© 2012 International Monetary Fund April 2012 IMF Country Report No. 12/71 March 9, 2012 January 29, 2001 January 29, 2001 January 29, 2001 January 29, 2001 Israel: Selected Issues Paper This selected issues paper on Israel was prepared by a staff team of the International Monetary Fund as background documentation for the periodic consultation with the member country. It is based on the information available at the time it was completed on March 9, 2012. The views expressed in this document are those of the staff team and do not necessarily reflect the views of the government of Israel or the Executive Board of the IMF. The policy of publication of staff reports and other documents by the IMF allows for the deletion of market-sensitive information. Copies of this report are available to the public from International Monetary Fund Publication Services 700 19 th Street, N.W. Washington, D.C. 20431 Telephone: (202) 623-7430 Telefax: (202) 623-7201 E-mail: [email protected] Internet: http://www.imf.org International Monetary Fund Washington, D.C.

Welcome message from author
This document is posted to help you gain knowledge. Please leave a comment to let me know what you think about it! Share it to your friends and learn new things together.
Transcript
© 2012 International Monetary Fund April 2012 IMF Country Report No. 12/71
March 9, 2012 January 29, 2001 January 29, 2001 January 29, 2001 January 29, 2001 Israel: Selected Issues Paper This selected issues paper on Israel was prepared by a staff team of the International Monetary Fund as background documentation for the periodic consultation with the member country. It is based on the information available at the time it was completed on March 9, 2012. The views expressed in this document are those of the staff team and do not necessarily reflect the views of the government of Israel or the Executive Board of the IMF. The policy of publication of staff reports and other documents by the IMF allows for the deletion of market-sensitive information.
Copies of this report are available to the public from
International Monetary Fund Publication Services 700 19th Street, N.W. Washington, D.C. 20431
Telephone: (202) 623-7430 Telefax: (202) 623-7201 E-mail: [email protected] Internet: http://www.imf.org
International Monetary Fund
Washington, D.C.
INTERNATIONAL MONETARY FUND
ISRAEL
Selected Issues
Prepared by Kotaro Ishi, Nicoletta Batini, (all EUR) and Jason Harris (FAD)
Approved by European Department
March 9, 2012
Contents Page
I. Macrosocial Challenges in Israel............................................................................................2 A. Why Is the Employment Rate and Wage of the Arab and Haredi Population Low? ..............................................................................................................................2 B. Demographic Challenges ..........................................................................................6 C. What Actions Should Be Taken And By Whom? .....................................................9 D. Concluding Remarks ...............................................................................................11
II. Composition of Civilian Expenditure .................................................................................19 A. Civilian Expenditure in Israel .................................................................................19 B. Civilian Expenditures Compared ............................................................................20 C. Social Outcomes ......................................................................................................23 D. Recent Policy Changes ...........................................................................................28 E. Concluding Remarks ...............................................................................................29
III. Inflation Targeting in Israel Twenty Years on...................................................................30 A. The 2010 New BoI Law ..........................................................................................30 B. How Does Israel New IT Framework Compare with That of Peer Countries ........31 C. Does the New Law Reflect the Lessons from the Global Financial Crisis? ...........33 D. Options for Development ........................................................................................35
Boxes 1. Government Initiatives to Enhance Minority Group Employment .......................................13
Figures I.1 The Overview of Socio Economic Developments, 1975–2009 .........................................14 I.2 Arab Households ................................................................................................................15 II.1. Size and Composition of Public Expenditure in 2008 .....................................................21 II.2. Public and Private Spending in Key Functional Areas ....................................................23 II.3 Comparison of Social Outcomes to Spending ..................................................................25
Tables I.1. Long-term Growth Projections, 1970–2029 ......................................................................16 I.2. Panel Regressions ..............................................................................................................17 III.1. A Comparison of Institutional Frameworks Across Selected IT Central Banks ............39

2
I. MACROSOCIAL CHALLENGES IN ISRAEL1
1. Israel’s growth performance of recent years is impressive, with real GDP growing at a faster pace than many other OECD countries. However, poverty remains among the highest in OECD countries (Figure 1).
2. While the secular Jewish population enjoys a high level of living standards, most of Arab and Haredi (Ultra-orthodox Jewish) people are poor, with poverty incidence reaching 60 percent for both groups. These populations also have a large number of children—typically 6–7 children in a Haredi family, and 3–4 children in an Arab family—and child poverty is dire. This mostly reflects low employment in these two groups, as they are not fully integrated in the labor market.
3. Currently, the number of Arab and Haredi first graders in primary school is estimated at over 40 percent of the total first graders, indicating a major demographic change coming in Israel. 2 If these groups’ contribution to labor markets continues to be low, this will not only result in a further increase in poverty but also undermine Israel’s overall growth potential and fiscal sustainability. Conversely, it also implies that compared to other countries with aging populations, Israel has a large pool of potential human resources, in these minority populations, a key engine for future growth.
A. Why Is the Employment Rate and Wage of the Arab and Haredi Population Low?
4. Low employment in Arab and Haredi communities is mainly accounted for by the low employment rate of Arab women and Haredi men. By contrast, Haredi women’s and Arab men’s employment rates are higher, although there are considerable wage gaps between secular Jewish workers and Arab/Haredim workers.
5. Lower employment and wage of the Haredi male and Arab female reflects a number of impediments for labor participation, including high implicit marginal tax on employment, low human capital acquisition, and high reservation wage. Particularly for Haredi males, rather than religious constraints, incentive mechanisms appear to matter, given that Haredi male labor force participation rates in the US and UK are on a par with the broader population there.
1 Prepared by Kotaro Ishi ([email protected]) with research assistance provided by Stephanie Denis.
2 Currently, Israel’s population totals 7.6 million (2009), of which Jews accounting for 75 percent, Arabs for 20 percent, and other minority groups of 5 percent. Official statistics measuring Haredi populations does not exist. The Central Bureau of Statistics (CBS, 2011) estimated that the population of Haredim is about 10 percent of total population.

3
6. How these impediments have developed differs for these two groups. Some are the result of the past policy decisions (specially in the case of Haredi men), culture, discrimination, and linguistic disadvantage problem (in the case of Arab female).3
The Case of Haredi Males
7. The Bank of Israel (2011) estimates that half of Haredi men in their working age population were not employed in 2010. There are four key factors contributing to the under-employment of Haredi men: special education system, government financial support, respectful status in their community, and exemption from military service. These factors are closely interrelated, and reflect the complex political setting which dates back to the compromises reached between the Labor leadership of the Yishuv and the Haredi leadership during the British Mandate (Rivlin, 2011). The Haredi communities has also gained greater political presence at the Knesset since the late 1970s, although they tend to distance itself from the rest of Israeli communities.
Special education system: delaying and lowering human capital acquisition
8. The Haredi community has a special education system—from pre-school/preliminary levels up to Yeshiva/Kollel (seminaries)—, which is not oriented to help students acquire knowledge and skills useful to get a job. Many Haredi men have a strong desire to continue religious study for life and eventually become a rabbis. These religious schools mostly focus on religious studies, and beyond primary levels, no time is devoted to secular subjects, such as mathematics, science, civics, and English (whereas girls’ curriculums basically follow secular subjects).
9. And its education system requires longer school years— many students stay in the school system until their mid 20s and often until late 30s. Only the selected best of the brightest can become rabbis, and the majority of students need to get out of the school system eventually. However, at their late 20s or older, without secular learning and job training, it is hard for most to get a good job.
Government support and respectful status: raising reservation wage
10. The government has provided substantial support to the Haredi community. Religious education is free for life, and Haredi religious students and their families are eligible for a range of benefits—some are exclusively for them—, such as implicit housing subsidies, local tax reductions, reduced national insurance payments, and rent subsidies.
3 Yashiv and Kasir (2011) empirically show that cultural factors in part explain low labor participation among Arab women. Rivlin (2011) refers to discrimination as one of many factors affecting labor participation among Arab women.

4
11. Universal child allowances have also been the important source of income for Haredi families. There is statistical evidence that the size and structure of child allowances affect fertility (National Insurance Institute of Israel, 2011). During the 1990s, when Haredi parties increased the number of seats in the Knesset, child allowances were raised significantly, with higher rates of allowance per child for families with a larger number of children. This structure helped poor families with larger number of children, but also incentivizes them, notably Haredi families, to have more children. However, after the 2003 general elections, child allowances and other transfer payments were cut sharply in the context of the Economic Recovery Plan. The fertility rate has since dropped significantly, but poverty incidence has also risen.
12. Furthermore, religious students are awarded with high respect within the community. Being a seminary student also signals a strong commitment to the community, and they are warmly supported by the rest of the community, financially and non-financially. This further raises reservation wages for Haredi men.
Exemption from military service: raising marginal tax rates on employment
13. At the establishment of Israel, the government agreed with the religious parties to exempt 400 religious scholars from military service so that they were able to focus on religious studies (called a Torato Omanuto arrangement). This practice has broadly remained until now—though the government has launched some initiatives to change it in recent years (see below)—, and many yeshiva students are exempted from military service on condition that they continue to study. Now, the Ministry of Finance estimates that around 37,000 Haredi men study at yeshiva schools and do not serve.
14. This practice of conditional exemption disincentives Haredi men to complete their studies earlier and to serve in the military, which is critical in Israel for building social net work and getting a basic job training. It is also considered as an essential citizenship duty, and without fulfilling it, Haredi men are at a significant disadvantage in finding a good job. Thus, conditional exemption from military service effectively raises marginal tax rates for them to get employed.
6.0
6.2
6.4
6.6
6.8
7.0
7.2
7.4
7.6
7.8
8.0
0
50
100
150
200
250
300
350
1993 1995 1997 1999 2001 2003 2005 2007 2009
Average monthly child allowance (left scale, NIS 2009 prices)Fertility of Haredi mothers (right scale, per mother)
Average monthly child allowance per child and fertility
Source: National Insurance Institute of Israel, 2009 Annual Survery.

5
The Case of Arab Females
15. Arab’s female employment rates are very low at around 20 percent, compared to about 70 percent for Jewish women.4 Impediments reflect typical minority problem—not unique for Israel—, and several factors contribute to the Arab and Jewish differences.
Generally low levels of education: lowering human capital acquisition
16. The average years of schooling for the Jewish population have continued to grow, with nearly half having 13 or more years of schooling. There also has been an improvement in the years of schooling for the Arab population, but the Arab population still lags behind others, with less than ¼ having 13 or more years of schooling. Women’s employment and their years of education are positively associated in general, and more starkly for Arab women.
Infrastructure constraints: raising marginal tax rates on employment
17. By advanced economy standards, Israel does not fare well in the quality of infrastructure.5 In particular, there is anecdotal evidence that public transportation, school, electricity, telephone lines, and internet access in some regions are not developed as equal standards as in other parts of Israel. For example, only 35 percent of the Arab population (age 20 and over) use internet, compared to 80 percent for non-religious Jews (Central Bureau of Statistics). Given that female workers with children have strong desire to find a job within reasonably commutable areas, the infrastructure bottleneck makes it harder for Arab females to access job opportunities outside their communities.
Double discrimination: raising entrance barriers
4 Arab men’s employment is high, only slightly lower than secular and traditional Jews, in part because Arab men retire earlier. They tend to work more in construction, agriculture, and traditional manufacturing sector—where labor productivity and wages are low— than in high skilled or productive high-tech sector where Jewish men tend to work.
5 The overall infrastructure quality is ranked the 38th out of 142 countries by the World Economic Forum Global Competitiveness Report, 2011–12.
0
10
20
30
40
50
60
70
80
0
10
20
30
40
50
60
70
80
0-10 years 11-12 years 13+ years
Arab women Jewish women
Women's Employment Experience by Years of Education(Percent share of sample population, women aged 25-29 in 1983)
Source: The Bank of Israel.
6
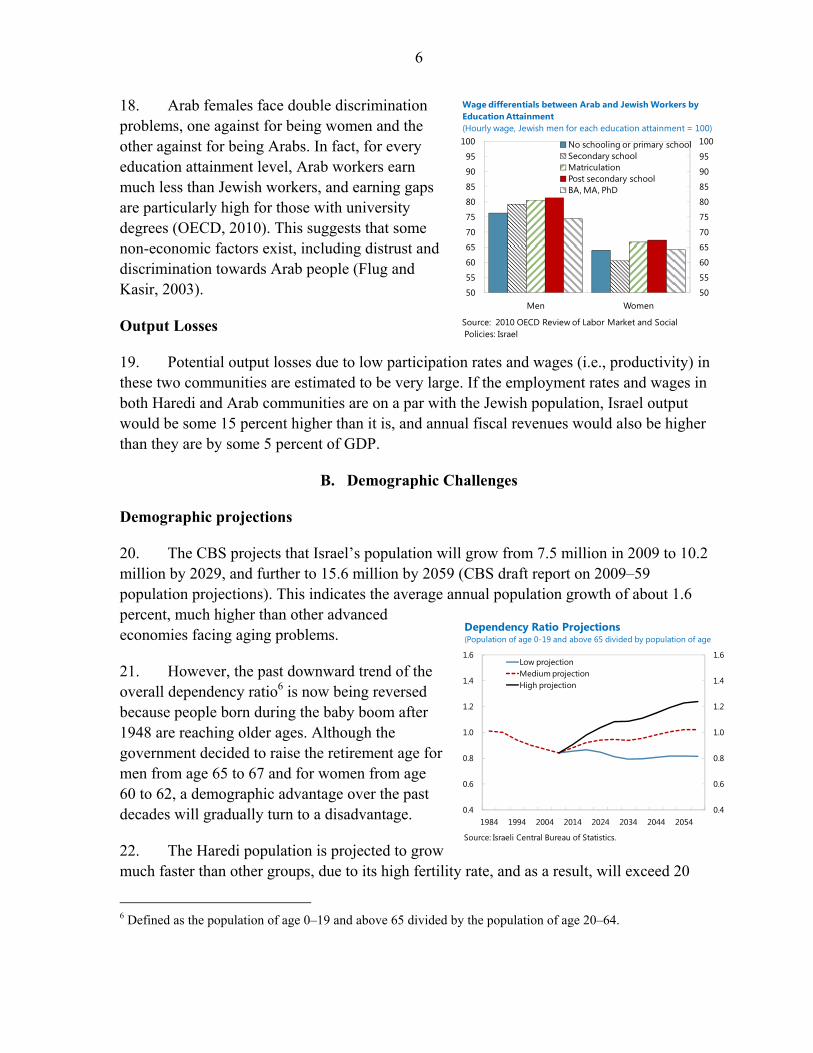
18. Arab females face double discrimination problems, one against for being women and the other against for being Arabs. In fact, for every education attainment level, Arab workers earn much less than Jewish workers, and earning gaps are particularly high for those with university degrees (OECD, 2010). This suggests that some non-economic factors exist, including distrust and discrimination towards Arab people (Flug and Kasir, 2003).
Output Losses
19. Potential output losses due to low participation rates and wages (i.e., productivity) in these two communities are estimated to be very large. If the employment rates and wages in both Haredi and Arab communities are on a par with the Jewish population, Israel output would be some 15 percent higher than it is, and annual fiscal revenues would also be higher than they are by some 5 percent of GDP.
B. Demographic Challenges
Demographic projections
20. The CBS projects that Israel’s population will grow from 7.5 million in 2009 to 10.2 million by 2029, and further to 15.6 million by 2059 (CBS draft report on 2009–59 population projections). This indicates the average annual population growth of about 1.6 percent, much higher than other advanced economies facing aging problems.
21. However, the past downward trend of the overall dependency ratio6 is now being reversed because people born during the baby boom after 1948 are reaching older ages. Although the government decided to raise the retirement age for men from age 65 to 67 and for women from age 60 to 62, a demographic advantage over the past decades will gradually turn to a disadvantage.
22. The Haredi population is projected to grow much faster than other groups, due to its high fertility rate, and as a result, will exceed 20
6 Defined as the population of age 0–19 and above 65 divided by the population of age 20–64.
50
55
60
65
70
75
80
85
90
95
100
50
55
60
65
70
75
80
85
90
95
100
Men Women
No schooling or primary schoolSecondary schoolMatriculationPost secondary schoolBA, MA, PhD
Wage differentials between Arab and Jewish Workers by Education Attainment(Hourly wage, Jewish men for each education attainment = 100)
Source: 2010 OECD Review of Labor Market and SocialPolicies: Israel
0.4
0.6
0.8
1.0
1.2
1.4
1.6
0.4
0.6
0.8
1.0
1.2
1.4
1.6
1984 1994 2004 2014 2024 2034 2044 2054
Low projectionMedium projectionHigh projection
Dependency Ratio Projections(Population of age 0-19 and above 65 divided by population of age
Source: Israeli Central Bureau of Statistics.
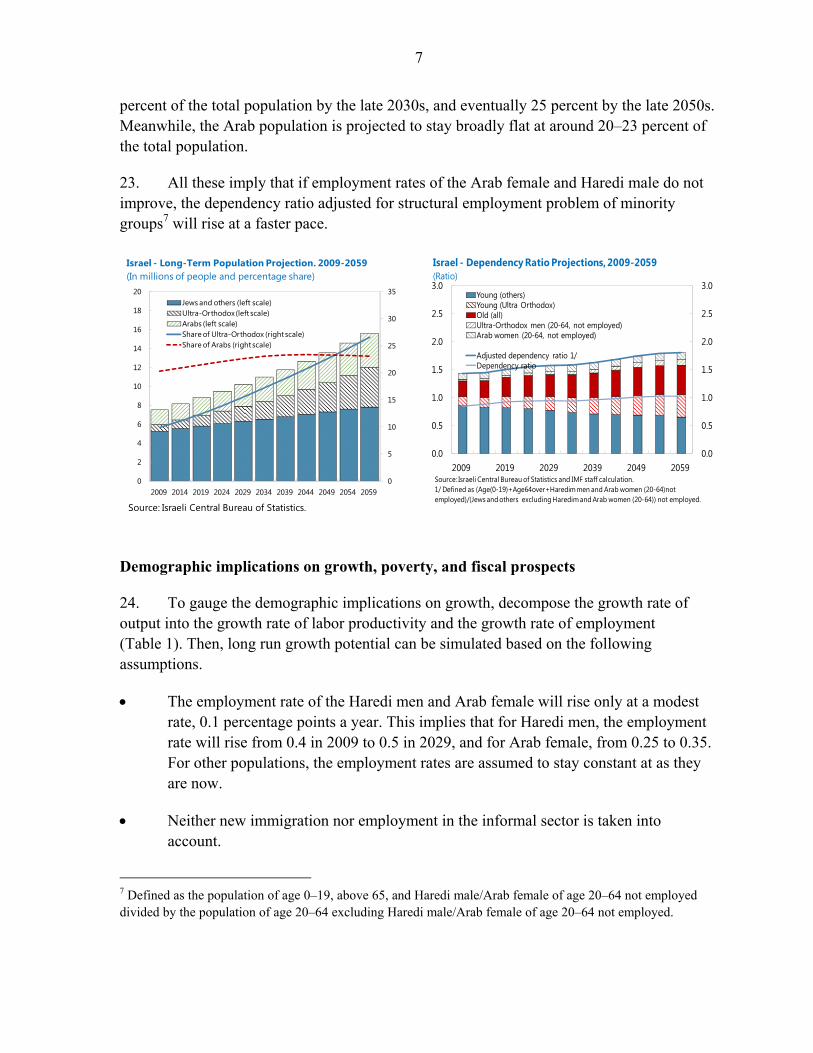
7
percent of the total population by the late 2030s, and eventually 25 percent by the late 2050s. Meanwhile, the Arab population is projected to stay broadly flat at around 20–23 percent of the total population.
23. All these imply that if employment rates of the Arab female and Haredi male do not improve, the dependency ratio adjusted for structural employment problem of minority groups7 will rise at a faster pace.
0
5
10
15
20
25
30
35
0
2
4
6
8
10
12
14
16
18
20
2009 2014 2019 2024 2029 2034 2039 2044 2049 2054 2059
Jews and others (left scale)Ultra-Orthodox (left scale)Arabs (left scale)Share of Ultra-Orthodox (right scale)Share of Arabs (right scale)
Source: Israeli Central Bureau of Statistics.
Israel - Long-Term Population Projection. 2009-2059(In millions of people and percentage share)
0.0
0.5
1.0
1.5
2.0
2.5
3.0
0.0
0.5
1.0
1.5
2.0
2.5
3.0
2009 2019 2029 2039 2049 2059
Young (others)Young (Ultra Orthodox)Old (all)Ultra-Orthodox men (20-64, not employed)Arab women (20-64, not employed)
Adjusted dependency ratio 1/Dependency ratio
Source: Israeli Central Bureau of Statistics and IMF staff calculation.1/ Defined as (Age(0-19)+Age64over+Haredim men and Arab women (20-64)not employed)/(Jews and others excluding Haredim and Arab women (20-64)) not employed.
Israel - Dependency Ratio Projections, 2009-2059(Ratio)
Demographic implications on growth, poverty, and fiscal prospects
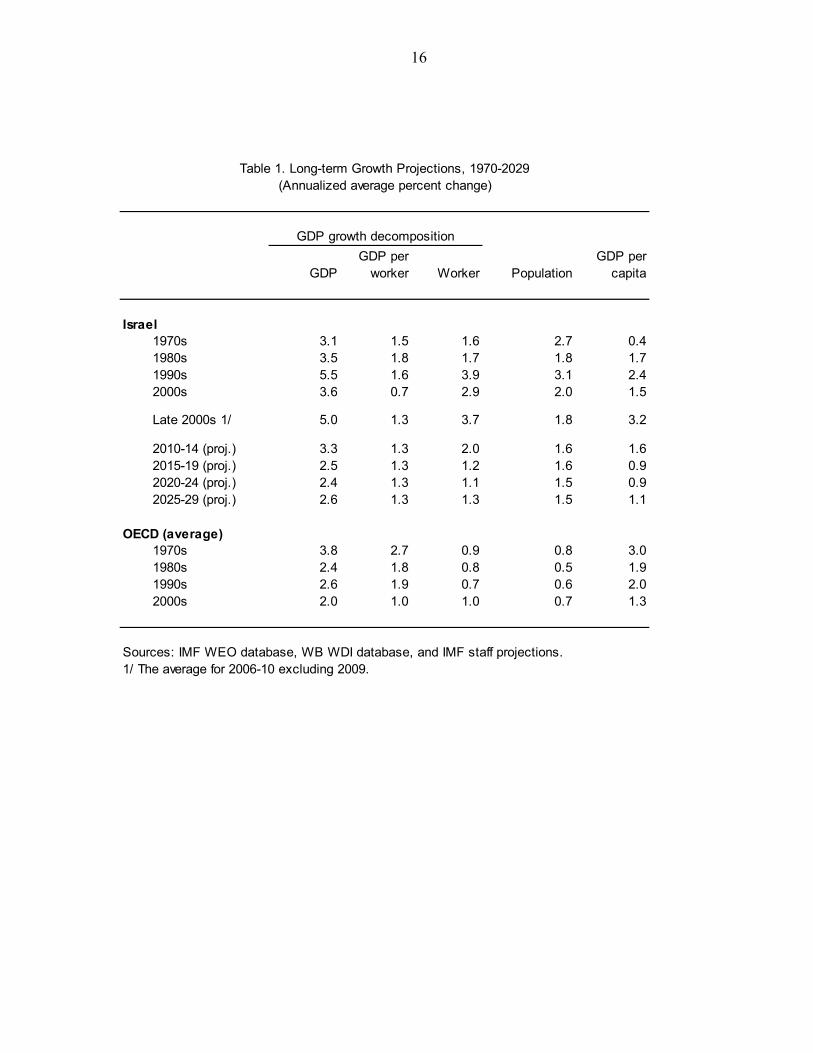
24. To gauge the demographic implications on growth, decompose the growth rate of output into the growth rate of labor productivity and the growth rate of employment (Table 1). Then, long run growth potential can be simulated based on the following assumptions.
The employment rate of the Haredi men and Arab female will rise only at a modest rate, 0.1 percentage points a year. This implies that for Haredi men, the employment rate will rise from 0.4 in 2009 to 0.5 in 2029, and for Arab female, from 0.25 to 0.35. For other populations, the employment rates are assumed to stay constant at as they are now.
Neither new immigration nor employment in the informal sector is taken into account.
7 Defined as the population of age 0–19, above 65, and Haredi male/Arab female of age 20–64 not employed divided by the population of age 20–64 excluding Haredi male/Arab female of age 20–64 not employed.
8
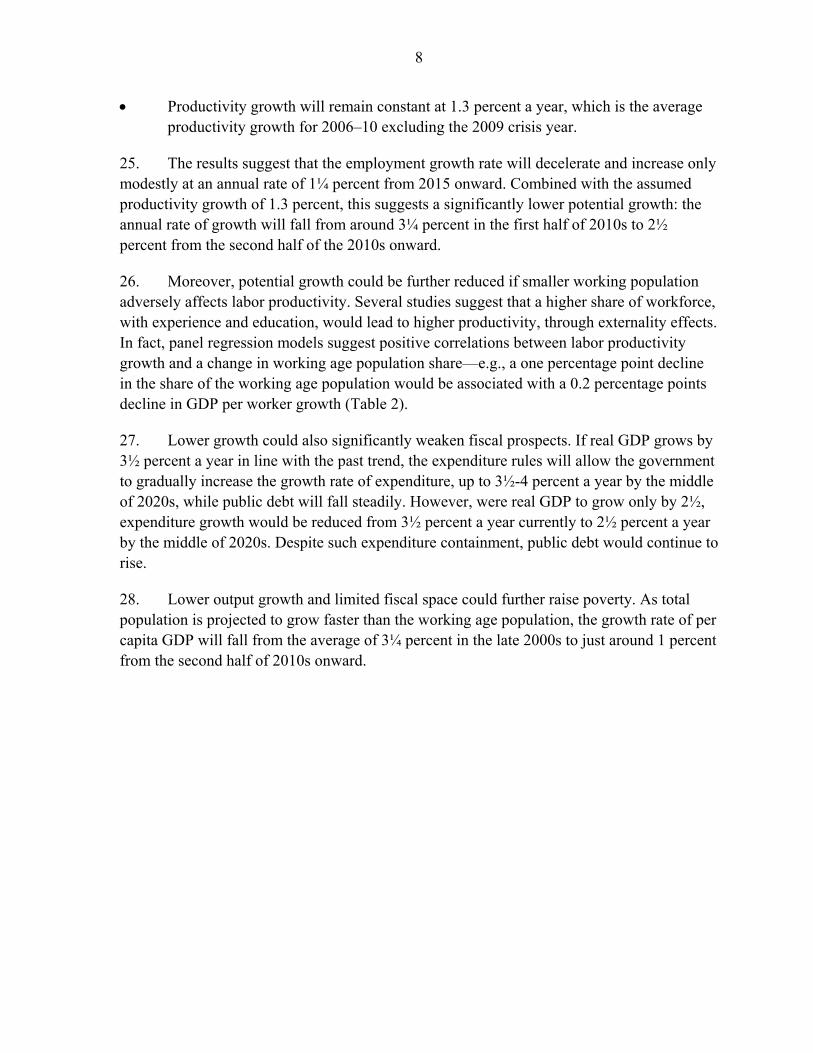
Productivity growth will remain constant at 1.3 percent a year, which is the average productivity growth for 2006–10 excluding the 2009 crisis year.
25. The results suggest that the employment growth rate will decelerate and increase only modestly at an annual rate of 1¼ percent from 2015 onward. Combined with the assumed productivity growth of 1.3 percent, this suggests a significantly lower potential growth: the annual rate of growth will fall from around 3¼ percent in the first half of 2010s to 2½ percent from the second half of the 2010s onward.
26. Moreover, potential growth could be further reduced if smaller working population adversely affects labor productivity. Several studies suggest that a higher share of workforce, with experience and education, would lead to higher productivity, through externality effects. In fact, panel regression models suggest positive correlations between labor productivity growth and a change in working age population share—e.g., a one percentage point decline in the share of the working age population would be associated with a 0.2 percentage points decline in GDP per worker growth (Table 2).
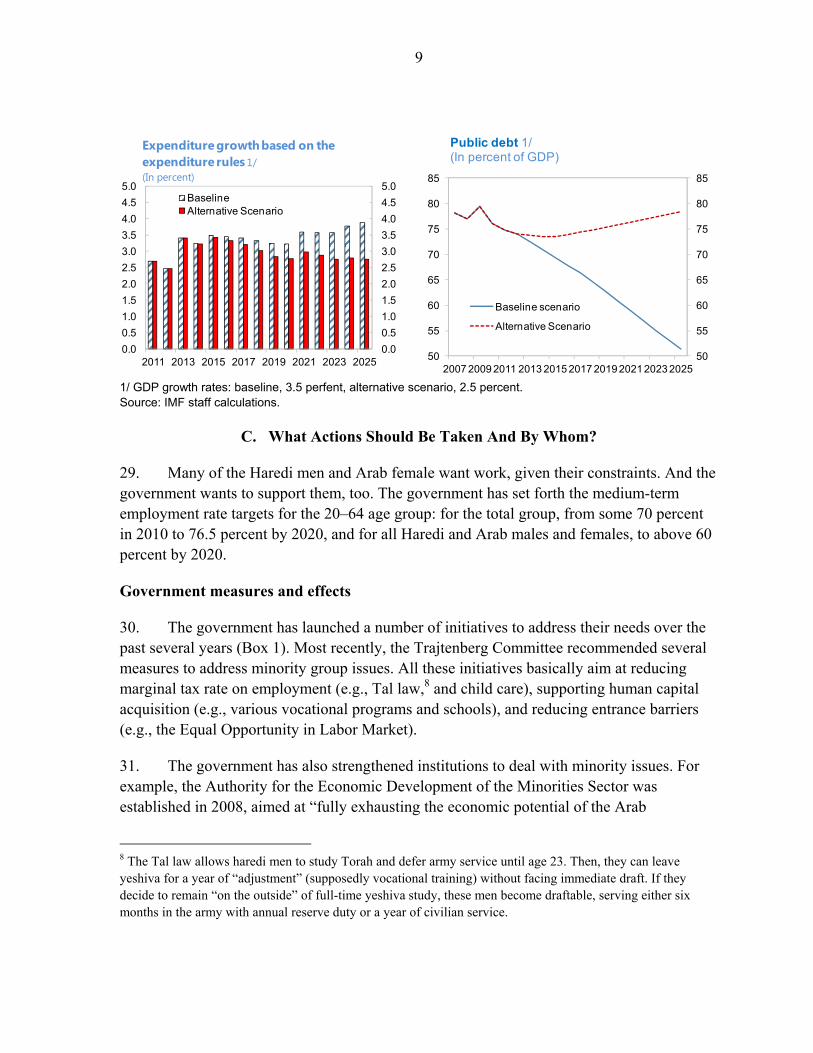
27. Lower growth could also significantly weaken fiscal prospects. If real GDP grows by 3½ percent a year in line with the past trend, the expenditure rules will allow the government to gradually increase the growth rate of expenditure, up to 3½-4 percent a year by the middle of 2020s, while public debt will fall steadily. However, were real GDP to grow only by 2½, expenditure growth would be reduced from 3½ percent a year currently to 2½ percent a year by the middle of 2020s. Despite such expenditure containment, public debt would continue to rise.
28. Lower output growth and limited fiscal space could further raise poverty. As total population is projected to grow faster than the working age population, the growth rate of per capita GDP will fall from the average of 3¼ percent in the late 2000s to just around 1 percent from the second half of 2010s onward.
9
0.0
0.5
1.0
1.5
2.0
2.5
3.0
3.5
4.0
4.5
5.0
0.0
0.5
1.0
1.5
2.0
2.5
3.0
3.5
4.0
4.5
5.0
2011 2013 2015 2017 2019 2021 2023 2025
Expenditure growth based on the expenditure rules 1/ (In percent)
BaselineAlternative Scenario
50
55
60
65
70
75
80
85
50
55
60
65
70
75
80
85
2007 2009 2011 2013 2015 2017 2019 2021 2023 2025
Public debt 1/(In percent of GDP)
Baseline scenario
Alternative Scenario
1/ GDP growth rates: baseline, 3.5 perfent, alternative scenario, 2.5 percent. Source: IMF staff calculations.
C. What Actions Should Be Taken And By Whom?
29. Many of the Haredi men and Arab female want work, given their constraints. And the government wants to support them, too. The government has set forth the medium-term employment rate targets for the 20–64 age group: for the total group, from some 70 percent in 2010 to 76.5 percent by 2020, and for all Haredi and Arab males and females, to above 60 percent by 2020.
Government measures and effects
30. The government has launched a number of initiatives to address their needs over the past several years (Box 1). Most recently, the Trajtenberg Committee recommended several measures to address minority group issues. All these initiatives basically aim at reducing marginal tax rate on employment (e.g., Tal law,8 and child care), supporting human capital acquisition (e.g., various vocational programs and schools), and reducing entrance barriers (e.g., the Equal Opportunity in Labor Market).
31. The government has also strengthened institutions to deal with minority issues. For example, the Authority for the Economic Development of the Minorities Sector was established in 2008, aimed at “fully exhausting the economic potential of the Arab
8 The Tal law allows haredi men to study Torah and defer army service until age 23. Then, they can leave yeshiva for a year of “adjustment” (supposedly vocational training) without facing immediate draft. If they decide to remain “on the outside” of full-time yeshiva study, these men become draftable, serving either six months in the army with annual reserve duty or a year of civilian service.
10
population by encouraging economic activity in Arab communities and by increasing their integration in the broader national economy.”
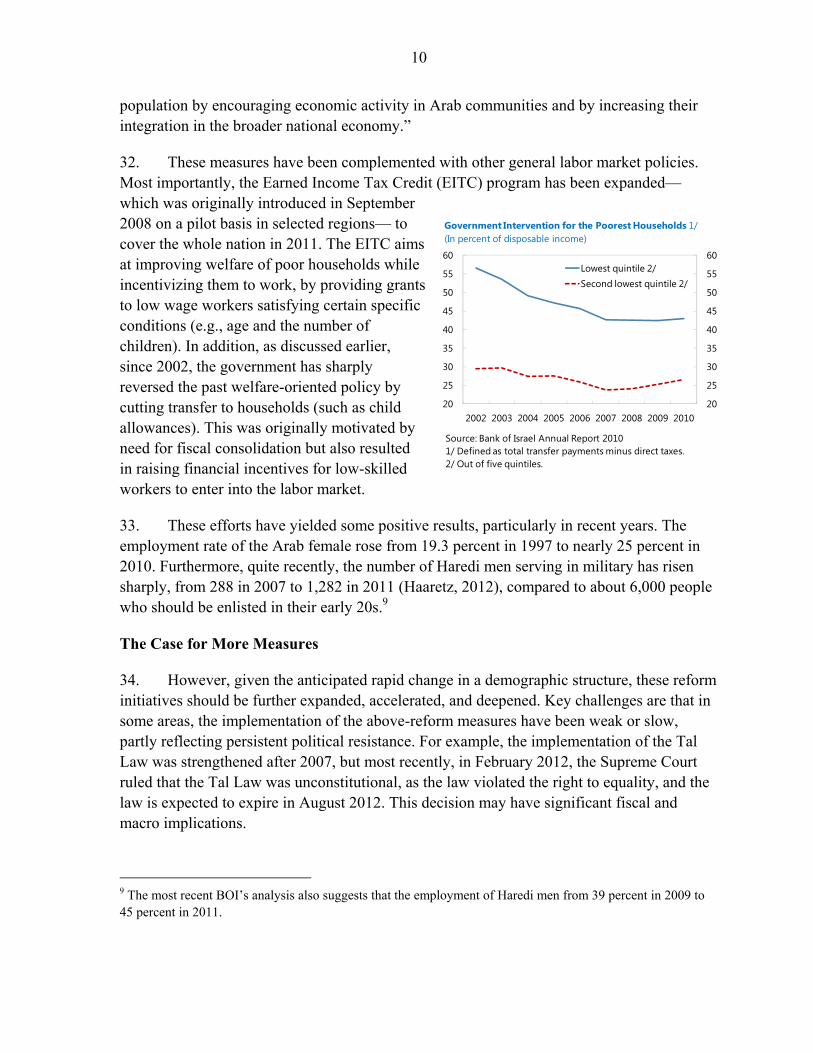
32. These measures have been complemented with other general labor market policies. Most importantly, the Earned Income Tax Credit (EITC) program has been expanded— which was originally introduced in September 2008 on a pilot basis in selected regions— to cover the whole nation in 2011. The EITC aims at improving welfare of poor households while incentivizing them to work, by providing grants to low wage workers satisfying certain specific conditions (e.g., age and the number of children). In addition, as discussed earlier, since 2002, the government has sharply reversed the past welfare-oriented policy by cutting transfer to households (such as child allowances). This was originally motivated by need for fiscal consolidation but also resulted in raising financial incentives for low-skilled workers to enter into the labor market.
33. These efforts have yielded some positive results, particularly in recent years. The employment rate of the Arab female rose from 19.3 percent in 1997 to nearly 25 percent in 2010. Furthermore, quite recently, the number of Haredi men serving in military has risen sharply, from 288 in 2007 to 1,282 in 2011 (Haaretz, 2012), compared to about 6,000 people who should be enlisted in their early 20s.9
The Case for More Measures
34. However, given the anticipated rapid change in a demographic structure, these reform initiatives should be further expanded, accelerated, and deepened. Key challenges are that in some areas, the implementation of the above-reform measures have been weak or slow, partly reflecting persistent political resistance. For example, the implementation of the Tal Law was strengthened after 2007, but most recently, in February 2012, the Supreme Court ruled that the Tal Law was unconstitutional, as the law violated the right to equality, and the law is expected to expire in August 2012. This decision may have significant fiscal and macro implications.
9 The most recent BOI’s analysis also suggests that the employment of Haredi men from 39 percent in 2009 to 45 percent in 2011.
20
25
30
35
40
45
50
55
60
20
25
30
35
40
45
50
55
60
2002 2003 2004 2005 2006 2007 2008 2009 2010
Lowest quintile 2/Second lowest quintile 2/
Source: Bank of Israel Annual Report 20101/ Defined as total transfer payments minus direct taxes.2/ Out of five quintiles.
Government Intervention for the Poorest Households 1/(In percent of disposable income)

11
35. Accordingly, much more is needed, because early substantive progress is essential to secure the long term sustainability of the Israeli economy, and the welfare of all of its citizens. However, making early and substantive progress will require all sides and leaders to adjust and to work closely together, requiring greater political dexterity. Steps in key areas needed are summarized in Text Table 1.
36. If no effective action is taken, given that labor supply is structurally-constrained, immigration (including informal ones) could rise more, which would be budgetary costly. For example, labor regulations may need to be even further enforced to protect immigrants’ rights, and these immigrants may need to be covered in the formal social welfare framework, including education and health.
D. Concluding Remarks
37. Haredi and Arab participation problem has already caused poverty. If not addressed, this will also cause growth to slow sharply in the medium term. In both cases, low employment rates appear to reflect high marginal tax facing these communities, and high reservation wage. Furthermore, both contributed to lowering human capital acquisition. Solutions should address all these problems quickly, because growth and fiscal implications are urgent.

12
Text Table. Additional Measures
Measures Pros Cons
Seeking alternatives to the Tal Law, so that more Haredi men would be able to serve in the military or civic activity, while balancing with equity concern with other Israeli people and citizenship obligation
Lowers marginal tax rates
May not meet citizenship obligation
Continuously expanding the provision of basic child care and transportation in the Arab areas
Lowers marginal tax rate
Increase in budgetary costs
Removing impediments to business establishment in both communities, in particular by increasing public investment in infrastructure
Lowers marginal tax rate
Increase in budgetary costs
Equalizing the quality and quantity of education provision at all levels in Arab communities with that elsewhere. And enhancing the core curriculum (particularly, English and mathematics) at secondary and tertiary levels. Further expanding vocational, job training, and preparatory study programs
Strengthens human capital
May raise cultural and religious concern
Strengthening the enforcement of labor regulations, which help to protect vulnerable minority workers, in particularly by raising resources.
Lowers marginal tax rate
Increase in budgetary costs
Subjecting welfare system (including child allowances, stipends for Haredi students) to give incentives to acquire job skills and enter into the labor market.
Strengthens human capital and lowers marginal tax rate
May increase poverty

13
Box 1. Government initiatives to enhance minority group employment
Initiatives
Long-standing government initiatives Enacting the Tal Law in 2002, which attempted to give
incentives for Haredi men to participate in army or civil services. The law was originally set to expire in 2007, but then extended to 2012. The Israel Defense Forces also created a special unit for Haredi men (called Nahal Haredi) in 1999, with corporation of a group of rabbis, in which Jewish dietary laws (e.g., Kosher food) are closely obeyed to accommodate Haredi’s needs. But in February 2012, the Supreme Court ruled that the Tal Law was unconstitutional, as the law violates the right to equality. Accordingly, the law is expected to expire in August 2012.
Establishing various programs and schools, for Haredi people, to provide vocational guidance, professional placement service, technological training, and preparatory programs (with scholarships) to enter into secular advanced studies
Intensifying the monitoring of religious students to ensure that religious studies are indeed taking place, while providing opportunities to combine religious studies with secular studies, job training, or work;
Improving day care services, employment services, and vocational training, targeted for Arab females.
Trajtenberg Committee recommendations
Expanding employment preparation programs for Arab women; expanding educational programs and providing vouchers for vocational training for Haredi and Arab people; and increasing the supervision of Haredi educational institutions.
Expanding national service (Sherut Leumi) for minorities; and expanding child care subsidies (age 0–3) for minority women who work part time
Objectives
Reducing marginal tax rate on employment
Raising human capital acquisition
Raising human capital acquisition Reducing marginal tax rate on employment and raising human capital Raising human capital acquisition Reducing marginal tax rate on employment

14
Figure 1. Israel: The Overview of Socio Economic Developments, 1975–2009
Over the last decade, Israel has grown faster than others, narrowing income gaps…
…however, faster growth has not much contributed to poverty reduction…
0
10
20
30
40
50
60
70
80
90
100
10,000
12,000
14,000
16,000
18,000
20,000
22,000
24,000
26,000
28,000
1975 1979 1983 1987 1991 1995 1999 2003 2007
A/B (in percent)Israel (B)OECD median(A) 1/
1/ 24 OECD countries.
Israel - GDP Per Capita, 1975-2010 (Constant 2000 U.S. dollars; unless otherwise indicated)
0.20
0.25
0.30
0.35
0.40
0
5
10
15
20
25
30
35
40
Mid 1980s
Around 1990
Mid 1990s
Around 2000
Mid 2000s
Late 2000s
Poverty incidence (left scale) 1/OECD average (poverty, left scale) 1/Gini coefficent (right scale)OECD average (Gini, right scale)
Israel - Poverty Incidence and Gini Coefficients (Index, total population)
1/ Poverty threshold is 50 percent of the current median income.
…and Israel has high poverty rates among OECD countries. This mainly reflects rising poverty incidence in Arabs and Haredim populations...
0.1
0.2
0.3
0.4
0.5
0.6
0.1
0.2
0.3
0.4
0.5
0.6After taxes and transfers Taxes and transfers
OECD Countries - Poverty Incidence(Rate)
Israel
0
10
20
30
40
50
60
70
0
10
20
30
40
50
60
70
All Israeli Arabs Haredim
2003 2010
Israel: Poverty Incidence by Population Group(Percent)
..which in turn reflects relatively lower employment rates in Arab women and Haredim men…
…and their relatively lower wages.
0
10
20
30
40
50
60
70
80
90
100
0
10
20
30
40
50
60
70
80
90
100
All Israeli Arabs Haredi Others
Men Women
Israel - Employment Rate by Population Group, 2009(In percent)
0
2,000
4,000
6,000
8,000
10,000
12,000
0
2,000
4,000
6,000
8,000
10,000
12,000
All Israeli Arabs Haredi Others
Men Women
Israel - Average Monthly Wages by Population Group, 2009(In NIS)
Sources: IMF WEO, WB WDI, OECD Stat, Bank of Israel annual reports, and Israeli Central Bureau of Statistics.
15
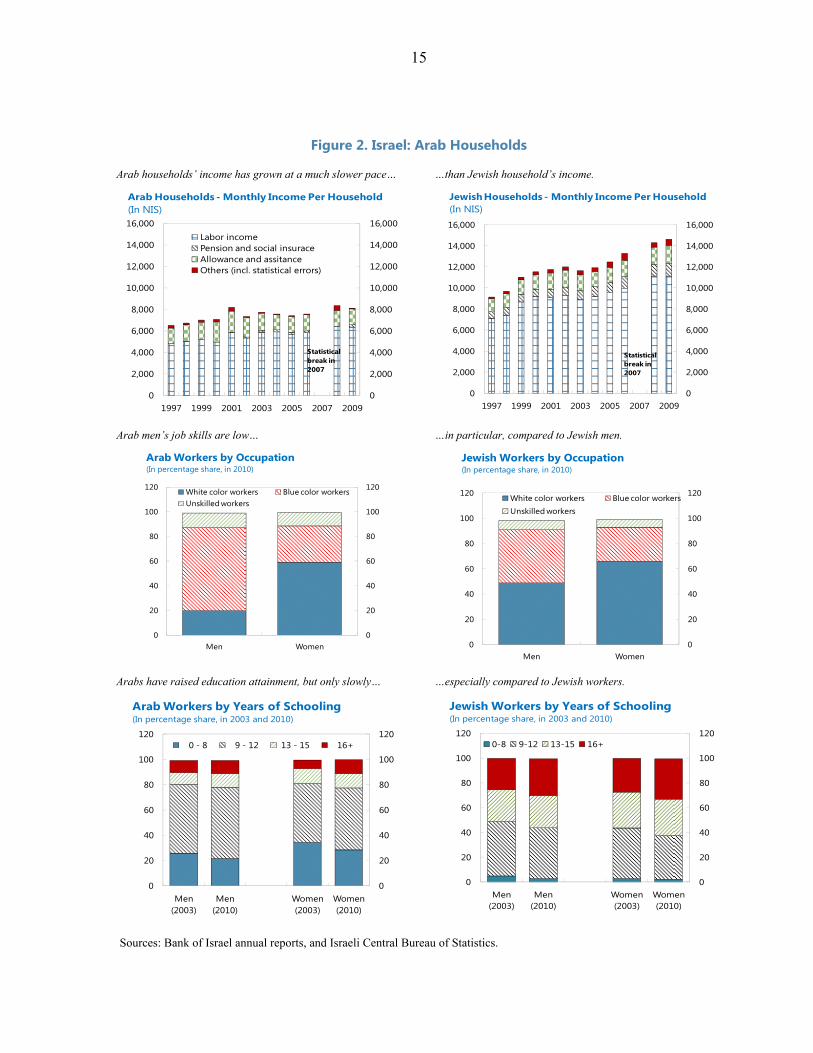
Figure 2. Israel: Arab Households
Arab households’ income has grown at a much slower pace… …than Jewish household’s income.
0
2,000
4,000
6,000
8,000
10,000
12,000
14,000
16,000
0
2,000
4,000
6,000
8,000
10,000
12,000
14,000
16,000
1997 1999 2001 2003 2005 2007 2009
Labor incomePension and social insuraceAllowance and assitanceOthers (incl. statistical errors)
Statistical break in 2007
Arab Households - Monthly Income Per Household(In NIS)
0
2,000
4,000
6,000
8,000
10,000
12,000
14,000
16,000
0
2,000
4,000
6,000
8,000
10,000
12,000
14,000
16,000
1997 1999 2001 2003 2005 2007 2009
Statistical break in 2007
Jewish Households - Monthly Income Per Household(In NIS)
Arab men’s job skills are low… …in particular, compared to Jewish men.
0
20
40
60
80
100
120
0
20
40
60
80
100
120
Men Women
White color workers Blue color workersUnskilled workers
Arab Workers by Occupation(In percentage share, in 2010)
0
20
40
60
80
100
120
0
20
40
60
80
100
120
Men Women
White color workers Blue color workersUnskilled workers
Jewish Workers by Occupation(In percentage share, in 2010)
Arabs have raised education attainment, but only slowly… …especially compared to Jewish workers.
0
20
40
60
80
100
120
0
20
40
60
80
100
120
Men (2003)
Men (2010)
Women (2003)
Women (2010)
0 - 8 9 - 12 13 - 15 16+
Arab Workers by Years of Schooling(In percentage share, in 2003 and 2010)
0
20
40
60
80
100
120
0
20
40
60
80
100
120
Men (2003)
Men (2010)
Women (2003)
Women (2010)
0-8 9-12 13-15 16+
Jewish Workers by Years of Schooling(In percentage share, in 2003 and 2010)
Sources: Bank of Israel annual reports, and Israeli Central Bureau of Statistics.
16
Table 1. Long-term Growth Projections, 1970-2029(Annualized average percent change)
GDP growth decomposition
GDPGDP per
worker Worker PopulationGDP per
capita
Israel1970s 3.1 1.5 1.6 2.7 0.41980s 3.5 1.8 1.7 1.8 1.71990s 5.5 1.6 3.9 3.1 2.42000s 3.6 0.7 2.9 2.0 1.5
Late 2000s 1/ 5.0 1.3 3.7 1.8 3.2
2010-14 (proj.) 3.3 1.3 2.0 1.6 1.62015-19 (proj.) 2.5 1.3 1.2 1.6 0.92020-24 (proj.) 2.4 1.3 1.1 1.5 0.92025-29 (proj.) 2.6 1.3 1.3 1.5 1.1
OECD (average)1970s 3.8 2.7 0.9 0.8 3.01980s 2.4 1.8 0.8 0.5 1.91990s 2.6 1.9 0.7 0.6 2.02000s 2.0 1.0 1.0 0.7 1.3
Sources: IMF WEO database, WB WDI database, and IMF staff projections.1/ The average for 2006-10 excluding 2009.

17
Table 2. Panel Regressions
Dependent variable GDP per employment grow th(1) (2) (3) (4) (5)
Initial per capita GDP -0.122 -0.215 -0.262* -0.249* -0.270**-0.07 -0.10 -0.09 -0.08 -0.07
Percentage point change in the 0.187*** 0.179*** 0.175*** 0.168*** 0.159***share of working age population -0.01 -0.01 -0.01 -0.02 -0.02
Tropical area -1.526** -1.398* -1.304* -1.182* -1.252**-0.46 -0.47 -0.49 -0.39 -0.36
Population density … -28.20** -11.68 -11.77 -11.67-8.40 -7.56 -7.53 -8.00
Terms of trade … … -7.149*** -6.434*** -6.572***-0.97 -1.09 -0.83
Inf lation … … … -1.756*** -1.639**-0.30 -0.38
Openness … … … … 0.004*0.00
Constant 2.700** 3.853** 4.569** 4.614*** 4.592***-0.70 -0.95 -0.84 -0.79 -0.743
Observations 268 268 268 268 268R-squared 0.12 0.13 0.17 0.20 0.21
1/ Standard errors are in Italics (*** p<0.01, ** p<0.05, * p<0.1). All regressions are panel f ixedeffects regressions, for a sample of 67 advanced, emerging, and developing economies, w ith the data average for four 10-year periods over 1970-2009.
18
Data A sample of 67 advanced and developing economies is used to examine correlations
between per employment real GDP growth and a change in working age population share.
Observations are average for four 10-year periods over 1970–2009. The model is estimated with random effects, and includes several control variables, such as proxy variables for the quality of institution and macroeconomic policies, as well as geography and initial income levels.
REFERENCES
Bank of Israel, 2011, Annual Report 2010, May 2011, Nissan-5711,
http://www.bankisrael.gov.il/deptdata/mehkar/doch10/eng/doch10e.htm
Haaretz, 2012, “IDF Personnel Chief: All Israeli Including Ultra-Orthodox Should Serve in Military,” January 23, 2012, http://www.haaretz.com/news/national/idf-personnel-chief-all-israelis-including-ultra-orthodox-should-serve-in-military-1.408811
Karnit, Flug, and Kasir Nitsa, 2006, “Poverty and Employment and the Gulf between Them,” Israel Economic Review Vol. 1, No. 1, 55-80.
National Insurance Institute of Israel, 2011, 2009 Annual Survey, http://www.btl.gov.il/English%20Homepage/Publications/Annual%20Surveys/Pages/AnnualSurvey2009.aspx
OECD, 2010, OECD Reviews of Labor Market and Social Policies Israel, OECD
Rivlin, Paul, 2011, The Israeli Economy From the Foundation of the State Through the 21st Century, Cambridge.
Yashiv, Eran, and Kasir Nitsa, 2011, “Patterns of Labor Force Participation Among Israeli Arabs,” Israel Economic Review Vol. 9, No. 1, 53-101, http://www.bankisrael.gov.il/deptdata/mehkar/iser/16/iser_3.pdf

19
II. COMPOSITION OF CIVILIAN EXPENDITURE1
1. Israel’s public expenditure as a share of GDP is around the OECD average, but exceptionally high levels of defense spending means that Israel’s civilian expenditure is amongst the lowest in the OECD. This raises concerns regarding the compression of spending on public services.
2. While Israel’s civilian expenditure low, other OECD economies still achieve strong social outcomes with similar shares of civilian expenditures. Israel’s composition of expenditure is strikingly similar to these countries, particularly once demographic factors are accounted for, and relative to them has high health and education spending.
3. The main difference between Israel and the OECD is the amount of social protection expenditure, owing to Israel’s relatively young population, which provides a considerable demographic dividend in the form of lower pension and health costs, though this is partly offset by higher spending on education. But the economic benefit of this dividend is reduced by the exceptionally low participation rates of minority groups (see Attachment I). Bringing those groups fully into the labor force and increasing their productivity levels would secure the full demographic dividend.
4. While Israel’s social outcomes are good, there is a case for higher civilian expenditure in some areas, notably to tackle the roots of low participation among minority groups and raise investment. Alongside, to reduce the high degree of inequality, the social transfer system could be made more targeted and increasingly conditional on employment without significantly increasing the amount of spending.
A. Civilian Expenditure in Israel
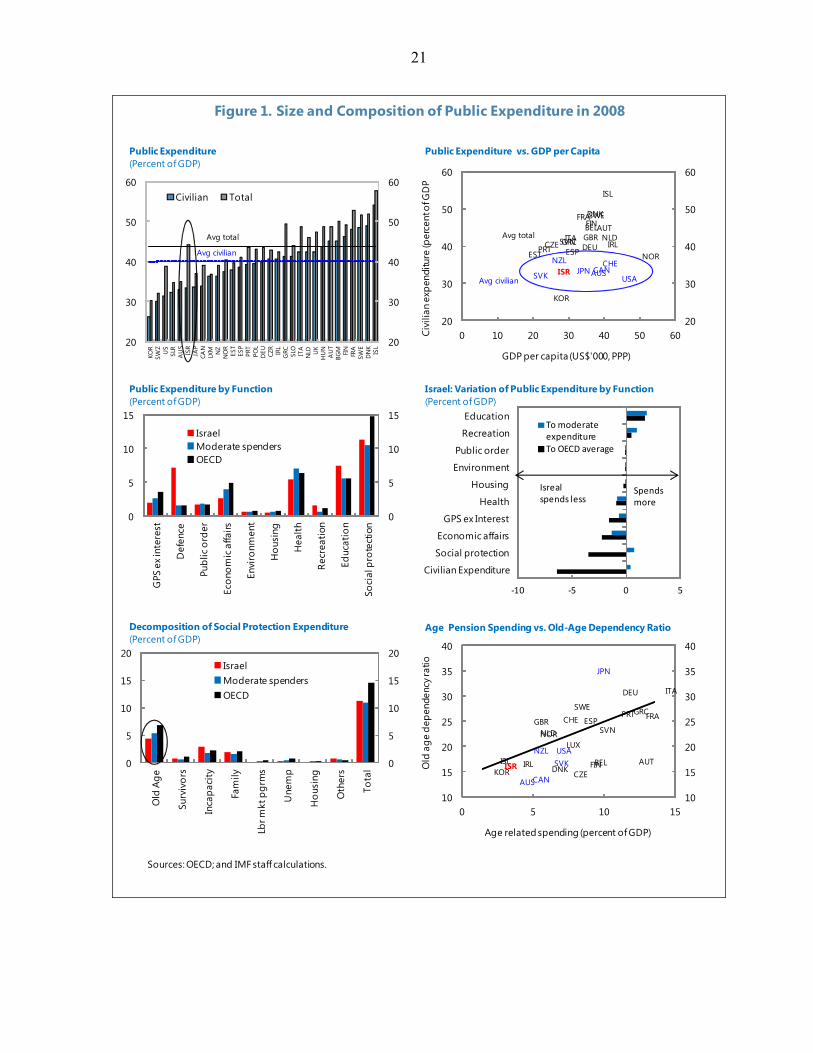
5. Israel sits in the middle of OECD countries in terms of the amount of public expenditure as a share of GDP. In 2008, public expenditure in Israel represented 44.3 percent of GDP compared to the OECD average of 43.7 percent. 2 But the size of defense expenditures in Israel sets it apart from all other economies in the OECD. In 2008, Israel spent 7.3 percent of GDP on defense – more than four times the OECD average, and significantly more than the 4.6 percent of GDP of the next highest, the US.
6. High defense and interest spending reduce the amount of resources available for civilian expenditure for any given tax ratio. Taking these into account, Israel’s civilian expenditure falls to 33.4 percent of GDP––amongst the lowest in the OECD.
1 Contributed by Jason Harris ([email protected]) with research assistance provided by Carla Sateriale.
2 2008 is chosen because this allows a comparison of expenditure before the impact of the global financial crisis.

20
7. However, Israel is far from alone in having civilian expenditure at this level. Australia , Canada, Japan, New Zealand , the Slovak Republic , Switzerland and the US all have similar shares. Thus, in addition to comparing the composition of Israeli civilian expenditure to the OECD average, which is dominated by large government European economies with large social welfare systems, it is useful to compare Israel’s spending pattern with this group of moderate expenditure countries. To facilitate this comparison, data for these countries in this chart and in all subsequent charts in the attachment are highlighted in blue.
B. Civilian Expenditures Compared
8. This section looks into the composition of expenditure to investigate whether there are any major difference between Israel and these moderate expenditure countries and the OECD overall. The functional composition of expenditure is compared using COFOG functional data, which decomposes government spending into 10 groupings. To compare civilian expenditures, interest and defense are excluded (Figure 1).
9. The composition of Israel’s expenditures is broadly in line with the moderate expenditure countries identified above, and with the OECD average in most areas. The exception is social protection, which falls significantly short of the OECD average. Other differences are also apparent, notably in economic affairs, general public services adjusted for interest expenditure, health (all lower), and education (higher).
10. Most social protection spending goes toward old-age pensions. However, in Israel these are much lower than in both the OECD and moderate expenditure countries3. This alone accounts for almost all of the difference in social protection expenditure. In contrast, family benefit payments and incapacity payments are relatively high in Israel. Finally, Israel has one of the lowest shares of expenditure on active labor market programs – despite the substantial labor force issues faced by the minority workforce.
11. The low share of spending on old-age pensions is almost entirely due to the relatively young age of Israel’s population (Figure 1). Comparing old-age pension spending to dependency ratios across the OECD, Israel sits right on the trend line. Thus, the bulk of difference in social protection expenditure ––and by extension of civilian expenditure––is due to a demographic dividend not due to a compression of spending by defense.
3 Some countries data are affected by differing treatment of tier 2 pension systems, which are excluded from Israel’s data.
21
Figure 1. Size and Composition of Public Expenditure in 2008
Sources: OECD; and IMF staff calculations.
20
30
40
50
60
20
30
40
50
60
KOR
SWZ
US
SLR
AU
SIS
RJA
PCA
NLX
M NZ
NO
RES
TES
PPR
TPO
LD
EU CZR
IRL
GRC SLO
ITA
NLD U
KH
UN
AU
TBG
M FIN
FRA
SWE
DN
KIS
L
Civilian Total
Avg total
Avg civilian
Public Expenditure(Percent of GDP)
AUS
AUTBEL
CAN
CZE
DNK
EST
FINFRA
DEUGRC
ISL
IRL
ISR
ITA
JPN
KOR
NLD
NZL NORPRT
SVK
SVNESP
SWE
CHE
GBR
USA
20
30
40
50
60
20
30
40
50
60
0 10 20 30 40 50 60Civi
lian
expe
nditu
re (p
erce
nt o
f GD
P
GDP per capita (US$'000, PPP)
Avg total
Avg civilian
Public Expenditure vs. GDP per Capita
0
5
10
15
0
5
10
15
GPS
ex i
nter
est
Def
ence
Publ
ic o
rder
Econ
omic
affa
irs
Envi
ronm
ent
Hou
sing
Hea
lth
Recr
eatio
n
Educ
atio
n
Soci
al p
rote
ctio
n
IsraelModerate spendersOECD
Public Expenditure by Function(Percent of GDP)
-10 -5 0 5
Civilian Expenditure
Social protection
Economic affairs
GPS ex Interest
Health
Housing
Environment
Public order
Recreation
EducationTo moderate expenditureTo OECD average
Isreal spends less
Spends more
Israel: Variation of Public Expenditure by Function(Percent of GDP)
0
5
10
15
20
0
5
10
15
20
Old
Age
Surv
ivor
s
Inca
paci
ty
Fam
ily
Lbr m
kt p
grm
s
Une
mp
Hou
sing
Oth
ers
Tota
l
IsraelModerate spendersOECD
Decomposition of Social Protection Expenditure (Percent of GDP)
AUS
AUTBEL
CAN CZEDNK FIN
FRA
DEU
GRC
ISL IRLISR
ITA
JPN
KOR
LUXNLD
NZL
NOR
PRT
SVK
SVNESP
SWECHEGBR
USA
10
15
20
25
30
35
40
10
15
20
25
30
35
40
0 5 10 15
Old
age
dep
ende
ncy r
atio
Age related spending (percent of GDP)
Age Pension Spending vs. Old-Age Dependency Ratio
22
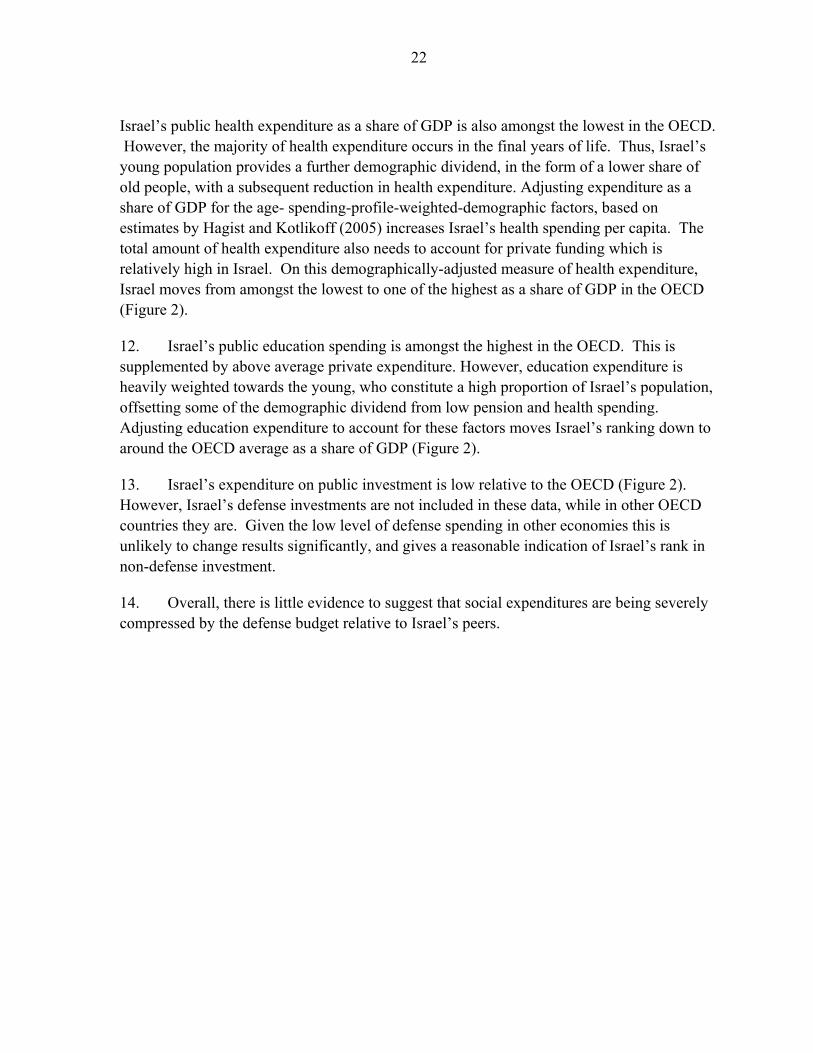
Israel’s public health expenditure as a share of GDP is also amongst the lowest in the OECD. However, the majority of health expenditure occurs in the final years of life. Thus, Israel’s young population provides a further demographic dividend, in the form of a lower share of old people, with a subsequent reduction in health expenditure. Adjusting expenditure as a share of GDP for the age- spending-profile-weighted-demographic factors, based on estimates by Hagist and Kotlikoff (2005) increases Israel’s health spending per capita. The total amount of health expenditure also needs to account for private funding which is relatively high in Israel. On this demographically-adjusted measure of health expenditure, Israel moves from amongst the lowest to one of the highest as a share of GDP in the OECD (Figure 2).
12. Israel’s public education spending is amongst the highest in the OECD. This is supplemented by above average private expenditure. However, education expenditure is heavily weighted towards the young, who constitute a high proportion of Israel’s population, offsetting some of the demographic dividend from low pension and health spending. Adjusting education expenditure to account for these factors moves Israel’s ranking down to around the OECD average as a share of GDP (Figure 2).
13. Israel’s expenditure on public investment is low relative to the OECD (Figure 2). However, Israel’s defense investments are not included in these data, while in other OECD countries they are. Given the low level of defense spending in other economies this is unlikely to change results significantly, and gives a reasonable indication of Israel’s rank in non-defense investment.
14. Overall, there is little evidence to suggest that social expenditures are being severely compressed by the defense budget relative to Israel’s peers.

23
Figure 2. Public and Private Spending in Key Functional Areas
Sources: OECD; and IMF staff calculations.
-5
0
5
10
15
20
-5
0
5
10
15
20
LUX
EST
DEU
GRC
SWE
JPN
ESP
NO
RSV
NIT
AKO
RN
LD NZL
CZE
GBR FIN
DN
KPR
TBE
LFR
AA
UT
AU
SIS
LC
AN
SVK
ISR
IRL
CH
EU
SA
PrivateDemographyPublicCombined
OECD: Total Health Spending Adjusted for Demographics (Percent of GDP)
-5
0
5
10
15
-5
0
5
10
15
SVN IRL
DEU LU
XIT
AFI
NC
ZRN
LD FRA
AU
TA
US
ISR
BEL
ESP
NO
RSW
EG
RCD
NK
NZL JPN
KOR
EST
ISL
PRT
USA
SVN
CH
EG
BRC
AN
PrivateDemographyPublicCombined
OECD: Total Education Spending Adjusted for Demographics (Percent of GDP)
0
1
2
3
4
5
6
0
1
2
3
4
5
6
AU
TD
EU BEL
ISR
CH
ED
NK
SVN
ITA
GBR FIN
USA PR
TJP
NN
OR
LUX
CA
NFR
ASW
EA
US
NLD
GRC NZL
ESP
ISL
SVK
CZE
KOR
IRL
OECD: Gross Public Capital Formation(Percent of GDP)
C. Social Outcomes
15. Although Israel’s social expenditures as broadly similar to the rest of the OECD once demographic factors are accounted for, concerns remain over the quality and level of public services, as evidenced by the social protests in the summer of 2011.
16. One way to assess this is to compare welfare outcomes to the rest of the OECD, and compare that to the amount of spending to gain a sense of effectiveness. To account for variances in GDP per capita levels across the OECD, the level of spending is stated in US$ per capita on a PPP basis, rather than as a share of GDP as described above. Where relevant – such as in health and education – these spending measures are adjusted for demographic factors and for levels of private expenditure.
24
17. Points to the north-west in the scatter plot charts (Figure 3) indicate a country with more effective spending. Of course, how effective and efficient public spending is depends on many factors (like population characteristics, past expenditure, income and education levels and immigration rates) which this presentation does not control for. Furthermore, the direction of causality is not always clear – high levels of spending could be a response to poor initial outcomes.
18. Israel’s health outcomes are very strong. Israel’s infant mortality rate is close to the OECD average, while its life expectancy at birth is amongst the highest in the OECD (Figure 3). Israel outperforms other moderate expenditure in terms of infant mortality, and performs comparably in terms of life expectancy.
19. Israel’s health expenditures appear to be highly effective, lying close to the efficiency frontier of the OECD. Part of this is likely due to Israel’s non-medical determinants of health, such as low alcohol consumption and good diet, which are reflected in lifestyle diseases: with low rates of obesity and diabetes, and low cancer and stroke mortality rates.

25
Figure 3. Comparison of Social Outcomes to Spending
Sources: OECD; and IMF staff calculations.
AUSAUTBEL
CAN
CZE
DNK
EST
FIN
FRADEU
GRC ISL
IRLISRITA
JPN
KOR
LUX
NLD
NZL
NORPRT
SVK
SVN
ESP
SWE
CHE
GBR
USA
0
1
2
3
4
5
6
7
0
1
2
3
4
5
6
70 2 4 6 8 10
Infa
nt M
orta
lity
Total demography adj health spending per capita ('000 US$)
Total Health Spending vs. Infant Mortality
AUSAUT
BELCAN
CZE
DNK
EST
FIN
FRADEUGRC
ISL
IRLISR
ITAJPN
KORLUXNLDNZL NOR
PRT
SVK
SVN
ESPSWECHE
GBR
USA
737475767778798081828384
737475767778798081828384
0 2 4 6 8 10
Life
exp
ecta
ncy a
t birt
h
Total demography adjusted health spending per capita ('000 US$ per capita)
Total Health Spending vs. Life Expectancy at Birth
CAN
CZE
DNK
FIN
DEU
GRC
ISLIRLISR
ITA
JPNKOR
LUX
NZL
NOR
PRT
SVK
SVN
ESP SWE
CHEGBR
USA
60
65
70
75
80
85
90
95
100
60
65
70
75
80
85
90
95
100
0 10 20 30 40
Gra
duat
ion
rate
s
Total education spending per student age person ('000 US$)
Total Education Spending vs. Secondary Graduation Rate
AUS
AUT
BEL
CAN
CZEDNK
EST
FIN
FRA
DEU
GRC
ISLIRL
ISR
ITA
JPN
KOR
LUX
NLDNZL
NOR
PRTSVN
SVK
ESP
SWE
CHE
GBRUSA
450460470480490500510520530540550
450460470480490500510520530540550
0 10 20 30 40
Aver
age
PISA
Sco
re
Total education spending per school age population ('000 US$)
Total Education Spending vs. Average PISA Score
200
300
400
500
600
200
300
400
500
600
Hebrew Israel Arabs
OECD Average 493
Israel: PISA Reading Score by Language Group
0
1
2
3
4
5
6
7
8
0
1
2
3
4
5
6
7
8
ITA
SVK
GRC IR
LN
ZLN
OR
ISR
AU
SSV
NC
ZEG
BRU
SA ESP
BEL
KOR
LUX
CA
NJP
NN
LD PRT
DEU AU
TSW
ED
NK
FIN ISL
FRA
CH
E
OECD: Quality of Overall Infrastructure(Score)

26
20. This conclusion is supported by data on Israel’s health outputs, which are more directly related to spending inputs than the outcomes. Israel also has above average doctor to population ratios indicating a high human capital intensive labor input, although the nurse to population ratio is below average. On the other hand, the capital intensive inputs, measured by outputs such as CT and MRI scanners and numbers of hospital beds, are relatively low. However, their utilization rates are relatively high, indicating efficient use of capital inputs. Finally, the quality of care is relatively high, as indicated by very low hospital mortality rate of myocardial infarction.
21. Israel’s education outcomes are more mixed. Israel’s graduation rate is amongst the highest in the OECD. 4 This is partly a result of policy, whereby students are required to complete secondary school – resulting in greater efforts at keeping marginalized students engaged. These high graduation rates are reinforced by one of the highest university enrollment rates in the OECD.
22. However, Israel’s PISA score is amongst the lowest in the OECD. This is true across the range of subjects covered by the PISA: maths, science and reading.
23. These results call into question the effectiveness of education spending in Israel. While spending per school age capita in US$ terms is below the OECD average, it is similar in amounts to countries that achieve much higher results, and Israeli children spend the 3rd highest cumulative time in school. On the other hand, class sizes in Israel are higher than the OECD average.
24. A significant factor in this result is the poor outcomes of minority groups.5 When looking at the PISA reading scores by cultural group, the difference between Jews and Arabs is stark. Jewish students’ scores are on par with the OECD average, while Arab group scores are more than 20 percent lower (Figure 3). This is likely due to a number of reasons, such as geographic vicinity, income levels and parent’s education levels: all of which have an impact on education outcomes. Nevertheless, budgetary spending per child in Arab localities is only half of that in Jewish communities, which is reflected in Arab schools having far higher class sizes, and 25 percent lower teaching hours than in Jewish schools at the elementary level.
25. Similar patterns can be seen in health indicators. Infant mortality rates amongst the Arab population are almost three times that of the Jewish population, which otherwise sits amongst the very top tier of results amongst the OECD. Again, this result is likely due to a
4 This measure differs to completion rates, which compares graduating to enrolled students.
5 Similar information is not available for Haredi schools, which did not participate in PISA.
Primary Lower Secondary
Arabs 29 33
Jews 24 29
OECD average 22 24
Source: OECD
Average Class Sizes

27
number of factors in addition to the provision of health services, including high fertility rates amongst the Muslim population.
26. These poor minority outcomes pose a major challenge. In addition to the direct impacts, they also feed into the broader economic issues facing Israel, with low productivity levels of minority populations to a large extent determined by education quality and attainment. Thus, this is one area where there is a strong case increasing expenditure.
27. The quality of infrastructure in Israel is below the OECD average. Israel scored highly among telecommunication indicators, but relatively poorly on physical infrastructure (Figure 3). Poor transport infrastructure is one of the obstacles to regional Arab communities’ participation in the labour market.
28. If these poor outcomes for minority groups are not resolved, Israel will face a considerable crunch in public spending. The minority groups are rapidly becoming an increasing share of the population. If employment and productivity rates are not lifted, Israel’s potential GDP will be affected, with severe flow through impacts on the amount of civilian expenditure.
29. Social protection outcomes in Israel leave room for improvement. Israel has one of the highest levels of inequality in the OECD. Israel’s relatively high degree of market income inequality reflects the impact of the two low income groups: the ultra-orthodox men (haredi) and Arab women, who make up considerable shares of the population but have very low levels of labor force participation. This is reflected in very low market incomes of the lowest income decile – which are 1/15th that of the highest income decile.
30. While the size of redistribution from the tax transfer system (the difference between market and disposable incomes) is around average in Israel, the high starting point leaves Israel one of the most unequal countries in the OECD, after only the US, Mexico and Chile.
31. Transfer payments typically have a much higher impact on inequality than does the tax system – approximately two-thirds of redistribution occurs through payments. In order to gauge the effectiveness of transfer
0.0
0.1
0.2
0.3
0.4
0.5
0.6
0.0
0.1
0.2
0.3
0.4
0.5
0.6
SVN
DN
KC
ZESV
KN
OR
BEL
FIN
SWE
AU
TC
HE
LUX
FRA
NLD
DEU
KOR
ISL
EST
POL
ESP
NZL JPN
AU
SC
AN
ITA
GBR PR
TIS
RU
SA CH
L
Inequality of Market income
Inequality of disposable income
Inequality and Redistribution(Gini coefficient)
Source: OECD.
0
40
80
120
160
0
10
20
30
40Size of transfer system (percent of GDP, LHS)Redistribution (change in Gini, LHS)Policy Effectiveness
Effectiveness of Transfer System
Source: OECD.
28
payments we compare the amount of redistribution, as measured by the change in the gini coefficient stemming from those transfers, to the size of the payments, as a share of GDP. The higher the ratio of redistribution to payments, the more higher the efficiency of the transfer payments.
32. The efficiency of Israel’s transfer payments is the lowest of those countries for which these data are available. This group can be loosely split between the high tax/transfer European countries, with relatively large universal-style transfer payments, and the (largely Anglo-Saxon) countries with smaller, more targeted transfer systems. As would be expected with universal systems, the redistribution is less effective, while the targeted (using means testing), and conditional (often to employment) nature of the latter have higher redistributive effectiveness. Israel’s system is characterized by universality of payments (for instance family benefit payments go to everyone), but the size of the transfer system is more like the smaller targeted systems of the Anglo-Saxon economies, with the resulting lower than average impact on redistribution from transfers.
33. There are a number of options to reduce the degree of inequality in Israel. The first is to lift market incomes of the lower income earners, through improving employment and productivity of the minority populations (which would also have the positive effect of lifting GDP per capita). The second is to increase the size of the transfer payment system, through increasing payment rates. The third option is to make the system more effective without increasing its size, through adopting some of the targeted and conditional programs that are used in the Anglo-Saxon countries. The design of these targeted systems needs to be done carefully, and looked at as a whole (including the tax system) as there can be associated problems of high effective marginal tax rates and potential poverty traps coming from the withdrawal of benefits.
D. Recent Policy Changes
34. There have been a number of policy changes since 2008, including increased education funding through the New Horizon initiative, the introduction of an earned income tax credit, and increased transport infrastructure investments.
35. In response to the social protests, the government formed the Tratjenberg Committee to recommend policy changes to meet the concerns of the protestors. On the expenditure side, the main recommendations that have so far been adopted by the Knesset were to expand child care positions and subsidies; provide free compulsory education for 3–4 year olds; and increase labor market schemes for minority populations.
36. These changes represent moves in the right direction. The new horizon and increased active labor market schemes go some way to improving the quality of education among minority communities, as well as raising the active labor market programs that are otherwise very low in Israel. The expansion of places for pre-primary students may raise

29
human capital levels – with various studies showing that pre-primary education can have a major impact of human capital attainment, while at the same time reducing effective marginal tax rates (in the form of lower child care costs) for working families. However, unlike the earned income tax credit, which is an example of a targeted and employment conditional transfer, the universal nature of the subsidies are unlikely to improve the redistributive effectiveness of the transfer system.
E. Concluding Remarks
37. While Israel’s social outcomes are of a relatively high quality, there is an argument for higher civilian expenditure in activities related to the minority groups. However, there are a number of other moderate expenditure countries which succeed in delivering high quality social outcomes with similar amounts of civilian spending.
38. With its young population providing a sizeable demographic dividend, this should also be possible for Israel, though the size of that dividend is reduced by the underutilization of minority groups. Failure to tackle this problem urgently will lead to a crunch in resources, requiring savings in all areas of expenditure – both civilian and defense.
39. Policy actions taken are moving in the right direction, with increased funding directed to these needs, and the lowering of effective marginal tax rates for the population overall. To increase the effectiveness of spending, particularly in reducing inequality, Israel should look to lessons from those moderate expenditure countries, particularly in the design of policies to increase the degree of targeting and conditionality to provide more bang for the social transfer shekel.

30
III. INFLATION TARGETING IN ISRAEL TWENTY YEARS ON1
The new Bank of Israel (BoI) Law heralds key institutional innovations to Israel’s monetary framework that align the Bank’s de jure set up with that of the world’s most modern inflation-targeting (IT) central banks. A number of important developments to the practice with which monetary policy is currently conducted in Israel are considered.
A. The 2010 New BoI Law
1. Since its introduction, Israel’s inflation targeting (IT) framework has delivered important macroeconomic results. In 1992 Israel adopted an inflation targeting policy together with a crawling exchange rate band regime with the aim of reducing the rate of inflation. As a result, by the year 2000, inflation had been successfully reduced from double digits to low single digits where it has stayed. And despite considerable inflation volatility, prices experienced moderate acceleration in the 2000s decade, with inflation remaining at all times within single digits. 2. The framework weathered severe shocks well, including wars, the bust of the dot-com bubble in 2000, and the 2007–09 global financial crisis. 3. However, throughout this period, the Bank of Israel was operating under a law dating back to 1954, which had become increasingly obsolete both in terms of changes in the Israeli and the global economy. In particular, although in 1985 the Bank’s law had been amended to prohibit the government from asking the Bank to print money for it (via the “Non-Printing Law”), the Bank’s de jure independence remained more restrictive than its de facto independence. At the same time, the 1954 law still assumed foreign-currency controls long time after Israel had shifted to a flexible exchange rate.
4. This may partly explain some of the difference in macro outcomes over the 2000s compared to Israel’s IT peers. Although Israel’s inflation outcomes have improved dramatically in the second decade since adoption,2 over that decade, advanced and emerging markets countries’ (like Peru) have had a stronger performance on some dimensions. And while in part, the better performance of Israel’s advanced economy peers may be ascribable to the fact that Israel faced severe shocks, including of geopolitical nature, countries in the emerging markets comparator group also lived through important disturbances over the
1 Prepared by Nicoletta Batini ([email protected]).
2 During the 1990s, the Bank of Israel main goal was to facilitate a disinflation process, rather than minimize inflation and output gap volatilities. These became more prominent goals in the 2000s, which may help explain why they were met more closely over that period.

31
period of comparison, notably the Argentina crisis in the early 2000s, the huge upswing between 2006–08 in commodity and fuel prices which feature prominently in these countries’ CPI baskets, and last but not least political turmoil and natural disasters. 5. In March 2010, following a long gestation, the Knesset passed a new Bank of Israel Law, which became effective on June 1, 2010. The new law leaves the Bank’s modus operandi largely intact but now formally states that the Bank’s main objective is to maintain price stability. In addition, while under the new law the Bank remains the regulator of the banking system, the new law now grants the Bank the objective to support the stability of the whole financial system.
0
1
2
34
5
Inflation Volatility
Avg. Inflation target misses
Policy Rate Volatility
Output Gap Volatility
1992-2001
2002-2011
Israel: Historic Performance Compared
012345
Inflation Volatility
Avg. Inflation target misses
Policy rate Volatility
Core inflation volatility
Output Gap Volatility
Israel BrazilChile Peru
Israel vs. EMEs Performance, 2002–11
0
1
2
3
Inflation Volatility
Avg. Inflation target misses
Policy Rate Volatility
Core inflation volatility
Output Gap Volatility
Israel UKCanada Sweden
Israel vs. Advanced Economies' Performance, 2002–11
6. The new law grants operational independence to the Bank of Israel. A Monetary Committee—as opposed to the Governor alone—now determines monetary policy as well as all other actions required to achieve the Bank's objectives. Alongside, mechanisms have been set up to ensure that the Bank's independence is accompanied by accountability and transparency with regard to the executive branch, the legislature and the public. A Council has been created, with the mandate to supervise the orderly and efficient management of the Bank.
B. How Does Israel New IT Framework Compare with That of Peer Countries
7. Israel’s new IT framework is modern, and compares well with the current frameworks of successful “mature” IT central banks in the advanced and emerging market world (Table 1). The key innovations that align Israel’s framework with that of its peers are:
i. The new law clearly identifies price stability as the primary objective of policy in line
with other successful IT central banks.3 Other goals, notably growth, employment and a reduction of social gaps, as well as financial stability, are secondary objectives. By making low inflation the primary goal of monetary policy and by specifying the goal
3 Bank of Israel Law 5770-2010, Chapter 2, Art. 3.
32
numerically, the new BoI law makes the Bank’s target intrinsically clearer and more easily observable and understandable than the 1954 law, helping to anchor inflation expectations more effectively.
ii. The inflation forecast over a two-year horizon is the de facto intermediate target of
policy.4 Since inflation is partially predetermined in the short term because of existing price and wage contracts and/or indexation to past inflation, monetary policy can only influence expected future inflation. By altering monetary conditions in response to new information, central banks influence expected inflation and bring it in line over time with the inflation target, which eventually leads actual inflation to the target. Contrary to other central banks, in Israel the length of the policy horizon—up to two years—is legislated.
iii. The Bank’s financial stability and foreign exchange rate mandates have been
qualified explicitly.5 In line with the organic laws of peer modern IT central banks, the new BoI Law assigns the Bank the goal of supporting the stability and normal functioning of internal and external payments. Importantly, the law also spells out exactly which actions the Bank can take for the discharge of its functions, identifying actions that can be taken under exceptional circumstances; and grants the Governor the right to access at will information to pursue the financial stability mandate from other regulatory authorities in the country.
iv. The new law grants the Bank a considerable degree of independence similarly to
other successful inflation-targeting central banks.6 Although the Bank already enjoyed a significant amount of independence in practice, the new law confers the Bank legal autonomy and reaffirms its freedom from fiscal and/or political pressure that would create conflicts with the inflation objective (“institutional independence”). The appointment of a Monetary Committee and a Council, whose members are chosen among the public with no political or business ties (“personal independence”), reinforces the Bank’s institutional independence. Finally, the new law also confers the Bank (and its Monetary Committee) the functional independence necessary to pursue the mandate objectives in a flexible way (operational independence) in recognition of the fact that the target on inflation is typically interpreted as a medium-term goal, and that the Committee has the skills to decide how best to alter the monetary stance so as to keep inflation expectations at target over the medium term (as well as to pursue its other goals).
4 Bank of Israel Law 5770-2010, Chapter 2, Art. 3. 5 Bank of Israel Law 5770–2010, Chapter 2, Art. 3; Chapter 5, Art. 36–39; Chapter 7, Art. 41–47; Chapters 9,
10, 12 and 13. 6 Bank of Israel Law 5770–2010, Chapter 2, Art. 5; Chapter 3, Art. 11–14; Chapter 4, Art. 15–16.
33
v. The Bank is now more accountable than before. As with other successful IT central
banks, the new law compensates for the greater operational freedom that IT offers by imposing greater transparency and greater accountability. This includes imposing the frequent and prompt publication of summaries of the Bank’s deliberations and resolutions, quarterly and annual reports, financial reports, as well as explanations of persistent deviations of inflation from target if any.
vi. The Bank’s management and governance have been strengthened.7 Like in other
modern IT central banks, the new BoI law institutionalizes a Council the functions of which are supervising the management of the Bank and approving its budget (including the salary terms for Bank employees) and appointing an internal auditor.
C. Does the New Law Reflect the Lessons from the Global Financial Crisis?
8. Following the global financial crisis, significant reforms have been implemented to reflect the change in emphasis at central banks with regard to financial stability. In the United States, for example, the Dodd-Frank Act instituted substantial changes to financial-sector supervision and regulation powers and responsibilities of the Federal Reserve in direct response to the lessons learned from the financial crisis and the associated recession. At the level of the European Union as a whole, a new financial supervisory architecture became operational at the beginning of 2011. It includes three new European supervisory authorities (ESAs) for banking, insurance and securities markets – which aim to strengthen micro- prudential supervision – and the European Systemic Risk Board (ESRB) responsible for macroprudential oversight. In the United Kingdom, since the 2009 Banking Act, the Bank of England has had a statutory objective to “contribute to protecting and enhancing the stability of the financial systems of the United Kingdom” and the Bank’s Court, consulting HM Treasury and on advice from the Financial Stability Committee, determines the Bank’s strategy in relation to that objective.
9. In this vein, the new BoI Law fully and suitably embeds lessons from the crisis establishing state-of-the-art mechanisms to deal with possible future crises. In particular, the new law:
Expands the Bank’s operational toolkit to encompass tools to implement quantitative and qualitative easing. Under the new law, the Monetary Committee has complete autonomy in choosing a combination of policy tools to deal with financial market volatility or distress. To encompass quantitative and qualitative easing tools,
7 Bank of Israel Law 5770–2010, Chapter 4, Subchapters B and C.

34
the toolkit now includes (in addition to standard measures such as changing the policy interest rate, receiving deposits and granting credit to banks—also by the pledge of securities––issuing directives on reserves held by the banking sector, managing international reserves and intervening in the foreign exchange rate market): (a) perform actions or transactions in the stock exchange, other regulated market or off-market; (b) purchase or sell government paper with maturity over thirteen months; (c) grant credit to non-bank financial institutions. This helps the Bank continue monetary expansion even when the policy rate has reached its effective zero.
Emphasizes the Bank’s “Lender of Last Resort” role. Under the new law, the Bank
can grant credit to banks determining the conditions for such financing. Importantly, the Bank can now autonomously amend (e.g. loosen) such conditions and extend borrowing to non-bank financial institutions under exceptional circumstances that the Committee believes may threaten the orderly functioning of financial markets.
Allows the Bank any action that it deems necessary under exceptional circumstances. These include actions not contemplated in the law itself, preempting the need—in case of future crises––for measures not yet used or conceived but that may possibly become appropriate in circumstances different than historical ones.
Confers the Bank the right to gain information on the triggers of capital inflows and outflows. The Governor, with the approval of the Monetary Committee, can now require information on transactions between residents and non-residents in (and/or possession by an Israeli resident of) foreign currency, foreign securities and real estate abroad and in Israel. This allows the Bank to better track the dynamics of such flows, which is helpful in understanding the nature of shocks and designing policies to deal with these.
Establishes that the Bank shall be consulted by the government on matters of macro prudential policy relating to capital flows. The Bank can also take an active role in supervising the implementation of such policies. This allows the Bank to coordinate a response to destabilizing flows, which can impact the exchange rate and other asset markets with adverse inflation and growth consequences.
Gives the Bank discretion in foreign exchange intervention, permitting unilateral actions in case of urgency. This enhances the Bank’s ability to promptly influence the stance of monetary policy or support the financial system in case of extraordinary foreign exchange rate volatility as can be generated by sudden safe-haven flows during a financial crisis.
Enhances policy coordination across governmental agencies and grants the Bank new supervisory and regulatory roles. Via the Governor, the Bank has now been granted the right to access from other Israeli regulatory authorities all information it

35
deems necessary in the discharge of its financial stability mandate. This buttresses policy coordination across regulators and supervisors with beneficial effects on their effectiveness. The new law also allows the Bank to request information and impose financial sanctions to financial institutions not abiding to regulations set by the Bank itself.
D. Options for Development
10. There are areas in the new BoI Law and practice which differ from arrangements elsewhere. Although there is not a present an international best practice on inflation targeting, in some of the areas, arrangements could be aligned over time with potential benefits to the Bank’s effectiveness. Options include:
Objectives: The Committee could gradually start to emphasize the special status of the midpoint
of the inflation target range when explaining to the public their interest rate decision. Emphasis on the midpoint would help the public internalize the notion that the Committee preferences relative to the target range are symmetric, that is to say, the Committee is equally uncomfortable to see inflation deviate into the lower and the upper parts of the target range. Importantly, with no emphasis on the midpoint, the range can be perceived as a « range of indifference » which can potentially lead to uncertainty vis-á-vis the exact inflation number at which the Committee aims, delaying the anchoring of expectations at the midpoint as well as potentially increasing inflation volatility by generating inflation uncertainty. Emphasizing a specific number within the range is particular key when a committee—as opposed to a single decision-maker—is in charge of setting the interest rate. Internally, it helps the Committee discuss strategy; while externally, it helps the public and markets extract the substantive reasons behind differences in views among Committee members. This, in turn, helps the public reverse-engineer policies and preferences.8
Accountability: Report inflation (and output growth) forecasts two-years out—in addition to one-year
out forecasts. The new BoI Law establishes that the Committee should run policy so that inflation is expected to be within the established price-stability range “within no more than two years”. Showing, as currently done, only inflation and output growth forecasts at a horizon shorter than two years prevents the public from monitoring observance of the inflation target. This not only limits the accountability of the
8 The Bank of England shifted from a target range to a point target with range in 1996 on these grounds.
36
Monetary Committee, but also hinders the swift convergence of inflation expectations at the policy horizon toward the Committee’s belief of where inflation will be at that horizon—blocking one of the main mechanisms through which inflation targeting works.9
Transparency and Communication: The Monetary Committee could start reporting its own inflation and output growth
forecasts.10 The Bank’s routine publications only report the Research Department’s forecasts. Although the latter forecasts receive inputs from the Committee, and although the Governor comments publicly on the Research Department’s forecasts during press releases of the Monetary Policy Report, these are not formally the Committee’s forecasts—contrary to international best practice. To guide expectations on interest rates and inflation the public must have clear what is the Committee’s own central tendency outlook on inflation over the policy horizon, as well as know how the Committee apportions risk around its own projection. Having its own forecast would also enhance the Committee accountability vis-à-vis its price stability mandate, and would help rationalize the Committee’s operational decisions regarding other mandates. This does not mean that the Monetary Committee needs to produce an additional set of forecasts to the Research Department ones. Rather, following the example of other successful IT central banks, the Committee could make the Research Department’s forecasts its own over time, by taking a leading role in the choice of initial assumptions—including on shocks—and by applying its own judgment to model forecasts and to the risk skews used in the preparation of the fan charts.
Some IT central banks find it useful to share the task of public communication between all members of the Monetary Committee and the BoI may want to consider their example. So far, and in keeping with earlier practice, the Bank’s communication has been executed primarily by the Governor. However, in some IT central banks this is not the case and the task of communication is shared among Committee members so that markets and the public at large—especially where there are no minutes of the policy meetings and/or the votes of individual members are not attributed like in Israel—get to know over time how each member of the Committee thinks and what
9 See Michael Woodford, 2007. "The Case for Forecast Targeting as a Monetary Policy Strategy." Journal of Economic Perspectives, 21(4): 3–24. The central banks of the United Kingdom, Sweden, Canada, Chile, and Peru all report inflation forecasts over a two year horizon, a horizon that is long enough to encompass these banks’ individual unlegislated horizons over which transmission is believed empirically to occur.
10 All central banks in Table 1—apart from Israel’s--publish executive boards’ forecasts. As of January 25, 2011 also the FOMC of the Federal Reserve, has begun publishing its own “central-tendency” forecasts (see http://www.federalreserve.gov/newsevents/press/monetary/20120125c.htm).
37
are her/his policy preferences with respect to current and long-term monetary policy issues. This helps them form expectations with regard to the future course of the policy rate (and thus, inflation) which is decided by the Committee as a whole. However, it is not clear which practice is best, and these arrangements can change over time.
Some IT central banks find it helpful to attribute votes in the minutes—a practice the BoI may consider to better reflect the Bank’s new decision-making process. Since the introduction of the new BoI Law, the policy rate is decided by the Monetary Committee and such decision is made on the basis of one-person, one vote. It is not based on a consensus of opinion. In some other successful central banks with a similar set up, like the Bank of England and the Riksbank, for example, the minutes give a full account of the policy discussion, including differences of view. Accordingly, they also record the votes of the individual members of the Committee.
Appointments of the members of the Monetary Committee. The new BoI Law establishes a precise and transparent code for the appointment of the members of the Committee. In addition, appointment of the external members is staggered which ensures that the composition of the group of external members of the Committee will change gradually when these members’ appointments expire. In line with some IT central banks, the BoI may want to gradually lengthen the terms of office of external members bringing it to a length equal to that of the Governor and Deputy Governor. The BoI may also want to publicly specify the length of the appointment of the Bank employee appointed by the Governor to be a member of the Monetary Committee, since this is not defined in the new BoI Law or elsewhere at present. Alongside, over time, it should be better clarified what kind of acts unbefit members of the Committee from their status, to limit—in line with some other IT central banks—the potential discretion in removing them from office.
The models and the policy rule used to form inflation forecasts could be published more systematically and disseminated widely. The Bank uses a “suite” of models to produce the inflation forecast but these are not well identified in a single document. Importantly, the Bank publications do not explain which interest rate path (or policy rule for the interest rate) are the inflation forecasts conditional upon. Although modeling at the Bank will continue to evolve, it would be important for transparency and accountability to keep the public up-to-date with the Bank’s forecasting technology. This also opens up the Bank’s forecasting to beneficial scrutiny from the academic community domestically and internationally.
Two further areas of the new BoI Law could require particular focus.

38
Handling of information on financial stability matters within the Monetary Committee. Presently, under the new law, the Monetary Committee does not serve as a Banking Supervisory Committee. As a result, the Bank Supervisor reports to the Governor and not the Monetary Committee. However the Monetary Committee does have a role somewhat similar to that of the Financial Stability Committee in the Bank of England—having in the Bank of Israel the role to support financial stability. The access of information by Committee members is currently based on the division of responsibilities. However, there may be circumstances in which making effective decisions in support of financial stability requires knowledge of the confidential information, thereby demanding that all members of the Committee have need for access to that data which is essential to the execution of their mandate. This will be particularly true when systemic issues arise. Without changing the new BoI law, giving information access on financial stability matters under specific circumstances to the Monetary Committee at large could be achieved by amending the Bank Law (which also governs the handling of this information), or, perhaps more easily, by establishing an internal Bank protocol that defines which information will be shared with the Committee by the Governor on an automatic basis.
In line with international best practice, decisions on staff salaries should be the remit of the Bank of Israel’s Council alone, with no government role.11 This ensures the Bank’s full budgetary autonomy—which in other successful central banks is a chief tenet of institutional independence. The Bank of Israel needs to be able to recruit and retain skilled staff—a task that is already proving difficult. Finally, to enhance transparency and accountability on Bank’s pay and to maintain appropriate relativities with pay elsewhere in the public and private sectors, Bank’s staff salary determination should be vetted by the Audit Committee; and both the Bank’s remuneration policy and the structure of staff salaries should be made public in the Bank’s Annual Financial Report.
11 For example, in the United Kingdom, the Bank of England Court decides the salaries of senior bank staff including the Governors and External MPC members, while the Governors decide other staff salaries subject to agreement of the Court. In Chile, staff salaries (subject to the private labor code and not the public administration’s) are decided by the Board, while the Board’s salaries are set by a decree after consultation with an external committee of former central bank governors. In Canada, the salaries of the Governor and Senior Deputy Governor are set by the Board of Directors subject to the approval of the federal cabinet. The salaries of other employees of the Bank are set in accordance with the salary scales established by the Board. In Peru, staff salaries are decided by the Board and the Board fixes its own salaries as well as those of senior bank staff, although the President and Congress need to be informed of any change to the salary of the central bank’s president.

39
Table 1. A Comparison of Institutional Frameworks Across Selected IT Central Banks
Israel1 UK Canada Sweden Brazil Chile Peru
Date of adoption Jan 1992 May 1997 Feb 1991 January 1993
(applicable from 1995)
Jun 1999 Jan 1991 Jan 2002
I. Independence
Goal independence
No.
Set by the government in consultation
with the central bank
governor
No.
Set by the government
alone
No.
Set by bilateral agreement between the
government and the central bank.
No.
Set by bilateral agreement between the
government and the central bank.
Govt decides price stability goal, Riksbank
decides numerical target and index
No.
Set by National Monetary Council
composed by finance minister, planning minister and central bank
president
Yes.
Set by the central bank alone
Yes.
Set by the central bank alone
Instrument independence
Yes Yes Yes* Yes Yes Yes Yes
Removal from office of Governor and MPC members
For generically-
specified non-compliance/mi
sconduct
Only for well-identified non
compliance/grave misconduct
If a profound disagreement on the conduct of monetary
policy were to occur plus other standard cases of
non-compliance/misconduct
Only if requirements for performing duties are no longer fulfilled or if guilty
of gross negligence.
Only for well-identified non
compliance/grave misconduct
Only for well-identified non
compliance/grave misconduct
Only if acts against the law (including the
central bank’s organic law)
Finance Minister participates in MPC Meetings with voting rights
No No No No No Yes. Speaking rights only
No, but Deputy Finance Minister can be a
member of the MPC
Obligation to purchase
government debt
No
No
No No No No No
1 Description of framework relates to status quo following the passing of the new Bank of Israel’s law 5770–2010. (*) But subject to the possibility of a government directive. See section 14 of the Bank of Canada Act. In practice, the government has never exercised its directive power.

40
Israel UK Canada Sweden Brazil Chile Peru
II. Objectives
Primary objective
Price stability Price stability Price stability Price and financial stability
Price stability Price stability* Price stability
Current target 1-3 pc 2pc 2pc 1pp 2pc 4.5 pc 2pp 3 pc 1pp 2 pc 1pp
Inflation measure
CPI CPI CPI CPI National Consumer Price Index (IPCA) : a measure of
inflation in 9 metro areas plus other 2 urban areas
CPI CPI for Metropolitan
Lima
Policy horizon 8 quarters All horizons** 6-8 quarters** 8-12 quarters** 8 quarters** 8 quarters** 8 quarters**
Escape clauses Yes Yes No*** No Yes Yes Yes
Secondary objective(s)
Value/stability of the currency;
financial stability
Growth and employment
None**** None Value/stability of the currency; growth,
development, general welfare ; financial stability
Value/stability of the currency; financial
stability
Financial stability
(*) Although the organic law of the central bank establishes three paritarian objectives, the central bank’s Board identifies price stability as its primary objective and financial and currency stability as secondary objectives (see Banco Central de Chile, 2007. « La Política Monetaria del Banco Central de Chile en el Marco de Metas de Inflación »). (**) Unlegislated. For the UK—with the understanding that inflation expected to deviate from time to time given shocks and with peak effect of policy recognized at 9 quarters. (***) But horizon can be extended depending on the circumstances. (****) Financial stability concerns are one of several possible reasons for varying the horizon for returning inflation to target, but do not constitute a secondary objective.

41
Israel UK Canada Sweden Brazil Chile Peru
III. Accountability
MPC with external members2
Yes Yes No No No No Yes
MPC members individually accountable (through identified voting)
No Yes
(also subject to individual hearings by Treasury Select Committee of the
House of Commons)
No Yes No* No No
MPC external members have own resources--including economic staff--to operate
No. Access to Bank’s staff under
mediation of deputy governor
Yes. Access to Bank’s staff mediated by internal members, although can expect prompt assistance ahead of
policy meetings
NA NA NA NA No. But mediation of access to bank staff waived in practice.
Governor’s mandate length same as rest of MPC
No (>) No (>) No (>) Yes No (>) No (<) Yes
Governor required to testify in Congress
Yes. 1/yr Yes. 2/yr Yes. 4/yr Yes. 2/yr Yes. 2/yr Yes. 2/yr No
Open letter to explain target misses
No Yes (triggered when inflation differs by more than 1pp from the 2pc target)
No No No No
MPR At least 2/yr 4/yr 4/yr 6/yr (3 MPR, 3 MPU
(updates))
4/yr 4/yr 4/yr
FSR 2/yr 2/yr 2/yr 2/yr 2/yr 2/yr 2/yr
Annual Report Yes No Yes Yes Yes Yes Yes
Financial Accounts 1/yr 1/yr 1/yr, qtr 1/yr, qtr 1/yr 1/yr 1/yr
2 An “external member” is here defined as a MPC member which is not a staff member of the central bank at the moment of the appointment nor after (although it can have been in the past), and who can hold positions not related to central bank activities during her/his office as a MPC member (some organic laws impose restriction on activity type). (*) The Bank’s governing council operates by consensus. The governing council de facto shares responsibility for monetary policy. However, the Bank of Canada Act formally places responsibility for monetary policy solely in the hands of the governor.

42
Israel UK Canada Sweden Brazil Chile Peru
IV. Transparency and Communication
Eijffinger-Geraats/Dincer-Eichengreen CB Transparency Index*
(*) as of 2005. EU: 10.5; US: 8.5
10.5** (8.5)
(**) Post new CB Law
() Pre new CB Law
12 10.5 13 9 7.5 12***
(***) Updated to 2012
A. Economic transparency (a, b are selected subindices)
Regularly publishes MPC’s forecastsa No Yes Yes Yes Yes Yes Yes
Forecasts include inflation and output growthb and distribution of risks
Only inflation.
No risks
Yes Yes Yes Yes Yes Yes
B. Procedural transparency (c, d are selected subindices)
Provides an explicit policy rule or strategy that describes its monetary policy frameworkc
No Yes Yes Yes No Yes Yes
Comprehensive accounts of policy deliberations within a reasonable amount of timed
Yes Yes Yes Yes Yes Yes
C. Policy Transparency (e, f are selected subindices)
Decisions about adjustments to the main operating instrument or target announced promptlye
Yes Yes Yes Yes Yes Yes Yes
Provides an explanation when it announces policy decisionsf
Yes Yes Yes Yes Yes Yes Yes
D. Operational Policy (g is a selected subindice)
Regularly evaluates to what extent its main policy targets (if any) have been achievedg
Yes Yes Yes Yes Yes Yes Yes
Related Documents