NEW HANOVER COUNTY The North Carolina Alliance for Athletics, Health, Physical Education, Recreation, and Dance (NCAAHPERD), launched In-school Prevention of Obesity and Disease (IsPOD) in 2007. The initiative began with a grant from the NC Health and Wellness Trust Fund and was expanded with grants from the Blue Cross Blue Shield of North Carolina Foundation. The expansion to a state-wide program is supported by a $3.6 million grant from the Kate B. Reynolds Charitable Trust. NCAAHPERD is engaged with a large network of health and physical education groups seeking greater opportunities for a healthier and more creative North Carolina. IsPOD Data Results Spring 2010

IsPOD DISTRICT REPORT - NEW HANOVER 10OCT01
Mar 29, 2016
IsPOD Data Results Spring 2010 2010 NC IsPOD Evaluation All rights reserved. 2010 NC IsPOD Evaluation Conducted by NCAAHPERD/NC DPH All rights reserved. ID School Name Grades 1-2 Grades 3-5 2010 NC IsPOD Evaluation Conducte4d by NCAAHPERD/NC DPH All rights reserved. 2 SPARK Trained? Using FG? 2009- 2010 ADM FG Response Rates # Staff Trained
Welcome message from author
This document is posted to help you gain knowledge. Please leave a comment to let me know what you think about it! Share it to your friends and learn new things together.
Transcript

2010 NC IsPOD Evaluation All rights reserved.
NEW HANOVER
COUNTY
The North Carolina Alliance for Athletics, Health, Physical Education, Recreation, and Dance (NCAAHPERD), launched In-school Prevention of Obesity and
Disease (IsPOD) in 2007. The initiative began with a grant from the NC Health
and Wellness Trust Fund and was expanded with grants from the Blue Cross Blue Shield of North Carolina Foundation. The expansion to a state-wide program
is supported by a $3.6 million grant from the Kate B. Reynolds Charitable Trust. NCAAHPERD is engaged with a large network of health and physical education
groups seeking greater opportunities for a healthier and more creative North Carolina.
IsPOD Data Results
Spring 2010

2010 NC IsPOD Evaluation
Conducted by NCAAHPERD/NC DPH All rights reserved.
New Hanover County
SPARK Training
Staff from New Hanover County began receiving SPARK training in the 2008-
2009 school year with the KBR Grant. New Hanover County has 33 K-8 public
schools. Of these 33 schools, 28 schools (or 85%) have received SPARK
training. At these schools, a total of 43 PE teachers and 3 coordinators have
been trained in SPARK. Table 1 shows the New Hanover County K-8 schools
that have received SPARK training and the number of staff trained. FitnessGram
Response Rates are also given for each of the K-8 schools.

2010 NC IsPOD Evaluation Conducte4d by NCAAHPERD/NC DPH
All rights reserved.
2
Table 1
New Hanover County K-8 Schools
Schools with SPARK Training and FitnessGram Response Rates
ID School Name
DEMOGRAPHICS SPARK FITNESSGRAM
2009-2010 ADM
% Needy
SPARK Trained?
# Staff Trained
Using FG?
FG Response Rates
Grades 1-2
Grades 3-5
Grades 6-8
304 Bradley Creek Elementary 339 33% YES 1 NO 0% 0% NA
308 Carolina Beach Elem 428 16% YES 1 NO 0% 0% NA
309 Castle Hayne Elementary 415 NA YES 1 NO 0% 0% NA
310 Charles P Murray Middle 843 0% YES 2 NO NA 0% 0%
312 R Freeman Engineering 348 0% YES 1 NO 0% 0% NA
316 College Park Elementary 380 100% YES 1 NO 0% 0% NA
320 D C Virgo Middle 285 74% YES 2 NO NA NA 0%
323 Edwin A Anderson Elem 611 39% YES 1 NO 0% 0% NA
324 Edwin A Alderman Elem 279 58% YES 1 NO 0% 0% NA
325 Emma B Trask Middle 850 45% YES 3 NO NA NA 0%
328 Forest Hills Elementary 462 66% YES 1 NO 0% 0% NA
332 Gregory Elementary 396 51% NO 0 NO 0% 0% NA
338 Heyward C Bellamy Elem 608 40% YES 1 NO 0% 0% NA
339 Holly Tree Elementary 489 26% YES 1 NO 0% 0% NA
341 John J Blair Elementary 610 39% YES 1 NO 0% 0% NA
345 Lake Forest Academy 37 92% YES 1 NO 0% 0% 0%
346 Mary C Williams Elem 400 86% YES 1 NO 0% 0% NA
348 Murrayville Elementary 627 41% YES 1 NO 0% 0% NA
350 M C S Noble Middle 887 27% YES 4 NO NA NA 0%
351 Myrtle Grove Middle 962 32% YES 3 NO NA NA 0%
353 Dr Hubert Eaton Sr Elem 576 13% YES 1 NO 0% 0% NA
354 Lakeside 70 100% NO 0 NO NA NA 0%
356 Ogden Elementary 666 13% NO 0 NO 0% 0% NA
362 Pine Valley Elementary 553 39% YES 1 NO 0% 0% NA
364 Roland-Grise Middle 763 40% YES 4 NO NA NA 0%
366 Dr John Codington Elem 528 14% YES 1 NO 0% 0% NA
368 Sunset Park Elementary 306 93% YES 1 NO 0% 0% NA
380 Walter L Parsley Elem 602 15% NO 0 NO 0% 0% NA
384 A H Snipes Acad of Arts 491 94% YES 1 NO 0% 0% NA
392 Williston Middle 600 74% YES 4 NO NA NA 0%
400 Winter Park Model Elem 336 75% YES 1 NO 0% 0% NA
404 Wrightsboro Elementary 470 57% NO 0 NO 0% 0% NA
408 Wrightsville Beach Elem 320 6% YES 1 NO 0% 0% NA

2010 NC IsPOD Evaluation Conducted by NCAAHPERD/NC DPH
All rights reserved.
3
New Hanover County
FitnessGram Response Rates
In spring 2010, none of the New Hanover County K-8 schools conducted
FitnessGram assessments and submitted their data. Table 2 shows the
FitnessGram Response Rates by grade for all New Hanover County K-8 schools
combined.

2010 NC IsPOD Evaluation Conducte4d by NCAAHPERD/NC DPH
All rights reserved.
4
Table 2
FitnessGram Response Rates
For 0 K-8 Schools in New Hanover County
Grade 2009-2010
Average Daily Membership
FitnessGram Response Rate
Number of FG Student Ids
Percent of ADM
1st 1970 0 0%
2nd 1883 0 0%
3rd 1925 0 0%
4th 1964 0 0%
5th 1786 0 0%
6th 1739 0 0%
7th 1761 0 0%
8th 1716 0 0%

2010 NC IsPOD Evaluation Conducted by NCAAHPERD/NC DPH
All rights reserved.
5
Body Mass Index (BMI)
North Carolina
Spring 2010 Percent in Health Fitness Zone (HFZ)
FitnessGram Results for 370 NC K-8 Schools in 61 NC Counties
Grade
Percent in HFZ Counts in HFZ
Female Male
Female Male
Total FG Results
N in HFZ Total FG Results
N in HFZ
1st 56% 57% 937 528 884 500
2nd 55% 57% 1175 642 1209 689
3rd 57% 55% 9670 5556 10075 5558
4th 54% 52% 9624 5227 10103 5260
5th 53% 51% 9396 4961 9857 5043
6th 54% 50% 3528 1893 3550 1785
7th 57% 52% 3315 1897 3149 1644
8th 56% 54% 3174 1780 3321 1802
56%
55% 57%
54%
53%
54% 57%
56%
57%
57%
55%
52%
51%
50%
52%
54%
0%
10%
20%
30%
40%
50%
60%
70%
80%
90%
100%
1st 2nd 3rd 4th 5th 6th 7th 8th
Pe
rce
nt
in H
FZ
Grade
Female Male
2010 NC IsPOD Evaluation Conducte4d by NCAAHPERD/NC DPH
All rights reserved.
6
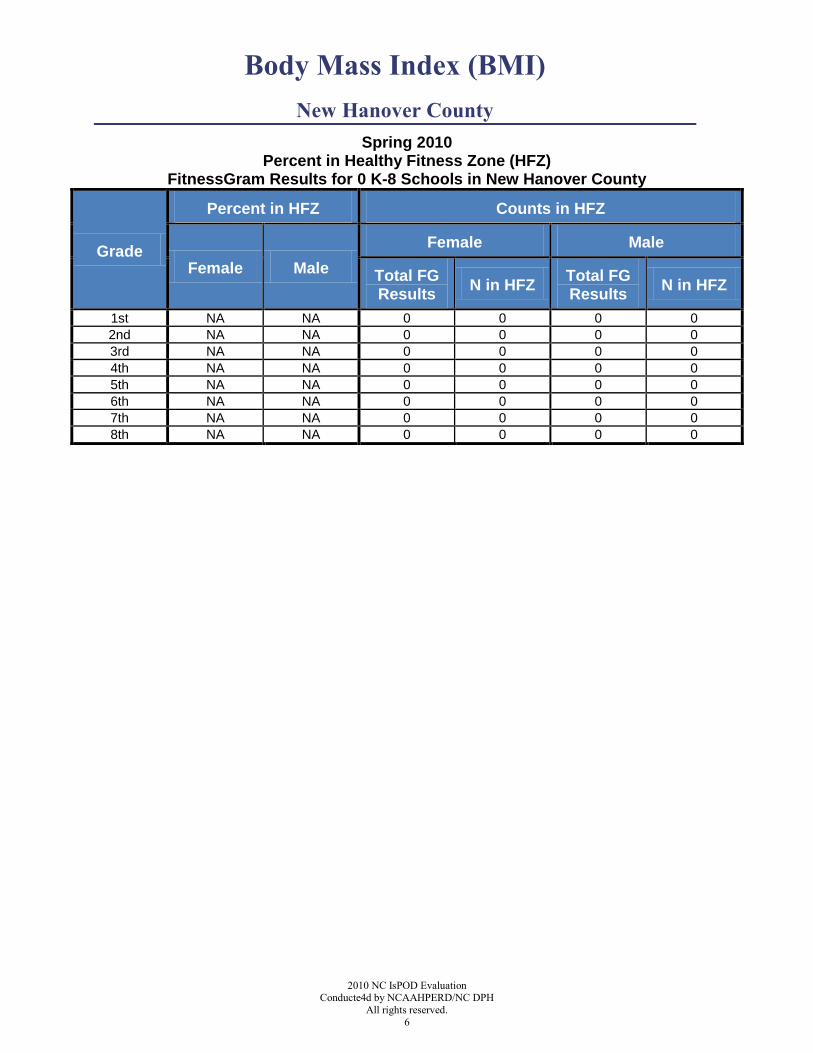
Body Mass Index (BMI)
New Hanover County
Spring 2010 Percent in Healthy Fitness Zone (HFZ)
FitnessGram Results for 0 K-8 Schools in New Hanover County
Grade
Percent in HFZ Counts in HFZ
Female Male
Female Male
Total FG Results
N in HFZ Total FG Results
N in HFZ
1st NA NA 0 0 0 0
2nd NA NA 0 0 0 0
3rd NA NA 0 0 0 0
4th NA NA 0 0 0 0
5th NA NA 0 0 0 0
6th NA NA 0 0 0 0
7th NA NA 0 0 0 0
8th NA NA 0 0 0 0

2010 NC IsPOD Evaluation Conducted by NCAAHPERD/NC DPH
All rights reserved.
7
PACER
North Carolina
Spring 2010 Percent in Healthy Fitness Zone (HFZ)
FitnessGram Results for 370 NC K-8 Schools in 61 NC Counties
Grade
Percent in HFZ Counts in HFZ
Female Male
Female Male
Total FG Results
N in HFZ Total FG Results
N in HFZ
4th 95% 61% 6952 6625 7321 4485
5th 82% 58% 6569 5398 6994 4047
6th 77% 54% 1882 1452 1936 1039
7th 68% 50% 1787 1222 1825 906
8th 58% 52% 1774 1036 1908 997
95%
82%
77%
68%
58%61%
58%
54%
50% 52%
0%
10%
20%
30%
40%
50%
60%
70%
80%
90%
100%
4th 5th 6th 7th 8th
Pe
rce
nt
in H
FZ
Grade
Female Male

2010 NC IsPOD Evaluation Conducte4d by NCAAHPERD/NC DPH
All rights reserved.
8
PACER
New Hanover County
Spring 2010 Percent in Healthy Fitness Zone (HFZ)
FitnessGram Results for 0 K-8 Schools in New Hanover County
Grade
Percent in HFZ Counts in HFZ
Female Male
Female Male
Total FG Results
N in HFZ Total FG Results
N in HFZ
4th NA NA 0 0 0 0
5th NA NA 0 0 0 0
6th NA NA 0 0 0 0
7th NA NA 0 0 0 0
8th NA NA 0 0 0 0
2010 NC IsPOD Evaluation Conducted by NCAAHPERD/NC DPH
All rights reserved.
9
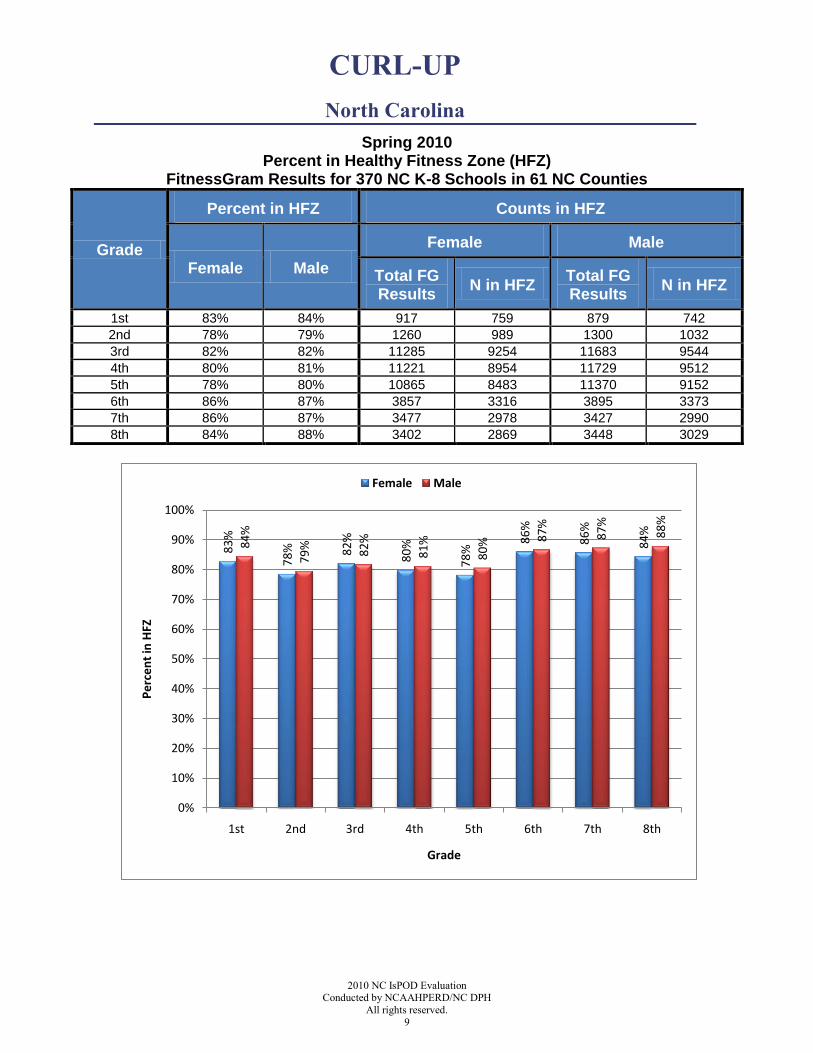
CURL-UP
North Carolina
Spring 2010 Percent in Healthy Fitness Zone (HFZ)
FitnessGram Results for 370 NC K-8 Schools in 61 NC Counties
Grade
Percent in HFZ Counts in HFZ
Female Male
Female Male
Total FG Results
N in HFZ Total FG Results
N in HFZ
1st 83% 84% 917 759 879 742
2nd 78% 79% 1260 989 1300 1032
3rd 82% 82% 11285 9254 11683 9544
4th 80% 81% 11221 8954 11729 9512
5th 78% 80% 10865 8483 11370 9152
6th 86% 87% 3857 3316 3895 3373
7th 86% 87% 3477 2978 3427 2990
8th 84% 88% 3402 2869 3448 3029
83%
78% 82%
80%
78%
86%
86%
84%
84%
79% 82%
81%
80% 87%
87%
88%
0%
10%
20%
30%
40%
50%
60%
70%
80%
90%
100%
1st 2nd 3rd 4th 5th 6th 7th 8th
Pe
rce
nt
in H
FZ
Grade
Female Male

2010 NC IsPOD Evaluation Conducte4d by NCAAHPERD/NC DPH
All rights reserved.
10
CURL-UP
New Hanover County
Spring 2010 Percent in Healthy Fitness Zone (HFZ)
FitnessGram Results for 0 K-8 Schools in New Hanover County
Grade
Percent in HFZ Counts in HFZ
Female Male
Female Male
Total FG Results
N in HFZ Total FG Results
N in HFZ
1st NA NA 0 0 0 0
2nd NA NA 0 0 0 0
3rd NA NA 0 0 0 0
4th NA NA 0 0 0 0
5th NA NA 0 0 0 0
6th NA NA 0 0 0 0
7th NA NA 0 0 0 0
8th NA NA 0 0 0 0

2010 NC IsPOD Evaluation Conducted by NCAAHPERD/NC DPH
All rights reserved.
11
PUSH-UP
North Carolina
Spring 2010 Percent in Healthy Fitness Zone (HFZ)
FitnessGram Results for 370 NC K-8 Schools in 61 NC Counties
Grade
Percent in HFZ Counts in HFZ
Female Male
Female Male
Total FG Results
N in HFZ Total FG Results
N in HFZ
1st 50% 63% 627 314 592 372
2nd 48% 62% 935 451 924 573
3rd 56% 70% 9157 5163 9527 6638
4th 52% 68% 9129 4713 9510 6475
5th 52% 66% 8900 4642 9309 6117
6th 68% 72% 3092 2093 3165 2272
7th 69% 72% 2768 1912 2742 1984
8th 68% 70% 2696 1830 2811 1965
50%
48%
56%
52%
52%
68%
69%
68%
63%
62%
70%
68%
66% 72%
72%
70%
0%
10%
20%
30%
40%
50%
60%
70%
80%
90%
100%
1st 2nd 3rd 4th 5th 6th 7th 8th
Pe
rce
nt
in H
FZ
Grade
Female Male

2010 NC IsPOD Evaluation Conducte4d by NCAAHPERD/NC DPH
All rights reserved.
12
PUSH-UP
New Hanover County
Spring 2010 Percent in Healthy Fitness Zone (HFZ)
FitnessGram Results for 0 K-8 Schools in New Hanover County
Grade
Percent in HFZ Counts in HFZ
Female Male
Female Male
Total FG Results
N in HFZ Total FG Results
N in HFZ
1st NA NA 0 0 0 0
2nd NA NA 0 0 0 0
3rd NA NA 0 0 0 0
4th NA NA 0 0 0 0
5th NA NA 0 0 0 0
6th NA NA 0 0 0 0
7th NA NA 0 0 0 0
8th NA NA 0 0 0 0
2010 NC IsPOD Evaluation Conducted by NCAAHPERD/NC DPH
All rights reserved.
13
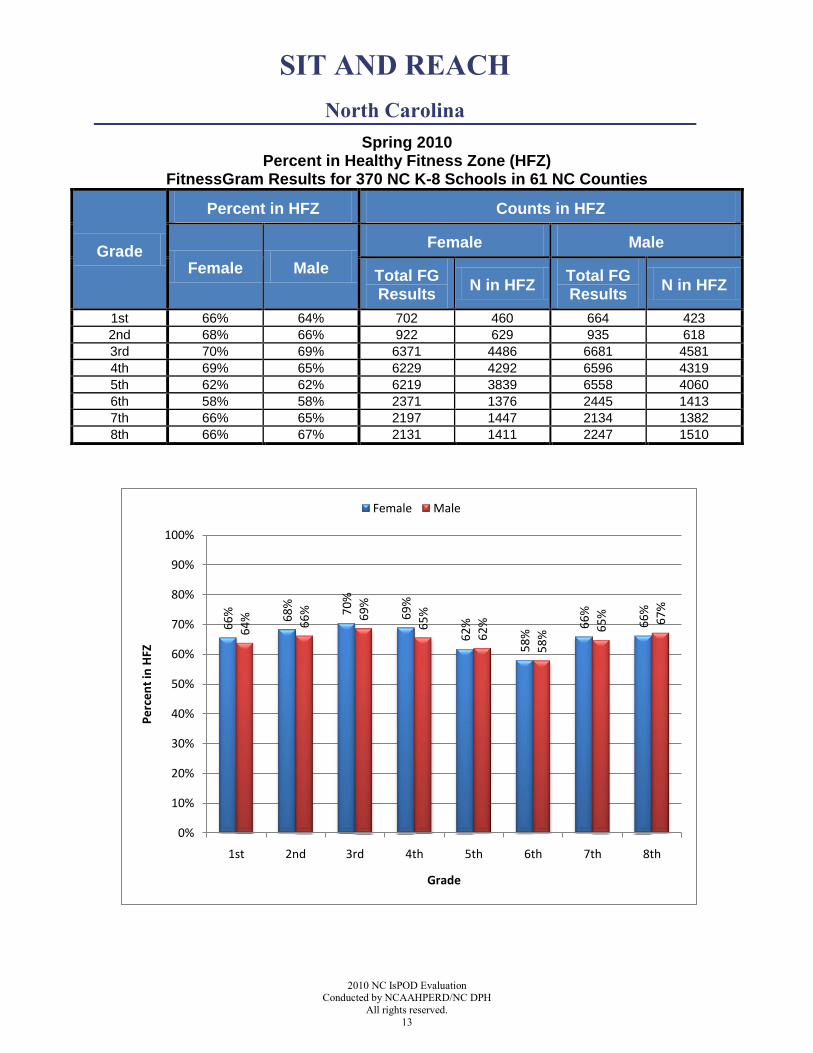
SIT AND REACH
North Carolina
Spring 2010 Percent in Healthy Fitness Zone (HFZ)
FitnessGram Results for 370 NC K-8 Schools in 61 NC Counties
Grade
Percent in HFZ Counts in HFZ
Female Male
Female Male
Total FG Results
N in HFZ Total FG Results
N in HFZ
1st 66% 64% 702 460 664 423
2nd 68% 66% 922 629 935 618
3rd 70% 69% 6371 4486 6681 4581
4th 69% 65% 6229 4292 6596 4319
5th 62% 62% 6219 3839 6558 4060
6th 58% 58% 2371 1376 2445 1413
7th 66% 65% 2197 1447 2134 1382
8th 66% 67% 2131 1411 2247 1510
66% 68%
70%
69%
62%
58%
66%
66%
64% 66% 69%
65%
62%
58%
65% 67%
0%
10%
20%
30%
40%
50%
60%
70%
80%
90%
100%
1st 2nd 3rd 4th 5th 6th 7th 8th
Pe
rce
nt
in H
FZ
Grade
Female Male

2010 NC IsPOD Evaluation Conducte4d by NCAAHPERD/NC DPH
All rights reserved.
14
SIT AND REACH
New Hanover County
Spring 2010 Percent in Healthy Fitness Zone (HFZ)
FitnessGram Results for 0 K-8 Schools in New Hanover County
Grade
Percent in HFZ Counts in HFZ
Female Male
Female Male
Total FG Results
N in HFZ Total FG Results
N in HFZ
1st NA NA 0 0 0 0
2nd NA NA 0 0 0 0
3rd NA NA 0 0 0 0
4th NA NA 0 0 0 0
5th NA NA 0 0 0 0
6th NA NA 0 0 0 0
7th NA NA 0 0 0 0
8th NA NA 0 0 0 0

2010 NC IsPOD Evaluation Conducted by NCAAHPERD/NC DPH
All rights reserved.
15
TRUNK LIFT
North Carolina
Spring 2010 Percent in Healthy Fitness Zone (HFZ)
FitnessGram Results for 370 NC K-8 Schools in 61 NC Counties
Grade
Percent in HFZ Counts in HFZ
Female Male
Female Male
Total FG Results
N in HFZ Total FG Results
N in HFZ
1st 91% 88% 744 680 746 659
2nd 91% 92% 1063 963 1056 971
3rd 93% 91% 10281 9572 10608 9648
4th 84% 80% 10205 8587 10688 8573
5th 81% 77% 9821 7973 10336 8001
6th 83% 79% 3438 2859 3361 2646
7th 82% 77% 3231 2656 3086 2364
8th 84% 79% 3136 2631 3161 2492
91%
91% 93%
84%
81%
83%
82%
84%88% 92%
91%
80%
77%
79%
77%
79%
0%
10%
20%
30%
40%
50%
60%
70%
80%
90%
100%
1st 2nd 3rd 4th 5th 6th 7th 8th
Pe
rce
nt
in H
FZ
Grade
Female Male

2010 NC IsPOD Evaluation Conducte4d by NCAAHPERD/NC DPH
All rights reserved.
16
TRUNK LIFT
New Hanover County
Spring 2010 Percent in Healthy Fitness Zone (HFZ)
FitnessGram Results for 0 K-8 School in New Hanover County
Grade
Percent in HFZ Counts in HFZ
Female Male
Female Male
Total FG Results
N in HFZ Total FG Results
N in HFZ
1st NA NA 0 0 0 0
2nd NA NA 0 0 0 0
3rd NA NA 0 0 0 0
4th NA NA 0 0 0 0
5th NA NA 0 0 0 0
6th NA NA 0 0 0 0
7th NA NA 0 0 0 0
8th NA NA 0 0 0 0
Related Documents