Isotopic characteristics of Indian precipitation Bhishm Kumar, 1 S. P. Rai, 1 U. Saravana Kumar, 2 S. K. Verma, 1 Pankaj Garg, 1 S. V. Vijaya Kumar, 1 Rahul Jaiswal, 1 B. K. Purendra, 1 S. R. Kumar, 1 and N. G. Pande 1 Received 19 August 2009; revised 22 June 2010; accepted 6 August 2010; published 22 December 2010. [1] Hydrogen ( 2 H/ 1 H) and oxygen ( 18 O/ 16 O) isotopic ratios were measured in precipitation (900 samples) collected from several locations in India during the period 2003–2006 (12 locations in 2003 and 18 locations in 2004–2006). The amount of rainfall along with air temperature and humidity were also measured. The meteoric water line developed for India using isotopic data of precipitation samples, namely, d 2 H = 7.93 (±0.06) × d 18 O + 9.94(±0.51) (n = 272, r 2 = 0.98), differs slightly from the global meteoric water line. Regional meteoric water lines were developed for several Indian regions (i.e., northern and southern regions of India, western Himalayas) and found to be different from each other (southern Indian meteoric water line, slope is 7.82, intercept or D excess is 10.23; northern Indian meteoric water line, slope is 8.15, intercept is 9.55) which is attributed to differences in their geographic and meteorological conditions and their associated atmospheric processes (i.e., ambient temperature, humidity, organ, and source of vapor masses). The local meteoric water lines developed for a number of locations show wide variations in the slope and intercept. These variations are due to different vapor sources such as the northeast (NE) monsoon that originates in the Bay of Bengal; the southwest monsoon (SW) that originates in the Arabian Sea; a mixture of NE and SW monsoons; retreat of NE and SW monsoons and western disturbances that originate in the Mediterranean Sea. The altitude effect in the isotopic composition of precipitation estimated for western Himalayan region also varies from month to month. Citation: Kumar, B., S. P. Rai, U. Saravana Kumar, S. K. Verma, P. Garg, S. V. Vijaya Kumar, R. Jaiswal, B. K. Purendra, S. R. Kumar, and N. G. Pande (2010), Isotopic characteristics of Indian precipitation, Water Resour. Res., 46, W12548, doi:10.1029/2009WR008532. 1. Introduction [2] The stable isotopes of hydrogen and oxygen can be used to characterize the precipitation and other sources of water in a region or area. Globally, the stable isotopic compositions of precipitation have been explained in the form of a global meteoric waterline (GMWL) by Craig [1961]. The GMWL represents the variation of d 2 H with respect to d 18 O in precipitation and can be used to identify the source of water, mixing, and other hydrological pro- cesses. The meteoric waterline is represented in its gener- alized form as d 2 H= A × d 18 O+ d, where A represents the slope and d represents the intercept or D excess ( 2 H excess). The International Atomic Energy Agency (IAEA) of Vienna, Austria, in collaboration with the World Meteorological Organization (WMO), established the Global Network of Isotopes in Precipitation (GNIP) under which water samples are collected to monitor the isotopic composition (d 2 H, d 18 O) of precipitation. The data produced from this network form an important asset to isotope hydrology. (These are available at http://isohis.iaea.org.) The regression line for the long‐term average of d 2 H and d 18 O[Rozanski et al., 1993] data mea- sured for precipitation at 219 stations under WMO‐IAEA network adds some precision to the Craig line: 2 H ¼ 8:17 0:07 ð Þ 18 O þ 11:27 0:65 ð Þ; ð1Þ where Vienna standard mean ocean water (VSMOW) was used as the standard for the isotopic measurements. Kumar et al. [1982] found the regional meteoric waterline for lower Maner Basin in the state of Andhra Pradesh in southern India, as 2 H ¼ 7:6 0:4 ð Þ 18 O þ 6:3 2:7 ð Þðn ¼ 26Þ: ð2Þ [3] Datta et al. [1991] established similar LMWL for Delhi using the annual weighted mean values for the period 1961–1982 which is similar to that of Das et al. [1988] reported for the period 1961–1978. 2 H ¼ 8:39 18 O þ 11:41 ðr 2 ¼ 0:95 : ð3Þ [4] Datta et al. [1991] also established LMWL for Delhi using the monthly (equation (4)) and composite weighted mean monthly (equation (5)) isotopic data of monsoon 1 Hydrological Investigations Division, National Institute of Hydrology, Roorkee, India. 2 Isotope Hydrology Section, Isotope Applications Division, Bhabha Atomic Research Centre, Mumbai, India. Copyright 2010 by the American Geophysical Union. 0043‐1397/10/2009WR008532 WATER RESOURCES RESEARCH, VOL. 46, W12548, doi:10.1029/2009WR008532, 2010 W12548 1 of 15

Welcome message from author
This document is posted to help you gain knowledge. Please leave a comment to let me know what you think about it! Share it to your friends and learn new things together.
Transcript
Isotopic characteristics of Indian precipitation
Bhishm Kumar,1 S. P. Rai,1 U. Saravana Kumar,2 S. K. Verma,1 Pankaj Garg,1
S. V. Vijaya Kumar,1 Rahul Jaiswal,1 B. K. Purendra,1 S. R. Kumar,1 and N. G. Pande1
Received 19 August 2009; revised 22 June 2010; accepted 6 August 2010; published 22 December 2010.
[1] Hydrogen (2H/1H) and oxygen (18O/16O) isotopic ratios were measured inprecipitation (900 samples) collected from several locations in India during the period2003–2006 (12 locations in 2003 and 18 locations in 2004–2006). The amount of rainfallalong with air temperature and humidity were also measured. The meteoric water linedeveloped for India using isotopic data of precipitation samples, namely, d2H = 7.93(±0.06) × d18O + 9.94(±0.51) (n = 272, r2 = 0.98), differs slightly from the global meteoricwater line. Regional meteoric water lines were developed for several Indian regions (i.e.,northern and southern regions of India, western Himalayas) and found to be different fromeach other (southern Indian meteoric water line, slope is 7.82, intercept or D excess is10.23; northern Indian meteoric water line, slope is 8.15, intercept is 9.55) which isattributed to differences in their geographic and meteorological conditions and theirassociated atmospheric processes (i.e., ambient temperature, humidity, organ, and sourceof vapor masses). The local meteoric water lines developed for a number of locations showwide variations in the slope and intercept. These variations are due to different vaporsources such as the northeast (NE) monsoon that originates in the Bay of Bengal; thesouthwest monsoon (SW) that originates in the Arabian Sea; a mixture of NE and SWmonsoons; retreat of NE and SW monsoons and western disturbances that originate in theMediterranean Sea. The altitude effect in the isotopic composition of precipitationestimated for western Himalayan region also varies from month to month.
Citation: Kumar, B., S. P. Rai, U. Saravana Kumar, S. K. Verma, P. Garg, S. V. Vijaya Kumar, R. Jaiswal, B. K. Purendra,S. R. Kumar, and N. G. Pande (2010), Isotopic characteristics of Indian precipitation, Water Resour. Res., 46, W12548,doi:10.1029/2009WR008532.
1. Introduction
[2] The stable isotopes of hydrogen and oxygen can beused to characterize the precipitation and other sources ofwater in a region or area. Globally, the stable isotopiccompositions of precipitation have been explained in theform of a global meteoric waterline (GMWL) by Craig[1961]. The GMWL represents the variation of d2H withrespect to d18O in precipitation and can be used to identifythe source of water, mixing, and other hydrological pro-cesses. The meteoric waterline is represented in its gener-alized form as d2H = A × d18O + d, where A represents theslope and d represents the intercept or D excess (2H excess).The International Atomic Energy Agency (IAEA) of Vienna,Austria, in collaboration with the World MeteorologicalOrganization (WMO), established the Global Network ofIsotopes in Precipitation (GNIP) under which water samplesare collected to monitor the isotopic composition (d2H, d18O)of precipitation. The data produced from this network form an
important asset to isotope hydrology. (These are available athttp://isohis.iaea.org.) The regression line for the long‐termaverage of d2H and d18O [Rozanski et al., 1993] data mea-sured for precipitation at 219 stations under WMO‐IAEAnetwork adds some precision to the Craig line:
�2H ¼ 8:17 �0:07ð Þ � �18Oþ 11:27 �0:65ð Þ; ð1Þ
where Vienna standard mean ocean water (VSMOW) wasused as the standard for the isotopic measurements. Kumaret al. [1982] found the regional meteoric waterline for lowerManer Basin in the state of Andhra Pradesh in southern India,as
�2H ¼ 7:6 �0:4ð Þ � �18Oþ 6:3 �2:7ð Þ ðn ¼ 26Þ: ð2Þ
[3] Datta et al. [1991] established similar LMWL forDelhi using the annual weighted mean values for the period1961–1982 which is similar to that of Das et al. [1988]reported for the period 1961–1978.
�2H ¼ 8:39� �18Oþ 11:41 ðr2 ¼ 0:95�: ð3Þ
[4] Datta et al. [1991] also established LMWL for Delhiusing the monthly (equation (4)) and composite weightedmean monthly (equation (5)) isotopic data of monsoon
1Hydrological Investigations Division, National Institute of Hydrology,Roorkee, India.
2Isotope Hydrology Section, Isotope Applications Division, BhabhaAtomic Research Centre, Mumbai, India.
Copyright 2010 by the American Geophysical Union.0043‐1397/10/2009WR008532
WATER RESOURCES RESEARCH, VOL. 46, W12548, doi:10.1029/2009WR008532, 2010
W12548 1 of 15
months for rainfall less than 30 mm for the period from1961 to 1978.
�2H ¼ 6:88� �18Oþ 1:61 ðr2 ¼ 0:90� ð4Þ
�2H ¼ 6:82� �18Oþ 0:68 ðr2 ¼ 0:83� ð5Þ
Mukherjee and Chandrasekharan [1993] reported LMWLfor Delhi (equation (6)) and Mumbai (equation (7)) usingmonthly isotopic composition of precipitation for the period1961–1966 and 1973–1977 as given below
�2H ¼ 6:80� �18Oþ 1:25 ðn ¼ 44; r2 ¼ 0:96� ð6Þ
�2H ¼ 8:16� �18Oþ 8:84 ðn ¼ 43; r2 ¼ 0:81�: ð7Þ
The authors attribute the differences in slope and interceptbetween the two stations (Delhi, Mumbai) to higher evapora-tion in Delhi which probably is corroborated by equation (5).[5] There are different types of effects like continental,
altitude, seasonal, and amount effect which the isotopiccomposition may vary from place to place and at differenttimes. But these effects once established for a region maynot change much (except amount effect) unless climatic andhydrological regimes change considerably. In order to under-stand the isotopic characterization of precipitation, many otherinvestigators like Dansgaard [1964]; Yurtsever [1975]; Gat[1980]; Gat and Gonfiantini [1981]; Kumar et al. [1982];Rozanski [1985]; Fritz et al. [1987]; Nativ and Riggio [1989];Gedzelman and Lawrence [1990]; Krishnamurthy andBhattacharya [1991]; Rozanski et al. [1991, 1993]; Friedmanet al. [1992]; Simpkins [1995]; Takle [1994]; Amundsonet al. [1996]; Gat [1996]; Araguás‐Araguás et al. [1998];Bhattacharya et al. [2003]; Deshpande et al. [2003]; IAEA/WMO (Global Network of Isotopes in Precipitation Database,http://isohis.iaea.org, 2003); and Saravana Kumar et al.[2008, 2009] have studied d2H and d18O variations in pre-cipitation and also developed meteoric waterlines in manycases for different parts of the world.[6] Reasonably long data series of isotopes in precipi-
tation exist only for one Indian station, namely, New Delhi.Other Indian stations (Bombay, Kozikhode, Shillong, Hyder-abad) have only records for short periods. Therefore, 2 to3 years of isotopic data have been used in this study tounderstand the isotopic characteristics of precipitation indifferent parts of India by establishing meteoric waterlines.
2. Sources of Precipitation
[7] The two principal sources of oceanic vapor to theIndian subcontinent are the Arabian Sea (AS) and the Bay ofBengal (BOB). During the SW monsoon (June–September),the west coast of India receives vapor from the Arabian Sea(AS) and is orographically uplifted by the Western Ghats.This section of the Indian SW monsoon is called the ASbranch of the monsoon. Because of “rainout,” the vaporcontent of the AS Branch of monsoon is considerablyreduced by the time they reach the middle of the PeninsularIndia [Rajan, 1988] and cross over the east coast of India. Inthe BOB, the monsoon current then takes a southeasterlyturn entering the Indo‐Gangetic plains after replenishingvapor from the BOB. This section of the Indian SW mon-soon is called the BOB branch [Das, 2005] and givesrainfall to the northeastern region of India [Rao, 1976].
However, certain regions in the northern part of Indiansubcontinent receive vapor both from AS and BOB andcontribute to rainfall during SW summer monsoon.[8] In addition, the western disturbances that originate in
the Mediterranean Sea are responsible for rainfall in manyparts of the country during the winter season. These differentsources of precipitation have different isotopic compositionof precipitation, e.g., the surface waters of Arabian Sea andBay of Bengal are reported to have mean d18O values of +0.6‰ and −0.5 ‰, respectively [Delaygue et al., 2001]. Also,because of a large influx of monsoon runoff from Himalayanrivers, seasonal changes in the isotopic composition of BOBsurface water is expected similar to large seasonal surfacewater salinity changes. This seasonal change in the isotopiccomposition of surface waters of BOB is expected to lead todifferent imprinting of the seasonal vapor influx which in turnwill transfer to all other components, namely, rainfall, streamflow, soil moisture, and surface and groundwater reservoirs.
3. Experiment
3.1. Sampling Procedure
[9] The precipitation sampling was initiated in the year2003. Precipitation samples, daily during the monsoon andmonthly integrated during the other months, were collectedfrom 12 selected locations distributed in different parts ofthe country using standard procedures [Clark and Fritz,1997]. The sample collection sites (Figure 1) were increasedto 18 in the year 2004–2005 and the western Himalayan regionwas also included. About 900 precipitation samples werecollected during the study. The samples were stored at 10°Cin double‐capped plastic bottles to avoid evaporation prior toisotopic analysis. The physicochemical parameters of samples(temperature, electrical conductivity, pH, etc.) were measuredon site. The rainfall amount along with air temperature andhumidity were also measured.
3.2. Isotopic Analyses
[10] The isotopic analyses (d2H, d18O) of about 90% ofthe water samples were carried out at the Nuclear HydrologyLaboratory of the National Institute of Hydrology (NIH),Roorkee, using Dual Inlet Isotope Ratio Mass Spectrometer(DIIRMS), mostly for d2H measurements, and ContinuousFlow Isotope Ratio Mass Spectrometer (CFIRMS), mostlyfor d18Omeasurements, installed during the year 2004, and theremaining samples were measured at the Isotope HydrologyLaboratory of IAEA, Vienna. The d2H and d18O were mea-sured by Pt–H2 and CO2 equilibration methods, respectively,following the standard procedure [Epstein and Mayeda,1953; Brenninkmeijer and Morrison, 1987]. To determined2H and d18O, a three‐point calibration equation was usedwith the isotopic water standards VSMOW, GISP, and stan-dard light arctic precipitation obtained from the IAEA (pre-cision is ±1.0‰ and ±0.1‰ for d2H and d18O, respectively).Due care was taken for having isotopic analytical results ofwater samples analyzed with CFIRMS and DIIRMS com-parable using the measured values of d18O secondary stan-dards with DIIRMS.
4. Results and Discussion
[11] The data of d2H and d18O for all precipitation samplescollected from different locations are given in Table 1 while
KUMAR ET AL.: ISOTOPIC CHARACTERISTICS OF INDIAN PRECIPITATION W12548W12548
2 of 15
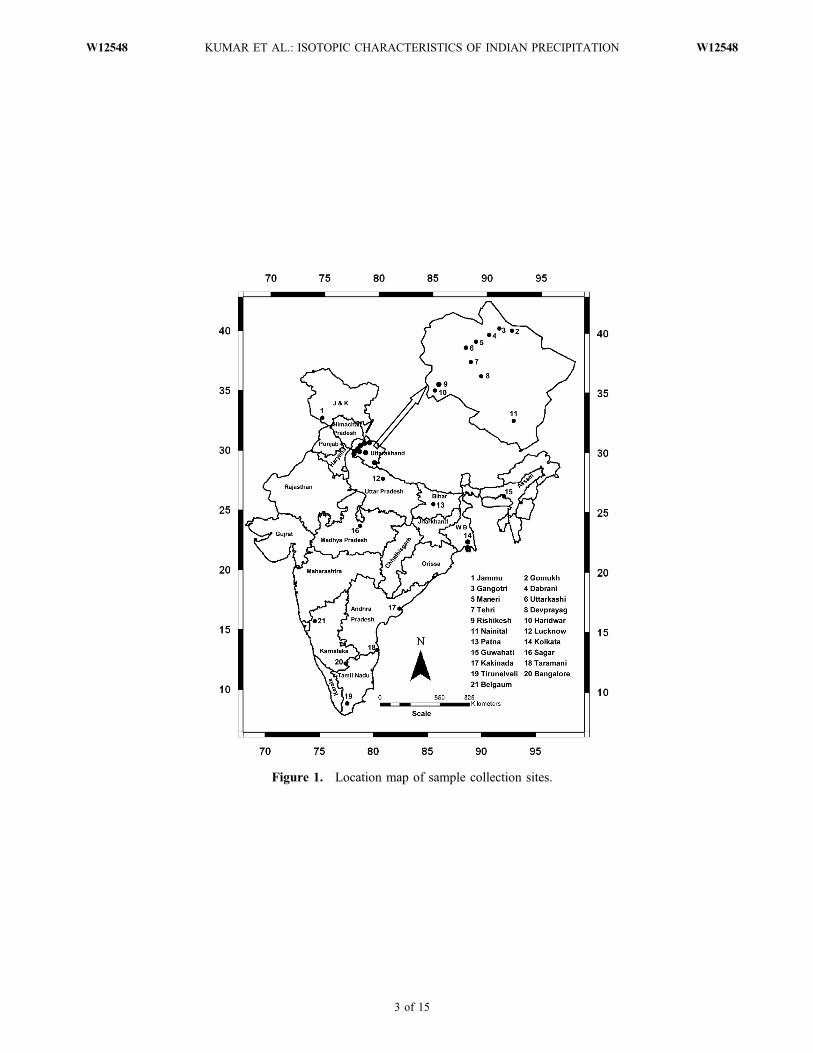
Figure 1. Location map of sample collection sites.
KUMAR ET AL.: ISOTOPIC CHARACTERISTICS OF INDIAN PRECIPITATION W12548W12548
3 of 15
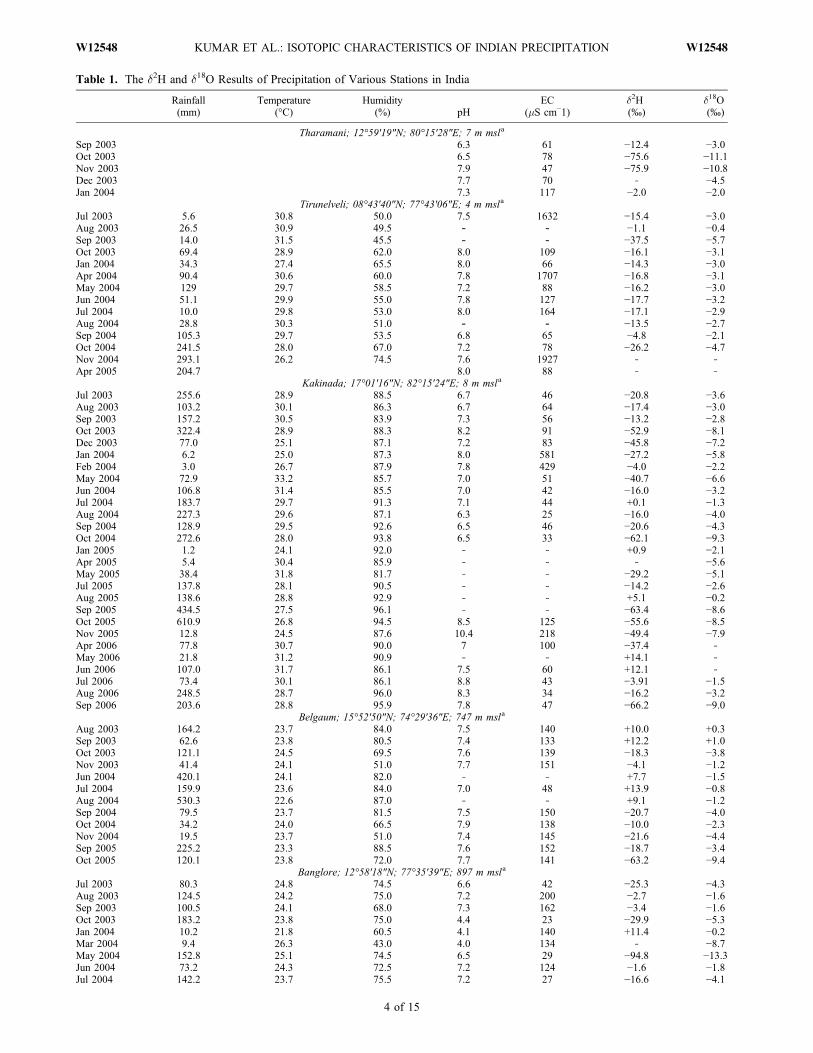
Table 1. The d2H and d18O Results of Precipitation of Various Stations in India
Rainfall(mm)
Temperature(°C)
Humidity(%) pH
EC(mS cm−1)
d2H(‰)
d18O(‰)
Tharamani; 12°59′19″N; 80°15′28″E; 7 m msla
Sep 2003 6.3 61 −12.4 −3.0Oct 2003 6.5 78 −75.6 −11.1Nov 2003 7.9 47 −75.9 −10.8Dec 2003 7.7 70 ‐ −4.5Jan 2004 7.3 117 −2.0 −2.0
Tirunelveli; 08°43′40″N; 77°43′06″E; 4 m msla
Jul 2003 5.6 30.8 50.0 7.5 1632 −15.4 −3.0Aug 2003 26.5 30.9 49.5 ‐ ‐ −1.1 −0.4Sep 2003 14.0 31.5 45.5 ‐ ‐ −37.5 −5.7Oct 2003 69.4 28.9 62.0 8.0 109 −16.1 −3.1Jan 2004 34.3 27.4 65.5 8.0 66 −14.3 −3.0Apr 2004 90.4 30.6 60.0 7.8 1707 −16.8 −3.1May 2004 129 29.7 58.5 7.2 88 −16.2 −3.0Jun 2004 51.1 29.9 55.0 7.8 127 −17.7 −3.2Jul 2004 10.0 29.8 53.0 8.0 164 −17.1 −2.9Aug 2004 28.8 30.3 51.0 ‐ ‐ −13.5 −2.7Sep 2004 105.3 29.7 53.5 6.8 65 −4.8 −2.1Oct 2004 241.5 28.0 67.0 7.2 78 −26.2 −4.7Nov 2004 293.1 26.2 74.5 7.6 1927 ‐ ‐Apr 2005 204.7 8.0 88 ‐ ‐
Kakinada; 17°01′16″N; 82°15′24″E; 8 m msla
Jul 2003 255.6 28.9 88.5 6.7 46 −20.8 −3.6Aug 2003 103.2 30.1 86.3 6.7 64 −17.4 −3.0Sep 2003 157.2 30.5 83.9 7.3 56 −13.2 −2.8Oct 2003 322.4 28.9 88.3 8.2 91 −52.9 −8.1Dec 2003 77.0 25.1 87.1 7.2 83 −45.8 −7.2Jan 2004 6.2 25.0 87.3 8.0 581 −27.2 −5.8Feb 2004 3.0 26.7 87.9 7.8 429 −4.0 −2.2May 2004 72.9 33.2 85.7 7.0 51 −40.7 −6.6Jun 2004 106.8 31.4 85.5 7.0 42 −16.0 −3.2Jul 2004 183.7 29.7 91.3 7.1 44 +0.1 −1.3Aug 2004 227.3 29.6 87.1 6.3 25 −16.0 −4.0Sep 2004 128.9 29.5 92.6 6.5 46 −20.6 −4.3Oct 2004 272.6 28.0 93.8 6.5 33 −62.1 −9.3Jan 2005 1.2 24.1 92.0 ‐ ‐ +0.9 −2.1Apr 2005 5.4 30.4 85.9 ‐ ‐ ‐ −5.6May 2005 38.4 31.8 81.7 ‐ ‐ −29.2 −5.1Jul 2005 137.8 28.1 90.5 ‐ ‐ −14.2 −2.6Aug 2005 138.6 28.8 92.9 ‐ ‐ +5.1 −0.2Sep 2005 434.5 27.5 96.1 ‐ ‐ −63.4 −8.6Oct 2005 610.9 26.8 94.5 8.5 125 −55.6 −8.5Nov 2005 12.8 24.5 87.6 10.4 218 −49.4 −7.9Apr 2006 77.8 30.7 90.0 7 100 −37.4 ‐May 2006 21.8 31.2 90.9 ‐ ‐ +14.1 ‐Jun 2006 107.0 31.7 86.1 7.5 60 +12.1 ‐Jul 2006 73.4 30.1 86.1 8.8 43 −3.91 −1.5Aug 2006 248.5 28.7 96.0 8.3 34 −16.2 −3.2Sep 2006 203.6 28.8 95.9 7.8 47 −66.2 −9.0
Belgaum; 15°52′50″N; 74°29′36″E; 747 m msla
Aug 2003 164.2 23.7 84.0 7.5 140 +10.0 +0.3Sep 2003 62.6 23.8 80.5 7.4 133 +12.2 +1.0Oct 2003 121.1 24.5 69.5 7.6 139 −18.3 −3.8Nov 2003 41.4 24.1 51.0 7.7 151 −4.1 −1.2Jun 2004 420.1 24.1 82.0 ‐ ‐ +7.7 −1.5Jul 2004 159.9 23.6 84.0 7.0 48 +13.9 −0.8Aug 2004 530.3 22.6 87.0 ‐ ‐ +9.1 −1.2Sep 2004 79.5 23.7 81.5 7.5 150 −20.7 −4.0Oct 2004 34.2 24.0 66.5 7.9 138 −10.0 −2.3Nov 2004 19.5 23.7 51.0 7.4 145 −21.6 −4.4Sep 2005 225.2 23.3 88.5 7.6 152 −18.7 −3.4Oct 2005 120.1 23.8 72.0 7.7 141 −63.2 −9.4
Banglore; 12°58′18″N; 77°35′39″E; 897 m msla
Jul 2003 80.3 24.8 74.5 6.6 42 −25.3 −4.3Aug 2003 124.5 24.2 75.0 7.2 200 −2.7 −1.6Sep 2003 100.5 24.1 68.0 7.3 162 −3.4 −1.6Oct 2003 183.2 23.8 75.0 4.4 23 −29.9 −5.3Jan 2004 10.2 21.8 60.5 4.1 140 +11.4 −0.2Mar 2004 9.4 26.3 43.0 4.0 134 ‐ −8.7May 2004 152.8 25.1 74.5 6.5 29 −94.8 −13.3Jun 2004 73.2 24.3 72.5 7.2 124 −1.6 −1.8Jul 2004 142.2 23.7 75.5 7.2 27 −16.6 −4.1
KUMAR ET AL.: ISOTOPIC CHARACTERISTICS OF INDIAN PRECIPITATION W12548W12548
4 of 15
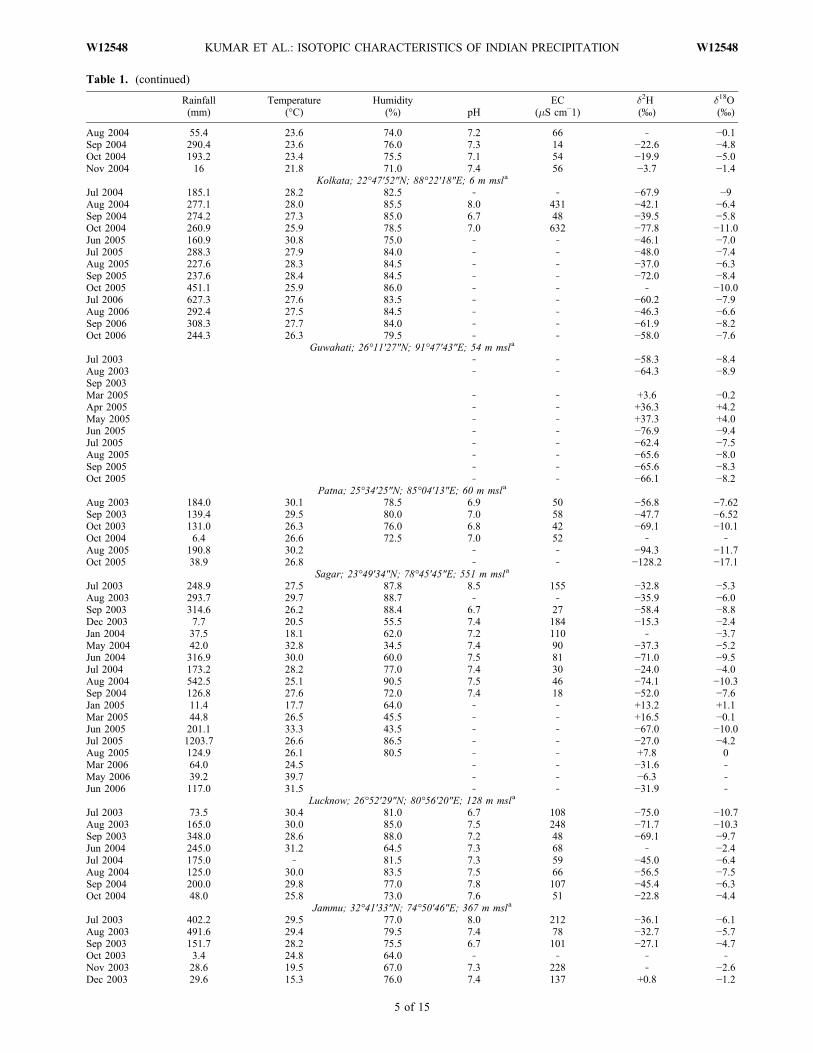
Table 1. (continued)
Rainfall(mm)
Temperature(°C)
Humidity(%) pH
EC(mS cm−1)
d2H(‰)
d18O(‰)
Aug 2004 55.4 23.6 74.0 7.2 66 ‐ −0.1Sep 2004 290.4 23.6 76.0 7.3 14 −22.6 −4.8Oct 2004 193.2 23.4 75.5 7.1 54 −19.9 −5.0Nov 2004 16 21.8 71.0 7.4 56 −3.7 −1.4
Kolkata; 22°47′52″N; 88°22′18″E; 6 m msla
Jul 2004 185.1 28.2 82.5 ‐ ‐ −67.9 −9Aug 2004 277.1 28.0 85.5 8.0 431 −42.1 −6.4Sep 2004 274.2 27.3 85.0 6.7 48 −39.5 −5.8Oct 2004 260.9 25.9 78.5 7.0 632 −77.8 −11.0Jun 2005 160.9 30.8 75.0 ‐ ‐ −46.1 −7.0Jul 2005 288.3 27.9 84.0 ‐ ‐ −48.0 −7.4Aug 2005 227.6 28.3 84.5 ‐ ‐ −37.0 −6.3Sep 2005 237.6 28.4 84.5 ‐ ‐ −72.0 −8.4Oct 2005 451.1 25.9 86.0 ‐ ‐ ‐ −10.0Jul 2006 627.3 27.6 83.5 ‐ ‐ −60.2 −7.9Aug 2006 292.4 27.5 84.5 ‐ ‐ −46.3 −6.6Sep 2006 308.3 27.7 84.0 ‐ ‐ −61.9 −8.2Oct 2006 244.3 26.3 79.5 ‐ ‐ −58.0 −7.6
Guwahati; 26°11′27″N; 91°47′43″E; 54 m msla
Jul 2003 ‐ ‐ −58.3 −8.4Aug 2003 ‐ ‐ −64.3 −8.9Sep 2003Mar 2005 ‐ ‐ +3.6 −0.2Apr 2005 ‐ ‐ +36.3 +4.2May 2005 ‐ ‐ +37.3 +4.0Jun 2005 ‐ ‐ −76.9 −9.4Jul 2005 ‐ ‐ −62.4 −7.5Aug 2005 ‐ ‐ −65.6 −8.0Sep 2005 ‐ ‐ −65.6 −8.3Oct 2005 ‐ ‐ −66.1 −8.2
Patna; 25°34′25″N; 85°04′13″E; 60 m msla
Aug 2003 184.0 30.1 78.5 6.9 50 −56.8 −7.62Sep 2003 139.4 29.5 80.0 7.0 58 −47.7 −6.52Oct 2003 131.0 26.3 76.0 6.8 42 −69.1 −10.1Oct 2004 6.4 26.6 72.5 7.0 52 ‐ ‐Aug 2005 190.8 30.2 ‐ ‐ −94.3 −11.7Oct 2005 38.9 26.8 ‐ ‐ −128.2 −17.1
Sagar; 23°49′34″N; 78°45′45″E; 551 m msla
Jul 2003 248.9 27.5 87.8 8.5 155 −32.8 −5.3Aug 2003 293.7 29.7 88.7 ‐ ‐ −35.9 −6.0Sep 2003 314.6 26.2 88.4 6.7 27 −58.4 −8.8Dec 2003 7.7 20.5 55.5 7.4 184 −15.3 −2.4Jan 2004 37.5 18.1 62.0 7.2 110 ‐ −3.7May 2004 42.0 32.8 34.5 7.4 90 −37.3 −5.2Jun 2004 316.9 30.0 60.0 7.5 81 −71.0 −9.5Jul 2004 173.2 28.2 77.0 7.4 30 −24.0 −4.0Aug 2004 542.5 25.1 90.5 7.5 46 −74.1 −10.3Sep 2004 126.8 27.6 72.0 7.4 18 −52.0 −7.6Jan 2005 11.4 17.7 64.0 ‐ ‐ +13.2 +1.1Mar 2005 44.8 26.5 45.5 ‐ ‐ +16.5 −0.1Jun 2005 201.1 33.3 43.5 ‐ ‐ −67.0 −10.0Jul 2005 1203.7 26.6 86.5 ‐ ‐ −27.0 −4.2Aug 2005 124.9 26.1 80.5 ‐ ‐ +7.8 0Mar 2006 64.0 24.5 ‐ ‐ −31.6 ‐May 2006 39.2 39.7 ‐ ‐ −6.3 ‐Jun 2006 117.0 31.5 ‐ ‐ −31.9 ‐
Lucknow; 26°52′29″N; 80°56′20″E; 128 m msla
Jul 2003 73.5 30.4 81.0 6.7 108 −75.0 −10.7Aug 2003 165.0 30.0 85.0 7.5 248 −71.7 −10.3Sep 2003 348.0 28.6 88.0 7.2 48 −69.1 −9.7Jun 2004 245.0 31.2 64.5 7.3 68 ‐ −2.4Jul 2004 175.0 ‐ 81.5 7.3 59 −45.0 −6.4Aug 2004 125.0 30.0 83.5 7.5 66 −56.5 −7.5Sep 2004 200.0 29.8 77.0 7.8 107 −45.4 −6.3Oct 2004 48.0 25.8 73.0 7.6 51 −22.8 −4.4
Jammu; 32°41′33″N; 74°50′46″E; 367 m msla
Jul 2003 402.2 29.5 77.0 8.0 212 −36.1 −6.1Aug 2003 491.6 29.4 79.5 7.4 78 −32.7 −5.7Sep 2003 151.7 28.2 75.5 6.7 101 −27.1 −4.7Oct 2003 3.4 24.8 64.0 ‐ ‐ ‐ ‐Nov 2003 28.6 19.5 67.0 7.3 228 ‐ −2.6Dec 2003 29.6 15.3 76.0 7.4 137 +0.8 −1.2
KUMAR ET AL.: ISOTOPIC CHARACTERISTICS OF INDIAN PRECIPITATION W12548W12548
5 of 15
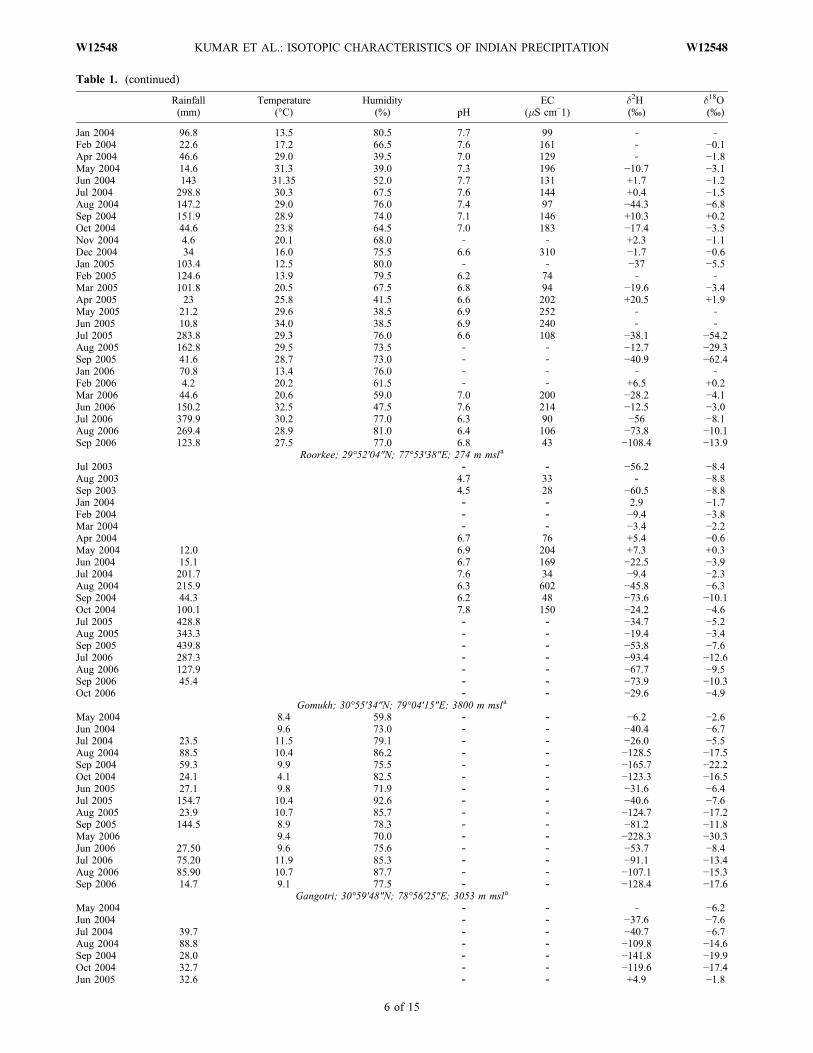
Table 1. (continued)
Rainfall(mm)
Temperature(°C)
Humidity(%) pH
EC(mS cm−1)
d2H(‰)
d18O(‰)
Jan 2004 96.8 13.5 80.5 7.7 99 ‐ ‐Feb 2004 22.6 17.2 66.5 7.6 161 ‐ −0.1Apr 2004 46.6 29.0 39.5 7.0 129 ‐ −1.8May 2004 14.6 31.3 39.0 7.3 196 −10.7 −3.1Jun 2004 143 31.35 52.0 7.7 131 +1.7 −1.2Jul 2004 298.8 30.3 67.5 7.6 144 +0.4 −1.5Aug 2004 147.2 29.0 76.0 7.4 97 −44.3 −6.8Sep 2004 151.9 28.9 74.0 7.1 146 +10.3 +0.2Oct 2004 44.6 23.8 64.5 7.0 183 −17.4 −3.5Nov 2004 4.6 20.1 68.0 ‐ ‐ +2.3 −1.1Dec 2004 34 16.0 75.5 6.6 310 −1.7 −0.6Jan 2005 103.4 12.5 80.0 ‐ ‐ −37 −5.5Feb 2005 124.6 13.9 79.5 6.2 74 ‐ ‐Mar 2005 101.8 20.5 67.5 6.8 94 −19.6 −3.4Apr 2005 23 25.8 41.5 6.6 202 +20.5 +1.9May 2005 21.2 29.6 38.5 6.9 252 ‐ ‐Jun 2005 10.8 34.0 38.5 6.9 240 ‐ ‐Jul 2005 283.8 29.3 76.0 6.6 108 −38.1 −54.2Aug 2005 162.8 29.5 73.5 ‐ ‐ −12.7 −29.3Sep 2005 41.6 28.7 73.0 ‐ ‐ −40.9 −62.4Jan 2006 70.8 13.4 76.0 ‐ ‐ ‐ ‐Feb 2006 4.2 20.2 61.5 ‐ ‐ +6.5 +0.2Mar 2006 44.6 20.6 59.0 7.0 200 −28.2 −4.1Jun 2006 150.2 32.5 47.5 7.6 214 −12.5 −3.0Jul 2006 379.9 30.2 77.0 6.3 90 −56 −8.1Aug 2006 269.4 28.9 81.0 6.4 106 −73.8 −10.1Sep 2006 123.8 27.5 77.0 6.8 43 −108.4 −13.9
Roorkee; 29°52′04″N; 77°53′38″E; 274 m msla
Jul 2003 ‐ ‐ −56.2 −8.4Aug 2003 4.7 33 ‐ −8.8Sep 2003 4.5 28 −60.5 −8.8Jan 2004 ‐ ‐ 2.9 −1.7Feb 2004 ‐ ‐ −9.4 −3.8Mar 2004 ‐ ‐ −3.4 −2.2Apr 2004 6.7 76 +5.4 −0.6May 2004 12.0 6.9 204 +7.3 +0.3Jun 2004 15.1 6.7 169 −22.5 −3.9Jul 2004 201.7 7.6 34 −9.4 −2.3Aug 2004 215.9 6.3 602 −45.8 −6.3Sep 2004 44.3 6.2 48 −73.6 −10.1Oct 2004 100.1 7.8 150 −24.2 −4.6Jul 2005 428.8 ‐ ‐ −34.7 −5.2Aug 2005 343.3 ‐ ‐ −19.4 −3.4Sep 2005 439.8 ‐ ‐ −53.8 −7.6Jul 2006 287.3 ‐ ‐ −93.4 −12.6Aug 2006 127.9 ‐ ‐ −67.7 −9.5Sep 2006 45.4 ‐ ‐ −73.9 −10.3Oct 2006 ‐ ‐ −29.6 −4.9
Gomukh; 30°55′34″N; 79°04′15″E; 3800 m msla
May 2004 8.4 59.8 ‐ ‐ −6.2 −2.6Jun 2004 9.6 73.0 ‐ ‐ −40.4 −6.7Jul 2004 23.5 11.5 79.1 ‐ ‐ −26.0 −5.5Aug 2004 88.5 10.4 86.2 ‐ ‐ −128.5 −17.5Sep 2004 59.3 9.9 75.5 ‐ ‐ −165.7 −22.2Oct 2004 24.1 4.1 82.5 ‐ ‐ −123.3 −16.5Jun 2005 27.1 9.8 71.9 ‐ ‐ −31.6 −6.4Jul 2005 154.7 10.4 92.6 ‐ ‐ −40.6 −7.6Aug 2005 23.9 10.7 85.7 ‐ ‐ −124.7 −17.2Sep 2005 144.5 8.9 78.3 ‐ ‐ −81.2 −11.8May 2006 9.4 70.0 ‐ ‐ −228.3 −30.3Jun 2006 27.50 9.6 75.6 ‐ ‐ −53.7 −8.4Jul 2006 75.20 11.9 85.3 ‐ ‐ −91.1 −13.4Aug 2006 85.90 10.7 87.7 ‐ ‐ −107.1 −15.3Sep 2006 14.7 9.1 77.5 ‐ ‐ −128.4 −17.6
Gangotri; 30°59′48″N; 78°56′25″E; 3053 m msla
May 2004 ‐ ‐ ‐ −6.2Jun 2004 ‐ ‐ −37.6 −7.6Jul 2004 39.7 ‐ ‐ −40.7 −6.7Aug 2004 88.8 ‐ ‐ −109.8 −14.6Sep 2004 28.0 ‐ ‐ −141.8 −19.9Oct 2004 32.7 ‐ ‐ −119.6 −17.4Jun 2005 32.6 ‐ ‐ +4.9 −1.8
KUMAR ET AL.: ISOTOPIC CHARACTERISTICS OF INDIAN PRECIPITATION W12548W12548
6 of 15
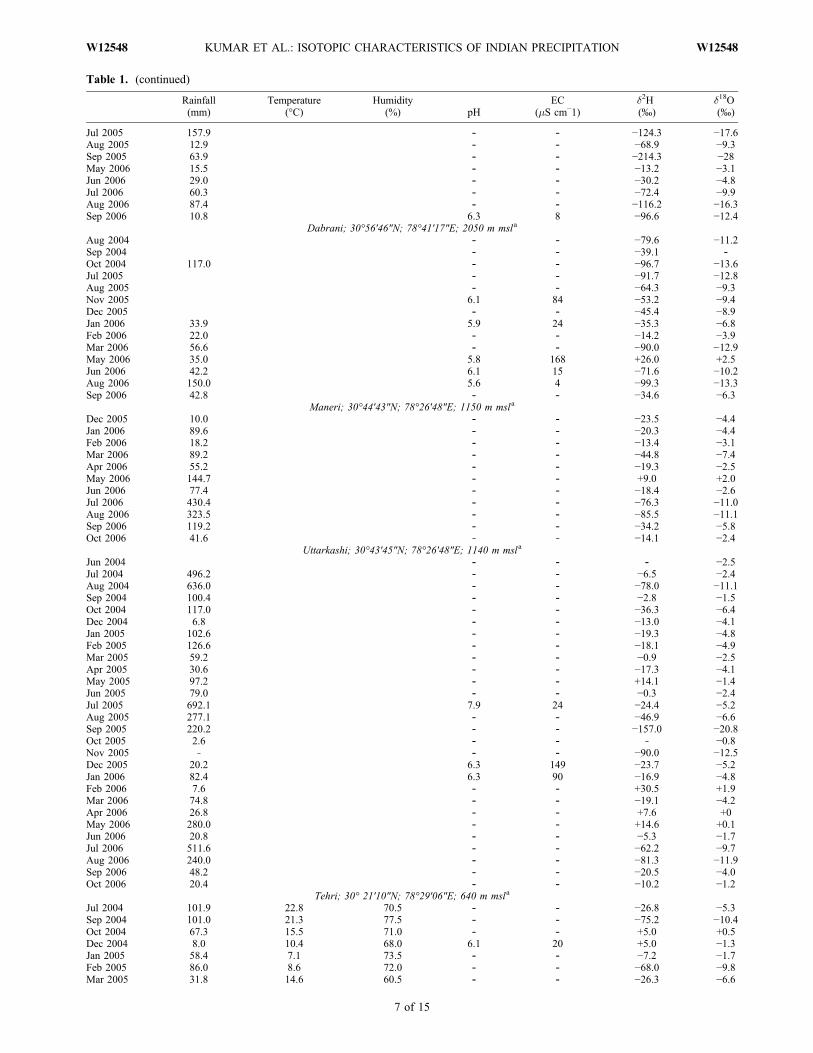
Table 1. (continued)
Rainfall(mm)
Temperature(°C)
Humidity(%) pH
EC(mS cm−1)
d2H(‰)
d18O(‰)
Jul 2005 157.9 ‐ ‐ −124.3 −17.6Aug 2005 12.9 ‐ ‐ −68.9 −9.3Sep 2005 63.9 ‐ ‐ −214.3 −28May 2006 15.5 ‐ ‐ −13.2 −3.1Jun 2006 29.0 ‐ ‐ −30.2 −4.8Jul 2006 60.3 ‐ ‐ −72.4 −9.9Aug 2006 87.4 ‐ ‐ −116.2 −16.3Sep 2006 10.8 6.3 8 −96.6 −12.4
Dabrani; 30°56′46″N; 78°41′17″E; 2050 m msla
Aug 2004 ‐ ‐ −79.6 −11.2Sep 2004 ‐ ‐ −39.1 ‐Oct 2004 117.0 ‐ ‐ −96.7 −13.6Jul 2005 ‐ ‐ −91.7 −12.8Aug 2005 ‐ ‐ −64.3 −9.3Nov 2005 6.1 84 −53.2 −9.4Dec 2005 ‐ ‐ −45.4 −8.9Jan 2006 33.9 5.9 24 −35.3 −6.8Feb 2006 22.0 ‐ ‐ −14.2 −3.9Mar 2006 56.6 ‐ ‐ −90.0 −12.9May 2006 35.0 5.8 168 +26.0 +2.5Jun 2006 42.2 6.1 15 −71.6 −10.2Aug 2006 150.0 5.6 4 −99.3 −13.3Sep 2006 42.8 ‐ ‐ −34.6 −6.3
Maneri; 30°44′43″N; 78°26′48″E; 1150 m msla
Dec 2005 10.0 ‐ ‐ −23.5 −4.4Jan 2006 89.6 ‐ ‐ −20.3 −4.4Feb 2006 18.2 ‐ ‐ −13.4 −3.1Mar 2006 89.2 ‐ ‐ −44.8 −7.4Apr 2006 55.2 ‐ ‐ −19.3 −2.5May 2006 144.7 ‐ ‐ +9.0 +2.0Jun 2006 77.4 ‐ ‐ −18.4 −2.6Jul 2006 430.4 ‐ ‐ −76.3 −11.0Aug 2006 323.5 ‐ ‐ −85.5 −11.1Sep 2006 119.2 ‐ ‐ −34.2 −5.8Oct 2006 41.6 ‐ ‐ −14.1 −2.4
Uttarkashi; 30°43′45″N; 78°26′48″E; 1140 m msla
Jun 2004 ‐ ‐ ‐ −2.5Jul 2004 496.2 ‐ ‐ −6.5 −2.4Aug 2004 636.0 ‐ ‐ −78.0 −11.1Sep 2004 100.4 ‐ ‐ −2.8 −1.5Oct 2004 117.0 ‐ ‐ −36.3 −6.4Dec 2004 6.8 ‐ ‐ −13.0 −4.1Jan 2005 102.6 ‐ ‐ −19.3 −4.8Feb 2005 126.6 ‐ ‐ −18.1 −4.9Mar 2005 59.2 ‐ ‐ −0.9 −2.5Apr 2005 30.6 ‐ ‐ −17.3 −4.1May 2005 97.2 ‐ ‐ +14.1 −1.4Jun 2005 79.0 ‐ ‐ −0.3 −2.4Jul 2005 692.1 7.9 24 −24.4 −5.2Aug 2005 277.1 ‐ ‐ −46.9 −6.6Sep 2005 220.2 ‐ ‐ −157.0 −20.8Oct 2005 2.6 ‐ ‐ ‐ −0.8Nov 2005 ‐ ‐ ‐ −90.0 −12.5Dec 2005 20.2 6.3 149 −23.7 −5.2Jan 2006 82.4 6.3 90 −16.9 −4.8Feb 2006 7.6 ‐ ‐ +30.5 +1.9Mar 2006 74.8 ‐ ‐ −19.1 −4.2Apr 2006 26.8 ‐ ‐ +7.6 +0May 2006 280.0 ‐ ‐ +14.6 +0.1Jun 2006 20.8 ‐ ‐ −5.3 −1.7Jul 2006 511.6 ‐ ‐ −62.2 −9.7Aug 2006 240.0 ‐ ‐ −81.3 −11.9Sep 2006 48.2 ‐ ‐ −20.5 −4.0Oct 2006 20.4 ‐ ‐ −10.2 −1.2
Tehri; 30° 21′10″N; 78°29′06″E; 640 m msla
Jul 2004 101.9 22.8 70.5 ‐ ‐ −26.8 −5.3Sep 2004 101.0 21.3 77.5 ‐ ‐ −75.2 −10.4Oct 2004 67.3 15.5 71.0 ‐ ‐ +5.0 +0.5Dec 2004 8.0 10.4 68.0 6.1 20 +5.0 −1.3Jan 2005 58.4 7.1 73.5 ‐ ‐ −7.2 −1.7Feb 2005 86.0 8.6 72.0 ‐ ‐ −68.0 −9.8Mar 2005 31.8 14.6 60.5 ‐ ‐ −26.3 −6.6
KUMAR ET AL.: ISOTOPIC CHARACTERISTICS OF INDIAN PRECIPITATION W12548W12548
7 of 15
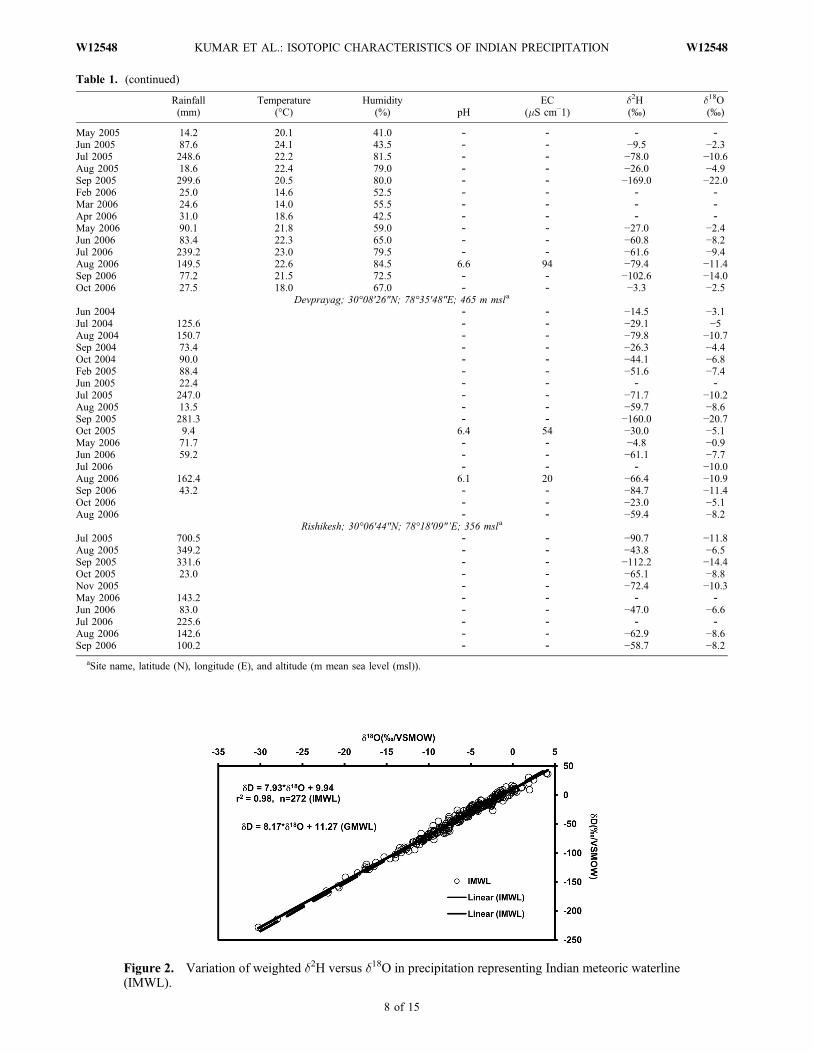
Table 1. (continued)
Rainfall(mm)
Temperature(°C)
Humidity(%) pH
EC(mS cm−1)
d2H(‰)
d18O(‰)
May 2005 14.2 20.1 41.0 ‐ ‐ ‐ ‐Jun 2005 87.6 24.1 43.5 ‐ ‐ −9.5 −2.3Jul 2005 248.6 22.2 81.5 ‐ ‐ −78.0 −10.6Aug 2005 18.6 22.4 79.0 ‐ ‐ −26.0 −4.9Sep 2005 299.6 20.5 80.0 ‐ ‐ −169.0 −22.0Feb 2006 25.0 14.6 52.5 ‐ ‐ ‐ ‐Mar 2006 24.6 14.0 55.5 ‐ ‐ ‐ ‐Apr 2006 31.0 18.6 42.5 ‐ ‐ ‐ ‐May 2006 90.1 21.8 59.0 ‐ ‐ −27.0 −2.4Jun 2006 83.4 22.3 65.0 ‐ ‐ −60.8 −8.2Jul 2006 239.2 23.0 79.5 ‐ ‐ −61.6 −9.4Aug 2006 149.5 22.6 84.5 6.6 94 −79.4 −11.4Sep 2006 77.2 21.5 72.5 ‐ ‐ −102.6 −14.0Oct 2006 27.5 18.0 67.0 ‐ ‐ −3.3 −2.5
Devprayag; 30°08′26″N; 78°35′48″E; 465 m msla
Jun 2004 ‐ ‐ −14.5 −3.1Jul 2004 125.6 ‐ ‐ −29.1 −5Aug 2004 150.7 ‐ ‐ −79.8 −10.7Sep 2004 73.4 ‐ ‐ −26.3 −4.4Oct 2004 90.0 ‐ ‐ −44.1 −6.8Feb 2005 88.4 ‐ ‐ −51.6 −7.4Jun 2005 22.4 ‐ ‐ ‐ ‐Jul 2005 247.0 ‐ ‐ −71.7 −10.2Aug 2005 13.5 ‐ ‐ −59.7 −8.6Sep 2005 281.3 ‐ ‐ −160.0 −20.7Oct 2005 9.4 6.4 54 −30.0 −5.1May 2006 71.7 ‐ ‐ −4.8 −0.9Jun 2006 59.2 ‐ ‐ −61.1 −7.7Jul 2006 ‐ ‐ ‐ −10.0Aug 2006 162.4 6.1 20 −66.4 −10.9Sep 2006 43.2 ‐ ‐ −84.7 −11.4Oct 2006 ‐ ‐ −23.0 −5.1Aug 2006 ‐ ‐ −59.4 −8.2
Rishikesh; 30°06′44″N; 78°18′09″’E; 356 msla
Jul 2005 700.5 ‐ ‐ −90.7 −11.8Aug 2005 349.2 ‐ ‐ −43.8 −6.5Sep 2005 331.6 ‐ ‐ −112.2 −14.4Oct 2005 23.0 ‐ ‐ −65.1 −8.8Nov 2005 ‐ ‐ −72.4 −10.3May 2006 143.2 ‐ ‐ ‐ ‐Jun 2006 83.0 ‐ ‐ −47.0 −6.6Jul 2006 225.6 ‐ ‐ ‐ ‐Aug 2006 142.6 ‐ ‐ −62.9 −8.6Sep 2006 100.2 ‐ ‐ −58.7 −8.2
aSite name, latitude (N), longitude (E), and altitude (m mean sea level (msl)).
Figure 2. Variation of weighted d2H versus d18O in precipitation representing Indian meteoric waterline(IMWL).
KUMAR ET AL.: ISOTOPIC CHARACTERISTICS OF INDIAN PRECIPITATION W12548W12548
8 of 15
plot is shown in Figure 2. This plot represents the Indianmeteoric waterline (IMWL) for a complete year which is notvery different from the GMWL (equation (1)).
�2H ¼ 7:93 �0:06ð Þ � �18Oþ 9:94 �0:51ð Þ ðn ¼ 272; r2 ¼ 0:98�:
ð8Þ
The IMWL for summer (equation (9)), monsoon (also calledas SWmonsoon; equation (10)) and winter (also called as NEmonsoon; equation (11)) are also established which havealmost similar slopes except for the summer equation becauseof the evaporation effect.
�2H ¼ 7:38 �0:21ð Þ�18Oþ 8:03 �1:05ð Þ ðn ¼ 81; r2 ¼ 0:94�;
ð9Þ
�2H ¼ 7:98 �0:078ð Þ�18Oþ 9:29 �0:679ð Þ ðn ¼ 134; r2 ¼ 0:99�;
ð10Þ
�2H ¼ 7:81 �0:17ð Þ�18Oþ 11:14 �1:18ð Þ ðn ¼ 63; r2 ¼ 0:97�;
ð11Þ
The IMWL for the winter season (equation (11)) has anintercept a little higher than that of the summer and monsoonseasons, indicating differences in their sources of precipi-tation. During the monsoon, the main source of precipita-
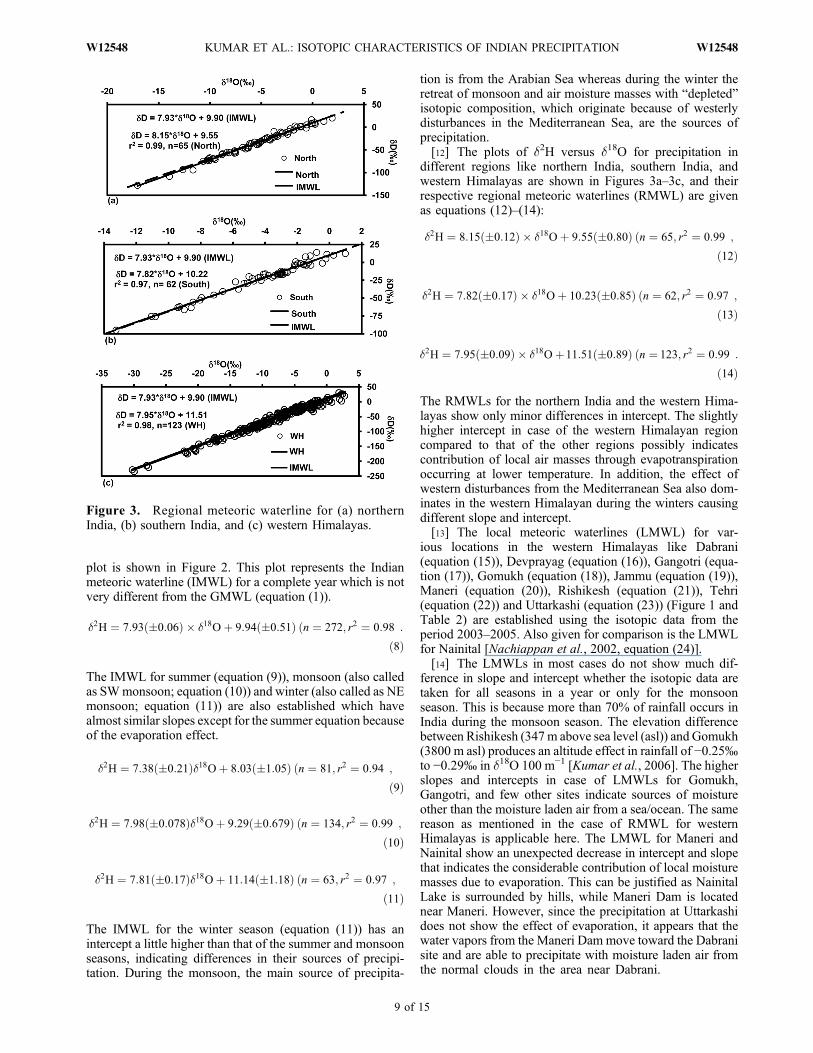
tion is from the Arabian Sea whereas during the winter theretreat of monsoon and air moisture masses with “depleted”isotopic composition, which originate because of westerlydisturbances in the Mediterranean Sea, are the sources ofprecipitation.[12] The plots of d2H versus d18O for precipitation in
different regions like northern India, southern India, andwestern Himalayas are shown in Figures 3a–3c, and theirrespective regional meteoric waterlines (RMWL) are givenas equations (12)–(14):
�2H ¼ 8:15 �0:12ð Þ � �18Oþ 9:55 �0:80ð Þ ðn ¼ 65; r2 ¼ 0:99�;
ð12Þ
�2H ¼ 7:82 �0:17ð Þ � �18Oþ 10:23 �0:85ð Þ ðn ¼ 62; r2 ¼ 0:97�;
ð13Þ
�2H ¼ 7:95 �0:09ð Þ � �18Oþ11:51 �0:89ð Þ ðn ¼ 123; r2 ¼ 0:99�:
ð14Þ
The RMWLs for the northern India and the western Hima-layas show only minor differences in intercept. The slightlyhigher intercept in case of the western Himalayan regioncompared to that of the other regions possibly indicatescontribution of local air masses through evapotranspirationoccurring at lower temperature. In addition, the effect ofwestern disturbances from the Mediterranean Sea also dom-inates in the western Himalayan during the winters causingdifferent slope and intercept.[13] The local meteoric waterlines (LMWL) for var-
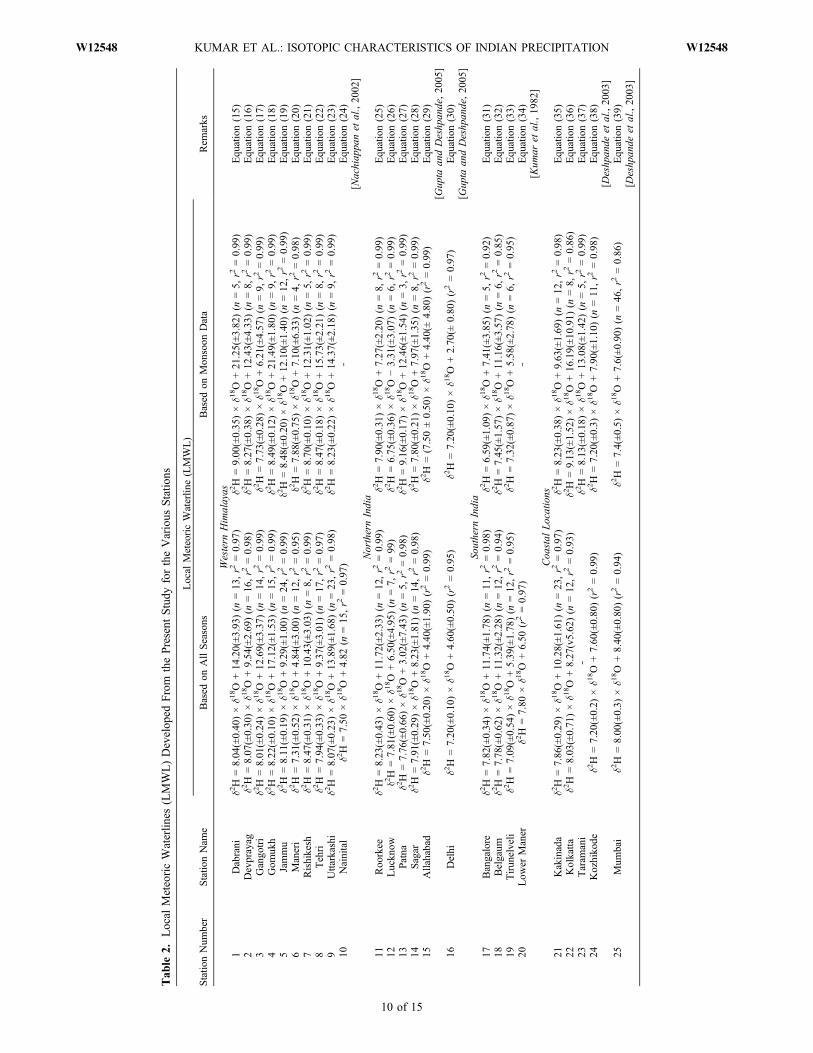
ious locations in the western Himalayas like Dabrani(equation (15)), Devprayag (equation (16)), Gangotri (equa-tion (17)), Gomukh (equation (18)), Jammu (equation (19)),Maneri (equation (20)), Rishikesh (equation (21)), Tehri(equation (22)) and Uttarkashi (equation (23)) (Figure 1 andTable 2) are established using the isotopic data from theperiod 2003–2005. Also given for comparison is the LMWLfor Nainital [Nachiappan et al., 2002, equation (24)].[14] The LMWLs in most cases do not show much dif-
ference in slope and intercept whether the isotopic data aretaken for all seasons in a year or only for the monsoonseason. This is because more than 70% of rainfall occurs inIndia during the monsoon season. The elevation differencebetween Rishikesh (347m above sea level (asl)) and Gomukh(3800 m asl) produces an altitude effect in rainfall of −0.25‰to −0.29‰ in d18O 100 m−1 [Kumar et al., 2006]. The higherslopes and intercepts in case of LMWLs for Gomukh,Gangotri, and few other sites indicate sources of moistureother than the moisture laden air from a sea/ocean. The samereason as mentioned in the case of RMWL for westernHimalayas is applicable here. The LMWL for Maneri andNainital show an unexpected decrease in intercept and slopethat indicates the considerable contribution of local moisturemasses due to evaporation. This can be justified as NainitalLake is surrounded by hills, while Maneri Dam is locatednear Maneri. However, since the precipitation at Uttarkashidoes not show the effect of evaporation, it appears that thewater vapors from the Maneri Dam move toward the Dabranisite and are able to precipitate with moisture laden air fromthe normal clouds in the area near Dabrani.
Figure 3. Regional meteoric waterline for (a) northernIndia, (b) southern India, and (c) western Himalayas.
KUMAR ET AL.: ISOTOPIC CHARACTERISTICS OF INDIAN PRECIPITATION W12548W12548
9 of 15
Tab
le2.
Local
MeteoricWaterlin
es(LMWL)Develop
edFrom
thePresent
Study
fortheVarious
Statio
ns
Statio
nNum
ber
Statio
nNam
e
Local
MeteoricWaterlin
e(LMWL)
Rem
arks
Based
onAllSeasons
Based
onMon
soon
Data
Western
Himalayas
1Dabrani
d2H
=8.04
(±0.40
)×d1
8O
+14
.20(±3
.93)
(n=13
,r2
=0.97
)d2H
=9.00
(±0.35
)×d1
8O
+21
.25(±3
.82)
(n=5,
r2=0.99
)Equ
ation(15)
2Devprayag
d2H
=8.07
(±0.30
)×d1
8O
+9.54
(±2.69
)(n
=16
,r2
=0.98
)d2H
=8.27
(±0.38
)×d1
8O
+12
.43(±4
.33)
(n=8,
r2=0.99
)Equ
ation(16)
3Gango
tri
d2H
=8.01
(±0.24
)×d1
8O
+12
.69(±3
.37)
(n=14
,r2
=0.99
)d2H
=7.73
(±0.28
)×d1
8O
+6.21
(±4.57
)(n
=9,
r2=0.99
)Equ
ation(17)
4Gom
ukh
d2H
=8.22
(±0.10
)×d1
8O
+17
.12(±1
.53)
(n=15
,r2
=0.99
)d2H
=8.49
(±0.12
)×d1
8O
+21
.49(±1
.80)
(n=9,
r2=0.99
)Equ
ation(18)
5Jammu
d2H
=8.11
(±0.19
)×d1
8O
+9.29
(±1.00
)(n
=24
,r2
=0.99
)d2H
=8.48
(±0.20
)×d1
8O
+12
.10(±1
.40)
(n=12
,r2
=0.99
)Equ
ation(19)
6Maneri
d2H
=7.31
(±0.52
)×d1
8O
+4.84
(±3.00
)(n
=12
,r2
=0.95
)d2H
=7.88
(±0.75
)×d1
8O
+7.10
(±6.33
)(n
=4,
r2=0.98
)Equ
ation(20)
7Rishikesh
d2H
=8.47
(±0.31
)×d1
8O
+10
.43(±3
.03)
(n=8,
r2=0.99
)d2H
=8.70
(±0.10
)×d1
8O
+12
.31(±1
.02)
(n=5,
r2=0.99
)Equ
ation(21)
8Tehri
d2H
=7.94
(±0.33
)×d1
8O
+9.37
(±3.01
)(n
=17
,r2
=0.97
)d2H
=8.47
(±0.18
)×d1
8O
+15
.73(±2
.21)
(n=8,
r2=0.99
)Equ
ation(22)
9Uttarkashi
d2H
=8.07
(±0.23
)×d1
8O
+13
.89(±1
.68)
(n=23
,r2
=0.98
)d2H
=8.23
(±0.22
)×d1
8O
+14
.37(±2
.18)
(n=9,
r2=0.99
)Equ
ation(23)
10Nainital
d2H
=7.50
×d1
8O
+4.82
(n=15
,r2
=0.97
)‐
Equ
ation(24)
[Nachiap
panet
al.,20
02]
NorthernIndia
11Roo
rkee
d2H
=8.23
(±0.43
)×d1
8O
+11
.72(±2
.33)
(n=12
,r2
=0.99
)d2H
=7.90
(±0.31
)×d1
8O
+7.27
(±2.20
)(n
=8,
r2=0.99
)Equ
ation(25)
12Luckn
owd2H
=7.81
(±0.60
)×d1
8O
+6.50
(±4.95
)(n
=7,
r2=99
)d2H
=6.75
(±0.36
)×d1
8O
−3.31
(±3.07
)(n
=6,
r2=0.99
)Equ
ation(26)
13Patna
d2H
=7.76
(±0.66
)×d1
8O
+3.02
(±7.43
)(n
=5,
r2=0.98
)d2H
=9.16
(±0.17
)×d1
8O
+12
.46(±1
.54)
(n=3,
r2=0.99
)Equ
ation(27)
14Sagar
d2H
=7.91
(±0.29
)×d1
8O
+8.23
(±1.81
)(n
=14
,r2
=0.98
)d2H
=7.80
(±0.21
)×d1
8O
+7.97
(±1.35
)(n
=8,
r2=0.99
)Equ
ation(28)
15Allahabad
d2H
=7.50
(±0.20
)×d1
8O
+4.40
(±1.90
)(r2=0.99
)d2H
=(7.50±0.50
)×d1
8O
+4.40
(±4.80
)(r2=0.99
)Equ
ation(29)
[Gup
taan
dDeshp
ande,20
05]
16Delhi
d2H
=7.20
(±0.10
)×d1
8O
+4.60
(±0.50
)(r2=0.95
)d2H
=7.20
(±0.10
)×d1
8O
+2.70
(±0.80
)(r2=0.97
)Equ
ation(30)
[Gup
taan
dDeshp
ande,20
05]
Southern
India
17Bangalore
d2H
=7.82
(±0.34
)×d1
8O
+11
.74(±1
.78)
(n=11
,r2
=0.98
)d2H
=6.59
(±1.09
)×d1
8O
+7.41
(±3.85
)(n
=5,
r2=0.92
)Equ
ation(31)
18Belgaum
d2H
=7.78
(±0.62
)×d1
8O
+11
.32(±2
.28)
(n=12
,r2
=0.94
)d2H
=7.45
(±1.57
)×d1
8O
+11
.16(±3
.57)
(n=6,
r2=0.85
)Equ
ation(32)
19Tirun
elveli
d2H
=7.09
(±0.54
)×d1
8O
+5.39
(±1.78
)(n
=12
,r2
=0.95
)d2H
=7.32
(±0.87
)×d1
8O
+5.58
(±2.78
)(n
=6,
r2=0.95
)Equ
ation(33)
20Low
erManer
d2H
=7.80
×d1
8O
+6.50
(r2=0.97
)‐
Equ
ation(34)
[Kum
aret
al.,19
82]
Coa
stal
Locations
21Kakinada
d2H
=7.86
(±0.29
)×d1
8O
+10
.28(±1
.61)
(n=23
,r2
=0.97
)d2H
=8.23
(±0.38
)×d1
8O
+9.63
(±1.69
)(n
=12
,r2
=0.98
)Equ
ation(35)
22Kolkatta
d2H
=8.03
(±0.71
)×d1
8O
+8.27
(v5.62
)(n
=12
,r2
=0.93
)d2H
=9.13
(±1.52
)×d1
8O
+16
.19(±1
0.91
)(n
=8,
r2=0.86
)Equ
ation(36)
23Taram
ani
‐d2H
=8.13
(±0.18
)×d1
8O
+13
.08(±1
.42)
(n=5,
r2=0.99
)Equ
ation(37)
24Kozhiko
ded2H
=7.20
(±0.2)
×d1
8O
+7.60
(±0.80
)(r2=0.99
)d2H
=7.20
(±0.3)
×d1
8O
+7.90
(±1.10
)(n
=11
,r2
=0.98
)Equ
ation(38)
[Deshp
ande
etal.,20
03]
25Mum
bai
d2H
=8.00
(±0.3)
×d1
8O
+8.40
(±0.80
)(r2=0.94
)d2H
=7.4(±0
.5)×d1
8O
+7.6(±0
.90)
(n=46
,r2
=0.86
)Equ
ation(39)
[Deshp
ande
etal.,20
03]
KUMAR ET AL.: ISOTOPIC CHARACTERISTICS OF INDIAN PRECIPITATION W12548W12548
10 of 15
[15] The LMWLs established for inland locations of north-ern India (Roorkee (equation (25)), Lucknow (equation (26)),Patna (equation (27)), and Sagar (equation (28))) also showvariations in the slope and intercept (Table 2). Also, theLMWLs for Allahabad [Gupta and Deshpande, 2005,equation (29)] and Delhi [Mukherjee and Chandrasekharan,1993, equation (30)] are given for the purpose of comparison.It has been observed that the slope and intercept decreasewhere surface water bodies occur and where the temperatureis higher, e.g., Sagar Lake at Sagar and the river Ganga atAllahabad, because of very wide course with impoundedwater. Similarly, Delhi has a number of impounded waterbodies that contribute considerable local moisture masses andthe precipitation in low amount is also subjected to evapo-ration during the rainout, causing a decrease in slope andintercept.[16] The LMWLs for a few locations in southern India are
given in Table 2 (Bangalore (equation (31)), Belgaum(equation (32)) and Tirunelveli (equation (33))). Also, theLMWL for lower Maner [Kumar et al., 1982, equation (34)]is given for the purpose of comparison. The slope is less ineach case than the IMWL because of evaporative enrich-ment of raindrops during the rainout processes. However, asTirunelveli is warmer (ambient temperature is 37°C, relativehumidity is 60%) than Bangalore and Bangalore is warmerthan Belgaum therefore the effect of evaporation increasesthe slope and intercept from Tirunelveli to Belgaum.[17] The LMWLs for different coastal locations like
Kakinada (equation (35)), Kolkata (equation (36)), andTaramani (equation (37)) vary in terms of slope as well as inintercept (Table 2). Also, the LMWLs for Kozhikode andMumbai [Deshpande et al., 2003] are given for the purposeof comparison. The one reason of variation of slope is thatthe NEmonsoon that originates fromBOB has comparativelydepleted (more negative) isotopic composition (−1.5‰ to+5‰), while the SW monsoon that originates from theArabian Sea has an isotopic composition +5‰ to +1.5‰. Inaddition, the SWmonsoon from the west coast moves towardthe east coast and gets depleted because of rainout processes,i.e., progressive depletion of vapor phase and preferentialcondensation of heavier isotopes and also mixes with theevaporated air moisture masses.[18] Furthermore, the variation in isotopic composition of
precipitation in different parts of India like south, north, etc.can be explained with the fact that the rainwater character-istics in the southern Indian Peninsula are controlled byprecipitation during the summer (SW) and winter (NE)monsoons. The SW monsoon operates during the months ofJune–September, and the NE monsoon operates during the
months of October–January. The causal mechanism for thesemonsoon systems is the seasonal reversal of temperature andpressure gradients and associated wind circulation followingthe annual northward and southward motion of the Sun[Rajan, 1988; Rao, 1976]. These two seasonal circulationsystems are part of the larger monsoon circulation of SouthAsia.[19] The major sources of moisture for the SW monsoon
rains in the southern Indian Peninsula are the northernIndian Ocean and the Arabian Sea, leading to rains along thewest coast of India and in the central and eastern parts of thepeninsula [Ghosh et al., 1978]. Whereas the NE monsoonderives moisture from the Bay of Bengal, the South ChinaSea, and the continental vapor sources to provide precipi-tation to eastern and southeastern parts of the peninsula[Rao, 1976;Mooley and Shukla, 1987; Rajan, 1988;Menon,1995]. The two sources of moisture in the two seasons areexpected to have different isotopic characteristics whoseimprints are identifiable in the geographic distribution ofisotopes in precipitation.[20] In addition to the SW and NE monsoons in northern
India, the westerly disturbances from the Mediterranean Seaare responsible for the variability in the isotopic character-istics of precipitation. It has been observed in most of thecases that the isotopic composition of precipitation is moredepleted in the month of September in comparison to Julyand August every year.[21] The plot of deviation in D excess versus slope of
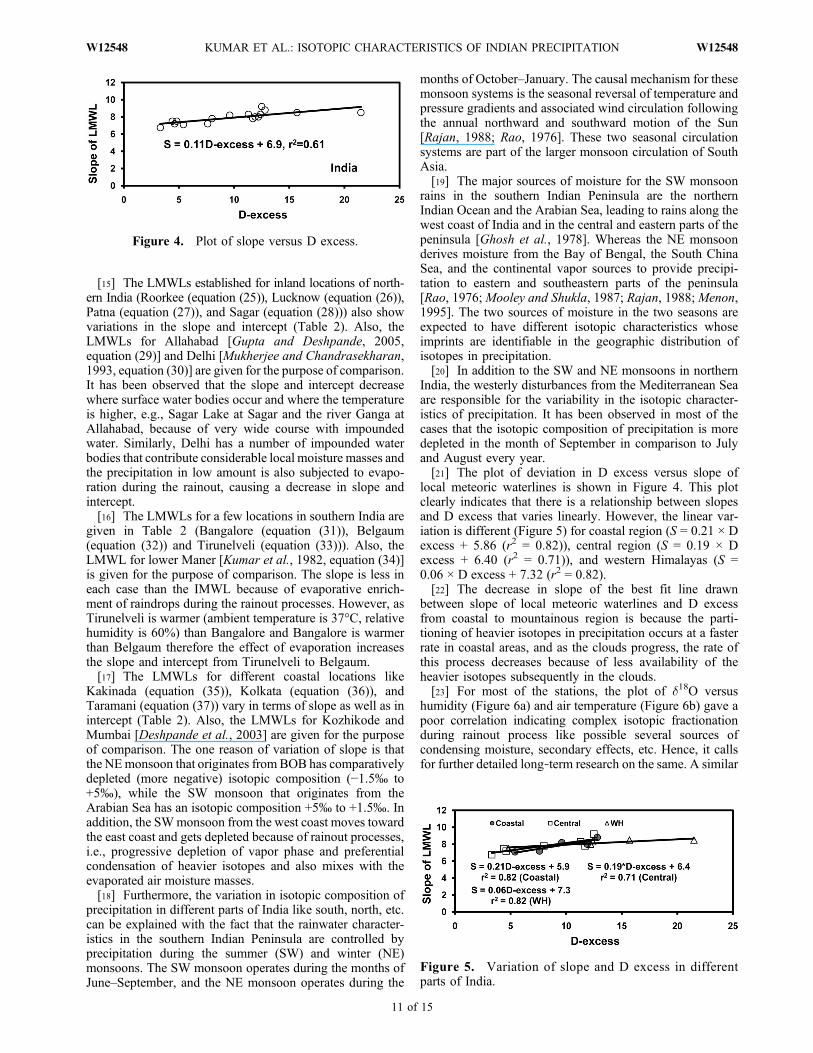
local meteoric waterlines is shown in Figure 4. This plotclearly indicates that there is a relationship between slopesand D excess that varies linearly. However, the linear var-iation is different (Figure 5) for coastal region (S = 0.21 × Dexcess + 5.86 (r2 = 0.82)), central region (S = 0.19 × Dexcess + 6.40 (r2 = 0.71)), and western Himalayas (S =0.06 × D excess + 7.32 (r2 = 0.82).[22] The decrease in slope of the best fit line drawn
between slope of local meteoric waterlines and D excessfrom coastal to mountainous region is because the parti-tioning of heavier isotopes in precipitation occurs at a fasterrate in coastal areas, and as the clouds progress, the rate ofthis process decreases because of less availability of theheavier isotopes subsequently in the clouds.[23] For most of the stations, the plot of d18O versus
humidity (Figure 6a) and air temperature (Figure 6b) gave apoor correlation indicating complex isotopic fractionationduring rainout process like possible several sources ofcondensing moisture, secondary effects, etc. Hence, it callsfor further detailed long‐term research on the same. A similar
Figure 4. Plot of slope versus D excess.
Figure 5. Variation of slope and D excess in differentparts of India.
KUMAR ET AL.: ISOTOPIC CHARACTERISTICS OF INDIAN PRECIPITATION W12548W12548
11 of 15
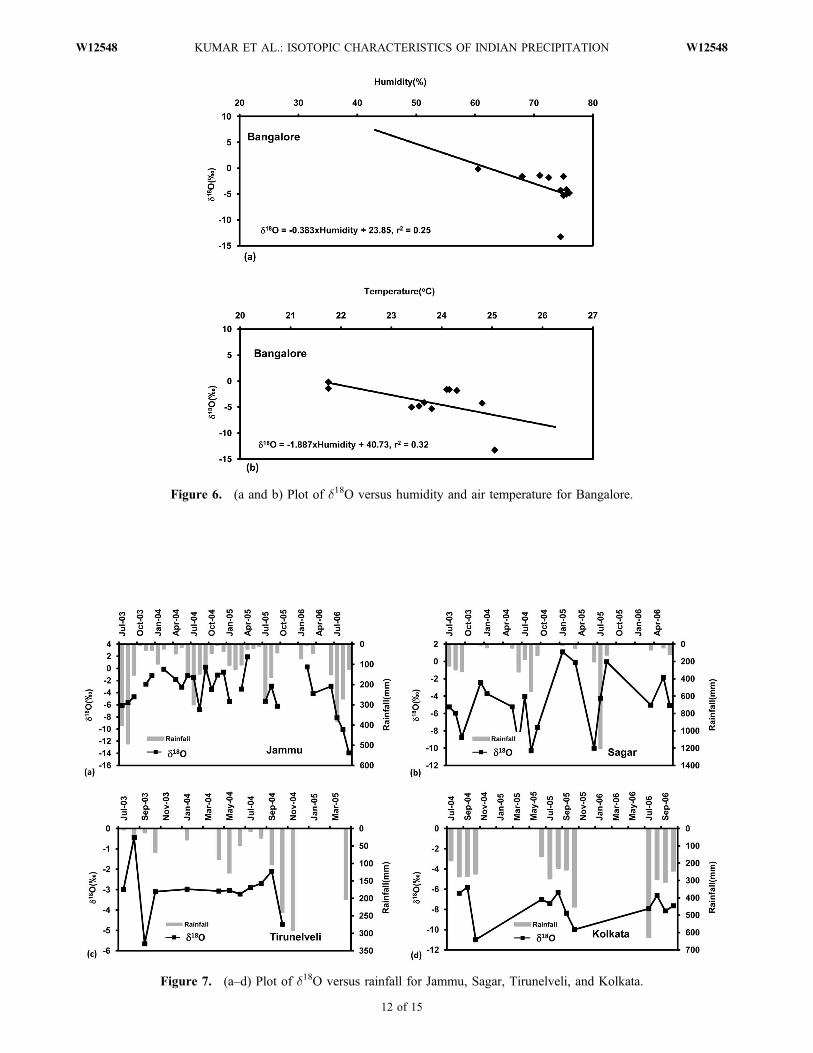
Figure 6. (a and b) Plot of d18O versus humidity and air temperature for Bangalore.
Figure 7. (a–d) Plot of d18O versus rainfall for Jammu, Sagar, Tirunelveli, and Kolkata.
KUMAR ET AL.: ISOTOPIC CHARACTERISTICS OF INDIAN PRECIPITATION W12548W12548
12 of 15
finding was made by Yurtsever andGat [1981] during a studyto develop a relationship between the isotopic composition ofprecipitation as a function of different independent variables,namely, latitude, temperature, and amount of precipitation.The authors pointed out that this approach may be true on aglobal scale and may not hold good on a regional scale andsuggested that certain geographical/climatologically para-meters may be included for better results.[24] The plot of d18O versus amount of rainfall (Figures 7a
and 7b) for various stations indicated good correlation onlyfor western Himalayas and northern Indian stations withhigher amount of rainfall giving rise to depleted d18O values,indicating the “amount effect” in precipitation. Whereas“the amount effect” is not clearly seen in southern Indian(Figure 7c) and coastal regions (Figure 7d). The “amounteffect” is seen only during the SW monsoon period insouthern and coastal regions.[25] The “altitude effect” in the d18O content of precipi-
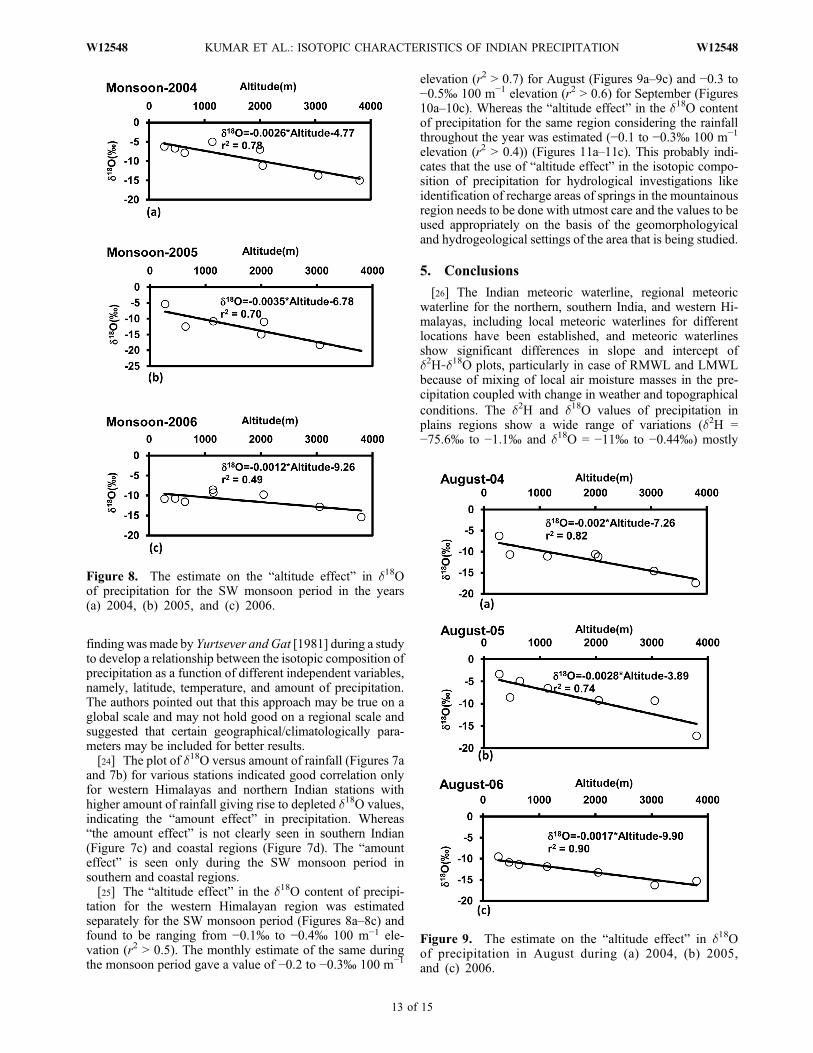
tation for the western Himalayan region was estimatedseparately for the SW monsoon period (Figures 8a–8c) andfound to be ranging from −0.1‰ to −0.4‰ 100 m−1 ele-vation (r2 > 0.5). The monthly estimate of the same duringthe monsoon period gave a value of −0.2 to −0.3‰ 100 m−1
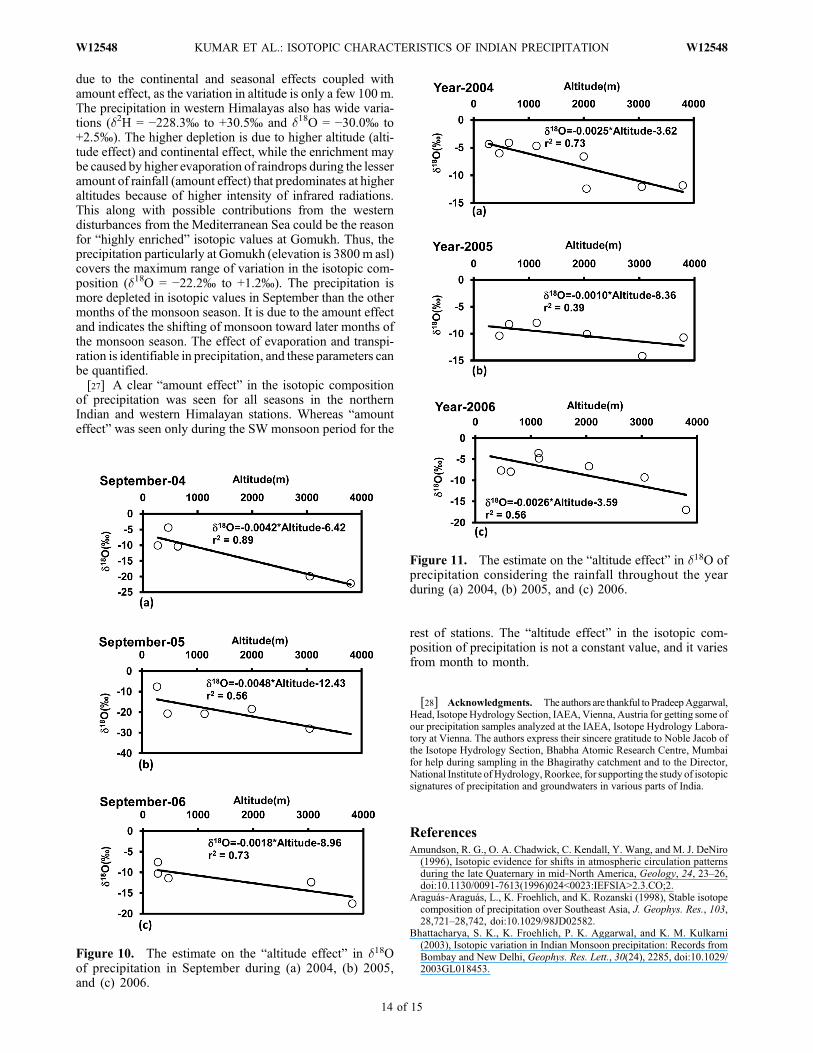
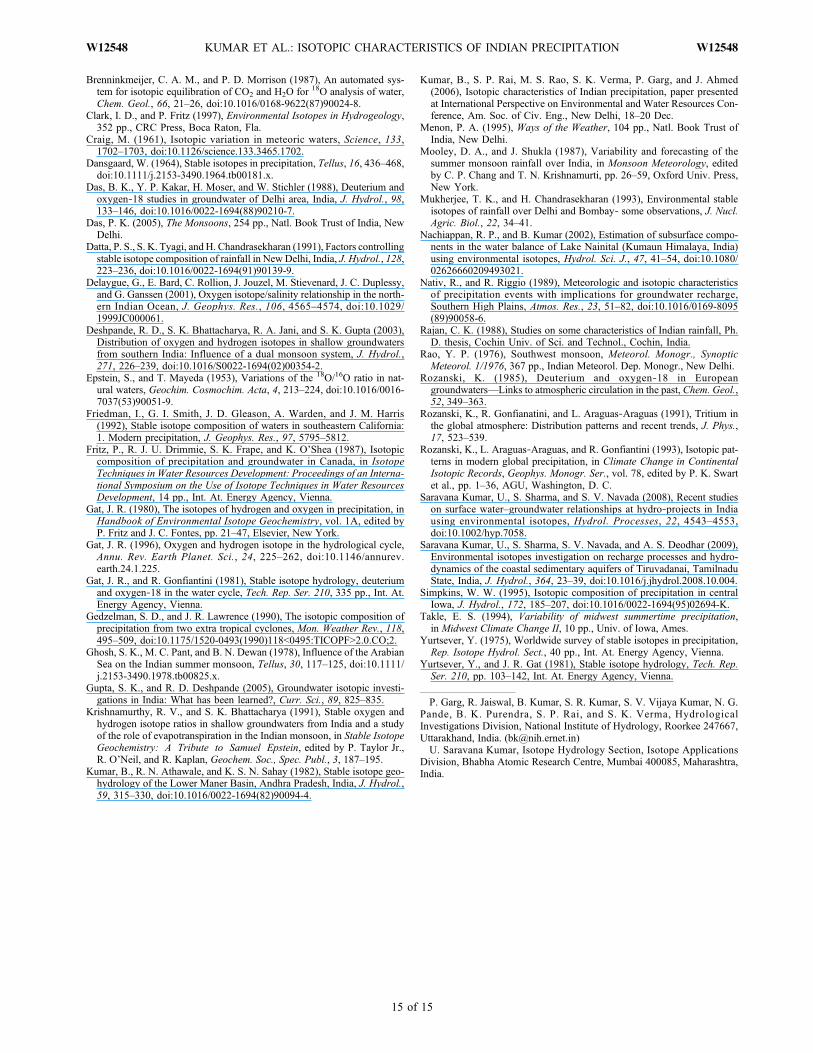
elevation (r2 > 0.7) for August (Figures 9a–9c) and −0.3 to−0.5‰ 100 m−1 elevation (r2 > 0.6) for September (Figures10a–10c). Whereas the “altitude effect” in the d18O contentof precipitation for the same region considering the rainfallthroughout the year was estimated (−0.1 to −0.3‰ 100 m−1
elevation (r2 > 0.4)) (Figures 11a–11c). This probably indi-cates that the use of “altitude effect” in the isotopic compo-sition of precipitation for hydrological investigations likeidentification of recharge areas of springs in the mountainousregion needs to be done with utmost care and the values to beused appropriately on the basis of the geomorphologyicaland hydrogeological settings of the area that is being studied.
5. Conclusions
[26] The Indian meteoric waterline, regional meteoricwaterline for the northern, southern India, and western Hi-malayas, including local meteoric waterlines for differentlocations have been established, and meteoric waterlinesshow significant differences in slope and intercept ofd2H‐d18O plots, particularly in case of RMWL and LMWLbecause of mixing of local air moisture masses in the pre-cipitation coupled with change in weather and topographicalconditions. The d2H and d18O values of precipitation inplains regions show a wide range of variations (d2H =−75.6‰ to −1.1‰ and d18O = −11‰ to −0.44‰) mostly
Figure 8. The estimate on the “altitude effect” in d18Oof precipitation for the SW monsoon period in the years(a) 2004, (b) 2005, and (c) 2006.
Figure 9. The estimate on the “altitude effect” in d18Oof precipitation in August during (a) 2004, (b) 2005,and (c) 2006.
KUMAR ET AL.: ISOTOPIC CHARACTERISTICS OF INDIAN PRECIPITATION W12548W12548
13 of 15
due to the continental and seasonal effects coupled withamount effect, as the variation in altitude is only a few 100 m.The precipitation in western Himalayas also has wide varia-tions (d2H = −228.3‰ to +30.5‰ and d18O = −30.0‰ to+2.5‰). The higher depletion is due to higher altitude (alti-tude effect) and continental effect, while the enrichment maybe caused by higher evaporation of raindrops during the lesseramount of rainfall (amount effect) that predominates at higheraltitudes because of higher intensity of infrared radiations.This along with possible contributions from the westerndisturbances from the Mediterranean Sea could be the reasonfor “highly enriched” isotopic values at Gomukh. Thus, theprecipitation particularly at Gomukh (elevation is 3800m asl)covers the maximum range of variation in the isotopic com-position (d18O = −22.2‰ to +1.2‰). The precipitation ismore depleted in isotopic values in September than the othermonths of the monsoon season. It is due to the amount effectand indicates the shifting of monsoon toward later months ofthe monsoon season. The effect of evaporation and transpi-ration is identifiable in precipitation, and these parameters canbe quantified.[27] A clear “amount effect” in the isotopic composition
of precipitation was seen for all seasons in the northernIndian and western Himalayan stations. Whereas “amounteffect” was seen only during the SW monsoon period for the
rest of stations. The “altitude effect” in the isotopic com-position of precipitation is not a constant value, and it variesfrom month to month.
[28] Acknowledgments. The authors are thankful to PradeepAggarwal,Head, Isotope Hydrology Section, IAEA, Vienna, Austria for getting some ofour precipitation samples analyzed at the IAEA, Isotope Hydrology Labora-tory at Vienna. The authors express their sincere gratitude to Noble Jacob ofthe Isotope Hydrology Section, Bhabha Atomic Research Centre, Mumbaifor help during sampling in the Bhagirathy catchment and to the Director,National Institute of Hydrology, Roorkee, for supporting the study of isotopicsignatures of precipitation and groundwaters in various parts of India.
ReferencesAmundson, R. G., O. A. Chadwick, C. Kendall, Y. Wang, and M. J. DeNiro(1996), Isotopic evidence for shifts in atmospheric circulation patternsduring the late Quaternary in mid‐North America, Geology, 24, 23–26,doi:10.1130/0091-7613(1996)024<0023:IEFSIA>2.3.CO;2.
Araguás‐Araguás, L., K. Froehlich, and K. Rozanski (1998), Stable isotopecomposition of precipitation over Southeast Asia, J. Geophys. Res., 103,28,721–28,742, doi:10.1029/98JD02582.
Bhattacharya, S. K., K. Froehlich, P. K. Aggarwal, and K. M. Kulkarni(2003), Isotopic variation in Indian Monsoon precipitation: Records fromBombay and New Delhi, Geophys. Res. Lett., 30(24), 2285, doi:10.1029/2003GL018453.
Figure 10. The estimate on the “altitude effect” in d18Oof precipitation in September during (a) 2004, (b) 2005,and (c) 2006.
Figure 11. The estimate on the “altitude effect” in d18O ofprecipitation considering the rainfall throughout the yearduring (a) 2004, (b) 2005, and (c) 2006.
KUMAR ET AL.: ISOTOPIC CHARACTERISTICS OF INDIAN PRECIPITATION W12548W12548
14 of 15
Brenninkmeijer, C. A. M., and P. D. Morrison (1987), An automated sys-tem for isotopic equilibration of CO2 and H2O for 18O analysis of water,Chem. Geol., 66, 21–26, doi:10.1016/0168-9622(87)90024-8.
Clark, I. D., and P. Fritz (1997), Environmental Isotopes in Hydrogeology,352 pp., CRC Press, Boca Raton, Fla.
Craig, M. (1961), Isotopic variation in meteoric waters, Science, 133,1702–1703, doi:10.1126/science.133.3465.1702.
Dansgaard, W. (1964), Stable isotopes in precipitation, Tellus, 16, 436–468,doi:10.1111/j.2153-3490.1964.tb00181.x.
Das, B. K., Y. P. Kakar, H. Moser, and W. Stichler (1988), Deuterium andoxygen‐18 studies in groundwater of Delhi area, India, J. Hydrol., 98,133–146, doi:10.1016/0022-1694(88)90210-7.
Das, P. K. (2005), The Monsoons, 254 pp., Natl. Book Trust of India, NewDelhi.
Datta, P. S., S. K. Tyagi, andH. Chandrasekharan (1991), Factors controllingstable isotope composition of rainfall in NewDelhi, India, J. Hydrol., 128,223–236, doi:10.1016/0022-1694(91)90139-9.
Delaygue, G., E. Bard, C. Rollion, J. Jouzel, M. Stievenard, J. C. Duplessy,and G. Ganssen (2001), Oxygen isotope/salinity relationship in the north-ern Indian Ocean, J. Geophys. Res., 106, 4565–4574, doi:10.1029/1999JC000061.
Deshpande, R. D., S. K. Bhattacharya, R. A. Jani, and S. K. Gupta (2003),Distribution of oxygen and hydrogen isotopes in shallow groundwatersfrom southern India: Influence of a dual monsoon system, J. Hydrol.,271, 226–239, doi:10.1016/S0022-1694(02)00354-2.
Epstein, S., and T. Mayeda (1953), Variations of the 18O/16O ratio in nat-ural waters, Geochim. Cosmochim. Acta, 4, 213–224, doi:10.1016/0016-7037(53)90051-9.
Friedman, I., G. I. Smith, J. D. Gleason, A. Warden, and J. M. Harris(1992), Stable isotope composition of waters in southeastern California:1. Modern precipitation, J. Geophys. Res., 97, 5795–5812.
Fritz, P., R. J. U. Drimmie, S. K. Frape, and K. O’Shea (1987), Isotopiccomposition of precipitation and groundwater in Canada, in IsotopeTechniques in Water Resources Development: Proceedings of an Interna-tional Symposium on the Use of Isotope Techniques in Water ResourcesDevelopment, 14 pp., Int. At. Energy Agency, Vienna.
Gat, J. R. (1980), The isotopes of hydrogen and oxygen in precipitation, inHandbook of Environmental Isotope Geochemistry, vol. 1A, edited byP. Fritz and J. C. Fontes, pp. 21–47, Elsevier, New York.
Gat, J. R. (1996), Oxygen and hydrogen isotope in the hydrological cycle,Annu. Rev. Earth Planet. Sci., 24, 225–262, doi:10.1146/annurev.earth.24.1.225.
Gat, J. R., and R. Gonfiantini (1981), Stable isotope hydrology, deuteriumand oxygen‐18 in the water cycle, Tech. Rep. Ser. 210, 335 pp., Int. At.Energy Agency, Vienna.
Gedzelman, S. D., and J. R. Lawrence (1990), The isotopic composition ofprecipitation from two extra tropical cyclones, Mon. Weather Rev., 118,495–509, doi:10.1175/1520-0493(1990)118<0495:TICOPF>2.0.CO;2.
Ghosh, S. K., M. C. Pant, and B. N. Dewan (1978), Influence of the ArabianSea on the Indian summer monsoon, Tellus, 30, 117–125, doi:10.1111/j.2153-3490.1978.tb00825.x.
Gupta, S. K., and R. D. Deshpande (2005), Groundwater isotopic investi-gations in India: What has been learned?, Curr. Sci., 89, 825–835.
Krishnamurthy, R. V., and S. K. Bhattacharya (1991), Stable oxygen andhydrogen isotope ratios in shallow groundwaters from India and a studyof the role of evapotranspiration in the Indian monsoon, in Stable IsotopeGeochemistry: A Tribute to Samuel Epstein, edited by P. Taylor Jr.,R. O’Neil, and R. Kaplan, Geochem. Soc., Spec. Publ., 3, 187–195.
Kumar, B., R. N. Athawale, and K. S. N. Sahay (1982), Stable isotope geo-hydrology of the Lower Maner Basin, Andhra Pradesh, India, J. Hydrol.,59, 315–330, doi:10.1016/0022-1694(82)90094-4.
Kumar, B., S. P. Rai, M. S. Rao, S. K. Verma, P. Garg, and J. Ahmed(2006), Isotopic characteristics of Indian precipitation, paper presentedat International Perspective on Environmental and Water Resources Con-ference, Am. Soc. of Civ. Eng., New Delhi, 18–20 Dec.
Menon, P. A. (1995), Ways of the Weather, 104 pp., Natl. Book Trust ofIndia, New Delhi.
Mooley, D. A., and J. Shukla (1987), Variability and forecasting of thesummer monsoon rainfall over India, in Monsoon Meteorology, editedby C. P. Chang and T. N. Krishnamurti, pp. 26–59, Oxford Univ. Press,New York.
Mukherjee, T. K., and H. Chandrasekharan (1993), Environmental stableisotopes of rainfall over Delhi and Bombay‐ some observations, J. Nucl.Agric. Biol., 22, 34–41.
Nachiappan, R. P., and B. Kumar (2002), Estimation of subsurface compo-nents in the water balance of Lake Nainital (Kumaun Himalaya, India)using environmental isotopes, Hydrol. Sci. J., 47, 41–54, doi:10.1080/02626660209493021.
Nativ, R., and R. Riggio (1989), Meteorologic and isotopic characteristicsof precipitation events with implications for groundwater recharge,Southern High Plains, Atmos. Res., 23, 51–82, doi:10.1016/0169-8095(89)90058-6.
Rajan, C. K. (1988), Studies on some characteristics of Indian rainfall, Ph.D. thesis, Cochin Univ. of Sci. and Technol., Cochin, India.
Rao, Y. P. (1976), Southwest monsoon, Meteorol. Monogr., SynopticMeteorol. 1/1976, 367 pp., Indian Meteorol. Dep. Monogr., New Delhi.
Rozanski, K. (1985), Deuterium and oxygen‐18 in Europeangroundwaters—Links to atmospheric circulation in the past, Chem. Geol.,52, 349–363.
Rozanski, K., R. Gonfianatini, and L. Araguas‐Araguas (1991), Tritium inthe global atmosphere: Distribution patterns and recent trends, J. Phys.,17, 523–539.
Rozanski, K., L. Araguas‐Araguas, and R. Gonfiantini (1993), Isotopic pat-terns in modern global precipitation, in Climate Change in ContinentalIsotopic Records, Geophys. Monogr. Ser., vol. 78, edited by P. K. Swartet al., pp. 1–36, AGU, Washington, D. C.
Saravana Kumar, U., S. Sharma, and S. V. Navada (2008), Recent studieson surface water–groundwater relationships at hydro‐projects in Indiausing environmental isotopes, Hydrol. Processes, 22, 4543–4553,doi:10.1002/hyp.7058.
Saravana Kumar, U., S. Sharma, S. V. Navada, and A. S. Deodhar (2009),Environmental isotopes investigation on recharge processes and hydro-dynamics of the coastal sedimentary aquifers of Tiruvadanai, TamilnaduState, India, J. Hydrol., 364, 23–39, doi:10.1016/j.jhydrol.2008.10.004.
Simpkins, W. W. (1995), Isotopic composition of precipitation in centralIowa, J. Hydrol., 172, 185–207, doi:10.1016/0022-1694(95)02694-K.
Takle, E. S. (1994), Variability of midwest summertime precipitation,in Midwest Climate Change II, 10 pp., Univ. of Iowa, Ames.
Yurtsever, Y. (1975), Worldwide survey of stable isotopes in precipitation,Rep. Isotope Hydrol. Sect., 40 pp., Int. At. Energy Agency, Vienna.
Yurtsever, Y., and J. R. Gat (1981), Stable isotope hydrology, Tech. Rep.Ser. 210, pp. 103–142, Int. At. Energy Agency, Vienna.
P. Garg, R. Jaiswal, B. Kumar, S. R. Kumar, S. V. Vijaya Kumar, N. G.Pande, B. K. Purendra, S. P. Rai, and S. K. Verma, HydrologicalInvestigations Division, National Institute of Hydrology, Roorkee 247667,Uttarakhand, India. ([email protected])U. Saravana Kumar, Isotope Hydrology Section, Isotope Applications
Division, Bhabha Atomic Research Centre, Mumbai 400085, Maharashtra,India.
KUMAR ET AL.: ISOTOPIC CHARACTERISTICS OF INDIAN PRECIPITATION W12548W12548
15 of 15
Related Documents