Chapter 10 Isothermal Crystallization Kinetics of Acrylonitrile Butadiene Rubber/Polypropylene Blends Abstract The phase morphology of polypropylene/acrylonitrile butadiene rubber (PP/NBR) blends were analysed using scanning electron microscopy (SEM) and atomic force microscopy (AFM). The uncompatibilized 60/40 NBR/PP blend showed a co-continuous morphology. Dynamic vulcanisation transformed the co-continuous phase morphology to particle/matrix morphology. Rubber content significantly influences the interparticle distances in thermoplastic vulcanizates (TPVs). The crystallization kinetics of iPP and its blend with nitrile rubber (NBR) has been analysed isothermally using differential scanning calorimetry (DSC). During the isothermal crystallization, relative crystallinity developed with the time dependence has been described by the Avrami equation. The crystallization temperature (T c ) was found to have a significant influence on the Avrami exponent. The crystallization half time (T 1/2 ) for the blend was found to decrease with increase in the nitrile rubber content. This confirms the increase in nucleation site for PP upon the addition of NBR. In the case of TPVs, a lower molar mass foreign substance (additives) could act as nucleation centres for crystal growth. The T 1/2 as well as the Avrami exponent (n) showed a slight increase with the increase in nitrile rubber content concentration in the blend. However, the overall kinetic rate constant seems to be influenced by the presence of the NBR phase. Tobin model for kinetics of crystallization was applied and it was found that Tobin Index is affected by rubber content. Kinetic rate constant is dependent on T c and elastomer content. The influence of physical compatibilization by the addition of graft copolymer on the crystallization process was analysed. Wide angle X-ray diffraction (WAXD) analysis proved that two-crystal forms α and β were present in the isothermally crystallised specimens. Dynamic vulcanization promotes α-crystals. Crystallinity values calculated from WAXD measurements showed that NBR addition does not influence the overall crystallinity of the blend. The result of this chapter has been submitted to Rubber chemistry and technology for publication.

Welcome message from author
This document is posted to help you gain knowledge. Please leave a comment to let me know what you think about it! Share it to your friends and learn new things together.
Transcript

Chapter 10
Isothermal Crystallization Kinetics of Acrylonitrile Butadiene Rubber/Polypropylene Blends
Abstract
The phase morphology of polypropylene/acrylonitrile butadiene rubber (PP/NBR) blends were analysed using scanning electron microscopy (SEM) and atomic force microscopy (AFM). The uncompatibilized 60/40 NBR/PP blend showed a co-continuous morphology. Dynamic vulcanisation transformed the co-continuous phase morphology to particle/matrix morphology. Rubber content significantly influences the interparticle distances in thermoplastic vulcanizates (TPVs). The crystallization kinetics of iPP and its blend with nitrile rubber (NBR) has been analysed isothermally using differential scanning calorimetry (DSC). During the isothermal crystallization, relative crystallinity developed with the time dependence has been described by the Avrami equation. The crystallization temperature (Tc) was found to have a significant influence on the Avrami exponent. The crystallization half time (T1/2) for the blend was found to decrease with increase in the nitrile rubber content. This confirms the increase in nucleation site for PP upon the addition of NBR. In the case of TPVs, a lower molar mass foreign substance (additives) could act as nucleation centres for crystal growth. The T1/2 as well as the Avrami exponent (n) showed a slight increase with the increase in nitrile rubber content concentration in the blend. However, the overall kinetic rate constant seems to be influenced by the presence of the NBR phase. Tobin model for kinetics of crystallization was applied and it was found that Tobin Index is affected by rubber content. Kinetic rate constant is dependent on Tc and elastomer content. The influence of physical compatibilization by the addition of graft copolymer on the crystallization process was analysed. Wide angle X-ray diffraction (WAXD) analysis proved that two-crystal forms α and β were present in the isothermally crystallised specimens. Dynamic vulcanization promotes α-crystals. Crystallinity values calculated from WAXD measurements showed that NBR addition does not influence the overall crystallinity of the blend.
The result of this chapter has been submitted to Rubber chemistry and technology for publication.

278 Chapter 10
10.1. Introduction
The development of commercial TPE is of tremendous industrial
importance. Its use in the automotive industry has resulted in improved
bumper systems. This class of materials consists of blends of polypropylene
(PP) with rubber. The inclusion of rubber could modify the properties of the
polypropylene. [1]. It is well understood that the physical, chemical and
mechanical properties of the crystalline polymers depend on the morphology,
the crystalline structure and degree of crystallization. In order to control the
rate of the crystallization and the degree of crystallinity and to obtain the
desired morphology and properties, a great deal of effort has been taken to
study the crystallization kinetics and change in the material properties [2,3].
Compared with the conventional rubbers, TPEs have commercial
advantages because they can be processed on thermoplastic machinery and
require no separate vulcanization stage. The most significant advantage is that
TPEs can be recycled [4]. TPEs also give higher output rates in injection molding
and extrusion than the conventional elastomers. With these advantages
thermoplastic elastomers are currently finding markets in many applications
where vulcanized rubbers have been traditionally used [5].
The physical properties of semi-crystalline based polymeric materials
strongly depend on their microstructure and crystallinity, because failure of
the materials takes place at the microscopic level. The crystalline form can be
obtained by slowly cooling the melt or by isothermal crystallization at a
temperature between the crystalline melting point and the glass transition
temperature. From this point of view, the crystallization kinetics of isotactic
polypropylene (iPP) has been widely studied by different methods. Isothermal
crystallization kinetics, in general, has been well described by the Avrami

Isothermal Crystallization Kinetics of NBR/PP TPEs 279
equation [6–17] though it is limited when used to describe the crystallization
of TPE that having a commercial potential. The topics of TPEs from
rubber/plastic blends have been extensively reported in the literature for the
last 25 years [18-26].
Blends of PP and NBR possess the oil resistant properties of NBR and
the excellent procesability and mechanical properties of polypropylene.
However these blends are incompatible with poor physical and chemical
interactions across the phase boundaries. Hence the system requires
compatibilization to improve the properties. The effect of phenolic-modified
polypropylene and maleic anhydride modified polypropylene as
compatibilizers on the properties of PP/NBR blend was investigated [27,28].
This chapter deals with the effect of blend composition, compatibilization and
dynamic vulcanisation on the isothermal crystallization behaviour of these
blends and TPVs at various Tcs. Attempts have also made to predict the
crystallisation mechanism using Avrami and Tobin approach. The morphology
of the system was examined as a function of rubber content using AFM and
SEM.
10.2. Isothermal crystallization- Theoretical approach
Overall crystallization of semi-crystalline polymers involves two main
processes: primary and secondary crystallization. Primary crystallization
relates to macroscopic development of crystallinity as a result of two
consecutive microscopic mechanisms: primary and secondary nucleation (i.e.
subsequent crystal growth). Formation of chain folded lamellae leads to
further growth of the lamellae through the processes of branching and splaying
[13]. The primary crystallization is assumed to cease when no additional
molecular stems can transport onto a growth face. This may be due to the

280 Chapter 10
impingement of the crystalline aggregates onto one another. Secondary
crystallization refers to any process that leads to further increase in
crystallinity (after the closure of the primary crystallization process). Two
important processes are envisaged: (a) crystal perfection and/or thickening
of the primary lamellae; and (b) formation of secondary lamellae from
crystallizable melt trapped between two different lamellae in the same
stack (i.e. inter-lamellar crystallizable melt) or between two different stacks
of lamellae (i.e. interfibrillar crystallizable melt). The thickening
mechanism is thermodynamically driven by the reduction of the specific
surfaces of the crystals (hence less free energy spent for the formation of
surfaces), but is hampered by the kinetics factors (e.g. molecular mobility).
Even though it is clear that secondary lamellae have to somehow originate
from either inter-lamellar or inter-fibrillar crystallizable melt (or both)
trapped within the crystalline aggregates (e.g. axialites, spherulites, etc.)
[15-17] after their impingement, the mechanisms by which the formation of
the secondary lamellae formed are uncertain and are still matters of
ongoing research [29-33].
Several models have been proposed to study crystallization kinetics of
semicrystalline polymers (34-43). Avrami and Tobin models were found to be
most satisfactory in describing the experimental data therefore only these two
macro-kinetic models were applied to describe the experimental data in the
present chapter.

Isothermal Crystallization Kinetics of NBR/PP TPEs 281
10.3. Results and Discussion
10.3.1. Morphology
10.3.1.1. Effect of blend ratio
SEM micrographs shows the morphology of the uncrosslinked blends.
Figures 10.1a-b, where figure 10.1a showing NBR/PP 30/70 and 10.1.b shows
the 60/40 blend. NBR/PP 30/70 blend system, exhibits a dispersed NBR phase
in continuous PP matrix.
a) b)
10.1 a) SEM images of NBR/PP 30/70 1 b) 50/50 blend, NBR phase was etched using chloroform from the faces of cryogenically cut specimens.
Here the NBR phase was selectively extracted using aniline. From these SEM
micrographs we could observe that, when the NBR content increases dispersed
phase morphology changed to a co-continuous morphology. And it is shown in
figure 10.1b.
10.3.1.2. Influence of dynamic vulcanisation
AFM phase images of cross-linked blends (TPVs) having various
blend ratios are shown in figures 10.2a-c, where 10.2a belongs to NBR/PP
50/50, 2b belongs to 60/40 and 10.2c to 70/30. In these systems the cross-
linked NBR phase is dispersed in the PP matrix. The dark phase belongs to the

282 Chapter 10
cross-linked NBR phase and the brighter part of the micrograph belongs to the
PP phase.
a) b) c)
10.2 a-c) AFM images of TPVs from NBR and PP. a) NBR/PP 50/50 b) NBR/PP 60/40 c) NBR/PP70/30.
As the amount of NBR in the TPVs increases, the continuous PP phase
becomes narrow. This is clear from the atomic force micrographs 2a-c. In the
case of dynamic vulcanisation the number of the cross-linked rubber particles
increases with increase in rubber content of the blend. Also it could be seen
from the AFM micrograph that submicron PP domains were entrapped in the
cross-linked NBR phase. It can also be noted that elongated continuous ribbon
of NBR phase could be seen.
10.3.2. Crystallization behaviour
10.3.2.1. Effect of blend ratio: Uncompatibilized TPEs
Young and Lovell [44] has defined crystallization as the process by
which an ordered structure is produced from a disordered phase such as a melt.
The crystallization proceeds in two steps: nucleation and crystal growth.
Theoretical values of ‘n’ and the isothermal rate constant ‘k’ for different
morphologies and nucleation mechanism [45,46] is given in section 5.2.
(Table 5.1.). Nucleation is either homogeneous or heterogeneous. During

Isothermal Crystallization Kinetics of NBR/PP TPEs 283
homogeneous nucleation, nuclei are formed randomly throughout the melt,
whereas during heterogeneous nucleation the crystals grow from inclusions
such as impurities, fillers and fibers. Tc and cooling rate dominantly influence
the nucleation mechanism [47]. Heterogeneous mechanism is dominant at
lower cooling rate, where as homogeneous nucleation takes place at higher
cooing rate.
Fig. 10.3. Effect of blend ratio on the isothermal crystallization of PP/NBR blends crystallized at 120ºC.
Effect of blend ratio on the isothermal crystallization behavior of pure
iPP and its blend at 120°C is shown in figure 10.3. It could be seen that as the
amount of rubber content increases, the crystallization peak becomes narrow
and the process completes much faster. PP crystallized at 120ºC shows a
broader peak among them.
10.3.2.2. Influence of compatibilization and dynamic vulcanization
Influence of compatibilization and dynamic vulcanization on the
isothermal crystallization of PP/NR 40/60 TPEs and TPVs crystallized at
0 2 4 6 8 10
Hea
t flo
w (W
/g)
Time (min)
PP120 NBR/PP 10/90 NBR/PP 20/80 NBR/PP 30/70 NBR/PP 60/40

284 Chapter 10
120ºC are shown in figure 10.4. It is clear from figure 10.4.a. The narrowing
of the width of the crystallization peak confirms that compatibilization simply
enhances the crystallization rate.
a) b)
Fig.10.4. a) Effect of compatibilization and dynamic vulcanisation on the isothermal crystallization of PP/NBR blends crystallized at 120ºC. b) Isothermal crystallization behaviour of PP and TPVs having various rubber contents. All the samples were crystallized at 120ºC.
Compatibilizer could act as nucleation centres for the crystallization or
compatibilizer could act as plasticizer and it could accelerate the mobility of the
chains. Effects of blend ratio and dynamic vulcanization on the isothermal
crystallization of NBR/PP TPVs crystallized at 120ºC were shown in figure 10.4.b.
Dynamic cross-linking further enhances the crystallization. Goossens et.al. and
Huang et. al. recently reported that these heterogeneities are residues of catalyst,
impurities, incomplete melted crystallites or solvent. (48, 49)
10.3.2.3. Isothermal crystallization-Avrami approach
Experimental data and values predicted using Avrami’s model is
shown in figures 10.5a-c. The symbols and the lines represent experimental
and thermal predictions respectively.
0 2 4 6 8 10
Hea
t flo
w (W
/g)
Time (min)
PP NBR/PP 60/40 NBR/PP 60/40 Com NBR/PP 60/40 D
0 2 4 6 8 10
Hea
t flo
w (W
/g)
Time (min)
PP NBR/PP 60/40 NBR/PP 60/40D NBR/PP 50/50D NBR/PP 70/30D

Isothermal Crystallization Kinetics of NBR/PP TPEs 285
a) b)
c)
Fig. 10.5.a-c) Evolution of the relative crystallinity and predicted data using Avrami model of PP and its blend with NBR isothermally crystallized at 120ºC. The symbols and the lines represent experimental data and predicted data. a) Effect of blend ratio. b) NBR/PP blend having a blend ratio 60/40, influence of compatibilizer and dynamic vulcanisation c) PP and TPVs of NBR and PP.
Relative crystallinity data calculated from the heat flows of
uncompatibilized blend specimen isothermally crystallized at 120ºC is shown in
figure 10.5.a Influence of compatibilization and dynamic vulcanization on the
0 2 4 6 80.0
0.2
0.4
0.6
0.8
1.0
Rel
ativ
e cr
ysta
llini
ty, X
t(%)
Time (min)
PP NBR/PP 60/40D NBR/PP 50/50D NBR/PP 70/30D
0 2 4 6 80.0
0.2
0.4
0.6
0.8
1.0
Rel
ativ
e cr
ysta
linity
, Xt (%
)
Time (min)
PP NBR/PP 10/90 NBR/PP 20/80 NBR/PP 30/70 NBR/PP 60/40
0 2 4 6 80.0
0.1
0.2
0.3
0.4
0.5
0.6
0.7
0.8
0.9
1.0
1.1
Rel
ativ
e cr
ysta
linity
,Xt (%
)Time (min)
PP NBR/PP 60/40 NBR/PP 60/40Com NBR/PP 60/40D
286 Chapter 10
relative crystallinity data of NBR/PP 40/60 blend isothermally crystallized at 120ºC
was shown in the figure 10.5.b. The influences of blend ratio and dynamic
vulcanization on the relative crystallinity data developed and predicted using
Avrami were shown in figure 10.5.c.
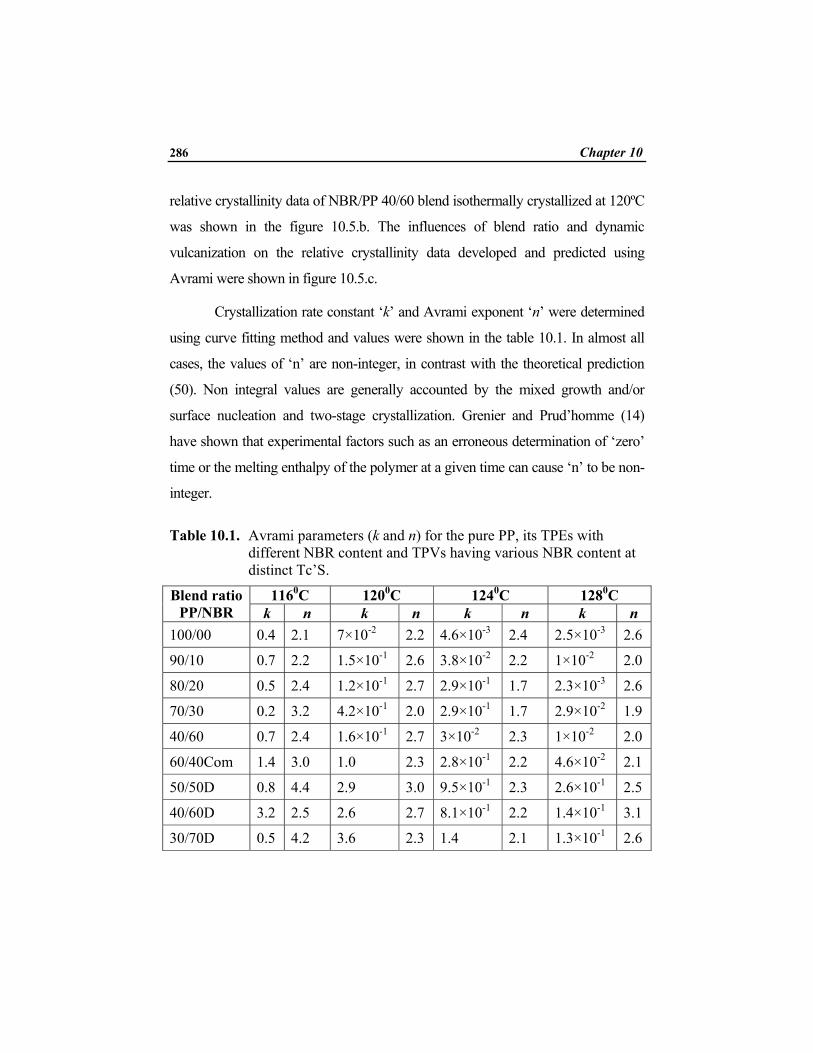
Crystallization rate constant ‘k’ and Avrami exponent ‘n’ were determined
using curve fitting method and values were shown in the table 10.1. In almost all
cases, the values of ‘n’ are non-integer, in contrast with the theoretical prediction
(50). Non integral values are generally accounted by the mixed growth and/or
surface nucleation and two-stage crystallization. Grenier and Prud’homme (14)
have shown that experimental factors such as an erroneous determination of ‘zero’
time or the melting enthalpy of the polymer at a given time can cause ‘n’ to be non-
integer.
Table 10.1. Avrami parameters (k and n) for the pure PP, its TPEs with different NBR content and TPVs having various NBR content at distinct Tc’S.
1160C 1200C 1240C 1280C Blend ratio PP/NBR k n k n k n k n
100/00 0.4 2.1 7×10⁻² 2.2 4.6×10⁻³ 2.4 2.5×10⁻³ 2.6
90/10 0.7 2.2 1.5×10⁻¹ 2.6 3.8×10⁻² 2.2 1×10⁻² 2.0
80/20 0.5 2.4 1.2×10⁻¹ 2.7 2.9×10⁻¹ 1.7 2.3×10⁻³ 2.6
70/30 0.2 3.2 4.2×10⁻¹ 2.0 2.9×10⁻¹ 1.7 2.9×10⁻² 1.9
40/60 0.7 2.4 1.6×10⁻¹ 2.7 3×10⁻² 2.3 1×10⁻² 2.0
60/40Com 1.4 3.0 1.0 2.3 2.8×10⁻¹ 2.2 4.6×10⁻² 2.1
50/50D 0.8 4.4 2.9 3.0 9.5×10⁻¹ 2.3 2.6×10⁻¹ 2.5
40/60D 3.2 2.5 2.6 2.7 8.1×10⁻¹ 2.2 1.4×10⁻¹ 3.1
30/70D 0.5 4.2 3.6 2.3 1.4 2.1 1.3×10⁻¹ 2.6

Isothermal Crystallization Kinetics of NBR/PP TPEs 287
Crystallization gets accelerated as the Tc decreases. This could be
explained on the basis that at lower crystallization temperature more nuclei got
activated and this impart more centres for macromolecular attachment leading
to faster crystallization. An increase of 12ºC (116 to 128ºC) in Tc will decrease
the rate constant by 10-3 times the value shown at 116ºC for neat PP.
Comparing the Avrami exponent shown by neat PP at different Tcs, there is
only a slight increase from 2.1 to 2.4 as the Tc increased from 116 to 128ºC.
The kinetic rate constant shown by TPEs having different elastomer content,
increases slightly even in the presence of a mass fraction of 10wt% NBR. ‘k’
value increases from 0.4 to 0.7 while the Avrami exponent ‘n’ remains same
when we compare the values for neat PP and NBR/PP 10/90 which crystallized at
116ºC. Compatibilization accelerates the rate constant ‘k’ for the crystallization
and it get doubled in the case of NBR/PP 60/40 TPEs at 116ºC and reaches a ten
times value at 120 and 124ºC. Avrami exponent shows a slight variation in its
values at lower Tcs and remains unaltered at elevated Tcs.
Dynamic vulcanisation process (sample 60/40D) increased its kinetic
rate constant value from 1.4 to 3.2 at 116ºC while the exponent shows a
substantial increase in its ‘k’ value which is associated with compatibilized
sample. In the case of TPVs, as the Tc increases from 116 to 128ºC, the ‘n’
values remain same. For the NBR/PP system kinetic rate constant calculated
using Avrami approach revealed slight increase in the presence of elastomer
and dynamic vulcanization accelerates the crystallization rate. External
additives which include the cure system could impart nucleation in the PP
phase. These could be the reason for the increased ‘k’ value for the TPEs and
TPVs. As the amount of NBR in the TPV increases, the crystallization rate
decreases for all Tcs. Avrami exponent reaches the value 3 after
288 Chapter 10
compatibilization, which means that the spherulite growth is spherical. From
the figures 10.5.a-c it could be clear that Avrami’s model suitably fits for the
PP/NR system.
10.3.2.4. Tobin’s model
Modified version of Avrami model proposed by Tobin, (eq. 2.9 in
chapter 2) is also applied for the crystallization of TPEs prepared from PP and
NBR. Tobin considered the spherulite impingement too for his updated theory
and he claimed that his method is better than Avramis’ model. Tobin index- ‘nt’
and crystallization rate constant ‘kt’ calculated using eq. 2.9 (in chapter 2) are
given in table 10.2.
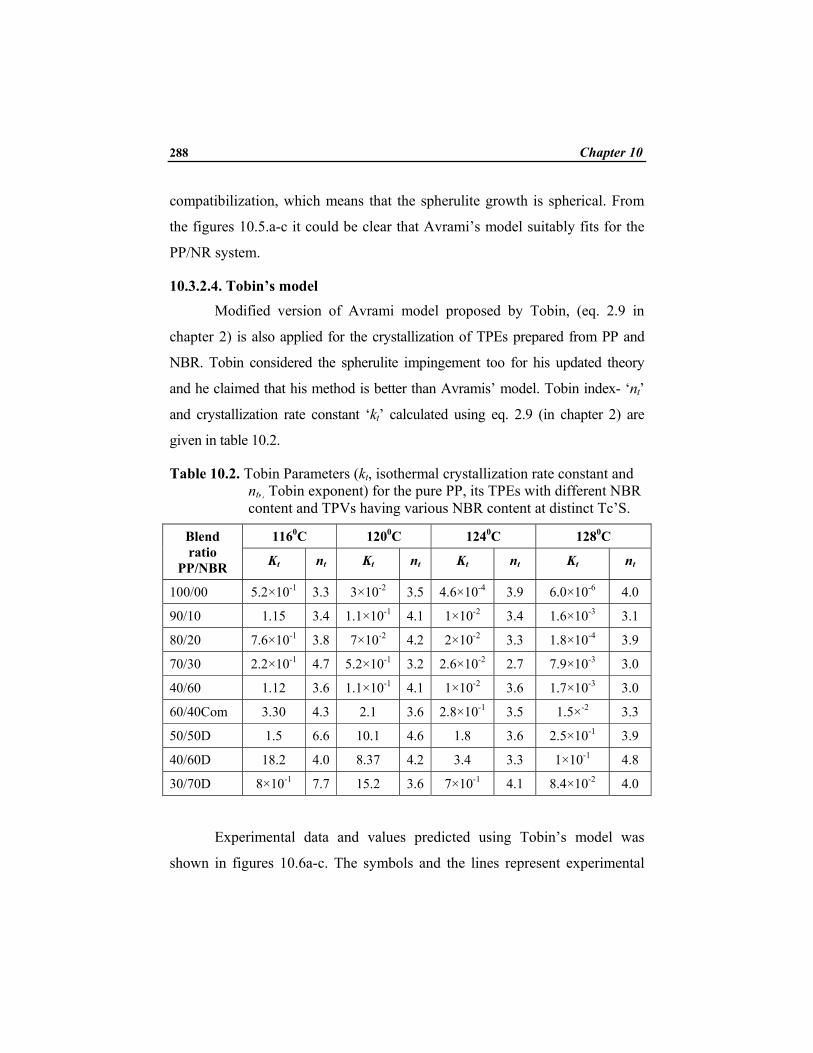
Table 10.2. Tobin Parameters (kt, isothermal crystallization rate constant and nt,, Tobin exponent) for the pure PP, its TPEs with different NBR content and TPVs having various NBR content at distinct Tc’S.
1160C 1200C 1240C 1280C Blend ratio
PP/NBR Kt nt Kt nt Kt nt Kt nt
100/00 5.2×10⁻¹ 3.3 3×10⁻² 3.5 4.6×10⁻⁴ 3.9 6.0×10⁻⁶ 4.0
90/10 1.15 3.4 1.1×10⁻¹ 4.1 1×10⁻² 3.4 1.6×10⁻³ 3.1
80/20 7.6×10⁻¹ 3.8 7×10⁻² 4.2 2×10⁻² 3.3 1.8×10⁻⁴ 3.9
70/30 2.2×10⁻¹ 4.7 5.2×10⁻¹ 3.2 2.6×10⁻² 2.7 7.9×10⁻³ 3.0
40/60 1.12 3.6 1.1×10⁻¹ 4.1 1×10⁻² 3.6 1.7×10⁻³ 3.0
60/40Com 3.30 4.3 2.1 3.6 2.8×10⁻¹ 3.5 1.5×-2 3.3
50/50D 1.5 6.6 10.1 4.6 1.8 3.6 2.5×10⁻¹ 3.9
40/60D 18.2 4.0 8.37 4.2 3.4 3.3 1×10⁻¹ 4.8
30/70D 8×10⁻¹ 7.7 15.2 3.6 7×10⁻¹ 4.1 8.4×10⁻² 4.0
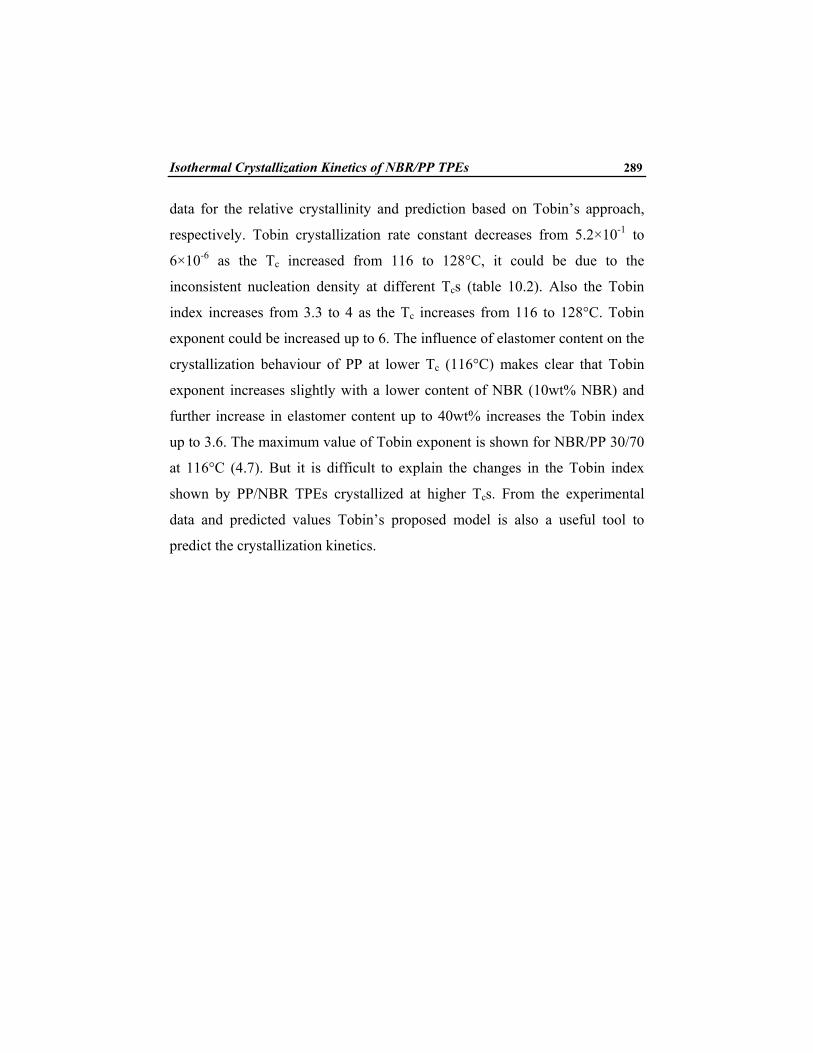
Experimental data and values predicted using Tobin’s model was
shown in figures 10.6a-c. The symbols and the lines represent experimental
Isothermal Crystallization Kinetics of NBR/PP TPEs 289
data for the relative crystallinity and prediction based on Tobin’s approach,
respectively. Tobin crystallization rate constant decreases from 5.2×10⁻¹ to
6×10⁻⁶ as the Tc increased from 116 to 128°C, it could be due to the
inconsistent nucleation density at different Tcs (table 10.2). Also the Tobin
index increases from 3.3 to 4 as the Tc increases from 116 to 128°C. Tobin
exponent could be increased up to 6. The influence of elastomer content on the
crystallization behaviour of PP at lower Tc (116°C) makes clear that Tobin
exponent increases slightly with a lower content of NBR (10wt% NBR) and
further increase in elastomer content up to 40wt% increases the Tobin index
up to 3.6. The maximum value of Tobin exponent is shown for NBR/PP 30/70
at 116°C (4.7). But it is difficult to explain the changes in the Tobin index
shown by PP/NBR TPEs crystallized at higher Tcs. From the experimental
data and predicted values Tobin’s proposed model is also a useful tool to
predict the crystallization kinetics.
290 Chapter 10
a) b)
c)
Fig. 10.6.a-c) Evolution of the relative crystallinity and predicted data using Tobin model for PP and its blend with NBR isothermally crystallized at 120ºC. The symbols and the lines represent experimental data and predicted data. a) Effect of blend ratio. b) Influence of compatibilization and dynamic vulcanization. c) Impact of blend ratio on TPVs.
Verifying the influence of compatibilization and dynamic
vulcanization using Tobin crystallization method, it could be seen that
compatibilization step up the crystallization process. In the case of NBR/PP
60/40 TPEs compatibilization accelerate the crystallization rate ten times at
0 2 4 6 8 100.0
0.2
0.4
0.6
0.8
1.0
Rel
ativ
e cr
ysta
llini
ty,X
t (%)
Time (Min)
PP NBR/PP 60/40D NBR/PP 50/50D NBR/PP 70/30D
0 2 4 6 80.0
0.2
0.4
0.6
0.8
1.0
Rel
ativ
e cr
ysta
llini
ty, X
t(%)
Time (Min)
PP NR/PP 10/90 NR/PP 20/80 NR/PP 30/70NR/PP 60/40
0 2 4 6 8 100.0
0.2
0.4
0.6
0.8
1.0
PP NBR/PP 60/40 NBR/PP 60/40Com NBR/PP 60/40D
Rel
ativ
e cr
ysta
llini
ty, X
t (%)
Time (Min)
Isothermal Crystallization Kinetics of NBR/PP TPEs 291
128°C. Dynamic vulcanization of the same blend again increases the ‘Kt’
value ten fold when compared to the value shown by the compatibilized
NBR/PP 60/40 TPEs.
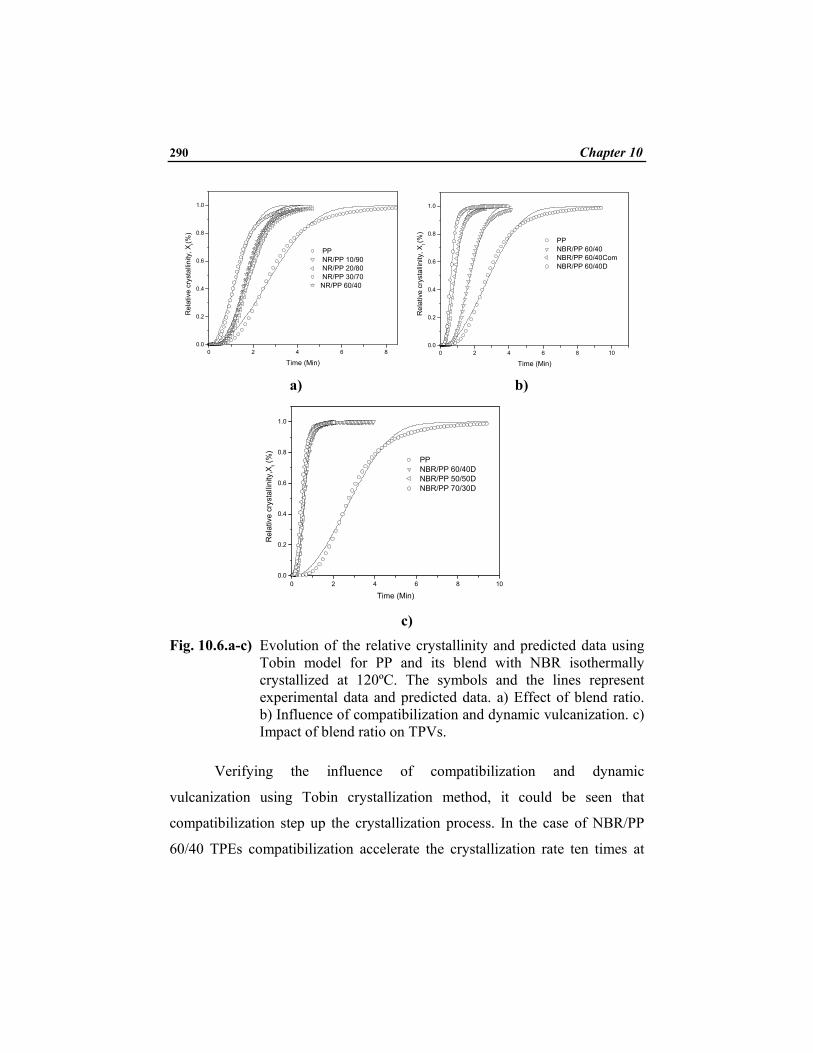
10.3.2.5. Crystallization half-time
Table 10.3. shows the crystallization half times of PP and its blends. It
could be observed that as the crystallization temperature increases, the time
taken for the completion of the half of the crystallization is also increased.
This observation is easy to explain because a higher Tc means a lower super
cooling and at this higher temperature the number of nuclei formed will be
less and hence a delayed crystallization leads to higher crystallization half
time. In the case of pure PP fifteen times increase of T1/2 is shown when the Tc
is increased from 116 to 128ºC. While considering the case of TPEs having
different elastomer content, it could be seen that the T1/2 increases with Tc.
Interestingly as the nitrile rubber content increases, T1/2 decreases. This
confirms the increase in nucleation site for PP in the presence of rubber.
Fig. 10.7. Influence of blend ratio on the half time for the crystallization (T1/2) of NBR/PP TPEs.
0 10 20 30 400
2
4
6
8
10
12
14
16
18
20
T 1/2 (m
in)
Weight percentage of NBR
116oC 120oC 124oC 128oC

292 Chapter 10
Table 10.3. T1/2 values of crystallization for the pure PP, its TPEs and TPVs having different weight percentage of NBR and its dynamic vulcanizates at different Tc’S.
Blend ratio NBR/PP
116ºC
(T1/2) min
120ºC
(T1/2) min
124ºC
(T1/2) min
128ºC
(T1/2) min
PP 1.24 2.78 7.20 18.73
10/90 1.2 1.87 3.73 8.40
20/80 1.1 1.97 3.39 9.23
30/70 1.1 1.47 1.70 5.51
60/40 0.7 1.90 3.96 8.77
60/40 Com 0.5 0.99 1.50 3.61
50/50D 0.62 0.68 0.85 1.45
60/40D 0.60 0.59 0.96 1.64
70/30D 0.6 0.53 0.72 1.89
Nitrile rubber may contain non-reacted catalytic residue or impurities.
It may act as heterogeneous nucleus for the crystallization. Graphical
representation of the influence of elastomer content on T1/2 of TPEs is shown
in figure 10.3. Influence of elastomer content on the T1/2 value is maximum at
higher Tc. At higher Tc the T1/2 value showed a maximum for PP and as NBR
content increases the T1/2 value decreases and levels off at higher NBR
content. At lower Tc the influence of rubber content is minimum and the
weight percentage of NBR does not show much influence and the curve
becomes a flat one. But compatibilization appreciably influences the T1/2

Isothermal Crystallization Kinetics of NBR/PP TPEs 293
values which is shown in table 10.3. It could be noticed that dynamic
vulcanization and compatibilization decrease the T1/2 and the effect becomes
prominent at higher temperatures. Compatibilization introduces nucleation
centres or it could accelerate the mobility of the macromolecule chains and
hence the T1/2 value diminishes. T1/2 shown by dynamically vulcanised
PP/NBR blend having a 50wt% elastomer content does not exhibit much
reduction at lower Tc. But at higher Tc, all the TPVs showed a reduction in T1/2
values. When we compare the TPEs (vulcanised) and TPVs (unvulcanised)
having the same rubber/plastic ratio we could observe that dynamic
vulcanization accelerates the crystallization and T1/2 value gets reduced. This
may be due to the fact that some of the cure system could influence the
crystallization, because during the dynamic cross-linking there is chance for
the curative to enter into the PP phase thereby causing faster crystallization
during cooling.
10.3.3. Melting behaviour of the isothermally crystallized TPEs
Melting behaviour of isothermally crystallized TPEs of NBR/PP at
different Tcs is given in figure 10.8.a Melting point of the PP remained
unchanged even after the blending and compatibilization process. Melting
behaviour of the compatibilized 60/40 NBR/PP blend is shown in figure
10.8.b. But crystallization temperature has a slight impact on the Tm of neat PP
and its TPEs. When the Tc is increased from 116 to 128ºC, Tm shows a shift of
3ºC to higher melting region because highly ordered crystals are formed due to
the isothermal crystallization at higher Tc [44,51]. Exotherms of the
isothermally crystallized TPEs having a NBR content ≤60-wt% are shown in
figure 10.8.b.
294 Chapter 10
a) b)
c)
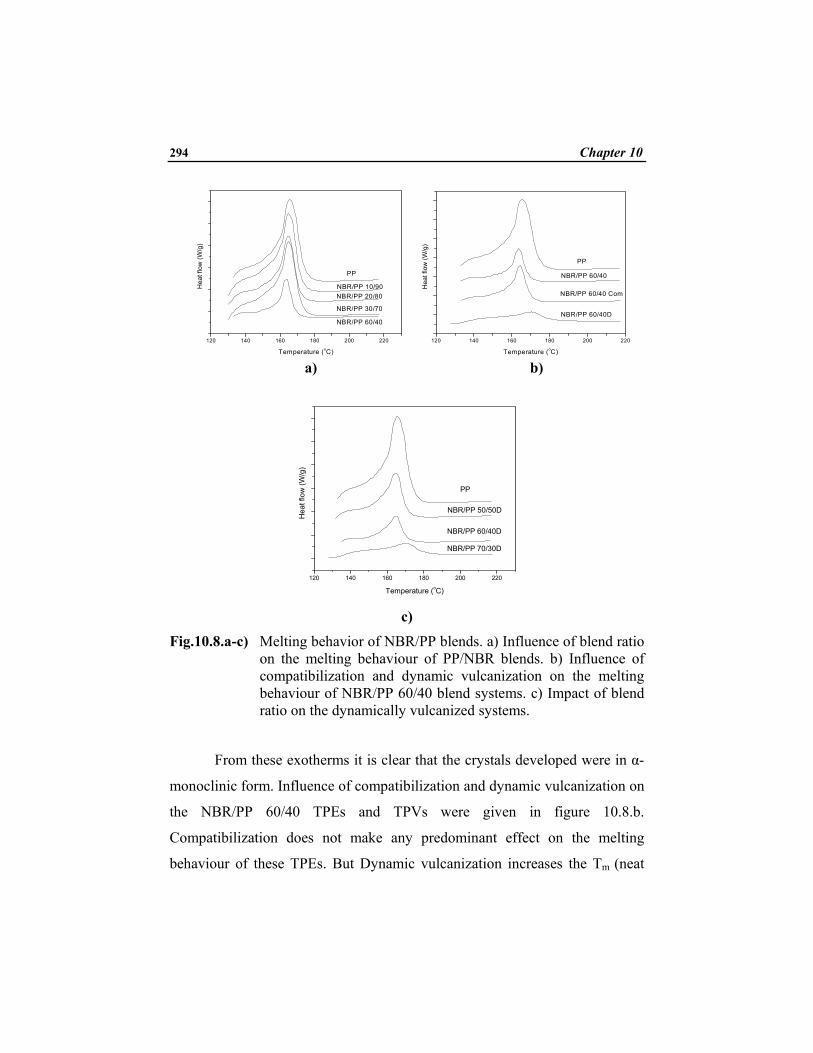
Fig.10.8.a-c) Melting behavior of NBR/PP blends. a) Influence of blend ratio on the melting behaviour of PP/NBR blends. b) Influence of compatibilization and dynamic vulcanization on the melting behaviour of NBR/PP 60/40 blend systems. c) Impact of blend ratio on the dynamically vulcanized systems.
From these exotherms it is clear that the crystals developed were in α-
monoclinic form. Influence of compatibilization and dynamic vulcanization on
the NBR/PP 60/40 TPEs and TPVs were given in figure 10.8.b.
Compatibilization does not make any predominant effect on the melting
behaviour of these TPEs. But Dynamic vulcanization increases the Tm (neat
120 140 160 180 200 220
NBR/PP 60/40
NBR/PP 30/70
NBR/PP 20/80
PP
NBR/PP 10/90Hea
t flo
w (W
/g)
Temperature (oC)
120 140 160 180 200 220
NBR/PP 60/40D
NBR/PP 60/40 Com
NBR/PP 60/40
PP
Hea
t flo
w (W
/g)
Temperature (oC)
120 140 160 180 200 220
NBR/PP 70/30D
NBR/PP 60/40D
NBR/PP 50/50D
PP
Hea
t flo
w (W
/g)
Temperature (oC)

Isothermal Crystallization Kinetics of NBR/PP TPEs 295
PP=165°C) to 170°C. Melting behaviours of TPVs with various NBR content
are shown in figure10.8c. It could be seen that only the TPV with 70 mass% of
NBR shows a difference from other TPVs.
10.3.3.1. WAXD Study
In order to determine the degree of crystallinity and the possible
formation of different possible polymorphic forms, static WAXD
measurements were performed on isothermally crystallized thin specimens.
Figures 10.9a-b represent WAXD intensities for the homopolymer PP and
TPEs having different NBR content up to 60 mass %.
a) b)
Fig.10.9.a-b) WAXD spectrum of a) neat PP and TPEs having varying NBR content, crystallized at 124ºC. b) neat PP and TPVs having varying rubber content crystallized at 124ºC.
PP having a broad amorphous background superimposed on six
distinct peaks at the same values of 2θ angles. These peaks values of 2θ are
14.05º, 16.85o, 18.45o, 21.6o and 28.65o. These correspond to the significant
peak values of α-monoclinic crystalline form of isotactic polypropylene [52].
There is a small additional peak at 15.6o on the PP curve that corresponds to
the β-hexagonal crystalline form of PP. Contribution from β-crystal forms is
0 10 20 30 40 50
NBR/PP 60/40NBR/PP 30/70NBR/PP 20/80NBR/PP 10/90iPP
Inte
nsity
(au)
2θ0 10 20 30 40
NBR/PPD70/30
NBR/PPD 60/40
NBR/PPD 50/50
PP
Inte
nsity
(au)
2θ

296 Chapter 10
clear from figure 10.9a-b. It also reveals that the β crystalline phase is almost
absent and dynamic vulcanization does not promote the growth of β crystalline
phase.
Table 10.4. Normalized percentage crystallinity of NBR/PP TPEs and TPVs calculated from WAXS analysis.
Blend ratio
NBR/PP
Xc (%)
124ºC
100/00 54
10/90 54.6
20/80 53.8
30/70 53.4
40/60D 54.2
50/50D 54
70/30D 54.1
Crystallinity values calculated from the WAXS examination is given in
table 10.4. Normalized percentage crystallinity of PP is almost unaffected by
the presence of NBR. Crosslinked elastomer phase could not influence the
ultimate crystallinity of the PP phase. Hence dynamic vulcanisation has no
influence on the final crystallinity of the TPVs. However, it could affect the
crystallization rate.
Isothermal Crystallization Kinetics of NBR/PP TPEs 297
10.4. Conclusions
Morphology of the unvulcanised (TPEs) and the vulcanised (TPVs)
blends were analysed using SEM and AFM. Dispersed morphology is shown
at lower concentration of the NBR where NBR is in the dispersed in PP
matrix. A co-continuous morphology is shown by NBR/PP 60/40 TPEs. Phase
inversion is observed due to the dynamic vulcanization. Melting and
crystallization behaviour of blends are analysed using DSC. TPEs and TPVs
were analysed using Avrami’s and Tobin’s theoretical approaches.
Crystallization rate constant calculated using Avrami method has shown that
blend ratio has only slight influence on the ‘k’ value. Compatibilization
predominantly influences crystallization rate of the TPEs. Compatibilization
increases the ‘k’ value in the case of NBR/PP 60/40 TPEs. Dynamic
vulcanization increases the rate constant for the crystallization. Only a slight
influence is shown by the NBR content on the ‘k’ value shown by TPVs. The
‘n’ value shown by the TPEs and TPVs prove that crystallization were taken
place due to the heterogeneous nucleation. Most of the values shown by
Avrami exponent are in between 2-3 and hence the crystal growths were in
spherical in dimension.
Tobin’s theoretical approach is also used for calculating the
crystallization rate constant and Tobin exponent. The Kt value for the
uncompatibilized TPEs shows that blend ratio has only a mild influence on the
crystallization rate. Compatibilization increases the ‘Kt’ value at higher Tcs.
There is significant increase in the ‘Kt’ value calculated for the TPVs
compared to the TPEs having same NBR content. Blend ratio do not have
influence on the Kt value shown by the TPVs. Tobin exponent ‘nt’ also shows
similar trend like the values shown by ‘Kt’.

298 Chapter 10
For the compatibilized TPEs, T1/2 value reduced to half of its value
observed for uncompatibilized blends at higher Tc s. Dynamic vulcanization
further reduces the T1/2 values compared to the uncompatibilized and
compatibilized blends. Blend ratio has no further influence on the T1/2 values
shown by the TPVs.
WAXD measurements prove that dynamic vulcanization promotes the
growth of α-crystals which are present in TPEs and absent in TPVs. Xc values
calculated from WAXD measurements prove that overall crystallinity is
unaffected by the compatibilization and dynamic cross-linking even though
there is significant influence on the rate of crystallization. Melting behaviour
of the TPEs and TPVs were almost unaffected by changing the NBR content
and dynamic vulcanization.
Isothermal Crystallization Kinetics of NBR/PP TPEs 299
10.5. References
1. Witold B and Nandika AD, Henryk G and Ramamurthy AC, Polym.
Eng. Sci. 1996: 36; 8.
2. Lu XF, Hay JN, Polym. 2001: 42; 9223.
3. Di Lorenzo ML, Silvestre C. Prog. Polym. Sci. 1999: 24; 917.
4. Camphell DS, Elliot DJ, Wheelans MA, NR Technol. 1978: 9; 21.
5. Varghese S, Alex R, Kuriakose B, J. Appl. Polym. Sci. 2004: 92; 2063.
6. Hoshino S, Meinecke E, Power J, Stein RS, Newman S. J. Polym. Sci.
Part 1 1965: 3; 3041.
7. Pratt CF, Hobbs SY. Polymer 1976: 17; 12.
8. Martuscelli E, Pracella M, Volpe GD, Greco P, Makromol Chem.
1984: 185; 1041.
9. Janimak J, Cheng S, Zhang A, Hsieh E, Polymer 1992: 33; 728.
10. Varga J, Karger-Kocsis J, editor. Polypropylene, vol. 1. London:
Chapman and Hall 1995. chap. 3.
11. Galeski A, Karger-Kocsis J, editor. Polypropylene, vol. 1. London:
Chapman and Hall 1995. Chap. 4.
12. Avrami M, J. Chem. Phys. 1939: 7; 1103.
13. Avrami M, J. Chem. Phys. 1941: 9; 117.
14. Grenier D, Prud’homme RE. J. Polym. Sci: Polym. Phys. Ed, 1980: 18;
1655.
15. Avalos F, Lopez-Manchade MA, Arroyo M. Polym. 1996: 37; 5681.

300 Chapter 10
16. Mandelkern L, Quinn FA; J. Appl. Phys. 1954: 25; 830.
17. Simon FT, Rutherford JM. J. Appl. Phys. 1964: 35; 82.
18. George S, Ramamurthy K, Anand JS, Groeninckx G, Varughese KT,
Thomas S, Polym. 1999: 40; 4325.
19. Thomas S, Groeninckx G, Polym. 1999; 40: 5799.
20. Oderkerk J, Groeninckx G, Polym. 2002; 43: 2219.
21. Walker RM, Hand Book of Thermoplastic Elastomers, Van Nostrand
Reinhold, New York 1979.
22. West JC and Cooper SL, Science and Technology of Rubber, edited by
Eirich FR Academic New York, Ch. 13, 1978.
23. Whelan A and Lee KS, Development in Rubber Technologies,
Thermoplastic Rubbers, Applied Science London 1982.
24. Oderkerk J, de Schaetzen G, Goderis B, Hellemans L, Groeninckx G,
Macromolecules 2002: 35; 6623.
25. Coran AY, Patel R, Williams D, Rubber Chem. and Techn. 1982: 55,
4;1063.
26. Toki S, Igors Sics, Burger C, Fang D, Liu L, Hsiao BS, Datta S, and
Tsou AH, Macromolecules 2006: 39; 3597.
27. George S., Joseph R., Varughese KT., Thomas S., Polymer 1995:
36,23; 4405.
28. Coran AY. and Patel R., Rubber Chem. Technol. 1983: 56; 1045.
29. Taguchi K, Miyaji H, Izumi K, Hoshino A, Miyamo Y, Kokawa R.
ACS-PMSE Prepr. 1999: 81; 308.
Isothermal Crystallization Kinetics of NBR/PP TPEs 301
30. Verma R, Marand H, Hsiao B, Macromolecules 1996: 29; 7767.
31. Marand H, Alizadeh A, ACS-PMSE Prepr. 1999: 81; 238.
32. Anderson K.L., Goldbeck-Wood G., Polym. 2000: 41; 8849–8855
33. Yoshiko O, Hajime F, Nobuaki T, Go Matsuba, Koji N, and Toshiji K,
Macromol. 2006: 39; 7617.
34. Kolmogoroff AN, Izvestiya AN, USSR, Ser. Math. 1937:1;355.
35. Johnson WA, Mehl KF, Trans Am Inst Mining Met. Eng. 1939: 135;
416.
36. Avrami M, J. Chem. Phys. 1939: 7; 1103.
37. Avrami M, J. Chem. Phys. 1940: 8; 212.
38. Avrami M, J. Chem. Phys. 1941: 9; 177.
39. Evans UR, Trans Faraday Soc. 1945: 41; 365.
40. Tobin MC, J. Polym. Sci, Polym. Phys. 1974: 12; 399.
41. Tobin MC, J. Polym. Sci., Polym. Phys. 1976: 14; 2253.
42. Tobin MC, J. Polym. Sci., Polym. Phys. 1977: 15; 2269.
43. Malkin AY, Beghishev VP, Keapin IA, Bolgov SA, Polym. Engng.
Sci., 1984: 24; 1396.
44. Young RJ and Lovel PA, Introduction to Polymers, Chapman and Hall,
London, 1991.
45. Hammami A and Spruiell JE, Polym. Eng. and Sci. May 1995: 35;
797.

302 Chapter 10
46. Jungang Gao, Dong Wang, Maoshang Yu, Zihua Yao, Journal of Appl.
Polym. Sci. 2004: 93; 1203.
47. Rabiej S, Eur. Polym. J. 1991: 27; 947
48. Goossens S and Groeninckx G, Macromolecules 2006: 39; 8049-8059,
49. Weihuan H, Chunxia L, Binyao L, and Yanchun H, Macromol 2006:
39; 8075.
50. Qipeng G and Groeninckx G, Polym 2001: 42; 8647.
51. Cho CR, and Lee KH, Plym. Eng. Sci. 1991: 31; 1009.
52. Liangbin Li, Ling Zhang, Journal of Polym. Sci. Part B: Polym. Phys.
2006: 44; 1188.
Related Documents