lsotactic Polypropylene Solidification Under Pressure and High Cooling Rates. A Master Curve Approach 'V. LA CARRUBBA, w. BRUCATO, and 'S. PICCAROL0 'D.I.C.P.M., Unwersita di Palem Viale delle Scienze - I-901 28-Palerm0, Italy 2D.I.C.A., Uniuersita di Salem Via Ponte don Me&, 84084 %Ciano @A), IMy Solidification in industrial processes very often involves flow fields, high thermal gradients and high pressures: the development of a model able to describe the PO@- mer behavior becomes complex. Recently a new equipment has been developed and improved to study the crystallization of polymers when quenched under pressure. An experimental apparatus based on a modified, special injection moulding ma- chine has been employed. Polymer samples can be cooled at a known cooling rate up to 100°C/s and under a constant pressure up to 40 ma. Density, Micro Hard- ness (MH), Wide angle X-ray diffraction (WAXD), and annealing measurements were then used to characterize the obtained sample morphology. Results on one iPP sample display a lower density and a lower density dependence on cooling rate for increasing pressure. Micro hardness confirms the same trend. A deconvolution technique of WAXD patterns is used to evaluate the final phase content of samples and to assess a crystallization kinetics behavior. A master curve approach to ex- plain iPP behavior under pressure and high cooling rates was successfully applied on density results. On the basis of this simple model it is possible to predict the final polymer density by superposition of the effect of cooling rate and the effect of pressure in a wide range of experimental conditions. 1. INTRODUCTION recognized, as witnessed bv the amount of research ormal techniques industrially employed to obtain N polymeric products are very often carried out under high pressures, high coollng rates and a flow field. Thus, an investigation of polymer solidification under processing conditions turns out to be complex owing to the need for complex modeling and to the large variety of parameters that necessarily have to be accounted for. Nevertheless it is easy to understand that, the effect of process conditions on: morphology and properties of the sample obtained, is a crucial point in plastic materials characterization. An accu- rate model describing these relationships would allow one to predict the final product properties if the mate- rial properties and the processing conditions are known. As a matter of fact, the main purpose of re- search in this field is to design and obtain polymeric products matching the required properties. As for the kinetics associated with polymer solidification, the im- portance of crystallization kinetics has been widely workv devoted to this topic (i-5). The complexity of the phenomenon, however, requires separate studies of the influence of flow, pressure and temperature on crystallization kinetics as well as cross experiments. Moreover, the majority of studies at high pressure have concentrated on one polymer, polyethylene, deal- ing with the formation of extended chain crystals (6-12). The pressure values used for such investiga- tions are extremely high (typically 5 kbar) relative to the pressures used by most industrial processes. Quasi-isothermalconditions are typically applied dur- ing experiments. As far as the polymer behavior under pressure is concerned, several fields of research have been ex- plored in recent years. The main purpose of the stud- ies on polymer behavior under pressure was generally to perform experiments leading to reliable PVT time dependent data for polymers. Although most of the works cover a wide pressure range (from 1 bar to sev- eral Kbars), only a few experiments have been per- 'To whom correspondence should be addressed. 2430 formed under cooling rates larger than few OC/s, owing to heat-transfer constraints imposed by the ap- paratus employed. Data presented in Term- POLYMER ENGINEERING AND SCIENCE, NOVEMBER 2O00, Vol. 40, No. 11

Welcome message from author
This document is posted to help you gain knowledge. Please leave a comment to let me know what you think about it! Share it to your friends and learn new things together.
Transcript

lsotactic Polypropylene Solidification Under Pressure and High Cooling Rates. A Master Curve Approach
'V. LA CARRUBBA, w. BRUCATO, and 'S . PICCAROL0
'D.I.C.P.M., Unwersita di P a l e m Viale delle Scienze - I-901 28-Palerm0, I taly
2D.I.C.A., Uniuersita di Salem Via Ponte don Me&, 84084 %Ciano @A), IMy
Solidification in industrial processes very often involves flow fields, high thermal gradients and high pressures: the development of a model able to describe the PO@- mer behavior becomes complex. Recently a new equipment has been developed and improved to study the crystallization of polymers when quenched under pressure. An experimental apparatus based on a modified, special injection moulding ma- chine has been employed. Polymer samples can be cooled at a known cooling rate up to 100°C/s and under a constant pressure up to 40 ma. Density, Micro Hard- ness (MH), Wide angle X-ray diffraction (WAXD), and annealing measurements were then used to characterize the obtained sample morphology. Results on one iPP sample display a lower density and a lower density dependence on cooling rate for increasing pressure. Micro hardness confirms the same trend. A deconvolution technique of WAXD patterns is used to evaluate the final phase content of samples and to assess a crystallization kinetics behavior. A master curve approach to ex- plain iPP behavior under pressure and high cooling rates was successfully applied on density results. On the basis of this simple model it is possible to predict the final polymer density by superposition of the effect of cooling rate and the effect of pressure in a wide range of experimental conditions.
1. INTRODUCTION recognized, as witnessed bv the amount of research
ormal techniques industrially employed to obtain N polymeric products are very often carried out under high pressures, high coollng rates and a flow field. Thus, an investigation of polymer solidification under processing conditions turns out to be complex owing to the need for complex modeling and to the large variety of parameters that necessarily have to be accounted for. Nevertheless it is easy to understand that, the effect of process conditions on: morphology and properties of the sample obtained, is a crucial point in plastic materials characterization. An accu- rate model describing these relationships would allow one to predict the final product properties if the mate- rial properties and the processing conditions are known. As a matter of fact, the main purpose of re- search in this field is to design and obtain polymeric products matching the required properties. As for the kinetics associated with polymer solidification, the im- portance of crystallization kinetics has been widely
workv devoted to this topic (i-5). The complexity of the phenomenon, however, requires separate studies of the influence of flow, pressure and temperature on crystallization kinetics as well as cross experiments. Moreover, the majority of studies at high pressure have concentrated on one polymer, polyethylene, deal- ing with the formation of extended chain crystals (6-12). The pressure values used for such investiga- tions are extremely high (typically 5 kbar) relative to the pressures used by most industrial processes. Quasi-isothermal conditions are typically applied dur- ing experiments. As far as the polymer behavior under pressure is
concerned, several fields of research have been ex- plored in recent years. The main purpose of the stud- ies on polymer behavior under pressure was generally to perform experiments leading to reliable PVT time dependent data for polymers. Although most of the works cover a wide pressure range (from 1 bar to sev- eral Kbars), only a few experiments have been per-
'To whom correspondence should be addressed.
2430
formed under cooling rates larger than few OC/s, owing to heat-transfer constraints imposed by the ap- paratus employed. Data presented in Term-
POLYMER ENGINEERING AND SCIENCE, NOVEMBER 2O00, Vol. 40, No. 11

rsotactic Polypropylene Solidifiatwn
(13) represent an interesting source of information on PVT behavior of polymeric materials under medium cooling rates, although the experimental apparatus used raises some doubts about the possibility of ap- plying a hydrostatic pressure field on the solid.
On the other hand, many studies have concentrated on m o d e m the PVT behavior of polymeric materials, in order to predict some relevant physical properties, such as compressibility and thermal expansion coefficient (14-18) and to assess crystallization kinetics. Hieber (19) used a modified Tait equation to interpolate a series of literature-derived experimental curves of fusion and crystallization of isotactic polypropylene (iPP). He also employed the Nakamura equation in order to predict the density versus temperature isobars for semicrystalline polymers, obtaining a good match with experiments only in a few cases. Chan, Shyu and Isayev (2) used a master curve approach in order to compare polymer crystallization kinetics under isother- mal and non-isothermal conditions. Their results show that the Nakamura equation yields reliable crystalliza- tion kinetic information in a narrower range of tem- peratures than non-isothermal data alone without using any specific model. Furthermore, the existence of a master curve implies that the degree of crys- tallinity at a given set of conditions may be predicted from measurements made under different set of con- ditions, which is in agreement with most of the results presented in this paper. Douillard, Dumazet, Chabert and Guillet (4) developed a method for analyzing and comparing non-isothermal crystallization based on a modified Avrami equation. This model allows one to describe any non-isothermal process, particularly at the beginning. Verhoyen et aL (20) proposed the “consecu- tive Avrami model” for taking into account ultimate crystallinity degree, induction time and secondary crystallization which may be highly relevant for many polymers slowly crystallizing, e.g. PET; however, pres- sure effects were not investigated.
Zoller and Fakhreddine (21) and elsewhere Zoller (22) have employed a ‘GNOMIX confining fluid dilatometer in order to measure the specific volume of some semicrystalline polymers, such as iPP, PA66, PET. They found a decrease of final solid density with applied pressure during crystallization for iPP, while they noticed an increase of density with pressure for PA66 and PET. Additionally they carried out measure- ments of crystallization kinetics at high pressure for iPP. They found an increase of crystallization rate with pressure under isothermal conditions at the same un- dercooling, which appears to be in contrast with the density decrease observed under non-isothermal con- ditions. However, no plausible justification was given for such an observation.
Phillips and Tseng (3) performed isothermal experi- ments on PET crystallized under different pressure conditions up to 2 kbar, obtaining both morphological and crystallization kinetics information. They ob- served a reduction of spherulite size with pressure, with a much larger effect than the one observed in
other studies on different polymers. A crystallinity level nearly double that obtained at atmospheric pres- sure was obtained at a pressure of 1.5 kbar. It ap- pears from their results that the increase of density with pressure is a direct consequence of the applied pressure during crystallization on the possible chain configurations, since PET is a polymer with a rigid chain. The molecular flexibility may be the key to un- derstanding the different behavior displayed by iPP and PET under pressure. Other interesting PVT mea- surements have been carried out by Zoller on different LDPE grades up to 200 MPa (23). The compressibility coefficient was calculated and data were analysed by means of the Tait equation. Schneider performed PVT measurements on amorphous and atactic polymers under similar conditions (24). His results show a pressure induced shift of the glass transition temper- ature to higher temperatures. This increase of Tg with pressure is larger, the higher the Tg is at atmospheric pressure, i.e. the stiffer the polymer is.
Some other studies by Shlykova et aL (25) have con- centrated on investigating the dependence of mechan- ical properties of materials on solidification pressure for transformation processes. One relevant mechani- cal property that has been extensively studied in the last few years is microhardness, which has been shown to be a bridging parameter between the bulk properties (density, elastic modulus, yield stress) and microstructural parameters (crystal thickness and unit cell cross-section). Bale Calleja et al. (26) have carried out MH measurements on HDPE crystallized under different pressures. Their results show a large increase of microhardness when the material is crys- tallized under high pressure. Santa Cruz et al. (27) have studied the microhardness behavior of various PET grades and its relationships with microstructure, while Vanderdonckt et aL (28) have investigated the effect of molecular weight on microhardness for PET in the light of changes in morphology (crystallinity, crystal thickness). Their results show an increasing value of MH when molecular weight increases. All these works, together with many others in the same field, have widely demonstrated that microhardness measurements represent a valuable source of infor- mation from a structural point of view (26-28).
Finally, from a structural point of view, a interesting work by Rastogi, Newmann and Heller appeared re- cently (29, 30). They investigated the effect of pressure on poly(4-methyl-pentene- 1) crystallization by X-ray diffraction leading to a temperature-phase diagram. A re-entrant amorphization of the polymer at increasing pressure is shown which agrees with results pre- sented in this work, i.e. a possible shift of the alpha- smectic transformation conditions to lower cooling rates induced by a pressure increase.
The present investigation provides information on crystallization kinetics under pressure. Indeed non- isothermal crystallization behavior can be determined as a function of the applied pressure. For this pur- pose, a master curve approach has been successfully
2431 POLYMER ENGINEERING AND SCIENCE, NOVEMBER 2000, Vol. 40, No. 11

V. La Carmbba, V. Brucato, and S. Piccarolo
[ \Thermocouple Heated 'Mould' Cavity
Coolant Entry
(@ 6 Bar) Co%t \\ Thermocouple FVg. 1. Apparatus scheme.
applied to the density data resulting from measure- ments performed in a density gradient column after polymer solidification.
2. EXPERIMENTAL
2.1 Appontru Deecription
In the past few years, two experimental apparatuses for investigating the influence of high cooling rates at ambient and high pressures on polymer charac- teristics have been widely used and tested (31-37). The second apparatus was designed to extend the ap- proach to the typical pressures adopted in injection molding. A standard Negri Bossi NB25 injection mold- ing machine was used as a source of molten polymer supplied at a controlled pressure. Molten polymer was injected into a temperature controlled mold cavity. The experimental methodology of recording the thermal history experienced by the surface of rapidly cooled samples and then amlyzing the resulting sample mor- phology has been adopted. A special injection mold has been designed such that samples can be cooled at a known cooling rate and under a known pressure (36.37). This mold consists of a cavity, which is located in the fixed part of the injection moulding machine. The front of the cavity is sealed with a high tensile modulus, high thermal conductivity copper-beryuum 'diaphragm," which is spray cooled on the Opposite
side when the quench starts. A thermocouple set into the diaphragm close to the wall facing the polymer sample records the thermal history during cooling, while a pressure sensor mounted in the cavity allows measurement of pressure during the experiment. A schematic representation of the apparatus is shown in FQ. 1. The whole apparatus (cavity and Cu-Be dia- phragm) has been designed such that it can be set up in and removed from a standard injection molding machine as a normal injection mold tool. In order to achieve higher temperatures in the diaphragm and to increase the maximum cooling rate on the diaphragm surface, it has been necessary to thermally insulate the diaphragm by ceramic contact rings on both sides. Temperatures up to 300°C and surface cooling rate up to 100°C/s (measured at 70°C) can be attained. These limits cannot easily be overcome, since a relatively high thermal mass of the diaphragm is required owing to the high pressure applied by the molten polymer on the diaphragm. Faster cooling rates can be ob- tained only by lowering the diaphragm thermal mass (i.e. the thickness), but this, in turn, limits the maxi- mum molten polymer pressure attainable with reason- able diaphragm deformation (37). Consequently, the adopted diaphragm thicknesses used along this work represented a choice between reasonable cooling rate and workjng pressure.
POLYMER ENGINEERING AND SCIENCE, NOVEMBER 2o00, Vol. 40, No. 11 2432

Isotactic Polypropylene Solidification
2.2 Sample Preparation and Characterization
Two independent temperature control systems are
of 250°C for iPP to be controlled within the cavity. When the set temperature is reached the injection mold is clamped and the diaphragm close fits the hot cavity. After attaining a steady thermal distribution in the whole apparatus, the polymer is injected into the cavity at a small flow rate so as to ensure negligible
been filled, the pressure and the temperature are held for 30 minutes in order to minimize memory effects. Then a pressurized cooling medium is sprayed onto the external surface of the diaphragm, causing the sample to cool. During the quench, the thermal his- tory of the sample surface is recorded, as well as the
employed: a thermocouple allows the set temperature 0.9
orientation effects during filling. After the cavity has 0.895
pressure profile. In that way, the: outer layer of poly- mer facing the diaphragm is solidified at the recorded cooling rate and at the applied pressure. For the pur- poses of our work, in order to cover a wide range of cooling rates experienced by the polymer during solid- ification, two diaphragm thicknesses have been used, 3.5 and 8 mm, which correspond to two cooling rates at the polymer surface of lOO"C/s and 20"C/s, re- spectively. Cooling rate values have been evaluated at 70°C since it has been demonstrated that the cooling rate measured in this temperature interval is repre- sentative of quench effectiveness for iPP (31-34). Four different pressures (0.1. 8, 24, 40 MPa) have been tested throughout the work.
Sample morphology distribution was evaluated by means of wide-angle X-ray scattering on slices cut along directions parallel and transverse to the heat flux respectively. Density of slices cut perpendicular to the heat flux was measured in a density gradient column (whose temperature was set to 20°C) and micro hardness distribution was mapped in the same direction as the heat flux. For micro hardness mea- surements a Vickers indenter MMT-10 by Anton Paar was employed.
Density depth profiles for experiments with the 3.5 mm thick diaphragm are reported in Fig. 2; Fig. 3 re- ports density depth profiles for the experiment with the 8 mm thick diaphragm.
2.3 Heat-Tranmfer Modeling of Cooling Indde Polymer
A simple model leading to the temperature distribu- tion during unsteady cooling of the sample was ap- plied in order to gain information on cooling rate pro- files. The Fourier heat transfer equation has been solved, considering a simplified uni-axial symmetry and neglecting crystallization latent heat and trans- port and physical property changes with temperature. In a dimensionless form this equation is:
U
8' Depth, pm
0.89 0 250 500 750 loo0
Flg. 2. Density depth p r o m (diaphragm 3.5 mm thick).
where: T = temperature, OK
t = time,s
cx = k/(p*cp) thermal diffusivity, m2/s
x = depthinthesample, m
= ( To - T)/(To - T,) dimensionless temperature:
temperature: To = Initial temperature; T, = coolant
5 = x/l dimensionless depth; 1 = cavity depth:
Fo = Fourier number = a*t/12
Together with the boundary conditions:
1) When Fo = 0 then 0 = 0 V.$ (flat temperature profile before cooling):
2) For 5 = 1, dO/dk = 0 V Fo 2 0 (heat flux negligible in deep layers of the cavity)
Cooled wall boundary condition was an exponential decay of temperature according to experimental ob- servation:
3) For 5 = 0, 0 = + (Fo) = exp(- t / T ) V Fo I 0;
This last peculiar wall boundary condition leads to an analytical solution for a symmetrically cooled slab (38):
(T = exponential time constant, s)
POLYMER ENGINEERING AND SCIENCE, NOVEMBER 2o00, Vol. 40, No. 11 2433
V. La Canubba, V. Brucato, and S. Piccarol0
with: Pd = e 2 / ( a * T ) , Predvotitelev number (dimensionless
time constant) and = n/2 + n*r. In our case the resulting temperature profiles in a
thin layer of polymer very far from the slab edges have been considered in order to satisfy the uni-axial sym- metry requirement. The time constant of the decay has been obtained by a best fitting procedure on the recorded experimental data of cooling history of the diaphragm. By this procedure it is possible to predict the temperature profiles inside the samples, i.e. the temperature vs. time histories of different layers within the sample. In order to check the reliability of the model, a special experiment has been carried out by recording temperature vs. time profiles inside the sample at three different depths. These profiles have been successfully compared to those calculated by the model, as shown in a previous work (37). By means of this model it is also possible to calcu-
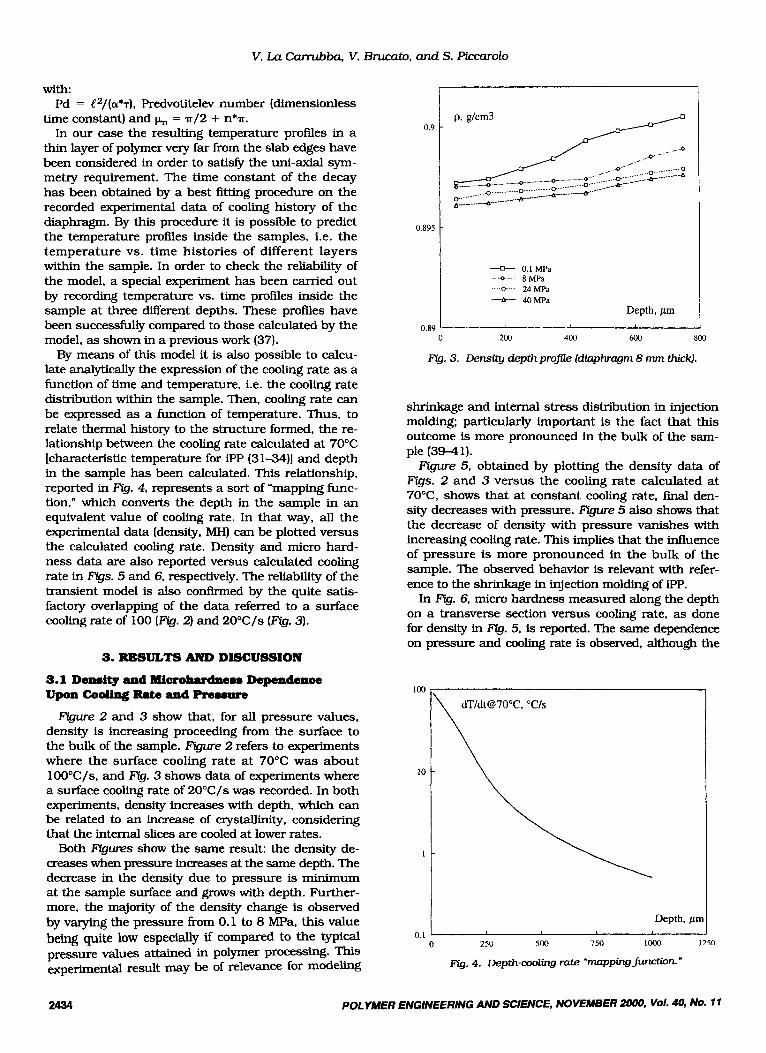
late analytically the expression of the cooling rate as a function of time and temperature, i.e. the cooling rate distribution within the sample. Then, cooling rate can be expressed as a function of temperature. Thus, to relate thermal history to the structure formed, the re- lationship between the cooling rate calculated at 70°C [characteristic temperature for iPP (3134)l and depth in the sample has been calculated. This relationship, reported in Rg. 4, represents a sort of "mapping func- tion," which converts the depth in the sample in an equivalent value of cooling rate. In that way, all the experimental data (density. MH) can be plotted versus the calculated cooling rate. Density and micro hard- ness data are also reported versus calculated cooling rate in Figs. 5 and 6, respectively. The reliability of the transient model is also confirmed by the quite satis- factory overlapping of the data referred to a surface cooling rate of 100 (Fig. 2) and 2OoC/s (Q. 3).
3. RESULTS AllTD DISCUSSION
3.1 Density and MicrohUdneu Dependence Upon Cooling Rate and Praurve
Figure 2 and 3 show that, for all pressure values, density is increasing proceeding from the surface to the bulk of the sample. Figure 2 refers to experiments where the surface cooling rate at 70°C was about lOO"C/s, and Fig. 3 shows data of experiments where a surface cooling rate of 2OoC/s was recorded. In both experiments, density increases with depth, which can be related to an increase of crystallinity, considering that the internal slices are cooled at lower rates.
Both Figures show the same result: the density de- creases when pressure increases at the same depth. The decrease in the density due to pressure is minimum at the sample surface and grows with depth. Further- more, the majority of the density change is observed by varying the pressure from 0.1 to 8 MPa, this value being quite low especially if compared to the typical pressure values attained in polymer processing. This experimental result may be of relevance for modeling
I
I 0.895
-n- 0.1 MPa 0 - 8MPa
.... O... 24 Mpa
40MPa Depth, pm
0.89 I 0 200 400 600 800
QJ. 3. Density depthpro@ kiiaphragm 8 mm thick).
shnnkage and internal stress distribution in injection molding: particularly important is the fact that this outcome is more pronounced in the bulk of the sam- ple (39-41). Figure 5, obtained by plotting the density data of
Figs. 2 and 3 versus the cooling rate calculated at 70"C, shows that at constant cooling rate, final den- sity decreases with pressure. Figure 5 also shows that the decrease of density with pressure vanishes with increasing cooling rate. This implies that the influence of pressure is more pronounced in the bulk of the sample. The observed behavior is relevant with refer- ence to the shnnkage in injection molding of iPP.
In Fig. 6, micro hardness measured along the depth on a transverse section versus cooling rate, as done for density in Rg. 5, is reported. The same dependence on pressure and cooling rate is observed, although the
100
10
1
0. I
dT/dt@7O0C, "CIS \
Depth, prr
0 250 500 750 10M) 1250
m. 4. mpth-cooling rate ' m a p p i n g m n "
2434 POLYMER ENGINEERING AND SCIENCE, NOVEMBER 2o00, Vol. 40, No. 11
Isotactic Polypropylene Solidification
p. g k m 3 0 0.IMPa 0 8MPa 0 24MPa A 40MPa
P dT/dt@70"C. "CIS
l l I I 10 100
Q. 5. Density cooling nrttepro_file.
curves at pressures above 8 Ml?a collapse on each other, which is also relevant for process simulation, especially with regard to mechanical properties.
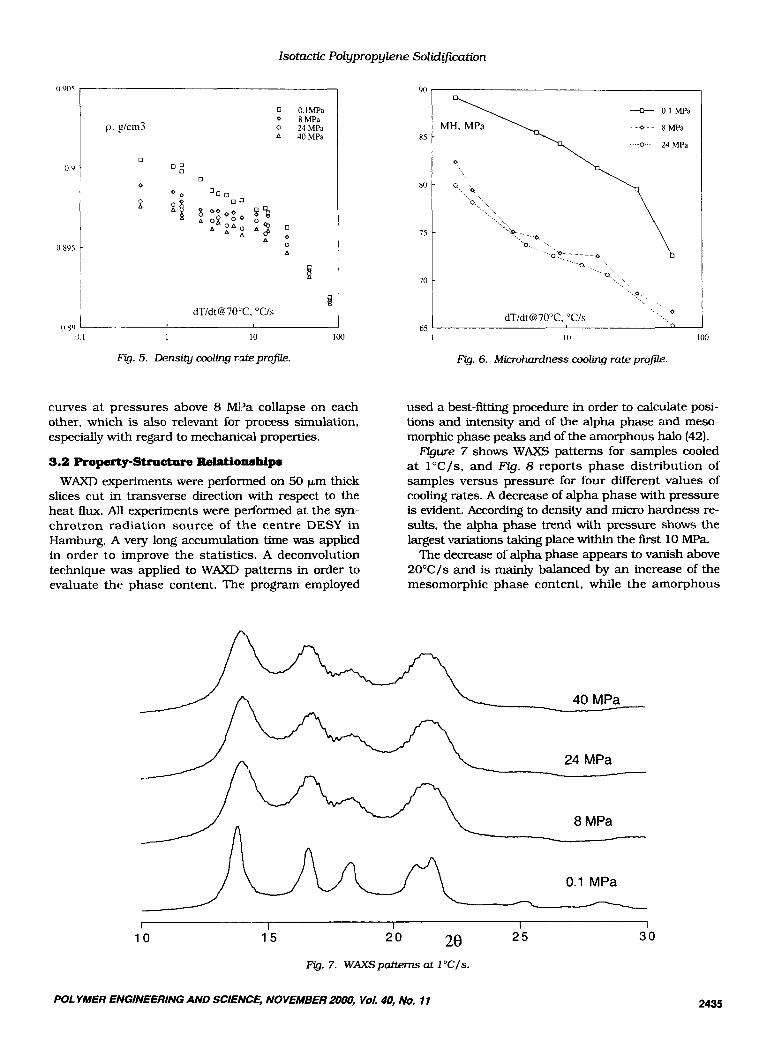
9.2 Property-Structure Relationships WAXD experiments were performed on 50 km thick
slices cut in transverse direction with respect to the heat flux. All experiments were performed at the syn- chrotron radiation source of tbe centre DESY in Hamburg. A very long accumulation time was applied in order to improve the statistics. A deconvolution technique was applied to WAXD patterns in order to evaluate the phase content. The program employed
90
85
80
75
70
65 dTldt@7O0C, "CIS
0
n I 10 I00
Fig. 6. Microhardness cooling rate profile.
used a best-fitting procedure in order to calculate posi- tions and intensity and of the alpha phase and meso- morphic phase peaks and of the amorphous halo (42).
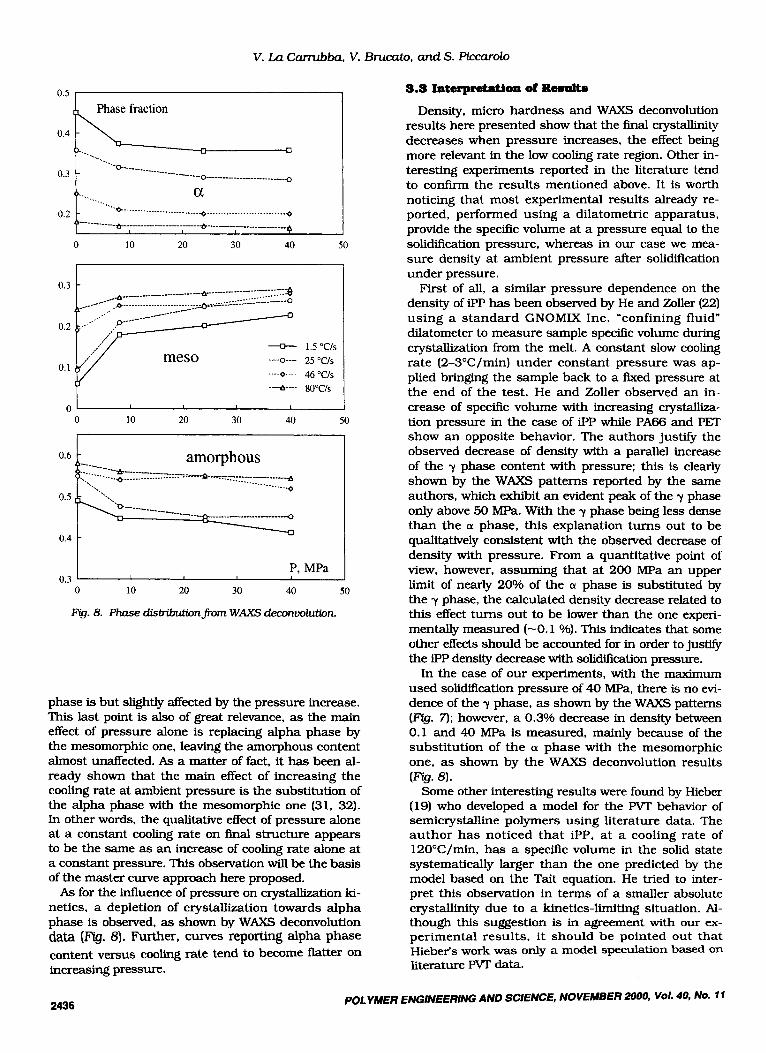
Figure 7 shows WAXS patterns for samples cooled at l"C/s, and Fig. 8 reports phase distribution of samples versus pressure for four different values of cooling rates. A decrease of alpha phase with pressure is evident. According to density and micro hardness re- sults, the alpha phase trend with pressure shows the largest variations talang place within the first 10 ma.
The decrease of alpha phase appears to vanish above 20"C/s and is mainly balanced by an increase of the mesomorphic phase content, while the amorphous
24 MPa
8 MPa
0.1 MPa
I
10 I
15 I I
25 20 2 0
Fig. 7. WAXS patterns at 1"C/s.
I 30
POLYMER ENGINEERING AND SCIENCE, NOVEMBER2000, VOI. 40, NO. 11 2435
0.5 I I
Phase fraction
...................... o------ ............ --.
0.3
....... ..- p.. a Y............ ................ 0 ............................ 0 I o.2 I---- * -A
0 10 20 30 40 50
0.3
0.2
0.1
I .5 "CIS 25 "CIS 46 "CIS 8O"Cls
0 0 10 20 30 40 50
- I amorphous ---___ ._._ -*----- ""* ..... .... ---_ --------.*-~~:--~ .................. ....... ........... "'-0
0.5
------ 0.4
P, MPa 0.3
0 10 20 30 40 50
0.8. Phase distributionJiorn WAXS deconuolution
phase is but slightly affected by the pressure increase. This last point is also of great relevance, as the main effect of pressure alone is replacing alpha phase by the mesomorphic one, leaving the amorphous content almost unaffected. As a matter of fact, it has been al- ready shown that the main effect of increasing the cooling rate at ambient pressure is the substitution of the alpha phase with the mesomorphic one (31, 32). In other words, the qualitative effect of pressure alone at a constant cooling rate on final structure appears to be the same as an increase of cooling rate alone at a constant pressure. This observation will be the basis of the master curve approach here proposed. As for the influence of pressure on crystallization ki-
netics, a depletion of crystallization towards alpha phase is observed, as shown by WAXS deconvolution data (FUJ 8). Further, curves reporting alpha phase content versus cooling rate tend to become flatter on increasing pressure.
V. La Camrbba, V. Brucato, and S. Piccarol0
2436 POLYMER ENGINEERING AND SCIENCE, NOVEMBER 2o00, Vol. 40, No. 71
3.3 Interpretation of Rmults
Density. micro hardness and WAXS deconvolution results here presented show that the final crystallinity decreases when pressure increases, the effect being more relevant in the low cooling rate region. Other in- teresting experiments reported in the literature tend to confirm the results mentioned above. It is worth noticing that most experimental results already re- ported, performed using a dilatometric apparatus, provide the specific volume at a pressure equal to the solidification pressure, whereas in our case we mea- sure density at ambient pressure after solidification under pressure.
First of all, a similar pressure dependence on the density of iPP has been observed by He and Zoller (22) using a standard GNOMIX Inc. "confining fluid" dilatometer to measure sample specific volume during crystallization from the melt. A constant slow cooling rate (2-3"C/min) under constant pressure was ap- plied bringing the sample back to a fixed pressure at the end of the test. He and Zoller observed an in- crease of specific volume with increasing crystalliza- tion pressure in the case of iPP while PA66 and PET show an opposite behavior. The authors justify the observed decrease of density with a parallel increase of the y phase content with pressure: this is clearly shown by the WAXS patterns reported by the same authors, which exhibit an evident peak of the y phase only above 50 Mpa. With the y phase being less dense than the a phase, this explanation turns out to be qualitatively consistent with the observed decrease of density with pressure. From a quantitative point of view, however, assuming that at 200 MPa an upper limit of nearly 20% of the a phase is substituted by the y phase, the calculated density decrease related to this effect turns out to be lower than the one experi- mentally measured (-0.1 O h ) . This indicates that some other effects should be accounted for in order to just@ the iPP density denease with solidification pressure.
In the case of our experiments, with the maximum used solidification pressure of 40 Mpa, there is no evi- dence of the y phase, as shown by the WAXS patterns (Rg. 7); however, a 0.3% decrease in density between 0.1 and 40 MPa is measured, mainly because of the substitution of the a phase with the mesomorphic one, as shown by the WAXS deconvolution results (Rg. 8).
Some other interesting results were found by Hieber (19) who developed a model for the PVT behavior of semicrystalline polymers using literature data. The author has noticed that iPP, at a cooling rate of 120°C/min, has a specific volume in the solid state systematically larger than the one predicted by the model based on the Tait equation. He tried to inter- pret this observation in terms of a smaller absolute crystallinity due to a kinetics-limiting situation. Al- though this suggestion is in agreement with our ex- perimental results, it should be pointed out that Hieber's work was only a model speculation based on literature PVT data.
Isotactic Polypropylene Solidification
A slightly different explanation of polymer solidifica- tion behavior under pressure has been offered by other authors who carried out an interesting investi- gation into the effect of pressure on polymer crystal- lization using X-ray diffraction (29, 30). This study produced a temperature-phase diagram for poly(4- methyl-pentene- 1). With an increase in pressure be- yond a certain threshold, the polymer, crystalline under ambient conditions, loses its crystalline order isothermally, passing through a continuously varying sequence of mesomorphic states, the process being reversible. Since this behavior is observed in two widely separated temperature regions, this suggests the possibility of a re-entrant amorphous phase. This outcome agrees with the results presented along this work, since it indicates a possible shift of the a-meso- morphic transformation conditions to lower cooling rates induced by higher pressures.
To sum up, polymer crystallization behavior under pressure and high cooling rates could be qualitatively explained on the basis of a free volume approach. Since a pressure rise leads to a lower free volume, i.e., a decrease of chain mobility, the clystallinity attained after cooling could be negatively affected by an in- creasingly si@cant diffusion control over crystalliza- tion kinetics. This observation leads also to the con- clusion that, whenever the density (or in a more detailed view, the a phase content) is low as a result of high cooling rates, the influence of pressure tends to disappear. The effect of pressure is in fact remark- able only at low cooling rates, conditions at which the
-0.104
-0.105
-0.106
-0.107
-0.108
-0.1 09
-0.1 1
-0.1 1 1
-0.1 12
a phase forms. Since high cooling rates lead to a very low a phase content, pressure does not affect material structure and, consequently, final density anymore.
Although the results of He and Zoller (22) confirm this interpretation, under different experimental con- ditions, isothermal tests, they found an increase of crystallization kinetics with pressure at the same un- dercooling. Generally speaking, experiments per- formed under isothermal conditions are made at very low undercoolings if solidification must take place during the isotherm and not during the cooling ramp to obtain isotherm conditions. Therefore, the kinetic constant calculated using these data refers to a tem- perature interval (around 130°C) that is far away from the temperature region where the maximum crystal- lization rate falls, around 70°C for iPP, where diffusion control of crystallization becomes significant. For these reasons, He and Zoller’s kinetic results, based on isothermal experiments, may not be directly com- pared to the present data obtained under high cooling rates and high undercoolings.
3.4 Analysis of Density Remults on the Basis of a Maater Curve Approach
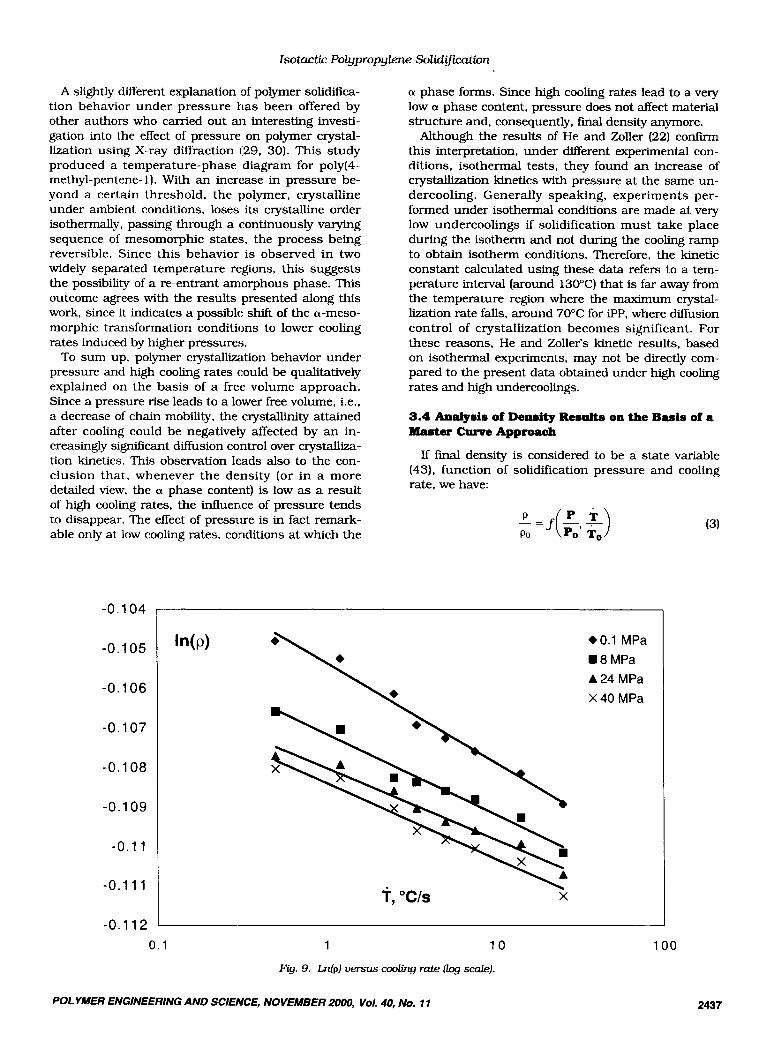
If final density is considered to be a state variable (43). function of solidification pressure and cooling rate, we have:
-=+) P P T Po Po To
(3)
X
eO.1 MPa 1 8 M P a A 24 MPa X 40 MPa
0.1 1 10
Fig. 9. M p ) versus cooling rate llog scale).
100
2437 POLYMER ENGINEERING AND SCIENCE, NOVEMBER 2000, Vol. 40, NO. 11
V. La Canubba, V. B w a t o , and S. Piccarob
-0.104
-0.105
-0.106
-0.1 07
-0.1 08
-0.1 09
-0.1 1
-0.1 11
A 7.5"CIs 0 5"CIs 0 3.4"CIs -2.5 "CIS + 1.2 "CIS
Inb)
c c A
A
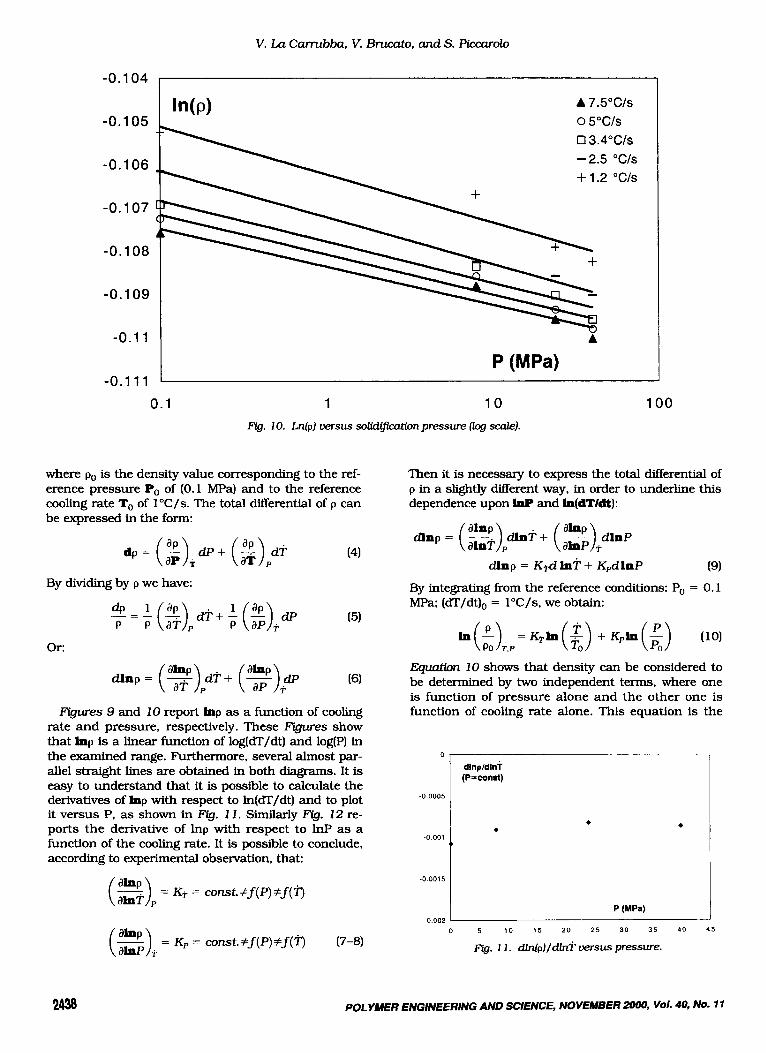
0.1 1 10 m. 10. Ln(p) versus soiidiiation pressure llog scale).
where po is the density value corresponding to the ref- erence pressure Po of (0.1 MPa) and to the reference cooling rate To of l"C/s. The total differential of p can be expressed in the form:
d p = ($)+dP+ (2) P dT (41
By dividing by p we have:
Or:
Rgures 9 and 10 report I n p as a function of cooling rate and pressure, respectively. These Flgures show that k r p is a linear function of log(dT/dt) and log(p] in the examined range. Furthermore, several almost par- allel straight lines are obtained in both diagrams. It is easy to understand that it is possible to calculate the derivatives of hrp with respect to ln(dT/dt] and to plot it versus P, as shown in Rg. I I. Similarly Fig. 12 re- ports the derivative of l n p with respect to lnP as a function of the cooling rate. It is possible to conclude, according to experimental observation, that:
(s)? = Kp = const.#f(P)#f(Q (7-8)
100
Then it is necessary to express the total differential of p in a slightly different way, in order to underline this dependence upon InP and In(dT/dt):
d l n p = ( $T)pdl~T + (*) akrP dlnP
d l n p = K& krT + K,AIUP (9)
By integrating from the reference conditions: Po = 0.1 MPa; (dT/dt], = l"C/s, we obtain:
Erpafhn 10 shows that density can be considered to be determined by two independent terms, where one is function of pressure alone and the other one is function of cooling rate alone. This equation is the
0 ,
dlnp/dlnT (P=const)
-0.0005
-0 001
-0 0015
4
P (MPa) -0.002
0 5 10 15 2 0 2 5 30 35 40 4 5
a. 11. m p J / d l n T versus pressure.
2438 POLYMER ENGINEERING AND SCIENCE, NOVEMBER 2o00, Vol. 40, No. 11
Isotactic Polypropylene Solidification
100 I 0 0002 -- - dlnpIdlnP
o ' (T=const)
-0 0002
-0 0004
-0 0006
-0 0008
0 001
T,("C/s) ~
1 0
Fg. 12. dln(ppl/dlnP versus coolug rate.
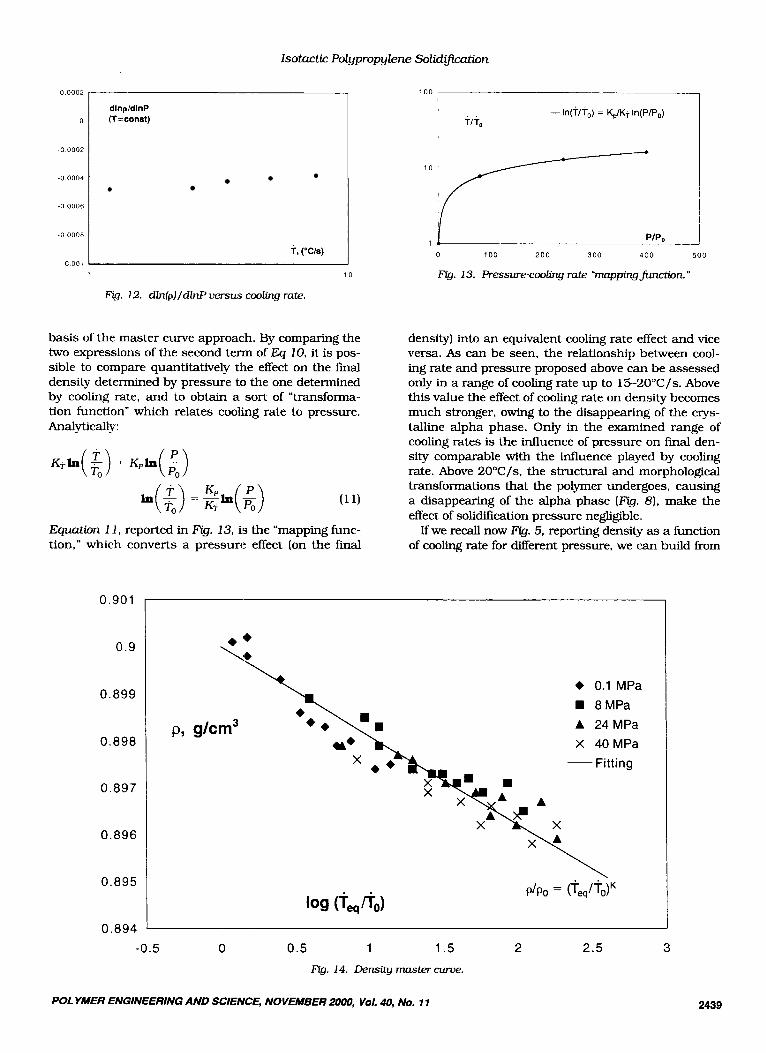
basis of the master curve approach. By comparing the two expressions of the second teim of Eq 10, it is pos- sible to compare quantitatively the effect on the final density determined by pressure to the one determined by cooling rate, and to obtain a sort of "transfonna- tion function" which relates cooling rate to pressure. Analytically:
- I n 7 ---In- (;)-: (;) Equation 1 1, reported in Fig. 13, is the "mapping func- tion," which converts a pressure effect (on the final
0.901
0.9
0.899
0.898
0.897
0.896
0.895
0.894
I - I TIT,
0 100 Z O O 300 400 5 0 0
Fig. 13. Pressure-coolug rate " m a p p i q m t i o n . "
density) into an equivalent cooling rate effect and vice versa. As can be seen, the relationship between cool- ing rate and pressure proposed above can be assessed only in a range of cooling rate up to 15-20°C/s. Above this value the effect of cooling rate on density becomes much stronger, owing to the disappearing of the crys- talline alpha phase. Only in the examined range of cooling rates is the influence of pressure on final den- sity comparable with the influence played by cooling rate. Above 2OoC/s, the structural and morphological transformations that the polymer undergoes, causing a disappearing of the alpha phase (Rg. 8). make the effect of solidification pressure neghgible.
If we recall now Rg.5, reporting density as a function of cooling rate for different pressure, we can build from
+ 0.1 MPa 8MPa
A 24MPa X 40MPa
-Fitting
P/Po =
-0.5 0 0.5 1 1.5 2 2.5 3 Flg. 14. Density master CUIve.
POL YMER ENGINEERING AND SCIENCE, NOVEMBER 2000, Vol. 40, No. 11 2439

V. La Carmbba, V. B w a t o , and S. Picccuolo
Table 1. Pressure-Cooling Rate "mapping function."
PIP, (dTIdt)I(dTIdt),
1 1 80 7.8
240 13.1 400 16.6
these diagram a master curve. For every solidification pressure we have to calculate a "shift cooling rate" by using Eq 11. Table 1 reports all the adopted solidifica- tion pressures together with the corresponding "shift cooling rates." Then it is possible to shift all curves under pressure by the factors reported in Table 1. It is easy to check that all points falls on one unique curve, as shown in Rg. 14. The X-axis of Rg. 14 is the "equivalent" cooling rate, obtained by multiplying the real cooling rate by the shift factors reported in Table 1. Analytically:
This approach suggests a simple way to express the dependence of density upon pressure and cooling rate in a wide range of operating conditions. If we have to estimate density of P P at a given dT/& and at a pres- sure P*#Po, we have to calculate the "equivalent cool- ing rate" and then read the density value reported in the master curve. The "equivalent cooling rate" is a fictitious cooling rate obtained multiplying the real cooling rate by a shift factor, function of the solidifica- tion pressure, calculated by means of the transforma- tion function. The "equivalent cooling rate" correctly accounts for real cooling rate and solidification pres- sure.
Above 20°C/s curves of density vs. cooling rate for different pressures collapse on each other, so the master curve is not valid and, consequently, density turns out to be only a function of cooling rate.
3.6 Conclamions
high cooling rate shows the following basic features: Solidification behavior of iPP under pressure and
a decrease of density (measured at 1 bar) and micro hardness with pressure is observed. This effect is clearly related to the presence of the a phase. For this reason it is more pronounced at low cooling rates, where the highest amount of (Y
phase is formed. When the cooling rate goes over 20°C/s, the a phase content tends to be very small and the influence of pressure can be con- sidered negwble.
a crystallinity content decreases on increasing pressure, owing to kinetic-limiting factors.
crystallization kinetics of a phase are clearly in- hibited by a pressure increase.
mesomorphic phase kinetics appear not to be af- fected by pressure, the final content being higher as a result of the substitution of the (Y phase; amorphous phase content seems not to be influ- enced by pressure, at least in the range of pres- sure investigated.
a "mapping function," which relates pressure and cooling rate, can be assessed on the basis of density measurements. In a well-defined range of cooling rates, an increase of pressure plays the Same role as an increase of cooling rate.
a master curve approach can be applied to de- scribe iPP behavior under pressure and cooling rate. The influence of pressure is accounted for in a "equivalent cooling rate," calculated on the basis of the pressure-coohng rate "mapping func- tion."
ACKNOWLEDGBXENTS
This work was supported by: Italian MURST 60%. and UE DECRYPO BRlTE PROJECT BFPRCT960147.
4. REFERENCES 1. G. Eder and H. Janeschitz-Kriegel, Material Science and
2. T. V. Chan, G. D. Shyu, and A. I. Isayev, Poly. Eng. Sci,
3. P. J. Phillips and H. T. Tseng, Macromolecules, 22,
4. A. Douillard. Ph. Dumazet, B. Chabert, and J. Guillet.
Techndogy, 18. H. E. M. Meijer, ed. (1997).
35, 733 (1995).
1649 (1994).
5. 6.
7.
8.
9.
10.
11.
12.
13.
14.
15.
16.
17. 18.
19.
klymer, 34, 1072 (1993). H. A. Schneider, J. Therm Anal, 47, 453 (1996). B. Wunderlich and T. Arakaw. J. Polym Sci, Part A, 2, 3697 (1964). P. H. Geil, F. R. Anderson, B. Wunderlich, and T. Arakawa, J. Polym Sci Part A. 2, 3707 (1964). M. B. Tchizmakov, M. B. Kostantinopolskaja. Yu. A
sokomoL Soed A, 18, 1121 (1976). B. Wunderlich, Macromolecular Physics, VoL 1 , Acade- mic Press, New York (1973). B. Wunderlich. Macromolecular Physics, VoL 2, Acade- mic Press, New York (1976). B. Wunderlich, Macromolecular Physics. VoL 3, Acade- mic Press, New York (1980). B. Wunderlich and T. Davison, J. Polym Sci PartA2. 7. 2043 (1969). Kenndatenfur die VerarbeitUng thennoplasti~~her K m t - stoffe, ?hermodynamik. Carl Hanser Verlag, Munich, Vi- enna (1979). V. Parekh and R. Danner, J. Polym Sci, Part B: Polym Phys., 33, 395 (1995). 0. Olabisi and R. Simha, Macromolecules, 8 , 206 ( 1975). C. Chiu, K. Liu, and J. Wei. Polym Eng. Sci, 35, 1505 ( 1995). J. W. Barlow, Polyrn Eng. Sci, 18. 238 (1978). U. kute, W. Dollhopf. and E. Liska, Colloid Pdym Sci. 254,237 (19761. C . A. Hieber, Inter. Po~merPmCeSS@l. 1%. 249 (1997).
ZU~OV, N. Ph. Bakew, N. M. KO~OV, and G. P. Belov, Vi-
2440 POLYMER ENGINEERING AND SCIENCE, NOVEMBER 2tW0, Vol. 40, No. 11
Zsotactic Polypropylene Solidification
20. 0. Verhoyen, F. Dupret, and R. Legras, Polyrn Eng. Sci,
21. P. Zoller and Y. Fakhreddine, '7hmnochim. Acta, 238,
22. J. He and P. Zoller, J. Polyrn SL, Part B: Polyrn Phys.,
23. P. Zoller. J. AppL Polyrn Sci, 23, 105 1 (1979). 24. T. Ozawa, Polymer. 12. 150 (1971). 25. T. S. Shlykova, N. M. Tchalaya, V. V. Abramov, and V.
N. Kuleznev, J. Polyn Eng., 12, 219 (1993). 26. F. J. Balta Calleja, D. R. Rueda. J. Garcia Pena, F. P.
Wolf, andV. H. Karl, J. Mater. Sci, 21, 1139 (1986). 27. C. Santa Cruz, F. J. Balta Calleja. H. G. Zachmann, N.
Stribeck, and T. Asano, J. Mater. Sci., 2B. 819 (1991). 28. C . Vanderdonckt, M. Krumova, F . J. BaltaCalleja, H. G.
Zachmann, and S. Fakirov, Colloyd Polymer Science, 270. 138 (1998).
29. S. Rastogi. M. Newmann, and A. Keller, Nature, 853 (1991)
30. S. Rastogi, M. Newmann, and A. Keller, Journal of Poly- mer Science, PartB, PolymerPhysics. 31, 125 (1993).
31. S. Piccarolo, J. Macrornol. Sci.-Phys., B31(4), 501 ( 1992).
32. S. Piccarolo, M. Saiu, V. Brucato, and G. Titomanlio, J. AppL Poly. Sci, 40, 625 (1992).
38, 1594 (1998).
397 (1994).
32. 1049 (1994).
33. V. Brucato, G. Crippa, S. Piccarolo, and G. Titomanlio, Polyn Eng. Sci, 31, 1411 (1991).
34. V. Brucato. S. F'iccarolo, and G. Titomanlio, Int. Forming Processes, 1, 35 (1998).
35. V. Brucato, S. Piccarolo, and G. Titomanlio, MacromL Chemie. Macromol. Symposia, 08, 245 (1993).
36. G. Hitchcock, V. Brucato, a n d S. Piccarolo, PPSIP- Twelfth International Annual Meeting of the PPS, 70 1, Sorrento, Italy (May 1996).
37. V. Brucato. V. La Canubba, and S. Piccarolo, Interna- tional Polymer Processing, 14 (1999).
38. A. V. Luikov, Heat and Mass 'Ransfer. MU Publishers, Moscow (1980).
39. G. Titomanlio, V. Speranza. and V. Brucato, Int. Polyrn Proc., 12, 45 (1997).
40. G. Titomanlio, S. Piccarolo, a n d G. Levati, J. Appl. Polyrn Sci. 35, 1483 (1988).
41. G. Titomanlio, A. W s , and S. F'iccarolo, Polyrn Eng. Sci 2s. 209 (1989).
42. A. Martorana, S. Piccarolo, and F. Scichilone, Macroml Chem Phys. 198. 597 (1997).
43. H. C. Ottinger, AppliedRheobgy, 9, 17 (1999).
POLYMER ENGlNEERl" AND SCIENCE, NOVEMBER 2000, Vol. 40, No. 11 2441
Related Documents


![Self-reinforcing and toughening isotactic polypropylene ...composites.utk.edu/papers in pdf/Jjiang-2018.pdftion [31,36]. During the first melt filling process (M1), once the melt](https://static.cupdf.com/doc/110x72/5f0565aa7e708231d412c255/self-reinforcing-and-toughening-isotactic-polypropylene-in-pdfjjiang-2018pdf.jpg)

