Prime Archives in Biosciences 1 www.videleaf.com Book Chapter Isolation of Flocculant-Producing Bacteria in Wastewater and its Application for Wastewater Treatment in the Mekong Delta, Vietnam Cao Ngoc Diep 1 *, Bui The Vinh 2 and Huynh Van Tien 3 1 Biotechnology R&D institute, Can Tho University, Vietnam 2 CanTho Dairy factory, Vietnam 3 KienGiang University, Vietnam *Corresponding Author: Cao Ngoc Diep, Biotechnology R&D institute, Can Tho University, Vietnam Published August 02, 2021 How to cite this book chapter: Cao Ngoc Diep, Bui The Vinh, Huynh Van Tien. Isolation of Flocculant-Producing Bacteria in Wastewater and its Application for Wastewater Treatment in the Mekong Delta, Vietnam. In: Malik Badshah, editor. Prime Archives in Biosciences. Hyderabad, India: Vide Leaf. 2021. © The Author(s) 2021. This article is distributed under the terms of the Creative Commons Attribution 4.0 International License(http://creativecommons.org/licenses/by/4.0/), which permits unrestricted use, distribution, and reproduction in any medium, provided the original work is properly cited. Summary The discharge of poorly treated effluents into the surface water such as streams, rivers and lakes had far – reaching impacts on human activities and aquatic life forms. Therefore, it needs to be cleaned to acceptable levels. For polluted water and wastewater treatments, biological methods are often preferred; in which the usage of highly efficient bioflocculants produced by flocculants

Welcome message from author
This document is posted to help you gain knowledge. Please leave a comment to let me know what you think about it! Share it to your friends and learn new things together.
Transcript

Prime Archives in Biosciences
1 www.videleaf.com
Book Chapter
Isolation of Flocculant-Producing
Bacteria in Wastewater and its
Application for Wastewater Treatment in
the Mekong Delta, Vietnam
Cao Ngoc Diep1*, Bui The Vinh
2 and Huynh Van Tien
3
1Biotechnology R&D institute, Can Tho University, Vietnam
2CanTho Dairy factory, Vietnam
3KienGiang University, Vietnam
*Corresponding Author: Cao Ngoc Diep, Biotechnology R&D
institute, Can Tho University, Vietnam
Published August 02, 2021
How to cite this book chapter: Cao Ngoc Diep, Bui The Vinh,
Huynh Van Tien. Isolation of Flocculant-Producing Bacteria in
Wastewater and its Application for Wastewater Treatment in the
Mekong Delta, Vietnam. In: Malik Badshah, editor. Prime
Archives in Biosciences. Hyderabad, India: Vide Leaf. 2021.
© The Author(s) 2021. This article is distributed under the terms
of the Creative Commons Attribution 4.0 International
License(http://creativecommons.org/licenses/by/4.0/), which
permits unrestricted use, distribution, and reproduction in any
medium, provided the original work is properly cited.
Summary
The discharge of poorly treated effluents into the surface water
such as streams, rivers and lakes had far – reaching impacts on
human activities and aquatic life forms. Therefore, it needs to be
cleaned to acceptable levels. For polluted water and wastewater
treatments, biological methods are often preferred; in which the
usage of highly efficient bioflocculants produced by flocculants

Prime Archives in Biosciences
2 www.videleaf.com
producing bacteria (FPB) were selected because low cost,
harmlessness to human and environment. In order to reduce
water pollution in fish ponds and treat wastewater piggery of
post-biogas in pig farms in the Mekong Delta, Vietnam, Protein
FPB isolates and Polysaccharide FPB isolates were isolated from
soil and water samples; identified by 16S rRNA gene
sequencing; and then investigated its characteristics and
flocculation activities. The good isolates were selected to
optimize parameters of flocculation and its applications in
treatments of the polluted water of tra-fish ponds and the
wastewater piggery of post-biogas in pig farms. Targets of the
quality of output wastewater were compared to standards of the
Regulation QCVN40 (A standard (mg/L): TSS < 50; COD < 75;
BOD5 < 30; TN < 20; Nitrite (NO2-) < 0.01; Nitrate (NO3
-) < 50;
TP < 4 and PO43-
< 6).
From the polluted water in tra-fish ponds: From 155 samples of
10 sites in the Mekong Delta, 389 FPB isolates were isolated
including 154 Protein FPB isolates and 235 Polysaccharide FPB
isolates. Among the FPB isolates, a total of the 20 isolates (10 of
Protein FPB isolates and 10 of Polysaccharide FPB isolates)
having the highest flocculating efficiency were selected to
identify, the results showed 16 strains belonged to genus
Bacillus, 2 strains belonged to genus Staphylococcus, 1 strain
was genus Arthrobacter and 1 strain was Agrobacterium,
respectively. Among the 20 isolates, the polysaccharide FPB
Agrobacterium tumefaciens strain STT37PS (optimal growth
medium: adding 1% sucrose and 5% glutamic) was selected to
treat wastewater of three-month old bronze featherback
(ThacLac) fish and ababas (RoDong) fish ponds. The quality of
treated wastewater reached the standards of Regulation QCVN40
in a short time (3 days for bio-floc stage, 2 days for Lemna
stage).
From the wastewater piggery of post-biogas in pig farms: One
hundred-nineteen (119) isolates including Protein FPB isolates
(53.85 %) and 102 Polysaccharide FPB (46.15 %) isolates were
isolated from 147 samples collected from 13 cities and provinces
in the Mekong Delta. A total of the 34 isolates (18 of Protein
FPB isolates and 16 of Polysaccharide FPB isolates) having

Prime Archives in Biosciences
3 www.videleaf.com
the highest flocculating efficiency were chosen to identify.
Among of them, all of the 18 Protein FPB isolates belonged to
genus Bacillus; the 16 Polysaccharide FPB isolates belonged to
genus Bacillus (majority) (10/16), genus Klebsiella (3/16),
Ochrobactrum anthropi (2/16) and genus Sphingobacterium
(1/16), respestively. Out of the 34 isolates, 2 strains had the
highest flocculating activities were Bacillus megaterium LA51P
(Protein FPB) and Bacillus aryhadtai KG12S (Polysaccharide
FPB). Combination of Bacillus megaterium LA51P and Bacillus
aryabhattai KG12S applied in the wastewater treatment (at
volume: 1 m3 and 50 m
3) showed that the criteria of the treated
wastewater were lower than the standard A of the Regulation
QCVN40.
Keywords
Bacillus; Flocculation; Flocculant-Producing Bacteria; Polluted
Water in Tra-Fish Ponds; Wastewater Piggery
Introduction
Most of the water people use everyday comes from
the sources of surface water such as streams, rivers and lakes.
Humans tend to have clean water but at the same time, the rate of
pollution in water was increased by their activities. Many lakes,
rivers and streams are becoming polluted increasingly by
industrial and agricultural activities, and domestic wastes are
often discharged into the surface water without proper treatment
especially. Therefore, it is necessary to treat before reuse by
evaluation of the physical, chemical and biological
characteristics of the water in order to verify whether the
observed water quality is suitable for the intended uses [1] . It
has been suggested that it is the leading worldwide cause of
deaths and diseases and accounts for the deaths of more than
14000 people daily.
The flocculation is a preferred method because of its high
efficiency and simplicity [2]. Flocculants can be classified into
three groups: inorganic flocculants (polyaluminum chloride and
aluminum sulfate), organic synthetic flocculants (polyethylene

Prime Archives in Biosciences
4 www.videleaf.com
imine and polyacrylamide derivatives), and naturally occurring
flocculants (chitosan, tannins, and bioflocculants) ([3-5] Roselet,
et al., 2015). Currently, many chemical flocculants including
polyaluminum chloride, aluminum sulfate, and polyacrylamide
are being applied in industrial processes such as wastewater
treatment, downstream processing of biopharmaceutical proteins,
dehydration of activated sludge, tap water production, dredging
and fermentation. However, the extensive use of chemical
flocculants has been restricted because of their neurotoxic and
carcinogenic properties [6]. With the restriction of the use of
chemical flocculants, it is necessary to use of the alternative
flocculation technology.
Bioflocculation is a dynamic process resulting from the synthesis
of extracellular polymer by living cells.
When compared with conventional synthetic flocculants,
bioflocculant has more special advantages in their use such as
safety, strong effect, biodegradable and harmlessness to humans
and the environment, so they may potentially be applied in
drinking and wastewater treatment, downstream processing, and
fermentation processes [3].
As an alternative to chemical flocculants, bioflocculants have
been widely studied in recent years as a promising option for
wastewater treatment because of their improved efficiency,
innocuity and biodegradability compared with that of traditional
flocculants [7-12]. Since 1984, when Fattom and Shilo found
that Phormidium J-1 could produce a polymer to flocculate
bentonite [13], many microorganisms have been studied for their
ability to produce bioflocculants. For example, Bacillus sp.
AEMREG7 was shown to produce a bioflocculant with a
maximum flocculating activity of 92.6% against kaolin clay
suspension [14]; Enterobacter cloacae sp. WD7 and
Pseudomonas alcaligenes WD22 were shown to produce
bioflocculants with flocculating activities of 91% and 55%,
respectively [15]. Fungi such as Aspergillus parasiticus was able
to produce a bioflocculant with a flocculating activity of 92.4%
against Reactive Blue 4 and a bioflocculant produced from
Aspergillus niger had a flocculating activity of 63% for turbidity

Prime Archives in Biosciences
5 www.videleaf.com
removal [16,17]. Actinomyces such as Nocardia spp. were able
to produce a highly efficient bioflocculant [18]. Algae such as
Desmodesmus sp. F51 were found to produce a bioflocculant
(Poly-γ-glutamic acid) with a flocculating activity of 96% [19].
Consequently, the screening of new strains that produced highly
efficient bioflocculants with low cost production, little impact on
the environment became an important research topic in this field
[4,20]. In addition, the applications of bioflocculants in the
control of harmful algae blooms in the water environment has
great practical significance.
In this study, flocculants producing bacterial isolates were
isolated, identified from water and soil in the Mekong Delta and
then investigated its characteristics and flocculation activity.
Response surface methodology (RSM) was used to optimize the
parameters of the bioflocculation for treating by kaolin
suspension. The results of the study suggested that these
bioflocculants offered a highly efficiency, it may be supplied the
solution for the wastewater treatment and applications in the
sustainable agricultural production further.
Materials and Methods Materials
Soils and water samples from tra-fish (catfish) pond, shrimp
pond and piggery wastewater were collected in the sterile plastic
bags or sterile plastic bottles 1-L (sterilized by alcohol 70%).
The samples were transferred or stored in ice-box before moving
to the laboratory (Can Tho University) and stored in the
refrigerators (-5oC) until isolation.
Methods Isolation of Flocculant-Producing Bacteria
Following ten - fold serial dilution, an aliquot of 100 µL of the
sample was spread over the cultivation agar media for the
isolation of Protein FPB [21] and Polysaccharide FPB [22]. The
cultivation agar plates were incubated at 30 °C overnight.
Prime Archives in Biosciences
6 www.videleaf.com
The subcultures were incubated under aerobic conditions at
32 °C for 24 h. This bacterial strain was consistently cultivated
on nutrient agar and preserved in the glycerol solution (20% w/v)
and stored at -80 °C.
Composition of the Used Media
Two types of media, namely, seed media and production media,
were used to screen and obtain flocculants producing bacteria.
The seed medium had the following composition (in g/L): 20 g
of glucose, 0.5 g of yeast extract, 50 g of glutamate, and 0.5 g of
MgSO4.7H2O. The pH was adjusted to 7.0 - 0.2. [21]. The
production medium contained the following components (in
g/L): 10 g of glucose, 0.5 g of yeast extract, 1.5 g of urea, 5 g of
KH2PO4, 0.1 g of K2HPO4, 0.1 g of NaCl, and 0.1 g of
MgSO4.7H2O. The pH was adjusted to 7.0 - 0.2, 0.3 g of
carbamate [23].
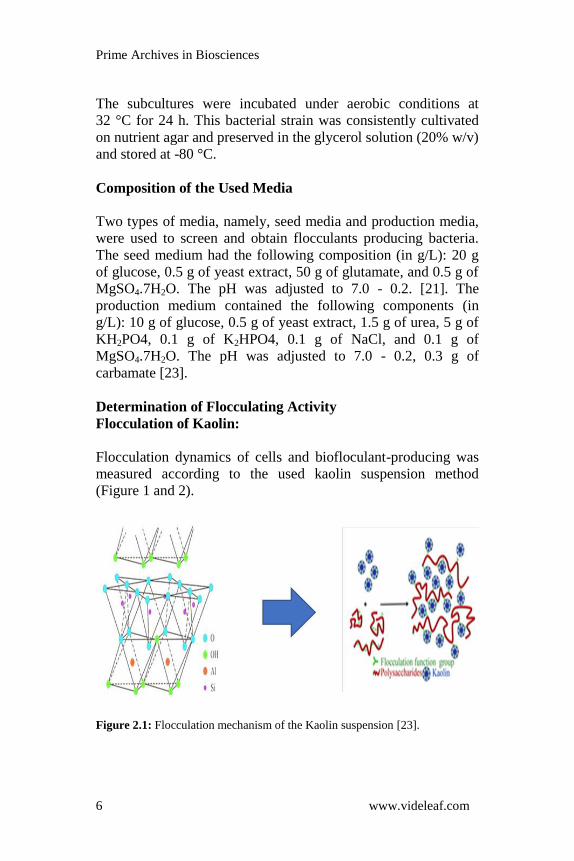
Determination of Flocculating Activity
Flocculation of Kaolin:
Flocculation dynamics of cells and biofloculant-producing was
measured according to the used kaolin suspension method
(Figure 1 and 2).
Figure 2.1: Flocculation mechanism of the Kaolin suspension [23].

Prime Archives in Biosciences
7 www.videleaf.com
Figure 2.2: Flocculation mechanism of the bioflocculant DYU500 [24].
One mL agent was mixed into 50 ml of 4 g/ L the kaolin
suspension in a 50 ml graduated cylinder covered with clean
film. The test cylinder was gently shaken and settled at room
temperature. At prescribed time, 3 mL of supernatant was
carefully removed from the upper layer of solution and measured
the absorbance at a 550 nm. Control experiment was also
conducted without flocculation agent.
Using a suspension of kaolin clay as test material, flocculating
activity was determined according to Kurane et al. [25] as
modified by Gao et al. [26]. A suspension of kaolin clay (4 g/L)
in deionized water at pH 7 was used as a stock solution for the
subsequent assays. The following solutions were mixed in a test
tube: kaolin clay suspension (9 mL), culture supernatant (0.1
mL) and 1% CaCl2 (0.25 mL). A control in which the culture
supernatant was replaced with deionized water was also included
and measured under similar conditions. The final volume of all
mixtures was made up to 10 mL with deionized water. The
solutions were mixed gently and allowed to settle for 5 min at
room temperature. The optical density (OD) of the clarifying
upper phase solution was measured at 550 nm using a Thermo
Spectronic spectrophotometer (Helios Epsilon, USA) and the
flocculating activity determined as follows: Flocculating activity
= [(B − A)/B] × 100% where A and B are optical densities at 550
nm of the sample and control, respectively.

Prime Archives in Biosciences
8 www.videleaf.com
The flocculating activity was calculated using the following
expression [27]:
Flocculating activity % = (Ac – Bs)/Ac x 100 [28] (1)
where Ac and Bs represent the OD of the control and real
samples, respectively.
Optimization of Cultural Conditions for Bioflocculants
Production:
a. Effects of pH
The effect of pH on the production medium was determined at
different pH values ranging from 3 – 11 and adjusted by adding
1N HCl and 1N NaOH as needed. A fresh culture of 2% (v/v)
bacterial isolate was inoculated into the prepared medium,
incubated for 72 h at 35°C, and shaken at 150 rpm. The
flocculating activity was examined using the kaolin clay to check
the optimal pH required for bioflocculant production as indicated
above [29].
b. Effects of Inoculum Sizes
The influence of the inoculum volume on bioflocculant
production by bacterial isolate was examined because different
inoculum sizes exert certain effects on the flocculation activity
and cell mass growth. The inoculum sizes used were 0.1%,
0.5%, 1%, 2%, 5%, and 10% [29].
c. Effects of Temperature and Shaking Speed
The bacterial isolate was inoculated into the seed media and
incubated at 37 °C on a shaker at 150 rpm for 24 h. From the
fresh culture of 2% v/v, was inoculated into several sets of 200
mL bottles containing 50 mL of the production medium, then
incubated at different cultivation temperatures (25, 30, 35, 40
and 45°C) on shaking 150 rpm for 144 h. Also, the shaking
speeds were investigated for different speeds such as 100, 120,
140, 160, 180, 200 and 220 rpm, respectively. The cell-free
supernatant was obtained by a centrifugation of 4000 rpm for 30
min to separate the cells. Then the flocculating activity was
checked.

Prime Archives in Biosciences
9 www.videleaf.com
4. Effects of Carbon and Nitrogen Sources
Bioflocculants production by microorganisms is significantly
influenced by carbon and nitrogen sources [4]. These parameters
were assessed according to Lachhwani [30]. The growth media
were prepared in separate flasks. The bacterial strain was
inoculated into the prepared medium. The media were
supplemented with 1 g/L each of various carbon sources,
incubated at 30 °C, and shaken at 150 rpm for 7 days. To
determine the influence of nitrogen sources on bioflocculants
production, 0.5 – 5 g/L each of the various nitrogen sources was
integrated into the fermentation medium in separate containers,
and the flocculation activity was calculated according to
Lachhwani using Equation (1) [30].
Identification of FPB
The bacterial strain was identified using molecular technique
based on the 16S rRNA gene amplification by polymerase chain
reaction (PCR) followed by sequencing of the amplified gene as
designed according to Neumann et al. [31] and Jie et al. [32].
Table 2.1: The effects of nutritional factors on bioflocculants production
Carbon sources Nitrogen sources Mineral sources
Glucose (1%) Urea (5%) KCl (0.3%)
Sucrose (1%) Yeast extract (0.05%) FeCl3 (0.5%)
Starch (1%) NH4(SO4)2 (0.05%) CaCl2 (0.5%)
Glutamate (0.05%) K2HPO4 (0.2%) + KH2PO4
(0.5%)
Cells were incubated in 250 mL flasks containing 50 mL fresh
Luria Bertani broth (LB) for 16 h at 37°C with shaking (120
rpm). The genomic DNA of the strain was then extracted using
CTAB method of DNA extraction from microorganisms. PCR
amplification was carried out to determine the partial 16S rRNA
gene. The PCR program was 30 cycles of 94°C (1 min), 55°C
(30 s), and 72°C (1.5 min) [3]. The PCR primers were 37F 5-
CCAGCAGCCGCGGTAATACG-3 (forward) and 1497R 5-
TACCAGGGTATCTAATCC-3 (reverse). Purification of the
PCR products and the determination of sequences were
performed by TBR Company, HCMC. The 16S rRNA gene

Prime Archives in Biosciences
10 www.videleaf.com
sequence of the strain obtained was compared with the NCBI
database (http://blast.ncbi.nlm.nih.gov/Blast.cgi).
Wastewater treatment with Bioflocculants Application of FPB to Remove Ammonia in Tra-Fish
(Catfish) Ponds
- Experiment in vitro.
- Experiment in ponds.
Application of FPB to remove Ammonia in Piggery
Wastewater
- Experiment in vitro.
- Experiment in containers: 10-L, 100-L and pond (50 m3).
Results and Discussions
The agricultural characteristics in the Mekong Delta are rice
cultivation, horticulture, aquaculture (especially tra-fish
[Pangasius] farms), husbandry as mainly raise pig at family
scales and few of pig farms (1000 – 5000 pigs/farm). Therefore,
application of FPB in wastewater treatment of tra-fish farming,
raise pig were presented.
Applications of FPB in Water Treatment of the Tra-
Fish Farming
From 155 samples, 389 FPB isolates were isolated including 154
protein FPB isolates and 235 polysaccharide FPB isolates.
Among of them, 304/389 isolates had the flocculating activities
more than 50% including 117 protein FPB isolates and 187
polysaccharide FPB isolates.
In the Mekong Delta, 10 cities/provinces had suitable conditions
to develop tra-fish farms. The water/sludge samples were
collected from these tra-fish farms. The results of the isolation
and the flocculating activities of the bacterial isolates were
presented in Table 3.1.

Prime Archives in Biosciences
11 www.videleaf.com
Table 3.1: FPB isolates isolated from the 10 sites in the Mekong Delta.
No
Site
No
of sample
Number of isolates isolated Isolates had the FA >50%
Total Protein Polysaccharide Total Protein Polysaccharide
1 AnGiang 24 19 10 9 14 7 7
2 BenTre 14 56 26 30 56 26 30
3 CanTho 21 33 10 23 31 10 21
4 DongThap 21 73 24 49 35 10 25
5 HauGiang 15 23 6 17 19 6 13
6 KienGiang 11 50 23 27 49 22 27
7 SocTrang 12 49 19 30 23 9 14
8 TienGiang 08 18 9 9 18 9 9
9 TraVinh 12 45 18 27 36 9 27
10 VinhLong 17 23 9 14 23 9 14
Total 155 389 154 235 304 117 187
Note: FA: flocculant activity

Prime Archives in Biosciences
12 www.videleaf.com
All of the FPB isolates isolated were amplified with 37F and
1479R primers. After PCR, bands at 1500 bp position were
identified, therefore they were the FPB strains.
The FPB strains developed very well on the media from 48 - 72
h at 30°C. The colonies had round-shape, spreading, slimy,
smooth, transparency, colorless or milk-color, white or yellow.
Most of the colony size of the strains were small (1 – 1.5 mm in
diameter), while a few strains were large (2.5 – 3 mm in
diameter) (Figure 3.1).
Morphological characteristics of the FPB cells were short rod-
shaped and circular. The cell had an outer mucus and viscous
layer that helped to flocculate the organic and inorganic
suspended particles and settle at the bottom of containers.
(Figure 3.2)
Figure 3.1: Shapes, sizes and color of a few FPB colonies isolated
Figure 3.2: Shapes of several FPB cells isolated.

Prime Archives in Biosciences
13 www.videleaf.com
Identification of the FPB Isolates
Among the FPB isolates, a total of the 20 isolates (10 of Protein
FPB isolates and 10 of Polysaccharide FPB isolates) with
the highest flocculating efficiency were selected to identify by
16S rRNA genes sequencing.
The results of the identification in table 3.2 and 3.3 showed that
among the 20 isolates, the 16, 2, 1 and 1 isolates belonged to
genus Bacillus, Staphylococcus, Arthrobacter and
Agrobacterium respectively.
The Protein FPB Isolates:
The result in figure 3.3 showed that the phylogenetic tree had 2
clusters: Cluster A had 2 small clusters as cluster A1 with two
strains: Bacillus aryabhattai DTT07P and Staphylococcus
xylosus TVT05P having high similarity with Bacillus
amyloliquefaciens TGT03P

Prime Archives in Biosciences
14 www.videleaf.com
Table 3.2: Phylogenetic affiliation of 10 protein FPB isolates on the basis of 16S rDNA gene sequences by using BLAST
programme in the GenBank database based on sequence similarity
No Strain Number of
nucleotids Closest species relative
Similarity
(%)
01 AGT08P 1151 JQ229803 Bacillus megaterium strain 1CK24 98
FJ976552 Bacillus megaterium strain LCR43 98
02 BTT24P 1184 JQ039972 Bacillus subtilis strain YNA61 98
HQ143570 Bacillus pumilus strain YT1 98
03 CTT04P 1145 JN086146 Bacillus amyloliquefaciens strain Rx-34 98
JF496465 Bacillus vallismortis strain WA1-1 98
04 DTT07P 1174 JN084155 Bacillus aryabhattai strain Y8 98
FJ620896 Bacillus megaterium strain XTBG34 98
05 HGT06P 957 HQ231223 Bacillus sp. NyZ44 98
HQ242772 Bacillus aryabhattai isolate PSB59 98
06 KGT15P 931 AF270793 Bacillus subtilis N5 99
JF738142 Bacillus sp. PSM2 99
07 STT05P 1117 FJ210844 Staphylococcus saprophyticus strain OTUC3 99
HM854231 Staphylococcus xylosus strain KTH6-1 99
08 TVT05P 967
GQ480491 Staphylococcus saprophyticus
subsp. saprophyticus train xf1-4
98
HM 854231 Staphylococcus xylosus strain KTH6-1 97
09 VLT02P 720 JF496324 Bacillus vallismortis strain A1-7 98
HQ238495 Bacillus methylotrophicus strain S521B-53 98
10 TGT03P 1360 HM055608 Bacillus amyloliquefaciens strain JS 99
JF899261 Bacillus methylotrophicus strain Hk9-21 99

Prime Archives in Biosciences
15 www.videleaf.com
Figure 3.3: Phylogenetic tree for partial 16S rRNA gene sequences from 10
protein FPB isolates by using primers (37F, 1492R) showing relationships
between representative strains along with related sequences retrieved from
GenBank. The numbers at the nods indicate the levels of bootstrap support (%)
based on a Maximum Likelihood analysis of 100 re-sampled datasets. The scale
bar indicates the phylogenetic distance corresponding to 5 changes per 100
bases.
; cluster A2 had 3 strains with high similarity (100%) as Bacillus
vallismortis VLT02P, Bacillus aryabhattai HGT06P and
Bacillus subtilis KGT15P, three strains originated from far from
(more than 100 km) but they related close genetic.
Cluster B had 2 small clusters: cluster B1 with 2 strains Bacillus
megaterium AGT08P related close with Staphylococcus
saprophyticus STT05P and cluster B2 with 2 strains as Bacillus
subtilis BTT24P also had high relationship with Bacillus
amyloliquefaciens CTT04P. In general, gram-positive bacteria
occupied the majority among genus Bacillus (8/10) and genus
Staphylococcus (2/10).

Prime Archives in Biosciences
16 www.videleaf.com
The Polysaccharide FPB Isolates:
Among the 10 strains in the phylogenetic tree (Figure 3.4), 9
were positive-gram bacteria including 8 belonged to genus
Bacillus (majority) and 1 was genus Arthrobacter; the 1 isolates
was negative-gram bacteria and belonged to genus Rhizobium.
The phylogenetic tree had 2 clusters: cluster A composed of 2
small clusters, cluster A1 with 4 strains: Bacillus sp. HGT09PS,
Bacillus sp. KGT50PS, Bacillus sp. TVT35PS and Bacillus sp.
BTT36PS with high similarity and originating from the same as
provinces at the seaside of the Mekong Delta; cluster A2 with 2
strains: Bacillus megaterium AGT19PS and Arthrobacter sp.
DTTPS45PS.
Figure 3.4: Phylogenetic tree for partial 16S rRNA gene sequences from 10
polysaccharide FPB isolates by using primers (37F, 1492R) showing
relationships between representative strains along with related sequences
retrieved from GenBank. The numbers at the nods indicate the levels of
bootstrap support (%) based on a Maximum Likelihood analysis of 100 re-
sampled datasets. The scale bar indicates the phylogenetic distance
corresponding to 5 changes per 100 bases.

Prime Archives in Biosciences
17 www.videleaf.com
Table 3.3: Phylogenetic affiliation of 10 polysaccharide FPB isolates on the basis of 16S rDNA gene sequences by using BLAST
programme in the GenBank database based on sequence similarity
No Strain Number of
nucleotides Closest species relative
Similarity
(%)
01 AGT19PS 1075 JN411325 Bacillus megaterium strain IARI-BK-14 99
EU834243 Bacillus subtilis strain DS13 99
02 BTT36PS 1171 KP992157 Bacillus sp. MNPK-2 98
JN642548 Bacillus megaterium strain EN2 98
03 CTT27PS 836 EU162025 Bacillus sp. PGBw5 99
04 DTT45PS 1184 HQ657321 Arthrobacter sp. D48 98
JF900051 Arthrobacter sp. C3-2 98
05 HGT09PS 1179 GQ284474 Bacillus megaterium strain PCWCW5 99
JF460759 Bacillus aryabhatti strain Kt10-17 99
06 KGT50PS 988 EU661789 Bacllus sp. C-18 98
HM027880 Bacillus megaterium strain RKJ 600 98
07 TVT35PS 949 HQ231223 Bacillus sp. NyZ44 99
FJ976550 Bacillus megaterium strain LCR41 99
08 STT37PS 1211 JN048647 Rhizobium sp. SYF-5 98
GQ181060 Agrobacterium tumefaciens strain BLN4 97
09 VLT22PS 1360 EU912461 Bacillus sp. SuP1 97
JF496312 Bacillus megaterium strain XAS5-1 97
10 TGT09PS 1239 JF496312 Bacillus megaterium strain XAS5-1 98
JN700159 Bacillus amyloliquefaciens subsp. plantarum strain P03 98

Prime Archives in Biosciences
18 www.videleaf.com
In cluster B composed of 4 strains: Bacillus megaterium
VLT22PS and Bacillus megaterium TGT09PS related close
relationship, they had a relationship with Bacillus sp. CTT27PS
and all of them had an relationship with Rhizobium sp.
STT37PS.
Effects of Environmental Factors on Flocculating Activity
(%)
Three good bacterial strains of polysaccharide FPB were selected
to evaluate the effects of pH, cations and optimal conditions on
growth of bacteria to obtain the highest flocculating activity.
+ pH: At pH 6, all of three bacterial strains had the highest
flocculating activities, while the flocculating activities were not
same at pH 5, 7, 8 and 9 (Table 3.4).
+ Cation: Among 5 kinds of the cations used (CaCl2, NaCl, KCl,
MnSO4, MgSO4), the cation of CaCl2 had the highest
flocculating activities (Table 3.5). In comparison with the NaCl,
the CaCl2 was high cost and the flocculating activity was no
different. Therefore, the NaCl were used to replace the CaCl2.
Moreover, the NaCl had higher flocculating activities than the
CaCl2 at low cations concentration (0.11 to 0.12%) for all the
bacterial strains (Table 3.6).
Table 3.4: Effects of pH on flocculating activity (%) of the polysaccharide
FPB strains
Strain
pH
5 6 7 8 9
AGT19PS 60.35 b 69.02 a 63.59 b 63.51 b 6218 b
STT37PS 6139 b 68.80 a 68.47 a 61.53 b 66.46 a
TGT09PS 67.07 a 68.84 a 65.88 a 65.65 a 66.47 a
Means within a column followed by the same letter/s are not significantly
different at p < 0.01

Prime Archives in Biosciences
19 www.videleaf.com
Table 3.5: Effects of cations on flocculating activity (%) of the polysaccharide
FPB strains
Strain Cations
CaCl2 NaCl KCl MnSO4 MgSO4
Flocculating activity (%)
AGT19PS 68.41 a 68.40 a 52.97 c 59.44 b 50.58 c
STT37PS 70.78 a 69.72 a 53.52 c 58.47 b 53.58 c
TGT09PS 68.89 a 66.05 a 55.63 b 52.69 bc 50.16 c
Means within a column followed by the same letter/s are not significantly
different at p < 0.01
Optimal Conditions for the Growth of the FPB
To determine an optimal medium for the good growth of FPB,
one type of medium should be made with adequate nutritional
ingredients (carbon, nitrogen, minerals,..) for the growth of
bacteria. So, an experiment was carried out to look for the best
formula of medium.
The results in table 3.7 showed that 1% sucrose + 5% glutamic
acid was used, the highest flocculating activities obtained in all
the three bacterial strains.
To evaluate the effectiveness of the three bacterial strains,
flocculating activities on water infecting many suspended solid
with Kaolin of the bacterial strains was performed independently
or in combination with 2 or 3 the bacterial strains. The results in
Table 3.8 showed that the usage of one the strain (STT37PS)
demonstrated the highest flocculating activity (%) in comparison
to the combinations.
AG : AGT19PS; ST : STT37PS; TG : TGT09PS and the
evaluating of the effectiveness of the three bacterial strains to
wastewater in tra-fish ponds (Kaolin liquid was replaced by
wastewater of the tra-fish pond), the results in Table 3.9 showed
that the effectiveness of the bacterial strains for the suspended
solid with Kaolin, however the flocculating activities were lower
than in comparison to the suspended solid with Kaolin perhaps
due to the presence of other suspended solids in the wastewater
from the tra-fish ponds.

Prime Archives in Biosciences
20 www.videleaf.com
Table 3.6: Effects of NaCl and CaCl2 on the flocculating activity (%) of the polysaccharide FPB strains.
Strain
Used
level
(%)
Kaolin +
NaCl
Kaolin +
CaCl2
strain
Used
level
(%)
Kaolin +
NaCl
Kaolin +
CaCl2
strain
Used
level
(%)
Kaolin +
NaCl
Kaolin +
CaCl2
AGT
19PS
0.08 42.27 c. 25.00 bc
STT
37PS
0.08 74.04 abc 58.75 b
TGT
09PS
0.08 40.89 c 25.31 d
0.09 44.79 bc 25.39 bc 0.09 72.28 c 67.66 a 0.09 43.26 c 28.20 d
0.10 39.43 c 27.66 b 0.10 75.57 ab 69.45 a 0.10 41.04 c 36.80 c
0.11 39.28 c 23.75 c 0.11 75.80 a 70.63 a 0.11 65.39 a 38.13 c
0.12 64.09 a 27.34 b 0.12 75.50 ab 72.81 a 0.12 50.15 b 51.88 b
0.20 53.29 b 61.02 a 0.20 73.35 c 72.50 a 0.20 41.58 c 63.98 a
Means within a column followed by the same letter/s are not significantly different at p < 0.
Table 3.7: Optimal medium for the growth of the 3 FPB strains.
Carbon
sources
Nitrogen sources Minerals
sources Glutamic acid (5%) Yeast extract (0.05%) Urea
(0.05%)
NH4SO4
(0.05%)
Glucose
(1%)
54.97 60.07 64.77 52.66 47.45 51.98 54.43 51.07 41.90 52.96 46.32 44.75 Mineral applied
in the treatments
(red numbers)
KCl (0.5%)
FeCl3 (0.5%)
CaCl2 (0.5%)
K2HPO4
(0.2%) +
KH2PO4 (0.5%)
32.72 37.44 29.67 41.72 42.02 34.75 46.04 49.83 39.40 45.19 47.68 40.72
64.36 58.99 59.56 58.04 47.79 48.23 58.81 52.77 38.85 54.58 44.85 43.15
37.80 44.17 54.90 49.19 39.59 35.86 54.58 42.76 44.20 52.96 48.76 29.88
Sucrose
(1%)
65.82 58.14 50.73 63.51 49.21 50.31 60.59 47.00 48.58 64.97 47.74 36.97
37.49 44.85 31.83 45.42 41.40 35.23 46.50 42.08 35.58 44.65 45.31 29.26
69.13 70.48 68.59 64.97 56.11 56.29 55.81 50.51 51.42 66.20 50.00 42.88
58.43 61.20 59.21 57.43 52.94 33.84 52.19 52.77 41.07 59.89 44.06 46.42
Starch
(1%)
13.47 32.18 33.77 59.58 39.93 52.88 46.19 38.52 35.65 33.72 38.24 28.35
38.34 36.99 30.99 47.58 45.36 40.24 40.49 42.42 33.43 46.04 48.25 46.63
32.95 29.69 22.03 36.80 36.65 39.61 28.95 29.71 18.42 44.34 45.14 20.22
37.80 28.79 35.72 37.95 33.14 41.77 34.64 30.09 48.92 31.10 38.35 55.94
AG ST TG AG ST TG AG ST TG AG ST TG

Prime Archives in Biosciences
21 www.videleaf.com
Table 3.8: Effects of a single strain or combination of two strains on
flocculating activity of water added suspended solids.
Strain Flocculating activity
(%)
Combination Flocculating activity
(%)
STT37PS 81.20 a AGT19PS +
TGT09PS
75.92 bc
AGT19PS 70.98 b STT37PS +
AGT19PS
73.01 cd
TGT09PS 70.14 b STT37PS +
TGT09PS
60.65 e
Means within a column followed by the same letter/s are not significantly
different at p < 0.01
Table 3.9: Effects of 3 polysaccharide FPB strains on flocculating activity of
wastewater from the tra-fish ponds.
Strain Kaolin liquid Polluted water in
tra-fish pond of
OMon
Polluted water in
tra-fish pond of
TraVinh
STT37PS 80.33 a 53.26 a 52.14 a
AGT19PS 72.92 b 40.55 b 44.50 b
TGT09PS 72.01 b 40.55 b 41.59 c
Means within a column followed by the same letter/s are not significantly
different at p < 0.01
Application of Polysaccharide FPB for Wastewater
Treatment of the Tra-Fish Ponds
The polysaccharide FPB strain STT37PS was applied to treat
wastewater from the tra-fish ponds (at 3 different sites in Can
Tho city) with 100-L container model. The results in Table 3.10
showed that all the strains could reduce TSS concentration (from
49 to 65%) and COD values (from 40 to 67%) after 1 day. The
strain STT37PS could reduce the TSS concentration and reached
less than 100 mg/L. Therefore, the strain STT37PS had potential
to treat wastewater.

Prime Archives in Biosciences
22 www.videleaf.com
Table 3.10: Effects of the strain STT37PS on TSS and COD concentration in
water of tra-fish from 3 different sites in CanTho city.
Site
TSS
mg/L
Rate of
reducti
on (%)
COD
mg/L
Rate of
reduction
(%)
CanTho 1 Regulation:
QCVN
08:2008/
BTNMT,
standard B1
50 30
Control (no
bacteria)
60.50 44
STT37PS 21.00 65.29 26 40.91
CanTho 2 Regulation:
QCVN
08:2008/
BTNMT,
standard B1
50 30
Control (no
bacteria)
124.5 49
STT37PS 63.50 49.00 16 67.35
CanTho 3 Regulation:
QCVN
08:2008/
BTNMT,
standard B1
50 30
Control (no
bacteria)
152.50 52
STT37PS 64.50 57.70 29 44.23
Application of FPB for Wastewater Treatment of Fish Ponds
ThacLac fish (Notopterus notopterus) [Pallas, 1969] and
RoDong fish (Anabas testudineus) (Bloch, 1792) have been feed
in the Mekong popularly, the areas of fish ponds increased.
Initially the area of the fish ponds of 2 districts (LongMy and
ViThuy) in HauGiang province was 80 ha (2011). Until now, the
area reached nearly 200 ha (2020). Besides increasing of area of
ponds and fish/ponds, then erosion of soil, residues of feed, etc.
had been caused an increase in the amount of waste in ponds
(wastewater + pond bottom mud), polluting the environmental
water and fish were attacked by pathogens (as anaerobic
bacteria) easily.

Prime Archives in Biosciences
23 www.videleaf.com
Table 3.11: Physical and Chemical Characteristics of water in ThacLac pond and RoDong ponds.
Target
pH
Amoni
(mg/L)
PO43-
(mg/L)
TN (mg/L) NO2
(mg/L)
NO3
(mg/L)
TP (mg/L) TSS
(mg/L)
COD (mg
O2/L)
BOD5 (mg
O2/L)
ThacLac 6.99 3.39 0.01 6.72 0.43 0.04 5.62 127.5 64.5 27.5
RoDong 7.45 42.5 3.90 8.40 0.07 0.03 1.92 251.5 195.5 79.5
Table 3.12: Effects of bio-floc on the physical, chemical characteristics of water in the ThacLac fish pond after 1 hour, 1 day, 2 days and 3 days.
Target
Application of bio-floc into water Water transferred into
Lemna
pond
CV
(%)
Regulation QCVN40:
2011/BTNMT Initiate after 1 h after
1 day
after
2 days
after 3 days
pH 6.99 a 6.77 b 6.78 b 6.70 b 6.80 b 7.33 c 0.18 6-9
PO43- (mg/L) 0.01 f 0.41 e 1.13 c 1.83 b 2.77 a 0.73 d 1.73 6*
NO2- (mg/L) 0.43 0.02 0.02 0.02 0.02 0.02 0.01*
NO3- (mg/L) 0.04 ND ND ND 0.03 0.06 50*
TP (mg/L) 5.62 a 2.83 d 3.08 c 2.65 e 3.80 b 0.62 f 0.28 4
Means within a column followed by the same letter/s are not significantly different at p < 0.01
Table 3.13: Effects of bio-floc on the physical, chemical characteristics of water in the RoDong fish pond after 1 hour, 1 day, 2 days and 3 days.
Target
Application of bio-floc into water Water transferred into
Lemna
pond
CV
(%)
Regulation QCVN
40:2011
/BTNMT Initiate after
1 h
after
1 day
after
2 days
after
3 days
pH 7.45 a 6.96 d 7.18 c 7.14 c 7.13 c 7.32 b 0.18 6-9
PO43- (mg/L) 3.90 e 68.1 b 77.1 a 38.9 d 40.1 c 0.23 f 0.26 6*
NO2- (mg/L) 0.43 0,02 0,02 0.02 0.02 0.02 0.01*
NO3- (mg/L) 0.04 ND ND ND 0.03 0.06 50*
TP (mg/L) 1.92 b 2.68 a 0.65 d 0.85 c 0.53 e 2.64 a 0.06 4
Means within a column followed by the same letter/s are not significantly different at p < 0.01

Prime Archives in Biosciences
24 www.videleaf.com
The results in table 3.11 showed that the quality of water in the
RoDong pond achieved not in comparison to the quality of water
in the ThacLac pond.
In order to remove toxic materials out of the ponds, water in
ponds in farms were only replace twice one month. The water in
the ponds irrigated directly to rivers and canals. Moreover,
chemicals and oxygen-generating reel were applied by a few of
farms but cost is high for small farm-family and economic
efficiency for big farm-family. Therefore, using FPB products
(Bio-floc) in the clear water environment is applied.
Application of FPB products in water treatment of the ThacLac
pond were performed in after 1 hour, 1 day, 2 days and 3 days.
The samples of the water in the ThacLac pond was collected to
measure pH, PO43-
(mg/L), NO2-
(mg/L), NO3-
(mg/L), TP
(mg/L) and TN, TSS, COD, BOD,… The results were presented
in table 3.12.
Figure 3.5: Effects of Bio-Floc and Lemna sp. on TN and Amoni
concentrations in water of the ThacLac fish pond.

Prime Archives in Biosciences
25 www.videleaf.com
Figure 3.6: Effects of Bio-floc on TSS, COD and BOD concentrations in water
of the ThacLac fish pond.
The results (Table 3.12., Figure 3.5. and Figure 3.6.) showed that
concentrations of TSS, COD, BOD5, TN, Nitrite, Nitrate, TP and
PO43-
in water of bronze featerback fish pond decreased strongly
after 1 hour applying biofloc and after 72 hours, all of data were
lower than A standard of Regulation QCVN40:2011/BTNMT;
Ammonia concentration increased from 1 to 3 days but it
reduced strongly when water was moved to Lemna pond.
Application of FPB products in water of the RoDong fish pond
in after 1 hour, 1 day, 2 days and 3 days, water in the RoDong
fish pond was collected to measure pH, PO43-
(mg/l), NO2-
(mg/l), NO3- (mg/l), TP (mg/l) and TN, TSS, COD, BOD… The
results presented in table 3.13.
Due to water in the RoDong fish pond contained many toxic
materials; concentrations of COD, BOD5, TP, Nitrite, Nitrate in
water of the RoDong fish pond decreased under A standard of
Regulation QCVN40 after 3 days applying bio-floc however
concentrations of Ammonia, PO43, TN increased during 3 days
after applying bio-floc and they only reduced strongly under A
standard of the Regulation (QCVN40) when water was
transferred to Lemna pond; neutral pH of water (two ponds)
changed slowly.

Prime Archives in Biosciences
26 www.videleaf.com
This process was applied for water treatment of three-month old
bronze featherback (ThacLac) fish and ababas (RoDong) fish
ponds successfully with data under A standard of Regulation
QCVN40 in a short time (3 days for bio-floc stage, 2 days for
Lemna stage) with low cost.
Figure 3.7: Effect of Bio-Floc and Lemna sp. on TN and Amoni concentrations
in water of the RoDong fish pond.
Figure 3.8: Effects of Bio-floc on TSS, COD and BOD concentrations in water
of the RoDong fish pond.

Prime Archives in Biosciences
27 www.videleaf.com
Applications of FPB in Treatment of Piggery
Wastewater
Raising of pigs in the Mekong Delta has been developed in
family scales and farms scales strongly but the wastewater
generated from the pig farms has been not treated yet and
drained to rivers and canals. This is one of the causes of water
source pollution in the rivers and the canals which people often
use the water from these sources for cooking and other living
activities daily. Therefore, the wastewater of pig farms need to
be cleaned before drain to rivers and canals.
One hundred-nineteen (119) Protein FPB isolates (53.85 %) and
102 Polysaccharide FPB (46.15 %) isolates were isolated from
147 samples which collected from 13 cities and provinces in the
Mekong Delta (Table 3.14).
Table 3.14: FPB isolates isolated from 13 sites in the Mekong Delta.
No Site Number of
samples
Number of isolated isolates
Protein Polysac
charide
01 KienGiang 17 12 9
02 CanTho 22 6 7
03 BenTre 21 6 12
04 TienGiang 20 15 20
05 VinhLong 12 2 6
06 TraVinh 22 7 7
07 SocTrang 22 18 4
08 DongThap 21 9 3
09 CaMau 17 12 7
10 AnGiang 16 15 13
11 HauGiang 15 6 7
12 BacLieu 11 5 4
13 LongAn 26 6 3
Total
242 119 102
All of the FPB isolates were identified by PCR technique with
primers 37F and 1479R. The PCR products were identified at
1500 bps position. Therefore they were the FPB isolates.

Prime Archives in Biosciences
28 www.videleaf.com
The FPB strains developed very well on the media from 48 - 72
h at 30°C. The colonies had round-shape, spreading, slimy,
smooth, transparency, colorless or milk-color, white or yellow.
Most of the colony size of the strains were small (1 – 1.5 mm in
diameter), while a few strains were large (2.5 – 3 mm in
diameter) (Figure 3.9).
Morphological characteristics of the FPB cells were short rod-
shaped and circular. The cell had an outer mucus and viscous
layer that helped to flocculate the organic and inorganic
suspended particles and settle at the bottom of containers.
Selection of 10 isolates had the highest flocculating activities
(FA) to identify them by 16S rRNA genes sequencing.
Figure 3.9: Colonies and cells of the protein FPB isolates (above) and the
polysaccharide FPB isolates (below) under SEM.

Prime Archives in Biosciences
29 www.videleaf.com
Identification of the FPB Isolates
The Protein FPB Isolates:
Eighteen isolates had the high flocculating activities were chosen
to identify by PCR technique and sequencing.
The results in Table 3.15 showed that all of the 18 isolates
belonged to genus Bacillus. The phylogenetic tree showed that
the 18 protein FPB strains had 2 big clusters: Cluster A with 2
small clusters: cluster A1 had 7 strains as TIENGIANG.13,
TRAVINH.1, BENTRE.31, ANGIANG.49, SOCTRANG.82,
CAMAU.64 and CANTHO.5 from 7 different provinces. Among
3 strains TIENGIANG.13, TRAVINH.1, BENTRE.31 had close
relationship perhaps they originated from 3 provinces nearly; 2
strains: SOCTRANG.82 and CAMAU.64 also had relationship
closely and 5 sites were 5 provinces located at the seaside
(Eastern Sea). Two strains ANGIANG.49 and CANTHO.5
distributed in 2 separate clades but all of them (7 strains) were
identified Bacillus megaterium. Cluster A2 with 2 small clusters
as cluster A21 with Bacillus megaterium KIENGIANG.32 and
Bacillus megaterium KIENGIANG.61 related very closely,
Three strains Bacillus aryabhattai HAUGIANG.3, BACLIEU.93
and LONGAN.21 had high relationship.
Cluster B had 2 clusters and the 6 strains were distributed
belong to local site as cluster B1 with 3 strains Bacillus
megaterium CANTHO.3, and CAMAU.64 together with
Bacillus sp. VINHLONG.1 and cluster B2 with 3 strains
Bacillus megaterium LONGAN.51, DONGTHAP.42 and
ANGIANG.84.
Phylogenetic tree of the 18 protein FPB strains belonged to
genus Bacillus that the species of Bacilli occupied the
dominance in flocculants producing bacteria and they survived
very well in wastewater piggery. Even though they distributed to
local sites but they had the relationships of genome.

Prime Archives in Biosciences
30 www.videleaf.com
Table 3.15: Phylogenetic affiliation of 18 protein FPB isolates on the basis of 16S rDNA gene sequences by using BLAST programme in the GenBank database based on sequence similarity
No Strain Closest species relative Similarity
(%)
01 KG32P JF496309 Bacillus megaterium strain XAS3-2 98
EU834243 Bacillus subtilis strain DS13 98
02 KG61P HM027880 Bacillus megaterium strain RKJ 60 98
JF496300 Bacillus megaterium strain XA7-7-1 98
03 CT3P JQ407796 Bacillus aryabhattai strain BVC13 98
JF496312 Bacillus megaterium strain XAS5-1 98
04 CT5P HQ647284 Bacillus megaterium strain TS58 98
FJ823003 Bacillus megaterium strain gx-98 98
05 BT31P JF820121 Bacillus megaterium strain PG-5-8 98
JF496506 Bacillus megaterium strain WAS1-2 98
06 TG13P JF496309 Bacillus megaterium strain XAS3-2 98
JF496454 Bacillus aryabhattai strain EAS5-1 98
07 VL1P FJ976552 Bacillus megaterium strain LCR43 98
EU931553 Bacillus megaterium strain ZFJ-14 98
No Strain Closest species relative Similarity
(%)
08 TV1P JN642548 Bacillus megaterium strain EN2 98 98
HQ242772 Bacillus aryabhattai isolate PSB59 98
09 ST82P HQ143579 Bacillus megaterium strain DZQ3-1 99
JN411298 Bacillus megaterium strain IARI-AN-28 98
10 ÐT42P FJ976616 Bacillus megaterium strain LCR107 98 98
GU563347 Bacillus aryabhattai strain LS11 98
11 CM641P JN903382 Bacillus megaterium strain W33 97
JF899293 Bacillus aryabhattai strain Hc15 97
12 CM64P FJ976544 Bacillus megaterium strain LCR35 98
EU979528 Bacillus megaterium strain TS-1 98

Prime Archives in Biosciences
31 www.videleaf.com
13 AG49P GU048867 Bacillus megaterium strain TOBCMDU-1 99
FJ174642 Bacillus megaterium strain 129YG13 97
14 AG84P FN435884 Bacillus megaterium isolate 13 99
HM357355 Bacillus megaterium strain 3-1-2 99
15 HG3P HM027880 Bacillus megaterium strain RKJ 600 98
JF460759 Bacillus aryabhattai strain Kt10 98
16 BL93P JF496310 Bacillus megaterium strain XAS4-7 98
JF895489 Bacillus megaterium strain As-30 99
17 LA21P FJ605385 Bacillus megaterium strain AceR-2 99 99
JF683607 Bacillus megaterium strain KU1 99
18 LA51P HQ242768 Bacillus megaterium isolate PSB55 99
HQ840732 Bacillus megaterium strain MBFF6 99

Prime Archives in Biosciences
32 www.videleaf.com
Figure 3.10: Phylogenetic tree for partial 16S rRNA gene sequences from the
18 protein FPB isolates by using primers (37F, 1492R) showing relationships
between representative strains along with related sequences retrieved from
GenBank. The numbers at the nods indicate the levels of bootstrap support (%)
based on a Maximum Likelihood analysis of 100 re-sampled datasets. The scale
bar indicates the phylogenetic distance corresponding to 5 changes per 100
bases.
The Polysaccharide FPB Isolates:
Among the 16 strains in phylogenetic tree (Figure 3.11)
belonged to genus Bacillus (majority) (10/16), genus Klebsiella
(3/16), Ochrobactrum anthropi (2/16 ) and genus
Sphingobacterium (1/16). They included 62.5 % positive-gram
bacteria [10/16] (majority genus Bacillus) and 37.5 % negative-
gram bacteria were [6/16].

Prime Archives in Biosciences
33 www.videleaf.com
Table 3.16: Phylogenetic affiliation of 16 polysaccharide FPB isolates on the basis of 16S rDNA gene sequences by using BLAST programme in the
GenBank database based on sequence similarity.
No Strain Closest species relative Similarity
(%)
01 KG12S JQ407796 Bacillus aryabhattai strain BVC13 98
JF496312 Bacillus megaterium strain XAS5-1 98
02 CT63S HQ908708 Bacillus aryabhattai strain F77063 99
HQ242772 Bacillus aryabhattai isolate PSB59 99
03 BT1S JF496290 Bacillus aryabhattai strain XA6-1 97
AY167862 Bacillus megaterium strain SAFR-038 97
04 BT2S JN411575 Bacillus megaterium strain S4 98
FR821658 Bacillus megaterium partial strain 108X 98
05 TG21S FJ3741261 Ochrobactrum anthropi strain P23 97
DQ417342 Ochrobactrum anthropi strain WZR 97
06 TG32S AY917134 Ochrobactrum anthropi isolate CYP2004 98
KC252888 Ochrobactrum anthropi strain R058 97
07 VL4S EF426437 Sphingobacterium sp. 1.3 98
JX035964 Sphingobacterium multivorum strain GZT-2 97
08 TV43S JQ308544 Bacillus amyloliquefaciens strain APS3 98
JQ308585 Bacillus amyloliquefaciens strain YPA6 98
09 ST71S HM753596 Bacillus subtilis strain AVT-KSU309 99
JQ308552 Bacillus subtilis strain FPA3 98
10 DT16S GU272350 Klebsiella sp. LP1MK 98
FJ490056 Klebsiella pneumoniae strain F2 98
11 DT42S JQ698335 Bacillus amyloliquefaciens strain N-6 98
JF935098 Bacillus subtilis strain ChST3.4 98
12 CM31S FJ174605 Bacillus megaterium strain 157XG76 97
GU048868 Bacillus megaterium strain TOBCMDU-2 97
13 AG75S GU272365 Klebsiella sp. TP1MC (KOREA) 99
FJ490057 Klebsiella pneumoniae strain F3 99
14 HG1S GU272365 Klebsiella sp. TP1MC 97
JX435602 Klebsiella pneumoniae strain zg2010 97
15 BL5S KC191571 Bacillus methylotrophicus strain CC 97
GU122948 Bacillus amyloliquefaciens strain DBT3SC3 97
16 LA1S HQ670558 Bacillus megaterium strain AIMST 97
JQ312015 Bacillus aryabhattai strain AIMST 97

Prime Archives in Biosciences
34 www.videleaf.com
Figure 3.11: Phylogenetic tree for partial 16S rRNA gene sequences from the
16 polysaccharide FPB isolates by using primers (37F, 1492R) showing
relationships between representative strains along with related sequences
retrieved from GenBank. The numbers at the nods indicate the levels of
bootstrap support (%) based on a Maximum Likelihood analysis of 100 re-
sampled datasets. The scale bar indicates the phylogenetic distance
corresponding to 5 changes per 100 bases.
The phylogenetic tree with the 16 polysaccharide FPB strains
(Figure 3.11) divided to 2 big clusters. Cluster C composed 11
strains with 2 small clusters; cluster C1 had 7 strains:
Ochrobactrum anthropi TIENGIANG 32S, Bacillus megaterium
CAMAU 31S, Klebsiella sp., HAUGIANG 1S,
Sphingobacterium sp. VL4S and Bacillus methylotrophicus 6S,
had related relationship close and they located cluster C11; and
cluster C12 with 2 strains as Bacillus amyloquefasciens
TRAVINH 43S and Bacillus aryabhattai BENTRE 1S had high
relationship. While cluster C2 with 4 strains Klebsiella sp.

Prime Archives in Biosciences
35 www.videleaf.com
DONGTHAP 1S, Bacillus megaterium LONGAN 1S, Bacillus
megaterium BENTRE 2S, and Bacillus subtilis SOCTRANG
71S, they had the high similarity because 4 provinces located
close together. The strains in cluster D1 were Klebsiella sp.
ANGIANG 7S, and Ochrobactrum anthropi TIENGIANG 21S.
Cluster D2 composed of 3 strains: Bacillus aryabhattai
KIENGIANG 12S and Bacillus amyloliquefaciens DONGTHAP
42S had relationship very closely and both strains related with
Bacillus aryabhattai CANTHO 63S.
Effects of Environmental Factors on Flocculating Activity
(%)
+ pH
Using the Kaolin suspension for determination the flocculating
activities of the bacterial strains showed that (Figure 3.12): At
different pH values, the flocculating activities were different.
The flocculating activities of Bacillus megaterium LA51P and
Bacillus aryhadtai KG12S were the highest (83.1 %, 83.2 %,
respectively) at pH 6 and significant different to the other pH
values. So, the pH 6 was used for the next experiments.
Means within a column followed by the same letter/s are not
significantly different at p < 0.01
Figure 3.12: Effects of pH on flocculating activities of Bacillus megaterium
LA51P and Bacillus aryhadtai KG12S.
+ Temperature
The flocculating activities of the Bacillus megaterium LA51P
and Bacillus aryhadtai KG12S were measured at different
incubation temperatures from 20°C to 50°C. The results in
Figure 3.13 showed that both the strains had the highest
flocculating activities at 32°C. At 50°C, the flocculating
activities were very low.

Prime Archives in Biosciences
36 www.videleaf.com
Figure 3.12: Effects of pH on flocculating activities of Bacillus megaterium
LA51P and Bacillus aryhadtai KG12S.
Figure 3.13: Effects of temperatures on the flocculating activities of Bacillus
megaterium LA51P and Bacillus aryhadtai KG12S.
+ The growth of Bacillus megaterium LA51P and Bacillus
aryhadtai KG12S
The bacterial growth curves of both the strains in medium were
the same (Figure 3.14). The growth rates were increased from 24
h to 48 h and reached the highest at 96 h (the log phase). From
96 h to 168 h, the growth did not change (the stationary phase).

Prime Archives in Biosciences
37 www.videleaf.com
+ Interactions between time, pH and temperature for the 2
strains
Analysis and construction of multi-variance regression equation
about the interactions of 3 factors including time, pH and
temperature by Statgraphics centurion XVI software. Based on
the equation identified the optimal treatments for environmental
factors to multiply the biomass of Bacillus megaterium LA51P
and Bacillus aryhadtai KG12S strains reached to the highest
flocculating activities.
Together with pH, two factors as time and temperature affected
to the flocculating activities clearly. The results in Table 3.17
showed that the interactions between pH, time and temperature
affected on the flocculating activities of the 2 strains.
Figure 3.14: The growth curves of the 2 strains overtime (24 to 168 h).
For Bacillus megaterium LA51P, at the levels of time (120 h)
and pH (6), the flocculating activities was the highest and did not
differ significantly at 3 levels of temperatures (30, 32 and 34°C).
Therefore, this train was multiplied at the 3 levels of
temperatures with fixing pH 6 and 120 h.
In the contrary, Bacillus aryhadtai KG12S had the highest
flocculating activity at the conditions of pH 6, 120 h and 34 oC.
Therefore, the medium, time (120 h) and temperature (34°C) of
culturing was the same for both the strains.

Prime Archives in Biosciences
38 www.videleaf.com
To reach the highest flocculating activities of Bacillus
megaterium LA51P and Bacillus aryhadtai KG12S, the
interactions of three factors as time, pH and temperature were
performed by the Statgraphics centurion XVI software to
determine the optimal environmental factors for multiply of
them.
Multi-variance regression equation about interactions of the 3
factors as time, temperature and pH to the flocculating activity of
Bacillus megaterium LA51P.
Flocculating activity (%) = - 371.622 + 10.0885 * Temperature
+ 5.85269 * pH + 4.22472 * Time – 0.146296 * Temperature *
Temperature – 1.23407 * pH * pH – 0.0186519 * Time * Time +
0.0163194 * Temperature * pH + 0.00144097 * Temperature *
Time + 0.0978819 * pH * Time – 0.00106771 * Temperature *
pH * Time
With the multi-variance regression equation was presented
above, replacing of Time = 120 h, pH = X = (5 – 7) and
temperature = Y = (30 - 34) and the Statgraphics centurion XVI
software was used to made a graph of surface plotting and graph
of contour, with the equation as following:
Table 3.17: Effects of time, pH and temperature on the flocculating activities
of Bacillus megaterium LA51P and Bacillus aryhadtai KG12S.
Strain Time
(h)
pH Temper
ature
( °C) 5 6 7
Bacillus
megaterium
LA51P
[LSD.01=
6.61]
96
69.78 68.18 66.56 30
70.63 69.02 67.17 32
70.38 70.72 66.89 34
120
83.19 85.18 80.34 30
85.87 85.65 81.12 32
85.67 86.09 81.08 34
144
75.43 76.32 78.89 30
76.98 77.89 78.91 32
75.18 78.09 77.97 34
Bacillus
aryhadtai
96
73.12 76.18 72.19 30
71.18 77.42 72.31 32
72.34 75.19 71.23 34
82.34 84.56 82.98 30

Prime Archives in Biosciences
39 www.videleaf.com
KG12S
[LSD.01=
2.78]
120 83.19 83.98 80.13 32
81.18 85.13 79.17 34
144
76.18 78.93 73.13 30
75.68 79.14 73.09 32
74.18 78.69 72.17 34
Flocculating activity (%) = - 371,622 + 10.0885 * Y + 5.85269
* X + 4.22472 * 120 – 0.146296 * Y * Y – 1.23407 * X * X –
0.0186519 * 120 * 120 + 0.0163194 * Y * X + 0.00144097 * Y
* 120 + 0.0978819 * X *120 – 0.00106771 * Y * X *120
From the Graph of surface plotting and graph of contour in
Figure 3.15 was used to made when replacing of TIME = 120
hour, pH = X (5 - 7) and TEMPERATURE = Y (30 - 34) had the
highest flocculating activity at 33oC and pH (5.7). Replacing of
TEMPERATURE = 33oC, TIME = X (96 - 144) and pH = Y (5 –
7) into the regression equation, the Statgraphics centurion XVI
software made a graph of surface plotting and graph of contour
with the equation as following:
Figure 3.15: Graph of surface plotting and graph of contour of the flocculating
activity to TIME = 120 hour, pH = X (5 - 7) and TEMPARATURE = Y (30 -
34).
Flocculant-activity (%) = - 371.622 + 10.0885 * 33 + 5.85269
* Y + 4.22472 * X – 0.146296 * 33 * 33 – 1.23407 * Y * Y –
0.0186519 * X * X + 0.0163194 * 33 * Y + 0.00144097 * 33 *
X + 0.0978819 * Y *X – 0.00106771 * 33 * Y * X

Prime Archives in Biosciences
40 www.videleaf.com
Figure 3.16: Graph of surface plotting and graph of contour of flocculating
activity of temperature = 33 °C, Time = X (96 - 144) and pH = Y (5 - 7)
From the Graph of surface plotting and graph of contour of the
flocculating activity in Figure 3.19 was made from the regression
equation when replacing of TEMPERARE = 29oC, TIME = X
(96 - 144) and pH = Y (5 - 7), showed that 2 factors: starch = X
= 124 hour and pH = Y = 5.7 had the best effective flocculating
activity.
Optimal conditions for the Growth of Flocculants Producing
Bacteria
To determine an optimal medium for the good growth of FPB,
one type of medium should be made with adequate nutritional
ingredients (carbon, nitrogen, minerals,..) for the growth of
bacteria. So, an experiment was carried out to look for the best
formula of medium. The result in Table 3.18 showed that the
medium containing 1 % sucrose and 5 % glutamic acid was an
optimal medium and gave the highest flocculating activities for
all the three strains.
Two treatments such as the first one included Starch (1 %),
glutamate (5 %), CaCl2 (0.5 %) and the second one included
Starch (1%), glutamate (5%), CaCl2 (0.75%) had the highest
flocculating activities (93.68%, 95.46%, respectively) and
differed from the others significantly (Table 3.19). While other
treatments had the lowest flocculating activities (43.56 % and
44.19%) including the third one included Starch (1.5%),
glutamate (2.5%), CaCl2 (0.5%) and the four one included starch
(1.5%), glutamate (7.5%), CaCl2 (0.25%).

Prime Archives in Biosciences
41 www.videleaf.com
Table 3.18: The optimal medium for the growth of Bacillus megaterium LA.51P and Bacillus aryhadtai KG12S.
Strain
Carbon sources Nitrogen sources
Mineral sources Glutamic acid
(5%)
Yeast extract
(0.05%)
Urea (0.05%) NH4SO4 (0.05%)
Bacillus
megaterium LA.51
LSD .01 = 2.72
Glucose
(1%)
79.35 57.89 11.40 50.63 MgSO4 (0.5 %)
65.33 49.96 9.33 51.23 CaCl2 (0.5 %)
60.16 55.17 10.98 49.06 FeCl3 (0.5 %)
63.86 59.44 13.77 52.38 K2HPO4 (0.2 %) + KH2PO4
(0.5 %)
Sucrose
(1%)
60.84 53.05 40.80 55.48 MgSO4 (0.5 %)
58.13 46.08 33.88 53.89 CaCl2 (0.5 %)
54.67 44.42 32.13 56.81 FeCl3 (0.5 %)
50.27 45.38 33.84 57.87 K2HPO4 (0.2%) + KH2PO4
(0.5%)
Starch
(1%)
65.62 73.59 77.71 60.34 MgSO4 (0.5 %)
86.12 71.33 77.86 59.67 CaCl2 (0.5 %)
65.09 74.18 75.67 60.23 FeCl3 (0.5 %)
63.69 76.31 77.64 57.47 K2HPO4 (0.2 %) + KH2PO4
(0.5 %)
Bacillus
aryhadtai KG12S
LSD .01 = 3.84
Glucose
(1%)
68.17 44.16 46.18 75.17 MgSO4 (0.5 %)
71.34 46.18 43.18 46.18 CaCl2 (0.5 %)
73.41 75.24 75.12 69.08 FeCl3 (0.5 %)
88.36 68.31 58.38 79.15 K2HPO4 (0.2 %) + KH2PO4
(0.5 %)
Sucrose
(1%)
62.34 66.19 51.72 70.02 MgSO4 (0.5 %)
66.18 68.16 49.17 69.53 CaCl2 (0.5 %)
69.98 69.09 52.18 66.17 FeCl3 (0.5 %)
79.95 55.18 53.85 69.09 K2HPO4 (0.2 %) + KH2PO4
(0.5 %)
Starch
(1 %)
68.17 42.39 42.14 71.23 MgSO4 (0.5 %)
65.87 50.18 68.13 70.21 CaCl2 (0.5 %)
71.24 54.14 71.28 72.18 FeCl3 (0.5 %)
81.42 76.16 79.14 78.19 K2HPO4 (0.2%) + KH2PO4
(0.5 %)
CV % = 2.76

Prime Archives in Biosciences
42 www.videleaf.com
Table 3.19: Effects of glutamate, glucose and minerals on flocculating activity
of Bacillus megaterium LA51P.
Carbon
sources
Nitrogen sources Inorganic
mineral
sources
(%)
Glutamate
(2.5 %)
Glutamat
e
(5.0 %)
Glutamat
e (7.5 %)
LA51P
LSD .01 =
13.05
CV % = 8.06
Starch
(0.5 %)
59.44 57.89 80.40 CaCl2
(0.25 %)
59.12 71.95 86.28 CaCl2
(0.50 %)
69.75 70.70 87.62 CaCl2
(0.75 %)
Starch
(1.0 %)
86.43 90.19 72.86 CaCl2
(0.25 %)
86.85 93.68 54.43 CaCl2
(0.50 %)
56.57 95.46 71.04 CaCl2
(0.75 %)
Starch
(1.5 %)
59.14 56.87 44.19 CaCl2
(0.25 %)
43.56 60.51 75.77 CaCl2
(0.50 %)
52.61 61.33 59.65 CaCl2
(0.75 %)

Prime Archives in Biosciences
43 www.videleaf.com
Table 3.20: Effects of glutamate, glucose and minerals on flocculating activity of Bacillus aryhadtai KG12S.
Carbon
source
Nitrogen sources Inorganic minerals sources
(%) Glutamate
(2.5 %)
Glutamate
(5.0 %)
Glutamate
(7.5 %)
KG12S
LSD .01 = 13.05
CV % = 8.06
Glucose
(0.5 %)
60.18 66.72 63.18 K2HPO4 (0.1 %) + KH2PO4 (0.25 %)
62.31 67.18 64.58 K2HPO4 (0.2 %) + KH2PO4 (0.5 %)
65.98 68.34 62.19 K2HPO4 (0.4 %) + KH2PO4 (1 %)
Glucose
(1.0 %)
76.24 87.88 81.19 K2HPO4 (0.1 %) + KH2PO4 (0.25 %)
77.11 88.36 82.18 K2HPO4 (0.2 %) + KH2PO4 (0.5 %)
75.98 91.35 85.47 K2HPO4 (0.4 %) + KH2PO4 (1 %)
Glucose
(1.5 %)
70.13 75.18 78.19 K2HPO4 (0.1 %) + KH2PO4 (0.25 %)
71.26 77.98 79.08 K2HPO4 (0.2 %) + KH2PO4 (0.5 %)
69.98 76.28 80.01 K2HPO4 (0.4 %) + KH2PO4 (1 %)
Table 3.21: Multi-variance regressive equation of interactions of 3 nutrient factors of Bacillus megaterium LA51P.
Equations
Starch (%) Glutamate (%) CaCl2
(%)
Flocculating activity (%) = - 24.6473 + 141.702 * starch + 15.225 * Glutamate + 56.9652 * CaCl2 – 55.7148 * starch * starch – 0.924148 * Glutamate
* Glutamate – 22.8237 * CaCl2 * CaCl2 – 7.80511 * starch * Glutamate – 61.5133 * starch * CaCl2 - 3.79022 * Glutamate * CaCl2 + 10.0467 * starch *
Glutamate * CaCl2
Flocculating activity (%) = - 23.7208 + 33.6744 * Y + 15.0676 * X + 134.774 *
1 – 57.9985 * 1 * 1 – 0.992919 * X * X – 15.358 * Y * Y – 5.94967 * 1 * X –
32.193 * 1 * Y – 1.23137 * X * Y + 5,27257 * 1 * X * Y
1
X
(2.5 -7.5 %)
Y
(0.25 -0.75 %)
Flocculating activity (%) = - 23.7208 + 33.6744 * 0.9 + 15.0676 * Y + 134.774
* X – 57.9985 * X * X – 0.992919 * Y * Y – 15.358 * 0.9 * 0.9 – 5.94967 * X *
Y – 32.193 * X * 0.9 – 1.23137 * Y * 0.9 + 5.27257 * X * Y * 0.9
X
(0.5 -1.5 %)
Y
(2.5 - 7.5 %)
0.9
Note: X, Y, Z were the changed variances of the factors (%) including starch, glutamate and CaCl2

Prime Archives in Biosciences
44 www.videleaf.com
Bacillus megaterium LA51P:
The multi-variance regression equation of interactions of 3
factors as starch, glutamate and minerals to the flocculating
activity of Bacillus megaterium LA51P (in Table 3.21).
Replacing of starch t = 1 %, glutamate = X (2.5 - 7.5 %) and
CaCl2 = Y (0.25 - 0.75 %) showed that 2 factors glutamate = X =
6.5 % and CaCl2 = Y = 0,9 % had the highest flocculating
activities. From the above results, replacing of CaCl2 = 0.9 %,
starch = X (0.5 - 1.5%) and glutamate = Y (2.5 - 7.5%) into
regressive equation showed that 2 factors: starch = X = 0.85 %
and glutamate = Y = 6.6 % had the highest biomass of bacteria.
Therefore, the medium contained 0.85% starch, 6.6 % glutamate
and 0.9 % CaCl2 were used to multiply for biomass of Bacillus
megaterium LA51P and reached the highest flocculating
activities. The formula of the medium was used for the further
experiments for flocculating activity of Bacillus megaterium
LA51P and the evaluation efficiency of piggery wastewater
treatment after biogas system.
Bacillus aryhadtai KG12S:
In Table 3.20, combinations of 1% glucose, 5% glutamic acid
and K2HPO4 (0.2%) + KH2PO4 (0.5%) in the medium had the
highest flocculating activities. However, finding of the optimal
conditions for the growth of Bacillus aryhadtai KG12S, an
experiment was carried out to select the best nutrient sources
(nitrogen, carbon, and minerals,..).
The results in Table 3.20 showed that the medium contained 1%
glucose + 5% glutamate + K2HPO4 (0.4 %) +KH2PO4 (1%) had
the highest flocculating activities.
The above results were used to determine the optimal medium
for Bacillus aryhadtai KG12S the multi-variance regressive
equation by the Statgraphics centurion XVI software. The results
of the analysis showed that the flocculating activity (%) was
correlated with 10 variances, regression equation:

Prime Archives in Biosciences
45 www.videleaf.com
Flocculating activity (%) = -5.225 + 114.399 * Glucose + 9.156
* Glutamate + 16.367 * minerals – 51.723 * Glucose * Glucose
– 0.829 * Glutamate * Glutamate – 2.531 * minerals * minerals
+ 0.186 *Glucose * Glutamate – 10.136 * Glucose * minerals –
1.775 * Glutamate * minerals + 1.767 * Glucose * Glutamate *
minerals
From the multi-variance regression equation, replacing of
glucose = 1 %, glutamate = X (2.5 – 7.5 %) and K2HPO4 +
KH2PO4 = Y = (0.35 – 1.4 %), the results from the Statgraphics
centurion XVI software with graph of surface plotting (Figure
3.20) and contour equation (Figure 3.1) with the equation as
following:
Flocculating activity (%) = - 5.22457 + 114.399*1 + 9.15619*x
+ 16.3672*y – 51.723*1*1 – 0.829452*x*x – 2.53061*y*y +
0.186333*1*x – 10.1361*1*y – 1.77456*x*y + 1.76748*1*x*y
From the Graph of surface plotting and Graph of contour
equation were made from the regression equation when replacing
of glucose = 1 %, glutamate = X (2.5 – 7.5 %) and minerals
K2HPO4 + KH2PO4 = Y (0.35 – 1.4 %) showed that 2 factors as
glutamate = X = 5.7 % and K2HPO4 + KH2PO4 = Y = 1.2 % had
the highest flocculating activities.
Figure 3.17: Graph of surface plotting of flocculating activity to glucose = 1%,
glutamate = X (2.5 – 7.5 %) and minerals K2HPO4 + KH2PO4 = Y (0.35 –
1.4 %)

Prime Archives in Biosciences
46 www.videleaf.com
Figure 3.18: Graph of contour equation of flocculating activity to glucose =
1 %, glutamate = X (2.5 – 7.5 %) and minerals K2HPO4 + KH2PO4 = Y (0.25 –
1.4 %)
From the above results, replacing of glutamate = Y (2.5 – 7.5 %),
glucose = X = (1.5 – 2.5 %) and K2HPO4 + KH2PO4 = 1.2 into
the regression equation, the Statgraphics centurion XVI software
made graph of surface plotting (Figure 3.19) and graph of
contour (Figure 3.20) with equation as:
Flocculating activity (%) = - 5.22457 + 114.399*x + 9.15619*y
+ 16.3672*1.2- 51.723*x*x – 0.829452*y*y – 2.53061*1.2*1.2
+ 0.186333*x*y – 10.1361*x*1.2 – 1.77456*y*1.2 +
1.76748*x*y*1.2
Figure 3.19: Graph of surface plotting of flocculating activity to minerals =
1.2%, glucose = X (0.5 - 1.5%) and glutamate = Y (2.5 - 7.5%).

Prime Archives in Biosciences
47 www.videleaf.com
Figure 3.20: Graph of contour equation of flocculating activity to minerals =
1.2%, glucose = X (0.5 - 1.5%) and glutamate = Y (2.5 - 7.5%).
From the Graph of surface plotting and the Graph of contour
equation (Figure 3.19 and 3.20) were made from regression
equation when replacing of minerals = 1.2%, glucose = X (0.5 -
1.5%) and glutamate = Y (2.5 - 7.5%), showed that 2 factors as
glucose = X = 1.12% and glutamate = Y = 5.7% had the highest
biomass of Bacillus aryhadtai KG12S.
Therefore, the medium which was supplemented with 1.12%
glucose, 5.7% glutamate and 1.2% minerals (K2HPO4 (0.4%) +
KH2PO4 (0.8%)) to multiply biomass of Bacillus aryhadtai
KG12S had the highest flocculating activity. The formula of
medium was used to further experiments for optimization of bio
flocculants producing by Bacillus aryhadtai KG12S and the
evaluation of effectiveness for piggery wastewater treatment
after biogas system.
Minerals Supplement:
In the previous experiment, the Kaolin suspension (control) as a
kind of mineral was used in the experiment of evaluation of
flocculating activity of the FPB strains. This experiment used
many kinds of mineral to replace the kaolin suspension in the
evaluation of flocculating activity.

Prime Archives in Biosciences
48 www.videleaf.com
The results in Table 3.22 showed that CaCl2 was a kind of
mineral which supported flocculating activity. The flocculating
activity reached 91.87%.

Prime Archives in Biosciences
49 www.videleaf.com
Table 3.22: Effects of the other minerals on flocculating activity of water added suspended solids
Minerals KCl NaCl CaCl2 MgSO4 MnSO4 FeCl3 Al2 (SO4)2 Kaolin
Flocculating
activity
(%)
70.18 d
66.24 e
91.87 a
86.23 b
83.12 c
88.21 b
70.18 d
21.12 f
LSD .01 = 2.18 ; CV =1.2%
Means within a column followed by the same letter/s are not significantly different at p < 0.01
Table 3.23: Interactions of time and bacterial population of the 2 strains after they were optimized.
Time
(h)
Bacillus megaterium LA51P Bacillus aryhadtai KG12S
Flocculating
activity
(%)
Population
CFU/mL)
OD
660
Flocculating
activity
(%)
Population
(CFU/mL)
OD 660
0 0.00 6.00 x 10³ 0.11 0.00 6.00 x 10³ 0.12
24 20.96 5.00 x 10⁷ 1.42 20.96 5.30 x 10⁷ 1.42
48 80.63 3.67 x 10⁹ 1.55 80.63 4.00 x 10⁹ 1.55
72 88.89 6.67 x 10⁹ 1.66 88.89 6.67 x 10⁹ 1.65
96 94.38 7.67 x 10⁹ 1.69 96.98 6.00 x 10⁹ 1.67
120 94.18 6.00 x 10⁹ 1.61 96.18 5.33 x 10⁹ 1.60
144 94.08 4.00 x 10⁹ 1.57 94.08 4.00 x 10⁹ 1.56
168 91.01 6.67 x 10⁸ 1.48 92.01 6.67 x 10⁸ 1.47
The results in Table 3.23 showed that time (96 h) and OD660 at 1.67 – 1.69 had the highest population for both strains
multiplied in the medium. These results were used for the next experiments.

Prime Archives in Biosciences
50 www.videleaf.com
Study on Bacteria Levels on Flocculating Activity:
At bacterial level of 0.2% used, the flocculating activity was the
highest. (Figure 3.21)
Means within a column followed by the same letter/s are not
significantly different at p < 0.01.
Figure 3.21: Effects of bacteria levels (%) to flocculating activities of Bacillus
megaterium LA51P and Bacillus aryhadtai KG12S
Interactions between Bacillus megaterium LA51P and
Bacillus aryhadtai KG12S:
When multiplying of the 2 strains in the fermented container, the
interactions between the 2 strains affected to the growth of the
flocculating activities and population of FPB isolates and
population.
The results in Table 3.23 showed that both the strains were not
against each other or they did not compete each other and they
grew parallel.

Prime Archives in Biosciences
51 www.videleaf.com
Application of FPB Strains for Wastewater Piggery after
Biogas System
Effects of Ph:
Due to pH of wastewater piggery collected from other sites
therefore pH varied from pH 3.52 to pH 8.13 and the FPB
isolates also developed very well at the suitable pH values.
Therefore, an experiment was carried out to find suitable ranges
of pH for the growth of the 2 strains.
The results in Figure 3.22 showed that at pH from 5.45 to 7.35,
both the strains developed very well. The pH values at near
neutral (6 – 7) were suited for the growth of the FPB isolates.
Effects of Minerals Supported Flocculating:
In reality, PAC and FeCl3 were used as minerals for supporting
flocculating and replacing of Kaolin.
Figure 3.22: Interactions between pH of medium and the FPB strains.
Besides, supplementary of minerals were necessary for
flocculating activity of the FPB strains in wastewater piggery
treatment. In the farm-yard, farms often applied PAC and/or
FeCl3 (as support to flocculation agent) into wastewater
treatment.

Prime Archives in Biosciences
52 www.videleaf.com
Figure 3.23: Effects of minerals on flocculating activity.
Figure 3.24: Effects of combination of PAC and FeCl3 on flocculating activity
Note: P1: Bacillus megaterium LA51P; P2: Bacillus megaterium TG13P; S1:
Bacillus aryabhattai KG12S and S2: Klebsiella pneumoniae ST71S
The results in Figure 3.23 and 3.24, combination of FeCl3 (0.5
g/l) and PAC (0.5 g/L) plus bacterial level (2 ml/L) were used in
the next experiments.
Application of the FPB Strains on Wastewater Piggery
Treatment: 10-L Container
The four strains were applied in this experiment together with
positive control (PAC 0.5 g/L; FeCl3 0.5 g/L), negative control
(no bacteria no PAC) in wastewater piggery treatment at pH 6,
OD550 = 1.261 plus 0.2% bacteria liquid, the results were
presented at Figure 3.25 and Figure 3.26.

Prime Archives in Biosciences
53 www.videleaf.com
Figure 3.25: Effects of the 4 FPB strains on piggery wastewater treatment.
Figure 3.26: Effects of the 4 FPB strains on flocculating rates (%) of piggery
wastewater.
Note: P1: Bacillus megaterium LA51P; P2: Bacillus megaterium TG13P; S1:
Bacillus aryabhattai KG12S; S2: Klebsiella pneumoniae ST71S; P1S1; P1S2;
P2S1; P2S2 were treatments of combination of the 2 strains.
The results in Figure 3.25 showed that the flocculating activities
of the treatment P1 (Bacillus megaterium LA51P), the treatment
P1S1 (Bacillus megaterium LA51P and Bacillus aryabhattai
KG12S) and treatment S1 (Bacillus aryabhattai KG12S) were
80.66, 72.36 and 70.28 %, respectively. The samples of three
treatments were analysed together with positive control and
negative control.
The results in Table 3.24 showed that the combination of the 2
strains could reduce TSS concentration and TP concentration
strongly. However, the single strain reduced COD (>50%), TN
(>40%) and TKN (>40%) concentrations but still not reached the
standard of the Regulation (QCVN 40_2011/BTNMT).

Prime Archives in Biosciences
54 www.videleaf.com
Table 3.24: Effects of Bacillus megaterium LA51P, Bacillus aryabhattai
KG12S) and combination of Bacillus megaterium LA51P and Bacillus
aryabhattai KG12S on wastewater piggery treatment after biogas system.
Target
Control
Biogas*
Flocculating activity (%) Regulation
QCVN
40_2011/BTN
MT
KG12
S**
LA51P** LA51P_
KG12S**
A B
TSS
(mg/L)
153.50 50.33 28.83 18.67 20 40
COD
(mg/L)
1104.00 542,67 310.33 513.00 75 150
TKN
(mg/L)
311.02 69,12 104.61 136.83 5 10
TN (mg/L) 369.86 92,47 126.09 153.18 50 100
TP (mg/L) 4.54 0.66 0.68 0.38 4 6
*one replicates, **3 replicates
Applications of the FPB Strains on Wastewater Piggery
Treatment: 100-L Container
In bigger volume (100-L), two treatments as Bacillus
megaterium LA51P and combination of Bacillus megaterium
LA51P and Bacillus aryabhattai KG12S were used in this study
together with controls (positive and negative).
Application of Bacillus megaterium LA51P into wastewater
treatment, the results showed that concentrations of BOD5,
COD, TN, TSS, TP and TKN reduced in comparison to negative
control were 81.46 %, 87.61 %, 84.05 %, 86.11 % and 80.42 %,
respectively.

Prime Archives in Biosciences
55 www.videleaf.com
Table 3.25: Effects of Bacillus megaterium LA51P and combination of
Bacillus megaterium LA51P and Bacillus aryabhattai KG12S on wastewater
piggery after biogas system (100-L).
Target
Negative
Control
Control
PAC
LA51
P
LA51
P+
KG12
S
Regulation
QCVN
40_2011/BTNMT
A B
TSS
(mg/L)
1975.00 1116.67 226.33 274.33 50 100
COD
(mg/L)
2314.00 1540.00 913.33 286.67 75 150
BOD5 at
20 °C
(mg/L)
1025.00 680.00 386.67 190.00 30 50
TN
(mg/L)
368.93 335.31 152.24 58.84 20 40
TKN
(mg/L)
198.01 196.14 81.26 63.20 5 10
TP
(mg/L)
34.29 23.17 4.10 6.71 4 6
However combination of Bacillus megaterium LA51P and
Bacillus aryabhattai KG12S also had good efficiency for
wastewater treatment (Table 3.25). Therefore, combination of
Bacillus megaterium LA51P and Bacillus aryabhattai KG12S
was used for the study at volume of 1 m3 and 40 m
3.
Application of the FPB Strains on Wastewater Piggery
Treatment: 1 m3
The experiment was designed in plastic containers (>1.000 L)
(Figure 3.27). Application of combination of Bacillus
megaterium LA51P and Bacillus aryabhattai KG12S together
with 2 controls.

Prime Archives in Biosciences
56 www.videleaf.com
Figure 3.27: The experiment designed in the plastic containers (>1000 L).
Application of combination of the 2 strains reduced
concentrations of BOD5, COD and TSS in wastewater piggery in
comparison to negative control were 82%, 78.83% and 66.46%,
respectively.
Table 3.26: Effects of combination of Bacillus megaterium LA51P and
Bacillus aryabhattai KG12S on wastewater piggery treatment (after biogas
system) (1000-L).
Target
Negati
ve
contro
l*
Positive
Control*
LA51P +
KG12S**
Regulation QCVN
40_2011/BTNMT
A B
TSS (mg/L) 81.50 125.00 27.33 50 100
COD
(mg/L)
403.00 289.00 85.33 75 150
BOD5 at
20 °C
(mg/L)
200.00 145.00 36.00 30 50
TN (mg/L) 88.73 39.23 70.61 20 40
TKN
(mg/L)
72.85 31.76 40.37 5 10
TP (mg/L) 0.48 17.69 3.06 4 6
*one replicates, **3 replicates

Prime Archives in Biosciences
57 www.videleaf.com
Application of the FPB Strains on Wastewater Piggery
Treatment: 50 m3
Three ponds were made to contain piggery wastewater (Figure
3.28), every pond contained over 50 m3 wastewater and bacteria
liquid.
Figure 3.28: The experiment designed in the ponds containted >40 m3 piggery
wasterwaster
After 24 h, wastewater divided into 2 parts: supernatant with
height 0.8 m and bottom mud approximately 0.2 m (Figure 3.27).
The supernatant was collected to analyze. The bottom mud were
moved to small material-contain pond, dried slowly and then
applied to Mango trees (very good). The results of analyzing of

Prime Archives in Biosciences
58 www.videleaf.com
supernatant samples were presented in Table 3.27.
Concentrations of BOD5, COD and TSS reduced in comparison
to negative control were 93.67 %, 92.51 % and 82.48 %,
respectively; and to positive control (PAC (1g/L) were 92.40 %,
90.79 % and 86.89 %, respectively. Concentrations of BOD5,
COD and TSS reached to A standard of the regulation (QCVN_
40/2011/BTNMT).
Thus, the FPB strains (combination of Bacillus megaterium
LA51P and Bacillus aryabhattai KG12S strains) for wastewater
piggery treatment (after biogas system) in the first stage (1 h),
the toxic materials in wastewater depleted gradually. After that,
the wastewater was applied with heterotrophic nitrogen removal
bacteria and poly-P accumulating bacteria to treat completely
and then drained to rivers/canals.
Table 3.27: Effects of combination of Bacillus megaterium LA51P and
Bacillus aryabhattai KG12S strains for wastewater piggery treatment (after
biogas system).
Target
Negative
control*
Positive
Control
*
LA51P +
KG12S**
Regulation QCVN
40_2011/BTNMT
A B
TSS (mg/L) 137.00 183.00 24.00 50 100
COD (mg/L) 501.00 407.00 37.50 75 150
BOD5 at
20 °C (mg/L)
300.00 250.00 19.00 30 50
TN (mg/L) 12.59 2.42 3.09 20 40
TKN (mg/L) 31.94 161.96 18.50 5 10
TP (mg/L) 35.87 194.46 20.74 4 6
Conclusion
Isolation of 389 FPB isolates including 154 Protein FPB isolates
and 235 Polysaccharide FPB isolates from polluted water in tra-
fish ponds of 10 provinces and 119 FPB isolates including
Protein FPB isolates and 102 Polysaccharide FPB isolates from
147 samples collected wastewater piggery from 13 cities and
provinces in the Mekong Delta.

Prime Archives in Biosciences
59 www.videleaf.com
Identification of 54 isolates had the highest flocculant activity by
PCR 16S rRNA showed that Bacilli occupied majority with
more 80%, 20% were negative-gram bacteria,
Selected 4 strains (2 were Protein FPB and 2 were
Polysaccharide FPB) for wastewater treatment, the results
received that application 2 strains in polluted water of tra-fish
ponds treatment, reduced TSS, BOD5, COD concentrations after
72 h and wastewater piggery decreased TSS, BOD5, COD and
TN concentrations, reached to B standard of the Regulation
QCVN 40_2011/BTNMT. The water after biological treatment
with FPB strains can release to canals/rivers or treated with
heterotrophic removal bacteria and poly-P bacteria to reach to A
standard.
References
1. Ismail MYB. Biological Nutrient Removal Using
Sequencing Batch Bioreactor. A thesis of the degree of
Bachelor of Chemical Engineering. Faculty of Chemical &
Natural Resources Engineering Universiti Malaysia Pahang.
2009.
2. Zhao H, Liu H, Zhou J. Characterization of a bioflocculant
MBF-5 by Klebsiella pneumoniae and its application in
Acanthamoeba cysts removal. Bioresource Technology.
2013; 137: 226 – 232.
3. Salehizadeh H, Shojaosadati S. Extracellular biopolymeric
flocculants: recent trends and biotechnological importance.
Biotechnology Advances. 2001; 19: 371 – 385.
4. Xia S, Zhang Z, Wang X, Yang M, Chen L, et al. Production
and characterization of a bioflocculant by Proteus mirabilis
TJ-1. Bioresource Technololy. 2008; 99: 6520-6527.
5. Qin L, Liu J, Li G, Kang Y. Removal of Tannic Acid by
Chitosan and N-Hydroxypropyl Trimethyl Ammonium
Chloride Chitosan: Flocculation Mechanism and
Performance. J. Dispersion Science and Technology. 2015;
36: 695–702.
6. Dearfield KL, Abernathy CO, Ottley MS, Brantner JH,
Hayes PF. Acrylamide: its metabolism, developmental and

Prime Archives in Biosciences
60 www.videleaf.com
reproductive effects, genotoxicity, and carcinogenicity.
Mutat.Res. 1988; 195: 45–77.
7. Tong Z, Zhe L. Microbial flocculant and its application in
environmental protection. Journal of Environmental Science.
1999; 11: 1–12.
8. Sponza DT. Extracellular polymer substances and
physicochemical properties of flocs in steady and unsteady-
state activated sludge systems. Process Biochemistry. 2002;
37: 983–998.
9. Yang Z, Yuan B, Huang X, Zhou J, Cai J, et al. Evaluation of
the flocculation performance of carboxymethyl chitosan-
graft-polyacrylamide, a novel amphoteric chemically bonded
composite flocculant. Water Research. 2012; 46: 107–114.
10. Yim JH, Kim SJ, Ahn SH, Lee HK. Characterization of a
novel bioflocculant, p-KG03, from a marine dinoflagellate,
Gyrodinium impudicum KG03. Bioresource Technology.
2007; 98: 361–367.
11. Gonzalez-Torres A Putnam J, Jefferson B, Stuetz RM,
Henderson RK. Examination of the physical properties of
Microcystis aeruginosa flocs produced on coagulation with
metal salts. Water Research. 2014; 60: 197–209.
12. Ugbenyen AM, Cosa S, Mabinya LV, Okoh AI. A.
Bioflocculant production by Bacillus sp. Gilbert isolated
from a marine environment in South Africa. Applied
Biochemistry and Microbiology. 2014; 50: 49–54.
13. Fattom A, Shilo M. Phormidium J-1 bioflocculant-
production and activity. Archives Microbiology. 1984; 139:
421–426.
14. Okaiyeto K. Characterization of a bioflocculant (MBF-UFH)
produced by Bacillus sp. AEMREG7. Int. J. Mol. Sci. 2015;
16: 12986–13003.
15. Prasertsan P, Dermlim W, Doelle H, Kennedy JF. Screening,
characterization and flocculating property of carbohydrate
polymer from newly isolated Enterobacter cloacae WD7.
Carbohydate Polymers. 2006; 66: 289–297.
16. Aljuboori AHR, Uemura Y, Osman NB, Yusup S. Production
of a bioflocculant from Aspergillus niger using palm oil mill
effluent as carbon source. Bioresources Technology. 2014;
171: 66–70.

Prime Archives in Biosciences
61 www.videleaf.com
17. Deng SB, Yu G, Ting YP. Production of a bioflocculant by
Aspergillus parasiticus and its application in dye removal.
Colloid Surfaces B – Biointerfaces. 2005; 44: 179–186.
18. Kurane R, Takeda K, Suzuki T. Microbial flocculants.1.
Screening for and characteristics of microbial flocculants.
Agricutural and Biological Chemistry. 1986; 50: 2301–2307.
19. Ndikubwimana T, Zeng X, He N, Xiao Z, Xie Y, et al.
Microalgae biomass harvesting by bioflocculation-
interpretation by classical DLVO theory. Biochemical
Engineering Journal. 2015; 101: 160–167.
20. Zhang X, Sun J, Liu X, Zhou J. Production and flocculating
performance of sludge bioflocculant from biological sludge.
Bioresource Technology. 2013; 146: 51–56.
21. Hazana R, Norli I, Ibrahimand M, Fazilah A. Flocculating
activity of bioflocculant producing bacteria isolated from
closed drainage system (CDS) at the Prai Industrial Zone,
Penang, Malaysia. International Conference on
Environmental Research and Technology, (ICERT’ 08).
2008; 422-425
22. Deng SB, Bai RB, Hu XM, Luo Q. Characteristics of a
bioflocculant produced by Bacillus mucilaginosus and its use
in starch wastewater treatment, Applied Microbiology
Biotechnology. 2003; 60: 588 - 593.
23. Tang J, Qi S, Li Z, An Q, Xie M, et al. Production,
purification and application of polysaccharide-based
bioflocculant by Paenibacillus mucilaginosus. Carbohydrate
Polymers. 2004; 113: 463–470.
24. Wu JY, Ye HF. Characterization and flocculanting properties
of an extracellular biopolymer produced from a Bacillus
subtilis DYU1 isolate. Process Biochemistry. 2007; 42:
1114-1123.
25. Kurane R, Matsuyama H. Production of a bioflocculant by
mixed culture. Bioscience, Biotechnology, and Biochemistry.
1994; 58: 1589-1594.
26. Gao J, Bao HY, Xin MX, Liu YX, Li Q, et al.
Characterization of a bioflocculant from a newly isolated
Vagococcus sp. W31. Journal of Zheijiang University.
Sciences. B. 2006; 7: 186-192.
27. Kurane R, Hatamochi K, Kakuno T, Kiyohara M,
Kawaguchi K, et al. Purification and characterization of

Prime Archives in Biosciences
62 www.videleaf.com
liquid bioflocculant produced by Rhodococcus erythropolis.
Bioscience, Biotechnology, and Biochemistry. 1994; 58:
1977-1982.
28. Zhang ZQ, Lin B, Qing XS, Jiang WX, Ming YA.
Production and application of a novel bioflocculant by
multiple-microorganism consortia using brewery wastewater
as carbon source. Journal of Environmental Sciences. 2007;
19: 667–673.
29. Aljuboori AHR, Idris A, Abdullah N, Mohamad R.
Production and characterization of a bioflocculant produced
by Aspergillus flavus. Bioresource Technology. 2013; 27:
489–493.
30. Lachhwani. P. Studies on Polymeric Bioflocculant Producing
Microorganisms. Master Thesis, Thapar Institute of
Engineering and Technology. Patiala, India. 2005.
31. Neumann B, Pospiech A, Schairrer HU. Rapid isolation of
genomic DNA from Gram negative. Trends Gent. 1992; 8:
332-333.
32. Jie G, B Hua-ying, X Ming-xiu, L Yuan-xia, L Qian, et al.
Characterization of a bioflocculant from a newly isolated
Vagococcus sp. W31. Journal of Zhejiang University
Science. 2006; 7: 186-192.
Related Documents