volume 9 Number 31981 Nucleic Acids Research Isolation, characterization and restriction endonuclease mapping of the Petunia hybrida chloroplast DNA W.A.Bovenberg, A.J.Kool and H.JJ.Nijkamp Department of Genetics, Biological Laboratory, Vrije Universiteit, De Boelelaan 1087, 1007 MC Amsterdam, The Netherlands Received 9 December 1980 ABSTRACT A procedure is developed for the isolation of intact chloroplast DNA (ctDNA) from Petunia hybrida. The molecular weight, calculated from contour length measurements, is 96.0 +4.5 x 10 daltons. This value is in good agreement with the value of 101.2 x 10^ daltons that was estimated from the electrophoretic mobilities of restriction endonuclease fragments of ctDNA. Analysis of petunia ctDNA in neutral CsCl gradients revealed the presence of only one type of DNA at a buoyant density of 1.6987 +_ 0.0005 gem" 3 . This corresponds with a GC-content of 39.3 +_ 0.5%. A physical map of petunia ctDNA was constructed by using the restriction endonucleases Sal I, Bgl I, Hpa I and Kpn I. The map indicates that petunia ctDNA contains two copies of a sequence in an inverted orientation. The inverted repeat regions have a minimum length of 10 x 10 6 daltons. Hybridization data indicate that part of the inverted repeat regions contain the genes for chloroplast ribosomal RNAs. INTRODUCTION For the study on the genetic organization and regulation of expression of ctDNA genes, involved in chloroplast biogenesis, we use tissue cultures of Petunia hybrida. Such plant cell cultures are valuable tools for the study of chloroplast biogenesis because cytokinin can be used to induce developmental processes that lead to the transition of undifferentiated plastids into chloroplasts (1, 2). In addition, chemical mutagenesis can be employed to isolate various mutants with an altered pattern of chloroplast biogenesis (3). For the study of the expression of at least part of the chloroplast genome, we can use isolated petunia chloroplasts. Such chloroplasts are able to perform light-driven and ATP-driven protein synthesis (4). However, for a full understanding of the coding properties and genetic organization of the petunia ctDNA, the physical mapping of genes and the study of the expression of cloned ctDNA in various in vitro systems will be essential. A prerequisite for this research is the availability of a restriction endonuclease map of the ctDNA. Restriction © IRL Press Umited. 1 Falconberg Court, London W1V 5FG, U.K. 503

Welcome message from author
This document is posted to help you gain knowledge. Please leave a comment to let me know what you think about it! Share it to your friends and learn new things together.
Transcript

volume 9 Number 31981 Nucleic Acids Research
Isolation, characterization and restriction endonuclease mapping of the Petunia hybrida chloroplastDNA
W.A.Bovenberg, A.J.Kool and H.JJ.Nijkamp
Department of Genetics, Biological Laboratory, Vrije Universiteit, De Boelelaan 1087, 1007 MCAmsterdam, The Netherlands
Received 9 December 1980
ABSTRACT
A procedure is developed for the isolation of intact chloroplast DNA(ctDNA) from Petunia hybrida. The molecular weight, calculated from contourlength measurements, is 96.0 + 4 . 5 x 10 daltons. This value is in goodagreement with the value of 101.2 x 10^ daltons that was estimated from theelectrophoretic mobilities of restriction endonuclease fragments of ctDNA.Analysis of petunia ctDNA in neutral CsCl gradients revealed the presenceof only one type of DNA at a buoyant density of 1.6987 +_ 0.0005 gem"3. Thiscorresponds with a GC-content of 39.3 +_ 0.5%. A physical map of petuniactDNA was constructed by using the restriction endonucleases Sal I, Bgl I,Hpa I and Kpn I. The map indicates that petunia ctDNA contains two copiesof a sequence in an inverted orientation. The inverted repeat regions havea minimum length of 10 x 106 daltons. Hybridization data indicate that partof the inverted repeat regions contain the genes for chloroplast ribosomalRNAs.
INTRODUCTION
For the study on the genetic organization and regulation of expression
of ctDNA genes, involved in chloroplast biogenesis, we use tissue cultures
of Petunia hybrida. Such plant cell cultures are valuable tools for the
study of chloroplast biogenesis because cytokinin can be used to induce
developmental processes that lead to the transition of undifferentiated
plastids into chloroplasts (1, 2). In addition, chemical mutagenesis can be
employed to isolate various mutants with an altered pattern of chloroplast
biogenesis (3). For the study of the expression of at least part of the
chloroplast genome, we can use isolated petunia chloroplasts. Such
chloroplasts are able to perform light-driven and ATP-driven protein
synthesis (4). However, for a full understanding of the coding properties
and genetic organization of the petunia ctDNA, the physical mapping of
genes and the study of the expression of cloned ctDNA in various in vitro
systems will be essential. A prerequisite for this research is the
availability of a restriction endonuclease map of the ctDNA. Restriction
© IRL Press Umited. 1 Falconberg Court, London W1V 5FG, U.K. 503

Nucleic Acids Research
endonuclease maps have been described for the ctDNAs from a number of higher
plants, e.g. Zea mays (5), Spinaoia oleracea (6), Nieotiana tabaeum (7),
Vioia faba (8) and also for the algae Chlamydomonas reinhardii (9) and
Euglena gvaoilis (10). Electronmicroscopic studies and hybridization of
chloroplast ribosomal RNA (rRNA) to ctDNA restriction fragments have
indicated that ctDNA of Spinaoia oleraoea (11), Zea mays (12) and
Chlamydomonas reinhardii (13) contain two copies of rRNA genes, located in
inverted repeat regions. In Pisim sativwn (11) two copies and in Euglena
graailis (14) three copies of these genes are present in a tandem array.
Vioia faba (8) contains only one set of rRNA genes.
In this paper we present a procedure for the isolation of intact petunia
chloroplast DNA, because methods described for the isolation of ctDNA from
other plant species were not suitable for petunia. A restriction endonuclease
map of the ctDNA was constructed by using the enzymes Sal I, Bgl I, Hpa I
and Kpn I.
MATERIALS AND METHODS
Preparation of chloroplast DNA
About 400g of leaves from 4-5 months old petunia plants were washed in
water and homogenized in 2 1 of ice-cold buffer A (0.05 M Tris-HCl pH 8.0,
0.35 M sucrose, 7 mM EDTA and 5 mM 2-mercaptoethanol), by using a Braun
blendor (four 10 seconds bursts at medium speed). The homogenate was filtered
through four layers of nylon netting of 200 um and again through four
layers of 50 um. The filtrate was centrifuged at 1,000 x g for 8 min at
4 C. The crude chloroplast pellets were resuspended in buffer A and washed
twice by centrifugation at 1,000 x g for 8 min. The final chloroplast pellet
was gently resuspended in buffer B (0.05 M Tris-HCl pH 8.0, 0.02 M EDTA)
in a total volume of 51.2 ml. In order to lyse the chloroplasts, 12.8 ml of
buffer B containing 10% sodium sarkosyl was added and the mixture was
incubated for 1 h at 20 C. (When the chloroplasts contained a lot of starch
the lysate was centrifuged at 2,700 x g for 5 min to remove most of the
starch grains). The lysate was transfered to polyallomer tubes (8 ml per
tube) and 8.4 g of CsCl was added to each tube and dissolved by gently
rolling the tubes on a flat surface. Ethidium bromide was added (120 ug/ml)
and the tubes were centrifuged in a Beckmann 65H roter at 35,000 rpm for
60 h at 15 C. Under ultraviolet light two fluorescent DNA bands were
visible in each gradient. The DNA bands were collected seperataly and
extracted three times with an equal volume of isopropanol that had been
504
Nucleic Acids Research
saturated with CsCl in buffer C (0.01 M Tris-HCl pH 8.0, 1 mM EDTA), in
order to remove ethidium bromide. The DNA fractions were dialyzed against
four 1 1 changes of buffer C for 40 h at 4°C, followed by ethanol
precipitation for 16 h at -20°C. The precipitated DNA was pelleted at 2,700
x g for 20 min at 4 C and dissolved by soaking the pellets in 300 ul of
buffer D <5 mM Tris-HCl pH 8.0, 0.5 mM EDTA) for 72 h at 4°C. The same
method as described above was used for the isolation of ctDNA from
exponentially growing Petunia hybvida cell suspension cultures. Petunia
cell suspension cultures were grown as described previously (3).
Preparation of mitochondrial DNA
Homogenates from leaves were prepared and filtered as described above.
The filtrate was centrifuged twice at 1,000 x g for 10 min in order to
remove most of the chloroplasts. The remaining chloroplasts (small and
disrupted chloroplasts) were removed by centrifugation at 3,000 x g for
15 min. The resulting supernatant was centrifuged at 20,000 x g for 15 min.
Mitochondrial pellets were washed twice in buffer A and resuspended in
buffer B. Mitochondria were lysed in 2% sarkosyl and mitochondrial DNA
(mtDNA) was purified by dye-buoyant density centrifugation as described
for ctDNA.
Analytical ultracentrifugation
Equilibrium centrifugation of 1-2 ug of DNA in neutral CsCl solutions
(p = 1.710 gem ) was performed in an AN-F Ti rotor in a Beckmann model E
analytical ultracentrifuge equipped with a photoelectric scanner.
Centrifugation was at 40,000 rpm for 24 h at 22°C. Miovoooocus lysodeiktiaus
DNA of density 1.731 gem was included with the sample as a density
standard. Buoyant densities and base compositions were calculated according
to the method of Schildkraut et at. (15).
Electron microscopy
Chloroplast DNA, purified by CsCl density gradient centrifugation, was
prepared for electron microscopy as described by Ferguson and Davis (16).
Fifteen microliter of a solution containing 0.1 M Tris-HCl pH 8.5, 10 mM
EDTA, cytochrome c (100 yg/ml), 30% formamide, 0.1 yg ctDNA and 1.4 pg
Clo DF13 DNA (added as marker) was spread on a hypophase that consisted of
10 mM Tris-HCl pH 8.5 and 10% formamide. The protein-nucleic acid layer
was picked up on parlodion-coated grids (Pellco, mesh 400), stained with
uranyl acetate, rotary shadowed with platinum-palladium (80:20) wire and
covered with carbon. The grids were examined at 60 kV in a Zeiss electron
microscope EM10.
505

Nucleic Acids Research
Restriction endonucleases
Sal I was prepared by the method of Greene et at. (17). Bgl I and Bam HI
were purchased from Boehringer, Mannheim; Hpa I and Kpn I were purchased from
New England Biolabs. Chloroplast DNA was digested with restriction
endonucleases as described by the suppliers. Reactions were terminated by
adding 0.25 vol. of a solution containing 50 mM Tris-HCl pH 7.8, 125 mM
EDTA and 0.06% bromphenol blue.
Agarose gel electrophoresis
Digests of ctDNA and mtDNA were analysed by electrophoresis on horizontal
slab gels (25 x 20 x 0.5 cm), containing 0.5 - 1.5% agarose (Sigma, low EEO)
depending on the size of the DNA fragments to be seperated. Electrophoresis
was performed in 40 mM Tris-acetate pH 7.5, 20 mM sodium acetate, 2 mM
EDTA and ethidium bromide (0.5 yg/ml). Gels were run for 16-20 h at 2 mA/cm,
examined under UV-light and photographed.
Molecular weights of ctDNA restriction fragments were estimated relative
to molecular weight markers: phage A DNA and Hindlll and Eco RI digestion
fragments of X DNA (Boehringer, Mannheim) .
P-labeling of ctDNA
To improve detection of low molecular weight DNA restriction fragments32
on agarose gels, the ctDNA was labeled in Vitro with 5'- a- P dATP. The
use of radioactive DNA has the additional advantage that high and low
molecular weight DNA fragments can be made visible on the same gel, simply
by varying the exposure time for autoradiography. The nick-translation
method of Rigby et al. (18) was modified as follows: Chloroplast DNA was
digested with the appropriate restriction endonuclease, precipitated in
ethanol and dissolved in TE buffer (5 mM Tris-HCl pH 8.0, 0.5 mM EDTA). The
digested DNA (about 2 Ug) was added to an incubation mixture containing:
50 mM NaCl, 6 mM Tris-HCl pH 7.4, 6 mM MgCl_, 6 mM 2-mercaptoethanol,
BSA (100 yg/ml), 1 ul DNA polymerase I (Kornberg polymerase, Boehringer,
specific activity 7635 U/mg), 0.01 mM dCTP, dTTP, dGTP and 0.001 mM
5'- a- P dATP (specific activity 400 Ci/mmol) in a total volume of 50 ul.
DNADO I was added to the incubation mixture in a final concentration of
5 pg/50 pi. After incubation for 2 h at 15°C, 5 pi of a 250 mM EDTA solution
was added and the mixture was heated for 10 min at 65°C. Ammonium acetate
was added to a final concentration of 2M and the labeled ctDNA fragments
were precipitated in ethanol for 15 min at -70°C. The precipitate was
centrifuged for 15 min at 12,000 x g, dissolved in 250 yl 0.3 M Na acetate
(pH 5.6) and again precipitated. The latter step was repeated three times.
506

Nucleic Acids Research
Finally the pellet was vacuum dried and dissolved in 50 yl TE buffer. By
this method the ctDNA was labeled to a specific activity of about 6 x 10
dpm/yg. The nick-translation procedure causes some degradation of the large
fragments, by which these fragments are present in less than equimolar
amounts.
Secondary digestion of DNA fragments isolated from LGT agarose gels
For the physical mapping of DNA fragments, generated by digestion with
restriction endonucleases, the procedure described by Herrmann et al. (19)
was modified as follows: About 500,000 dpm of P-labeled primary ctDNA
restriction endonuclease digests were mixed with 3 yg of unlabeled primary
digests and subjected to electrophoresis on horizontal slab gels, containing
0.5% low-gelling-temperature (LGT) agarose (Seaplaque, Marine Colloids Inc.).
Gels were run at 80 mA for 16-24 h, examined under UV-light, and DNA
fragments were cut out. Gel slices containing individual DNA bands were
liquified by heating for 2 min at 68 C. The salt concentration was adjusted
and secondary digestion was performed with 5-10 units of restriction
endonuclease for 1.5 h at 37 C. Reactions were terminated as described
above and the samples were subjected to electrophoresis on horizontal
agarose slab gels, containing 0.8 - 2.0% agarose. Gels were dried under
vacuum and exposed to Kodak XR-1 films.32
Hybridization of P-labeled rRNA to ctDNA restriction fragments32
The P-labeled rRNA was prepared from E. ooli P678-54(2O) by in vivo32
labeling with P-orthophosphate as described by Vereijken (21). The32 7
isolated P-labeled rRNA had a specific activity of about 6.10 dpm/yg.
Preparation of diazobenzyloxymethyl-paper (DBM-paper), transfer of ctDNA
restriction endonuclease fragments to DBM-paper, and hybridization of32P-rRNA to DBM-paper strips, containing the transferred ctDNA fragments
was performed according to Wahl et al. (22).
RESULTS AND DISCUSSION
Isolation of petunia ctDNA
Methods described for the isolation of ctDNA from higher plants (2 3, 24)
were not suitable for the isolation of DNA from Petunia hybrida chloroplasts,
probably because these chloroplasts are much more fragile. The DNAse
treatment, that is used in these methods to remove contaminating nuclear
DNA (nDNA) from the chloroplast preparation, resulted in degradation
of petunia ctDNA. Therefore we developed an isolation procedure that lacks
the DNAse treatment. Furthermore, centrifugation steps used for the
507

Nucleic Acids Research
isolation and washing of the chloroplasts may not exeed 1,200 x g to prevent
disruption of the chloroplasts.
When petunia chloroplast lysates are subjected to CsCl-ethidium bromide
centrifugation, two fluorescent DNA bands are visible in the gradients under
ultraviolet light. Electron microscopic analysis of the lower band indicates
that this band represents covalently closed circular ctDNA. Digestion of
this DNA with restriction endonuclease Bam HI did not show any contamination
with mitochondrial DNA which has a quite different Bam HI restriction
profile (results not shown). The ctDNA from the upper band in the CsCl
gradient is also suitable for restriction endonuclease mapping work,
although some contaminating nuclear DNA may be present, resulting in a
slight smear when the DNA is analyzed by electrophoresis on agarose gels.
Starting from 400 g of leaves, the method described in Materials and Methods
yields about 250 yg of lower and upper band ctDNA.
The same method is also suitable for the isolation of ctDNA from Petunia
hybrtda cell suspension cultures that have been grown in our laboratory
for four years. The fragments obtained upon digestion of this DNA with-
several restriction endonucleases did not differ from the fragments
obtained upon digestion of ctDNA isolated from leaf chloroplasts (results
not shown). This implies that major genetic alterations in the ctDNA did not
occur during this period of in vitvo culture of petunia cells.
Physical characterization of chloroplast DNA
Buoyant density and base composition. Samples containing 1 yg of upper
band or lower band ctDNA, mtDNA and nDNA were subjected to equilibrium CsCl
density gradient centrifugation. Both upper band and lower band ctDNA bands
at a buoyant density of 1.6987 _+ 0.0005 gem (Fig. la and b) . This value
corresponds with a GC-content of 39.3 +_ 0.5%. The buoyant density of
petunia ctDNA agrees with the value of 1.698 +_ 0.001 that has been found
for the buoyant density of ctDNA from several higher plants (24).
Mitochondrial DNA and nuclear DNA were found to band at buoyant densities
of respectively 1.7066 and 1.6960 +_ 0.0005 gem (Fig. lc and d) . The
buoyant density of ctDNA and mtDNA differ sufficiently to distinguish both
DNA species from each other on analytical CsCl gradients. Therefore it can
be concluded from the banding patterns in Fig. la and b that the ctDNA
preparations do not contain detectable amounts of mtDNA. Analytical
ultracentrifugation could not exclude the presence of nDNA in the upper
and lower band ctDNA preparation because nDNA and ctDNA band very closely
in the gradient. However the fact that the lower ctDNA band represents
508

Nucleic Acids Research
1.6987
1.6960 1.7066 1.731
1. Photoelectric scans of DNA, banded in neutral CsCl equilibriumdensity gradients. MioToooccus lysodeiktious DNA of buoyant density1.731 gcm~3 was added as a density standard, (a) lower band ctDNA,(b) upper band ctDNA, (c) mtDNA and nDNA, (d) nDNA.
covalently closed circular DNA molecules excludes the possibility that
contaminating nDNA is present in the ctDNA from this band.
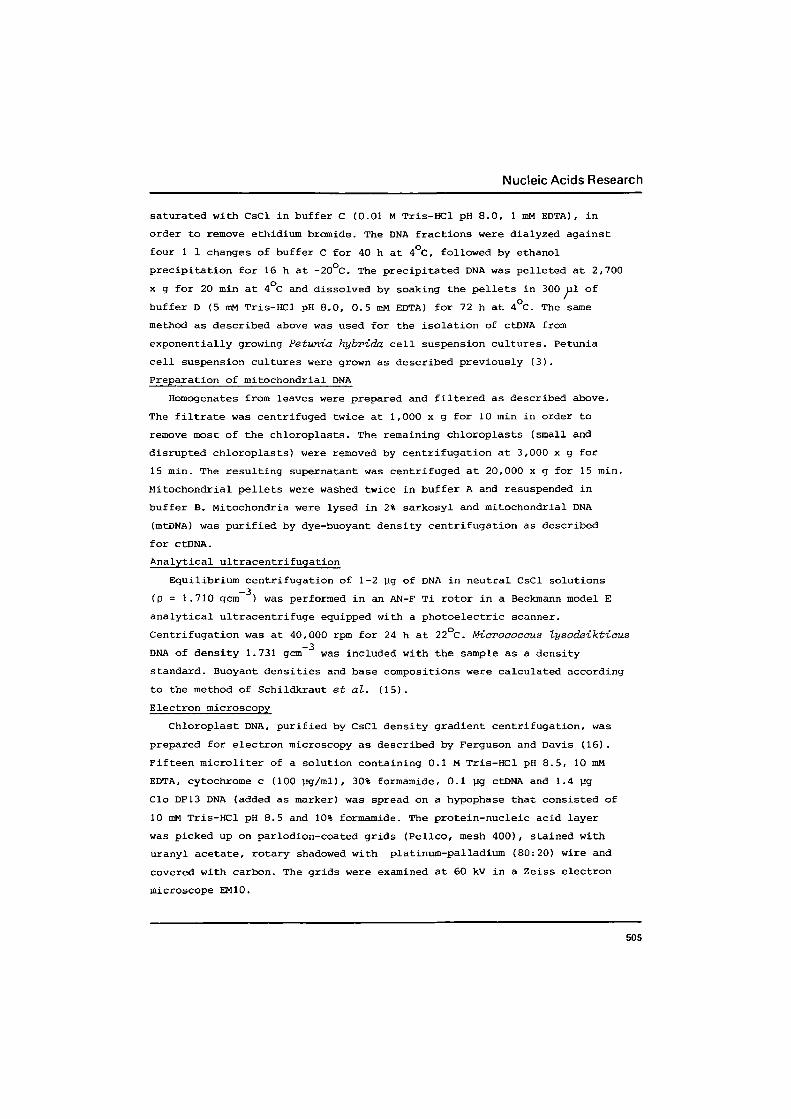
Electron microscopy. Electron microscopic analysis revealed that petunia
ctDNA molecules are circular and have a homogeneous contour length. The
length of relaxed circular ctDNA molecules was measured relative to the
length of the bacterial plasmid Clo DF13, which was used as an internal
standard in all experiments (Fig. 2). The size of this plasmid was
previously determined at 9,600 bp. (25). The ratio of the length of ctDNA
to Clo DF13 DNA was 15.3 +_ 0.7, which corresponds to a molecular weight
of 96.0 +_ 4.5 Md for ctDNA. This value is in good agreement with the
estimated value of 101.2 Md, that was obtained from restriction endonuclease
analysis of ctDNA (see Table 1). The molecular weight found for petunia
ctDNA falls within the molecular weight range of 85.2 - 103,2 Md, established
for ctDNA from several higher plants (26).
Cleavage of ctDNA by restriction endonucleases. CtDNA was digested with
several restriction endonucleases in order to find out which endonucleases
cut the DNA infrequently and produce fragments that can be easily
seperated on agarose slab gels. For these reasons the restriction
endonucleases Sal I, Bgl I, Hpa I and Kpn I were selected for the
construction of a restriction map of petunia ctDNA. The fragment patterns
of petunia ctDNA obtained upon digestion with the selected endonucleases
509

Nucleic Acids Research
.• •.c>y-v.»
7
Fig. 2. Electron micrograph of Petunia hybrida chloroplast DNA. The arrowindicates Clo DF13 plasmid DNA (9,600 bp) , added as marker. The barrepresents 1 |Jm-
are shown in Fig. 3. The molecular weights of the ctDNA restriction
endonuclease fragments were estimated from the electrophoretic mobilities
of DNA molecular weight markers and are summarized in Table 1.
Sail Hpal Kpnl
2
3-4-
5,6"
10-1
2.3-1
7-1
10-11'
Fig. 3. Agarose gel electrophoresis of petunia ctDNA digested withrestriction endonuclease Sal I, Bgl I, Hpa I and Kpn I. The fragmentsS13, K12, 13 and 14 are not visible on this photograph.
510

Nucleic Acids Research
Table 1. Chloroplast DNA fragments resulting fraa digestions with various restriction
endonucleases.
Fragment no.
1
2
3
4
5
6
7
8
9
10
11
12
13
14
15
ie
17
18
19
20
21
Sum of
MO1. WtS.
Sal I
17.6
14.3
12.4
11.9
10.7
8.2
8.0
7.3
2.85
0.95
0.85
0.45
101.2
Bgl I
20.1
18.7
14.4
13.2
7.3
5.5
5.3*
5.3*
4.4*
2.55
101.15
Hpa I
29.3
19.5
14.0
8.2
7.2*
7.2*
5.3
4.65
2.2
101.25
Kpn I
21.6
17.7
17.3
12.1
9.6
7.4
4.0
2.8
2.3
2.1
0.5*
0.5*
0.45
101.1
Sal I/Bgl I
12.4
9.9
9.8
S.2
7.3
6.1
5.8
5.3 (2x)
4.8
4.6 (2x)
2.85
2.5 (2x>
1.9 (2x)
1.45
0.95
0.9
0.8
0.65
0.45
0.2
101.15
Sal I/Hpa I
14.3
8.2
8.0
7.3
7.2 (2x1
6.7
5.3
4.45
4. 3
4.05
3.9
3.7
3.3
2.85
2.45
2.2
1.35
1.15 (2x)
0.95
0.8
0.45
101.25
Sal I/Kpn I
14.3
11.3
8.0
6.0
5.95 (5x)
4.0
3.7
3.3
2.85
2.8
2.75
2.1 (2x>
1.5
1.45
1.3
0.95
0.8
0.5 (2x)
0.45 <2x)
0.2
101.05
Molecular weights of the fragments are given m megadaltons. The number given in brackets
refers to the molar ratio of that band.
*Bgl I fragments B7 and BS, B9 and B10, Hpa I fragments H5 and H6, and Kpn I fragments K12
and K13 are identical.
A number of restriction fragments, obtained after primary digestion of
ctDNA, were present in bimolar amounts as was concluded from the relative
intensity of ethidium bromide fluorescence of some DNA bands. Redigestion
of such bands with a second enzyme resulted in fragments with molecular
weights that added up to the molecular weight of the original DNA band and
not twice that molecular weight. From these results it was concluded that
the fragments B7 and B8 are identical, and also B9 and B10, H5 and H6 and
K12 and K13.
511

Nucleic Acids Research
Physical mapping of restriction endonuclease fragments
Ordering of the Sal I, Bgl I, Hpa I and Kpn I restriction endonuclease
fragments of ctDNA on a cleavage site physical map was obtained by
determining the cleavage sites of the enzymes Bgl I, Hpa I and Kpn I
relative to those of Sal I. For this purpose the individual Sal I fragments
were isolated and redigested with Bgl I, Hpa I or Kpn I, and vice versa.
In order to improve the detection of small DNA fragments (smaller than 1.0
Md), produced upon redigestion of individual fragments, we used P-labeled
primary digests of ctDNA. The isolation of DNA fragments from gels was
facilitated by the use of low-gelling-temperature (LGT) agarose (19). In
a typical experiment P-labeled Sal I fragments of ctDNA were separated
on 0.5% LGT agarose gels. The DNA bands were cut out, melted, and incubated
with Hpa I. Fig. 4 shows the agarose electrophoresis of the resulting DNA
fragments. Sal I/Hpa I double digest and Sal I and Hpa I single digests
were coelectrophoresed as markers. By comparing the redigestion products
of the individual Sal I fragments with the Sal I/Hpa I double digest
Sail SI S2 • S3 S4 S5 • S6 S7 S8 • S9 SK>
n-
12-
4. Autoradiograph of agarose gel electrophoresis of individualP-labeled Sal I restriction fragments of petunia ctDNA redigested
with restriction endonuclease Hpa I. Lanes indicated by an asterixcontain a -"P-labeled Sal I/Hpa I double digest, added as marker.The cleavage products resulting from redigestion of the individualSal I fragments are marked by a dot.
512

Nucleic Acids Research
pattern, it could be established from which primary Sal I fragments a
certain Sal I/Hpa I double digest fragment originates. The fragment patterns
are sometimes slightly complicated by the presence of incompletely digested
fragments or by cross-contamination of the fragments, due to close
migration on LGT agarose gels. However, interpretation of the patterns
presents little difficulty when differences in the intensities of redigestion
products are taken into consideration and also because the molecular weights
of the fragments are known. The results obtained from this gel and those
obtained from the gels of the Sal I/Bgl I and Sal I/Kpn I digestions are
summarized in Table 2. From the common double digest fragments, the overlap
between the primary Sal I, Bgl I, Hpal and Kpn I fragments could be
assigned. This allowed the determination of the order of most of the DNA
Table 2. Relationship between primary restriction endonuclease fragments and double digest fragments of
petunia ctDNA.
Sal I/Bgl Idouble digestfragments
SBl
SB2
SB3
SB 4
SB 5
SB6
SB7
SB8 <2x)
SB9
SBlO (2x)
SBl 1
SB12 (2x)
SBl3 (2x)
SBl 4
5B15
SBl 6
SB17
SB18
SBl 9
SB 20
Primaryand Bglments frderived
S2
S5
SI
S6
S4
S7
S3
SI, S3
S9
S3, S4
S10
SI, S3
S2, 57
S8
S U
S9
S5
S12
S13
S12
Sal II frag-ora which
B4
Bl
B3
B2
Bl
B2
B7, B8
B2
B3, B6
Bl
B9, BIO
B9, BIO
Bl 1
B5
B6
B4
Bl 1
81 1
BS
Sal I/Hpa Idouble digestfragments
SHI
SH2
SH3
SH4
SH5 (2x)
5H6
SH7
SH8
SH9
SH10
SH11
SHI 2
SHI 3
SH14
SHIS
5H16
SH17
SHI8 (2x)
SH19
SH20
SH21
Primaryand Hpaments frderived
S2
S&
S7
sa
SI, S3
SS
SI
S4
S3
S5
SI
S4
S9
S10
S9
S4
S4
SI, S3
SI 1
SI 2
S13
Sal II frag-OCD which
H2
HI
HI
HI
H5, H6
H3
H7
H3
H4
H2
H4
H9
H8
H3
HI
H10
HO
HI, H2
HI
HI
HI
Sal I/Kpn Idouble digestfragments
SKI
SK2
SK3
SK4
SK5 (5x)
SK6
SK7
SK8
SK9
SK10
SK11
SKI2 <2x)
SKI 3
SKI 4
SKIS
SK1&
SKI 7
SK18 (2x)
SK19 (2x)
SK20
Primary Sal Iand Kpn I frag-ments from whichderived
S2
SI
S7
S3
SI, S3
S4(2x),
S9
S3
S5
S10
S5
S5
S6, S8
53
S9
S5
Sll
S12
SI, S3
S5, S13
S9
Kl
K3
K2
Kl
K2, K3
S6 K4, K5, K6
K7
K5
K4
K4
K8
K9
K10, Kll
K2
KG
Kl
K3
K2
K12, KI3
K2, K14
K1O
The rv»-h«»r given in brackets refers to multiple copies of a fragment. Molecular weights of the fragmento are
given in Table I.
513

Nucleic Acids Research
fragments. The relative order of Hpa I fragments H9 and H10 was established
by redigestion of these fragments with Bgl I. The relative order of fragments
K8 and K9 was determined by redigestion with Hpa I (results not shown). As
yet the relative order of K8 and K14 could not be determined unambiguously.
The position of several cleavage sites was confirmed by reciprocal digestion
of various Bgl I, Hpa I and Kpn I restriction fragments (results not shown).
The resulting restriction fragment map of petunia ctDNA is shown in Fig. 5.
The physical map shows that petunia ctDNA contains two copies of a region
in a inverted orientation. The inverted repeat regions have a minimum size
of 10 Md but may very well extend into the adjacent part of the ctDNA molecule.
A similar arrangement of inverted repeat regions on restriction endonuclease
fragment maps has been found for ctDNA from a number of other higher plants,
e.g. lea mays, Spinacia oZevacea (see also Introduction). The sizes of the
inverted repeat regions observed in the ctDNA from these and other plants
range from about 13-17 Md (27).
Fig. 5. Physical map of restriction endonuclease fragments of petunia ctDNA,showing the Sal I, Bgl I and Hpa I cleavage sites. Sizes of thenumbered fragments are listed in Table 1. The thick lines indicatethe positions of the inverted repeat regions.
514

Nucleic Acids Research
1 3 J 4
I4
IIIII
Fig. 6. Hybridization of 32P-labeled rRNA. from E. aoli to restrictionendonuclease fragments of petunia ctDNA. Lane 1 and 2, Sal Ifragments; 3 and 4, Bgl I fragments; 5 and 6, Hpa I fragments. 1, 3and 5 are photographs of ethidium bromide stained gels; 2, 4 and 6are autoradiographs of the transferred fragments on DBM-paper towhich 2P-rRNA was hybridized.
Mapping of chloroplast rRNA genes
The major RNAs in the chloroplast ribosomes are 23S, 16S and 5S. Schwarz
and Kossel (28) showed that the nucleotide sequence of the 16S RNA gene is
strikingly similar for Zea mays chloroplasts and E. aoli. In view of this
similarity of rDNA in E. ooli and chloroplasts, p-rRNA from E. aoli was
used as a probe for hybridization with DBM-paper strips containing
restriction endonuclease fragments of petunia ctDNA to obtain information
on the location of the chloroplast rRNA genes. Fig. 6 shows that E. ooli
rRNA specifically hybridizes with fragments SI and S3, fragments B7 and B8
and fragments H5 and H6. All these fragments are part of the inverted
repeat sequences of petunia ctDNA (Fig. 5) . The hybridization data indicate
a sequence homology between petunia ctDNA and E. aoli rDNA. They also
strongly suggest that the chloroplast rRNA genes are located within these
fragments. Since no hybridization was observed with fragments B3, B9 and BIO,
the maximum size of the ctDNA region that could be occupied by these rRNA
genes is the 5.3 Md dashed region in the inverted repeats (Fig. 5). A
515

Nucleic Acids Research
similar location of the rRNA genes in the inverted repeat regions has been
found for the ctDNA from a number of other plant species (7, 11, 12, 13, 23)
ACKNOWLEDGEMENTS
We thank Dr. J.D.A. van Embden for the determination of the buoyant
density of ct, mt and nDNA, and Mr. P.L. Lolkema for electron microscopic
analysis of ctDNA preparations. Petunia plants were a kind gift of Prof.Dr.
F.K. Bianchi.
REFERENCES(1) Colijn, C M . , Kool, A.J., Nijkamp, H.J.J. (1979) Protoplasma 99, 335-340.(2) Seyer, P., Marty, D., Lescure, A.M. and P«5aud-Lenoel, C. (1975) Cell
Differentiation 4, 187-197.
(3) Colijn, C M . , Kool, A.J. and Nijkamp, H.J.J. (1979) Theor. Appl. Genet55, 101-106.
(4) Colijn, C M . , Kool, A.J. and Nijkamp, H.J.J. (1980) Manuscript inpreparation.
(5) Bedbrook, J.R. and Bogorad, L. (1976) Proc.Natl. Acad. Sci. USA 73,4309-4313.
(6) Bohnert, H.J., Gordon, K. Driesel, A.J., Crouse, E.J. and Herrmann, R.G.(1978) in Chloroplast Development, Akoyunoglou, G. Ed., Elsevier,Amsterdam.
(7) Jurgenson, J.E. and Bourque, D.P. (1980) Nucl. Acid. Res. 8, 3505-3516.(8) Roller, B. and Delius, H. (1980) Molec. gen. Genet. 178, 261-269.
(9) Rochaix, J.D. (1978) J. Mol. Biol. 126, 597-617.(10) Gray, P.W. and Hallick, R.B. (1977) Biochemistry 16, 1665-1671.(11) Kolodner, R. and Tewari, K.K. (1979) Proc. Natl. Acad. Sci. USA 76,
41-45.(12) Bedbrook, J.R., Kolodner, R. and Bogorad, L. (1977) Cell 11, 739-749.(13) Rochaix, J.D. and Malnoe, P. (1978) Cell 15, 681-670.(14) Rawson, J.R.Y., Kusher, S.R., Vapnek, D., Altom, K.K. and Boerma, C.L.
(1978) Gene 3, 191-209.(15) Schildkraut, C.L., Marmur, J. and Doty, P. (1962) J. Mol. Biol. 4,
430-443.
(16) Ferguson, J. and Davies, R.W. (1978) in Advanced Techniques inBiological Electron Microscopy, Koehler, J.K. Ed., Springer VerlagNew York.
(17) Greene, P.J., Heyneker, H.L., Betlack, M., Bolivar, F., Rodriguez, R.,Covarrabias, A., Fodor, I., Backman, K. and Boyer, H.W. (1978) Nucl.Acids Res. 5, 2773-2780.
(18) Rigby, P.W.J., Dieckmann, M., Rhodes, C and Berg, P. (1977) J. Mol.Biol. 113, 237-251.
(19) Herrmann, R.G., Whitfeld, P.R. and Bottomley, W. (1980) Gene 8, 179-191.(20) Kool, A.J., Pols, C. and Nijkamp, H.J.J. (1975) Antimicrob. Agents
Chemother. 8, 67-75.(21) Vereyken, J.M. (1977). Thesis, State University of Utrecht.(22) Wahl, G.M., Stern, M., Stark, G.R. (1979). Proc. Natl. Acad. Sci USA,
76, 3683-3688.(23) Whitfeld, P.R., Herrmann, R.G. and Bottomley, W. (1978) Nucl. Acids
Res. 5, 1741-1751.
(24) Kolodner, R. and Tewari, K.K. (1975) Biochim. Biophys. Acta 402,372-390.
(25) Elzen, P.J.M., Konings, R.N.H., Veltkamp, E. and Nijkamp, H.J.J. (1980)J. Bacteriol. (in press) .
516

Nucleic Acids Research
(26) Bedbrook, J.R. and Kolodner, R. (1979) Ann. Rev. Plant Physiol. 30,593-620.
(27) Bedbrook, J.R., Beaton, A.R., Bogorad, L. , Coen, D.M., Dyer, T.A. andKolodner, R. (1980) in The plant genome, Davies, D.R. and Hopwood, D.A.Eds., F. Crowe & Sons Ltd., Norwich, England.
(28) Schwarz, Zs. and Kossel, H. (1979) Nature 283, 739-742.
517

Nucleic Acids Research
Related Documents