I Tanya Jane Laird Honours Thesis School of Veterinary and Life Sciences Murdoch University October 2016 Supervisors: Dr Mark O’Dea Lecturer, Murdoch University Dr. Sam Abraham Lecturer, Murdoch University Isolation and Genomic Characterization of Bacteriophages Targeting Extended-Spectrum Cephalosporin Resistant E. coli

Welcome message from author
This document is posted to help you gain knowledge. Please leave a comment to let me know what you think about it! Share it to your friends and learn new things together.
Transcript

I
Tanya Jane Laird
Honours Thesis
School of Veterinary and Life Sciences
Murdoch University
October 2016
Supervisors: Dr Mark O’Dea
Lecturer, Murdoch University
Dr. Sam Abraham
Lecturer, Murdoch University
Isolation and Genomic
Characterization of Bacteriophages
Targeting Extended-Spectrum
Cephalosporin Resistant E. coli

II
Declaration
This thesis was presented as part of the requirements for the degree of
Bachelor of Science (Honours) – Veterinary Biology.
I declare this thesis is my own account of my research and contains as its main content
work which has not been previously submitted for a degree at any tertiary education
institution.
Tanya Jane Laird
III
Abstract
Overuse of antibiotics has resulted in the emergence of antibiotic resistant bacteria
resulting in bacterial infections in livestock and humans, that can no longer be
controlled by these drugs [2]. Third generation cephalosporins are an antibiotic class
used in critical situations as the last line of defence, however bacteria have now
developed resistance to these drugs [3].
Bacteriophages are viruses which can infect and destroy bacteria, and are being
developed as a new therapeutic method for the control and management of bacterial
infections in swine. This method offers a highly specific therapy with minimal side
effects on the gut microflora [4]. Administration of phages in animal feed has resulted
in a reduction of the severity of bacterial infections in addition to a reduction in the
shedding of bacteria in faecal matter [2, 5]. This shedding is a major human health
concern as it has the potential to transfer antibiotic resistant bacteria and plasmids
carrying resistant genes to humans through the faecal to oral route.
This project isolated 21 bacteriophages, from three separate sources, that are capable of
lysing extended-spectrum cephalosporin (ESC) resistant E. coli. Characterisation of
these phages, through electron microscopy and genome sequencing, identified phages
belonging to the three different families within the order Caudovirales; Siphoviridae,
Myoviridae and Podoviridae. Analysis of the phage genomes resulted in the
identification of two clusters within the phages belonging to the Siphoviridae family,
named Cluster 1 and 2. Comparison of the specificity of phages sourced from pig farms
with (South Australia) and without (Murdoch University) ESC resistant bacteria
suggests that highly specific phages can be sourced from locations infected and
uninfected by the target bacterial isolate. Three of the phages isolated from Murdoch
University have a broad host range of the target ESC resistant E. coli isolates,

IV
highlighting these phages for further studies and potential development into therapeutic
products.

V
Table of Contents
Declaration ............................................................................................................................ II
Abstract ................................................................................................................................III
Table of Contents ................................................................................................................. V
List of Figures ................................................................................................................... VIII
List of Tables ....................................................................................................................... XI
List of Abbreviations ........................................................................................................ XII
Acknowledgements ........................................................................................................... XIV
1. Introduction ..................................................................................................................... 1
1.1 Antibiotic Resistant Bacteria ................................................................................... 2
1.2 Alternatives to Antibiotics ...................................................................................... 6
1.3 Brief History of Phages ........................................................................................... 8
1.4 Characteristics of Phages ........................................................................................ 9
1.4.1 Virulent vs Temperate ..................................................................................... 9
1.4.2 Phage Therapy ............................................................................................... 10
1.5 Phage Taxonomy ................................................................................................... 12
1.6 Phage Characterisation .......................................................................................... 13
1.6.1 Morphological Characterisation .................................................................... 13
1.6.2 Genetic Characterisation ............................................................................... 14
1.7 Phage Specificity ................................................................................................... 16
1.8 Phage Therapy ....................................................................................................... 19
1.8.1 Therapy In Livestock .................................................................................... 19
1.8.2 Phage Cocktails ............................................................................................. 20
1.8.3 Phage Resistance ........................................................................................... 22

VI
1.8.4 Complications of Phage Therapy .................................................................. 23
1.8.5 Phage-Antibiotic Synergy ............................................................................. 25
1.9 Project Aim ........................................................................................................... 27
2. Methods ......................................................................................................................... 29
2.1 Sample Background .............................................................................................. 29
2.2 Bacterial Isolates ................................................................................................... 30
2.3 Broth Microdilution .............................................................................................. 33
2.4 Chemicals, Equipment and Media ........................................................................ 35
2.5 Isolation of Phages ................................................................................................ 37
2.5.1 Phage Enrichment ......................................................................................... 37
2.5.2 Phage Isolation .............................................................................................. 37
2.5.3 Phage Stock Preparation ............................................................................... 38
2.6 Electron Microscopy ............................................................................................. 39
2.7 Host Range ............................................................................................................ 39
2.8 DNA Extraction .................................................................................................... 40
2.9 DNA Quantification .............................................................................................. 40
2.10 MiSeq DNA Library Preparation .......................................................................... 40
2.11 Bioinformatics ....................................................................................................... 41
3. Results ........................................................................................................................... 42
3.1 MIC Value ............................................................................................................. 42
3.2 Phage Enrichment ................................................................................................. 44
3.3 Phage Isolation ...................................................................................................... 46
3.4 Host Range Determination .................................................................................... 49
3.5 Phage Characterisation .......................................................................................... 52

VII
3.5.1 Electron Microscopy ..................................................................................... 52
3.5.2 Whole Genome Sequencing .......................................................................... 54
3.6 Comparative Genome Analysis of the Phages Active Against ESC Resistant E. coli.
…... 56
3.6.1 Annotated Phage Genomes ........................................................................... 56
3.6.2 Phylogenetic Analysis of Phages .................................................................. 58
3.6.3 Molecular Comparison of Phage Tail Proteins ............................................. 61
4. Discussion ..................................................................................................................... 64
5. Conclusion .................................................................................................................... 71
6. References ..................................................................................................................... 73
Appendix I............................................................................................................................. 83
Appendix II ........................................................................................................................... 85
Appendix III .......................................................................................................................... 89

VIII
List of Figures
Figure 1. Timeline of antibiotic class discovery from 1908-2010. Adapted from Silver (2011)
[1]. ........................................................................................................................................... 2
Figure 2. Lytic vs lysogenic phage life cycle. Adapted from
https://blogs.unimelb.edu.au/sciencecommunication/2010/11/07/viruses-used-for-good-gene-
therapy/.................................................................................................................................. 10
Figure 3. Virion morphological structure of tailed bacteriophages. Adapted from
https://www.diva-portal.org/smash/get/diva2:807580/FULLTEXT01.pdf. ...................... 13
Figure 4. Schematic diagram of broth microdilution plates for susceptibility testing with
labelled ceftriaxone concentrations. ...................................................................................... 33
Figure 5. Flow chart describing the experimental design for the isolation and characterisation of
phages with lytic activity against ESC resistant E. coli isolates. .......................................... 36
Figure 6. Spot test of phage enrichment from faecal sample S2 and isolate SA35 onto lawn
plate of ESC E. coli isolate SA35 demonstrating four plaques of strong lytic activity. ....... 44
Figure 7. Ten-fold dilution series of phage lysate 6 on lawn plate of ESC E. coli isolate SA35
for phage plaque purification, with decreasing concentration of phage in a clockwise direction
from n being the original concentration PFU/mL to section -7 being 10-7
PFU /mL. .......... 46
Figure 8. Comparison of bacteriophage single plaque size variation on lawn plate of the host
strain ATCC E. coli 25922 between phage 40 (a) and phage 35 (b) using light microscopy.47
Figure 9. Spot test of phages 1-15 on lawn plate of ESC E. coli isolate SA35 with lysis of the

IX
host isolate for phages 1-12 and no lysis of SA35 from phages 13-15 which were isolated on
SA36. .................................................................................................................................... 48
Figure 10. Transmission electron micrographs of bacteriophages against ESC resistant E. coli
representing all tailed phage family – Myoviridae, Siphoviridae and Podoviridae. ............. 53
Figure 11. Annotated whole genomes of phages representing the four groups (Myoviridae,
Podoviridae, Siphoviridae cluster 1 and Siphoviridae cluster 2) with lytic activity against ESC
resistant E. coli isolates. ........................................................................................................ 57
Figure 12. Maximum likelihood phylogenetic tree based on the lysin gene of phages from the
three tailed phage families (Myoviridae, Siphoviridae and Podoviridae). ............................ 59
Figure 13. Maximum likelihood phylogeny tree based on the DNA polymerase gene of phages
from the three tailed phage families (Myoviridae, Siphoviridae and Podoviridae). ............. 60
Figure 14. Concatenated tail protein segment of phages that target ESC resistant E. coli isolates,
the phages represent each family and cluster identified. ....................................................... 63
Figure 15. Annotated genome of phage 1 (Myoviridae) with lytic activity against ESC resistant
E. coli. ................................................................................................................................... 85
Figure 16. Annotated genome of phage 13 (Podoviridae) with lytic activity against ESC
resistant E. coli. ..................................................................................................................... 85
Figure 17. Annotated genome of phage 7 (Siphoviridae cluster 1) with lytic activity against
ESC resistant E. coli. ............................................................................................................. 85

X
Figure 18. Annotated genome of phage 26 (Siphoviridae cluster 2) with lytic activity against
ESC resistant E. coli. ............................................................................................................. 85

XI
List of Tables
Table 1. Collection details of source samples used for phage isolation. .............................. 29
Table 2. List of all bacterial isolates used in this project for isolation of phages and host range
determination. ....................................................................................................................... 31
Table 3. Minimum inhibitory concentration values of ESC resistant E. coli isolates against
ceftriaxone. ............................................................................................................................ 43
Table 4. Isolated phage IDs showing the bacterial host strain and source sample used in the
phage enrichment step. .......................................................................................................... 45
Table 5. Host range of all isolated bacteriophages against ESC resistant E. coli. ................ 50
Table 6. Host specificity of all isolated phages tested against multiple bacterial genera. .... 51
Table 7. Morphological characteristics captured using transmission electron microscopy of
bacteriophages isolated against ESC resistant E. coli. .......................................................... 54
Table 8. Analysis of contig sequences from whole genome sequencing of isolated phages
against ESC resistant E. coli using BLASTn. ....................................................................... 55
XII
List of Abbreviations
°C degree Celsius
mg milligram
g gram
kg kilogram
µL microliter
mL milliliter
L Litre
µm micrometer
nm nanometer
BHI Brain heart infusion
CFU Colony forming units
DNA Deoxyribonucleic acid
dsDNA Double stranded deoxyribonucleic acid
dsRNA Double stranded ribonucleic acid
DTR Direct terminal repeats
EM Electron microscopy
EPEC Enteropathogenic Escherichia coli
ESC Extended-spectrum cephalosporins
ETEC Enterotoxigenic Escherichia coli
EUCAST European Committee on Antimicrobial Susceptibility Testing
HDP Host defence peptides
ICTV International Committee on Taxonomy of Viruses
LB Luria bertani
LPS Lipopolysaccharides
MDR Multi-drug resistant
MH Mueller-hinton

XIII
MIC Minimum inhibitory concentration
MRSA Methicillin resistant Staphylococcus aureus
MOI Multiplicity of infection
NGS Next generation sequencing
OMP Outer membrane protein
PCR Polymerase chain reaction
PFU Plaque forming units
RBP Recognition binding protein
SNP Single nucleotide polymorphism
ssDNA Single stranded deoxyribonucleic acid
ssRNA Single stranded ribonucleic acid
STEC Shiga toxin-producing Escherichia coli
SUMO Small ubiquitin-like modifier
TEM Transmission electron microscopy

XIV
Acknowledgements
I would first like to express my deepest gratitude to my principal supervisor Dr. Mark O’Dea for
your unwavering support and guidance throughout the project. You have helped overcome
every hurdle, generously shared your knowledge with your door always open for any questions.
Thank you to my supervisor Dr. Sam Abraham for your assistance, enthusiasm and passion.
Your devotion towards your work has been truly inspirational. Together you have provided me
with many opportunities that have allowed me to learn and experience more than I could have
ever expected this year.
I would like to thank Michael Platten for his contribution of the electron micrographs. The
morphological characterization of the phages was only possible due to your help. To Dr. Stanley
Pang, thank you for your contribution to the sequencing and aid in the genetic analysis. I would
like to acknowledge Lina Lee for preparing the runs for the sequencing and Terence Lee for
teaching me how to perform broth microdilutions and the continuous advice about the Honours
program.
I am forever indebted to my parents for the unwavering encouragement they have provided
throughout my study and for the person they have shaped me to become. To my partner Craig
Cherrington, thank you for your continuous support, your patience during the heavy workload
and always relieving my stress. I could never have enjoyed this year so much without you by
my side. Lastly, I would like to deeply thank my sister Jodie Laird for dealing with the stresses
and celebrating the highs, you have never stopped believing in me.
1
1. Introduction
In the swine industry, diarrhoea-inducing bacterial infections cause reduced growth and can
result in increased piglet mortalities, greatly decreasing meat production and profitability [6].
For a prolonged period following their discovery, the use of antibiotics led to the control and
management of the majority of significant bacterial infections. However recently bacteria have
evolved resistance to various groups of antibiotics due to selective pressures, and with this
resistance spreading rapidly throughout farms and across countries, antibiotics may no longer be
depended upon for the control of certain infections in both veterinary and human medicine [2].
Bacteriophages (phages) are one alternative method for the management of bacterial infections.
A phage is a virus that infects bacteria. A certain class of phage, known as lytic phages, causes
the host cell to burst and thus has a bactericidal effect. The high specificity, low incidence of
side effects and natural abundant occurrence makes phages an attractive alternative to
conventional antibiotics [4]. Due to this, studies have developed methods to isolate phages and
hijack their lytic activity for use in therapeutics, an intervention termed phage therapy [7].

2
1.1 Antibiotic Resistant Bacteria
Antibiotics have been developed and utilised as the main therapeutic method against bacterial
infection since the discovery of penicillin in 1929 [8], and as outlined in Figure 1, discovery of
new antibiotic classes continued through to the late 1980s [1], however following this period
there was a void in the discovery of new antibiotics. Recently a new method for discovery of
antibiotic compounds has led to the discovery of teixobactin [9]. This new antibiotic is the first
new antibiotic class in over 30 years, however further studies and clinical trials need to be
conducted before the drug is cleared as safe and available for animal and human use [10].
In the food animal industry, antibiotics may be added to the animal’s diet in order to prevent
disease and increase the animal’s growth rate [11]. This has resulted in the overuse of various
classes of antibiotics, including macrolides, penicillins and tetracyclines, exerting a selective
pressure on the bacteria and resulting in the emergence and rapid spread of antibiotic resistant
genes [2, 12]. These genes can be transferred amongst bacteria via horizontal transfer (including
Figure 1. Timeline of antibiotic class discovery from 1908-2010. Adapted from Silver (2011)
[1].

3
plasmids and mobile genetic elements) or via vertical transfer (parent to offspring) [13].
Humans are at a risk of transfer of antibiotic resistance through the direct transfer of bacterial
isolates or mobilization of plasmids by direct contact with animals, with animal faeces or
contamination of carcasses at slaughter [14, 15]. It should be noted that although this review is
predominantly livestock focused, inappropriate use of various antimicrobial classes in humans
has also contributed greatly to the development of resistance [12].
Bacterial isolates can be resistant to single antibiotics or to multiple classes of antibiotics and
are then termed multidrug resistant (MDR) bacteria [16]. This is due to bacterial isolates
accumulating various genes that confer resistance to different classes of antibiotics (such as
critically important cephalosporins and fluoroquinolones) [3]. In some cases, these antibiotic
genetic cassettes mobilise together on elements termed integrons, such that selecting for
resistance using one drug will co-select for another. The class 1 integron with the dfrA12-orfF-
aadA27 genetic cassette array is an example, resulting in resistance to trimethoprim and
aminoglycosides [17].
Antibiotic resistant bacteria have emerged and spread rapidly [2]. Comparison of antimicrobial
resistance between the periods 1950-1959 to 2000-2002 showed an increase in resistance to 11
out of 15 agents in animal isolates. Resistance against ampicillin, sulphonamide and tetracycline
increased from 0% to 69.4%, 73.7% and 85.5% respectively in animals (cattle, chicken and
pigs). This pattern was repeated in human isolates with an increase of ampicillin, sulphonamide
and tetracycline resistance from 0% to 66.7%, 50% and 58% respectively. The number of
multidrug resistant Escherichia coli (E. coli) isolates from humans and food production animals
in the US has also increased over this timeframe from 7.2% of all isolates in 1950-1959 to
63.6% in 2000-2002. The 285 pigs tested between 1950 and 2002 from across America were
tested for the presence of multidrug resistant bacteria with 53.7% of isolated bacteria showing
resistance to three or more drug classes [16].
Not only are bacteria showing an increase in multidrug resistance, an increasing number of
bacterial isolates have demonstrated resistance to the critical antibiotic class of ESCs [18]. This
4
is a major health issue as cephalosporin antibiotics are relied upon as a last line of defence, both
in human health and in tightly controlled cases in Australian food animals [3]. The enteric
bacteria carrying genes encoding resistance to ESCs (found on plasmids) can potentially infect
humans via the faecal-oral route. One example is the IncA/C-type plasmids which have been
shown to carry blaCMY-2 [19]. These plasmid carrying bacteria may colonise the human host or
transfer the plasmids carrying resistant genes into commensal human gut microflora [20]. The
IncA/C-type plasmids have been attributed as the cause of the rapid spread of the
cephalosporinase resistant genes [19].
Ceftiofur and ceftriaxone are extended-spectrum cephalosporins (ESC) and the use of these
antibiotics is tightly controlled in an attempt to prevent the emergence and spread of resistance
in populations. This tight control of antibiotics and the geographic and genetic isolation of
Australian livestock have resulted in no ceftiofur resistance being detected in 117 E. coli
isolates from 1999-2005 [21] with ESC resistance only first being detected in 2015 [15]. This is
in comparison to countries such as Canada, where 13% of ETEC isolates from 2001-2003 were
ceftiofur resistant, and Denmark where the prevalence of ESC E. coli isolates from slaughter
pigs was 11% in 2009 [22, 23].
In 2006 a survey was conducted on the use of ceftiofur in large Australian pig herds. 25% of
these herds had used ceftiofur within the preceding year [24]. Studies have highlighted that an
increased antimicrobial usage on-farm results in a higher frequency of resistant bacteria
compared to low antimicrobial usage. Agerso et al. (2012) described this pattern in the use of
third generation cephalosporins with an increase of resistance from 10.8% to 26.3% in farms
that had used cephalosporins within the prior 12 months. With a growing dependence on
ceftiofur for managing multi-drug resistant bacterial isolates, there is concern of an increased
emergence and spread of ESC resistant bacteria amongst livestock. Global cephalosporin use in
humans has also increased from approximately 8.5 billion standard units in 2000 to 16.5 billion
standard units in 2010 [12].

5
With E. coli being a major component species of an animal’s normal gut microflora, these
commensal isolates can act as a reservoir of plasmids carrying antimicrobial resistant genes,
resulting in the spread of resistant genes and the potential to transfer horizontally into
pathogenic species. Kheiri et al. (2016) recently discovered 136 of 200 commensal E. coli
isolates from humans and animals were multi-drug resistant, showing the significance of
commensal bacteria with antibiotic resistance. Decolonising animal species of commensal
bacterial species carrying these genes, such as commensal ESC resistant E. coli, can aid in the
prevention of the spread of these genes into humans [25]. An estimated 25,000 deaths occur in
Europe alone each year due to antibiotic resistant bacterial infections in humans due to the
spread of resistance markedly reducing the number of last line antibiotics available to the human
health system [26]. Given the discovery void in antibiotic development (Figure 1), it has
certainly become clear that alternatives to conventional antibiotic therapies are already required
for control of infection. Development of these therapies and continued antibiotic discovery are
both needed to prevent the spread and overcome continued emergence of bacterial resistance.
6
1.2 Alternatives to Antibiotics
Immune-modulating agents, host defence peptides (HDP) and phages are only a few strategies
considered to reduce or potentially replace the use of antibiotics in livestock. The vast numbers
of livestock to be managed requires that any adopted strategy be low cost, practical and stable to
transport whilst also having minimal side effects, no/minimal effect on the animal’s normal
microflora and a low rate of bacterial resistance [27].
Immune-modulating agents are used to induce or enhance the animal’s immune response against
pathogenic bacteria, without directly killing the bacteria. These agents can be in the form of
vaccines (both live-attenuated and inactivated forms) or immunostimulants (including thymosin
and probiotics) [27]. Recently, two studies have tested the effects of using the prebiotic, sodium
butyrate, as an addition to livestock feed. The first study looked at the diarrhoea incidence rate
in weaned pigs comparing a negative control group, a group receiving a combination of butyrate
and antibiotics and another receiving only antibiotics. Both groups showed a reduction in the
percentage of piglets with diarrhoea compared to the control group, from 17% in the negative
control group to 11.3% and 12.4% for the combination therapy and antibiotics respectively [28].
Comparison of these groups to a group receiving sodium butyrate with no antibiotics would
show a clearer result to the effects of sodium butyrate itself. This recent study demonstrates the
potential of immune-modulating agents however further studies are needed to confirm results
before development for commercial use.
HDPs are naturally released by the host’s immune system in the presence of an infection [29].
These peptides can either directly kill bacteria or modulate the host’s immune response [30].
Synthetic HDPs have been produced that have greater stimulatory and enhancement effect on
the host’s immune response, resulting in higher efficacy against bacterial infections [29]. The
incidence of diarrhoea in piglets was reduced by 47.6% for piglets treated with the HDP
cecropin, when compared to piglets without treatment [30]. HDPs have also been shown to be
effective in killing antibiotic resistant bacteria including methicillin resistant Staphylococcus
aureus (S. aureus; MRSA) [31]. Despite this potential, in the past the high manufacturing costs

7
associated with the production of HDPs have reduced their use. In addition to this the toxicity
towards the bacterial host producing the antimicrobial peptides has resulted in limited output.
Recently a new method has been developed that conquers both of these issues, with multiple
studies demonstrating the reduced cost and higher output of HDPs. This method uses a protein
to fuse the peptide and a small ubiquitin-like modifier (SUMO) gene and after expression of the
HDP, a sumolase protease is used to cleave the HDP peptide. The HDP has a reduced toxicity
towards the host cell whilst attached to the SUMO, resulting in a higher output of HDP peptides
[29, 30].
Perhaps the most promising and economically viable of the listed methods are phages. An
estimated 1031
phages inhabit the earth and many isolated phages have shown antimicrobial
activity against antibiotic resistant bacteria [4, 11]. Studies on phages have shown no general
side effects, minimal effects on the normal microflora and the ability for practical application
for treatment of livestock through addition to feed [2, 32, 33]. These attributes have resulted in
phages being considered as potential alternatives for management of bacterial infections in
swine.

8
1.3 Brief History of Phages
Bacteriophages were co-discovered by Frederick William Twort and Felix Hubert d’Hérelle in
the early 20th century. Twort described the phage phenomenon as a virus in 1915 however
discontinued further research [34]. In 1917, d’Hérelle ‘officially’ discovered phages when he
confirmed the phenomenon was a virus. He named these bacteria eating viruses, bacteriophages.
d’Hérelle isolated phages from samples collected at site and successfully treated soldiers
suffering from bacillary dysentery in World War I through ingestion of the phage preparation.
In 1921 the use of phages for clinical treatment continued when Richard Bruynoghe and Joseph
Maisin injected Staphylococcus specific phages into and around opened lesions, successfully
treating Staphylococcal skin disease in human patients [35].
In the 1930’s pharmacological companies began to develop commercially available phage
preparations to treat infections against bacterial pathogens including E. coli and S. aureus [36].
However, there was controversy over the use of phages for clinical therapy. This controversy
arose from the lack of knowledge of phage biology and underdeveloped scientific methods of
the times resulting in inconsistent results, inappropriate controls and a lack of reproducibility
[34]. The discovery of penicillin in the 1940’s began the antibiotic era with many countries
ceasing development of phage therapy and turning to antibiotics for treatment of bacterial
infections [8, 34]. Only some countries, including the former USSR and Poland, continued to
use phage therapy [34]. The recent emergence of antibiotic resistant bacteria has led to a re-
evaluation of the therapeutic use of phages [36].

9
1.4 Characteristics of Phages
Phages are bacteria-infecting viruses and are classed as virulent or temperate [37]. They occur
naturally in abundance and can be isolated from sewerage and faecal material [38], and
potentially from any environment in which bacteria are present. The benefits of phages include
their ability to self-amplify in the presence of host bacteria and their high specificity towards
bacteria, leading to fewer side effects and limited cross-resistance occurring in bacteria other
than the target species [2, 32]. To harness the lytic capability of these viruses they must first be
isolated and demonstrate lysis of the intended bacterial isolate. When purified, the phages can
be characterised using electron microscopy and genome sequencing [39]. After the initial
isolation and characterisation steps, further studies can be conducted on their physical
characteristics including host range and burst size and the phage’s in vivo activity. The burst
size of a phage is the number of progeny virion released by the infected bacterial cell from one
cycle of phage growth, with larger burst sizes being beneficial for therapy [40].
1.4.1 Virulent vs Temperate
There are two types of phages; virulent (lytic) and temperate (lysogenic) (Figure 2) [37].
Virulent phages are ideal for phage therapy as they follow a strictly lytic cycle [37]. The life
cycle of virulent phages begins with the adsorption of the phage to the bacterium [42]. This
occurs through interaction between the tail fibers of the phage and specific receptors found on
the surface of the bacterium. The phage then injects its genetic material into the cytoplasm
where the host cell machinery is hijacked and used to synthesise new phage progeny. The
release of the new phages occurs via phage-encoded enzymes which break the bacterium cell
wall and cause lysis of the host cell [7].

10
Temperate phages can interact with the host cell in a lytic or lysogenic manner, depending on
the surrounding conditions of the phage [43]. The lysogenic cycle involves integration of the
phage genome into the host genome. There is some hesitation towards using temperate phages
in phage therapy, with the potential for the host cell to increase in virulence due to the
horizontal transfer of genes, including antibiotic resistant genes and toxin producing genes
through the cycle of integration [7]. A study conducted by Moon et al. (2015) demonstrated the
ability of a temperate staphylococcal specific phage, φSaBov, to horizontally transfer the
genomic island υSaβ, which carries varying sequences of toxins, superantigens and bacteriocins,
into human and animal isolates of S. aureus. Temperate phages are still being researched to
further evaluate their suitability to be used for phage therapy [37].
1.4.2 Phage Therapy
Development of phages as therapeutic agents requires in vivo testing. In these trials, the ratio of
phage to bacteria, termed the multiplicity of infection (MOI), that maximizes the lytic activity of
the phage therapy is determined. This ratio differs between phages and the target isolate with a
MOI of between 0.01 and 100 normally optimizing phage lytic activity [41]. The phage is
formulated for administration (in SM buffer or encapsulated in liposomes) and administered
Figure 2. Lytic vs lysogenic phage life cycle. Adapted from
https://blogs.unimelb.edu.au/sciencecommunication/2010/11/07/viruses-used-for-good-
gene-therapy/

11
systemically to animals through feed and to humans through drinking water [5, 32]. Attachment
of phages occurs through the recognition of the bacterial host isolate, with the phage then
creating a pore in the host cell’s wall and injecting the phage DNA inside. After the phage DNA
has been expressed and proteins synthesized, phage enzymes break down the cell wall lysing the
host cell and releasing virions. Phage therapy utilises this lytic activity to reduce the number of
bacterial cells resulting in a high level of control of bacterial infections and reduction of the
shedding of harmful of resistant carrying commensal and pathogenic bacterial isolates by
livestock [34].

12
1.5 Phage Taxonomy
The International Committee on Taxonomy of Viruses (ICTV) was formed to categorise
viruses. This system was created for easy management in identifying new viruses and
comparing the previously recorded viruses [45]. The hierarchical system classifies the bacterial
viruses into families based on the nucleic acid genome (dsDNA, ssDNA, dsRNA and ssRNA),
morphology (tailed, polyhedral, filamentous and pleomorphic) and physical characteristics
(including host range and resistance to organic solvents) [45, 46]. Tailed phages account for
96% of all phages and form the three families belonging to the order Caudovirales;
Siphoviridae, Myoviridae and Podoviridae. These three families all contain double stranded
DNA genomes [17]. Siphoviridae are the most common of the tailed phages with 61%, 24.5%
and 14% of tailed phages belonging to Siphoviridae, Myoviridae and Podoviridae respectively
[39].
There is controversy as to whether this historical classification system is the most appropriate
method for classification of phages [17, 46]. A newly suggested method of classifying phages
used the genetic similarity of genes coding for capsid proteins, however not all bacteriophages
carried a homologous gene [17]. Rohwer and Edwards (2002) analysed the whole genome of
105 phages isolated from various bacterial species. These isolates again did not share a common
single gene due to the high rate of lateral and horizontal transfer of genetic material between
phages [46]. Comparison between phages within families can sometimes be achieved using
genes including portal protein, lysin and major capsid genes. Without a common gene amongst
all phages to base the hierarchical classification on, the classification of phages using whole
genome comparison becomes difficult [47].

13
1.6 Phage Characterisation
1.6.1 Morphological Characterisation
Bacteriophages show great variability in their morphological structure and this can be used to
distinguish which family a phage belongs to (Figure 3). The primary classification tool and
standard technique to produce images capturing viral structure is transmission electron
microscopy (TEM), first used in 1940 [4, 39]. These images allow preliminary classification of
phages and are mandatory for the acceptance of the classification of a phage by the ICTV [39].
TEM offers a relatively cheap, fast and simple method of the morphological classification of
phages. The phages are negatively stained using stains including phosphotungstic acid or
ammonium molybdite. The electron micrograph shows the shape and diameter of the phage
head, the presence, length and contractibility of tails and the presence of tail fibers, base plates
and tail spikes [39].
Once the morphology of the phage is captured using TEM, it can be classified into a family. The
shape of the head can be differentiated between elongated and icosahedral with further
differentiation of the head determined by the diameter. Families can be differentiated due to the
length and contractile ability of the tail. Siphoviridae have long, non-contractile tails of length
79-539 nm and head diameters of 40-97 nm. Myoviridae have long contractile tails of length 80-
Figure 3. Virion morphological structure of tailed bacteriophages.
Adapted from https://www.diva-
portal.org/smash/get/diva2:807580/FULLTEXT01.pdf.
A: Myoviridae, B: Siphoviridae and C: Podoviridae.

14
485 nm and head diameters of 53-160 nm whilst Podoviridae have short tails of length 3-40 nm
and head diameters of 38-75 nm [48]. Classification of phages to lower taxonomic levels can’t
be performed using electron microscopy and therefore other techniques including whole
genome sequencing are employed [39].
1.6.2 Genetic Characterisation
Further characterisation of phages into lower taxonomic levels can be performed using genome
sequencing [39]. Analysis of the genome sequence allows an increased understanding of the
biology of phages and their bacterial hosts, through the identification of proteins and mutations
involved in this interaction [49]. Despite this, various complications have resulted in the number
of sequenced phage genomes being minimal in comparison to the sequencing of bacterial
genomes [49].
The first issue is the overabundance of host DNA in the sample due to the inability of the virus
to self-replicate. To minimize this problem, phage DNA needs to be purified by methods
including the use of chloroform, or sequenced reads belonging to the host need to be removed
before analysing the sequencing output data. A second issue is the high levels of methylation
and repeats of phage DNA required for successful protection from the host. These can affect the
success of polymerase chain reactions (PCR) and sequencing of phages, however can be
overcome through the use of a combination Next Generation Sequencing (NGS) technologies
[50], such as scaffolding using long read technology and assembling using short technology.
Lastly issues with cloning the DNA of lytic phages into E. coli hosts, required for Sanger
sequencing, reduces the success of sequencing phage genomes due to the potential lytic effects
of the phage DNA on the host [49, 50]. The development and technological advances in NGS
have resulted in faster, cheaper and more efficient whole genome sequencing of phages [49, 50].
Presently the sequencing of the entire genome of each phage is mandatory for the phage to be
recognised by the ICTV [50]. Before 2010 this requirement was only desirable of phages for use
in phage therapy, leading to concerns of toxic or potential viral transduction genes being missed
and thus introduced into a mammalian species [51, 52]. This has since been modified with

15
whole genome sequencing currently being a requirement for all phages used for phage therapy
[50].

16
1.7 Phage Specificity
Phages have narrow host ranges due to their high specificity with most phages being species or
even strain specific [5]. This level of specificity has both advantages and disadvantages for
phage therapy.
Host ranges of phages differ due to the ability of various phage recognition binding proteins
(RBP) to attach to the different surface receptors of bacterial cells [53]. The recognition binding
proteins are often contained in the phage tail fiber [54]. They attach to surface receptors such as
the hydrophilic component of specific lipopolysaccharides (LPS) and/or certain outer membrane
proteins (OMPs) referred to as porins [53]. The Sf6 phage uses both receptors with LPS as a
primary receptor and OmpA as a secondary receptor. Furthermore, when grown on ompA-,
ompC- and ompA
-C
- mutated bacterial isolates the phage can still infect the cells, demonstrating
a switch of the secondary receptor. This switch of the surface receptors in the absence of the
preferred surface receptor demonstrates a phages ability to mutate and overcome bacterial
resistance, a strong advantage in therapeutic products. Another example of this switch in
receptor preference is the ability of phage Lambda to recognise OmpF when the preferred
receptor LamB is absent [55]. The natural host range of a phage depends on the recognition
binding proteins of that phage, the presence of the appropriate surface receptors and the ability
of the recognition binding proteins to switch between receptors [53, 55]. An increased
understanding of these interactions can lead to a more targeted and effective phage therapy.
An advantage of phage specificity is the reduced risk of phages having lytic activity against
commensal microflora. Denis et al. (2009) recovered 80 bacterial isolates from the faecal matter
of 20 healthy humans. From here, increasing concentrations of four virulent E. coli specific
phages were tested as to whether they had lytic activity against these gut microflora isolates.
81% of isolates showed no lysis by phages with 19% of isolates showing lysis by one or more of
the four phages (under extremely high concentrations of phages of 108
plaque-forming
units(PFU)/mL) [33]. However, it should be noted that this study was conducted in vitro with a
high ratio of phage to bacteria. Bruttin et al. (2005) conducted a safety trial of the T4 phage in

17
vivo on 15 healthy humans, in which all individuals had no phages present in faecal matter
before the experiments. The T4 phage lysed diarrhoea inducing E. coli and had demonstrated a
broad host range in previous animal studies, therefore safety trials in humans were undertaken.
There was no significant difference in adverse effects, listed as stomach pain, nausea and a sore
throat, or E. coli titres between the treatment groups and the placebo group. This study
demonstrates the specificity of the T4 phage having no effect on microflora. During the
experiment the control group still had no phages present while T4 phages were isolated from the
treatment groups. The concentration of phage in faecal matter of the high concentration
treatment group was 34,000 PFU/g. The peak titre of phage in the faecal matter of the low
concentration treatment group was 68 PFU/g, 500-fold lower than the high concentration
treatment group. The lower concentration treatment group also showed a sharp decrease in the
concentration of excreted phages when treatment was stopped compared to the high
concentration treatment group, with approximately only 10% of individuals having phages
present 24 hours and 96 hours after treatment was stopped for the low and high concentration
treatment groups respectively [32]. This demonstrates that the phages transit through the
gastrointestinal tract quickly and have no prolonged impact following treatment. Denou et al.
(2009) conducted a study measuring the effect of phages on gut microflora. There was no
decrease in the 1011
colony forming units (CFU) of microflora bacteria per gram of faeces
recorded with the addition of no adverse effects, normal weight gain, normal behavior and no
changes in phage or antibody levels after the experiment [5]. These studies demonstrate that the
specificity of phage treatment results in minimal side effects on gut microflora, highlighting the
attractiveness of using phage therapy to treat and manage bacterial infections.
The disadvantage of phage therapy is the limited range of pathogens that each phage can infect.
A therapy that is highly specific may result in an ineffective coverage of the target pathogen
after spending limited time, resources and trials to produce and test it [32]. This limiting
specificity has been demonstrated by various studies. Bruttin and Brüssow (2005) [32] tested the
lytic activity of an E. coli specific phage T4 against 42 E. coli isolates. Only two of the 42
isolates were lysed by the phage [32]. Another study conducted by Denou et al. (2009) tested a

18
number of phages in their ability to lyse 25 enteropathogenic E. coli (EPEC) and
enterotoxigenic E. coli isolates. Phage RB49 had the largest host range at 8 of 25 isolates, with
the other phages infecting four or less isolates [5]. In contrast, a study testing phages GJ1-GJ6
against 85 ETEC isolates demonstrated a broad host range. Four of the phages lysed 99% of the
isolates with the other two phages lysing 100% of the isolates suggesting variation in phage
recognition proteins [56]. These studies show the varying host ranges of the phages from highly
specific to broad spectrum. Selection of broad spectrum phages for production as phage therapy
can result in effective management of bacterial infections, with the caveat that extensive in vivo
testing would be required to ensure commensal bacteria are not adversely affected. An increased
knowledge of factors and phage recognition proteins resulting in broad spectrum phages will
minimize the number of phages needing to be developed for management and control of
bacterial infections.

19
1.8 Phage Therapy
1.8.1 Therapy in Livestock
Studies observing the therapeutic effect of phages against pathogenic E. coli continue to be
conducted. One of the earliest studies highlighted the potential for phages to reduce the impact
of bacterial infections and the concentration of bacteria excreted in faeces in livestock. In this
study, 14 pigs were challenged with E. coli P433, with seven receiving a mix of phage P433/1
and P433/2 (1010
viable particles of each), at the onset of diarrhoea. The duration of diarrhoea
for the untreated group was recorded to be between 26-84 hours with the duration of the treated
group reduced to 7-13 hours. Four of the untreated pigs died as compared to survival of all
treated pigs. In addition to reduced diarrhoea, duration and mortality in the phage treated group,
there was also a reduction in the excreted E. coli count from 109.4
CFU/g of E. coli P433 in the
untreated group compared to 104.6
CFU/g in the treated group [57]. These results have continued
to be supported through various studies focusing on different phages [2, 58].
Pathogenic bacterial infections have a significant financial impact on the swine industry due to
the death and reduced growth of swine. As such, phages are being isolated from pig farms to
find an alternative to antibiotics. Jamalludeen et al. (2009) isolated phages GJ1-GJ6 and studied
their ability to reduce the duration and severity of diarrhoea in pigs infected with ETEC JG280.
All phages reduced the average group weight changes from the control showing a decrease in
weight of approximately 1 kg compared to phage treatment groups increasing in weight of
approximately 0.2kg to 1.2kg. The phages also reduced the group’s average duration of
diarrhoea with the control group having a duration of four days compared to two and a half days
for treatment groups [58]. Further studies supported these results [2, 59]. The phage CJ12 was
mixed with pig feed at a ratio of 1:1,000 (0.1% w/w) for two groups of pigs using a
concentration of the phage of 106 and 10
8 PFU/g. This was continued for the duration of the
experiment. One week later the pigs, along with two control groups, were orally challenged with
ETEC at a concentration of 1011
CFU/mL. The faecal matter was scored (diarrhoea score) from
0 (firm and normal shape) to 3 (frequent passage of watery faeces) to determine the percentage

20
of infected pigs. In this study the highest diarrhoea score of the pigs reached 2 compared to a
maximum of 3, meaning diarrhoea scores consistent with severe bacterial infections were not
reached. This may explain the lack of a significant difference in the weight changes between the
control and treatment groups. Despite this, the phage treated groups showed a decrease of
60.73% and 63.92% in the concentration of ETEC in faeces showing that the phage treated
group had a reduced severity of infection following ETEC challenge [2]. Another study with
EPEC E. coli isolates conducted on calves did induce severe bacterial infection and
demonstrated reduction of the severity and the duration of diarrhoea in the phage treatment
group. 12 calves were inoculated with E. coli 85, with six calves pre-inoculated with phage
B85/1. The calves with no treatment developed severe diarrhoea scores with diarrhoea lasting
until death compared to moderate to mild diarrhoea scores and duration of 12-40 hours of the
phage treated group [59]. These results support the therapeutic effects of bacteriophages in the
treatment of bacterial diarrhoea in livestock.
Phage therapy is also being utilized to reduce the excretion of bacterial isolates and therefore the
risk of transfer of resistance genes to humans, with these isolates potentially carrying plasmids
coding for antibiotic resistance. Studies have observed a beneficial impact of phage therapy on
bacterial load of faecal matter. These studies have shown a reduction of excreted pathogenic
bacterial load after phage treatment. A study on the impact of phage CJ12 on the ETEC
bacterial load of faeces demonstrated that groups treated with phages showed a large reduction
of excreted bacterial load, reducing the bacterial load in faeces by 63.92% and 60.73
respectively compared to the positive control [2]. This demonstrates that phage therapy may
reduce the risk of humans acquiring antibiotic resistance via faecal-oral contamination, by
reducing the pathogenic bacterial load within contaminated faeces.
1.8.2 Phage Cocktails
Single treatments containing multiple phages are termed phage cocktails. The interest in phage
cocktails is the potential of an enhanced effect and host range of the phages. Phage cocktails
have demonstrated an increase in the lytic activity against bacteria, an increase in the host range

21
of the therapy and a reduction in the development of bacterial resistance to phages [58, 60, 61].
Nale et al. (2016) compared the effect of five different phages, as either single phages or as
mixtures, on bacterial infection. The single phages lysed the bacteria by between 2-6 log units
within five hours however bacterial regrowth occurred within 24 hours. Various combinations
of phage mixtures were tested with a cocktail of two phages and a cocktail of three phages
completely lysing the infection within two hours with no regrowth occurring [60]. Furthermore
a study by Denou et al. (2009) demonstrated a cocktail of six phages (lysing between four and
eight isolates as single phages) were capable of fully lysing 13 out of 25 (52%) pathogenic E.
coli isolates [5]. Another study conducted by Khan et al. (2015), determined lysis of 76% of
isolates from the E. coli reference collection using a cocktail of six phages. The study selected
these six phages as they had the broadest host range, varying from phage SU57 lysing 15% of
all isolates compared to phage SU16 causing lysis of 60% of isolates [62]. It is evident that
mixtures of phages can have a greater impact on the bacterial infection than a single phage
alone.
These studies suggest that by selecting phages with different host ranges and combining them in
the one mixture, an increased host range is created. However, there are some studies showing a
decrease of the expected host range of the phage cocktails. Bourdin et al. (2014) conducted a
study on various phages selecting the three phages with the broadest host range to be combined
as a cocktail. Using the host range determined for each single phage, the three phages should
have been able to lyse 87% of the bacterial isolates however only 54% were lysed. They then
used six phages to create a cocktail which could only lyse 69% of isolates and a cocktail of nine
phages had no increase in the host range [63]. This shows that there can be a limit on the
efficacy of the number of phages used in a cocktail. The overlapping of host ranges and
decreased concentration of each individual phage with the addition of more phages to a cocktail,
may interfere with the effectiveness of the cocktail, possibly through non-specific blocking of
receptor sites by phage species. Despite this, the advantages of phage cocktails are apparent.
Careful selection of the phages incorporated into a cocktail and studies on the effectiveness of

22
the cocktail in vitro and in vivo is required when producing phage cocktails with the highest
potential for phage therapy.
1.8.3 Phage Resistance
The evolution of antibiotic resistance in bacteria has led to the re-emergence of studies into
phage therapy, but could bacteria further evolve resistance towards phage therapy? The
presence of the phages with lytic activity selects for mutated bacteria that have evolved
resistance. However, phages can also adapt and evolve, unlike antibiotics and other alternative
strategies. For the phages to survive they must adapt to gain lytic activity against the mutated
bacteria, leading to phage-susceptible bacteria, as seen with the switching of the host receptor
preference [61]. This co-evolution decreases the ability of bacterial cells to become permanently
resistant to phage therapy compared to the current resistance towards antibiotics.
In comparison to antibiotic resistance, resistance developed against phages has limited spread
between bacterial genera. This is due to genes for antibiotic resistance being present on mobile
genetic elements, the integrons and gene cassettes as outlined above, resulting in the transfer of
multiple resistance genes across bacterial genera. The transfer of resistance against phages are
unlikely to spread across in a similar pattern as the modified genes are not on mobile genetic
elements.
Resistance against phages has occurred and the mechanisms of resistance studied include
prevention of phage adsorption, blocking of phage DNA entry and the nicking of phage nucleic
acids. Phages infect bacterial cells through the recognition of host surface molecules referred to
as phage adsorption to the host cell. Some resistant bacterial isolates have edited the surface
structure preventing phage infection. An example of this is the production of immunoglobulin
G-binding protein A by S. aureus which masks the phage receptor. Another method to prevent
phage adsorption is the production of competitive inhibitors [61]. Microcin J25 out-competes
phages T1 and T5 for the E. coli FhuA (iron transporter) adsorption site, reducing the adsorption
of phages and therefore phage infection [64].

23
Pseudomonas aeruginosa isolates have evolved resistance to the phage OMK01 by changing the
multi-drug efflux (Mex) system. This system increases resistance to multiple classes of
antibiotics including quinolones, macrolides and tetracyclines [65], as it transports the
antibiotics out of the cell. The phage OMK01 binds to the outer membrane protein OprM, one
of the three components of the Mex system. A study performed demonstrated that the resistance
developed by the bacteria against the phage was coupled to an increased susceptibility of the
bacteria to all four antibiotics tested (ciprofloxacin, ceftazidime, erythromycin and tetracycline).
The decreased expression of the OprM protein results in reduced activity of the Mex system
increasing the sensitivity towards antibiotics showing an advanced phage therapy [66]. Overall
the phage treatment increases the bacteria’s susceptibility to antibiotic treatment. Further studies
on the potential of phage therapy to be used in this manner need to be conducted after discovery
of the phage’s recognition binding protein.
1.8.4 Complications of Phage Therapy
Studies have reported reduced anti-bacterial activity of phages in vivo compared to in vitro
systems. One to 1000 PFU/CFU concentrations of phages e11/2 and e4/1c both showed
successful reduction of E. coli 0157:H7 within four hours in an ex vivo rumen model system.
This success was not repeated in vivo, with a cocktail of the two phages having no effect on
reducing the number of cattle infected with E. coli 0157:H7 and no reduction on the excretion
levels of the bacteria. The proposed reason behind the decrease in phage infectivity was the 1 to
1,000 ratio of the phage and bacteria used in the study, resulting in the lack of exposure of the
phage to the E. coli. With the potential of phages being inactivated in vivo, this ratio of bacteria
to active phages would become even more significant. Studies with varying systems using
higher concentrations of phages than bacterial cells have shown success in reducing bacterial
infection in cattle [67], therefore analysis of the methods and concentrations used in this study
need to be conducted.
Another factor influencing the effectiveness of phage therapy is the highly acidic levels of the
gastrointestinal tract. Kerby et al. (1949) determined phage T7 to have optimum stability at a

24
pH range of 6-8. At pH 4, the majority of lytic activity was lost after 96 hours and at pH 3 all
lytic activity was lost after one hour [68]. Jamalludeen et al. (2007) also conducted tests
studying stability in acidic conditions with optimum stability being at pH 5-9. Incubation for 16
hours at pH 1 and 2 denatured all the phages to the point of no detection with pH 3 denaturing
five out of nine phages [56]. With acidity of the GI tract of swine ranging from pH 1-2 before a
meal to pH 4-5 after a meal, the administration of phages in animal feed helps to reduce the
acidic impact on the phages resulting in a higher therapeutic effect. This study also highlighted
the variability of acidic resistance amongst various phages, with four out of nine phages
tolerating acidic levels of pH 3 [56]. Bruttin et al. (2005) also demonstrated the stability of
phages in in vivo studies with the dose of phages received in participant’s drinking water being
9x10⁷
PFU/mL with only 1x10⁷ PFU/g excreted in the faeces. The small reduction of phage
concentration shows stability of the phage through the gastrointestinal tract. The acidity of the
gastrointestinal tract can reduce the success of phage therapy however with the correct selection
of acid stable phages and the application method of therapy this issue can be greatly minimised
[56].
Another strategy to protect phages from acidic conditions is the use of liposomes to encapsulate
the phage. Survival of liposome-encapsulated phages was compared to non-encapsulated phages
in gastric fluid of pH 2.8. The decrease in phage titre was 3.7-5.4 log units and 5.7-7.8 log units
for encapsulated and non-encapsulated respectively. This in vitro experiment shows the
advantage of providing adequate protection for the phage until it reaches its site of action.
Similar results of improved stability of encapsulated phages were demonstrated with phages
being detected in 38.1% of animals compared to detection of non-encapsulated phages in 9.5%
of animals. The protection level of the phage against bacterial infection was similar for both
groups when tested in vivo, however the encapsulated phages provided a longer time of
protection when treatment was stopped with non-encapsulated phages disappearing within 72
hours and encapsulated phages remaining for one week [69]. For these reasons, phages with
high acidic resistance should be selected for phage therapy in the gastrointestinal tract or

25
methods to protect the phages against acidic conditions should be implemented or a
combination of these methods.
1.8.5 Phage-Antibiotic Synergy
Studies over the past decade have demonstrated the potential of using bacteriophages as phage
therapy in order to replace the current method of antibiotics. Instead of complete replacement of
antibiotics, Comeau et al. (2007) performed a study determining the effect of a combined
therapy of both phage and antibiotic. This study demonstrated an increased phage titre and
increased rate of lytic activity with the combined therapy. The phenomenon was repeated in
different bacterial species using various phages combined with antibiotics. This included E. coli
infected with phage MFP and cephalosporins, and Yersinia pseudotuberculosis infected with
phage PST and quinolone. The combined treatment of T4 phage and 30 mg/L ceftotaxime
demonstrated an 11-fold increase in the total phage titre. The theory behind this synergistic
relationship is the filament-induced state of the bacterial cells by the antibiotics, leads to an
enhanced rate of phage assembly and increased sensitivity of the bacterial cell to the phage
lysin. This filamentous state of bacteria is stress-induced; therefore from an ecological view the
phages may have developed to identify weak and easily infected cells for fast production of
viral progeny [70]. The synergistic effect was termed phage-antibiotic synergy (PAS). Torres-
Barcelo et al. (2016) demonstrated the synergistic effect of phage LKD16 and varying
antibiotics on P. aeruginosa. The difference in the average final optical density of bacterial
growth was decreased to 0.92 +/- 0.07 in the combined therapy compared to the antibiotic
therapy of 1.32 +/- 0.05. The observed difference in optical density was compared to the
expected difference of the combined therapy. This was repeated using various antibiotics with a
threefold increase in the observed reaction of phage and carbenicillin and a twofold increase in
the observed reaction of phage and gentamicin and trimethoprim, demonstrating the synergistic,
not additive, relationship [71]. Further studies need to be conducted to ensure resistance towards
phages and antibiotics are not selected for when using a combination of therapies. The highly
specific lytic activity of phages has been demonstrated to be successfully harnessed to control
bacterial infection, however with the combined therapy of phage and antibiotics a higher

26
efficiency therapeutic method may be developed.

27
1.9 Project Aim
The emergence and spread of critically important antimicrobial resistance such as ESC resistant
E. coli urgently requires a novel strategy for the control and management of these bacterial
isolates. The significant financial impact on meat production and the risk of direct transfer or
mobilization of plasmids carrying ESC resistant genes along the food chain, from livestock to
humans [6, 14], shows the need for a phage therapeutic agent targeting ESC resistant E. coli to
be developed. Phages offer a highly specific control of infections in livestock, however phages
that target ESC resistant E. coli need to be isolated, characterised using electron microscopy and
whole genome sequencing, and the host range determined. These host specificity tests will
determine if the lytic phages target ESC resistant E. coli isolates with no lysis of commensal E.
coli and other gut microflora. Analysis of the phage genomes, with concentration on tail
proteins, may determine the phage recognition protein allowing development of a more valuable
phage therapy.
Hypotheses of this study
1) Lytic phages that can specifically lyse ESC resistant E. coli can be isolated from faecal
samples from pig farms that have detected ESC resistant E. coli after ESC (ceftiofur)
use.
2) Lytic phages isolated from faecal samples from pigs treated with ESCs and target ESC
resistant E. coli present will have greater host specificity than phages isolated from
faecal samples from untreated pigs or environmental samples without ESC resistant E.
coli, making them more suitable as phage therapy agents
Aims of this study
1) Isolate lytic bacteriophages that target ESC resistant E. coli from different sources including
a) Faecal material from pig farm where ceftiofur was used in the past
b) Faecal material from pigs that did not receive ceftiofur treatment in the past
c) Environmental water samples

28
2) Identify the host range of the bacteriophages that are active against ESC resistant E. coli by
testing lytic activity against a range of bacteria including ESC resistant E. coli, commensal
and pathogenic E. coli isolates from pigs and wide range of bacterial genera
3) Characterisation of bacteriophages specific to ESC resistant E. coli using transmission
electron microscopy and next generation sequencing
4) Identify differences in tail segments of lytic bacteriophages which may account for different
host ranges

29
2. Methods
2.1 Sample Background
Samples for isolation of E. coli specific phages were sourced from three locations; a piggery in
South Australia, grower pigs housed at Murdoch University and swampland on the south side of
Murdoch University, which was a runoff area for paddocks holding sheep, cattle and horses.
Samples were collected and isolated on different dates (Table 1), with faecal samples collected
from the freshly defecated samples on the ground. The three pooled faecal samples from South
Australia (S1, S2 and S3) were analyzed separately due to the potential that the three samples
were collected from three different pens from around the piggery. The six faecal samples from
Murdoch University (M1) grower pigs were pooled together for testing due to all samples being
collected from a single house of grower pigs on the same day. The water samples from the
Murdoch University swampland (M2) were analysed separately due to collection at different
geographical locations within the swampland.
Table 1. Collection details of source samples used for phage isolation.
Sample type Number of samples Location collected from Date collected
Pooled Faeces
(S1, S2 and S3)
3 Piggery, South Australia March 2015
Faeces (M1) 6 Grower pigs, Murdoch May 2016
Water (M2) 6 Swampland, Murdoch June 2016

30
2.2 Bacterial Isolates
All bacterial isolates used in this study are listed in Table 2. Bacterial isolates were provided by
Dr Sam Abraham from a reference strain collection (Table 2). Isolation of phages was
conducted using bacterial isolates SA35-46, 72-73 and ATCC 25922 E. coli strain. Isolates
SA35-46 and 72-73 were isolated from healthy livestock whilst 107 is the ATCC 25922 E. coli
strain (Table 2).
Cross-reactivity within E. coli was tested using commensal and pathogenic E. coli isolates from
pigs and other E. coli isolates from seagulls and dogs. Phage lysis was also tested against
multiple bacterial genera, including Salmonella spp, Streptococcus spp, Enterococcus spp and
Staphylococcus spp, to determine the potential effect of the lytic phages on gut microflora.

31
Table 2. List of all bacterial isolates used in this project for isolation of phages and host range
determination.
ID Number Species Source
SA 35* Escherichia coli Pig – healthy
SA 36* Escherichia coli Pig – healthy
SA 37* Escherichia coli Pig – healthy
SA 38* Escherichia coli Pig – healthy
SA 39* Escherichia coli Pig – healthy
SA 40* Escherichia coli Pig – healthy
SA 41* Escherichia coli Pig – healthy
SA 42* Escherichia coli Pig – healthy
SA 43* Escherichia coli Pig – healthy
SA 44* Escherichia coli Pig – healthy
SA 45* Escherichia coli Pig – healthy
SA 46* Escherichia coli Pig – healthy
SA 72* Escherichia coli Pig – healthy
SA 73* Escherichia coli Pig – healthy
SA 18 Escherichia coli Pig – diarrhoea
SA 20 Escherichia coli Cow – diarrhoea
SA 22 Escherichia coli Cow – diarrhoea
SA 25 Escherichia coli Pig – diarrhoea
SA 26 Escherichia coli Pig – diarrhoea
SA 27 Escherichia coli Pig – diarrhoea
SA 28 Escherichia coli Human – Sepsis
SA 34 Escherichia coli Dog – Sepsis
SA 58 Escherichia coli Human – Sepsis
SA 63 Escherichia coli Lab strain J53
SA 102 Escherichia coli Pig – diarrhoea
SA 103 Escherichia coli Pig – diarrhoea
SA 104 Escherichia coli Pig – diarrhoea
SA 107 Escherichia coli ATCC 25922
SA 118 Escherichia coli Cattle – carriage STEC
SA 120 Escherichia coli Cattle – carriage STEC
ETEC 24 Escherichia coli Pig – diarrhoea
ETEC 28 Escherichia coli Pig – diarrhoea
ETEC M10 Escherichia coli Pig – diarrhoea
Com 20 Escherichia coli Pig – healthy
Com 78 Escherichia coli Pig – healthy
Com 119 Escherichia coli Pig – healthy
Com 132 Escherichia coli Pig – healthy
Com 151 Escherichia coli Pig – healthy
APLMAR WA3 Escherichia coli Pig – healthy
APLMAR WA7 Escherichia coli Pig – healthy
APLMAR WA13 Escherichia coli Pig – healthy
APLMAR WA16 Escherichia coli Pig – healthy
APLMAR WA20 Escherichia coli Pig – healthy
SG 84 Escherichia coli Seagull – healthy
SA 2 Salmonella enterica Cat – diarrhoea
SA 89 Staphylococcus aureus Pig – Healthy
SA 90 Staphylococcus aureus Pig – Healthy
SA 108 Staphylococcus aureus ATCC 25923
SA 101 Staphylococcus epidermis Dog – skin infection

32
SA 84 Streptococcus suis Pig – Meningitis
SA 86 Streptococcus suis Pig – Meningitis
SA 105 Enterococcus faecalis ATCC 29212
SG 28 Enterococcus gallinarum Seagull – healthy
E104 Enterococcus hirae Pig – healthy
E112 Enterococcus durans Pig – healthy
E107 Enterococcus faecium Pig – healthy
E115 Enterococcus faecium Pig – healthy
E119 Enterococcus faecium Pig – healthy
SA 6 Enterbacter cloacae Human – healthy
SA 109 Pseudomonas aeruginosa ATCC 27853
SA 1 Citrobacter frendii Human – healthy
SG 77 Aeromonas veronii Seagull – healthy
SG 40 Proteus mirabillis Seagull – healthy
*Extended-spectrum cephalosporin resistant isolate
Prior to this project all isolates were stored at -80 °C in 1 mL of brain heart infusion broth (BHI)
(Thermo Fisher Scientific, Australia) with 20% glycerol (Ajax finechem, Australia). ESC
resistant E. coli isolates were subcultured onto blood agar plates (Micromedia, Australia) and
incubated at 37 °C for 24 hours. To ensure pure colonies were used for experiments, a single
colony was subcultured onto another blood agar plate and incubated at 37 °C for 24 hours.
Bacterial cultures were harvested from the subcultured plate using a 10 µL loop taken and
suspended in BHI broth with 20% glycerol in a 2 mL cryotube (Sarstedt, Germany). The
suspension was vortexed and stored at -80 °C. This stock was used for the project. All other
isolates were cultured from original stocks stored at -80 °C. Cultures used in all experiments
were recultured from these -80 °C stocks onto Luria-Bertani (LB) (Thermo Fisher Scientific,
Australia) agar plates using a 10 µL loop. The plates were incubated overnight at 37 °C.

33
2.3 Broth Microdilution
Broth microdilution was performed using ceftriaxone (Sigma Aldrich, Australia) to reconfirm
ESC resistance of previously isolated ceftiofur (ESC) resistant bacterial isolates that were stored
at -80 °C. The reason for this is because ESC resistance encoding plasmids can be lost after
freezing at -80 °C. The minimum inhibitory concentration (MIC) was determined by the lowest
concentration of antibiotics which inhibited bacterial growth. To ensure sterility all preparation
work was conducted inside a Class II Biological Safety Cabinet and microtitre plates were only
opened inside the cabinet. The 96-well polystyrene round bottom microtitre plates (Thermo
Fisher, Australia) were labelled with column 1 used as a negative control to confirm the sterility
of the Mueller Hinton II broth (MH) (Thermo Fisher, Australia) (Figure 4). Column 2 was a
positive control to confirm growth of bacterial isolates with only MH broth and inoculum added
to this column (Figure 4). All other columns received broth, inoculant and varying
concentrations of antibiotics with two-fold dilutions of antibiotics across the columns (Figure
4).
Neg Pos 16 8 4 2 1 0.5 0.25 0.125 0.06 0.03
Figure 4. Schematic diagram of broth microdilution plates for susceptibility testing
with labelled ceftriaxone concentrations.
Neg: Negative control. Pos; Positive control.
34
The European Committee on Antimicrobial Susceptibility Testing (EUCAST) guideline
concentrations for broth microdilution resistance testing were used to calculate the
concentration of ceftriaxone required. The MIC breakpoints from EUCAST are 2 µg/mL for
ceftriaxone.
For serial dilutions, 90 µL MH II broth was aliquoted into all columns using an electronic
multichannel pipette. All wells in column 3 received 90 µL of 16 µg/mL ceftriaxone (Sigma
Aldrich, Australia), the solution was pipetted up and down to mix and 90 µL transferred to the
next column. This serial dilution step was repeated to columns 3-12 with the 90 µL of the last
column discarded. This resulted in each column being diluted in a two-fold dilution series.
The inoculation stage standardizes the bacterial concentration used to inoculate the plates. The
required concentration following the EUCAST guidelines is 5 x 10⁵ CFU/mL. The acceptable
range is 2 - 8 x 10⁵ CFU/mL. Bacterial isolates were recultured from frozen stocks on blood
agar plates 48 hours prior to the broth microdilution. The plates were incubated at 37 °C for 24
hours. To ensure pure colonies a single colony was re-plated onto blood agar and incubated at
37 °C for 24 hours. Single colonies (1-3) of similar morphology were suspended from the plate
into 2 mL of saline (0.9% w/v NaCl). The turbidity of this solution was compared to the
turbidity of the calibrated McFarland 0.5 standard (Thermo Fisher, United States). The turbidity
was adjusted through suspension of more colonies or by dilution with 0.9% w/v saline. The
solution was used within 15 minutes to prevent bacterial growth occurring before incubation, as
per EUCAST guidelines. The solution was then diluted 1:20 in MH II broth to reach a bacterial
concentration of 5 x 10⁶ CFU/mL. This was achieved via addition of an aliquot of 25 µL of
bacterial suspension into 475 µL of MH II broth. Each well was inoculated with 10 µL of the
diluted bacteria in MH II broth, with the exception of column 1 (negative control). When
pipetting, the solution was mixed thoroughly by pipetting up and down multiple times. After
inoculation the plates were incubated for 24 hours at 37 °C in an ambient air incubator. The
results were read by eye with comparison against the control as per EUCAST guidelines.
Results were recorded as growth or no growth observed on the bottom of each well.

35
2.4 Chemicals, Equipment and Media
All chemicals, reagents and equipment used in this project are listed in Appendix I. The method
for preparation of all media used in this project are listed in Appendix II.

36
Figure 5. Flow chart describing the experimental design for the isolation and characterisation of phages with lytic activity against ESC resistant E. coli
isolates.

37
2.5 Isolation of Phages
Phages with lytic activity against ESC resistant E. coli isolates were isolated from source
samples using the following method. The first step was enrichment of the phages through the
incubation of source samples and the target bacterial isolates in broth. Phages were subcultured
and serial dilutions of the phage preparation were conducted in order to isolate a single phage
plaque. The lytic activity of all phages was tested against ESC resistant, commensal and
pathogenic E. coli, as well as other bacterial genera to determine host specificity. Electron
microscopy and NGS were conducted to characterise the phages (Figure 5).
2.5.1 Phage Enrichment
Faecal samples were suspended in SM buffer at a ratio of 1:10 and stirred using a magnetic
stirrer for 24 hours at 4 °C. The suspensions were centrifuged at 4000 g for 10 mins and then
filtered using a 0.45 µm syringe driven membrane filter unit. An equal volume (50 mL) of the
filtrate and 2x LB broth were aliquoted into conical flasks. The solution was inoculated with a
single colony of the different ESC resistant E. coli isolate selected for isolation of phages.
Samples were incubated at 37 °C for 18 hours on an orbital shaker at 80 rpm. The solution was
centrifuged at 4000 g for 10 mins then filtered through a 0.45 µm membrane filter. The
collected lysate was immediately used for phage isolation (as outlined below) with the
remainder stored as stock at 4°C.
2.5.2 Phage Isolation
Phage lysates were spot tested onto lawn plates of their host bacterial isolation isolates.
Bacterial isolates for isolation of phages and host range tests were prepared from frozen stocks
with a 10 µL loop of frozen stock suspended in 3 mL of LB broth. This was incubated on an
orbital shaker at 220 rpm for 5 hours at 37 °C. After incubation, 1 mL of the bacterial broth was
dispensed onto a LB agar plate and the plate swirled to ensure even coverage, followed by
removal of excess broth. The plates were allowed to dry, then four 20 µL drops of phage lysate
were applied to a lawn plate of the target bacterial isolate. The plates were allowed to dry and
were then incubated for 24 hours at 37 °C to determine the lytic activity of phages.

38
Phage growth was indicated by the formation of phage plaques (areas of bacterial lysis), with a
section of the plaques formed harvested using a sterile pasteur pipette and suspended into a
solution containing 1 mL of SM buffer and 25 µL of chloroform (Sigma Aldrich, Australia).
The samples were held at room temperature for several hours.
Ten-fold dilution series were conducted to ensure isolation of a single phage. This was achieved
using a 96-well polystyrene flat bottom plate (Thermo Fisher, United States). For each plaque
suspension 90 µL of Luria-Bertani broth was added to seven wells in a row with 10 µL of
plaque buffer solution added to the first well. From here the solution was mixed by pipetting up
and down and 10 µL transferred to the next well. This was repeated for all wells containing LB
broth with the 10 µL of the last well transferred to a waste bottle. LB agar plates were divided
into eight sections and a lawn plate of the corresponding bacterial isolate were prepared as
above. The phage solutions were dispensed onto the plate in 15 µL volumes, in order of
decreasing concentrations and the plate allowed to air dry. The plates were incubated for 24
hours at 37 °C. Single plaques were harvested using a sterile pasteur pipette as described above.
2.5.3 Phage Stock Preparation
A bacterial broth was incubated for each isolate as described (Section 2.5.2). Aliquots of 100 µL
of the corresponding bacterial isolate to each phage was added into a 0.5 mL microcentrifuge
tube. To this an aliquot of 100 µL of the harvested phage in buffer was added. These were
incubated together for 20 mins at 37 °C. After incubation the 200 µL of bacteria and phage was
aliquoted into 3 mL of soft agar. The agar was mixed and poured onto a LB agar plate covering
the surface. The agar was allowed to harden and the plates were incubated for 16-18 hours at 37
°C.
A solution of 10 mL SM buffer and 200 µL chloroform was prepared for each plate that was
incubated overnight. This was mixed and poured on top of the soft agar. The plates were then
stored at 4 °C for several hours and agitated manually every hour. The supernatant was then
extracted and aliquoted into 15 mL centrifuge tubes. The samples were centrifuged at 4000 g for
10 mins and the supernatant was filtered through a 0.45 µm membrane filter syringe. Phages

39
were stored by dispensing 1 mL of phage into multiple 2 mL screw cap micro tubes. One micro
tube was stored at 4 °C for electron microscopy and DNA extraction whilst the remainder were
stored at -80 °C.
To ensure the phage preparation contained a sufficient concentration of phages for electron
microscopy and DNA sequencing, 1 mL of the preparation was concentrated tenfold and stored
at 4 °C. This was prepared using 500 µL Vivaspin 10 kDa cutoff protein concentrator spin
columns (GE Healthcare Life Sciences, Australia). A 500 µL aliquot of the phage preparation
was added to the column and centrifuged at 10,000 g for 10 mins. The membrane was washed
repeatedly with 50 µL SM buffer and wash was stored at 4 °C.
2.6 Electron Microscopy
Sample particles were fixed onto a formvar grid and allowed to air dry for 5 minutes. Grids
were negatively stained using ammonium molydbate. Electron micrographs were captured using
a Tecnai G2 D1237 electron microscope (FEI, United States).
2.7 Host Range
The host range of the phages was determined using spot tests on all bacterial isolates listed in
Table 2. Cross-reactivity between the different ESC resistant E. coli isolates from the South
Australian piggery was conducted first. The isolates were incubated as previously described
(2.5.2). The lawn plate was prepared as described in section 2.5.2 using LB agar plates. The
lawn plate was divided into a 4x4 grid structure with 10 µL of each phage spotted onto each
square. The last square on each plate was used as a negative control with 10 µL of SM buffer
dispensed on it. The plates were incubated at 37 °C for 16-20 hours before examination for
lysis. This was repeated for all ESC resistant E. coli isolates.
Following this the specificity of the phages amongst multiple E. coli isolates were tested using
the procedure explained above. To determine the potential of the phages to be used in phage
therapy the lytic activity of each phage was also tested on various bacterial genera including

40
commensal and enterotoxigenic E. coli, Salmonella spp, Streptococcus spp (on blood agar) and
Enterococcus spp.
2.8 DNA Extraction
DNA extractions of phages was conducted using two methods. DNA extractions of a small set
of samples were conducted using a DNeasy Blood and Tissue Kit (Qiagen, Australia) [72]. The
manufacturer recommended protocol was followed for cultured animal cells with the following
modifications; the digestion of protein contaminations step was conducted at 55 °C instead of
70 °C and 50 µL of Buffer AE was used for the final illusion instead of 200 µL.
DNA extractions for a large set of samples (greater than 12) were conducted using a MagMAX
Viral Isolation Kit (Ambion, Australia), according to the manufacturer’s instructions.
2.9 DNA Quantification
DNA extracts were quantified using a Qubit dsDNA HS Assay Kit (Thermo Fisher Scientific,
Australia) with a Qubit 2.0 fluorometer (Thermo Fisher Scientific, Australia). The
concentrations were diluted to the required concentration (0.3 ng/µL, with an accepted range of
0.2-0.4 ng/µL) for the DNA library preparation for NGS. The diluted DNA extracts were used
immediately for sequencing preparation.
2.10 MiSeq DNA Library Preparation
The DNA library preparation for sequencing was conducted using the Nextera XT DNA library
preparation kit (Illumina, United States) according to the manufacturer’s protocol with the
exception that the incubation of the tagmentation reaction was extended from 5 minutes to 7
minutes at 55 °C [72]. Library quality was assessed on a LabChip GXII (Perkin Elmer,
Australia), before samples were normalised and loaded onto an Illumina MiSeq V3 2x300
flowcell and sequencing performed on the Illumina MiSeq platform [72].

41
2.11 Bioinformatics
Analysis and annotation of whole genome sequences was conducted using CLC Genomics
Workbench V7.7.64 (QIAGEN, Australia), Geneious V9.1.6 [73], Mauve V2.4.0 [74] and
Mega7 V7.0.18 [75]. De novo assembly of paired reads was performed using CLC Genomics
Workbench. Contigs larger than 10,000 base pairs in length were retained for further analysis.
Contig sequence homology to known viral sequences was characterized by searching against the
BLASTn database. The accession with the highest similarity and query cover was recorded.
Phages were annotated using Phantome (www.phantome.org) and Geneious [73]. Manual
annotation was conducted by BLASTp interrogation of translated open reading frames of the
unrecognized proteins against all protein sequences on the NCBI database.
Phylogenetic analysis was conducted in Mega7 [75]. The genes were first aligned, selection of
the best DNA model for each data set were conducted and used for creation of trees. For the
lysin gene, the evolutionary history was inferred by using the maximum likelihood method
based on the Whelan and Goldman model [76]. For the DNA polymerase gene, the evolutionary
history was inferred by using the maximum likelihood method based on the JTT matrix-based
model [77].
Mauve [74] and Mega7 [75] were used to build alignments of both whole genomes and
particular protein sequences between the different phages for visual comparison and
identification of nucleotide changes.
Sections of the genomes accounting for tail genes were concatenated and aligned for analysis
using Geneious [73]. Alignments of each of the major tail protein sequences were also
conducted using Mega7 [75].

42
3. Results
3.1 MIC Value
Antimicrobial susceptibility was performed via broth microdilution to confirm extended-
spectrum cephalosporin resistance of E. coli isolates SA35-46 and 72-73. All tested E. coli
isolates demonstrated resistance to ESC with the minimum inhibitory concentration of all
isolates being >8 µg/mL (Table 3).
In all plates the negative and positive controls worked successfully with no growth present in
the negative control and growth in all positive controls. This demonstrated the broth sterility and
viability of all isolates. The EUCAST MIC breakpoint for ceftriaxone is 2 µg/mL. The ATCC
E. coli control 25922 should be susceptible to ceftriaxone at this concentration as confirmed in
Table 3, with the MIC being 0.5 µg/mL.

43
Table 3. Minimum inhibitory concentration values of ESC resistant E. coli isolates against
ceftriaxone.
Isolate number Ceftriaxone (µg/mL)
SA35 >8
SA36 >8
SA37 >8
SA38 >8
SA39 >8
SA40 >8
SA41 >8
SA42 >8
SA43 >8
SA44 >8
SA45 >8
SA46 >8
SA72 >8
SA73 >8
ATCC 25922 0.5

44
3.2 Phage Enrichment
In order to determine the presence of phages specific to ESC resistant E. coli bacterial isolates,
phages were isolated and purified through enrichment using these bacterial isolates. The spot
tests of the phage lysates onto target microorganisms did display strong lytic activity against the
ESC resistant E. coli host isolates (Figure 6). Faecal samples S1, S2 and S3 were enriched in
bacterial isolates SA35, 36, 72 and 73. The presence of phages were detected in S1, S2 and S3
enriched in isolate SA35, 72 and 73 and S2 and S3 enriched in isolate SA36 (Table 4). There
was no phage lysis in three of the source sample and bacterial isolate combinations; faecal
samples S1 enriched in isolate SA73 and S2 and S3 in isolate 72.
A larger bacterial collection range was used for isolation of phages from faecal samples from
pigs at Murdoch University with faeces enriched in E. coli isolates SA10, 18, 25, 26, 35, 36, 72,
73, 102, 103 and 104. Phages were only isolated from enrichments with isolate SA35, showing
the presence of only phages with lytic activity against the ESC resistant E. coli (Table 1). The
water samples sourced from Murdoch University swampland were enriched in broths with the
Figure 6. Spot test of phage enrichment from faecal sample S2
and isolate SA35 onto lawn plate of ESC E. coli isolate SA35
demonstrating four plaques of strong lytic activity.

45
ESC resistant E. coli isolate SA35 and ATCC E. coli strain 25922. Five phages were isolated
from the water samples. All phages were isolate using the ATCC E. coli strain 25922, with no
phages isolated with lytic activity against E. coli SA35 (Table 4).
Table 4. Isolated phage IDs showing the bacterial host strain and source sample used in the
phage enrichment step.
Phage ID Bacterial isolate Sample
1-4 SA35 S1
5-8 SA35 S2
9-12 SA35 S3
13 SA36 S2
14, 15 SA72 S1
16-23 SA72 S2
24, 25 SA73 S3
26-33 SA35 M1
34-38 ATCC 25922 E. coli strain M2
S1: faecal matter 1 from South Australia, S2: faecal matter 2 from South Australia, S3: faecal matter 3 from
South Australia, M1: faecal matter from Murdoch University, M2: water samples from Murdoch University
swampland.

46
3.3 Phage Isolation
After phage enrichment, individual phage plaques were isolated for purification of the phage
preparation. The ten-fold dilution series showed a decrease in the size of bacterial plaques in
reducing phage concentrations (Figure 7). The dilutions resulted in single plaque formation in
the 10-5
, 10-6
and 10-7
dilutions (see section -5, -6 and -7 Figure 7), with these single plaques
being used for phage harvesting. Some dilution series were repeated due to single colonies not
being evident or separated. These were successful following repetition, with a total of 38 phage
plaques isolated from the three source samples against E. coli isolates SA35, 36, 72, 73 and
ATCC E. coli strain 25922.
Figure 7. Ten-fold dilution series of phage lysate 6 on lawn plate of ESC E. coli
isolate SA35 for phage plaque purification, with decreasing concentration of
phage in a clockwise direction from n being the original concentration PFU/mL
to section -7 being 10-7
PFU /mL.

47
The diameter of plaques from the serial dilutions varied significantly between phages (see in
Figure 8). Figure 8 shows a six-fold larger burst size over phage 40 (1100µm) compared to
phage 35 (180µm). Picking of the phage plaques was difficult for the phages with smaller burst
size, in some cases requiring a dissection microscope, and may have accounted for the loss of
lytic phages in some samples.
The phages were then purified and harvested for stock using the soft agar method (Section
2.5.3). The phage lysis differed between phages in this soft agar process, with some showing
strong lysis of the bacterial lawn plate and therefore a high amount of phage for harvesting, and
others demonstrating no lysis of the bacterial lawn plate preventing these phages from being
harvested, this may be due to the small burst size as mentioned in the above paragraph.
Repetition of this process didn’t affect the results with phages 16, 18, 19, 20, 21 and 22 still
showing no phage growth. Plaques of these phages from the first spot test were taken and the
serial dilution and soft agar processes repeated with no success of phage plaque formation.
Phage purification was successfully achieved from 32 of the 38 plaques isolated. Six of the
plaques did not show bacterial lysis during the harvesting of the phage and could not be
a) b)
Figure 8. Comparison of bacteriophage single plaque size variation on lawn plate of the host strain
ATCC E. coli 25922 between phage 40 (a) and phage 35 (b) using light microscopy
Scale bar = 500 µm. a) Burst size = 1100µm b) Burst size = 180µm.
a) b)

48
isolated. To confirm that the harvested phages remained active and were taken up into the SM
buffer, spot tests on the host isolates were conducted. Figure 9 demonstrates the lytic activity of
phages 1-12 on the host isolate SA35. Phages 13-15 were isolated on a different isolate and
therefore were not expected to lysis SA35. Phages 14-15, 17, 23 and 35-36 lost lytic activity
against the host isolate which may be due to an issue with the small size of the single plaques
from the dilution series.
Figure 9. Spot test of phages 1-15 on lawn plate of ESC E. coli isolate
SA35 with lysis of the host isolate for phages 1-12 and no lysis of
SA35 from phages 13-15 which were isolated on SA36.

49
3.4 Host Range Determination
The host range of each phage was determined against all the ESC resistant E. coli isolates
(Table 5). This was determined in order to see the potential coverage of single and combined
phages against the ESC resistant isolates. The majority of phages had a small host range with 20
(74%) phages lysing only one bacterial isolate, two (7%) phages lysing two bacterial isolates
and two (7%) lysing three bacterial isolates. Three (11%) phages showed a larger host range
with phage 30 lysing five ESC resistant E. coli isolates and phage 26 and 27 lysing nine ESC
resistant E. coli isolates.
Further host range tests were completed on all phages against a large collection of bacteria
compromising of commensal E. coli from pigs, diarrhoea inducing E. coli and other bacterial
genera (Table 6). These tests were conducted in order to determine whether the isolated phages
had lytic activity against common gut microflora species. Of all bacterial isolates tested, only
three E. coli isolates were lysed by the phages, with one isolated from swine with diarrhoea
(SA25), one isolated from healthy swine from Western Australia (APLMAR-WA16) and the
other strain being a sodium azide resistant laboratory strain.

50
Table 5. Host range of all isolated bacteriophages against ESC resistant E. coli.
Phage
Number
Bacterial Isolate Identification
SA35 SA36 SA37 SA38 SA39 SA40 SA41 SA42 SA43 SA44 SA45 SA46 SA72 SA73
1 + -- -- -- -- -- -- -- -- -- -- -- -- --
2 + - - - - - - - - - - - - -
3 + - - - - - - - - - - - - -
4 + - - - - - - - - - - - - -
5 + - - - - - - - - - - - - -
6 + - - - - - - - - - - - - -
7 + - - - - - - - - - - - - -
8 + - - - - - - - - - - - - -
9 + - - - - - - - - - - - - -
10 + - - - - - - - - - - - - -
11 + - - - - - - - - - - - - -
12 + - - - - - - - - - - - - -
13 -- + -- -- -- - - - - - - - - -
17 - - - - - - + - - - - - - -
23 - - - - - - - - - - - - - -
24 -- -- - -- + - - - - - - + - +
25 - - -- - + - - - - - - + - +
26 + + - + - - + + + + + + - -
27 + + - + - - + + + + + + - -
28 + - - - - - - - - - - - - -
29 + - - - - - - - - - - - - -
30 + - - - + + - + - - - + - -
31 + + - - - - - - - - - - - -
32 + - - - - - - - - - - - - -
33 + - - - - - - - - - - - - -
34 - - - - + - - - - - - - - -
37 - - - - + - - - - - - - - -
38 - - - - - - + - - - - + - -
+ = lysis of bacteria
- = no lysis of bacteria

51
Table 6. Host specificity of all isolated phages tested against multiple bacterial genera.
Bacterial
species
Number of isolates
tested
Number of
lysed isolates
Isolate lysed (phage ID)
E. coli 44 3 SA25 (24), SA63 (1-13, 26, 27, 31),
APLMAR-WA16 (1)
S. enterica 1 0
S. aureus 3 0
S. epidermis 1 0
S. suis 2 0
E. faecalis 1 0
E. gallinarum 1 0
E. hirae 1 0
E. durans 1 0
E. faecium 3 0
E. cloacae 1 0
P. aeruginosa 1 0
C. frendii 1 0
A. veronii 1 0

52
3.5 Phage Characterisation
3.5.1 Electron Microscopy
Morphological characterization of phages 1, 2, 3 and 4 was performed using electron
microscopy (EM). Later in the project, morphological characterization of phages 23 and 26 was
performed using electron microscopy, in order to capture the structural differences between
each family of phages. Electron micrographs of these phages are shown in Figure 10. Phage
tails were present in all samples therefore all belong to the Caudovirales order with
representations of all three tailed phage families captured.
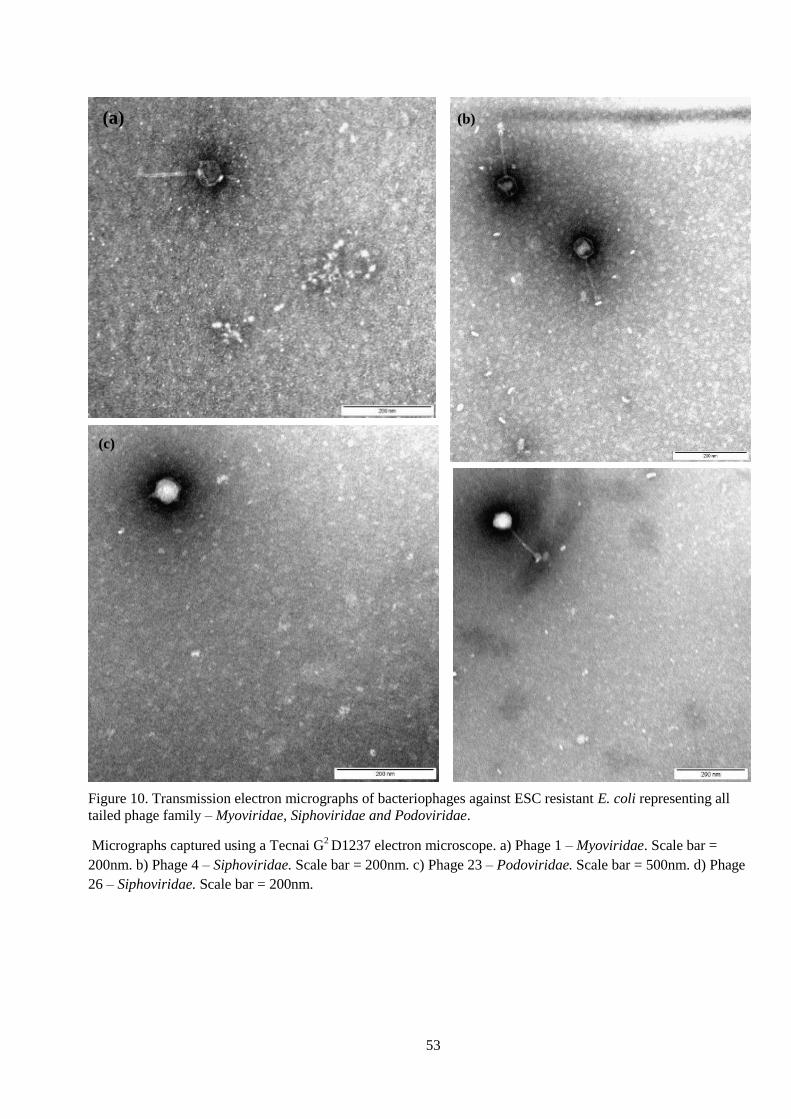
53
Figure 10. Transmission electron micrographs of bacteriophages against ESC resistant E. coli representing all
tailed phage family – Myoviridae, Siphoviridae and Podoviridae.
Micrographs captured using a Tecnai G2 D1237 electron microscope. a) Phage 1 – Myoviridae. Scale bar =
200nm. b) Phage 4 – Siphoviridae. Scale bar = 200nm. c) Phage 23 – Podoviridae. Scale bar = 500nm. d) Phage
26 – Siphoviridae. Scale bar = 200nm.
(a) (b)
(c) (d)
(c)
(d)

54
The diameter of the head and length of the tail were determined using the measuring tool from
the program ImageJ V1.6.0 [78] and additional structures identified. Differentiation into
families was determined based on the characteristics as outlined in Table 7. The tail length of
phage 1 and the presence of the contractile tail sheath inferred that phage 1 was from the family
Myoviridae. Phages 4 and 26 tails were non-contractile however of length 121nm and 126nm
respectively, placing these phages within the Siphoviridae family. The short tail length of 18nm
of phage 23 is consistent with the phage belonging to the Podoviridae family. The morphology
of each phage showed an icosahedral shaped head with a diameter range of 50-56nm.
Table 7. Morphological characteristics captured using transmission electron microscopy of
bacteriophages isolated against ESC resistant E. coli.
Phage number Head diameter (nm) Tail length (nm) Extra features Virus Family
1 56 127 Tail sheath and
baseplate
Myoviridae
4 50 121 Baseplate Siphoviridae
23 50 18 Podoviridae
26 52 126 Baseplate Siphoviridae
3.5.2 Whole Genome Sequencing
All 28 phages that were active against ESC resistant E. coli were prepared for whole genome
sequencing in order to confirm characterization of phages into families and potentially further
characterization into genera. Successful sequencing of twenty one phages with contigs over
10,000 base pairs were used for molecular analysis. Comparison of the isolated phages against
the NCBI database was performed by using the BLASTn tool from NCBI and confirmed phage
1 belonged to the family Myoviridae, with phages 13, 17 and 23 belonging to the Podoviridae
family and all other phages being Siphoviridae (Table 8).

55
Table 8. Analysis of contig sequences from whole genome sequencing of isolated phages
against ESC resistant E. coli using BLASTn.
Phage Contig
length (bp)
Top BLAST
result
Accession
Number
Genome
length (bp)
Query
(%)
Ident Phage family Phage Genus
1 42413 vB EcoM KM360178.1 42351 76 93 Myoviridae Unclassified
2 44518 JK06 DQ121662.1 46072 65 83 Siphoviridae Tunalikevirus
3 44518 phiEB49 JF770475.1 47180 54 84 Siphoviridae Tunalikevirus
3 42462 K1ind2 GU196280.1 42765 67 89 Siphoviridae Unclassified
4 42462 K1ind2 GU196280.1 42765 68 89 Siphoviridae Unclassified
4 44518 phiEB49 JF770475.1 47180 54 84 Siphoviridae Tunalikevirus
5 26129 phiEB49 JF770475.1 47180 53 83 Siphoviridae Tunalikevirus
6 44518 JK06 DQ121662.1 46072 64 83 Siphoviridae Tunalikevirus
7 44518 phiEB49 JF770475.1 47180 54 84 Siphoviridae Tunalikevirus
8 44518 phiEB49 JF770475.1 47180 54 84 Siphoviridae Tunalikevirus
9 44519 phiEB49 JF770475.1 47180 54 84 Siphoviridae Tunalikevirus
10 11509 phiEB49 JF770475.1 47180 88 84 Siphoviridae Tunalikevirus
11 44532 phiEB49 JF770475.1 47180 54 84 Siphoviridae Tunalikevirus
13 38842 YpsP-G JQ965703.1 38288 88 93 Podoviridae T7likevirus
17 38749 YpsP-G JQ965703.1 38288 88 93 Podoviridae T7likevirus
23 39036 YpsP-G JQ965703.1 38288 88 93 Podoviridae T7likevirus
26 42462 K1ind2 GU196280.1 42765 67 89 Siphoviridae Unclassified
27 42462 K1ind2 GU196280.1 42765 68 91 Siphoviridae Unclassified
28 42462 K1ind2 GU196280.1 42765 68 89 Siphoviridae Unclassified
29 42462 K1ind2 GU196280.1 42765 68 89 Siphoviridae Unclassified
30 42462 K1ind2 GU196280.1 42765 68 89 Siphoviridae Unclassified
31 42462 K1ind2 GU196280.1 42765 68 90 Siphoviridae Unclassified
32 42462 K1ind2 GU196280.1 42765 68 90 Siphoviridae Unclassified

56
3.6 Comparative Genome Analysis of the Phages Active Against ESC Resistant E.
coli
3.6.1 Annotated Phage Genomes
Analysis of phage genomes was conducted after phage genomes were annotated. Due to the
high number of unknown proteins returned by the online phage annotation tool Phantome
(www.phantome.org), all translated open reading frames of unrecognized proteins were
manually searched against the NCBI database using the BLASTp tool and the region
annotations updated if homologous proteins were found. The phage genome annotation was
completed by grouping the proteins by an arbitrary colour scheme; tail proteins (green), lysin
(blue), other known proteins (red) and hypothetical proteins (pink) (Figure 11). The large
difference of the genomes representing each of the different families and cluster demonstrates
the high rate of mutation of phages resulting in a highly divergent evolution between these
groups, with the genes themselves, the number of genes and the size of genes differing between
the groups.
Several alignments of whole genomes were constructed with phages within each cluster
(excluding Myoviridae due to only one genome) using Mauve. These were used for visual
comparison of the genomes between families. The alignment of the whole genome sequences of
the three Podoviridae phages, all isolated from source sample S2 with isolate SA36 and SA72
demonstrated high similarity. In comparison the alignments of the whole genomes of clusters 1
and 2 demonstrated blocks of the similarity in different locations in relation to the start of the
genome. These blocks were in the same arrangement and the nucleotides in these genomes were
highly similar with the sequences being 99-100% identical. Phages within these clusters have
different 5’ termini of each genome however the order of the genes and blocks are the same.
13
23
17

57
Figure 11. Annotated whole genomes of phages representing the four groups (Myoviridae, Podoviridae, Siphoviridae cluster 1 and Siphoviridae cluster 2) with lytic activity
against ESC resistant E. coli isolates.
a) Phage 1 (Myoviridae), b) Phage 13 (representative of phages 17 and 23 – Podoviridae), c) Phage 7 (representative of phages 2, 3.1, 4.2, 5, 6, 7, 8, 9, 10 and 11 – Siphoviridae cluster 1), d)
Phage 26 (representative of phages 3.2, 4.1, 27, 28, 29, 30, 31 and 32 – Siphoviridae cluster 2). Tail proteins are coded green, other known proteins are coded red, hypothetical proteins (HP) are
coded pink.
a)
b)
c)
d)

58
3.6.2 Phylogenetic Analysis of Phages
Two genes, lysin and DNA polymerase, were chosen for phylogenetic studies in order to
determine relationships between the three bacteriophage families (Figure 12, Figure 13). Two
clusters within the Siphoviridae family were identified using the lysin gene for analysis with
further analysis using the DNA polymerase gene demonstrating a higher rate of differentiation
between phages. These two genes were chosen as they were present across majority of phages.
Phage 1, the only phage belonging to Myoviridae, did not have a DNA polymerase identified.
The lysin and DNA polymerase genes varied in both length across the families.
The phylogenetic tree assembled using the lysin gene (Figure 12) shows three families with 2
clusters within the family Siphoviridae; Cluster 1 includes phages 2, 3.1, 4.2, 6, 7, 8, 9, 10 and
11 with cluster 2 including phages 3.2, 4.1, 26, 27, 28, 29, 30, 31 and 32.
The phylogenetic tree of DNA polymerase (Figure 13) indicates that this gene differs within the
family Siphoviridae, with four different branches corresponding to this family. Cluster 2 showed
three different branches despite 99 or 100% identity of the genome, suggesting that the
mutations in DNA polymerase may be used to differentiate phages beyond the family
Siphoviridae into genus or species.

59
Figure 12. Maximum likelihood phylogenetic tree based on the lysin gene of phages from the three
tailed phage families (Myoviridae, Siphoviridae and Podoviridae).
Scale bar = number of nucleotide substitutions per site. MU – Phages isolated from Murdoch University faecal
material and water samples, SA – Phages isolated from South Australia faecal material. Tree created using WAG
model.
Phage 32 - Lysin translation Phage 32
Phage 31 - Lysin translation 31
Phage 28 - Endolysin translation Phage 28
Phage 27 - Endolysin translation Phage 27
Phage 26 - Putative endolysin translation Phage 26
Phage 4 - contig 1 - Lysin translation Phage 4.1
Phage 3 - contig 2 - Lysin translation Phage 3.2
Phage30 lysin translation 30
Phage29 - Lysin translation 29
P7 Endolysin translation Phage 7
Phage 2 - Endolysin translation Phage 2
Phage 3 - contig 1 - Lysin translation Phage 3.1
Phage 4 - contig 2 - Lysin translation Phage 4.2
Phage 6 - Lysin translation Phage 6.1
Phage 9 - Endolysin translation Phage 9
Phage 8 - contig 1 1 44518 - Lysin translation Phage 8
Phage 11 - contig 1 1 44532 - Endolysin translation Phage 11
P17 contig 2 1 38749 - Lysin translation Phage 17
Phage 13 - Phage lysin N-acetylmuramoyl-L-alanine amidase (EC 3.5.1.28) CDS translation Phage 13
Phage 23 - contig 1 1 39036 - Phage lysin N-acetylmuramoyl-L-alanine amidase (EC 3.5.1.28) CDS translation Phage 23
Phage 1 - Phage lysin CDS translation Phage 1
Phage 32 - MU
Phage 31 - MU
Phage 28 - MU
Phage 27 - MU
Phage 26 - MU
Phage 4.1 - SA
Phage 3.2 - SA
Phage 30 - MU
Phage29 – MU
Phage 7 - SA
Phage 2 - SA
Phage 3.1 - SA
Phage 4.2 - SA
Phage 6 - SA
Phage 9 - SA
Phage 8 - SA
Phage 11 - SA
Phage 17 - SA
Phage 13- SA
Phage 23 - SA
Phage 1- SA
Siphoviridae, Cluster 2
Siphoviridae, Cluster 1
Myoviridae
Podoviridae

60
Figure 13. Maximum likelihood phylogeny tree based on the DNA polymerase gene of phages from the three tailed
phage families (Myoviridae, Siphoviridae and Podoviridae).
Scale bar = number of nucleotide substitutions per site. MU – Phages isolated from Murdoch University faecal material, SA- Phages
isolated from South Australia faecal material. Tree created using JTT model.
Phage 32 DNA P translation Phage 32
Phage 31 - DNA P translation 31
Phage 28 - DNA P translation Phage 28
Phage 4 - contig 1 - DNA P translation Phage 4.1
P17 DNA Polymerase translation Phage 17
Phage 13 - DNA Polymerase translation Phage 13
Phage 23 DNA Polymerase translation Phage 23
Phage 26 DNA P translation Phage 26
Phage29 DNA P translation 29
Phage30 DNA P translation 30
Phage 3 - contig 2 DNA P translation Phage 3.2
Phage 27 DNA P translation Phage 27
Phage 11 -DNA P translation Phage 11
P7 DNA P translation Phage 7
Phage 2 - DNA P translation Phage 2
Phage 3 - contig 1 DNA P translation Phage 3.1
Phage 4 - contig 2 -DNA P translation Phage 4.2
Phage 6 DNA P translation Phage 6.1
Phage 9 DNA P translation Phage 9
Phage 8 DNA P translation Phage 8
Phage 32 – MU
Phage 31 – MU
Phage 28 – MU Phage 4.1 - MU
Phage 17 – SA
Phage 13 – SA
Phage 23 – SA
Phage 26 – MU
Phage 29 – MU
Phage 30 – MU
Phage 3.2 – SA Phage 27 - MU
Phage 11 – SA
Phage 7 – SA
Phage 2 – SA Phage 3.1 – SA
Phage 4.2 – SA
Phage 6 – SA
Phage 9 – SA
Phage 8 – SA
Siphoviridae, Cluster 2
Siphoviridae, Cluster 2
Siphoviridae, Cluster 2
Siphoviridae, Cluster 1
Podoviridae

61
3.6.3 Molecular Comparison of Phage Tail Proteins
Analysis of tail proteins were performed to determine any differences between phages that may
account for change in host range between phages, however no results of significance were
found.
Each tail protein common within each cluster was aligned and checked for single nucleotide
polymorphisms (SNPs). A SNP was found in the tail fiber of Phage 26 leading to a change in
amino acid sequence. The adenosine to guanine change resulted in the change of the neutral
amino acid histidine to a positively charged arginine. Further investigation using an online
interactive protein model portal using RaptorX showed this amino acid change altered the
exposure level of the amino acid at the position from 21% to 22.5% exposed [79]. Phyre2, a
protein homology/analogy recognition engine, predicted the binding site of the protein was
altered from phage 27 to include the arginine [80, 81]. These predictions suggest that the SNP
may be involved with the protein binding site and could potentially alter the host range. Despite
this Phage 26 showed the same host range of the isolates tested in this project when compared to
other phages in this cluster.
Further analysis of the tail proteins was performed by building a concatenated tail protein
segment for each phage (Figure 14). These were aligned for visual comparison using Geneious
[73]. The concatenated tail segments of each phage cluster highlights the variation of the tail
protein genes across the different phage families with the length of these sections being
comparable at 11,000bp for Myoviridae, 12000bp for Podoviridae and 18000bp for
Siphoviridae. There is variation within the genes present in these regions with Myoviridae
having no identified tail fiber gene compared to Podoviridae and Siphoviridae. Each gene also
varies in length between the clusters with the length of the tail fiber protein gene being 1,338bp,
2,388bp, 2,277bp and 2,550bp in Myoviridae, Podoviridae, Siphoviridae cluster 1 and
Siphoviridae cluster 2 respectively. Despite these variations phages from each cluster have
shown the same host range, only showing lytic activity of isolate SA35. This suggests that the

62
different genes may still recognize the same receptor or that a different receptor on this strain is
being used for adsorption.
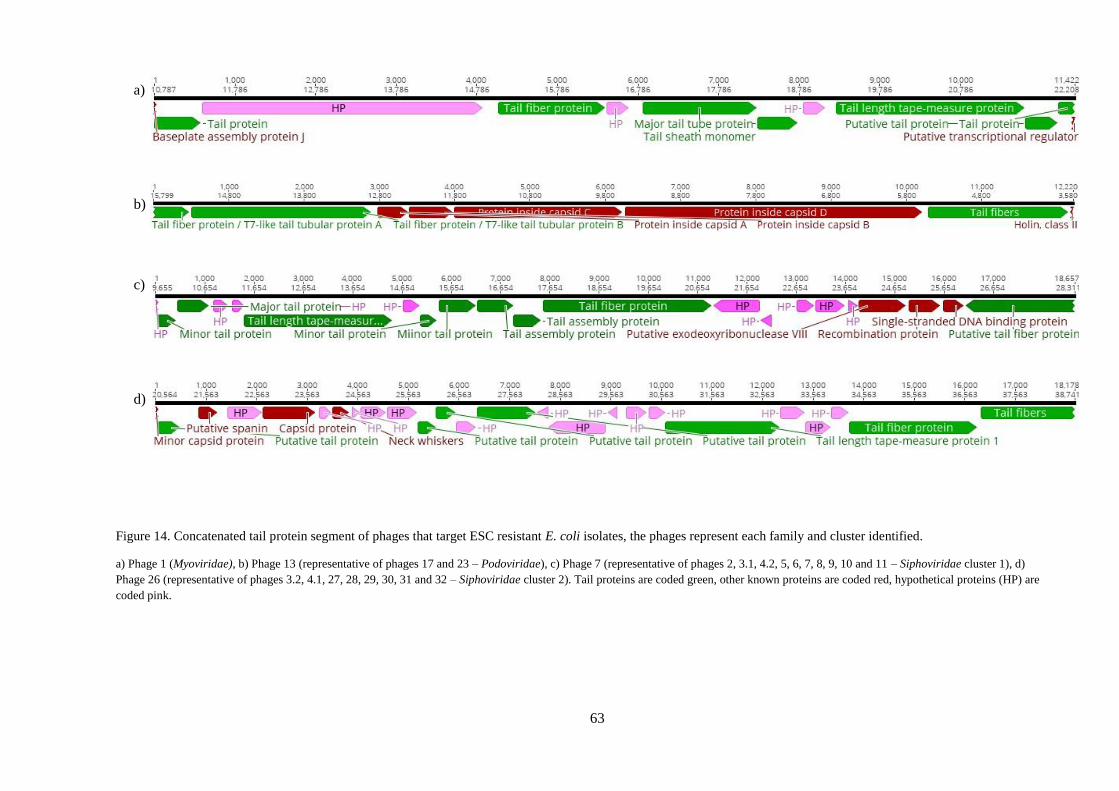
63
a)
b)
c)
d)
Figure 14. Concatenated tail protein segment of phages that target ESC resistant E. coli isolates, the phages represent each family and cluster identified.
a) Phage 1 (Myoviridae), b) Phage 13 (representative of phages 17 and 23 – Podoviridae), c) Phage 7 (representative of phages 2, 3.1, 4.2, 5, 6, 7, 8, 9, 10 and 11 – Siphoviridae cluster 1), d)
Phage 26 (representative of phages 3.2, 4.1, 27, 28, 29, 30, 31 and 32 – Siphoviridae cluster 2). Tail proteins are coded green, other known proteins are coded red, hypothetical proteins (HP) are
coded pink.

64
4. Discussion
Antibiotic and multidrug resistant bacteria have emerged and rapidly spread, with antibiotics no
longer able to be depended upon as the definitive treatment and prevention tool for diarrhoea
induced bacterial infections in the swine industry [2, 12, 16]. Contamination of slaughter meat
with bacteria resistant to critically important antimicrobials such as extended-spectrum
cephalosporins is also a major concern due to its potential for the transfer of antimicrobial
resistant bacteria from animals to humans via the food chain [13, 14]. The use of lytic, target-
specific bacteriophages provides a strategy that can be implemented on a large scale to reduce
the carriage of antimicrobial resistant bacteria in food-producing animals in order to limit the
spread of critically important antimicrobial resistant bacteria [2, 32, 33]. This project aimed to
isolate and characterise bacteriophages that target ESC resistant E. coli from pigs. The major
findings arising from this study are as follows: Firstly, this study has successfully isolated and
characterized 21 bacteriophages that specifically target ESC resistant E. coli from faecal
material of pigs from different sources. Secondly, the morphological and genomic
characterization revealed that all bacteriophages belong to the order Caudovirales and represent
the tailed phage families Myoviridae, Podoviridae and Siphoviridae. Molecular analysis
identified the DNA polymerase gene as a potential marker for the differentiation of
bacteriophages within family groupings. Finally, Siphoviridae phages have the same order of
genes however different 5’ and 3’ termini, suggesting these phages undergo headful DNA
packaging.
Phages with lytic activity against different ESC resistant E. coli isolates were successfully
isolated from faecal material sourced from South Australia (ESC resistant E. coli isolates
present) and Murdoch University. Host specificity testing was conducted on all phages to
determine phages with a broad target host range that have minimal lytic activity against other
bacterial isolates, for identification of phages for future development into a therapeutic agent.
Of the 12 ESC resistant E. coli isolates, 11 were lysed by the phages isolated in this study.
Phages 26, 27 and 30 lysed a wide range of these isolates with phages 26 and 27 lysing nine

65
isolates and phage 30 lysing five isolates. These phages show potential for development into a
phage therapy for decolonizing pigs from ESC resistant E. coli.
Further target specificity of the phages was determined through tests on a number of commensal
and pathogenic E. coli and other bacterial genera and revealed that the majority of the phages
were target specific. The host range testing also revealed that the phages from sources with no
use of ceftiofur (pigs and environment) were able to specifically target ESC resistant E. coli.
This indicates that naturally occurring phages could have specific lytic activity against
antimicrobial resistant E. coli disproving one of the hypothesis of this project, that phages
isolated from faecal material obtained from pigs that were treated with ceftiofur, are more
specific than phages from faecal material from non-treated pigs for lysis of ESC resistant E.
coli. The phages from both samples were highly specific to the ESC resistant E. coli isolates
with only three other E. coli isolates (not resistant to ESCs) also lysed by phages from South
Australia (Phage 1-13 and 24) and Murdoch University (26, 27 and 31) and no lysis of bacteria
from other genera (Table 6). This demonstrates that the phages isolated from faecal material
without the presence of ESC resistant E. coli are of similar specificity and faecal material can
easily be sourced from outside samples for the isolation of phages. In addition to this, the
phages isolated from the South Australian pig farm on average lysed 1.25 (range of 1-3) of the
ESC resistant E. coli isolates compared to the faeces collected from Murdoch University
causing lysis of 3.63 (range of 1-9) isolates (Table 5). This data set not only disproves this
hypothesis, it shows that phages isolated from faecal material without ESC resistant E. coli
isolates has an increased host range of the ESC resistant E. coli isolates. Comparison of the
specificity between phages isolated from different locations evaluated that phages don’t need to
be sourced from locations in conjunction with target bacterial isolates.
Phages were characterized using electron microscopy and next generation sequencing due to
characterization of phages used in phage therapy being a mandatory requirement [50]. All
phages belonged to the order Caudovirales with the EM images capturing the presence of tails
in all samples tested (Phages 1-4, 23 and 26) (Figure 10). Whole genome sequencing confirmed
these classifications into families whilst determining the taxonomy of all other phages. 82.6%,

66
4.3% and 13% of phages isolated belonged to the family Siphoviridae, Myoviridae and
Podoviridae respectively. Characterisation of isolated phages demonstrated an expected range
and proportion of families similar to previous studies with 96% of all bacteriophages belonging
to the order Caudovirales and 61%, 24.5% and 14% being Siphoviridae, Myoviridae and
Podoviridae respectively [17, 39]. These three phage families have also been previously isolated
from swine faecal samples [82-84].
Faecal sample 2 was the only sample containing phages belonging to the Podoviridae family.
These phages were isolated using ESC resistant E. coli isolates (SA36 and SA72). This suggests
that faecal sample 2 may have a different phage population and possibly collected from a
different pig pen. All phages isolated from the Murdoch University faecal samples belonged to
the second cluster of Siphoviridae (tree). This second group was also present in the South
Australian samples however was the minority with a prevalence of 17% of all Siphoviridae
isolated. These demonstrate an unexpected difference in phage population between host
populations and locations.
In this study the DNA Polymerase gene was identified as a potential marker for phylogenetic
analysis. Firstly, molecular analysis of the whole genome sequence of phages that target ESC
resistant E. coli resulted in the recognition of four groups of phages with one group belonging to
each family Myoviridae and Podoviridae and the family Siphoviridae divided into two clusters.
This grouping was also supported by phylogenetic analysis using the lysin gene (Figure 12).
Previous studies have performed phylogenetic analysis of phages using the major capsid gene
and the large terminase gene. This study could not use these genes for phylogenetic analysis due
to a major capsid protein not identified in the Myoviridae phage with three identified in the
Podoviridae phages, and a large terminase gene not identified in Podoviridae with two
identified in phages belonging to Siphoviridae cluster 1. Therefore, phylogenetic analysis was
conducted using DNA polymerase as one copy of this gene was present in all phages (excluding
the one Myoviridae phage), and viral polymerase genes are relatively conserved within families
(Figure 13). This analysis resulted in the differentiation of Siphoviridae cluster 2 into three

67
separate groups. These groups potentially align with phage genus and species and therefore can
be used for classification, with analysis of more phages needing to be conducted to confirm this.
The whole genome alignments of cluster 1 and 2 demonstrated the genes of each phage
arranged in the same order, however in different locations in relation to the start of the genome.
This change in the start of the genome is due to the type of DNA packaging of the phage.
Headful DNA packaging results in genomes of differing lengths and different starting and
ending locations. When phage DNA is inserted into the host cell, it can circularize. The
terminase protein recognizes a specific site on the genome referred to as the pac sequence and
starts synthesis of genetic material from this site. This newly synthesised genome is inserted
into the capsid of a length of between 102 and 110% of the actual genome length. The synthesis
of genetic material continues from the region past the ‘end’ of the genome, with the next
genome packaged now starting at a different base. This cutting and inserting continues until the
capsid is full, resulting in genomes of varying lengths and starting points as seen in these two
clusters. The whole genome alignment of Podoviridae suggests a different DNA packaging
method is used such as exact DTR’s or cohesive ends, due to the identical alignments [85].
Two issues arose when determining phage lysis of ESC resistant E. coli isolates; bacterial
contamination and the determination of lysis. To overcome the bacterial contamination 1 mL of
phage suspension was filtered using a 0.20 µm filter syringe. This process resulted in the
majority of the 1 mL suspension lost due to absorption in the filter and syringe. The next
method applied to overcome the contamination was the addition of chloroform to the phage
preparation. The chloroform resulted in elimination of bacterial contamination without altering
phage lysis. The spot tests with contamination were then repeated. The addition of small
amounts of chloroform should be used for future bacterial contamination.
The second issue was the determination of lysis and no lysis of phages on bacterial lawn plates.
Some spots showed partial lysis with others showing complete lysis of all bacteria. To
differentiate between the levels of lytic activity a scale similar to the study conducted by Kutter
(2009) [86], could be implemented. This scale uses a number system from 0 to +4 with 0

68
showing no lysis and +4 showing complete lysis of bacteria [86, 87]. Future application of the
scale method when recording lysis of phage will differentiate the degree of lysis of each phage,
helping to identify which phage would have higher therapeutic potential against certain bacterial
isolates.
Another issue of the project relates to the concentration of phages for host range testing. When
comparing the host range of different phages, there is an expected difference between the
genomic sequences. However, phages with different host ranges showed identical genome
sequences. This could be due to the concentrations of the phages and the bacteria when
conducting spot tests. The ratio of phage and bacteria (MOI) affect the lytic capability of the
phage suspension [86, 87]. A previous study comparing the percentage reduction of bacteria
against the phage and bacteria concentration demonstrated the importance of the correct MOI
for phage lysis of target bacteria. Initially 4.6x10² PFU/mL was incubated for 2 hours with
differing concentrations of phages. Only 0.1% of the bacteria survived when incubated with
1.1x10⁷
PFU/mL of phage compared to 98.9% surviving when incubated with 1.8x10⁴ PFU/mL
[87]. The significance of the phage concentration was further studied with a log reduction in
phage concentration, from 1.5x10⁶ PFU/mL to 1.5x10
5 PFU/mL, resulting in a 50% reduction in
the percentage of bacteria lysed. In theory, phages 26, 27 and 30 may have a higher phage titer
than other stocks, resulting in the ability to show lysis of various isolates of bacteria. This
change in concentration may also account for the varying amounts of lysis in Figure 3 where
phages 1-15 were spotted onto 35 and the variation in plaque sizes of the different phage
lysates. MOI calculations were not performed in this study, and this may have had some affect
on the results. Future characterization and development of the phages isolated in this study will
require titrations and MOI to be performed.
The immediate future direction is the in-vivo testing of a successful phage cocktail in pigs to
evaluate the efficacy of the phage cocktails in eliminating ESC resistant E. coli. Before use, the
phage preparation would need to have all endotoxins removed using a commercial kit or an
organic solvent method [88]. Endotoxins are the main contaminants of phage preparations from
the bacterial host and if not removed, the in-vivo testing can cause cell injury and toxic shock to

69
the animal [89]. Another factor for preparation of a phage therapy for in-vivo testing is the
survival of the therapy in the acidic levels of the gastrointestinal tract. The stability of phages
differs between each phage with majority denaturing at pH 3 [56, 68]. The acidity of the GI tract
of swine ranges from pH 1-2 before a meal up to pH 4-5 after a meal, with phage therapy
combined into animal feed reducing the effect of the pH on the phages [56]. Another method to
further protect phages against the GI tract is the encapsulation of the phages in liposomes [69].
This would further protect and improve the stability of the phage therapy in in-vivo trials.
Further study of ESC resistant E. coli targeting phages include the combination of phages into a
cocktail, efficacy tests of in vivo animal trials and molecular analysis to identify the phage
recognition binding protein for improvement of phage therapy. Single phages with high
therapeutic potential are often combined into phage cocktails to increase the benefit of the phage
therapy via an increased host range and decreased rate of bacterial resistance [58, 60, 61]. To
create a cocktail with 100% coverage of the ESC resistant E. coli isolates in this study, further
isolation of phages from faecal matter using isolate 37 as the host isolate for phage enrichment
needs to be conducted in order to isolate a phage with lytic activity against isolate SA37.
Combination of this phage with the broad host range phages (Phage 26, 27 and 30) isolated will
create a cocktail that can theoretically lyse all of the ESC resistant E. coli isolates, limiting
development of bacterial resistance against the phages [61]. Interaction between the phages may
decrease the practical host range of such a cocktail with studies needing to be conducted to
determine this [63].
Identification of the recognition binding protein of phages used in phage therapy is highly
desirable in optimization of phage therapy as therapies can be targeted to bacteria with the
corresponding binding site, or phages with strong lytic activity can be genetically modified to
change or extend their host range [90]. This study identified a single nucleotide polymorphism
(SNP) in the tail fiber of phage 26, changing the positively charged lysine to a neutral
asparagine [90]. The SNP identified in this project didn’t result in an altered host range.
However studies have successfully identified a recognition binding protein by recognition of a
SNP in mutagenesis studies. Le et al. (2013) identified ORF84 (putative tail fiber gene) as the

70
recognition binding protein of phage JG004. This was achieved through genetic analysis of
phage JG004 and its mutants with lytic activity of a different range of hosts. Further extensive
molecular analysis focusing on the tail fibers and baseplates may results in the identification of
the recognition binding protein of phages that target ESC resistant E. coli. A potential
therapeutic option following this is to have a library of lytic phages which can be mutated on
demand using CRISPR-Cas9 to bind to newly isolated resistant bacteria.
Recent development of a novel method for identification of phage recognition binding proteins
has shown promise recognizing the proteins by their attachment to a host cell and could also be
conducted to identify the recognition binding protein of ESC resistant E. coli targeting phages.
The method utilizes expression vectors containing phage DNA, transferring them into E. coli
and probing with fluorescent bacterial hosts. The proteins that attached the host cell are then
sequenced. This method allows for the identification of novel recognition binding proteins.
Limitations are still present with only bacteria capable of being cultured available to use as the
host [91], however it is foreseen that this method could be applied to ESC resistant E. coli
which are easily cultured.

71
5. Conclusion
This project has resulted in the isolation of 21 phages that specifically target ESC
resistant E. coli isolates, and is a significant first step in the process of developing an
alternative antimicrobial therapeutic. Phages isolated from sources with and without the
presence of ESC resistant E. coli isolates show similar specificity towards the ESC
resistant E. coli strains, demonstrating that phages can be isolated from sources not
infected by the target bacterial isolate, can be easily isolated from sources that are easy
to sample, and providing promise for use against other antibiotic class resistant E. coli.
These phages have been morphologically and genetically characterized by EM and
NGS, a mandatory requirement for classification of phages by the ICTV and for use in
phage therapy. In addition, this study has demonstrated the potential for the DNA
polymerase gene to be used for phylogenetic analysis to differentiate phages within
family groups, particularly within the Siphoviridae.
Future directions for this study include:
1. Retesting of host specificity of phages with controlled phage titre and bacterial
concentration (MOI testing).
2. Molecular and mutagenesis studies directed towards identifying the phage
recognition binding protein and the protein binding site on the ESC resistant E.
coli isolates.
3. Phage cocktail preparation and in vitro and in vivo testing to demonstrate
combinatorial efficacy of phages.
4. In vivo animal testing to determine the efficacy of the treatment in controlling
ESC resistant E. coli.

72
In conclusion, the study has isolated and characterized highly specific bacteriophages
that target ESC resistant E. coli from sources with and without the presence of these
target bacterial isolates, identifying a novel method for the control of ESC resistant E.
coli isolates within pigs.

73
6. References
1. Silver L L, Challenges of antibacterial discovery. Clinical Microbiology Reviews, 2011.
24(1): p. 71-109.
2. Cha S B, Yoo A N, Lee W J et al., Effect of bacteriophage in enterotoxigenic Escherichia
coli (ETEC) infected pigs. Journal of Veterinary Medical Science, 2012. 74(8): p. 1037-9.
3. Abraham S, Trott D J, Jordan D et al., Phylogenetic and molecular insights into the
evolution of multidrug-resistant porcine enterotoxigenic Escherichia coli in Australia.
International Journal of Antimicrobial Agents, 2014. 44(2): p. 105-11.
4. Aprea G, Rita D'Angelo A, Annunziata Prencipe V et al., Bacteriophage morphological
characterisation by using transmission electron microscopy. Journal of Life Sciences,
2015. 9: p. 214-20.
5. Denou E, Bruttin A, Barretto C et al., T4 phages against Escherichia coli diarrhea:
Potential and problems. Virology, 2009. 388(1): p. 21-30.
6. Wyrsch E, Chowdhury P R, Abraham S et al., Comparative genomic analysis of a
multiple antimicrobial resistant enterotoxigenic Escherichia coli o157 lineage from
Australian pigs. BMC Genomics, 2015. 16(1): p. 1-11.
7. Salem M, Virtanen S, Korkeala H et al., Isolation and characterization of Yersinia-
specific bacteriophages from pig stools in Finland. Journal of Applied Microbiology,
2015. 118(3): p. 599-608.
8. Bush K, The coming of age of antibiotics: Discovery and therapeutic value. Annals of
the New York Academy of Sciences, 2010. 1213(1): p. 1-4.
9. Ling L L, Schneider T, Peoples A J et al., A new antibiotic kills pathogens without
detectable resistance. Nature, 2015. 517(7535): p. 455-9.
10. Piddock L J V, Teixobactin, the first of a new class of antibiotics discovered by ichip
technology? Journal of Antimicrobial Chemotherapy, 2015. 70(10): p. 2679-80.
11. Lv M, Wang S, Yan G et al., Genome sequencing and analysis of an Escherichia coli
phage vb_ecom-ep3 with a novel lysin, lysep3. Virus Genes, 2015. 50(3): p. 487-97.

74
12. Centre for Disease Dynamics E P State of the world's antibiotics, 2015, CDDEP, Editor.
2015: Washington, D. C.
13. Mazurek J, Bok E, Pusz P et al. Phenotypic and genotypic characteristics of antibiotic
resistance of commensal Escherichia coli isolates from healthy pigs, in Bulletin of the
Veterinary Institute in Pulawy. 2014. p. 211.
14. O'Flynn G, Ross R P, Fitzgerald G F et al., Evaluation of a cocktail of three
bacteriophages for biocontrol of Escherichia coli o157:H7. Applied and Environmental
Microbiology, 2004. 70(6): p. 3417-24.
15. Abraham S, Jordan D, Wong H S et al., First detection of extended-spectrum
cephalosporin- and fluoroquinolone-resistant Escherichia coli in Australian food-
producing animals. Journal of Global Antimicrobial Resistance, 2015. 3(4): p. 273-7.
16. Daniel A T, Shaohua Z, Emily T et al., Antimicrobial drug resistance in Escherichia coli
from humans and food animals, United States, 1950–2002. Emerging Infectious
Disease journal, 2012. 18(5): p. 741.
17. Lopes A, Tavares P, Petit M-A et al., Automated classification of tailed bacteriophages
according to their neck organization. BMC Genomics, 2014. 15(1): p. 1027.
18. Seiffert S N, Hilty M, Perreten V et al., Extended-spectrum cephalosporin-resistant
gram-negative organisms in livestock: An emerging problem for human health? Drug
Resistance Updates, 2013. 16(1): p. 22-45.
19. Carattoli A, Villa L, Poirel L et al., Evolution of inca/c bla(cmy-2)-carrying plasmids by
acquisition of the bla(ndm-1) carbapenemase gene. Antimicrobial Agents and
Chemotherapy, 2012. 56(2): p. 783-6.
20. Lalak A, Wasyl D, Zając M et al., Mechanisms of cephalosporin resistance in indicator
Escherichia coli isolated from food animals. Veterinary Microbiology, 2016.
21. Smith M G, Jordan D, Chapman T A et al., Antimicrobial resistance and virulence gene
profiles in multi-drug resistant enterotoxigenic Escherichia coli isolated from pigs with
post-weaning diarrhoea. Veterinary Microbiology, 2010. 145(3–4): p. 299-307.

75
22. Agersø Y, Aarestrup F M, Pedersen K et al., Prevalence of extended-spectrum
cephalosporinase (esc)-producing Escherichia coli in Danish slaughter pigs and retail
meat identified by selective enrichment and association with cephalosporin usage.
Journal of Antimicrobial Chemotherapy, 2012. 67(3): p. 582-8.
23. Boerlin P, Travis R, Gyles C L et al., Antimicrobial resistance and virulence genes of
Escherichia coli isolates from swine in ontario. Applied and Environmental
Microbiology, 2005. 71(11): p. 6753-61.
24. Jordan D, Chin J-C, Fahy V A et al., Antimicrobial use in the Australian pig industry:
Results of a national survey. Australian Veterinary Journal, 2009. 87(6): p. 222-9.
25. Kheiri R, Akhtari L, Antimicrobial resistance and integron gene cassette arrays in
commensal Escherichia coli from human and animal sources in IRI. Gut Pathogens,
2016. 8(1): p. 40.
26. Gelband H, Miller-Petrie M, Pant S et al. The state of the world's antibiotics, 2015.
2015, Center for Disease Dynamics, Economics & Policy: Washington, D. C.
27. Cheng G, Hao H, Xie S et al., Antibiotic alternatives: The substitution of antibiotics in
animal husbandry? Frontiers in Microbiology, 2014. 5: p. 217.
28. Huang C, Song P, Fan P et al., Dietary sodium butyrate decreases postweaning diarrhea
by modulating intestinal permeability and changing the bacterial communities in
weaned piglets 1-3: 1. The Journal of Nutrition, 2015. 145(12): p. 2774.
29. Bommarius B, Jenssen H, Elliott M et al., Cost-effective expression and purification of
antimicrobial and host defense peptides in Escherichia coli. Peptides, 2010. 31(11): p.
1957-65.
30. Wu S, Zhang F, Huang Z et al., Effects of the antimicrobial peptide cecropin ad on
performance and intestinal health in weaned piglets challenged with Escherichia coli.
Peptides, 2012. 35(2): p. 225-30.
31. She F, Nimmagadda A, Teng P et al., Helical 1:1 α/sulfono-γ-aa heterogeneous
peptides with antibacterial activity. Biomacromolecules, 2016. 17(5): p. 1854-9.

76
32. Bruttin A, Brüssow H, Human volunteers receiving Escherichia coli phage t4 orally: A
safety test of phage therapy. Antimicrobial Agents and Chemotherapy, 2005. 49(7): p.
2874-8.
33. Denis M S, Johnson R, Louie T et al., O61 the impact of Escherichia coli o157:H7-
specific bacteriophages on human gastro-intestinal microflora. International Journal of
Antimicrobial Agents, 2009. 34, Supplement 2: p. S22.
34. Wittebole X, De Roock S, Opal S M, A historical overview of bacteriophage therapy as
an alternative to antibiotics for the treatment of bacterial pathogens. Virulence, 2014.
5(1): p. 226-35.
35. Sulakvelidze A, Alavidze ZMorris J G, Bacteriophage therapy. Antimicrobial Agents and
Chemotherapy, 2001. 45(3): p. 649-59.
36. Chibani-Chennoufi S, Sidoti J, Bruttin A et al., In vitro and in vivo bacteriolytic activities
of Escherichia coli phages: Implications for phage therapy. Antimicrobial Agents and
Chemotherapy, 2004. 48(7): p. 2558-69.
37. Matsuzaki S, Rashel M, Uchiyama J et al., Bacteriophage therapy: A revitalized therapy
against bacterial infectious diseases. Journal of Infection and Chemotherapy, 2005.
11(5): p. 211-9.
38. Kumari S, Harjai K, Chhibber S, Isolation and characterization of Klebsiella pneumoniae
specific bacteriophages from sewage samples. Folia Microbiologica, 2010. 55(3): p.
221-7.
39. Ackermann H-W, Chapter 1 - bacteriophage electron microscopy, in Advances in virus
research, Ł. Małgorzata and T.S. Wacław, Editors. 2012, Academic Press. p. 1-32.
40. Gadagkar R, Gopinathan K P, Bacteriophage burst size during multiple infections.
Journal of Biosciences, 1980. 2(3): p. 253-9.
41. Ly-Chatain M H, The factors affecting effectiveness of treatment in phages therapy.
Frontiers in Microbiology, 2014. 5: p. 51.
77
42. Smith H L, Models of virulent phage growth with application to phage therapy. SIAM
Journal on Applied Mathematics, 2008. 68(6): p. 1717-37.
43. Williamson S J, Paul J H, Environmental factors that influence the transition from
lysogenic to lytic existence in the ϕhsic/Listonella pelagia marine phage–host system.
Microbial Ecology, 2006. 52(2): p. 217-25.
44. Moon B Y, Park J Y, Hwang S Y et al., Phage-mediated horizontal transfer of a
Staphylococcus aureus virulence-associated genomic island. Scientific Reports, 2015. 5:
p. 9784.
45. Lavigne R, Seto D, Mahadevan P et al., Unifying classical and molecular taxonomic
classification: Analysis of the Podoviridae using blastp-based tools. Research in
Microbiology, 2008. 159(5): p. 406-14.
46. Rohwer F, Edwards R, The phage proteomic tree: A genome-based taxonomy for
phage. Journal of Bacteriology, 2002. 184(16): p. 4529-35.
47. Grose J H, Casjens S R, Understanding the enormous diversity of bacteriophages: The
tailed phages that infect the bacterial family Enterobacteriaceae. Virology, 2014. 0: p.
421-43.
48. Ackermann H-W, Tailed bacteriophages: The order Caudovirales, in Advances in virus
research, F.A.M. Karl Maramorosch and J.S. Aaron, Editors. 1998, Academic Press. p.
135-201.
49. Rihtman B, Meaden S, Clokie M R J et al., Assessing Illumina technology for the high-
throughput sequencing of bacteriophage genomes. PeerJ, 2016. 4: p. e2055.
50. Klumpp J, Fouts D E, Sozhamannan S, Next generation sequencing technologies and
the changing landscape of phage genomics. Bacteriophage, 2012. 2(3): p. 190-9.
51. Carlton R M, Noordman W H, Biswas B et al., Bacteriophage p100 for control of Listeria
monocytogenes in foods: Genome sequence, bioinformatic analyses, oral toxicity
study, and application. Regulatory Toxicology and Pharmacology, 2005. 43(3): p. 301-
12.

78
52. Hagens S, Loessner M, Bacteriophage for biocontrol of foodborne pathogens:
Calculations and considerations. Current Pharmaceutical Biotechnology, 2010. 11(1): p.
58-68.
53. German G J, Misra R, The tolc protein of Escherichia coli serves as a cell-surface
receptor for the newly characterized tls bacteriophage1. Journal of Molecular Biology,
2001. 308(4): p. 579-85.
54. Morita M, Tanji Y, Mizoguchi K et al., Characterization of a virulent bacteriophage
specific for Escherichia coli o157:H7 and analysis of its cellular receptor and two tail
fiber genes. FEMS Microbiology Letters, 2002. 211(1): p. 77-83.
55. Parent K N, Erb M L, Cardone G et al., Ompa and ompc are critical host factors for
bacteriophage sf6 entry in shigella. Molecular microbiology, 2014. 92(1): p. 47-60.
56. Jamalludeen N, Johnson R P, Friendship R et al., Isolation and characterization of nine
bacteriophages that lyse o149 enterotoxigenic Escherichia coli. Veterinary
Microbiology, 2007. 124(1–2): p. 47-57.
57. Smith H WHuggins M B, Effectiveness of phages in treating experimental Escherichia
coli diarrhoea in calves, piglets and lambs. Microbiology, 1983. 129(8): p. 2659-75.
58. Jamalludeen N, Johnson R P, Shewen P E et al., Evaluation of bacteriophages for
prevention and treatment of diarrhea due to experimental enterotoxigenic Escherichia
coli o149 infection of pigs. Veterinary Microbiology, 2009. 136(1–2): p. 135-41.
59. Smith H W, Huggins M B, Shaw K M, The control of experimental Escherichia coli
diarrhoea in calves by means of bacteriophages. Journal of General Microbiology,
1987. 133(5): p. 1111-26.
60. Nale J Y, Spencer J, Hargreaves K R et al., Bacteriophage combinations significantly
reduce Clostridium difficile growth in vitro and proliferation in vivo. Antimicrobial
Agents and Chemotherapy, 2016. 60(2): p. 968-81.
61. Labrie S J, Samson J E, Moineau S, Bacteriophage resistance mechanisms. Nature
Reviews Microbiology, 2010. 8(5): p. 317-27.

79
62. Khan Mirzaei M, Nilsson A S, Isolation of phages for phage therapy: A comparison of
spot tests and efficiency of plating analyses for determination of host range and
efficacy. PLoS ONE, 2015. 10(3): p. e0118557.
63. Bourdin G, Navarro A, Sarker S A et al., Coverage of diarrhoea-associated Escherichia
coli isolates from different origins with two types of phage cocktails. Microbial
Biotechnology, 2014. 7(2): p. 165-76.
64. Destoumieux-Garzón D, Duquesne S, Peduzzi J et al., The iron–siderophore transporter
fhua is the receptor for the antimicrobial peptide microcin j25: Role of the microcin
val(11)–pro(16) β-hairpin region in the recognition mechanism. Biochemical Journal,
2005. 389(Pt 3): p. 869-76.
65. Masuda N, Sakagawa E, Ohya S et al., Substrate specificities of mexab-oprm, mexcd-
oprj, and mexxy-oprm efflux pumps in Pseudomonas aeruginosa. Antimicrobial Agents
and Chemotherapy, 2000. 44(12): p. 3322-7.
66. Chan B K, Sistrom M, Wertz J E et al., Phage selection restores antibiotic sensitivity in
mdr Pseudomonas aeruginosa. Scientific Reports, 2016. 6: p. 26717.
67. Rivas L, Coffey B, McAuliffe O et al., In vivo and ex vivo evaluations of bacteriophages
e11/2 and e4/1c for use in the control of Escherichia coli o157:H7. Applied and
Environmental Microbiology, 2010. 76(21): p. 7210-6.
68. Kerby G P, Gowdy R A, Purification ph stability and sedimentation properties of the t7
bacteriophage of Escherichia coli. Journal of immunology (Baltimore, Md. : 1950),
1949. 63(1): p. 93-107.
69. Colom J, Cano-Sarabia M, Otero J et al., Liposome-encapsulated bacteriophages for
enhanced oral phage therapy against Salmonella spp. Applied and Environmental
Microbiology, 2015. 81(14): p. 4841-9.
70. Comeau A M, Tétart F, Trojet S N et al., Phage-antibiotic synergy (pas): Β-lactam and
quinolone antibiotics stimulate virulent phage growth. PLoS ONE, 2007. 2(8): p. e799.

80
71. Torres‐Barceló C, Franzon B, Vasse M et al., Long‐term effects of single and combined
introductions of antibiotics and bacteriophages on populations of Pseudomonas
aeruginosa. Evolutionary Applications, 2016. 9(4): p. 583-95.
72. O’Dea M A, Tu S-L, Pang S et al., Genomic characterization of a novel poxvirus from a
flying fox: Evidence for a new genus? Journal of General Virology, 2016. 97(9): p. 2363-
75.
73. Kearse M, Moir R, Wilson A et al., Geneious basic: An integrated and extendable
desktop software platform for the organization and analysis of sequence data.
Bioinformatics, 2012. 28(12): p. 1647-9.
74. Darling A E, Mau B, Perna N T, Progressivemauve: Multiple genome alignment with
gene gain, loss and rearrangement. PLoS ONE, 2010. 5(6): p. e11147.
75. Kumar S, Stecher G, Tamura K, Mega7: Molecular evolutionary genetics analysis
version 7.0 for bigger datasets. Molecular Biology and Evolution, 2016.
76. Whelan S, Goldman N, A general empirical model of protein evolution derived from
multiple protein families using a maximum-likelihood approach. Molecular Biology and
Evolution, 2001. 18(5): p. 691-9.
77. Jones D T, Taylor W R, Thornton J M, The rapid generation of mutation data matrices
from protein sequences. Computer applications in the biosciences : CABIOS, 1992.
8(3): p. 275-82.
78. Schneider C A, Rasband W S, Eliceiri K W, Nih image to imagej: 25 years of image
analysis. Nat Methods, 2012. 9(7): p. 671-5.
79. Källberg M, Wang H, Wang S et al., Template-based protein structure modeling using
the raptorx web server. Nat. Protocols, 2012. 7(8): p. 1511-22.
80. Kelley L A, Mezulis S, Yates C M et al., The phyre2 web portal for protein modeling,
prediction and analysis. Nat. Protocols, 2015. 10(6): p. 845-58.

81
81. Wass M N, Kelley L A, Sternberg M J E, 3dligandsite: Predicting ligand-binding sites
using similar structures. Nucleic Acids Research, 2010. 38(Web Server issue): p. W469-
W73.
82. Easwaran M, Paudel S, De Zoysa M et al., Functional characterization of a novel lytic
phage ecsw isolated from Sus scrofa domesticus and its potential for phage therapy.
Molecular and Cellular Probes, 2015. 29(3): p. 151-7.
83. Greer G G, Dilts B D, Ackermann H W, Characterization of a Leuconostoc gelidum
bacteriophage from pork. International Journal of Food Microbiology, 2007. 114(3): p.
370-5.
84. Albino L A, Rostagno M H, Hungaro H M et al., Isolation, characterization, and
application of bacteriophages for Salmonella spp. Biocontrol in pigs. Foodborne Pathog
Dis, 2014. 11(8): p. 602-9.
85. Merrill B D, Ward A T, Grose J H et al., Software-based analysis of bacteriophage
genomes, physical ends, and packaging strategies. BMC Genomics, 2016. 17(1): p. 1-
16.
86. Kutter E, Phage host range and efficiency of plating, in Bacteriophages: Methods and
protocols, volume 1: Isolation, characterization, and interactions, M.R.J. Clokie and
A.M. Kropinski, Editors. 2009, Humana Press: Totowa, NJ. p. 141-9.
87. Bigwood T, Hudson J ABillington C, Influence of host and bacteriophage concentrations
on the inactivation of food-borne pathogenic bacteria by two phages. FEMS
Microbiology Letters, 2009. 291(1): p. 59-64.
88. Szermer-Olearnik B, Boratyński J, Removal of endotoxins from bacteriophage
preparations by extraction with organic solvents. PLoS ONE, 2015. 10(3): p. e0122672.
89. Bonilla N, Rojas M I, Netto Flores Cruz G et al., Phage on tap–a quick and efficient
protocol for the preparation of bacteriophage laboratory stocks. PeerJ, 2016. 4: p.
e2261.

82
90. Le S, He X, Tan Y et al., Mapping the tail fiber as the receptor binding protein
responsible for differential host specificity of Pseudomonas aeruginosa bacteriophages
pap1 and jg004. PLoS ONE, 2013. 8(7): p. e68562.
91. Simpson D J, Sacher J C, Szymanski C M, Development of an assay for the identification
of receptor binding proteins from bacteriophages. Viruses, 2016. 8(1): p. 17.

83
Appendix I
Reagents
5% sheep’s blood agar plate Micromedia, Australia
Agar bacteriological Thermo Fisher Scientific, Australia
BBL ™ Muller Hinton II broth (cation adjusted) BD Worldwide, USA
Brain heart infusion broth Thermo Fisher Scientific, Australia
Ceftriaxone Sigma Aldrich, Australia
Chloroform Sigma-Aldrich, Australia
Ethanol Sigma-Aldrich, Australia
Distilled water
Gelatin Ajax Finechem, Australia
Glycerol Ajax Finechem, Australia
LB broth Thermo Fisher Scientific, Australia
Magnesium sulphate UNIVAR, Australia
Molecular grade water
Potassium chloride Ajax Finechem, Australia
Potassium phosphate Ajax Finechem, Australia
Sodium chloride VWR Chemicals, Belgium
Sodium hydroxide Ajax Finechem, Australia
Sodium phosphate Ajax Finechem, Australia
Tris hydrochloride Amresco, Australia
Equipment and materials
Generic laboratory equipment is listed without manufacturers.
0.45 µm filter Pall Life Sciences, Australia
0.5 mL microcentrifuge tubes Sarstedt, Germany
1.5 mL microcentrifuge tube Sarstedt, Germany
2 mL screw cap micro tube Sarstedt, Germany
5 mL sterile tubes Sarstedt, Germany
10 µL loop Copen Labs, United Kingdom
15 mL FALCON tubes Sarstedt, Germany
50mm Rapid-Flow 500 mL filter unit Thermo Fisher Scientific, Australia

84
50mL falcon tubes Sarstedt, Germany
96-well polystyrene flat bottom plate w/ lid Thermo Fisher, United States
96-well polystyrene round bottom plate w/ lid Thermo Fisher, United States
DNeasy blood and tissue kit Qiagen, Australia
Electronic pipette, multichannel pipette and tips Thermo Fisher, United States
LabChip GXII Perkin Elmer, Australia
MagMAX viral RNA isolation kit Thermo Fisher Scientific, Australia
Magnetic stand Ambion, Australia
McFarland 0.5 standard Thermo Fisher, United States
Nextera XT DNA library preparation kit Illumina, Singapore
Petri dish Thermo Fisher Scientific, Australia
Qubit dsDNA HS Assay Kit Thermo Fisher Scientific, Australia
Qubit 2.0 Fluorometer Thermo Fisher Scientific, Australia
Syringe Terumo, Australia
Tecnai G2 D1237 FEI, United States
Thermal cycler BIO-RAD, Australia
Vivaspin protein concentrator spin column GE Healthcare Life Sciences,
Australia
85
Appendix II
1. Preparation of Luria-Bertani broth
Luria-Bertani (Thermo Fisher Scientific, Australia) broth was prepared by weighing 10 grams
of LB broth powder and adding it to 400 mL of distilled water. After mixing the solution was
autoclaved at 121 °C for 15 mins. The broth was allowed to cool and stored at 4 °C.
2. Preparation of 2 x Luria-Bertani broth
The 2 x Luria-Bertani broth was prepared by weighing 7.5 grams of LB broth powder and
adding it into a bottle with 300 mL of distilled water. The broth was autoclaved at 121 °C for 15
mins, then stored at 4 °C until use.
3. Preparation of Luria-Bertani agar
Luria-Bertani agar was prepared by weighing 10 grams of LB broth powder and 6 grams of
bacteriological agar powder and adding it to 400 mL of distilled water. The agar was autoclaved
at 121 °C for 15 mins. Molten agar was poured into sterile petri dishes and the plates stored at 4
°C until use.
4. Preparation of soft Luria-Bertani agar
Soft Luria-Bertani agar was prepared by weighing 5 grams of LB broth powder and 6 grams of
bacteriological agar powder (Thermo Fisher Scientific, Australia). These were added together
into a bottle along with 200 mL of distilled water. The solution was autoclaved at 121 °C for 15
mins then stored at 4 °C. Prior to use, agar was heated in a water bath at 47 °C until it formed a
liquid suspension.
5. Preparation of SM buffer
SM buffer was prepared by mixing 2.91 grams NaCl (VWR Chemicals, Belgium), 0.61 grams
MgSO4 (UNIVAR, Australia) and 0.05 grams of gelatin (Ajax Finechem, Australia). In a
separate bottle 3.94 grams of tris-HCl (Amresco, Australia) was added into 25 mL of distilled
water and mixed to dissolve. All 25 mL was added to the bottle with the other powders, made

86
up to 500 mL with distilled water, and the pH adjusted to 7.5 before the solution was sterile
filtered through a 50mm Rapid-Flow 500 mL 0.2µm filter unit using a vacuum system.
6. Preparation of Mueller Hinton broth
Mueller Hinton broth (Thermo Fisher Scientific, Australia) was prepared by addition of 6.6
grams of MH broth powder to 300 mL of distilled water. To ensure all powder was completely
dissolved, the bottle was heated with frequent agitation and boiled for 1 min. The broth was then
autoclaved at 116-121 °C for 10 mins, before being stored at 4 °C.
7. Preparation of PBS buffer
PBS buffer was prepared by combining 8 g of NaCl (VWR Chemicals, Belgium), 0.2 g of KCl
(Ajax Finechem, Australia), 1.44 g Na2HPO4 (Ajax Finechem, Australia) and 0.24 g of KH2PO4
(Ajax Finechem, Australia) to 1000 mL distilled water and the pH adjusted to 7.4, before
autoclaving at 121°C for 15 mins and storage at 4 °C.
8. Preparation of Brain Heart Infusion broth with 20% glycerol
Brain heart infusion (BHI) (Thermo Fisher Scientific, Australia) broth was prepared by adding
3.70 grams of BHI broth, and 20 mL of glycerol to 80 mL of distilled water. This was
autoclaved at 121 °C for 15 mins then stored at 4 °C.

87
Appendix III
Figure 15. Annotated genome of phage 1 (Myoviridae) with lytic activity against ESC resistant E. coli.
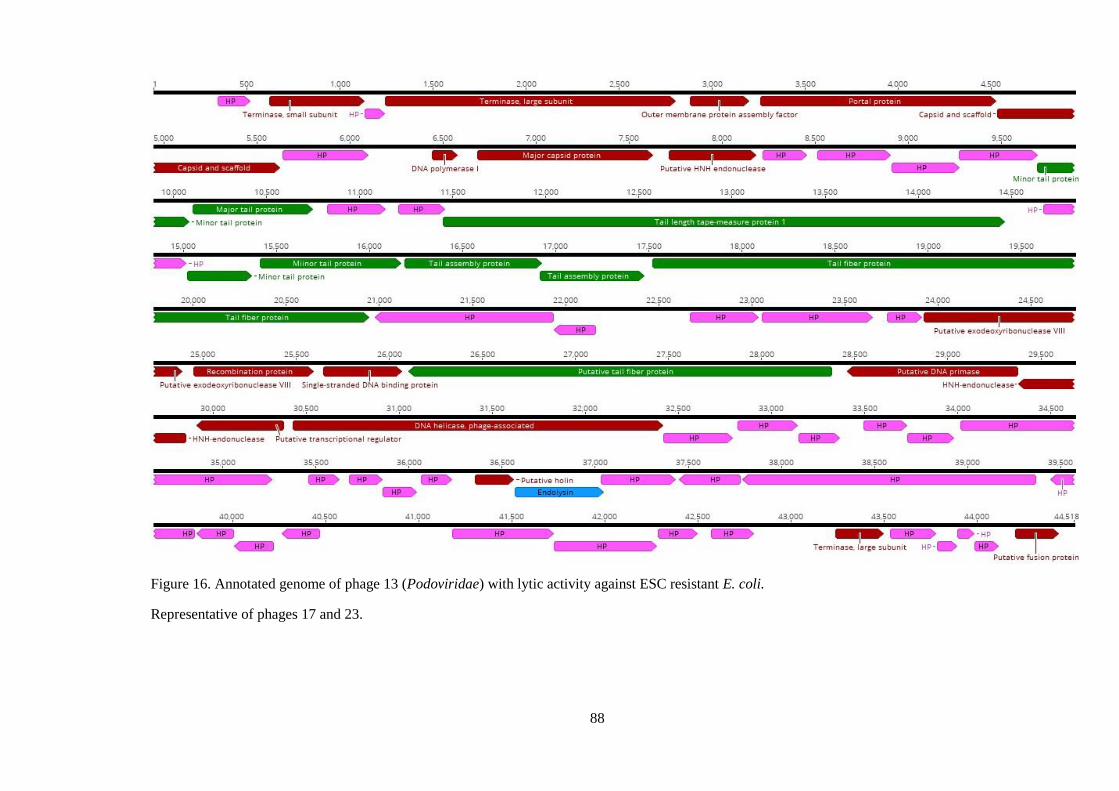
88
Figure 16. Annotated genome of phage 13 (Podoviridae) with lytic activity against ESC resistant E. coli.
Representative of phages 17 and 23.
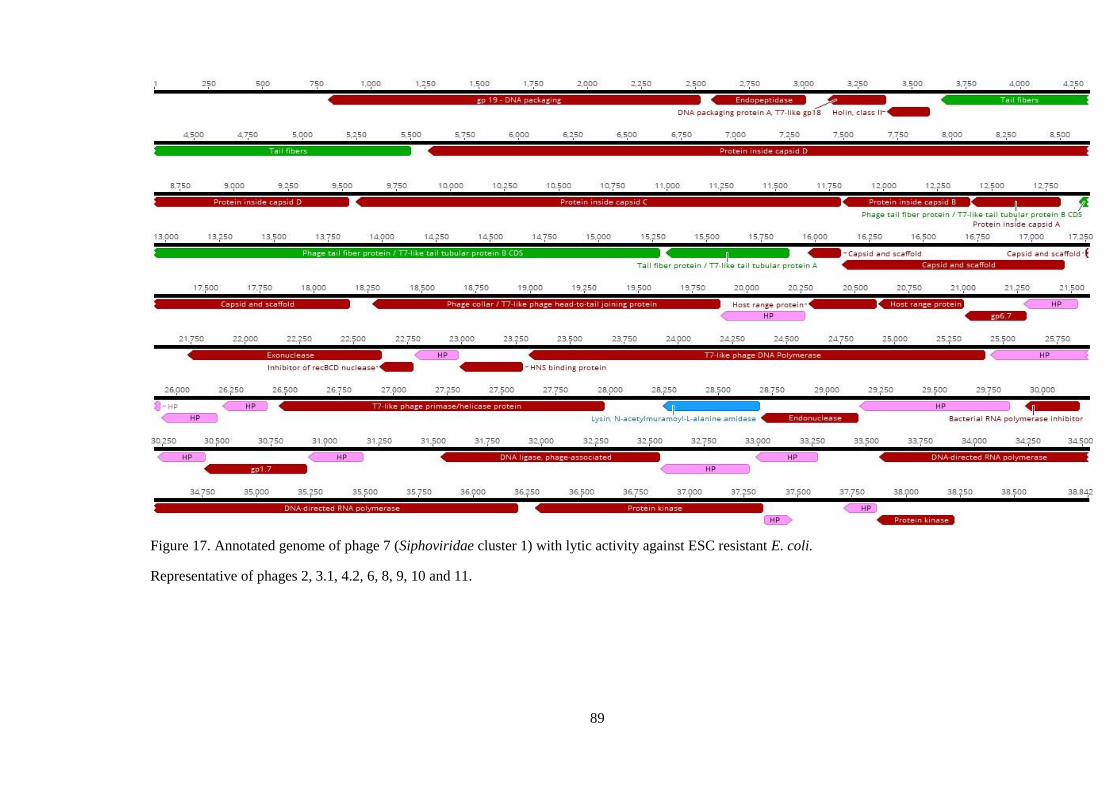
89
Figure 17. Annotated genome of phage 7 (Siphoviridae cluster 1) with lytic activity against ESC resistant E. coli.
Representative of phages 2, 3.1, 4.2, 6, 8, 9, 10 and 11.

90
Figure 18. Annotated genome of phage 26 (Siphoviridae cluster 2) with lytic activity against ESC resistant E. coli.
Representative of phages 3.2, 4.1, 26, 27, 28, 29, 30, 31 and 32.
Related Documents


