Isolation and characterization of CD146 þ multipotent mesenchymal stromal cells Antonio Sorrentino a , Manuela Ferracin b , Germana Castelli a , Mauro Biffoni a , Giada Tomaselli a , Marta Baiocchi a , Alessandro Fatica c , Massimo Negrini b , Cesare Peschle a , and Mauro Valtieri a a Department of Hematology, Oncology, and Molecular Medicine, Istituto Superiore di Sanita `, Rome, Italy; b Department of Experimental and Diagnostic Medicine and Interdepartmental Center for Cancer Research, University of Ferrara, Ferrara, Italy; c Institute Pasteur Cenci-Bolognetti, Department of Genetics and Molecular Biology, University of Rome ‘‘La Sapienza,’’ Rome, Italy (Received 29 October 2007; revised 10 March 2008; accepted 10 March 2008) Mesenchymal stromal cells (MSCs) represent a bone marrow (BM) population, classically defined by five functional properties: extensive proliferation, ability to differentiate into os- teoblasts, chondrocytes, adipocytes, and stromal cellsLsupporting hematopoiesis. However, research progress in this area has been hampered by lack of suitable markers and standard- ized procedures for MSC isolation. We have isolated a CD146 + multipotent MSC population from 20 human BM donors displaying the phenotype of self-renewing osteoprogenitors; an extensive 12-week proliferation; and the ability to differentiate in osteoblasts, chondrocytes, adipocytes, and stromal cells supporting hematopoiesis. Furthermore, the CD146 + MSCs se- crete a complex combination of growth factors (GFs) controlling hematopoietic stem cells (HSCs) function, while providing a O2-log increase in the long-term culture (LTC) colony output in 8-week LTC over conventional assays. The hematopoietic stromal function ex- hibited by the MSCs was further characterized by manipulating LTCs with the chemical inhibitors Imatinib or SU-5416, targeting two GF receptors (GFRs), KIT or VEGFR2/1, re- spectively. Both treatments similarly impaired LTC colony output, indicating key roles for these two GF/GFR interactions to support LTC-initiating cell activity. CD146 + MSCs may thus represent a tool to explore the MSC-HSC cross-talk in an in vitro surrogate model for HSC ‘‘niches,’’ and for regenerative therapy studies. In addition, the MSC microRNA (miRNA) expression profile was analyzed by microarrays in both basic conditions and chon- drogenic differentiation. Our analysis revealed that several miRNAs are modulated during chondrogenesis, and many of their putative targets are genes involved in chondrogenic dif- ferentiation. Ó 2008 ISEH - Society for Hematology and Stem Cells. Published by Elsev- ier Inc. Mesenchymal stromal cells (MSCs) represent a bone mar- row cell (BM) population, classically defined by the ability to undergo sustained proliferation and the potential to give rise to multiple mesenchymal cell lineages, including oste- ocytes, chondrocytes, adipocytes, and reticular stromal cells supporting hematopoiesis [1–11]. In the mouse, MSCs have been isolated from virtually all postnatal murine organs and tissues, possibly due to their presence in a perivascular MSC niche [12]. In humans, MSC have been isolated from bone marrow [1–3,13], cord blood [13], adult periph- eral blood, mobilized [14], or not [15], and adipose tissue [13]. A variety of heterogeneous MSC populations have been reported to possess additional functional properties, such as quasi-immortality [16], ability to homotypically differentiate into other mesodermic tissues as endothelium [17], astrocytes [18], myoblasts [19], or cardiomyocytes [20], and the capacity to heterotypically differentiate into neurons [21] and hepatocytes [18,22]. These reports uti- lized either human unseparated adherent mononuclear cells (MNCs) or different separation procedures, due to lack of consensus on the MSC phenotype. Recent studies indicated as putative MSC markers stage-specific embryonic antigens (SSEA-1 or -4) [18,23], neural ganglioside GD2 [24], or, most recently, CD146 [10,25]. This complex and somewhat contradictory scenario led us to develop a strategy to isolate homogeneous multipotent MSCs from human adult BM. Offprint requests to: Mauro Valtieri, M.D., Department of Hematology, Oncology and Molecular Medicine, Istituto Superiore di Sanita `, Viale Re- gina Elena 299, 00161 Rome, Italy; E-mail: [email protected] 0301-472X/08 $–see front matter. Copyright Ó 2008 ISEH - Society for Hematology and Stem Cells. Published by Elsevier Inc. doi: 10.1016/j.exphem.2008.03.004 Experimental Hematology 2008;36:1035–1046

Welcome message from author
This document is posted to help you gain knowledge. Please leave a comment to let me know what you think about it! Share it to your friends and learn new things together.
Transcript
Isolation and characterization ofCD146þ multipotent mesenchymal stromal cells
Antonio Sorrentinoa, Manuela Ferracinb, Germana Castellia, Mauro Biffonia, Giada Tomasellia,Marta Baiocchia, Alessandro Faticac, Massimo Negrinib, Cesare Peschlea, and Mauro Valtieria
aDepartment of Hematology, Oncology, and Molecular Medicine, Istituto Superiore di Sanita, Rome, Italy; bDepartment of
Experimental and Diagnostic Medicine and Interdepartmental Center for Cancer Research, University of Ferrara, Ferrara, Italy;cInstitute Pasteur Cenci-Bolognetti, Department of Genetics and Molecular Biology, University of Rome ‘‘La Sapienza,’’ Rome, Italy
(Received 29 October 2007; revised 10 March 2008; accepted 10 March 2008)
Mesenchymal stromal cells (MSCs) represent a bone marrow (BM) population, classicallydefined by five functional properties: extensive proliferation, ability to differentiate into os-teoblasts, chondrocytes, adipocytes, and stromal cellsLsupporting hematopoiesis. However,research progress in this area has been hampered by lack of suitable markers and standard-ized procedures for MSC isolation. We have isolated a CD146+ multipotent MSC populationfrom 20 human BM donors displaying the phenotype of self-renewing osteoprogenitors; anextensive 12-week proliferation; and the ability to differentiate in osteoblasts, chondrocytes,adipocytes, and stromal cells supporting hematopoiesis. Furthermore, the CD146+ MSCs se-crete a complex combination of growth factors (GFs) controlling hematopoietic stem cells(HSCs) function, while providing a O2-log increase in the long-term culture (LTC) colonyoutput in 8-week LTC over conventional assays. The hematopoietic stromal function ex-hibited by the MSCs was further characterized by manipulating LTCs with the chemicalinhibitors Imatinib or SU-5416, targeting two GF receptors (GFRs), KIT or VEGFR2/1, re-spectively. Both treatments similarly impaired LTC colony output, indicating key roles forthese two GF/GFR interactions to support LTC-initiating cell activity. CD146+ MSCs maythus represent a tool to explore the MSC-HSC cross-talk in an in vitro surrogate modelfor HSC ‘‘niches,’’ and for regenerative therapy studies. In addition, the MSC microRNA(miRNA) expression profile was analyzed by microarrays in both basic conditions and chon-drogenic differentiation. Our analysis revealed that several miRNAs are modulated duringchondrogenesis, and many of their putative targets are genes involved in chondrogenic dif-ferentiation. � 2008 ISEH - Society for Hematology and Stem Cells. Published by Elsev-ier Inc.
Experimental Hematology 2008;36:1035–1046
Mesenchymal stromal cells (MSCs) represent a bone mar-row cell (BM) population, classically defined by the abilityto undergo sustained proliferation and the potential to giverise to multiple mesenchymal cell lineages, including oste-ocytes, chondrocytes, adipocytes, and reticular stromal cellssupporting hematopoiesis [1–11]. In the mouse, MSCs havebeen isolated from virtually all postnatal murine organs andtissues, possibly due to their presence in a perivascularMSC niche [12]. In humans, MSC have been isolatedfrom bone marrow [1–3,13], cord blood [13], adult periph-eral blood, mobilized [14], or not [15], and adipose tissue
Offprint requests to: Mauro Valtieri, M.D., Department of Hematology,
Oncology and Molecular Medicine, Istituto Superiore di Sanita, Viale Re-
gina Elena 299, 00161 Rome, Italy; E-mail: [email protected]
0301-472X/08 $–see front matter. Copyright � 2008 ISEH - Society for Hem
doi: 10.1016/j.exphem.2008.03.004
[13]. A variety of heterogeneous MSC populations havebeen reported to possess additional functional properties,such as quasi-immortality [16], ability to homotypicallydifferentiate into other mesodermic tissues as endothelium[17], astrocytes [18], myoblasts [19], or cardiomyocytes[20], and the capacity to heterotypically differentiate intoneurons [21] and hepatocytes [18,22]. These reports uti-lized either human unseparated adherent mononuclear cells(MNCs) or different separation procedures, due to lack ofconsensus on the MSC phenotype. Recent studies indicatedas putative MSC markers stage-specific embryonic antigens(SSEA-1 or -4) [18,23], neural ganglioside GD2 [24], or,most recently, CD146 [10,25]. This complex and somewhatcontradictory scenario led us to develop a strategy to isolatehomogeneous multipotent MSCs from human adult BM.
atology and Stem Cells. Published by Elsevier Inc.
1036 A. Sorrentino et al. / Experimental Hematology 2008;36:1035–1046
We have enriched for a lin� MNC-BM fraction, whichwas then CD34þ cell�depleted and expanded in selectiveclonal/low-density adherent cultures, resulting in aCD146þ MSCs population coexpressing 12 additional anti-gens, CD49a, CD90, CD105, CD140b, GD2, a-smoothmuscle actin (a-SMA), alkaline phosphatase (ALP), butnot the endothelial/hematopoietic CD31, CD34, CD45markers. The CD146þMSCs extensively proliferate, differ-entiate in osteoblasts, chondrocytes, adipocytes, and effi-ciently support hematopoiesis in 8-week long-term culture(LTC), through a complex adhesion molecules expressionand cytokine secretion pattern, including vascular endothe-lial growth factor (VEGF)-A/C, placental-derived growthfactor, angiopoietin (Ang)-1/2, FLT-3 ligand (FL), stemcell factor (SCF) in both soluble and membrane-bound(mb) isoforms, bone morphogenetic protein (BMP) 2, stro-mal cell�derived factor 1 (SDF-1), interleukin (IL)-3, andgranulocyte macrophage (GM-CSF)/macrophage colony-stimulating factor (M-CSF).
Finally, we have analyzed expression of microRNAs(miRNAs) in the CD146þ MSCs and their chondrogenicprogeny. miRNAs are small (w22 nt) single-stranded non-coding RNAs that serve as posttranscriptional regulators ofgene expression, mainly by base-pairing to the 30-UTR oftarget mRNAs, thereby causing translational repressionand/or mRNA degradation [26]. To date, several hundredmiRNAs have been discovered in a variety of organisms,playing a key role in basic cell functions (e.g., proliferation,differentiation, apoptosis) in both normal and pathologicalconditions [27]. We describe the MSC miRNA expressionprofile, analyzed by microarrays in either basal conditionsor chondrogenic differentiation, showing a marked modula-tion of 36 miRNAs during chondrogenesis.
Materials and methods
Enrichment of MSCsBM from healthy donors was purchased from CAMBREXPoietics cell systems (Gaithersburg, MD, USA). BM sampleswere treated for 20 minutes at 20�C with RosetteSep humanMSC enrichment cocktail (StemCell Technologies, Vancouver,BC, Canada) composed by CD3, CD14, CD19, CD38, CD66b,Glycophorin A tetrameric antibody (Ab) complexes crosslinkingunwanted cells with red blood cells, diluted and centrifugedover Ficoll-Hypaque gradient for 25 minutes at 300g. Enrichedcells were collected, washed, and treated with NH4Cl (StemCell)for 10 minutes in ice to remove residual red blood cells. CD34þ
cells were removed by MACS column (Miltenyi, Bergisch Glad-bach, Germany). Enriched or unseparated cells were then culturedat clonal/low density (1�10 cells/cm2) for 3 weeks in a-medium(Invitrogen, Carlsbad, CA, USA), 20% fetal calf serum (FCS;StemCell) in T75 flasks at 37�C in 5%CO2 atmosphere. Half me-dium was replaced two times a week until MSCs reached conflu-ence, defined as passage (P) 0. MSCs were detached by trypsin-ethylenediamine tetraacetic acid solution (Invitrogen) treatmentand replated. Each weekly replating or P was defined by a progres-sive number.
MSC phenotypingAll Abs were purchased from BD Biosciences (San Diego, CA,USA). Senescence was evaluated by b-galactosidase staining kit(Cell Signalling, Beverly, MA, USA, http://www.cellsignal.com).MSC phenotype was analyzed by flow cytometry using a FACS-can instrument (BD). Cell-sorting experiments were performedusing a FACSaria instrument (BD).
LTCsThe 3.6 � 104 CD146þ MSCs/cm2 or 6.0 � 105 adherent cellsderived from unseparated BM MNCs/cm2 were seeded in 24-well/plates (Falcon) in a-medium, 20% MCS selected FCS; plateswere then irradiated (2000 cGy) with a cesium source, and themedium changed to a-medium consisting of 10% FCS, 10%Horse S (both from StemCell Technologies, Vancouver, BC, Can-ada), and 10�6M hydrocortisone (Sigma, St Louis, MO, USA)[28,29]. Plates were then seeded with 3 � 103CD34þCB cellsand cultured up to 8 weeks at 33�C in 5%CO2 atmosphere.Half volume of each culture (.2 mL) was harvested weekly andreplaced with fresh medium. Cells were then counted and seededin multilineage semisolid medium for clonogenetic assay and re-placed with fresh medium. In some experiments, the VEGFR2/1chemical inhibitor SU5416 [30] (Sigma) was used at 1, 3, or 10mM. SU5416 was added weekly with medium replacement. Equi-molar amounts of Imatinib-mesylate (GLIVEC or ST1571) [31](Novartis, Basel, Switzerland), a Kit inhibitor, were simulta-neously added in control cultures. All experiments were per-formed in triplicate.
Clonogenetic culturesClonogenetic cultures [28,29] were prepared in Iscove’s modifiedDulbecco’s medium (Invitrogen), 10% FCS, 10% Horse S (bothfrom StemCell), 100 ng/mL SCF, FL, thrombopoietin, IL-3,GM-CSF, G-CSF, M-CSF, 3 U/mL erythropoietin (all fromR&D Systems, Minneapolis, MN, USA); MTC 1.8% (StemCell).Suspension cells (100�400/dish) were seeded in triplicate 35-mmdishes and cultured for 2 weeks at 37�C in 5% CO2, O2
atmosphere.
MSC differentiationOsteogenic. The 3.1 � 103 MSC/cm2 were seeded in six-well/plates (BD) in MSCGM (Cambrex, Poietics Cell Systems) for24 hours at 37�C in 5% CO2 atmosphere. MSCGM was replacedwith Osteogenesis Induction Medium (Cambrex), and MSCs cul-tured for 3 weeks with refeeding every 3 to 4 days.
Chondrogenic. The 2.5 � 105 MSC were washed twice at 150gfor 5 minutes at 20�C with incomplete chondrogenic medium(Cambrex), resuspended in 0.5 mL complete medium (Cambrex)in 15 mL polypropylene tube and cultured for 3 weeks at 37�Cin 5%CO2 atmosphere, refeeding every 2 to 3 days with freshmedium.
Adipogenic. Confluent MSCs were supplemented with Adipogen-esis induction medium for 3 days followed by 1 to 3 days of cul-ture in Adipogenic maintenance medium (both from Cambrex).After three cycles of induction/maintenance, cells were cultured
1037A. Sorrentino et al./ Experimental Hematology 2008;36:1035–1046
for an additional week with Adipogenic maintenance medium re-placing the medium every 2 to 3 days.
Cytokine measurementCytokine levels were analyzed by enzyme-linked immunosorbentassay kits according to the manufacturer’s instructions (Quanti-kine, R&D).
Confocal immunofluorescence microscopyMSCs were fixed in 0.4% paraformaldehyde�phosphate-bufferedsaline (Sigma-Invitrogen) for 20 minutes at 20�C, permeabilizedin 0.2% Triton X-100, 1% bovine serum albumin (both fromSigma) in phosphate-buffered saline (Invitrogen), wash buffer(WB) for 15 minutes at 20�C, three times washed for 5 minuteswith WB. Samples were incubated overnight at 4�C with a-SMA Ab (Sigma). The following day, samples were washed threetimes with WB, incubated with fluorescein isothiocyante�conju-gated goat a-mouse IgG2a for 1 hour at 25�C, and then washedagain. Nuclei were counterstained with TOTO3 (MolecularProbes, Invitrogen) and coverslides mounted. Images were col-lected with a laser scanning microscope (Olympus, Tokyo, Japan).
Western blotMembrane proteins were extracted by incubating cells for 30 min-utes at 4�C in a membrane isolation buffer (Tris [pH 7.4] 20 mM,ethylenediamine tetraacetic acid 2 mM, Na3VO4 0.2 M). Nucleiwere discarded by centrifugation at 1000g for 5 minutes, andthe membrane fraction was subsequently obtained by ultracentri-fugation of the remaining solution at 30,000g for 30 minutes at4�C. Membrane pellets were lysed using the CelLytic M Lysis Re-agent (Sigma), with Protease Inhibitor Cocktail (Sigma) followingmanufacturer’s protocol.
Abs used for immunodetection were anti-SCF (R&D), anti�b-actin (Chemicon, Temecula, CA, USA) and secondary anti-mouseIgG peroxidase conjugate (Pierce, Rockford, IL, USA).
Reverse transcriptase polymerase chain reactionTotal RNA was isolated by Trizol (Invitrogen) following manufac-turer’s instructions. First-strand cDNA was synthesized with Su-perScript II (Invitrogen) using 1 mg total RNA for each sampleand oligo(dT) (Invitrogen). Polymerase chain reaction was per-formed using the following primers:
mbSCF For 50-CAGTGACCATCTACAGCTTTCCGG-30
mbSCF Rev 50-GCTGCTACCACAGTGATGATGACAA-30
S26 For 50-GGTCCGTGCCTCCAAGATGA-30
S26 Rev 50-AAATCGGGGTGGGGGTGTT-30
miRNA microarrayTotal RNA was extracted from two basal and two chondrogenicdifferentiated MSC cultures by Trizol (Invitrogen) according tomanufacturer’s instructions. One-color RNA labeling and hybrid-ization on miRNA microarray chips were performed as describedpreviously [32,33]. Briefly, 5 mg RNA from each sample were hy-bridized on a miRNA microarray consisting of 226 probes for hu-man miRNAs. Hybridization signals were detected by biotinbinding of a Streptavidin-Alexa 647 conjugate using a GenePix4000B scanner (Axon Instruments, Sunnyvale, CA, USA). Imageswere quantified by the GenePix Pro 6.0 (Axon).
Analysis of microarray dataRaw data from one-color miRNA microarrays were normalizedand analyzed by GeneSpring GX software version 7.3 (AgilentTechnologies, Santa Clara, CA, USA). The GeneSpring softwaregenerated a unique value for each miRNA, performing the averageof replicate probes present on the chip. Samples were normalizedusing the on-chip median normalization. Chondrocytes were nor-malized on basal MSCs and the miRNAs differentially expressedbetween the two populations were identified by using a filter basedon a fold change of 1.3 combined with a Student’s t-test (p !0.05). Unsupervised hierarchical cluster analysis was performedafter normalization procedures using average linkage and Pearsoncorrelation as measure of similarity.
miRNA target predictionAnalysis of miRNA predicted targets was determined using the al-gorithms TargetScan (http://genes.mit.edu/targetscan) [34], PicTar(http://pictar.bio.nyu.edu) [35], and miRanda (http://cbio.mskc-c.org/cgi-bin/mirnaviewer/mirnaviewer.pl) [36].
miRNA northern blotRNA (4 mg) samples were run as described [32,33]. The oligonu-cleotides used as probes are:
miR-23a 50 - AAATCCCATCCCCAGGAACCCC - 30
miR-26b 50 - ACCTATCCTGAATTACTTGAA -30
Let-7a 50 - AACTATACAACCTACTACCTCA - 30
miR-214 50 - GCACAGCAAGTGTAGACAGGCA - 30
U2 50 - GGGTGCACCGTTCCTGGAGGTAC - 30
Results
Phenotyping of MSCWe have isolated a lin�mononuclear BM cell fraction, whichwas then CD34þ cell�depleted and expanded in clonal/low-density MSC culture (1�10 cells/cm2): in this in vitrocondition, the proliferating CD146þ colony-forming unitfibroblast (CFU-F) clones (Suppl. Fig. 1C, right microphoto-graph) became prevalent after 2 weeks of culture over com-mitted contaminating cells and finally merged after 3 weeks,defined as P0 (Fig. 1). CD146þ cells in crude BM-MNCfractions, including CD34þ endothelial cells, were underthe detectability level (w0.1%) (Suppl. Fig. 1A) [10], butthey were enriched w10 to 15 times after our negative selec-tions (Suppl. Fig. 1B). The preliminary selections of the un-cultured cells were also critical for the homogeneity of thefinal CD146þ MSCs population because in parallel crudeBM-MNC expansions $30% contaminating CD31, CD34,and CD45 cells were detected (not shown). Lin� CD34�
BM MNCs cultured in 20% FCS preselected for MSCsgrowth at clonal/low-density, progressively expanded theCD146þMSCs to homogeneity in 3 weeks (P0) (Fig. 1),while former studies with crude BM MNCs reporteda w15% level of expression of CD146 in similar culture con-ditions [25]. Cell-sorting experiments, performed before theCD146þ cells became homogeneous (P�1) (Suppl. Fig. 1C)confirmed that the fraction generating CFU-F (Suppl.

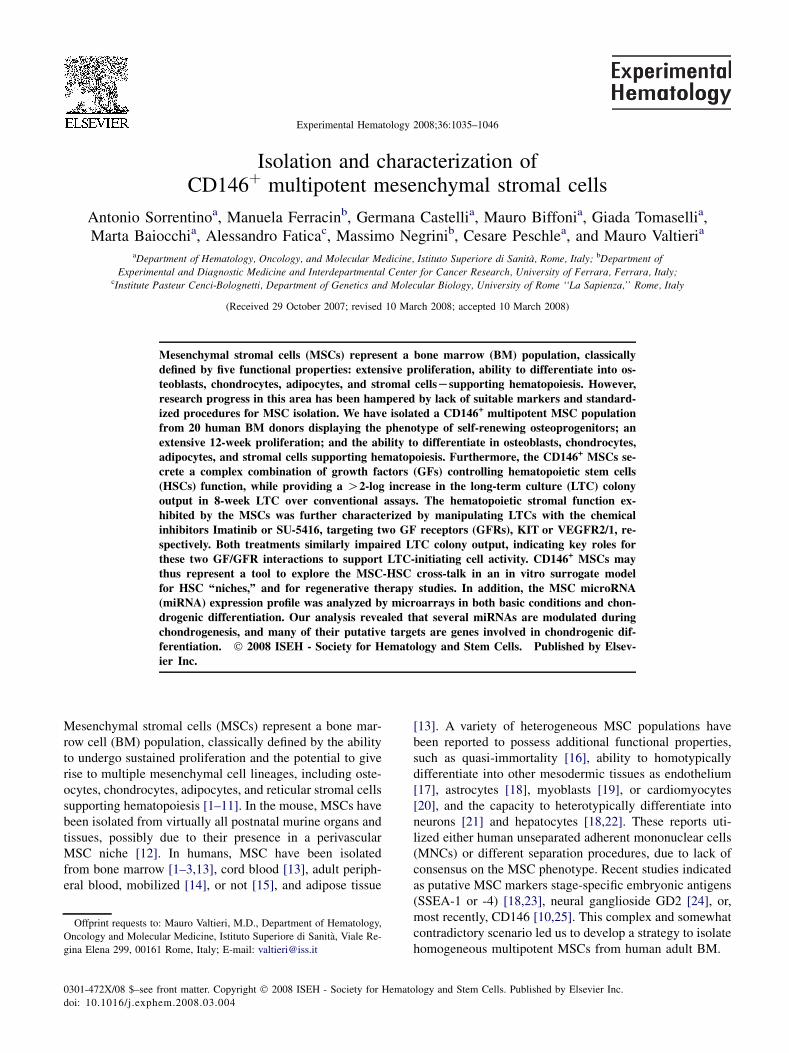
Figure 1. MSC antigen expression. Flow cytometry analysis of hematopoietic, endothelial, and stromal membrane antigens on homogeneous MSC popu-
lations. Several adhesion molecules and growth factor receptors are expressed. FITC 5 fluorescein isothiocyanate; PE 5 phycoerythrin.
1038 A. Sorrentino et al. / Experimental Hematology 2008;36:1035–1046
Fig. 1C, right microphotograph) and proliferating up to 13additional weeks was CD146þ, while CD146� cells couldbe barely maintained for 2 weeks (Suppl. Fig. 1C, left micro-photograph). The isolation method used led to a consistentyield of homogeneous CD146þ MSCs for all 20 BM isola-tions that were phenotyped using a panel of 39 monoclonalAbs against hematopoietic, endothelial, or stromal antigens(Fig. 1). Among the hematopoietic markers, includingseveral adhesion proteins, some were expressed by allMSCs at high (CD13/Aminopeptidase N, CD29/b1-integrin,CD44/H-CAM, CD49a/a1-integrin, CD49c/a39-integrin)or low-intensity (CD49d/a49-integrin, CD10/CALLA,CD61/b3-integrin), while others were negative (CD45,CD14, CD31/PECAM1, CD34, CD117/KitR). MSC alsoshowed several antigens usually expressed by endothelialcells at either high (CD105/TGFbR, CD146/S-endo/mela-noma cell adhesion molecule [10,25], CD147/neurothelin,CD166/ALCAM) or lower intensity (CD54/ICAM1,CD106/vascular cellular-adhesion molecule 1 [VCAM1]).Among endothelial growth factor (GF) receptors, Kinase do-main receptor/VEGFR2 and Tie-2/Angpt1-2R were weaklyexpressed whereas CD141/thrombomodulin, CD184/
CXCR4 and Flt-1/VEGFR1 were below detection level.The stromal marker CD90 and the recently described MSCmarker, GD2 [24] were highly expressed, as observed forCD140b/platelet-derived growth factor receptor (PDGFR)b [37,38] and to a lesser extent CD140a/PDGFRa [37,38].a-SMA was significantly expressed and mostly organizedin fibers (Fig. 2K) [39] indicating the potential for myoblasticdifferentiation. Conversely, ALP, CD271/nerve growth factorreceptor, and SSEA4 [23] were expressed at lower levels,while SSEA1, a marker for pre-MSCs [18], was almost unde-tectable (Fig.1). CD71/TrfR expression is apparently linkedto the presence of an actively proliferating fraction. HLA-ABC/major histocompatibility complex class I expressionwas high (99.3%) while HLA-DR/major histocompatibilitycomplex class II, and leukemia inhibitory factor receptorwere low (Fig.1). Altogether, our CD146/CD105/CD140b/CD49a/ALP/a-SMAþ, CD31/CD34/CD45� MSC pheno-type is consistent with the recently described proliferatingCFU-F, termed adventitial reticular cell or hematopoiesis-supporting stromal cell [10]; furthermore, the MSCphenotype analysis has been extended to other markers upto a total of 39 antigens.

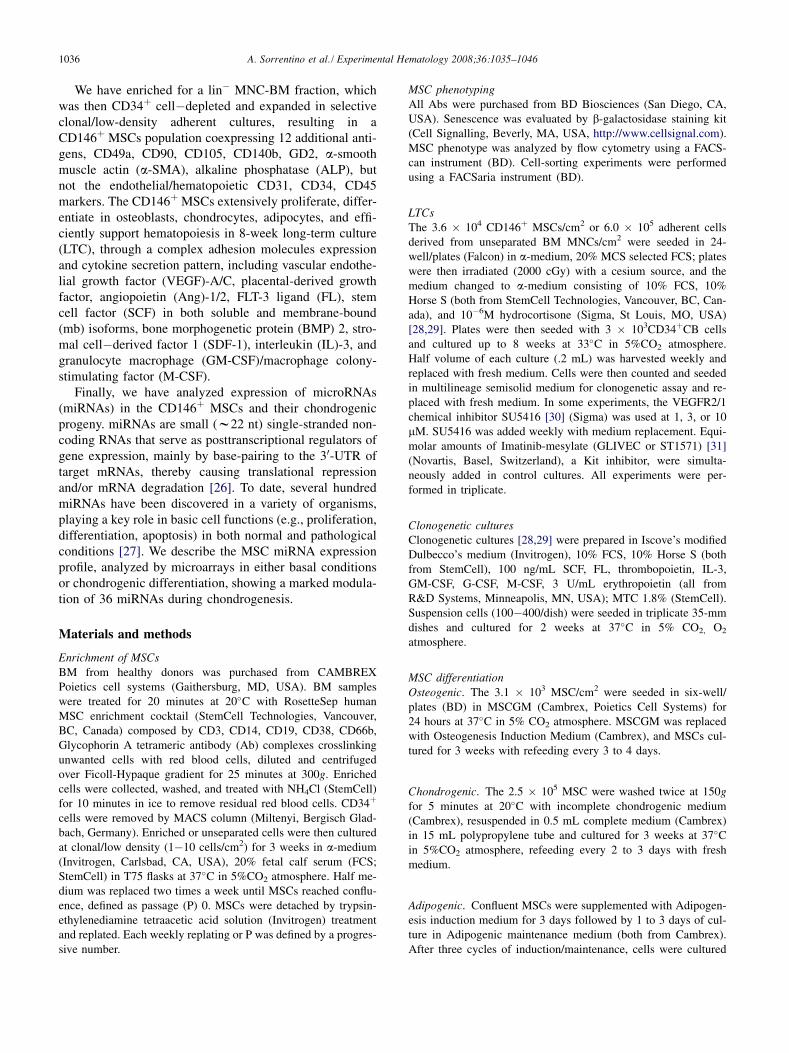
Figure 2. (A) ALP staining in undifferentiated MSCs and (B) osteogenic-induced MSCs after 1-week culture (30�). (C) Von Kossa staining for calcium
deposition in undifferentiated MSCs and (D) in differentiated MSCs after 3-week osteogenic culture (May-Grunwald/Giemsa counterstain, 60�). (E) Saf-
ranin O staining in undifferentiated MSCs (60�) and in differentiated MSCs after 3 week chondrogenic culture (F) (30�). (G) Undifferentiated MSC and (H)
adipogenic 4-week differentiation of MSCs (phase contrast, 30�). (I) Oil Red staining of undifferentiated MSCs and (J) in differentiated MSCs after 4 week
adipogenic culture (60�). (K) MSCs express fibrillar smooth muscle actin. Cells were stained by immunofluorescence with anti-smooth muscle actin (SMA).
Confocal laser scanning images are shown (60�).
1039A. Sorrentino et al./ Experimental Hematology 2008;36:1035–1046
MSC proliferationMSCs could be expanded up to 12 weeks (P12), showinga progressively decreasing proliferation rate. Doublingtime was 84 hours from weeks 0 to 4, 168 hours from weeks4 to 8, 336 hours from weeks 8 to 12, correlating with thedecrease of proliferating CD71þ MSCs. By week 12, virtu-ally all the MSCs stained positive for b-Gal (Suppl. Fig. 1),indicating an arrested state or senescence [40]. The antigenexpression pattern was relatively stable up to P12 for 20 ofthe monitored markers. CD141 modestly increased from P1to P9 while the remaining 18 monitored markers decreasedover time (Suppl. Fig. 2). Interestingly, the multilineageCD146/MCAMþ population sharply decreased at P10 inparallel with a drop of the proliferation rate.
MSC multilineage differentiationWhen cultured in proper differentiation medium, CD146þ
MSCs differentiated not only in osteoblasts or HSC-supporting cells [10], but also toward chondrocytes andadipocytes [25].
Osteoblasts. MSCs are largely positive for ALP after 7days (Fig. 2 A,B) and present typical calcium deposition,as revealed by Von Kossa staining, after 21 days of osteo-genic differentiation (Fig. 2 C,D).
Chondrocytes. MSCs induced in chondrogenic differentia-tion for 3 weeks are shown after Safranin O staining (Fig. 2E,F).
Adipocytes. MSCs induced in adipogenic differentiationfor 4 weeks are shown in phase contrast (Fig. 2 G,H) andafter oil red O staining (Fig. 2 I,J).
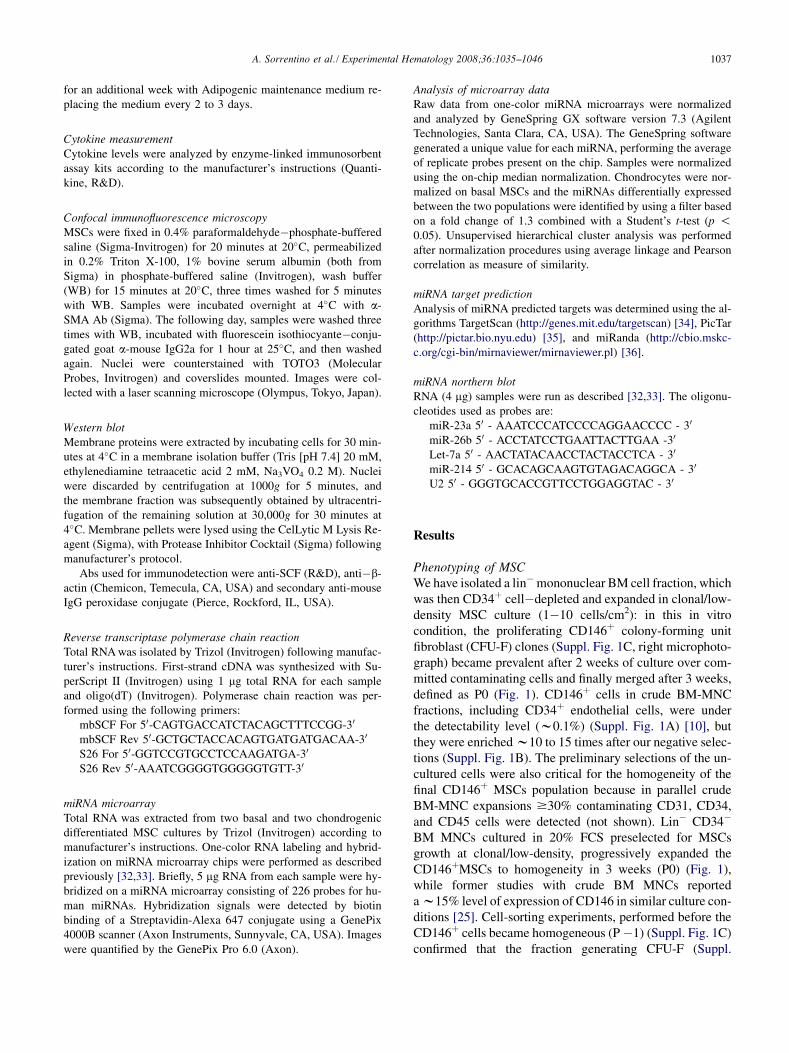
Cytokine production by MSCCD146þ MSC cytokine secretion was analyzed for 16 GFs(Table 1). Among the hematopoietic growth factors, FL, IL-3, GM-CSF, and M-CSF, were abundantly produced, whilelittle soluble SCF was secreted. However, mbSCF waseasily detected by reverse transcriptase polymerase chainreaction performed using isoform-specific primers and by

1040 A. Sorrentino et al. / Experimental Hematology 2008;36:1035–1046
Western blot in membrane extracts (Fig. 3 A,B). Among en-dothelial GFs, VEGF-A/C and Ang-1 were abundantly se-creted, Ang-2 and PLGF were detected in lower amounts,and VEGF-D was undetectable. As for stromal GFs,SDF-1 (CXCL12) secretion level was elevated (1147.7 6
310.2 pg/mL/105 cells/24 hours) [9,10], BMP-2 was also
Table 1. Cytokine production by mesenchymal stromal cell
Mean 6 SEM
(pg/mL/105 cells/24 hours)
No. of
experiments
Flt-3 ligand 67.3 6 18.1 11
SCF 2.3 6 1.8 12
IL-3 37.5 6 6.9 8
GM-CSF 14.6 6 4.5 9
M-CSF 125.9 6 44.5 17
VEGF-A 625.8 6 59.1 19
PlGF 24.1 6 4.4 18
VEGF-C 1231.7 6 196.0 7
VEGF-D Neg 3
Angpt-1 510.0 6 84.8 23
Angpt-2 87.0 6 16.8 23
SDF-1 1147.7 6 310.2 10
BMP-2 53.6 6 14.4 9
BMP-4 Neg 9
LIF Neg 9
IGF-1 Neg 8
Dosages of cytokines were performed using enzyme-linked immunosor-
bent assay kits according to manufacturer’s instructions.
Angpt 5 angiopoietin; BMP 5 bone morphogenetic protein; GM-CSF 5
granulocyte macrophage colony-stimulating factor; IGF-1 5 insulin-like
growth factor 1; IL 5 interleukin; LIF 5 leukemia inhibitory factor;
PlGF 5 placental-derived growth factor; M-CSF 5 macrophage colony-
stimulating factor; SCF 5 stem cell factor; SDF-1 5 stromal cell�derived
factor; VEGF 5 vascular endothelial growth factor.
Figure 3. (A) Reverse transcriptase polymerase chain reaction for mem-
brane-bound isoform of SCF (mbSCF) mRNA. HL-60 cell line was used
as a negative control. S26 was used as endogenous control. (B) Western
blot analysis of mbSCF protein in mesenchymal stromal cells. Human re-
combinant SCF (150 ng/lane) was used as positive control and HL-60 total
protein extract was used as negative control. rhSCF 5recombinant human
stem cell factor.
significantly produced, while BMP-4, LIF, and insulin-like growth factor-1 (IGF-1) were undetectable. OurCD146þ MSC cytokine secretion pattern provides addi-tional informations over that reported for HSC-supportingmural cells [10].Functional LTC assayBecause CD146þ MSC phenotype is consistent with that ofadventitial reticular cells composing HSC niches [9,10], wedecided to evaluate their supportive function for hematopoi-esis in vitro. CD34þ cells were seeded at 3 � 103 on irra-diated CD146þMSCs or adherent cells from unseparatedBM MNCs, showing a highly effective O2-log increasein the LTC colony output (Fig. 4A [28,29]).
The stromal function was further characterized by ma-nipulating LTCs either with the KIT or VEGFR2/1 chemi-cal inhibitors Imatinib [31] or SU-5416 [30], respectively.Both treatments similarly impaired the LTC colony output,indicating key roles for these two GF/GFR interactions foroptimal MSCs supportive activity. SU5416 treatment ofLTCs, at each concentration used, totally abrogated LTCcolony output by week 6 (Fig. 4B), while Imatinib treat-ment caused a milder, although substantial, inhibition(Fig. 4B).
miRNA expression profile in chondrocyte differentiationThe miRNA expression profile was identified for two basaland two chondrogenic CD146þ MSC samples by microar-rays [32]. Statistical analysis revealed a specific modulationof 36 miRNAs during the chondrogenic differentiation pro-cess (p ! 0.05). Twelve miRNAs were upregulated duringdifferentiation, while 24 were downregulated, as indicatedby the ratio of their expression value (Fig. 5A, Table 2).Northern blot analysis for the selected miRNAs, miR-23a,miR-26b, miR-214, and the Let-7a family confirmed theobserved modulation (Fig. 5B). Putative targets of differen-tially expressed miRNAs were identified including genesinvolved in chondrogenic differentiation and tissue homeo-stasis. As shown in Table 2, the putative genes regulatedby this set of miRNAs includes GF receptors (GFR) andcytokines (angiopoietin-1 [ANGPT1], insulin-like growthfactor II receptor [IGF2R], transforming growth factorbeta receptor [TGFBR], interleukin-6 [IL-6], fibroblastgrowth factor receptor [FGFR], placental growth factor[PGF], platelet-derived growth factor A [PDGFRA]), signaltransduction mediators (mothers against decapentaplegichomolog 4 [SMAD4], mitogen-activated protein Kinase 1[MAPK1], wingless-type MMTV integration site familymember 1 [WNTP]), and molecules involved in the extra-cellular matrix remodeling (matrix metalloproteinases andcollagens), all key regulators of human chondrogenesis.
We also performed enzyme-linked immunosorbent assayof angiopoietin-1, VEGF, and macrophage colony stimulat-ing factor in CD146þ MSC chondrogenic differentiation:these GFs emerged as putative targets for miR-204, miR-185/miR-199a-2-5p, and miR-214, respectively (Suppl.

1041A. Sorrentino et al./ Experimental Hematology 2008;36:1035–1046
Fig. 3). Release of these GFs, was inversely correlated tothe levels of the corresponding targeting miRNAs. Hypo-thetically, this pattern is compatible with an miRNA-medi-ated posttranscriptional regulation.
DiscussionHuman BM hosts a double stem cell system, MSCs [1–3]and HSCs in postnatal age [28]. These two distinct stemcell populations arrange closely in specific architecturalunities, the hematopoietic niches, ensuring hematopoietic
Figure 4. (A) Standard long-term culture (LTC). Progenitor cell output of
3 � 103 cord blood (CB) CD34þ cells seeded on irradiated adherent bone
marrow (BM) mononuclear cells (MNCs) or mesenchymal stromal cells
(MSCs). Suspension cells were cloned weekly in multilineage semisolid
media to evaluate hematopoietic progenitor cell (HPC) number. Values
represent mean 6 standard deviation of three experiments. (B) Effect of
SU5416 on 3 � 103 CB CD34þ cells seeded on irradiated MSCs. SU-
5416 (VEGFR2/1 inhibitor) totally abrogated LTC progenitor output by
week 6 at all concentrations (1, 3, and 10 mM), while control culture
produced an elevated progenitor number (compare also with Fig. 4A).
ST-1571 or GLIVEC (KIT inhibitor) treatment caused a similar but milder
inhibition. Values represent mean 6 standard error of mean from three
experiments.
and skeletal homeostasis. In the highly organized structureof the HSC niche, several signals are likely to take place[4–9]. Three types of HSC niches have been hypothesized,defined according to the HSC counterpart: the osteoblastic[4,5], the reticular stromal niche [6,9,10], and the vascular/sinusoidal endothelium niche [7,8]. The niches might playdifferent roles in the regulation of HSC quiescence, prolif-eration, differentiation, and mobilization [4–10].
Our studies may provide a relatively simple, reproduc-ible methodology for obtaining phenotypically homoge-neous MSCs, expressing pivotal markers. Specifically, thelin� BM MNC cell fraction was CD34þ cell�depletedand expanded in clonal/low-density adherent MSC cultures.Removal of CD34þ hematopoietic progenitors (HPCs) andendothelial cells, together with CD14þ depletion, are criti-cal to prevent MSC contamination with other cell types,particularly with monocytic progenitors endowed withsome (2�4 weeks) clonogenic potential [41]. The resultingCD146þ MSCs show coexpression at elevated intensity ofstromal markers including CD90, GD2 [24], a-SMA [39]highly expressed and organized in fibers, CD140b and, toa lesser extent, CD140a [37,38]. Notably, CD146þ MSCpopulation represents only a minority of adherent BMMNCs [10,25]. MSCs also expressed the embryonic stemcell marker, SSEA-4 [23], whereas SSEA-1 was barely de-tectable [18]. The latter finding is possibly due to the factthat SSEA-1þ MSCs represent a highly primitive stemcell population, generating also astrocytes and hepatocytes[18]. Finally, CD146þ MSCs express hematopoieticmarkers, including several adhesion molecules [17,42],and endothelial antigens [25] at diverse intensity levels(see Results).
The antigen expression pattern was stable throughout theMSC lifespan for many of the analyzed markers (from P1 toP12), while most adhesion molecules decreased. Particu-larly, the multilineage CD146/MCAMþ population wassharply reduced at P10 in parallel with a drop of the prolif-eration rate (see Results), the differentiation potential andthe hematopoietic support function (data not shown). Theexpression of CD146, CD105, a-SMA, ALP in CD34/CD31/CD45-negative cells has been correlated with HSCniche-related pericytes surrounding endothelial sinusoids[10,43]. It has been also suggested that perivascular sitesin microvessels represent the postnatal MSC niche [44],whose nature is to date far more elusive than the proposedHSC niches [4–9,41,45]. Interactions between very-late an-tigens (VLA-4 [CD29-CD49c]) and its ligand VCAM-1,(CD106)] may serve for both MSC/MSC anchoring andHPC/HSC homing [42]. The antigen expression analysisdescribed here confirms and extends to 39 antigens the re-cently reported immunophenotype of self-renewing osteo-progenitors [10].
CD146þ MSCs produce several GFs that may have anautocrine or a juxtacrine role at the HSC niche level. FL,IL-3, GM-CSF, and M-CSF were secreted, while SCF

Figure 5. (A) Cluster analysis of chondrogenic MSCs differentiation based on 36 differentially expressed genes. A hierarchical cluster of four samples, based
on 36 selected genes differentially expressed between chondrocyte differentiated and undifferentiated MCSs, generated a good separation of samples. A
color-bar for gene expression values is shown on the right of the cluster: for each gene (rows), red indicates an expression value higher in chondrocytes
than in MSCs; green shows a lower expression value. (B) Northern blot analysis of selected micro RNAs. U2 was used to normalize the total RNA loaded
on each lane.
1042 A. Sorrentino et al. / Experimental Hematology 2008;36:1035–1046
[10] was mostly produced in the membrane-bound form,confirming former reports on marrow stromal fibroblasts[46]. VEGF-A/C and Ang-1 [10] were abundantly secreted,Ang-2 and PLGF detected in lower amounts, and VEGF-Dwas undetectable. SDF-1 [9,10] secretion level was high,BMP-2 also abundant, but BMP-4, LIF, and IGF-1 werenot detected. The role of angiogenic factors in regulatingHSC is rapidly emerging [28,47,48], illustrated by the dif-ferential influence of VEGF-A [28], PLGF [47], and Ang-1[10,48] on HSC fate [49]. Hypothetically, VEGF-A mayalso play an autocrine/paracrine role through PDGFR sig-naling [38]. While the role of Ang-2 in vascular remodelingis accepted [50,51], its effect on HSCs remains to be eluci-dated. As observed in endothelial cells [51], Ang-2 mightfunction as antagonist or agonist of Tie-2 in HSCs. BMP-2 is a known osteogenic factor which can regulate the de-
velopmental program of human HSCs [52] or act synergis-tically with HGF on HPC differentiation [53]. The FL effecton human hematopoiesis is also multilevel [54]. SDF-1 reg-ulates HSC and HPC mobilization and trafficking[9,10,11,55]. The membrane-bound isoform of SCF syner-gizes with soluble FL in supporting LTC initiating cells[56]. Furthermore, IL-3 [57] and GM-CSF [58] have pleio-tropic effects on HPCs and mature cells. Finally, M-CSF,whose role on HPCs and mature cells is well-established[59–61], was also detected. Altogether, the combinatorialpattern of these HGFs and adhesion molecules, many ofwhich act in synergy, may provide optimal hematopoieticsupport. In this regard, we report for the first time the useof a defined primary CD146þ MSC population to establishLTCs. In 8-week CD34þ cell LTC, MSCs provided a O2-log higher LTC colony output, as compared with standard

e targets
ODULIN, CDK6,
ADIPOR2,
OTCH1, SMAD6, COL12A1, CDK6
OL1A2, COL4A5, COL15A1, COL2A1,
T3
A5, SMAD1, IGF1R
GFA, TGFBR3, COL11A2, CCND1, IL-11
1, CDK6, VCL, CCND1, WNT1
2, HAS3, IL1R1, MMP14, FGFR3,
2, HAS3, IL1R1, MMP14, FGFR3
P1, COL11A1, ERBB4, IL-6, CBFB,
RA, IGFBP5, IL13RA
1
14A1, IL13, CD61, COL1A1, GHR, COL4A2,
14A1, IL13, CD61, COL1A1, GHR, COL4A2,
14A1, IL13, CD61, COL1A1, GHR, COL4A2,
14A1, IL13, CD61, COL1A1, GHR, COL4A2,
14A1, IL13, CD61, COL1A1, GHR, COL4A2,
10
43
A.
Sorrentinoet
al./E
xperimental
Hem
atology2008;36:1035–1046
Table 2. MicroRNAs differentially expressed between differentiated chondrocyte and undifferentiated MSC and putative targets
miRNA expression
MicroRNA P-value Chondro/Control Symbol Genbank Map Putativ
pre-mir-204 0.0295 4.97 MIRN204 9q21.1 ANGPT1, IGF2R, BCL2, ESR1, CAV1,
miR-192 0.0135 2.90 MIRN192 11q13 RB1, CART1
pre-mir-185 0.00358 2.18 MIRN185 22q11.2 VEGFA, NFATC3, IGF2R, FURIN,
miR-146 0.00838 1.78 MIRN146A 5q34 TRAF6, RARB, SMAD4, CNTFR,
miR-214 0.0156 1.78 MIRN214 AJ550417 1q23.3 PGF, MAPK1, FGFR, CSF-1, CD47, CALM
miR-31 0.0125 1.73 MIRN31 AJ421753 9p21 CD71, HIF1AN, CALCR,
miR-212 0.0449 1.72 MIRN212 AJ550415 17p13.3 MAPK1, MMP16, COLQ,
pre-mir-212 0.0256 1.62 MIRN212 AJ550415 17p13.3 MAPK1, MMP16, COLQ,
miR-149 0.00576 1.53 MIRN149 2q37.3 PDGFRA, SP1, CD47, PGF, CD59, RORB,
miR-136 0.00716 1.50 MIRN136 14q32 ELK1, LIFRpre-mir-32 0.0372 1.44 MIRN32 AJ421754 9q31.2 CD51, ITGA5, COL1A2, SMAD7, HAS3, N
miR-199a-2-5p 0.00237 1.33 MIRN199A2 AJ560756 1q24.3 ETS1, CAV1, JUNB, CTGF, HIF1A, VEGFA
miR-10b 0.0426 0.76 MIRN10B AJ550395 2q31 FLT1, HAS3
miR-10a 0.00213 0.72 MIRN10A AJ550394 17q21.3 FLT1, HAS3
miR-29b 0.00189 0.70 MIRN29B2 AF480543 1q32.2-32.3 COL3A1, COL5A3, COL11A1, COL5A1, C
COL9A1, COL19A1, COL6A3, COL22A1, AK
miR-103-2 0.00448 0.67 MIRN103-2 AF480501 2p13 FGF2, TGFBR3
miR-138-1 0.0195 0.66 MIRN138-1 3p21 RARA
miR-30a-5p 0.0429 0.64 MIRN30A AF480535 6q12-13 RARB, CALCR, IL1A, CASP3, CBFB, ITG
miR-21 0.00994 0.64 MIRN21 AJ421741 17q23.2 STAT3, TGFBI, SMAD7
miR-107 0.00095 0.63 MIRN107 AF480505 10q23.31 FGF2, TGFBR3
miR-23a 0.0374 0.63 MIRN23A AJ421743 19p13.2 Il-6R, MET, HS6ST2, TGFBR2, HOXD10, T
pre-mir-34 0.0337 0.61 MIRN34A AJ550399 1p36.22 MET, PDGFRA, NOTCH, CALCR, COL12A
miR-24-1-3p 0.022 0.61 MIRN24-1 AJ421744 9q22.1 CALCR, PDGFRA, FLT1, MMP16, COL11A
miR-24-2 0.0149 0.60 MIRN24-2 AJ421745 19p13.2 CALCR, PDGFRA, FLT1, MMP16, COL11A
miR-26b 0.0288 0.60 MIRN26B AJ421748 2q35 SMAD1, COL10A1, COL1A2, SMAD4, LTB
COL12A1, CTGF
miR-143 0.0346 0.60 MIRN143 5q32-33 FGF1, CBFB, COL5A3, CTGF, LIFR, PDGF
miR-145 0.00534 0.57 MIRN145 5q32-33 ERG, CDK6, BMPR2
miR-191-5p 0.0147 0.57 MIRN191 3p21 EGR1
miR-181a-1 0.029 0.55 MIRN213 1q31.2-q32.1 IL1A, PDGFRA, TNFSF11, SMAD7, RUNX
miR-130a 0.00478 0.50 MIRN130A 11q12 RUNX3, SMAD5, WNT1, PDGFRA
miR-100 0.0272 0.48 MIRN100 AF480498 11q24.1 FGFR3, RAC1
let-7a-3 0.0122 0.47 MIRNLET7A3 AJ421726 22q13.3 TGFBR1, OSMR, COL1A2, COL3A1, COL
FARP1, IL6, IL10, HAS2, MMP11, CRTAP,
let-7d 0.0335 0.44 MIRNLET7D AJ421729 9q22.2 TGFBR1, OSMR, COL1A2, COL3A1, COL
FARP1, IL6, IL10, HAS2, MMP11, CRTAP
let-7a-2 0.00128 0.43 MIRNLET7A2 AJ421725 11q24.2 TGFBR1, OSMR, COL1A2, COL3A1, COL
FARP1, IL6, IL10, HAS2, MMP11, CRTAP
let-7c 0.00765 0.43 MIRNLET7C AJ421728 21q11.2 TGFBR1, OSMR, COL1A2, COL3A1, COL
FARP1, IL6, IL10, HAS2, MMP11, CRTAP
let-7a-1 0.0145 0.39 MIRNLET7A1 AJ421724 9q22.2 TGFBR1, OSMR, COL1A2, COL3A1, COL
FARP1, IL6, IL10, HAS2, MMP11, CRTAP
Pre-miRs correspond to precursor microRNA, while miRs correspond to the mature product.aCapital letters correspond to a gene that is predicted by the three algorithms. Italics are predicted by Target Scan and miRanda only.
1044 A. Sorrentino et al. / Experimental Hematology 2008;36:1035–1046
adherent BM MNCs [29] stromal layers composed of ran-domly mixed cell types, including fibroblasts, adipocytes,macrophages, mesenchymal, and endothelial cells. Homo-geneous CD146þ MSC feeder layers may represent an invitro surrogate model for studies on the HSC niche, or atleast a significant improvement over standard LTC assays,allowing acquisition of data on HSC/MSC interactions tobe validated in vivo.
MSC stromal function was further investigated manipu-lating LTCs either with the KIT or VEGFR2/1 chemical in-hibitors Imatinib [31] or SU-5416 [30], respectively. Bothtreatments similarly impaired HPC output in LTCs, indicat-ing key roles for these two GF/GFR interactions for optimalMSC/LTC-initiating cells cross-talk. Interestingly, SU-5416treatment of CB CD34þ cells totally abrogated HPC outputby week 6, while Imatinib treatment caused a milder andslower inhibition.
In addition to functional hematopoietic support,CD146þ MSCs exhibited canonical stem cell propertiessuch as extended 12-week proliferation and multilineagepotential toward chondrogenic, osteoblastic, and adipo-genic differentiation.
To extend the molecular characterization of CD146þ
MSCs, the miRNA-expression profile was also analyzedby microarrays in both basal conditions and chondrogenicdifferentiation revealing 36 significantly modulated miR-NAs. MiRNA expression profiles are characteristic of spe-cific cell types, so they might represent reliable molecularmarkers specific to MSCs. Advances in miRNA profilingof MSCs and their terminally differentiated progeny willenable the delineation of standards for use in MSC qualitycontrol. Significantly, miRNA fingerprint in basal conditionconfirm and extend the recently published miRNA expres-sion profile on undifferentiated MSCs [62], whereas thechondrogenesis data are novel. Bioinformatic analysis ofthe putative target genes for these miRNAs uncoveredmany fundamental cellular mediators of chondrogenic dif-ferentiation, as well as tissue maintenance, including GFs(IL-6, PGF, ANGPT1, CSF-1, FGF) and GFRs (TGFBR,PDGFRA, IGF2R, FGFR). Therefore, the present work pro-vides the basis for more detailed investigation at the level ofsingle miRNAs and their putative targets, in order to unveilmiR-based regulatory pathways in normal human chondro-genesis. Hypothetically, this study might contribute to thefuture development of novel therapeutic approaches in he-mophiliac’s arthropathy.
A similar approach has been applied to studies on hema-topoiesis with considerable success [33,63,64]. Ongoingstudies aim to expand our initial observations to osteogenicand adipogenic differentiation.
Additionally, a CD146þ MSC population could beadvantageous for in vivo regenerative therapy studies[1,15,18–22].
In conclusion, the availability of a phenotypically homo-geneous CD146þ MSC population, meeting the required
MSC definition criteria [65,66], will allow to obtain consis-tent results in both basic and clinical studies, thus facilitat-ing progress in this research area.
AcknowledgmentsWe thank E. Pelosi, P. Di Matteo, and A. D’Angio for technicalassistance, M. Fontana, D. Marinelli and A. Zito for editorial as-sistance and graphics. We also thank L.M. Starnes, P. Biancoand A. Santoni for critical reading of the manuscript. This workwas supported by Italy-USA Oncology Program on microRNAsand antisense sequences (to C.P.) and FIRB 2001 GrantRBNE01SP72-004 (to M.V.)
References1. Bianco P, Robey PG. Stem cells in tissue engineering. Nature. 2001;
414:118–121.
2. Pittenger MF, Mackay AM, Beck SC, et al. Multilineage potential of
adult human mesenchymal stem cells. Science. 1999;284:143–147.
3. Prockop DJ. Marrow stem cells as stem cells for non-hematopoietic
tissues. Science. 1997;276:71–74.
4. Zhang J, Niu C, Ye L, Huang H, et al. Identification of the haemato-
poietic stem cell niche and control of the niche size. Nature. 2003;425:
836–841.
5. Calvi LM, Adams GB, Welbrecht KW, et al. Osteoblastic cells regu-
late the haematopoietic stem cell niche. Nature. 2003;425:841–846.
6. Kuznetsov SA, Riminucci M, Ziran N, et al. The interplay of osteo-
genesis and hematopoiesis: expression of a constitutively active
PTH/PTHrP receptor in osteogenic cells perturbs the establishment
of hematopoiesis in bone and of skeletal stem cells in the bone mar-
row. J Cell Biol. 2004;167:1113–1122.
7. Li W, Johnson SA, Shelley WC, et al. Hematopoietic stem cell repo-
pulating ability can be maintained in vitro by some primary endothe-
lial cells. Exp Hematol. 2004;32:1226–1237.
8. Kiel MJ, Yalmaz OH, Iwashita T, et al. SLAM family receptors distin-
guish hematopoietic stem and progenitor cells and reveal endothelial
niches for stem cells. Cell. 2005;121:1109–1121.
9. Sugiyama T, Kohara H, Noda M, et al. Maintenance of the hematopoi-
etic stem cell pool by CXCL12-CXCR4 chemokine signaling in bone
marrow stromal cell niches. Immunity. 2006;25:977–988.
10. Sacchetti B, Funari A, Michienzi S, et al. Self-renewing osteoprogeni-
tors in bone marrow sinusoids can organize a hematopoietic microen-
vironment. Cell. 2007;131:324–336.
11. Pelosi E, Valtieri M, Coppola S, et al. Identification of the hemangio-
blast in postnatal life. Blood. 2002;100:3203–3207.
12. da Silva Meirelles L, Chagastelles PC, Nardi B. Mesenchymal stem
cells reside in virtually all post-natal organs and tissues. J Cell Sci.
2006;119:2204–2213.
13. Wagner W, Wein F, Seckinger A. Comparative characteristics of mes-
enchymal stem cells from human bone marrow, adipose tissue, and
umbilical cord blood. Exp Hematol. 2005;33:1402–1416.
14. Kassis I, Zangi L, Rivkin R, et al. Isolation of mesenchymal stem cells
from G-CSF-mobilized human peripheral blood using fibrin microbe-
ads. Bone Marrow Transplant. 2006;37:967–976.
15. Mansilla E, Marin GH, Drago H, et al. Bloodstream cells phenotypi-
cally identical to human mesenchymal bone marrow stem cells circu-
late in large amounts under the influence of acute large skin damage:
new evidence for their use in regenerative medicine. Transplant Proc.
2006;38:967–969.
16. Jiang Y, Jahagirdar BN, Reinhardt RL, et al. Pluripotency of mesen-
chymal stem cells derived from adult marrow. Nature. 2002;418:41–
49.

1045A. Sorrentino et al./ Experimental Hematology 2008;36:1035–1046
17. Yin T, Li L. The stem cell niches in bone. J Clin Invest. 2006;116:
1195–1201.
18. Anjos-Afonso F, Bonnet D. Nonhematopoietic/endothelial SSEA-1þcells define the most primitive progenitors in the adult murine bone
marrow mesenchymal compartment. Blood. 2007;109:1298–1306.
19. Seruya M, Shah A, Pedrotty D, et al. Clonal population of adult stem
cells: life span and differentiation potential. Cell Transplant. 2004;13:
93–101.
20. Pittenger MF, Martin BJ. Mesenchymal stem cells and their potential
as cardiac therapeutics. Circulation Res. 2004;95:9–20.
21. Wenisch S, Trinkaus K, Hild A, et al. Immunochemical, ultra struc-
tural and electrophysiological investigations of bone-derived stem
cells in the course of neuronal differentiation. Bone. 2006;38:911–
921.
22. Ong SY, Dai H, Leong KW. Inducing hepatic differentiation of human
mesenchymal stem cells in pellet culture. Biomaterials. 2006;22:
4087–4097.
23. Gang EJ, Bosnakovski D, Figueiredo CA, et al. SSEA-4 identifies
mesenchymal stem cells from bone marrow. Blood. 2007;109:1743–
1751.
24. Martinez C, Hofmann TJ, Marino R, et al. Human bone marrow stro-
mal cells express the neural ganglioside GD2: a novel surface marker
for the identification of MSCs. Blood. 2007;109:4245–4248.
25. Baksh D, Yao R, Tuan RS. Comparison of proliferative and multiline-
age differentiation potential of human mesenchymal stem cells derived
from umbilical cord and bone marrow. Stem Cells. 2007;25:1384–
1392.
26. Bartel DP. MicroRNAs: genomics, biogenesis, mechanism, and func-
tion. Cell. 2004;116:281–297.
27. Kloosterman WP, Plasterk RH. The diverse functions of microRNAs
in animal development and disease. Dev Cell. 2006;11:441–450.
28. Ziegler BL, Valtieri M, Almeida Porada G, et al. KDR receptor:
a key marker defining hematopoietic stem cells. Science. 1999;
285:1553.
29. Valtieri M, Schiro R, Chelucci C, et al. Efficient transfer of selectable
and membrane reporter genes in hematopoietic progenitor and stem
cells purified from human peripheral blood. Cancer Res. 1994;54:
4398–4404.
30. Ye C, Sweeny D, Sukbuntherng J, Zhang Q, et al. Distribution, metab-
olism, and excretion of the anti-angiogenic compound SU5416. Toxi-
col In Vitro. 2006;20:154–162.
31. Rubin BP, Heinrich MC, Corless CL. Gastrointestinal stromal tumor.
Lancet. 2007;369:1731–1741.
32. Liu CG, Calin GA, Meloon B, et al. An oligonucleotide microchip for
genome-wide microRNA profiling in human and mouse tissues. Proc
Natl Acad Sci U S A. 2004;101:9740–9744.
33. Felli N, Fontana L, Pelosi E, et al. MicroRNAs 221 and 222 inhibit
normal erythropoiesis and erytholeukemic cell growth via kit receptor
down-modulation. Proc Natl Acad Sci U S A. 2005;102:18081–
18086.
34. Lewis BP, Shih IH, Jones-Rhoades MW, et al. Prediction of mamma-
lian microRNA targets. Cell. 2003;115:787–798.
35. Krek A, Grun D, Poy MN, et al. Combinatorial microRNA target pre-
diction. Nat Genet. 2005;37:495–500.
36. John B, Enright AJ, Aravin A, et al. Human microRNA targets. PloS
Biol. 2004;2:e363.
37. Schwab KE, Gargett CE. Co-expression of two perivascular cell
markers isolates mesenchymal stem-like cells from human endome-
trium. Hum Reprod. 2007;22:2903–2911.
38. Ball SG, Shuttleworth A, Kielty CM. Vascular endothelial growth fac-
tor can signal through platelet-derived growth factor receptors. J Cell
Biol. 2007;177:489–500.
39. Wang D, Park JS, Chu JSF, et al. Proteomic profiling of bone marrow
mesenchymal stem cells upon transforming growth factor b stimula-
tion. J Biol Chem. 2004;279:43725–43734.
40. Cristofalo VJ, Volker C, Francis MK, et al. Age-dependent modifica-
tions of gene expression in human fibroblasts. Crit Rev Eukaryot Gene
Expr. 1998;8:43–80.
41. Metcalf D. Concise review: hematopoietic stem cells and tissue stem
cells: current concepts and unanswered questions. Stem Cells. 2007;
25:2390–2395. Epub 2007 Aug 9.
42. Verfaille CM. Adhesion receptors as regulators of the hematopoietic
process. Blood. 1998;92:2609–2612.
43. Li Q, Bischoff J, Mulliken JB, Olsen BR. Differential expression of
CD146 in tissues and endothelial cells derived from infantile haeman-
gioma and normal human skin. J Pathol. 2003;201:296–302.
44. Shi S, Gronthos S. Perivascular niche of postnatal mesenchymal stem
cells in human bone marrow and dental pulp. J Bone Miner Res. 2003;
18:696–704.
45. Miller FD. Riding the waves: neural and nonneural origins for mesen-
chimal stem cells. Cell Stem Cell. 2007;1:129–130.
46. Linenberger ML, Jacobson FW, Bennett LG, et al. Stem cell factor
production by human marrow stromal fibroblasts. Exp Hematol.
1995;23:1104–1114.
47. Hattori K, Heissig B, Wu Y, et al. Placental growth factor reconstitutes
hematopoiesis by recruiting VEGFR1(þ) stem cells from bone mar-
row microenvironment. Nat Med. 2002;8:841–849.
48. Arai F, Hirao A, Ohmura M, et al. Tie2/angiopoietin-1 signalling reg-
ulates hematopoietic stem cell quiescence in the bone marrow niche.
Cell. 2004;118:149–161.
49. Han W, Yu Y, Liu XY. Local signals in stem cell-based bone marrow
regeneration. Cell Res. 2006;16:189–195.
50. Roy H, Bhardwaj S, Yla-Herttuala S. Biology of vascular endothelial
growth factors. FEBS Lett. 2006;580:2279–2287.
51. Eklund L, Olsen BR. Tie receptors and their angiopoietin ligands are
context-dependent regulators of vascular remodelling. Exp Cell Res.
2006;312:630–641.
52. Bhatia M, Bonnet D, Wu D, et al. Bone morphogenetic proteins reg-
ulate the developmental program of human hematopoietic stem cells. J
Exp Med. 1999;189:1139–1148.
53. Detmer K, Walker AN. Bone morphogenetic proteins act synergisti-
cally with hematopoietic cytokines in the differentiation of hematopoi-
etic progenitors. Cytokine. 2002;17:36–42.
54. Gabbianelli M, Pelosi E, Montesoro E, et al. Multi-level effects of flt3
ligand on human hematopoiesis: expansion of putative stem cells and
proliferation of granulomonocytic progenitors/monocytic precursors.
Blood. 1995;86:1661–1670.
55. Liles WC, Broxmeyer HE, Rodger E, et al. Mobilization of hemato-
poietic progenitor cells in healthy volunteers by AMD3100,
a CXCR4 antagonist. Blood. 2003;102:2728–2730.
56. Slanicka Krieger M, Nissen C, Manz CY, et al. The membrane-bound
isoform of stem cell factor synergizes with soluble flt3 ligand in sup-
porting early hematopoietic cells in long-term cultures of normal and
aplastic anemia bone marrow. Exp Hematol. 1998;26:365–373.
57. Scott CL, Robb L, Papaevangeliou B, et al. Reassessment of interac-
tions between hematopoietic receptors using common beta-chain and
inteleukin-3-specific receptor beta-chain-null cells: no evidence of
functional interactions with receptor for erythropoietin, granulocyte
colony-stimulating factor, or stem cell factor. Blood. 2000;96:1588–
1590.
58. Fleetwood AJ, Cook AD, Hamilton JA. Functions of granulocyte-
macrophage colony-stimulating factor. Crit Rev Immunol. 2005;25:
405–428.
59. Chitu V, Stanley ER. Colony-simulating factor-1 in immunity and in-
flammation. Curr Opin Immunol. 2006;18:39–48.
60. Nakano T. In vitro development of hematopoietic system from mouse
embryonic stem cells: a new approach for embryonic hematopoiesis.
Int J Hematol. 1996;65:1–8.
61. Takakura N, Kodama H, Nishikawa S, Nishikawa S. Preferential pro-
liferation of colony-forming units in a chemically defined condition

1046 A. Sorrentino et al. / Experimental Hematology 2008;36:1035–1046
with a macrophage colony-stimulating factor-negative stromal cell
clone. J Exp Med. 1996;184:2301–2309.
62. Greco SJ, Rameshwar P. MicroRNAs regulate synthesis of the neuro-
transmitter substance P in human mesenchymal stem cells-derived
neuronal cells. Proc Natl Acad Sci U S A. 2007;104:15484–15489.
63. Fontana L, Pelosi E, Greco P, et al. The microRNAs 17-5p/-20a/106a
function as a master gene complex controlling monocytopoiesis
through AML1 targeting. Nat Cell Biol. 2007;9:775–787.
64. Fazi F, Rosa A, Fatica A, et al. A minicircuitry comprised of micro-
RNA-223 and transcription factor NFI-A and C/EBPalpha regulates
human granulopoiesis. Cell. 2005;5:819–831.
65. Dominici M, Le Blanc K, Mueller I, et al. Minimal criteria for
defining multipotent mesenchymal stromal cells. Cytotherapy. 2006;
8:315–317.
66. Delorme B, Ringe J, Gallay N, et al. Specific plasma membrane pro-
tein phenotype of culture-amplified and native human bone marrow
mesenchymal stem cells. Blood. 2008;111:2631–2635. Epub 2007
Dec 17.
Supplementary data associated with this article can befound, in the online version, at doi:10.1016/j.exphem.2008.03.004.
Related Documents


![RESEARCH Open Access Human multipotent stromal cells ...mesenchymal lineage cell types including bone, cartilage, adipose tissue, muscle and tendon [4]. MSCs have been isolated from](https://static.cupdf.com/doc/110x72/5e6b65b920f9b208741edf9a/research-open-access-human-multipotent-stromal-cells-mesenchymal-lineage-cell.jpg)


