Journal of Plant Pathology (2014), 96 (1), 43-55 43 ISOLATION AND BIOLOGICAL CHARACTERIZATION OF GUIGNARDIA SPECIES FROM CITRUS IN FLORIDA H.L. Er 1 , K. Hendricks 1,2 , E.M. Goss 1,3 , M. Smith 1 , T.S. Schubert 4 , P.D. Roberts 1,2 and A.H.C. van Bruggen 1,3 1 Department of Plant Pathology, University of Florida. PO Box 110680, Gainesville, FL 32611-0680, USA 2 Southwest Research and Education Center, University of Florida. 2685 SR29N, Immokalee, FL 34142-9515, USA 3 Emerging Pathogen Institute, University of Florida. PO Box 110680, Gainesville, FL 32611-0680, USA 4 Division of Plant Industry. PO Box 147100, Gainesville, FL32614-7100, USA SUMMARY Citrus black spot (CBS) is an emerging citrus disease in Florida. The causal agent is Guignardia citricarpa, but non-pathogenic Guignardia mangiferae is often isolated from the same lesions. A hypothesis on CBS emergence in Florida was formulated: a change in environment, such as increased copper applications could have favored growth and infection by G. citricarpa, causing it to outcompete G. mangiferae , facilitating the emergence of CBS. Moreover, differential temperature optima could favor one of the two species. Four agar media were compared for isolation of both species from citrus tissues. The obtained isolates were subjected to sequence comparison in the ITS region with that of Guignardia species worldwide, to pathogenic- ity tests, growth tests at different temperatures and com- petition assays at different copper concentrations. There were no significant differences between the media for iso- lation of both Guignardia species. Comparison of the ITS region of the isolates to those in international databases confirmed the identity of both species, and revealed higher diversity among the G. mangiferae than G. citricarpa iso- lates. The G. citricarpa isolates had similar temperature response curves (optima at 26°C), whereas the G. mangi- ferae isolates were more diverse in their response to tem- peratures (optima at 25-30°C). Growth of G. citricarpa was increasingly suppressed at higher copper concentrations, while a slight increase or no change in growth rate was observed for G. mangiferae . Therefore, our initial hypoth- esis was rejected. The differential response to copper and temperature by G. citricarpa and G. mangiferae will serve as a basis for modeling and predicting the spread of CBS in Florida. Key words: competition, copper, G. citricarpa, G. man- giferae , temperature optimum curve INTRODUCTION Florida is one of the major producers of citrus in the world, and has been responsible for the production of 70% of all citrus in the USA during the last decade (USDA- NASS, 2011). It has about 219,000 ha of citrus in produc- tion with an economic value of around 1 billion US dol- lars. The citrus industry, however, has been threatened by several newly introduced diseases, including citrus canker caused by Xanthomonas axonopodis, Huanglong- bing associated with Candidatus Liberibacter asiaticus, and more recently citrus black spot (CBS) (Chiyaka et al., 2012; Schoulties et al ., 1987; Schubert et al ., 2012). CBS was first detected in March 2010 on Valencia oranges in the Immokalee area in southern Florida during a multi-pest survey (Schubert et al ., 2010). The first scientific report on the occurrence of CBS in the USA was published in 2012 (Schubert et al., 2012). It is not known how the disease was introduced into the USA or why the disease emerged. Citrus black spot is well known in other parts of the world. It was first observed in Australia in the 1890s and has inflicted heavy losses there for many years, particularly in coastal regions with relatively humid climates (Kotze, 1981). Around the 1920s, it was found in South Africa, first along the coastal region of Natal, then spreading inland to the main citrus production sites of the country (Ko- tze, 1981). The disease has not been eradicated in those two countries. Citrus black spot has also been found in Asia (China, Taiwan, the Philippines and Indonesia), other countries in Africa (Zimbabwe, Mozambique and Ghana), in South America (Argentina, Brazil, and Uruguay), and North America (the USA). This disease has not yet been observed in Europe and import of infected citrus from other countries is banned (Paul et al ., 2005). CBS is caused by G. citricarpa Kiely [anamorph Phyl- losticta citricarpa (McAlp.) van der Aa]. Infection results in unsightly lesions on the fruits, and extensive prema- ture fruit drop when the disease is severe. At least four types of lesions have been described (Chung et al., 2005; Marques et al ., 2012). Hard spot is the most characteristic symptom on infected fruits. A hard spot lesion is a light brown necrotic lesion with a dark reddish-brown raised border, which may contain the pycnidia (asexual fruiting bodies). There are several less characteristic lesions, among Edizioni ETS Pisa, 2014 Corresponding author: A.H.C. van Bruggen Fax: +1.352.2739396 E-mail: ahcvanbruggen@ufl.edu

Welcome message from author
This document is posted to help you gain knowledge. Please leave a comment to let me know what you think about it! Share it to your friends and learn new things together.
Transcript
Journal of Plant Pathology (2014), 96 (1), 43-55 Er et al. 43
ISOLATION AND BIOLOGICAL CHARACTERIZATION OF GUIGNARDIA SPECIES FROM CITRUS IN FLORIDA
H.L. Er1, K. Hendricks1,2, E.M. Goss1,3, M. Smith1, T.S. Schubert4, P.D. Roberts1,2 and A.H.C. van Bruggen1,3
1Department of Plant Pathology, University of Florida. PO Box 110680, Gainesville, FL 32611-0680, USA2Southwest Research and Education Center, University of Florida. 2685 SR29N, Immokalee, FL 34142-9515, USA
3Emerging Pathogen Institute, University of Florida. PO Box 110680, Gainesville, FL 32611-0680, USA4Division of Plant Industry. PO Box 147100, Gainesville, FL32614-7100, USA
SUMMARY
Citrus black spot (CBS) is an emerging citrus disease in Florida. The causal agent is Guignardia citricarpa, but non-pathogenic Guignardia mangiferae is often isolated from the same lesions. A hypothesis on CBS emergence in Florida was formulated: a change in environment, such as increased copper applications could have favored growth and infection by G. citricarpa, causing it to outcompete G. mangiferae, facilitating the emergence of CBS. Moreover, differential temperature optima could favor one of the two species. Four agar media were compared for isolation of both species from citrus tissues. The obtained isolates were subjected to sequence comparison in the ITS region with that of Guignardia species worldwide, to pathogenic-ity tests, growth tests at different temperatures and com-petition assays at different copper concentrations. There were no significant differences between the media for iso-lation of both Guignardia species. Comparison of the ITS region of the isolates to those in international databases confirmed the identity of both species, and revealed higher diversity among the G. mangiferae than G. citricarpa iso-lates. The G. citricarpa isolates had similar temperature response curves (optima at 26°C), whereas the G. mangi-ferae isolates were more diverse in their response to tem-peratures (optima at 25-30°C). Growth of G. citricarpa was increasingly suppressed at higher copper concentrations, while a slight increase or no change in growth rate was observed for G. mangiferae. Therefore, our initial hypoth-esis was rejected. The differential response to copper and temperature by G. citricarpa and G. mangiferae will serve as a basis for modeling and predicting the spread of CBS in Florida.
Key words: competition, copper, G. citricarpa, G. man-giferae, temperature optimum curve
INTRODUCTION
Florida is one of the major producers of citrus in the world, and has been responsible for the production of 70% of all citrus in the USA during the last decade (USDA-NASS, 2011). It has about 219,000 ha of citrus in produc-tion with an economic value of around 1 billion US dol-lars. The citrus industry, however, has been threatened by several newly introduced diseases, including citrus canker caused by Xanthomonas axonopodis, Huanglong-bing associated with Candidatus Liberibacter asiaticus, and more recently citrus black spot (CBS) (Chiyaka et al., 2012; Schoulties et al., 1987; Schubert et al., 2012). CBS was first detected in March 2010 on Valencia oranges in the Immokalee area in southern Florida during a multi-pest survey (Schubert et al., 2010). The first scientific report on the occurrence of CBS in the USA was published in 2012 (Schubert et al., 2012). It is not known how the disease was introduced into the USA or why the disease emerged.
Citrus black spot is well known in other parts of the world. It was first observed in Australia in the 1890s and has inflicted heavy losses there for many years, particularly in coastal regions with relatively humid climates (Kotze, 1981). Around the 1920s, it was found in South Africa, first along the coastal region of Natal, then spreading inland to the main citrus production sites of the country (Ko-tze, 1981). The disease has not been eradicated in those two countries. Citrus black spot has also been found in Asia (China, Taiwan, the Philippines and Indonesia), other countries in Africa (Zimbabwe, Mozambique and Ghana), in South America (Argentina, Brazil, and Uruguay), and North America (the USA). This disease has not yet been observed in Europe and import of infected citrus from other countries is banned (Paul et al., 2005).
CBS is caused by G. citricarpa Kiely [anamorph Phyl-losticta citricarpa (McAlp.) van der Aa]. Infection results in unsightly lesions on the fruits, and extensive prema-ture fruit drop when the disease is severe. At least four types of lesions have been described (Chung et al., 2005; Marques et al., 2012). Hard spot is the most characteristic symptom on infected fruits. A hard spot lesion is a light brown necrotic lesion with a dark reddish-brown raised border, which may contain the pycnidia (asexual fruiting bodies). There are several less characteristic lesions, among
Edizioni ETS Pisa, 2014
Corresponding author: A.H.C. van Bruggen Fax: +1.352.2739396 E-mail: [email protected]
44 Characterization of Guignardia spp. from Florida Journal of Plant Pathology (2014), 96 (1), 43-55
them the irregular ‘virulent spots’, mostly on mature fruit, and ‘speckled blotch’ or ‘false melanose’ consisting of dark brown stipplings, observed on green fruit. Leaf symptoms are seldom seen or are relatively minor on most citrus species except for lemons. When present, they appear as round, small, sunken necrotic spots with brown centers surrounded by a yellow halo (Schubert et al., 2010). When infected leaves abscise and decay on the orchard floor, they provide inoculum for new infections via air-borne ascospores (McOnie, 1967).
The CBS life cycle begins with infected fallen leaves on the orchard floor. Pseudothecia (sexual fruiting bodies) of G. citricarpa develop 40-180 days after leaf fall, depending on the frequency of leaf wetness and relative humidity. Mature ascospores are forcibly released during irrigation or rainfall and disseminated by wind currents (Huang and Chang, 1972). After germination of ascospores on fruit and colonization of the space between cuticle and epidermal wall, the fungus remains quiescent until the fruit becomes mature. It takes several months for symptom development after infection. Symptom development on mature fruit is enhanced by high temperature and humidity. Black pyc-nidia usually occur on heavily infected fruit, and some-times on leaves and twigs. Conidia from pycnidia are dis-persed by water splash to infect healthy fruit or leaves. Pycnidia on infected leaves or fruit overwinter in dead tissues and start a new cycle of infections the next spring. This life cycle is similar to that of apple scab caused by Venturia inaequalis (Cooke) G. Wint (Holb et al., 2005). However, in the case of citrus black spot, leaf lesions are rare and conidia are considered a less important source of inoculum than ascospores (McOnie, 1967).
Apple scab control is well developed, with special at-tention for decomposition of infected leaf litter, prediction of ascospore release and chemical control of infection by ascospores and conidia (Holb, 2006). Control of CBS is less well established. Enhanced decomposition of leaf lit-ter by urea applications has been shown (Bellotte et al., 2009), but otherwise disease control depends primarily on fungicide applications, such as copper and other classes of fungicides during critical periods for fruit infection (Ko-tze, 1981; Possiede et al., 2009). In Florida, acceleration of leaf litter decomposition by application of nitrogenous compounds and limitation of G. citricarpa infection of im-mature fruit by copper and strobilurin applications are rec-ommended (University of Florida IFAS extension: http://edis.ifas.ufl.edu/cg088).
Besides G. citricarpa, other species of Guignardia (or the anamorph Phyllosticta) closely related to G. citricarpa are frequently found in infected and healthy leaves and fruit. For example, G. mangiferae A.J. Roy (anamorph Phyllo-sticta capitalensis P. Hennings) is often isolated from citrus with CBS as well as healthy tissues (Baldassari, 2008). This species is mostly an endophyte with a wider host range than G. citricarpa extending beyond the citrus family (Baayen et al., 2002). G. mangiferae has sometimes been
misidentified as G. citricarpa before Baayen et al. clarified the taxonomy in 2002 (Everett and Rees-George, 2006; Glienke-Blanco et al., 2002). As both species are often iso-lated from the same citrus tissue, they may directly com-pete with each other. Several morphological and physiolog-ical characteristics have been compared for the two species in vitro. G. mangiferae has a faster growth rate in culture and forms bigger conidia than G. citricarpa (Baayen et al., 2002), but it has significantly lower amylase, endogluca-nase, and pectinase activities than G. citricarpa in liquid culture (Ramao et al., 2011). However, comparison of the two species on nutrient media or at different temperatures has not yet been investigated. Moreover, the effect of cop-per on the outcome of the competition between G. citri-carpa and G. mangiferae has not been studied.
Considering that the source of G. citricarpa in Florida is unknown, the following hypothesis was formulated: G. citricarpa might have been present before it was detected in Florida but black spot disease caused by this fungus did not manifest itself due to competition by endophytic G. mangiferae. A change in the growing environment, such as increased copper applications to control citrus canker (which were increased after 2005, when the program to eradicate citrus canker was stopped), could have shifted the balance towards increased growth and infection by G. citricarpa thereby facilitating the emergence of CBS in Florida. Moreover, differential temperature optima could favor one of the two species. Therefore, the objectives of this study were to: (i) compare different media and citrus tissues for isolation of G. citricarpa and G. mangiferae; (ii) test G. citricarpa isolates for pathogenicity on citrus fruits; (iii) compare the ITS sequence of G. citricarpa isolates with
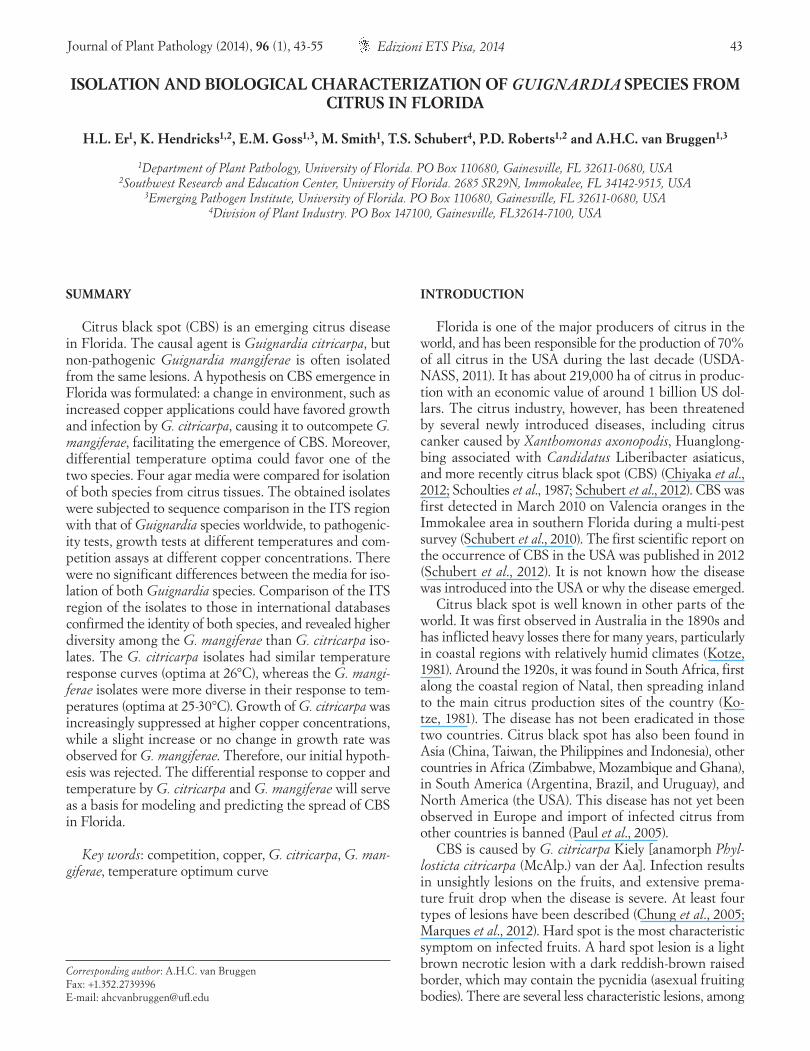
Fig. 1. Florida map by counties. The quarantine areas for ci-trus black spot have been located near Immokalee in Hendry and Collier counties since 2010, and have expanded into Polk county since 2013.
Journal of Plant Pathology (2014), 96 (1), 43-55 Er et al. 45
that of G. mangiferae obtained from citrus in Florida and with related Guignardia and Phyllisticta species from other regions of the world; (iv) characterize the growth response of Florida isolates of G. citricarpa and G. mangiferae to a range of temperatures, and (v) determine colony growth rates of G. citricarpa and G. mangiferae competing on agar plates as affected by copper concentration.
MATERIALS AND METHODS
Sampling location. Two citrus groves located in the Immokalee area in southwest Florida were sampled (Fig. 1). Both groves are within the CBS quarantine area, one located in Collier County (Grove 1), and the other one in Hendry County (Grove 2). In both groves, CBS was detected in the main blocks with Valencia oranges and samplings were carried out in those blocks. In Immokalee, fruit set of Valencia oranges occurs in January to Febru-ary. Harvesting of the fruits from previous year starts between February and March, and continues up to June and July. Grove 1 was visited in May 2010 to survey the disease. Four rows with about twenty trees in each row were inspected. Fruits, leaves and twigs were examined for the presence of pycnidia with a hand lens. Subsequently, symptomatic fruits (4), immature fruits (2), fruits dropped on the ground (2), leaves with spots (1), healthy leaves (30) and young twigs with pycnidia were collected (1). This site was already harvested during the time of visit so there were relatively few mature fruits still hanging on the trees. It was rare to find leaves with spots and twigs with pyc-nidia so that the number of samples was limited. In March 2011, eight symptomatic fruits from Grove 2 were sent to the lab in Gainesville. In October 2011 and January 2012, asymptomatic fruits (~500) were collected from Grove 1 and Grove 2 and incubated under controlled temperature and relative humidity (Er et al., 2013) for development of black spot symptoms.
Isolations. The first attempt to isolate G. citricarpa and G. mangiferae from citrus tissue was in May 2010. All col-lected symptomatic fruits, immature fruits, fruits dropped on the ground, leaves with spots, healthy leaves and infect-ed young twigs were used for isolation. Subsequently, in March 2011, December 2011 and between February-April 2012, isolations were attempted from symptomatic fruits only. The citrus tissue was surface sterilized with 70% eth-anol for 1 min, washed three times in sterile water, cut into small pieces (< 5mm) and then plated on potato dextrose agar (PDA), acidified potato dextrose agar (APDA), V8 agar, oatmeal agar (OMA), and corky root media (CRM; Singleton et al., 1992) (Table 1) or put on a moist filter paper in Petri dishes to check for pycnidia development. The isolates were identified by morphology of mycelium and conidia (Baayen et al., 2002; Baldassari et al., 2008), as well as PCR amplification.
Pathogenicity test. About 100 cv. Valencia oranges (fresh weight 195.8g ± 34.3) were collected from the exper-imental orange grove of the University of Florida (Citra, FL) in November 2010. G. citricarpa isolates DPI Gc, Gc1 and Gc2 were grown for two weeks on PDA and flushed with 50 ml of sterile distilled water. Pycnidia were disrupt-ed with a sterile plastic scraper and the conidia released into the water were collected in a centrifuge tube (Fisher Scientific, USA). The spore suspension was diluted with sterile water to ca. 105 spores/ml in a final volume of 200 ml. Spreader sticker (Voluntary Purchasing Group, USA) was added to the spore suspension in a ratio of 2:126 to aid in attachment of the spores to the fruit surface. Oranges (60) were swabbed with 70% ethanol, allowed to dry, and then dipped in the spore suspension for 10 sec each, then incubated on top of wire racks in crisper boxes with a layer of sterile water at the bottom to create high relative humidity. The controls (20) were dipped in the same vol-ume of sterile water with spreader sticker. A total of 10 crisper boxes were arranged randomly in two incubators at 30°C with 12 h photoperiod. The experimental design was split plot with incubators as the main plots and the crisper boxes as the sub plots. The oranges were checked for appearance of symptoms periodically for five months. At the end of five months, all black spot like lesions were photographed and isolation of G. citricarpa was attempted on APDA from 10 spots.
DNA extraction and PCR amplification. Genomic DNA was either extracted with DNeasy plant mini kit (Qiagen Science, USA) or a quick extraction protocol similar to the Extract-N-Amp™ Kit (Sigma-Aldrich, USA). For identification, G. citricarpa specific primers CITRI1 (5’- GAAAGGTGATGGAAGGGAG-3’) (Meyer et al., 2006) and ITS4 (5’- TCCTCCGCTTATTGATATGC-3’), or G. mangiferae specific primers CAMEL2 (5’- AGTATACAAAACTCAAGAATTC-3’) (Meyer et al.,
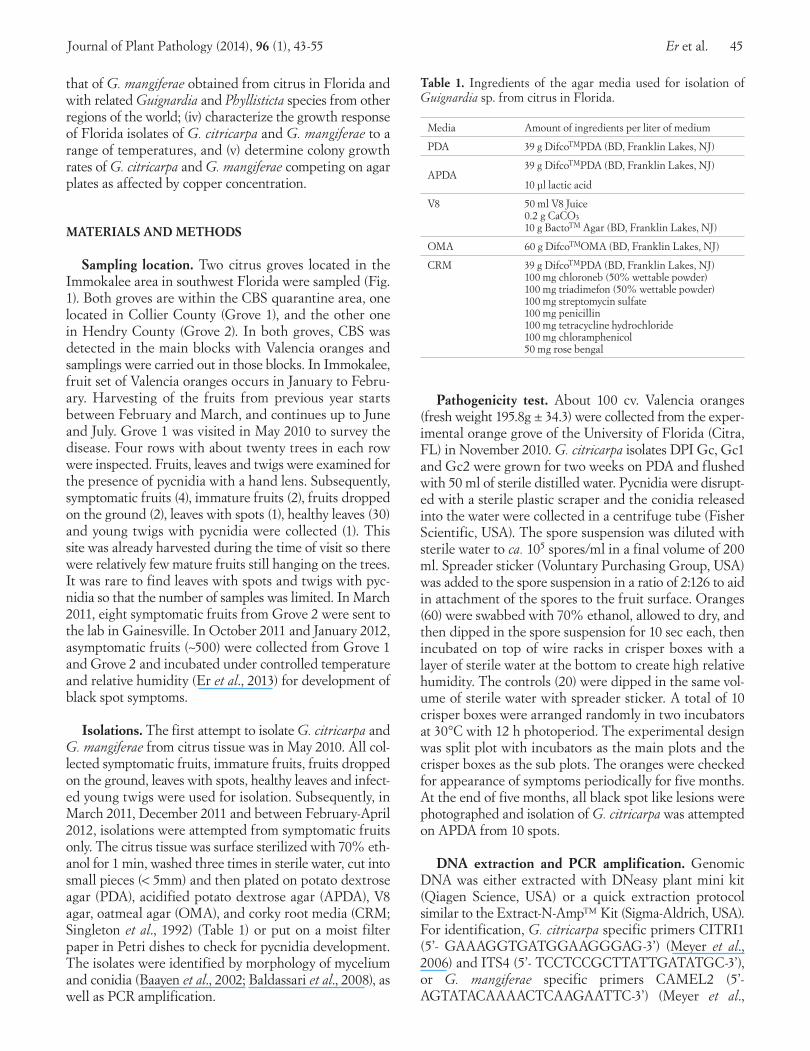
Table 1. Ingredients of the agar media used for isolation of Guignardia sp. from citrus in Florida.
Media Amount of ingredients per liter of medium
PDA 39 g DifcoTMPDA (BD, Franklin Lakes, NJ)
APDA39 g DifcoTMPDA (BD, Franklin Lakes, NJ)
10 µl lactic acid
V8 50 ml V8 Juice 0.2 g CaCO3 10 g BactoTM Agar (BD, Franklin Lakes, NJ)
OMA 60 g DifcoTMOMA (BD, Franklin Lakes, NJ)
CRM 39 g DifcoTMPDA (BD, Franklin Lakes, NJ) 100 mg chloroneb (50% wettable powder) 100 mg triadimefon (50% wettable powder) 100 mg streptomycin sulfate 100 mg penicillin 100 mg tetracycline hydrochloride 100 mg chloramphenicol 50 mg rose bengal
46 Characterization of Guignardia spp. from Florida Journal of Plant Pathology (2014), 96 (1), 43-55
2006) and ITS4, were used. The ITS regions of the iden-tified isolates were amplified with primer pair ITS1-F (5’-CTTGGTCATTTAGAGGAAGTAA-3’) and ITS4 (White et al., 1990). A PCR reaction volume of 20 µl con-sisted of 2 µl of 10X PCR buffer, 0.4 µl of 10 mM dNTPs, 1.2 µl of 25 mM MgCl2, 0.4 µl of each primer (primer concentration = 10 µm), 0.2 µl of 5 U/µl Taq DNA poly-merase, 14.4 µl of sterile deionized water and 1 µl of DNA template. The PCR conditions were: 94°C for 2 min, fol-lowed by 39 cycles of 94°C for 30 sec, 55°C for 30 sec and 72°C for 1 min, and then a final elongation at 72°C for 10 min. The PCR products were purified with Wizard SV Gel and PCR clean-up system (Promega Corpora-tion, USA) and sequenced at the Interdisciplinary Center for Biotechnology Research (ICBR) at the University of Florida (UF).
Phylogenetic analysis. The DNA sequences were visu-alized and manually edited in the chromatogram viewer Finch TV version 1.4.0 (Geospiza, USA) prior to align-ment. The ITS sequences of reference Guignardia spp. and Phyllosticta spp. were obtained from the Centraal Bureau voor Schimmelcultures (CBS) fungus database (http://www.cbs.knaw.nl/databases/) and GenBank (http://www.ncbi.nlm.nih.gov/genbank/). Multiple sequence alignment was done with Muscle in MEGA. Phylogenetic trees were constructed with the neighbour-joining and maximum likelihood methods. For the neighbour-joining tree, the evolutionary distances were computed using the maximum composite likelihood method; whereas the maximum like-lihood tree was based on the Tamura-Nei model, which is the recommended and default model (Hall, 2011). For both trees, fewer than 5% alignment gaps, missing data and ambiguous bases were allowed at any position; a total of 418 bases were used for tree construction. A bootstrap test was carried out to check the reliability of the tree with 2,000 replications.
Effect of temperature on colony growth. Three isolates of G. citricarpa (DPI Gc, Gc2, Gc3) and three isolates of G. mangiferae (Gm2, Gm5, Gm7) were grown on ¼ PDA at 4, 13, 15, 17, 27, 35, and 37°C. There were two incubators for each temperature and two plates of each isolate were put in each incubator. Colony radii were measured in four directions from the central plug every three to four days for 27-34 days.
Effect of copper on competitive growth between G. citricarpa and G. mangiferae. The label rate of the com-mercial copper fungicide, Kocide 3000 (DuPont, USA), for control of CBS and other citrus diseases is around 0.2-0.6 kg/ha (http://fs1.agrian.com/pdfs/DuPont_Kocide_3000_FungicideBactericide_Label5a.pdf). The application vol-ume for citrus trees is 383-919 l/ha, depending on the size of the trees and the spray equipment available. Therefore the concentration of copper is in the range of 0.2-1.4g/l. Kocide 3000, containing 30% metallic copper as the active ingredient, was used as the source of copper in this experi-ment. In preliminary experiments it was found that both G. citricarpa and G. mangiferae will not grow at copper concentrations above 0.5g/l of ¼ PDA medium, similar to results obtained in another study (Hendricks et al., 2013). Therefore, copper concentrations of 0 g/l, 0.005 g/l, 0.02 g/l, 0.1 g/l and 0.2 g/l of ¼ PDA medium were chosen for this experiment. Mycelial plugs (diameter = 6 mm) of G. citricarpa (Gc2) and G. mangiferae (Gm2 or Gm5) were placed on two opposite edges in the same plate. Colony radii of both species were recorded on day 2, 6, 9, 13 and 20. On plates without copper, two mycelial plugs of the same species (Gc2, Gm2 and Gm5) were inoculated at two opposite edges in one plate as well. Colony radii were measured on day 2, 3, 4, 7, 10, 13, 21, 25, 29, 32, 42. There were two replications for each treatment.
Table 2. Mathematical equations for calculation of area under growth curves and models used to fit colony growth, temperature-growth response function, and copper-growth response function.
Biological process Name of function Mathematical equation
Radial colony growth
AUGCa
Linear regressionb
Temperature-growth response Analytis (1977) optimum curvec
Copper-growth response Exponential decline with asymptoted
a For calculation of AUGC, r is the colony radius (mm) at day t. b For the linear function, ML is the mycelial length at day D, r is the absolute colony growth rate, I is the intercept. c In the Analytis model, AUGC is the predicted area under growth curve at any given temperature T, within the range bounded by minimum and maximum temperature (Tmin and Tmax, respectively); whereas p, n and m are shape parameters of the Analytis model. d In the exponential decline with asymptote model, y is the predicted growth rate at copper concentration C, K is the estimated asymptote, y0 is the estimated growth rate at 0 copper concentration, r is the estimated rate of decline.
Journal of Plant Pathology (2014), 96 (1), 43-55 Er et al. 47
Statistical analysis. The Chi-square test was carried out to check whether the different media had a signifi-cant effect on successful isolation of Guignardia spp. The absolute growth rate of the colony radius was obtained by linear regression of colony radius (mm) over time (day) in Microsoft Excel 2010. Only the linear part of the growth curves was used for linear regression and the R2 was used as criterion for the goodness of fit. The area under the growth curve (AUGC) was calculated for each isolate on each plate using the equation given in Table 2, and then plotted against temperature. The AUGC vs. T plots were fitted to the Analytis model (Table 2) using the nonlinear modeling program PROC NLIN in SAS9.3 (SAS Insti-tute, USA). The best fit was selected based on least mean squared error (MSE), residual distribution close to normal and high R2 in regression analyses of predicted versus ob-served values (Analytis, 1977). The estimates of five pa-rameters (p, m, n, Tmin and Tmax) of the Analytis model were used to construct the predicted temperature-growth response functions. Tmin and Tmax are minimum and maximum temperature for growth, respectively, whereas p, n and m are shape parameters of the Analytis model.
In the copper assay experiment, the rates of colony growth for each isolate at different copper concentrations were estimated using the slopes obtained from linear re-gression of the average colony radius against time over 20 days. In plates without copper, observation of colony growth continued until day 42, in which case the Logistic model provided a better fit to the growth curve. Model fitting was done using a similar procedure as described above. To show a reduction in growth due to copper, colony radius ratios, i.e. the colony radius of an isolate at a particular copper concentration divided by the colony radius of the same isolate at zero copper, were calculated. Colony radius ratios larger than 1 indicated more growth at that copper concentration compared to zero copper, and vice versa.
To test for interaction of the effect of copper concentra-tions and isolates on colony linear growth rates, proc glm with split-plot design in SAS9.3 was used. When a sig-nificant interaction was present, the colony linear growth rates between the G. citricarpa and G. mangiferae isolates at each copper concentration was compared with a one-tailed paired t-test. Linear growth rates (days 0-20) were plotted against copper concentration, and were again sub-jected to nonlinear regression using the exponential de-cline with asymptote model (Cevallos-Cevallos et al., 2012; Gu et al., 2011). The parameter y0 in this model was fixed during model fitting. Growth reduction of Gc2 at differ-ent copper concentrations was compared to that of Gm2 and Gm5 with two-tailed paired t-tests.
RESULTS
Isolations. G. citricarpa was isolated only from oranges that developed typical black spot symptoms with or with-out pycnidia, either on the tree or in storage (Table 3). It was isolated successfully on PDA (11/51 = 11 out of 51 attempts), V8 (2/8), OMA (3/8) and CRM (2/11). G. mangi-ferae was isolated from symptomatic oranges and infected young twigs on APDA (7/12), V8 (1/8) and CRM (4/11). G. citricarpa was distinguished from G. mangiferae based on colony morphology, formation of a yellow halo on OMA medium, PCR amplification with species-specific primers and sequencing of the ITS region. G. citricarpa readily produced conidia in culture; the conidia exhibited granular contents, each with a hyaline appendage. There were no significant differences among media for isolation of both isolates according to the chi-square test.
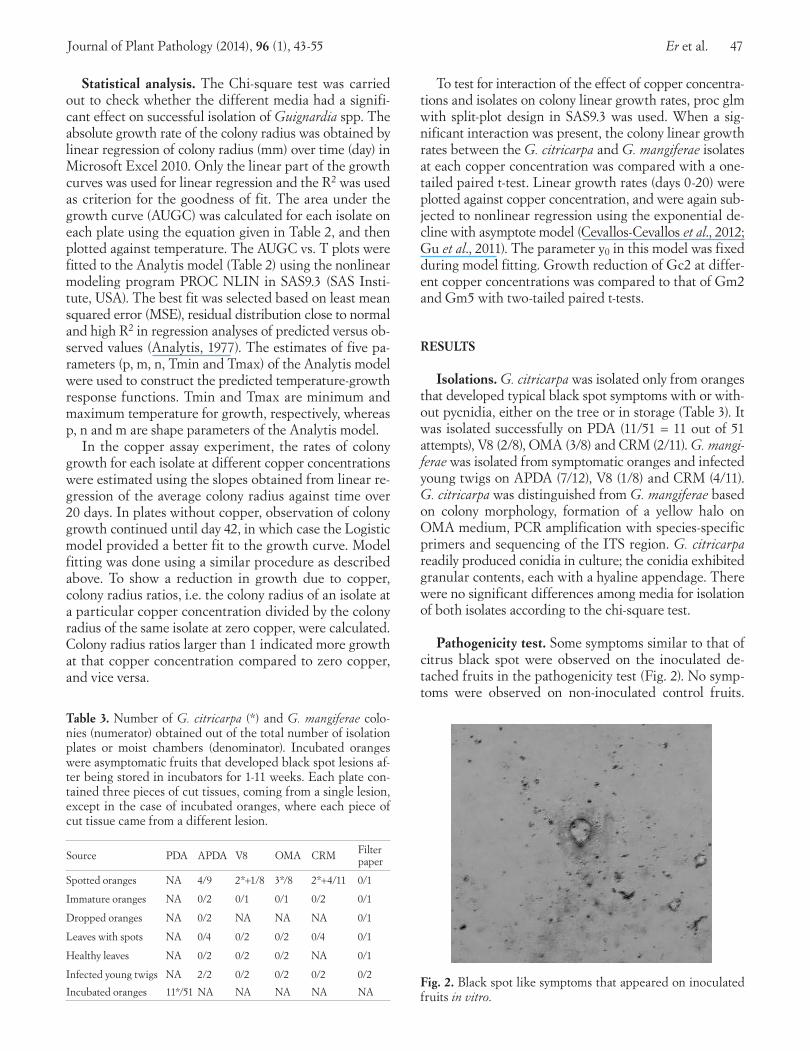
Pathogenicity test. Some symptoms similar to that of citrus black spot were observed on the inoculated de-tached fruits in the pathogenicity test (Fig. 2). No symp-toms were observed on non-inoculated control fruits.
Table 3. Number of G. citricarpa (*) and G. mangiferae colo-nies (numerator) obtained out of the total number of isolation plates or moist chambers (denominator). Incubated oranges were asymptomatic fruits that developed black spot lesions af-ter being stored in incubators for 1-11 weeks. Each plate con-tained three pieces of cut tissues, coming from a single lesion, except in the case of incubated oranges, where each piece of cut tissue came from a different lesion.
Source PDA APDA V8 OMA CRM Filter paper
Spotted oranges NA 4/9 2*+1/8 3*/8 2*+4/11 0/1
Immature oranges NA 0/2 0/1 0/1 0/2 0/1
Dropped oranges NA 0/2 NA NA NA 0/1
Leaves with spots NA 0/4 0/2 0/2 0/4 0/1
Healthy leaves NA 0/2 0/2 0/2 NA 0/1
Infected young twigs NA 2/2 0/2 0/2 0/2 0/2
Incubated oranges 11*/51 NA NA NA NA NAFig. 2. Black spot like symptoms that appeared on inoculated fruits in vitro.
48 Characterization of Guignardia spp. from Florida Journal of Plant Pathology (2014), 96 (1), 43-55
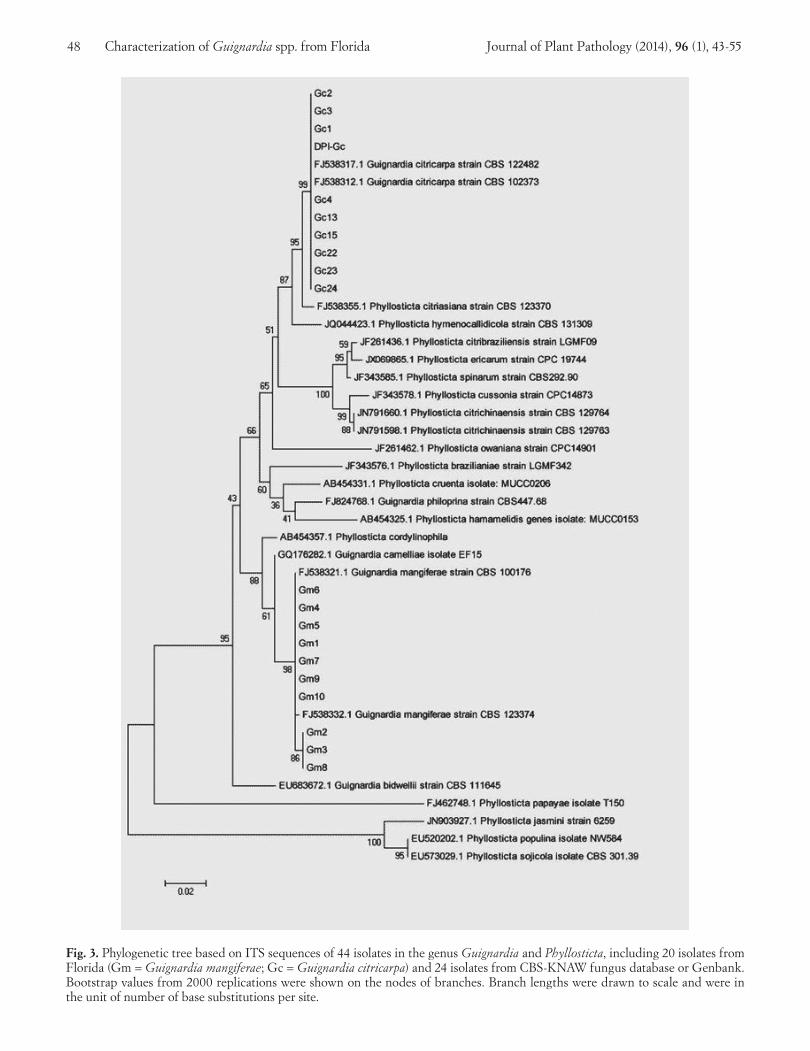
Fig. 3. Phylogenetic tree based on ITS sequences of 44 isolates in the genus Guignardia and Phyllosticta, including 20 isolates from Florida (Gm = Guignardia mangiferae; Gc = Guignardia citricarpa) and 24 isolates from CBS-KNAW fungus database or Genbank. Bootstrap values from 2000 replications were shown on the nodes of branches. Branch lengths were drawn to scale and were in the unit of number of base substitutions per site.
Journal of Plant Pathology (2014), 96 (1), 43-55 Er et al. 49
However, no G. citricarpa was successfully recovered from those observed lesions.
Phylogenetic analysis. ITS sequences of the isolates were aligned with the same and closely related species deposited in the fungal data bases of the Centraal Bureau voor Schimmelcultures (CBS) and GenBank. Phylogenetic trees constructed with the neighbour-joining method and the maximum likelihood method had similar topology, therefore only the neighbour-joining tree is presented here (Fig. 3). The phylogenetic tree showed that all G. citricarpa isolates had an ITS rDNA sequence identical to G. citri-carpa strains CBS122482 (from Citrus aurantium fruit in Zimbabwe), CBS102373 (from Citrus sinensis fruit in Bra-zil), and a strain DPI Gc, provided by the Division of Plant Industry (DPI) of Gainesville (FL, USA). forming a clade with a bootstrap support value of 99. The G. citricarpa isolates were closely related to Phyllosticta citriasiana and Phyllosticta hymenocallidicola, pathogens on citrus and lily, respectively. All the G. mangiferae isolates formed a well-supported clade (bootstrap support = 98) that was distinct from the G. citricarpa strains. There was more variation in
the ITS region among the G. mangiferae isolates compared to the G. citricarpa isolates. Two reference isolates of G. mangiferae, CBS100176 (from Citrus sp. leaf in Brazil) and CBS123374 (from Citrus maxima in Thailand), were dif-ferent for two bps in the ITS1 region. There were two dis-tinct groups of isolates from Florida. Gm2, Gm3 and Gm8 formed one clade with bootstrap percentage of 86 within the G. mangiferae clade, making them different from the rest of the G. mangiferae isolates. There was one bp differ-ence between the two groups in the 18S rRNA region. All sequences used in this study were submitted to GenBank (KC311447-KC311466).
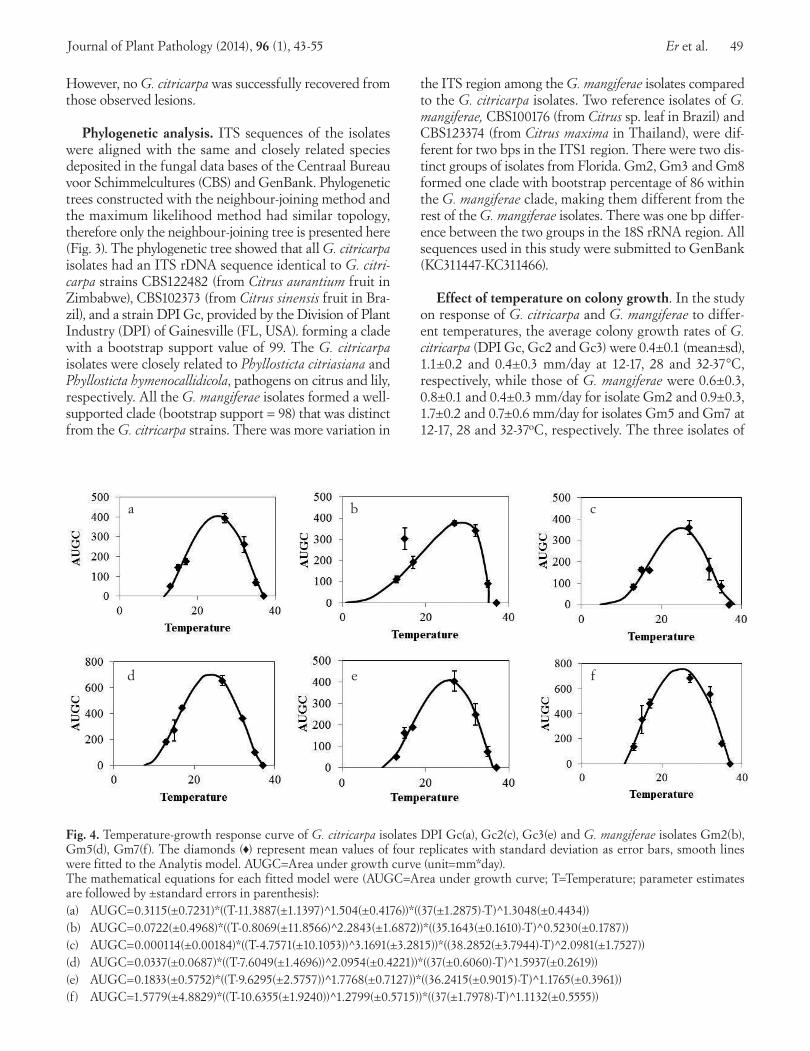
Effect of temperature on colony growth. In the study on response of G. citricarpa and G. mangiferae to differ-ent temperatures, the average colony growth rates of G. citricarpa (DPI Gc, Gc2 and Gc3) were 0.4±0.1 (mean±sd), 1.1±0.2 and 0.4±0.3 mm/day at 12-17, 28 and 32-37°C, respectively, while those of G. mangiferae were 0.6±0.3, 0.8±0.1 and 0.4±0.3 mm/day for isolate Gm2 and 0.9±0.3, 1.7±0.2 and 0.7±0.6 mm/day for isolates Gm5 and Gm7 at 12-17, 28 and 32-37oC, respectively. The three isolates of
Fig. 4. Temperature-growth response curve of G. citricarpa isolates DPI Gc(a), Gc2(c), Gc3(e) and G. mangiferae isolates Gm2(b), Gm5(d), Gm7(f). The diamonds (♦) represent mean values of four replicates with standard deviation as error bars, smooth lines were fitted to the Analytis model. AUGC=Area under growth curve (unit=mm*day). The mathematical equations for each fitted model were (AUGC=Area under growth curve; T=Temperature; parameter estimates are followed by ±standard errors in parenthesis): (a) AUGC=0.3115(±0.7231)*((T-11.3887(±1.1397) 1̂.504(±0.4176))*((37(±1.2875)-T) 1̂.3048(±0.4434))(b) AUGC=0.0722(±0.4968)*((T-0.8069(±11.8566)^2.2843(±1.6872))*((35.1643(±0.1610)-T)^0.5230(±0.1787))(c) AUGC=0.000114(±0.00184)*((T-4.7571(±10.1053))^3.1691(±3.2815))*((38.2852(±3.7944)-T)^2.0981(±1.7527))(d) AUGC=0.0337(±0.0687)*((T-7.6049(±1.4696))^2.0954(±0.4221))*((37(±0.6060)-T) 1̂.5937(±0.2619))(e) AUGC=0.1833(±0.5752)*((T-9.6295(±2.5757)) 1̂.7768(±0.7127))*((36.2415(±0.9015)-T) 1̂.1765(±0.3961))(f) AUGC=1.5779(±4.8829)*((T-10.6355(±1.9240)) 1̂.2799(±0.5715))*((37(±1.7978)-T) 1̂.1132(±0.5555))
a
d
b
e
c
f
50 Characterization of Guignardia spp. from Florida Journal of Plant Pathology (2014), 96 (1), 43-55
G. citricarpa, DPI Gc, Gc2 and Gc3, had a similar tem-perature optimum curve for AUGC (Fig. 4a, 4c, 4e). The optimal temperature was around 26°C, the minimum tem-perature was between 5 and 11.4°C, while the maximum temperature was between 36.2-38.3°C. More variation was observed among the three isolates of G. mangiferae, Gm2, Gm5 and Gm7 (Fig. 4b, 4d, 4f). Gm2 was different from Gm5 and Gm7 in that it had a smaller maximum AUGC and a higher optimal temperature, i.e. 375.6 compared to 653.7 and 681.8 at 30°C, 25°C and 26°C for Gm5 and Gm7, respectively. Moreover, it had a wider temperature range for growth (from 1 to 35.2°C as predicted by the An-alytis model), but a lower maximum temperature than all other strains. Growth of Gm2 at 15°C was similar to that at the optimal temperature 27°C, making it an outlier, so that it was not included for model fitting. This was a fur-ther indication of a broader adaptability of this isolate to lower temperatures. Gm5 and Gm7 were more similar to each other in terms of AUGC at the optimal temperature
25-26°C, minimum temperature (7.6 and 10.6°C, respec-tively), and maximum temperature (37°C for both).
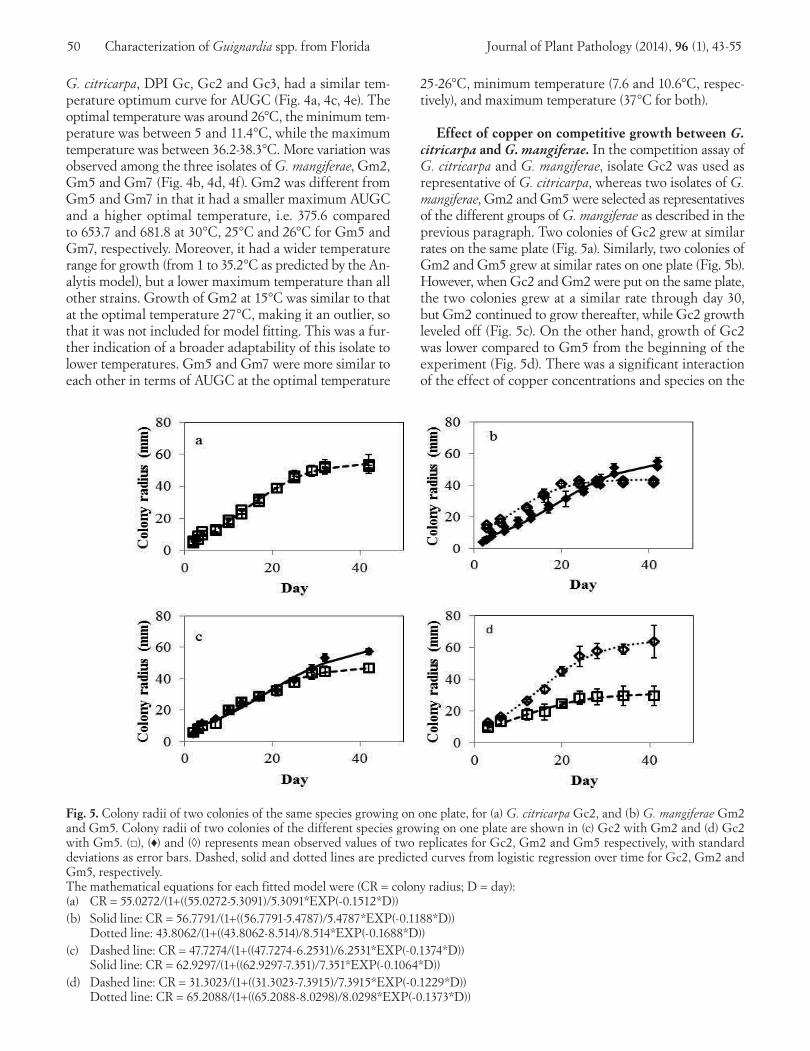
Effect of copper on competitive growth between G. citricarpa and G. mangiferae. In the competition assay of G. citricarpa and G. mangiferae, isolate Gc2 was used as representative of G. citricarpa, whereas two isolates of G. mangiferae, Gm2 and Gm5 were selected as representatives of the different groups of G. mangiferae as described in the previous paragraph. Two colonies of Gc2 grew at similar rates on the same plate (Fig. 5a). Similarly, two colonies of Gm2 and Gm5 grew at similar rates on one plate (Fig. 5b). However, when Gc2 and Gm2 were put on the same plate, the two colonies grew at a similar rate through day 30, but Gm2 continued to grow thereafter, while Gc2 growth leveled off (Fig. 5c). On the other hand, growth of Gc2 was lower compared to Gm5 from the beginning of the experiment (Fig. 5d). There was a significant interaction of the effect of copper concentrations and species on the
Fig. 5. Colony radii of two colonies of the same species growing on one plate, for (a) G. citricarpa Gc2, and (b) G. mangiferae Gm2 and Gm5. Colony radii of two colonies of the different species growing on one plate are shown in (c) Gc2 with Gm2 and (d) Gc2 with Gm5. (□), (♦) and (◊) represents mean observed values of two replicates for Gc2, Gm2 and Gm5 respectively, with standard deviations as error bars. Dashed, solid and dotted lines are predicted curves from logistic regression over time for Gc2, Gm2 and Gm5, respectively. The mathematical equations for each fitted model were (CR = colony radius; D = day):(a) CR = 55.0272/(1+((55.0272-5.3091)/5.3091*EXP(-0.1512*D))(b) Solid line: CR = 56.7791/(1+((56.7791-5.4787)/5.4787*EXP(-0.1188*D)) Dotted line: 43.8062/(1+((43.8062-8.514)/8.514*EXP(-0.1688*D))(c) Dashed line: CR = 47.7274/(1+((47.7274-6.2531)/6.2531*EXP(-0.1374*D)) Solid line: CR = 62.9297/(1+((62.9297-7.351)/7.351*EXP(-0.1064*D))(d) Dashed line: CR = 31.3023/(1+((31.3023-7.3915)/7.3915*EXP(-0.1229*D)) Dotted line: CR = 65.2088/(1+((65.2088-8.0298)/8.0298*EXP(-0.1373*D))
Journal of Plant Pathology (2014), 96 (1), 43-55 Er et al. 51
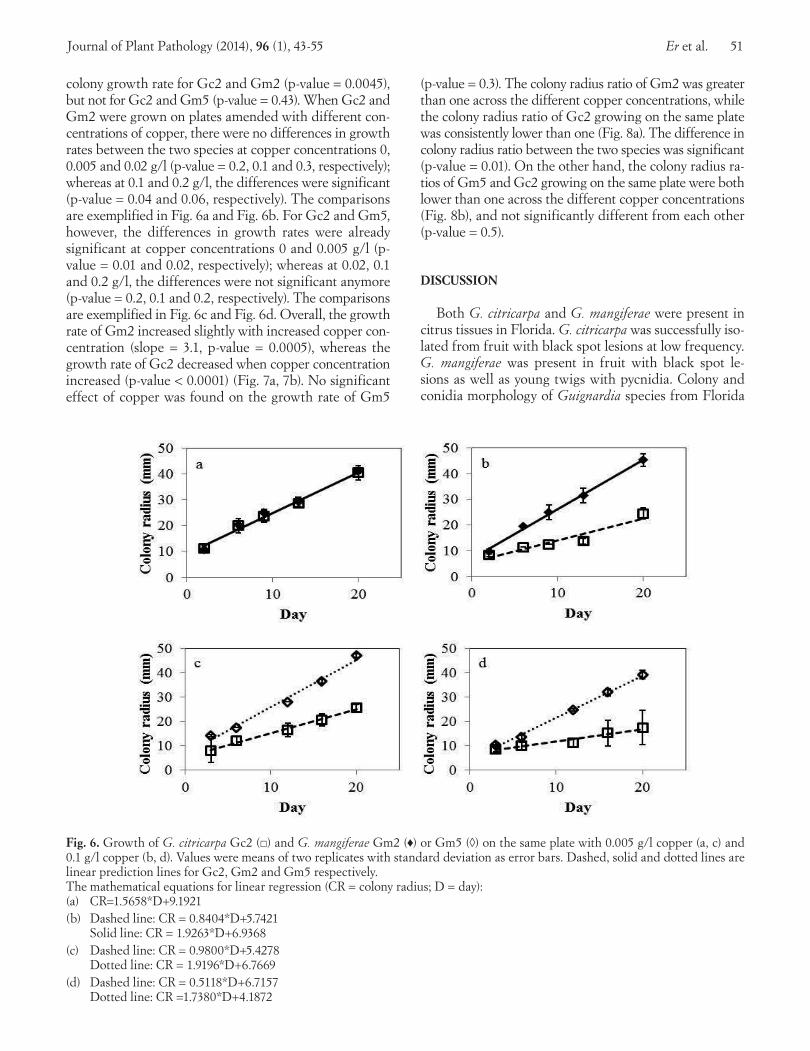
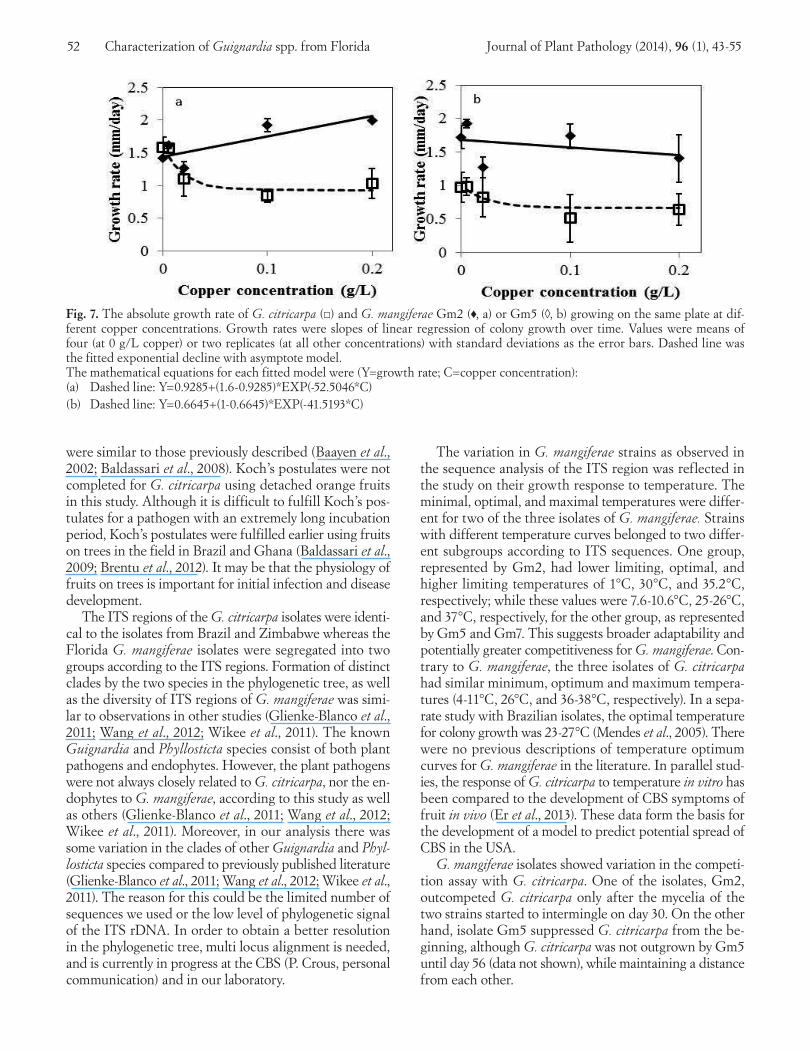
colony growth rate for Gc2 and Gm2 (p-value = 0.0045), but not for Gc2 and Gm5 (p-value = 0.43). When Gc2 and Gm2 were grown on plates amended with different con-centrations of copper, there were no differences in growth rates between the two species at copper concentrations 0, 0.005 and 0.02 g/l (p-value = 0.2, 0.1 and 0.3, respectively); whereas at 0.1 and 0.2 g/l, the differences were significant (p-value = 0.04 and 0.06, respectively). The comparisons are exemplified in Fig. 6a and Fig. 6b. For Gc2 and Gm5, however, the differences in growth rates were already significant at copper concentrations 0 and 0.005 g/l (p-value = 0.01 and 0.02, respectively); whereas at 0.02, 0.1 and 0.2 g/l, the differences were not significant anymore (p-value = 0.2, 0.1 and 0.2, respectively). The comparisons are exemplified in Fig. 6c and Fig. 6d. Overall, the growth rate of Gm2 increased slightly with increased copper con-centration (slope = 3.1, p-value = 0.0005), whereas the growth rate of Gc2 decreased when copper concentration increased (p-value < 0.0001) (Fig. 7a, 7b). No significant effect of copper was found on the growth rate of Gm5
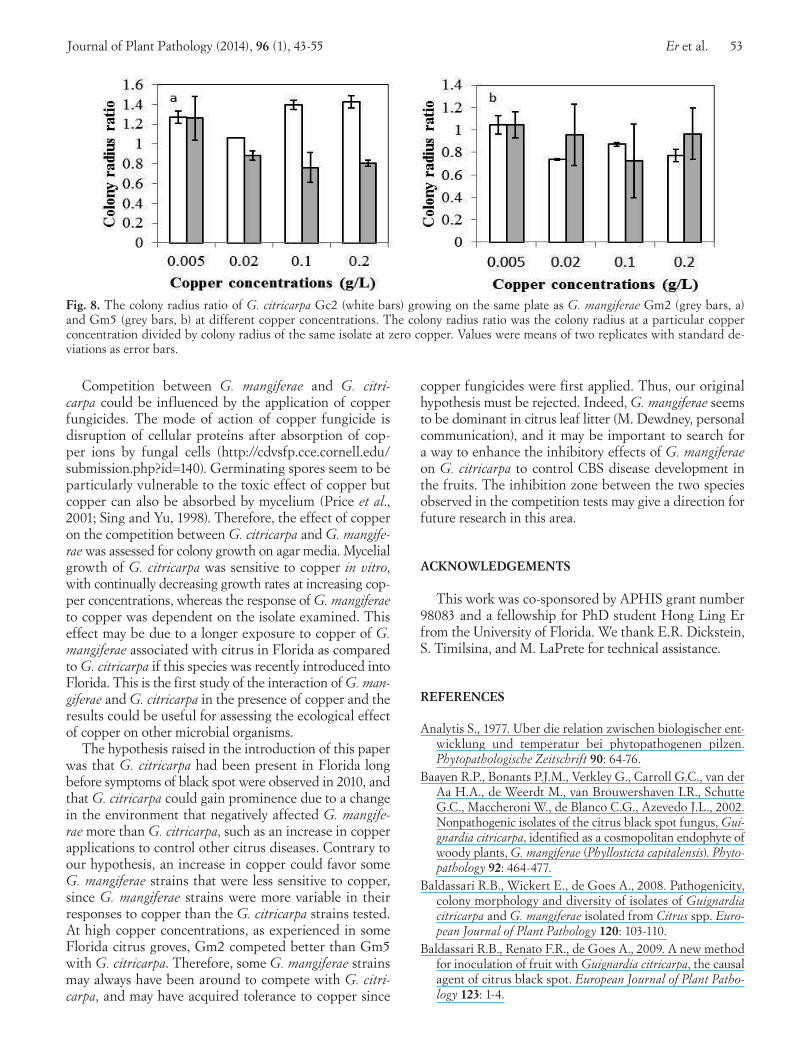
(p-value = 0.3). The colony radius ratio of Gm2 was greater than one across the different copper concentrations, while the colony radius ratio of Gc2 growing on the same plate was consistently lower than one (Fig. 8a). The difference in colony radius ratio between the two species was significant (p-value = 0.01). On the other hand, the colony radius ra-tios of Gm5 and Gc2 growing on the same plate were both lower than one across the different copper concentrations (Fig. 8b), and not significantly different from each other (p-value = 0.5).
DISCUSSION
Both G. citricarpa and G. mangiferae were present in citrus tissues in Florida. G. citricarpa was successfully iso-lated from fruit with black spot lesions at low frequency. G. mangiferae was present in fruit with black spot le-sions as well as young twigs with pycnidia. Colony and conidia morphology of Guignardia species from Florida
Fig. 6. Growth of G. citricarpa Gc2 (□) and G. mangiferae Gm2 (♦) or Gm5 (◊) on the same plate with 0.005 g/l copper (a, c) and 0.1 g/l copper (b, d). Values were means of two replicates with standard deviation as error bars. Dashed, solid and dotted lines are linear prediction lines for Gc2, Gm2 and Gm5 respectively. The mathematical equations for linear regression (CR = colony radius; D = day):(a) CR=1.5658*D+9.1921 (b) Dashed line: CR = 0.8404*D+5.7421 Solid line: CR = 1.9263*D+6.9368 (c) Dashed line: CR = 0.9800*D+5.4278 Dotted line: CR = 1.9196*D+6.7669(d) Dashed line: CR = 0.5118*D+6.7157 Dotted line: CR =1.7380*D+4.1872
52 Characterization of Guignardia spp. from Florida Journal of Plant Pathology (2014), 96 (1), 43-55
were similar to those previously described (Baayen et al., 2002; Baldassari et al., 2008). Koch’s postulates were not completed for G. citricarpa using detached orange fruits in this study. Although it is difficult to fulfill Koch’s pos-tulates for a pathogen with an extremely long incubation period, Koch’s postulates were fulfilled earlier using fruits on trees in the field in Brazil and Ghana (Baldassari et al., 2009; Brentu et al., 2012). It may be that the physiology of fruits on trees is important for initial infection and disease development.
The ITS regions of the G. citricarpa isolates were identi-cal to the isolates from Brazil and Zimbabwe whereas the Florida G. mangiferae isolates were segregated into two groups according to the ITS regions. Formation of distinct clades by the two species in the phylogenetic tree, as well as the diversity of ITS regions of G. mangiferae was simi-lar to observations in other studies (Glienke-Blanco et al., 2011; Wang et al., 2012; Wikee et al., 2011). The known Guignardia and Phyllosticta species consist of both plant pathogens and endophytes. However, the plant pathogens were not always closely related to G. citricarpa, nor the en-dophytes to G. mangiferae, according to this study as well as others (Glienke-Blanco et al., 2011; Wang et al., 2012; Wikee et al., 2011). Moreover, in our analysis there was some variation in the clades of other Guignardia and Phyl-losticta species compared to previously published literature (Glienke-Blanco et al., 2011; Wang et al., 2012; Wikee et al., 2011). The reason for this could be the limited number of sequences we used or the low level of phylogenetic signal of the ITS rDNA. In order to obtain a better resolution in the phylogenetic tree, multi locus alignment is needed, and is currently in progress at the CBS (P. Crous, personal communication) and in our laboratory.
The variation in G. mangiferae strains as observed in the sequence analysis of the ITS region was reflected in the study on their growth response to temperature. The minimal, optimal, and maximal temperatures were differ-ent for two of the three isolates of G. mangiferae. Strains with different temperature curves belonged to two differ-ent subgroups according to ITS sequences. One group, represented by Gm2, had lower limiting, optimal, and higher limiting temperatures of 1°C, 30°C, and 35.2°C, respectively; while these values were 7.6-10.6°C, 25-26°C, and 37°C, respectively, for the other group, as represented by Gm5 and Gm7. This suggests broader adaptability and potentially greater competitiveness for G. mangiferae. Con-trary to G. mangiferae, the three isolates of G. citricarpa had similar minimum, optimum and maximum tempera-tures (4-11°C, 26°C, and 36-38°C, respectively). In a sepa-rate study with Brazilian isolates, the optimal temperature for colony growth was 23-27°C (Mendes et al., 2005). There were no previous descriptions of temperature optimum curves for G. mangiferae in the literature. In parallel stud-ies, the response of G. citricarpa to temperature in vitro has been compared to the development of CBS symptoms of fruit in vivo (Er et al., 2013). These data form the basis for the development of a model to predict potential spread of CBS in the USA.
G. mangiferae isolates showed variation in the competi-tion assay with G. citricarpa. One of the isolates, Gm2, outcompeted G. citricarpa only after the mycelia of the two strains started to intermingle on day 30. On the other hand, isolate Gm5 suppressed G. citricarpa from the be-ginning, although G. citricarpa was not outgrown by Gm5 until day 56 (data not shown), while maintaining a distance from each other.
Fig. 7. The absolute growth rate of G. citricarpa (□) and G. mangiferae Gm2 (♦, a) or Gm5 (◊, b) growing on the same plate at dif-ferent copper concentrations. Growth rates were slopes of linear regression of colony growth over time. Values were means of four (at 0 g/L copper) or two replicates (at all other concentrations) with standard deviations as the error bars. Dashed line was the fitted exponential decline with asymptote model. The mathematical equations for each fitted model were (Y=growth rate; C=copper concentration): (a) Dashed line: Y=0.9285+(1.6-0.9285)*EXP(-52.5046*C)(b) Dashed line: Y=0.6645+(1-0.6645)*EXP(-41.5193*C)
Journal of Plant Pathology (2014), 96 (1), 43-55 Er et al. 53
Competition between G. mangiferae and G. citri-carpa could be influenced by the application of copper fungicides. The mode of action of copper fungicide is disruption of cellular proteins after absorption of cop-per ions by fungal cells (http://cdvsfp.cce.cornell.edu/submission.php?id=140). Germinating spores seem to be particularly vulnerable to the toxic effect of copper but copper can also be absorbed by mycelium (Price et al., 2001; Sing and Yu, 1998). Therefore, the effect of copper on the competition between G. citricarpa and G. mangife-rae was assessed for colony growth on agar media. Mycelial growth of G. citricarpa was sensitive to copper in vitro, with continually decreasing growth rates at increasing cop-per concentrations, whereas the response of G. mangiferae to copper was dependent on the isolate examined. This effect may be due to a longer exposure to copper of G. mangiferae associated with citrus in Florida as compared to G. citricarpa if this species was recently introduced into Florida. This is the first study of the interaction of G. man-giferae and G. citricarpa in the presence of copper and the results could be useful for assessing the ecological effect of copper on other microbial organisms.
The hypothesis raised in the introduction of this paper was that G. citricarpa had been present in Florida long before symptoms of black spot were observed in 2010, and that G. citricarpa could gain prominence due to a change in the environment that negatively affected G. mangife-rae more than G. citricarpa, such as an increase in copper applications to control other citrus diseases. Contrary to our hypothesis, an increase in copper could favor some G. mangiferae strains that were less sensitive to copper, since G. mangiferae strains were more variable in their responses to copper than the G. citricarpa strains tested. At high copper concentrations, as experienced in some Florida citrus groves, Gm2 competed better than Gm5 with G. citricarpa. Therefore, some G. mangiferae strains may always have been around to compete with G. citri-carpa, and may have acquired tolerance to copper since
copper fungicides were first applied. Thus, our original hypothesis must be rejected. Indeed, G. mangiferae seems to be dominant in citrus leaf litter (M. Dewdney, personal communication), and it may be important to search for a way to enhance the inhibitory effects of G. mangiferae on G. citricarpa to control CBS disease development in the fruits. The inhibition zone between the two species observed in the competition tests may give a direction for future research in this area.
ACKNOWLEDGEMENTS
This work was co-sponsored by APHIS grant number 98083 and a fellowship for PhD student Hong Ling Er from the University of Florida. We thank E.R. Dickstein, S. Timilsina, and M. LaPrete for technical assistance.
REFERENCES
Analytis S., 1977. Uber die relation zwischen biologischer ent-wicklung und temperatur bei phytopathogenen pilzen. Phytopathologische Zeitschrift 90: 64-76.
Baayen R.P., Bonants P.J.M., Verkley G., Carroll G.C., van der Aa H.A., de Weerdt M., van Brouwershaven I.R., Schutte G.C., Maccheroni W., de Blanco C.G., Azevedo J.L., 2002. Nonpathogenic isolates of the citrus black spot fungus, Gui-gnardia citricarpa, identified as a cosmopolitan endophyte of woody plants, G. mangiferae (Phyllosticta capitalensis). Phyto-pathology 92: 464-477.
Baldassari R.B., Wickert E., de Goes A., 2008. Pathogenicity, colony morphology and diversity of isolates of Guignardia citricarpa and G. mangiferae isolated from Citrus spp. Euro-pean Journal of Plant Pathology 120: 103-110.
Baldassari R.B., Renato F.R., de Goes A., 2009. A new method for inoculation of fruit with Guignardia citricarpa, the causal agent of citrus black spot. European Journal of Plant Patho-logy 123: 1-4.
Fig. 8. The colony radius ratio of G. citricarpa Gc2 (white bars) growing on the same plate as G. mangiferae Gm2 (grey bars, a) and Gm5 (grey bars, b) at different copper concentrations. The colony radius ratio was the colony radius at a particular copper concentration divided by colony radius of the same isolate at zero copper. Values were means of two replicates with standard de-viations as error bars.
54 Characterization of Guignardia spp. from Florida Journal of Plant Pathology (2014), 96 (1), 43-55
Bellotte J.A.M., Kupper K.C., Rinaldo D., de Souza A., Pereira F.D., de Goes A., 2009. Acceleration of the decomposition of Sicilian lemon leaves as an auxiliary measure in the con-trol of citrus black spot. Tropical Plant Pathology 34: 71-76.
Brentu F.C., Oduro K.A., Offei S.K., Odamtten G.T., Vicent A., Peres N.A., Timmer L.W., 2012. Crop loss, aetiology, and epidemiology of citrus black spot in Ghana. European Journal of Plant Pathology 133: 657-670.
Cevallos-Cevallos J.M., Gu G., Danyluk M.D., Dufault N.S., van Bruggen A.H.C., 2012. Salmonella can reach tomato fruits on plants exposed to aerosols formed by rain. Interna-tional Journal of Food Microbiology 158: 140-146.
Chiyaka C., Singer B.H., Halbert S.E., Morris J.G., van Bruggen A.H.C., 2012. Modeling huanglongbing transmission within a citrus tree. Proceedings of the National Academy of Sciences USA 109: 12213-12218.
Chung K.R., Peres N.A., Timmer L.W., 2005. Citrus diseases exotic to Florida: Black Spot. In: Fact Sheet PP-213. Plant Pathology Department, Florida Cooperative Extension Ser-vice, pp. 1-4. Institute of Food and Agricultural Science, University of Florida, Gainsville, FL, USA.
Er H.L., Roberts P.D., Marois J.J, van Bruggen A.H.C., 2013. Potential distribution of citrus black spot in the United States based on climatic conditions. European Journal of Plant Pathology 137: 635-647.
Everett K.R., Rees-George J., 2006. Reclassification of an isolate of Guignardia citricarpa from New Zealand as Guignardia mangiferae by sequence analysis. Plant Pathology 55: 194-199.
Glienke-Blanco C., Aguilar-Vildoso C.I., Vieira M.L.C., Bar-roso P.A.V., Azevedo J.L., 2002. Genetic variability in the endophytic fungus Guignardia citricarpa isolated from citrus plants. Genetics and Molecular Biology 25: 251-255.
Glienke-Blanco C., Pereira O.L., Stringari D., Fabris J., Kava-Cordeiro V., Galli-Terasawa L., Cunnington J., Shivas R.G., Groenewald J.Z., Crous P.W., 2011. Endophytic and patho-genic Phyllosticta species, with reference to those associated with Citrus Black Spot. Persoonia 26: 47-56.
Gu G., Hu J., Cevallos-Cevallos J.M., Richardson S.M., Bartz J.A., van Bruggen A.H.C., 2011. Internal colonization of Sal-monella enterica serovar Typhimurium in tomato plants. PLoS ONE 6: e27340.
Hall B.G., 2011. Phylogenetic Trees Made Easy: A How-to Manual. 4th Ed. Sinauer Associates, Publishers, Sunderland, MA, USA.
Hendricks K.E.M., Donahoo R.S., Roberts P.D., Christman M.C., 2013. Effect of copper on growth characteristics and disease control of the recently introduced Guignardia citri-carpa on citrus in Florida. American Journal of Plant Sciences 4: 282-290.
Holb I.J., Heijne B., Jeger M.J., 2005. The widespread occur-rence of overwintered conidial inoculum of Venturia inae-qualis on shoots and buds in organic and integrated apple orchards across the Netherlands. European Journal of Plant Pathology 111: 157-168.
Holb I.J., 2006. Effect of six sanitation treatments on leaf litter density, ascospore production of Venturia inaequalis and scab incidence in integrated and organic apple orchards. European Journal of Plant Pathology 115: 293-307.
Huang C.S., Chang S.L., 1972. Leaf infection with citrus black spot and perithecial development in relation to ascospore discharge of Guignardia citricarpa Kiely. Journal of Taiwan Agricultural Research 21: 256-263.
Kotze J.M., 1981. Epidemiology and control of citrus black spot in South Africa. Plant Disease Reporter 65: 945-950.
Marques J.P.R., Sposito M.B., Silveira Mello A.F., Amorim L., Mondin M., Appezzato-da-Gloria B., 2012. Histopathology of black spot symptoms in sweet oranges. European Journal of Plant Pathology 133: 439-448.
McOnie K.C., 1967. Germination and infection of citrus by as-cospores of Guignardia citricarpa in relation to control of black spot. Phytopathology 57: 743-746.
Mendes D., dos Reis R.F., de Oca A.G.M., Pereira G.T., de Goes A., 2005. Aspectos nutricionais e físicos no crescimen-to micelial, esporulação e germinação de conidios de Phyl-losticta citricarpa (=Guignardia citricarpa), agente causal da mancha preta dos frutos cítricos. Summa Phytopathologica 31: 349-357.
Meyer L., Sanders G.M., Jacobs R., Korsten L., 2006. A one-day sensitive method to detect and distinguish between the cit-rus black spot pathogen Guignardia citricarpa and the endo-phyte Guignardia mangiferae. Plant Disease 90: 97-101.
Paul I., van Jaarsveld A.S., Korsten L., Hattingh V., 2005. The potential global geographical distribution of Citrus Black Spot caused by Guignardia citricarpa (Kiely): likelihood of disease establishment in the European Union. Crop Protec-tion 24: 297-308.
Price M.S., Classen J. J., Payne G.A., 2001. Apergillus niger ab-sorbs copper and zinc from swine wastewater. Bioresource Technology 77: 41-49.
Possiede Y.M., Gabardo J., Kava-Cordeiro V., Galli-Terasawa L.V., Azevedo J.L., Glienke-Blanco C., 2009. Fungicide re-sistance and genetic variability in plant pathogenic strains of Guignardia citricarpa. Brazilian Journal of Microbiology 40: 308-313.
Ramao A.S., Sposito M.B., Andreote F.D., Azevedo J.L., Arau-jo W.L., 2011. Enzymatic differences between the endophyte Guignardia mangiferae (Botryosphaeriaceae) and the citrus pathogen G. citricarpa. Genetics and Molecular Research 10: 243-252.
Schoulties C.L., Civerolo E.L., Miller J.W., Stall R.E., Krass C.J., Poe S.R., DuCharme E.P., 1987. Citrus canker in Flor-ida. Plant Disease 71: 388-395.
Schubert T.S., Dewdney M.M., Peres N.A., Palm M.E., Jey-aprakash A., Sutton B., Mondal S.N., Wang N.Y., Rascoe J., Picton D.D., 2012. First report of Guignardia citricarpa as-sociated with citrus black spot on sweet orange (Citrus sinen-sis) in North America. Plant Disease 96: 1225.
Schubert T.S., Sutton B., Jeyaprakash A., 2010. Citrus black spot (Guignardia citricarpa) discovered in Florida. In: Pest Alert DACS-P-01723. Florida Department of Agriculture and Consumer Services, Division of Plant Industry, Gaines-ville, FL, USA.
Sing Y., Yu J., 1998. Copper absorption and removal from water by living mycelium of white-rot fungus Phanerochaete chryso-sporium. Water Research 32: 2746-2752.
Journal of Plant Pathology (2014), 96 (1), 43-55 Er et al. 55
Singleton L.L., Mihail J.D., Rush C.M., 1992. Soilborne Phyto-pathogenic Fungi. 1st Ed. APS Press, St. Paul, MN, USA.
USDA-NASS, 2011. Citrus total 2011 statistic. U.S. Department of Agriculture, National Agriculture Statistics Service. Last accessed online 9/18/12 at http://www.nass.usda.gov/Statis-tics_by_Subject/result.php?BCFC6A17-041B-3518-9BCD-C7E1F2C248B6§or=CROPS&group=FRUIT%20%26%20TREE%20NUTS&comm=CITRUS%20TOTALS.
Wang X., Chen G., Huang F., Zhang J., Hyde K.D., Li H., 2012. Phyllosticta species associated with citrus diseases in China.
Fungal Diversity 52: 209-224.White T.J., Bruns T., Lee S., Taylor J., 1990. Amplification and
direct sequencing of fungal ribosomal RNA genes for phy-logenetics. In: Innis M.A., Gelfand D.H., Sninsky J.J., White T.J. (eds). PCR Protocols: a Guide to Methods and Applica-tions, pp. 315-322. Academic Press, New York, NY, USA.
Wikee S., Udayanga D., Crous P.W., Chukeatirote E., McKenzie E.H.C., Bahkali A.H., Dai D., Hyde K.D., 2011. Phyllosticta – an overview of current status of species recognition. Fungal Diversity 51:43-61.
Received December 28, 2012 Accepted August 15, 2013

Related Documents