Isochore chromosome maps of the human genome Jose ´ L. Oliver a, * , Pedro Carpena b , Ramo ´n Roma ´n-Rolda ´n c , Trinidad Mata-Balaguer a , Andre ´s Mejı ´as-Romero a , Michael Hackenberg a , Pedro Bernaola-Galva ´n b a Departamento de Gene ´tica, Instituto de Biotecnologı ´a, Universidad de Granada, Granada, Spain b Departamento de Fı ´sica Aplicada II, Universidad de Ma ´laga, Ma ´laga, Spain c Departamento de Fı ´sica Aplicada, Universidad de Granada, Ma ´laga, Spain Received 21 December 2001; received in revised form 19 August 2002; accepted 18 September 2002 Abstract The human genome is a mosaic of isochores, which are long DNA segments ( q 300 kbp) relatively homogeneous in G þ C. Human isochores were first identified by density-gradient ultracentrifugation of bulk DNA, and differ in important features, e.g. genes are found predominantly in the GC-richest isochores. Here, we use a reliable segmentation method to partition the longest contigs in the human genome draft sequence into long homogeneous genome regions (LHGRs), thereby revealing the isochore structure of the human genome. The advantages of the isochore maps presented here are: (1) sequence heterogeneities at different scales are shown in the same plot; (2) pair-wise compositional differences between adjacent regions are all statistically significant; (3) isochore boundaries are accurately defined to single base pair resolution; and (4) both gradual and abrupt isochore boundaries are simultaneously revealed. Taking advantage of the wide sample of genome sequence analyzed, we investigate the correspondence between LHGRs and true human isochores revealed through DNA centrifugation. LHGRs show many of the typical isochore features, mainly size distribution, G þ C range, and proportions of the isochore classes. The relative density of genes, Alu and long interspersed nuclear element repeats and the different types of single nucleotide polymorphisms on LHGRs also coincide with expectations in true isochores. Potential applications of isochore maps range from the improvement of gene-finding algorithms to the prediction of linkage disequilibrium levels in association studies between marker genes and complex traits. The coordinates for the LHGRs identified in all the contigs longer than 2 Mb in the human genome sequence are available at the online resource on isochore mapping: http://bioinfo2.ugr.es/isochores. q 2002 Elsevier Science B.V. All rights reserved. Keywords: Isochore maps; Compositional segmentation; Chromosome domains; Comparative genomics; Alus; Long interspersed nuclear elements; Single nucleotide polymorphisms 1. Introduction The availability of the human genome draft sequence offers an unprecedented opportunity to bring sequence patterns into line with the chromosome structures revealed by modern molecular cytogenetics, such as chromosome domains or high-resolution chromosome bands. Isochores – long DNA segments ( q 300 kbp) fairly homogeneous in G þ C, revealed by analytical ultracentrifugation of bulk DNA (Macaya et al., 1976; Bernardi et al., 1985; Bernardi, 1995, 2000) – may be the structures linking both organization levels. In fact, isochores have been success- fully related to chromosome bands (Saccone et al., 1993). One conventional way to visualize sequence heterogen- eity is the moving-window approach. This simple technique consists of sliding a window of arbitrary length along the sequence, and then computing the GC content of each window. This procedure dates from the earliest times of sequence analysis when only short, and often homogeneous, sequences were available. However, with the discovery that eukaryotic genomes are multi-scale complex systems made up of fairly homogeneous isochores of different composition (Macaya et al., 1976; Bernardi et al., 1985; Bernardi, 2000) and with the subsequent finding of long-range correlations in eukaryotic DNA sequences (Li and Kaneko, 1992; Peng et al., 1992; Voss, 1992; Bernaola-Galva ´n et al., 2002a), this 0141-933/02/$ - see front matter q 2002 Elsevier Science B.V. All rights reserved. PII: S0378-1119(02)01034-X Gene 300 (2002) 117–127 www.elsevier.com/locate/gene * Corresponding author. Departamento de Genetica, Facultad de Ciencias, Universidad de Granada, E-18071 Granada, Spain. Fax: þ 34- 958-244073. E-mail address: [email protected] (J.L. Oliver). Abbreviations: LHGR, long homogeneous genome region; bp, base pair; kbp, kilobase pair; G þ C, guanine plus cytosine content; SNP, single nucleotide polymorphism; MY, millions of years; SINE, short interspersed nuclear element; LINE, long interspersed nuclear element.

Welcome message from author
This document is posted to help you gain knowledge. Please leave a comment to let me know what you think about it! Share it to your friends and learn new things together.
Transcript
Isochore chromosome maps of the human genome
Jose L. Olivera,*, Pedro Carpenab, Ramon Roman-Roldanc, Trinidad Mata-Balaguera,Andres Mejıas-Romeroa, Michael Hackenberga, Pedro Bernaola-Galvanb
aDepartamento de Genetica, Instituto de Biotecnologıa, Universidad de Granada, Granada, SpainbDepartamento de Fısica Aplicada II, Universidad de Malaga, Malaga, SpaincDepartamento de Fısica Aplicada, Universidad de Granada, Malaga, Spain
Received 21 December 2001; received in revised form 19 August 2002; accepted 18 September 2002
Abstract
The human genome is a mosaic of isochores, which are long DNA segments ( q 300 kbp) relatively homogeneous in G þ C. Human
isochores were first identified by density-gradient ultracentrifugation of bulk DNA, and differ in important features, e.g. genes are found
predominantly in the GC-richest isochores. Here, we use a reliable segmentation method to partition the longest contigs in the human genome
draft sequence into long homogeneous genome regions (LHGRs), thereby revealing the isochore structure of the human genome. The
advantages of the isochore maps presented here are: (1) sequence heterogeneities at different scales are shown in the same plot; (2) pair-wise
compositional differences between adjacent regions are all statistically significant; (3) isochore boundaries are accurately defined to single
base pair resolution; and (4) both gradual and abrupt isochore boundaries are simultaneously revealed. Taking advantage of the wide sample
of genome sequence analyzed, we investigate the correspondence between LHGRs and true human isochores revealed through DNA
centrifugation. LHGRs show many of the typical isochore features, mainly size distribution, G þ C range, and proportions of the isochore
classes. The relative density of genes, Alu and long interspersed nuclear element repeats and the different types of single nucleotide
polymorphisms on LHGRs also coincide with expectations in true isochores. Potential applications of isochore maps range from the
improvement of gene-finding algorithms to the prediction of linkage disequilibrium levels in association studies between marker genes and
complex traits. The coordinates for the LHGRs identified in all the contigs longer than 2 Mb in the human genome sequence are available at
the online resource on isochore mapping: http://bioinfo2.ugr.es/isochores. q 2002 Elsevier Science B.V. All rights reserved.
Keywords: Isochore maps; Compositional segmentation; Chromosome domains; Comparative genomics; Alus; Long interspersed nuclear elements; Single
nucleotide polymorphisms
1. Introduction
The availability of the human genome draft sequence
offers an unprecedented opportunity to bring sequence
patterns into line with the chromosome structures revealed
by modern molecular cytogenetics, such as chromosome
domains or high-resolution chromosome bands. Isochores –
long DNA segments ( q 300 kbp) fairly homogeneous in
G þ C, revealed by analytical ultracentrifugation of bulk
DNA (Macaya et al., 1976; Bernardi et al., 1985; Bernardi,
1995, 2000) – may be the structures linking both
organization levels. In fact, isochores have been success-
fully related to chromosome bands (Saccone et al., 1993).
One conventional way to visualize sequence heterogen-
eity is the moving-window approach. This simple technique
consists of sliding a window of arbitrary length along the
sequence, and then computing the GC content of each
window. This procedure dates from the earliest times of
sequence analysis when only short, and often homogeneous,
sequences were available. However, with the discovery that
eukaryotic genomes are multi-scale complex systems made
up of fairly homogeneous isochores of different composition
(Macaya et al., 1976; Bernardi et al., 1985; Bernardi, 2000)
and with the subsequent finding of long-range correlations
in eukaryotic DNA sequences (Li and Kaneko, 1992; Peng
et al., 1992; Voss, 1992; Bernaola-Galvan et al., 2002a), this
0141-933/02/$ - see front matter q 2002 Elsevier Science B.V. All rights reserved.
PII: S0 37 8 -1 11 9 (0 2) 01 0 34 -X
Gene 300 (2002) 117–127
www.elsevier.com/locate/gene
* Corresponding author. Departamento de Genetica, Facultad de
Ciencias, Universidad de Granada, E-18071 Granada, Spain. Fax: þ34-
958-244073.
E-mail address: [email protected] (J.L. Oliver).
Abbreviations: LHGR, long homogeneous genome region; bp, base
pair; kbp, kilobase pair; G þ C, guanine plus cytosine content; SNP, single
nucleotide polymorphism; MY, millions of years; SINE, short interspersed
nuclear element; LINE, long interspersed nuclear element.
practice becomes untenable. Sliding a window of arbitrary
length and step over long, heterogeneous and correlated
sequences may lead to misleading results (see Li, 2001, for a
recent review). However, GC-plots routinely accompany
the publication of every new genome sequence, the long-
range patterns being identified only by eye. This happens,
for example, with the ‘isochores’ tentatively identified on
human chromosomes 21 (Hattori et al., 2000) and 22
(Dunham et al., 1999).
Two other more recent techniques (Nekrutenko and Li,
2000; Haring and Kypr, 2001), also based on moving
windows, use the random (uncorrelated) model to test
sequence homogeneity. The pitfalls in such an approach
have already been noted (Bernardi, 2001; see also Li et al.,
2002). A key problem is that moving windows do not enable
the accurate location of isochore boundaries before carrying
out the homogeneity test. Therefore, it is not surprising that
one of these techniques (Nekrutenko and Li, 2000) failed to
detect the only isochore boundary experimentally charac-
terized to date (Fukagawa et al., 1995, 1996; Stephens et al.,
1999), while the other (Haring and Kypr, 2001) was unable
to detect any isochores in the human chromosomes 21 and
22.
An alternative tool to analyze genome heterogeneity is
compositional segmentation (Bernaola-Galvan et al., 1996,
2001; Li et al., 1998; Roman-Roldan et al., 1998; Oliver
et al., 1999, 2001; Li, 2001). Domains of all sizes can be
simultaneously detected by this method, and isochore
boundaries can be accurately determined to single base
pair resolution.
A recently derived hierarchical segmentation method
(Oliver et al., 2001; Roman-Roldan et al., 2002) is used here
to divide the longest contig of each human chromosome into
non-overlapping, relatively homogeneous genome regions,
called long homogeneous genome regions (LHGRs). To
investigate to what extent these regions may correspond to
the true isochores identified by the Bernardi group through
DNA centrifugation, we analyze here several LHGR
features, such as size distribution, G þ C range, and
proportions of the different compositional classes in a
wide sample of human genome sequence. We also analyzed
the relative densities of genes, Alu and long interspersed
nuclear element (LINE) repeats and the different types of
single nucleotide polymorphisms (SNPs) in these regions.
2. Materials and methods
Different freezes, from October 2001 to February 2002,
of the public human genome draft sequence available at
NCBI (Lander et al., 2001; ftp://ncbi.nlm.nih.gov/genomes/
H_sapiens) were used to compile information for different
parts of this work. All the contigs longer than 2 Mb in the
human genome were segmented using our hierarchical
algorithm (for a complete list see the online resource on
isochore mapping: http://bioinfo2.ugr.es/isochores). The
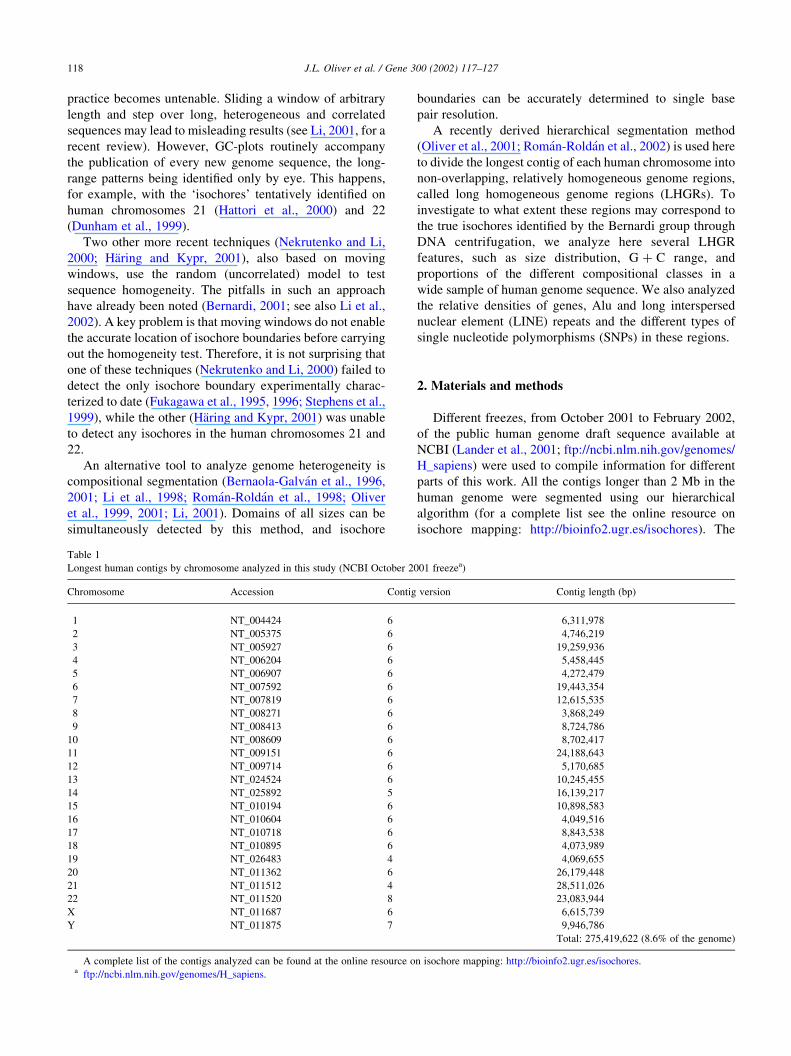
Table 1
Longest human contigs by chromosome analyzed in this study (NCBI October 2001 freezea)
Chromosome Accession Contig version Contig length (bp)
1 NT_004424 6 6,311,978
2 NT_005375 6 4,746,219
3 NT_005927 6 19,259,936
4 NT_006204 6 5,458,445
5 NT_006907 6 4,272,479
6 NT_007592 6 19,443,354
7 NT_007819 6 12,615,535
8 NT_008271 6 3,868,249
9 NT_008413 6 8,724,786
10 NT_008609 6 8,702,417
11 NT_009151 6 24,188,643
12 NT_009714 6 5,170,685
13 NT_024524 6 10,245,455
14 NT_025892 5 16,139,217
15 NT_010194 6 10,898,583
16 NT_010604 6 4,049,516
17 NT_010718 6 8,843,538
18 NT_010895 6 4,073,989
19 NT_026483 4 4,069,655
20 NT_011362 6 26,179,448
21 NT_011512 4 28,511,026
22 NT_011520 8 23,083,944
X NT_011687 6 6,615,739
Y NT_011875 7 9,946,786
Total: 275,419,622 (8.6% of the genome)
A complete list of the contigs analyzed can be found at the online resource on isochore mapping: http://bioinfo2.ugr.es/isochores.a ftp://ncbi.nlm.nih.gov/genomes/H_sapiens.
J.L. Oliver et al. / Gene 300 (2002) 117–127118
LHGRs identified on the longest contigs of each chromo-
some (Table 1) were used for most of the statistical
comparisons described in this paper.
The segmentation algorithm used here (Oliver et al.,
2001, 2002; Roman-Roldan et al., 2002) is based on the
original method developed by our group (Bernaola-Galvan
et al., 1996, 1999, 2000; Roman-Roldan et al., 1998; Oliver
et al., 1999; Grosse et al., 2002), but with several
improvements (all aimed at addressing the specific isochore
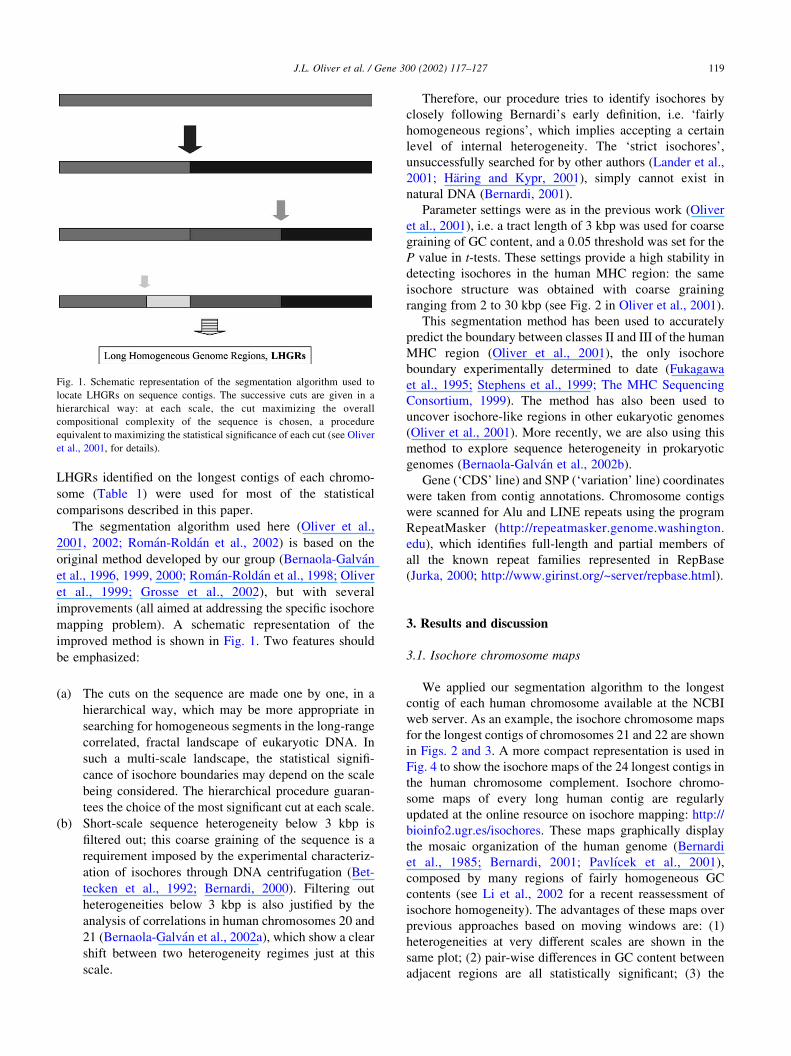
mapping problem). A schematic representation of the
improved method is shown in Fig. 1. Two features should
be emphasized:
(a) The cuts on the sequence are made one by one, in a
hierarchical way, which may be more appropriate in
searching for homogeneous segments in the long-range
correlated, fractal landscape of eukaryotic DNA. In
such a multi-scale landscape, the statistical signifi-
cance of isochore boundaries may depend on the scale
being considered. The hierarchical procedure guaran-
tees the choice of the most significant cut at each scale.
(b) Short-scale sequence heterogeneity below 3 kbp is
filtered out; this coarse graining of the sequence is a
requirement imposed by the experimental characteriz-
ation of isochores through DNA centrifugation (Bet-
tecken et al., 1992; Bernardi, 2000). Filtering out
heterogeneities below 3 kbp is also justified by the
analysis of correlations in human chromosomes 20 and
21 (Bernaola-Galvan et al., 2002a), which show a clear
shift between two heterogeneity regimes just at this
scale.
Therefore, our procedure tries to identify isochores by
closely following Bernardi’s early definition, i.e. ‘fairly
homogeneous regions’, which implies accepting a certain
level of internal heterogeneity. The ‘strict isochores’,
unsuccessfully searched for by other authors (Lander et al.,
2001; Haring and Kypr, 2001), simply cannot exist in
natural DNA (Bernardi, 2001).
Parameter settings were as in the previous work (Oliver
et al., 2001), i.e. a tract length of 3 kbp was used for coarse
graining of GC content, and a 0.05 threshold was set for the
P value in t-tests. These settings provide a high stability in
detecting isochores in the human MHC region: the same
isochore structure was obtained with coarse graining
ranging from 2 to 30 kbp (see Fig. 2 in Oliver et al., 2001).
This segmentation method has been used to accurately
predict the boundary between classes II and III of the human
MHC region (Oliver et al., 2001), the only isochore
boundary experimentally determined to date (Fukagawa
et al., 1995; Stephens et al., 1999; The MHC Sequencing
Consortium, 1999). The method has also been used to
uncover isochore-like regions in other eukaryotic genomes
(Oliver et al., 2001). More recently, we are also using this
method to explore sequence heterogeneity in prokaryotic
genomes (Bernaola-Galvan et al., 2002b).
Gene (‘CDS’ line) and SNP (‘variation’ line) coordinates
were taken from contig annotations. Chromosome contigs
were scanned for Alu and LINE repeats using the program
RepeatMasker (http://repeatmasker.genome.washington.
edu), which identifies full-length and partial members of
all the known repeat families represented in RepBase
(Jurka, 2000; http://www.girinst.org/~server/repbase.html).
3. Results and discussion
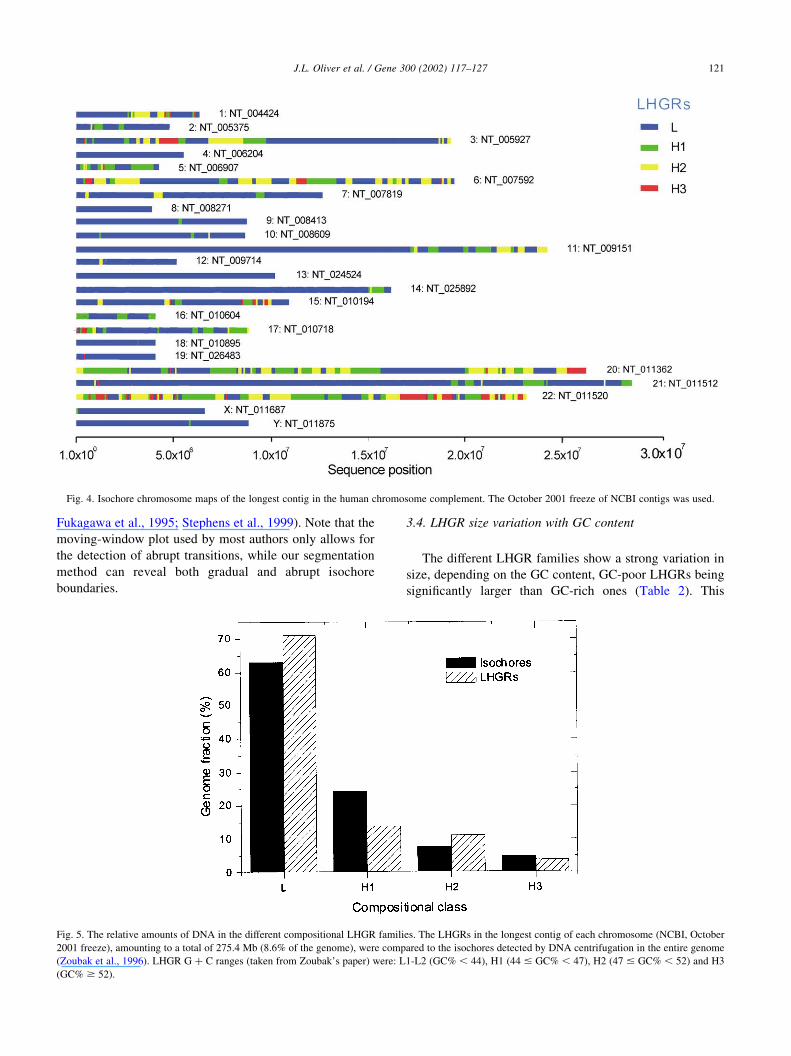
3.1. Isochore chromosome maps
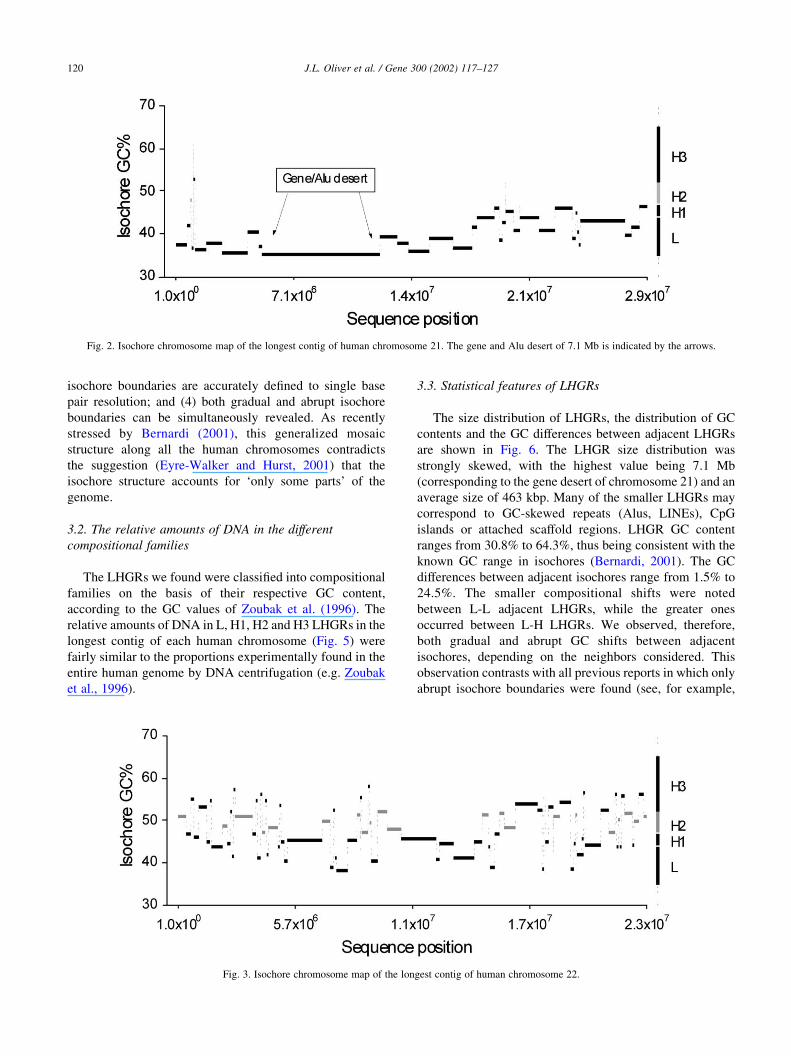
We applied our segmentation algorithm to the longest
contig of each human chromosome available at the NCBI
web server. As an example, the isochore chromosome maps
for the longest contigs of chromosomes 21 and 22 are shown
in Figs. 2 and 3. A more compact representation is used in
Fig. 4 to show the isochore maps of the 24 longest contigs in
the human chromosome complement. Isochore chromo-
some maps of every long human contig are regularly
updated at the online resource on isochore mapping: http://
bioinfo2.ugr.es/isochores. These maps graphically display
the mosaic organization of the human genome (Bernardi
et al., 1985; Bernardi, 2001; Pavlıcek et al., 2001),
composed by many regions of fairly homogeneous GC
contents (see Li et al., 2002 for a recent reassessment of
isochore homogeneity). The advantages of these maps over
previous approaches based on moving windows are: (1)
heterogeneities at very different scales are shown in the
same plot; (2) pair-wise differences in GC content between
adjacent regions are all statistically significant; (3) the
Fig. 1. Schematic representation of the segmentation algorithm used to
locate LHGRs on sequence contigs. The successive cuts are given in a
hierarchical way: at each scale, the cut maximizing the overall
compositional complexity of the sequence is chosen, a procedure
equivalent to maximizing the statistical significance of each cut (see Oliver
et al., 2001, for details).
J.L. Oliver et al. / Gene 300 (2002) 117–127 119
isochore boundaries are accurately defined to single base
pair resolution; and (4) both gradual and abrupt isochore
boundaries can be simultaneously revealed. As recently
stressed by Bernardi (2001), this generalized mosaic
structure along all the human chromosomes contradicts
the suggestion (Eyre-Walker and Hurst, 2001) that the
isochore structure accounts for ‘only some parts’ of the
genome.
3.2. The relative amounts of DNA in the different
compositional families
The LHGRs we found were classified into compositional
families on the basis of their respective GC content,
according to the GC values of Zoubak et al. (1996). The
relative amounts of DNA in L, H1, H2 and H3 LHGRs in the
longest contig of each human chromosome (Fig. 5) were
fairly similar to the proportions experimentally found in the
entire human genome by DNA centrifugation (e.g. Zoubak
et al., 1996).
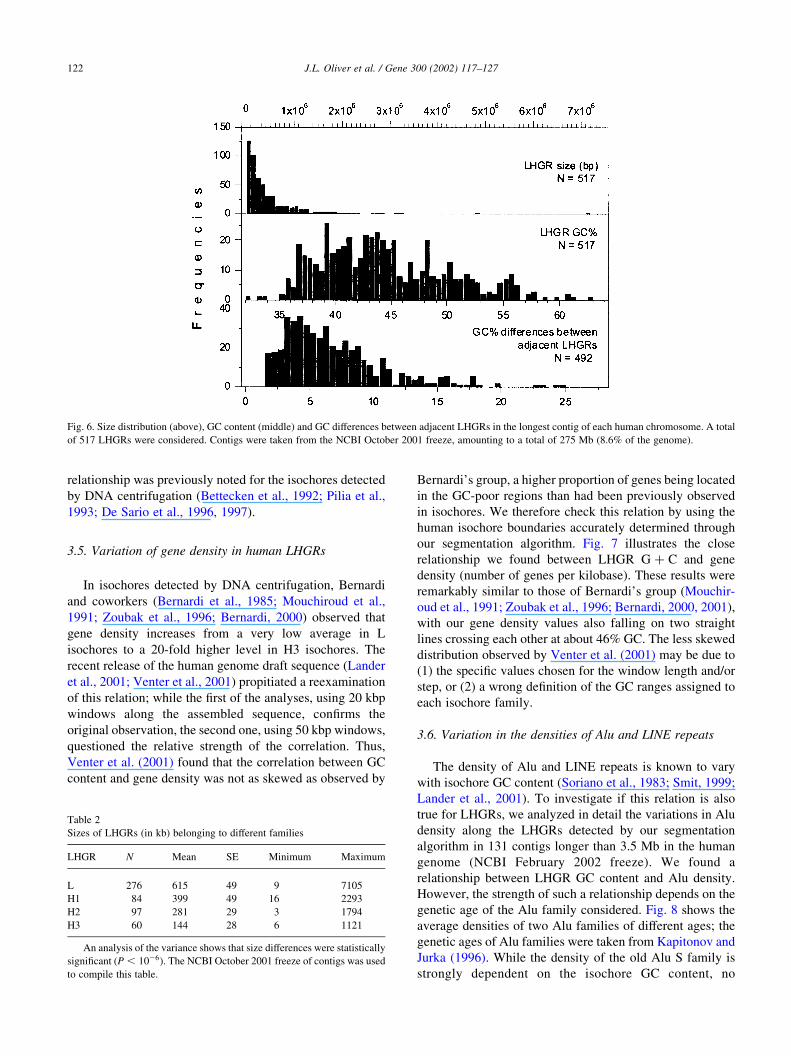
3.3. Statistical features of LHGRs
The size distribution of LHGRs, the distribution of GC
contents and the GC differences between adjacent LHGRs
are shown in Fig. 6. The LHGR size distribution was
strongly skewed, with the highest value being 7.1 Mb
(corresponding to the gene desert of chromosome 21) and an
average size of 463 kbp. Many of the smaller LHGRs may
correspond to GC-skewed repeats (Alus, LINEs), CpG
islands or attached scaffold regions. LHGR GC content
ranges from 30.8% to 64.3%, thus being consistent with the
known GC range in isochores (Bernardi, 2001). The GC
differences between adjacent isochores range from 1.5% to
24.5%. The smaller compositional shifts were noted
between L-L adjacent LHGRs, while the greater ones
occurred between L-H LHGRs. We observed, therefore,
both gradual and abrupt GC shifts between adjacent
isochores, depending on the neighbors considered. This
observation contrasts with all previous reports in which only
abrupt isochore boundaries were found (see, for example,
Fig. 3. Isochore chromosome map of the longest contig of human chromosome 22.
Fig. 2. Isochore chromosome map of the longest contig of human chromosome 21. The gene and Alu desert of 7.1 Mb is indicated by the arrows.
J.L. Oliver et al. / Gene 300 (2002) 117–127120
Fukagawa et al., 1995; Stephens et al., 1999). Note that the
moving-window plot used by most authors only allows for
the detection of abrupt transitions, while our segmentation
method can reveal both gradual and abrupt isochore
boundaries.
3.4. LHGR size variation with GC content
The different LHGR families show a strong variation in
size, depending on the GC content, GC-poor LHGRs being
significantly larger than GC-rich ones (Table 2). This
Fig. 5. The relative amounts of DNA in the different compositional LHGR families. The LHGRs in the longest contig of each chromosome (NCBI, October
2001 freeze), amounting to a total of 275.4 Mb (8.6% of the genome), were compared to the isochores detected by DNA centrifugation in the entire genome
(Zoubak et al., 1996). LHGR G þ C ranges (taken from Zoubak’s paper) were: L1-L2 (GC% , 44), H1 (44 # GC% , 47), H2 (47 # GC% , 52) and H3
(GC% $ 52).
Fig. 4. Isochore chromosome maps of the longest contig in the human chromosome complement. The October 2001 freeze of NCBI contigs was used.
J.L. Oliver et al. / Gene 300 (2002) 117–127 121
relationship was previously noted for the isochores detected
by DNA centrifugation (Bettecken et al., 1992; Pilia et al.,
1993; De Sario et al., 1996, 1997).
3.5. Variation of gene density in human LHGRs
In isochores detected by DNA centrifugation, Bernardi
and coworkers (Bernardi et al., 1985; Mouchiroud et al.,
1991; Zoubak et al., 1996; Bernardi, 2000) observed that
gene density increases from a very low average in L
isochores to a 20-fold higher level in H3 isochores. The
recent release of the human genome draft sequence (Lander
et al., 2001; Venter et al., 2001) propitiated a reexamination
of this relation; while the first of the analyses, using 20 kbp
windows along the assembled sequence, confirms the
original observation, the second one, using 50 kbp windows,
questioned the relative strength of the correlation. Thus,
Venter et al. (2001) found that the correlation between GC
content and gene density was not as skewed as observed by
Bernardi’s group, a higher proportion of genes being located
in the GC-poor regions than had been previously observed
in isochores. We therefore check this relation by using the
human isochore boundaries accurately determined through
our segmentation algorithm. Fig. 7 illustrates the close
relationship we found between LHGR G þ C and gene
density (number of genes per kilobase). These results were
remarkably similar to those of Bernardi’s group (Mouchir-
oud et al., 1991; Zoubak et al., 1996; Bernardi, 2000, 2001),
with our gene density values also falling on two straight
lines crossing each other at about 46% GC. The less skewed
distribution observed by Venter et al. (2001) may be due to
(1) the specific values chosen for the window length and/or
step, or (2) a wrong definition of the GC ranges assigned to
each isochore family.
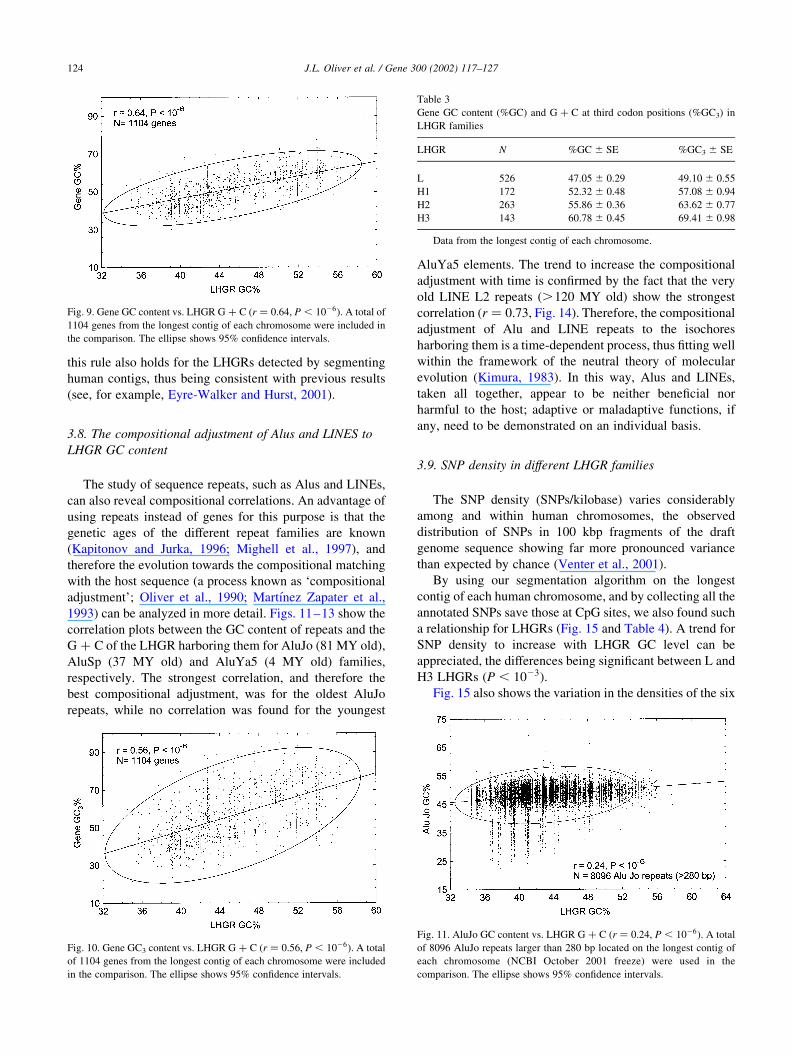
3.6. Variation in the densities of Alu and LINE repeats
The density of Alu and LINE repeats is known to vary
with isochore GC content (Soriano et al., 1983; Smit, 1999;
Lander et al., 2001). To investigate if this relation is also
true for LHGRs, we analyzed in detail the variations in Alu
density along the LHGRs detected by our segmentation
algorithm in 131 contigs longer than 3.5 Mb in the human
genome (NCBI February 2002 freeze). We found a
relationship between LHGR GC content and Alu density.
However, the strength of such a relationship depends on the
genetic age of the Alu family considered. Fig. 8 shows the
average densities of two Alu families of different ages; the
genetic ages of Alu families were taken from Kapitonov and
Jurka (1996). While the density of the old Alu S family is
strongly dependent on the isochore GC content, no
Table 2
Sizes of LHGRs (in kb) belonging to different families
LHGR N Mean SE Minimum Maximum
L 276 615 49 9 7105
H1 84 399 49 16 2293
H2 97 281 29 3 1794
H3 60 144 28 6 1121
An analysis of the variance shows that size differences were statistically
significant (P , 1026). The NCBI October 2001 freeze of contigs was used
to compile this table.
Fig. 6. Size distribution (above), GC content (middle) and GC differences between adjacent LHGRs in the longest contig of each human chromosome. A total
of 517 LHGRs were considered. Contigs were taken from the NCBI October 2001 freeze, amounting to a total of 275 Mb (8.6% of the genome).
J.L. Oliver et al. / Gene 300 (2002) 117–127122
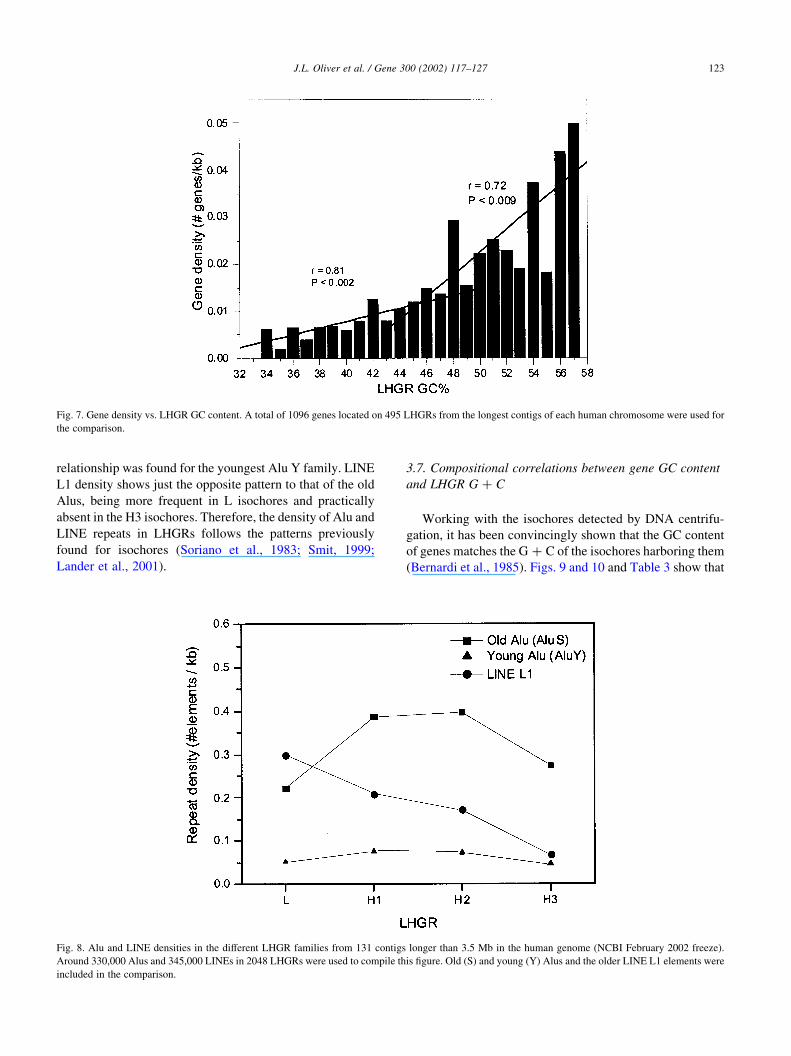
relationship was found for the youngest Alu Y family. LINE
L1 density shows just the opposite pattern to that of the old
Alus, being more frequent in L isochores and practically
absent in the H3 isochores. Therefore, the density of Alu and
LINE repeats in LHGRs follows the patterns previously
found for isochores (Soriano et al., 1983; Smit, 1999;
Lander et al., 2001).
3.7. Compositional correlations between gene GC content
and LHGR G þ C
Working with the isochores detected by DNA centrifu-
gation, it has been convincingly shown that the GC content
of genes matches the G þ C of the isochores harboring them
(Bernardi et al., 1985). Figs. 9 and 10 and Table 3 show that
Fig. 8. Alu and LINE densities in the different LHGR families from 131 contigs longer than 3.5 Mb in the human genome (NCBI February 2002 freeze).
Around 330,000 Alus and 345,000 LINEs in 2048 LHGRs were used to compile this figure. Old (S) and young (Y) Alus and the older LINE L1 elements were
included in the comparison.
Fig. 7. Gene density vs. LHGR GC content. A total of 1096 genes located on 495 LHGRs from the longest contigs of each human chromosome were used for
the comparison.
J.L. Oliver et al. / Gene 300 (2002) 117–127 123
this rule also holds for the LHGRs detected by segmenting
human contigs, thus being consistent with previous results
(see, for example, Eyre-Walker and Hurst, 2001).
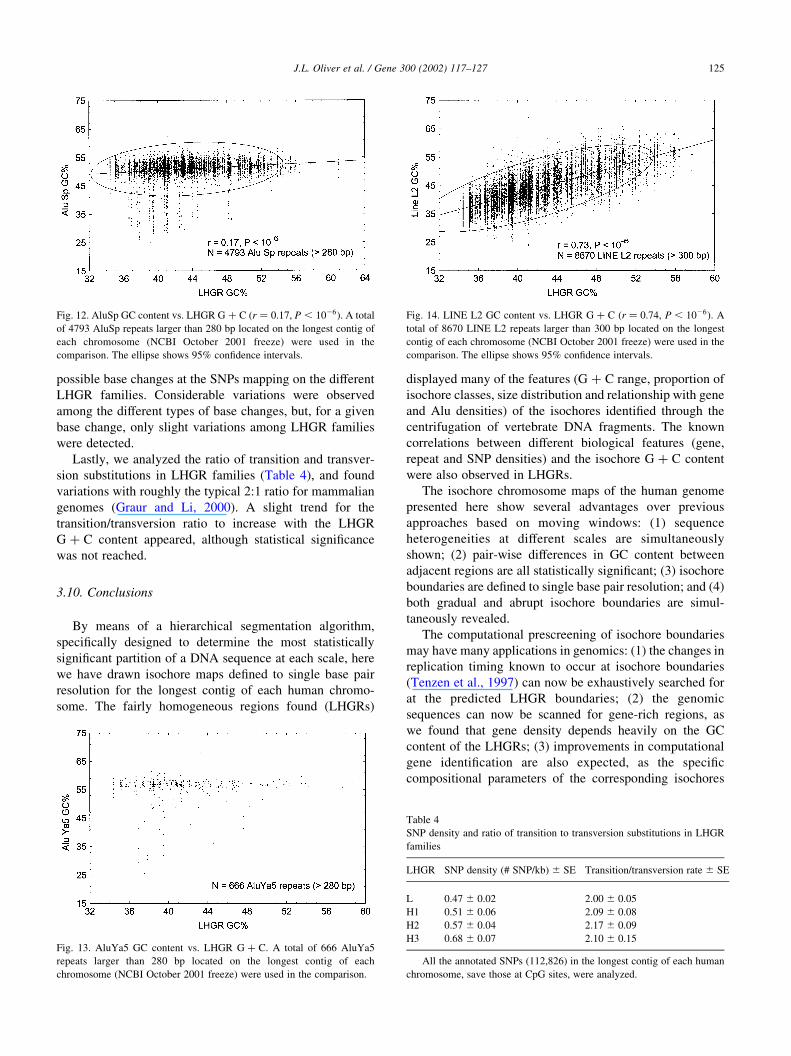
3.8. The compositional adjustment of Alus and LINES to
LHGR GC content
The study of sequence repeats, such as Alus and LINEs,
can also reveal compositional correlations. An advantage of
using repeats instead of genes for this purpose is that the
genetic ages of the different repeat families are known
(Kapitonov and Jurka, 1996; Mighell et al., 1997), and
therefore the evolution towards the compositional matching
with the host sequence (a process known as ‘compositional
adjustment’; Oliver et al., 1990; Martınez Zapater et al.,
1993) can be analyzed in more detail. Figs. 11–13 show the
correlation plots between the GC content of repeats and the
G þ C of the LHGR harboring them for AluJo (81 MY old),
AluSp (37 MY old) and AluYa5 (4 MY old) families,
respectively. The strongest correlation, and therefore the
best compositional adjustment, was for the oldest AluJo
repeats, while no correlation was found for the youngest
AluYa5 elements. The trend to increase the compositional
adjustment with time is confirmed by the fact that the very
old LINE L2 repeats (.120 MY old) show the strongest
correlation (r ¼ 0:73, Fig. 14). Therefore, the compositional
adjustment of Alu and LINE repeats to the isochores
harboring them is a time-dependent process, thus fitting well
within the framework of the neutral theory of molecular
evolution (Kimura, 1983). In this way, Alus and LINEs,
taken all together, appear to be neither beneficial nor
harmful to the host; adaptive or maladaptive functions, if
any, need to be demonstrated on an individual basis.
3.9. SNP density in different LHGR families
The SNP density (SNPs/kilobase) varies considerably
among and within human chromosomes, the observed
distribution of SNPs in 100 kbp fragments of the draft
genome sequence showing far more pronounced variance
than expected by chance (Venter et al., 2001).
By using our segmentation algorithm on the longest
contig of each human chromosome, and by collecting all the
annotated SNPs save those at CpG sites, we also found such
a relationship for LHGRs (Fig. 15 and Table 4). A trend for
SNP density to increase with LHGR GC level can be
appreciated, the differences being significant between L and
H3 LHGRs (P , 1023).
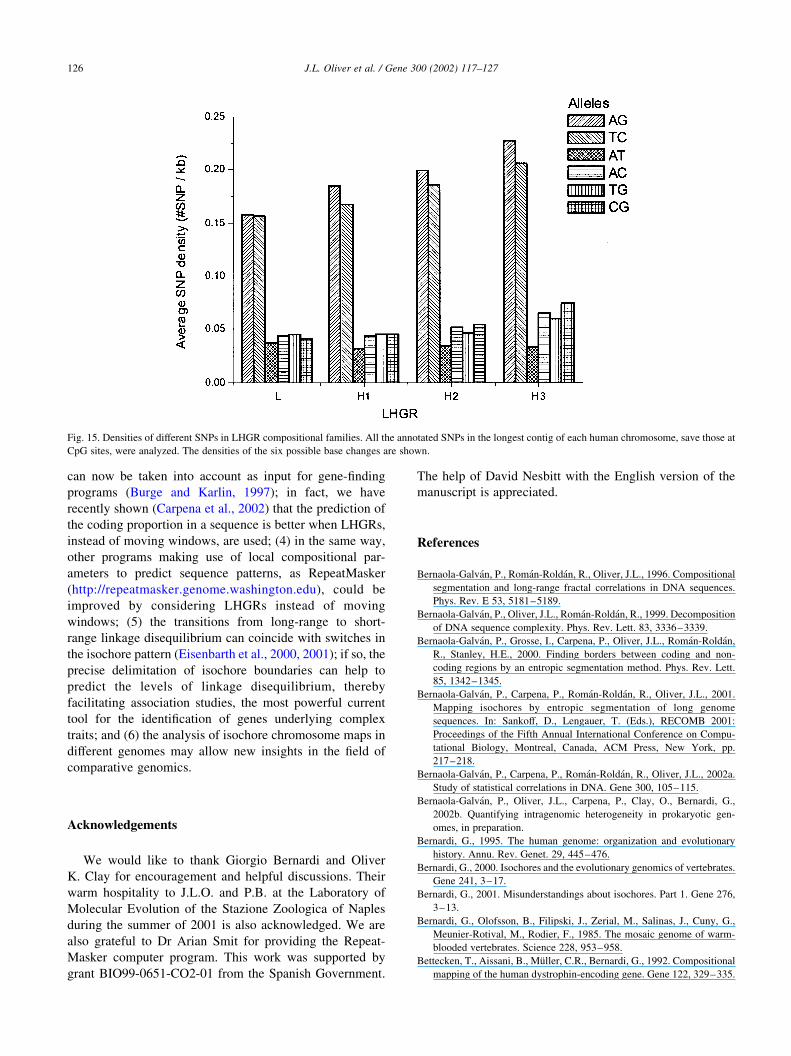
Fig. 15 also shows the variation in the densities of the six
Fig. 10. Gene GC3 content vs. LHGR G þ C (r ¼ 0:56, P , 1026). A total
of 1104 genes from the longest contig of each chromosome were included
in the comparison. The ellipse shows 95% confidence intervals.
Table 3
Gene GC content (%GC) and G þ C at third codon positions (%GC3) in
LHGR families
LHGR N %GC ^ SE %GC3 ^ SE
L 526 47.05 ^ 0.29 49.10 ^ 0.55
H1 172 52.32 ^ 0.48 57.08 ^ 0.94
H2 263 55.86 ^ 0.36 63.62 ^ 0.77
H3 143 60.78 ^ 0.45 69.41 ^ 0.98
Data from the longest contig of each chromosome.
Fig. 11. AluJo GC content vs. LHGR G þ C (r ¼ 0:24, P , 1026). A total
of 8096 AluJo repeats larger than 280 bp located on the longest contig of
each chromosome (NCBI October 2001 freeze) were used in the
comparison. The ellipse shows 95% confidence intervals.
Fig. 9. Gene GC content vs. LHGR G þ C (r ¼ 0:64, P , 1026). A total of
1104 genes from the longest contig of each chromosome were included in
the comparison. The ellipse shows 95% confidence intervals.
J.L. Oliver et al. / Gene 300 (2002) 117–127124
possible base changes at the SNPs mapping on the different
LHGR families. Considerable variations were observed
among the different types of base changes, but, for a given
base change, only slight variations among LHGR families
were detected.
Lastly, we analyzed the ratio of transition and transver-
sion substitutions in LHGR families (Table 4), and found
variations with roughly the typical 2:1 ratio for mammalian
genomes (Graur and Li, 2000). A slight trend for the
transition/transversion ratio to increase with the LHGR
G þ C content appeared, although statistical significance
was not reached.
3.10. Conclusions
By means of a hierarchical segmentation algorithm,
specifically designed to determine the most statistically
significant partition of a DNA sequence at each scale, here
we have drawn isochore maps defined to single base pair
resolution for the longest contig of each human chromo-
some. The fairly homogeneous regions found (LHGRs)
displayed many of the features (G þ C range, proportion of
isochore classes, size distribution and relationship with gene
and Alu densities) of the isochores identified through the
centrifugation of vertebrate DNA fragments. The known
correlations between different biological features (gene,
repeat and SNP densities) and the isochore G þ C content
were also observed in LHGRs.
The isochore chromosome maps of the human genome
presented here show several advantages over previous
approaches based on moving windows: (1) sequence
heterogeneities at different scales are simultaneously
shown; (2) pair-wise differences in GC content between
adjacent regions are all statistically significant; (3) isochore
boundaries are defined to single base pair resolution; and (4)
both gradual and abrupt isochore boundaries are simul-
taneously revealed.
The computational prescreening of isochore boundaries
may have many applications in genomics: (1) the changes in
replication timing known to occur at isochore boundaries
(Tenzen et al., 1997) can now be exhaustively searched for
at the predicted LHGR boundaries; (2) the genomic
sequences can now be scanned for gene-rich regions, as
we found that gene density depends heavily on the GC
content of the LHGRs; (3) improvements in computational
gene identification are also expected, as the specific
compositional parameters of the corresponding isochores
Fig. 13. AluYa5 GC content vs. LHGR G þ C. A total of 666 AluYa5
repeats larger than 280 bp located on the longest contig of each
chromosome (NCBI October 2001 freeze) were used in the comparison.
Fig. 14. LINE L2 GC content vs. LHGR G þ C (r ¼ 0:74, P , 1026). A
total of 8670 LINE L2 repeats larger than 300 bp located on the longest
contig of each chromosome (NCBI October 2001 freeze) were used in the
comparison. The ellipse shows 95% confidence intervals.
Table 4
SNP density and ratio of transition to transversion substitutions in LHGR
families
LHGR SNP density (# SNP/kb) ^ SE Transition/transversion rate ^ SE
L 0.47 ^ 0.02 2.00 ^ 0.05
H1 0.51 ^ 0.06 2.09 ^ 0.08
H2 0.57 ^ 0.04 2.17 ^ 0.09
H3 0.68 ^ 0.07 2.10 ^ 0.15
All the annotated SNPs (112,826) in the longest contig of each human
chromosome, save those at CpG sites, were analyzed.
Fig. 12. AluSp GC content vs. LHGR G þ C (r ¼ 0:17, P , 1026). A total
of 4793 AluSp repeats larger than 280 bp located on the longest contig of
each chromosome (NCBI October 2001 freeze) were used in the
comparison. The ellipse shows 95% confidence intervals.
J.L. Oliver et al. / Gene 300 (2002) 117–127 125
can now be taken into account as input for gene-finding
programs (Burge and Karlin, 1997); in fact, we have
recently shown (Carpena et al., 2002) that the prediction of
the coding proportion in a sequence is better when LHGRs,
instead of moving windows, are used; (4) in the same way,
other programs making use of local compositional par-
ameters to predict sequence patterns, as RepeatMasker
(http://repeatmasker.genome.washington.edu), could be
improved by considering LHGRs instead of moving
windows; (5) the transitions from long-range to short-
range linkage disequilibrium can coincide with switches in
the isochore pattern (Eisenbarth et al., 2000, 2001); if so, the
precise delimitation of isochore boundaries can help to
predict the levels of linkage disequilibrium, thereby
facilitating association studies, the most powerful current
tool for the identification of genes underlying complex
traits; and (6) the analysis of isochore chromosome maps in
different genomes may allow new insights in the field of
comparative genomics.
Acknowledgements
We would like to thank Giorgio Bernardi and Oliver
K. Clay for encouragement and helpful discussions. Their
warm hospitality to J.L.O. and P.B. at the Laboratory of
Molecular Evolution of the Stazione Zoologica of Naples
during the summer of 2001 is also acknowledged. We are
also grateful to Dr Arian Smit for providing the Repeat-
Masker computer program. This work was supported by
grant BIO99-0651-CO2-01 from the Spanish Government.
The help of David Nesbitt with the English version of the
manuscript is appreciated.
References
Bernaola-Galvan, P., Roman-Roldan, R., Oliver, J.L., 1996. Compositional
segmentation and long-range fractal correlations in DNA sequences.
Phys. Rev. E 53, 5181–5189.
Bernaola-Galvan, P., Oliver, J.L., Roman-Roldan, R., 1999. Decomposition
of DNA sequence complexity. Phys. Rev. Lett. 83, 3336–3339.
Bernaola-Galvan, P., Grosse, I., Carpena, P., Oliver, J.L., Roman-Roldan,
R., Stanley, H.E., 2000. Finding borders between coding and non-
coding regions by an entropic segmentation method. Phys. Rev. Lett.
85, 1342–1345.
Bernaola-Galvan, P., Carpena, P., Roman-Roldan, R., Oliver, J.L., 2001.
Mapping isochores by entropic segmentation of long genome
sequences. In: Sankoff, D., Lengauer, T. (Eds.), RECOMB 2001:
Proceedings of the Fifth Annual International Conference on Compu-
tational Biology, Montreal, Canada, ACM Press, New York, pp.
217–218.
Bernaola-Galvan, P., Carpena, P., Roman-Roldan, R., Oliver, J.L., 2002a.
Study of statistical correlations in DNA. Gene 300, 105–115.
Bernaola-Galvan, P., Oliver, J.L., Carpena, P., Clay, O., Bernardi, G.,
2002b. Quantifying intragenomic heterogeneity in prokaryotic gen-
omes, in preparation.
Bernardi, G., 1995. The human genome: organization and evolutionary
history. Annu. Rev. Genet. 29, 445–476.
Bernardi, G., 2000. Isochores and the evolutionary genomics of vertebrates.
Gene 241, 3–17.
Bernardi, G., 2001. Misunderstandings about isochores. Part 1. Gene 276,
3–13.
Bernardi, G., Olofsson, B., Filipski, J., Zerial, M., Salinas, J., Cuny, G.,
Meunier-Rotival, M., Rodier, F., 1985. The mosaic genome of warm-
blooded vertebrates. Science 228, 953–958.
Bettecken, T., Aissani, B., Muller, C.R., Bernardi, G., 1992. Compositional
mapping of the human dystrophin-encoding gene. Gene 122, 329–335.
Fig. 15. Densities of different SNPs in LHGR compositional families. All the annotated SNPs in the longest contig of each human chromosome, save those at
CpG sites, were analyzed. The densities of the six possible base changes are shown.
J.L. Oliver et al. / Gene 300 (2002) 117–127126
Burge, C., Karlin, S., 1997. Prediction of complete gene structures in
human genomic DNA. J. Mol. Biol. 268, 8–94.
Carpena, P., Bernaola-Galvan, P., Roman-Roldan, R., Oliver, J.L., 2002. A
simple and species-independent coding measure. Gene 300, 95–104.
De Sario, A., Geigl, E.-M., Palmieri, G., D’Urso, M., Bernardi, G., 1996. A
compositional map of human chromosome band Xq28. Proc. Natl.
Acad. Sci. USA 93, 1298–1302.
De Sario, A., Roizes, G., Allegre, N., Bernardi, G., 1997. A compositional
map of the cen-q21 region of human chromosome 21. Gene 194,
107–113.
Dunham, I., Shimizu, N., Roe, B.A., Chissoe, S., et al., 1999. The DNA
sequence of human chromosome 22. Nature 402, 489–495.
Eisenbarth, I., Vogel, G., Krone, W., Vogel, W., Assum, G., 2000. An
isochore transition in the NF1 gene region coincides with a switch in the
extent of linkage disequilibrium. Am. J. Hum. Genet. 67, 873–880.
Eisenbarth, I., Striebel, A.M., Moschgath, E., Vogel, W., Assum, G., 2001.
Long-range sequence composition mirrors linkage disequilibrium
pattern in a 1.13 Mb region of human chromosome 22. Hum. Mol.
Genet. 10, 2833–2839.
Eyre-Walker, A., Hurst, L.D., 2001. The evolution of isochores. Nat. Rev.
Genet. 2, 549–555.
Fukagawa, T., Sugaya, K., Matsumoto, K., Okumura, K., Ando, A., Inoko,
H., Ikemura, T., 1995. A boundary of long-range G þ C% mosaic
domains in the human MHC locus: pseudoautosomal boundary-like
sequence exists near the boundary. Genomics 25, 184–191.
Fukagawa, T., Nakamura, Y., Okumura, K., Nogami, M., Ando, A., Inoko,
H., Saitou, N., Ikemura, T., 1996. Human pseudoautosomal boundary-
like sequences: expression and involvement in evolutionary formation
of the present-day pseudoautosomal boundary of human sex chromo-
somes. Hum. Mol. Genet. 5, 123–132.
Graur, D., Li, W.-H., 2000. Fundamentals of Molecular Evolution, 2nd
Edition, Sinauer Associates, Sunderland, MA.
Grosse, I., Bernaola-Galvan, P., Carpena, P., Roman-Roldan, R., Oliver,
J.L., Stanley, H.E., 2002. Analysis of symbolic sequences using the
Jensen-Shannon divergence measure. Phys. Rev. E 65, 041905-
1–041905-16.
Haring, D., Kypr, J., 2001. No isochores in the human chromosomes 21 and
22? Biochem. Biophys. Res. Commun. 280, 567–573.
Hattori, M., et al., 2000. The DNA sequence of human chromosome 21.
Nature 405, 311–319.
Jurka, J., 2000. RepBase update: a database and an electronic journal of
repetitive elements. Trends Genet. 16, 418–420.
Kapitonov, V., Jurka, J., 1996. The age of Alu subfamilies. J. Mol. Evol. 42,
59–65.
Kimura, M., 1983. The Neutral Theory of Molecular Evolution, Cambridge
University Press, Cambridge.
Lander, E.S., Waterston, R.H., Sulston, J., Collins, F.S., et al., 2001.
International Human Genome Sequencing Consortium. Initial sequen-
cing and analysis of the human genome. Nature 409, 860–921.
Li, W., 2001. Delineating relative homogeneous G þ C domains in DNA
sequences. Gene 276, 57–72.
Li, W., Kaneko, K., 1992. Long range correlation and partial 1/fa spectrum
in a noncoding DNA sequence. Europhys. Lett. 17, 655.
Li, W., Stolovitzky, G., Bernaola-Galvan, P., Oliver, J.L., 1998.
Compositional heterogeneity within, and uniformity between, DNA
sequences of yeast chromosomes. Genome Res. 8, 916–928.
Li, W., Bernaola-Galvan, P., Carpena, P., Oliver, J.L., 2002. Isochores
merit the prefix ‘Iso’, submitted for publication.
Macaya, G., Thiery, J.P., Bernardi, G., 1976. An approach to the
organization of eukaryotic genomes at a macromolecular level. J. Mol.
Biol. 108, 237–254.
Martınez Zapater, J.M., Marın, A., Oliver, J.L., 1993. Evolution of base
composition in T-DNA genes from Agrobacterium. Mol. Biol. Evol. 10
(2), 437–448.
Mighell, A.J., Markham, A.F., Robinson, P.A., 1997. Alu sequences. FEBS
Lett. 417, 1–5.
Mouchiroud, D., D’Onofrio, G., Aıssani, B., Macaya, G., Gautier, C.,
Bernardi, G., 1991. The distribution of genes in the human genome.
Gene 100, 181–187.
Nekrutenko, A., Li, W.H., 2000. Assessment of compositional heterogen-
eity within and between eukaryotic genomes. Genome Res. 10,
1986–1995.
Oliver, J.L., Marın, A., Martınez Zapater, J.M., 1990. Chloroplast genes
transferred to the nuclear plant genome have adjusted to nuclear base
composition and codon usage. Nucleic Acids Res. 18 (1), 65–73.
Oliver, J.L., Roman-Roldan, R., Perez, J., Bernaola-Galvan, P., 1999.
SEGMENT: identifying compositional domains in DNA sequences.
Bioinformatics 15, 974–979.
Oliver, J.L., Bernaola-Galvan, P., Carpena, P., Roman-Roldan, R., 2001.
Isochore chromosome maps of eukaryotic genomes. Gene 276, 47–56.
Oliver, J.L., et al., 2002. IsoFinder: finding isochore boundaries on large
sequence contigs, in preparation.
Pavlıcek, A., Jabbari, K., Paces, J., Paces, V., Hejnar, J., Bernardi, G., 2001.
Similar integration but different stability of Alus and LINEs in the
human genome. Gene 276, 39–45.
Peng, C.-K., Buldyrev, S.V., Goldberger, A.L., Havlin, S., Sciortino, F.,
Simons, M., Stanley, H.E., 1992. Long-range correlations in nucleotide
sequences. Nature 356, 168–170.
Pilia, G., Little, R.D., Aıssani, B., Bernardi, G., Schlessinger, D., 1993.
Isochores and CpG islands in YAC contigs in human X26.1-qter.
Genomics 17, 456–462.
Roman-Roldan, R., Bernaola-Galvan, P., Oliver, J.L., 1998. Sequence
compositional complexity of DNA through an entropic segmentation
method. Phys. Rev. Lett. 80, 1344–1347.
Roman-Roldan, R., et al., 2002. Information-theoretic symbolic sequence
segmentation by maximum discrepancy ordering, in preparation.
Saccone, S., De Sario, A., Wiegant, J., Rap, A.K., Della Valle, G., Bernardi,
G., 1993. Correlations between isochores and chromosomal bands in
the human genome. Proc. Natl. Acad. Sci. USA 90, 11929–11933.
Smit, A.F., 1999. Interspersed repeats and other mementos of transposable
elements in mammalian genomes. Curr. Opin. Genet. Dev. 9, 657–663.
Soriano, P., Meunier-Rotival, M., Bernardi, G., 1983. The distribution of
interspersed repeats is nonuniform and conserved in the mouse and
human genomes. Proc. Natl. Acad. Sci. USA 80, 1816–1820.
Stephens, R., Horton, R., Humphray, S., Rowen, L., Trowsdale, J., Beck, S.,
1999. Gene organisation, sequence variation and isochore structure at
the centromeric boundary of the human MHC. J. Mol. Biol. 291,
789–799.
Tenzen, T., Yamagata, T., Fukagawa, T., Sugaya, K., Ando, A., Inoko, H.,
Gojobori, T., Fujiyama, A., Okumura, K., Ikemura, T., 1997. Precise
switching of DNA replication timing in the GC content transition area
in the human MHC. Mol. Cell. Biol. 17, 4043–4050.
The MHC Sequencing Consortium, 1999. Complete sequence and gene
map of a human major histocompatibility complex. Nature 401,
921–923.
Venter, J.C., et al., 2001. The sequence of the human genome. Science 291,
1304–1351.
Voss, R., 1992. Evolution of long-range fractal correlations and 1/f noise in
DNA base sequences. Phys. Rev. Lett. 68, 3805–3808.
Zoubak, S., Clay, O., Bernardi, G., 1996. The gene distribution of the
human genome. Gene 174, 95–102.
J.L. Oliver et al. / Gene 300 (2002) 117–127 127
Related Documents


