IsOl Long Wavelength Spectrograph Observations of Cold Dust in Galaxies Matthew Trewhella IPAC (Caltech/JPL), 770 S. Wilson Ave., Pasadena, CA 91125, USA and Jonathon I. Davies, Paul B. Alton and Simone Bianchi Dept. of Physics and Astronomy, University of Wales Cardiff, The Parade, Cardiff CF2 3YB, UK and Barry F. Madore NASA/IPAC Extragalactic Database (NED), 770 S. Wilson Ave., Pasadena, CA 91125, USA & Observatories of the Carnegie Institute of Washington, 813 Santa Barbara St., Pasadena, CA 91101, USA Received ; accepted To appear in the Astrophysical Journal ‘Based on observations with ISO, an ESA project with instruments Funded by ESA Member States (especially the PI countries: France, Germany, the Netherlands and the United kingdom) with the participation of IS;\S and NASA.

Welcome message from author
This document is posted to help you gain knowledge. Please leave a comment to let me know what you think about it! Share it to your friends and learn new things together.
Transcript
IsOl Long Wavelength Spectrograph Observations of Cold Dust
in Galaxies
Matthew Trewhella
IPAC (Caltech/JPL), 770 S. Wilson Ave., Pasadena, CA 91125, USA
and
Jonathon I. Davies, Paul B. Alton and Simone Bianchi
Dept. of Physics and Astronomy, University of Wales Cardiff,
The Parade, Cardiff CF2 3YB, UK
and
Barry F. Madore
NASA/IPAC Extragalactic Database (NED), 770 S. Wilson Ave., Pasadena, CA 91125,
USA & Observatories of the Carnegie Institute of Washington, 813 Santa Barbara St.,
Pasadena, CA 91101, USA
Received ; accepted
To appear in the Astrophysical Journal
‘Based on observations with ISO, an ESA project with instruments Funded by ESA
Member States (especially the PI countries: France, Germany, the Netherlands and the
United kingdom) with the participation of IS;\S and NASA.
- 2 -
ABSTRACT
We describe observations of 5 nearby galaxies obtained using the Long
Wavelength Spectrograph (LWS) on the Infrared Space Observatory (ISO).
We observed 5 galaxies, using spectrograph apertures positioned at the
galactic center and in the outskirts of the disk, to compare the spectral energy
distribution of the emitting dust at different positions. The central spectra
are typical of those inferred previously from IRAS data; peaking at about 100
p m with estimated dust temperatures of Td = 30 - 35°K. However, there is a
rapid change in the spectral energy distribution with increasing galactocentric
distance. In the outer regions the spectra are flat, or still rising, out t o 197pm
indicating a predominantly cold dust component with Td < 20" K. In the central
regions, the inferred cold dust mass is approximately an order of magnitude
larger than that associated with the warm dust and increasingly dominates the
dust ma,ss even more in the outer regions. We discuss reasons for believing
that emission beyond M 150pm in disk galaxies is associated with a seperate
component of dust with an extended distribution that may be associated with a
possible molecular halo.
Subject headings: dust, extinction - galaxies - general
1. Introduction
Some of the most important problems facing extragalactic astronomers today revolve
around the interpretation of observations of a ‘dusty’ Universe. These include the
relationship between the UV energy density and the star formation rate as a function of
redshift; the strong evolution of infrared bright galaxies; and measurements of the far
infrared cosmic background. An important tool to help us interpret the many observations
that can be made of galaxies is found in radiative transfer models that are able to predict
both the extinction by and the emission from dust (Kylafis and Bahcall 1987, Disney, Davies
& Phillipps 1989, Witt, Thronson & Capuano 1992, Bianchi, Ferrara & Giovanardi 1996,
Trewhella, Madore and Kuchinski 1999). The basic input to such models are the physical
properties and relative distribution of the extinguishing material and the heating sources
(i.e. for galaxies, the 3D spatial distribution of stars and dust). We have recently obtained
observations, over a wide range of wavelengths, of nearby, large-angular-size galaxies to try
to define more precisely the input parameters to these radiative transfer models.
A la.rge source of uncertainty in, and a crucial component of, the models is the relative
geometry of the stars and dust. For a point source seen through a screen of dust (as when
viewing stars in our galaxy), the radiative transfer is relatively simple and many classic
techniques (e.g. Hiltner & Johnson 1956) exist to correct stellar magnitudes for extinction.
It has proved difficult however, to find such simple methods to correct the observed, global
properties of galaxies for the obscuring effects of dust (Disney et al. 19S9). As yet, no
straightforward and unambiguous diagnostic for dust extinction exists for composite stellar
systems, even though all areas of extragalactic astronomy that rely on measurement of
luminosity and color are affected by it. It is likely that this wi l l remain the case until we
have a better understanding of the detailed dust distribution in galaxies.
A major open question has been how the cold dust, ( < 201<) which cor~ltl not be
- 4 -
detected by the InfraRed Astronomical Satellite (IRAS), behaves. We will argue that the
cumulative evidence (including the data presented in this paper) shows that the cold dust
forms a separate component that is widely distributed within galaxies and contains at least
an order of magnitude more mass than the warm (IRAS detected) dust.
Although a bolometric correction for cold dust emission was suggested by Disney et
al. (1989), a physically extended dust component was first suggested by Valentijn (1990)
to explain the results of a surface-brightness/inclination test that found galaxies did not
change their surface-brightness with inclination. Also, Beckman et al. (1996) found strong
color gradients in galaxies which, if due to dust, required a dust scale height larger than
the stars. The conclusions drawn from these studies were not unique however; Davies et
al. (1993) argued that Valentijn’s surface-brightness/inclination test was invalid because
of surface-brightness selection effects, and de Jong (1996) argued that the strong color
gradients found by Beckman et al. were the result of differences in star formation history.
The first direct evidence (though still lacking confirmation) for an extended dust
distribution came from Zaritski (1994). He measured the reddening of background galaxies
seen in projection both close to and far away from two foreground galaxies. He claimed
a detection of measurable reddening of the background galaxy population at a projected
distance of 60 kpc from the foreground galaxy. The exponential scale length of the dust
distribution was estimated to be about 30 kpc , consistent, for example, with the size of
halos determined from QSO absorption line studies (Ostriker Qi Heisler 1954). Th’ 1s was a
highly radical conclusion, the uncertainties in our understanding of the standard (IRAS)
interstellar dust distribution (with a scale length of - 3.5kpc) was already leading to
confusion in determinations of the optical opacity of spira.1 disks (Trewhella et al. 1997). To
add another dust component would complicate the process still further.
LVe began the study of dust distribution as part of our ongoing initiative to understa.nd
- ,5 -
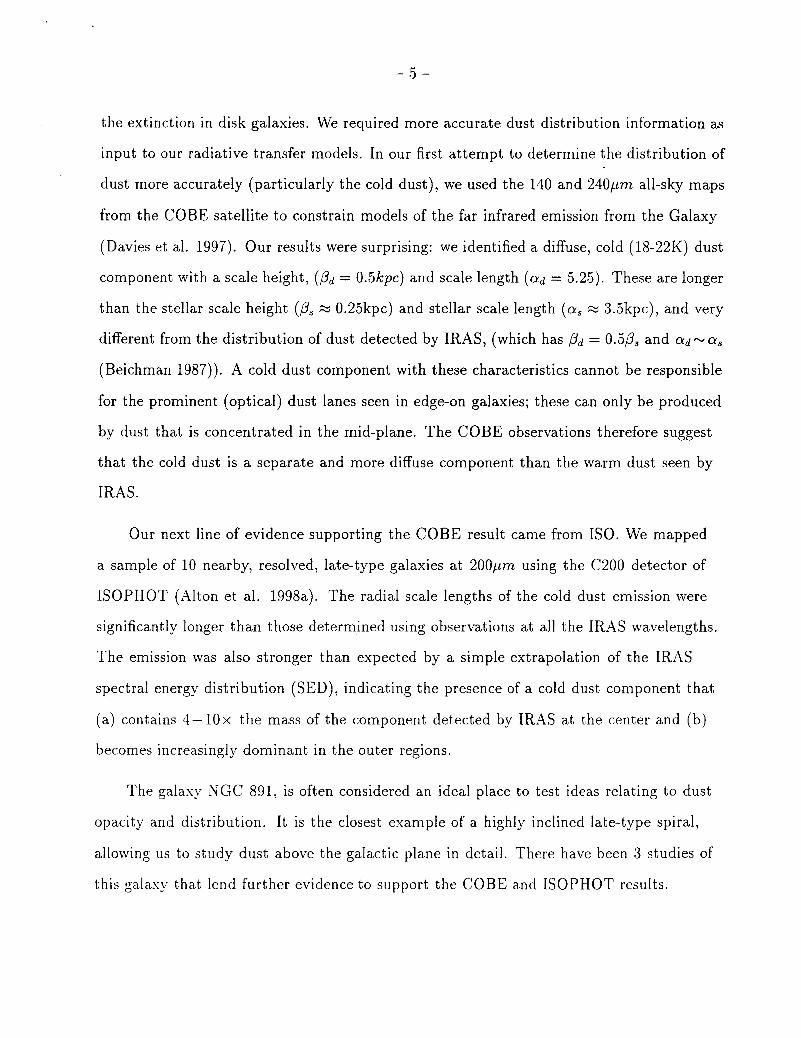
the extinction in disk galaxies. We required more accurate dust distribution information as
input to our radiative transfer models. In our first attempt to determine the distribution of
dust more accurately (particularly the cold dust), we used the 140 and 240prn all-sky maps
from the COBE satellite to constrain models of the far infrared emission from the Galaxy
(Davies et al. 1997). Our results were surprising: we identified a diffuse, cold (18-22K) dust
component with a scale height, ( P d = 0.5kpc) and scale length ( a d = 5.25). These are longer
than the stellar scale height ( p s M 0.25kpc) and stellar scale length (CY, M 3.5kpc)) and very
different from the distribution of dust detected by IRAS, (which has P d = O.S,B, and CYd-cX,
(Beichman 1987)). A cold dust component with these characteristics cannot be responsible
for the prominent (optical) dust lanes seen in edge-on galaxies; these can only be produced
by dust that is concentrated in the mid-plane. The COBE observations therefore suggest
that the cold dust is a separate and more diffuse component than the warm dust seen by
IRAS.
Our next line of evidence supporting the COBE result came from ISO. We mapped
a sample of 10 nearby, resolved, late-type galaxies at 200,urn using the C200 detector of
ISOPHOT (Alton et al. 1998a). The radial scale lengths of the cold dust emission were
significantly longer than those determined using observations at all the IRAS wavelengths.
The emission was also stronger than expected by a simple extrapolation of the IRAS
spectral energy distribution (SED), indicating the presence of a cold dust component that
(a) contains 4- lox the mass of the component detected by IRAS at the center and (b)
becomes increasingly dominant in the outer regions.
The galaxy NGC 891, is often considered an ideal place to test ideas relating to dust
opacity and distribution. It is the closest example of a highly inclined late-type spiral,
allowing us to study dust above the galactic plane in detail. There have been 3 studies of
this galaxy that lend further evidence to support the COBE and ISOPHOT results.
- 6 -
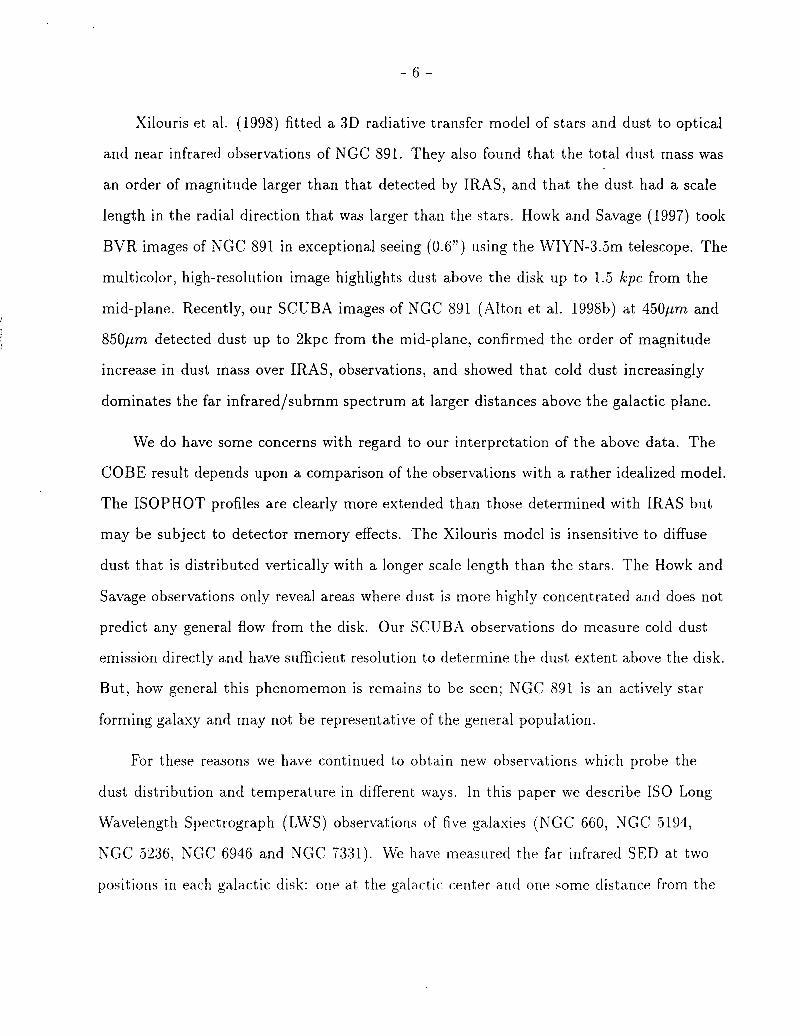
Xilouris et al. (1998) fitted a 3D radiative transfer model of stars and dust to optical
and near infrared observations of NGC 891. They also found that the total dust mass was
an order of magnitude larger than that detected by IRAS, and that the dust had a scale
length in the radial direction that was larger than the stars. Howk and Savage (1997) took
BVR images of NGC 891 in exceptional seeing (0.6”) using the WIYN-3.5m telescope. The
multicolor, high-resolution image highlights dust above the disk up to 1.5 kpc from the
mid-plane. Recently, our SCUBA images of NGC 891 (Alton et al. 199813) at 450pm and
850pum detected dust up to 2kpc from the mid-plane, confirmed the order of magnitude
increase in dust mass over IRAS, observations, and showed that cold dust increasingly
dominates the far infrared/submm spectrum at larger distances above the galactic plane.
We do have some concerns with regard to our interpretation of the above data. The
COBE result depends upon a comparison of the observations with a rather idealized model.
The ISOPHOT profiles are clearly more extended than those determined with IRAS but
may be subject to detector memory effects. The Xilouris model is insensitive to diffuse
dust that is distributed vertically with a longer scale length than the stars. The Howk and
Savage observations only reveal areas where dust is more highly concentrated and does not
predict any general flow from the disk. Our SCUBA observations do measure cold dust
emission directly and have sufficient resolution to determine the dust extent above the disk.
But, how general this phenomemon is remains to be seen; NGC 891 is an actively star
forming ga.laxy and may not be representative of the general population.
For these reasons we have continued to obtain new observations which probe the
dust distribution and temperature in different ways. In this paper we describe I S 0 Long
Wavelength Spectrograph (LWS) observations of five galaxies (NGC 660, NGC 5194,
NGC 5236, NGC 6946 and NGC 7331). We have measured the far infrared SED at two
positions in each galactic disk: one at the galactic center and one some distance from the
- 7 -
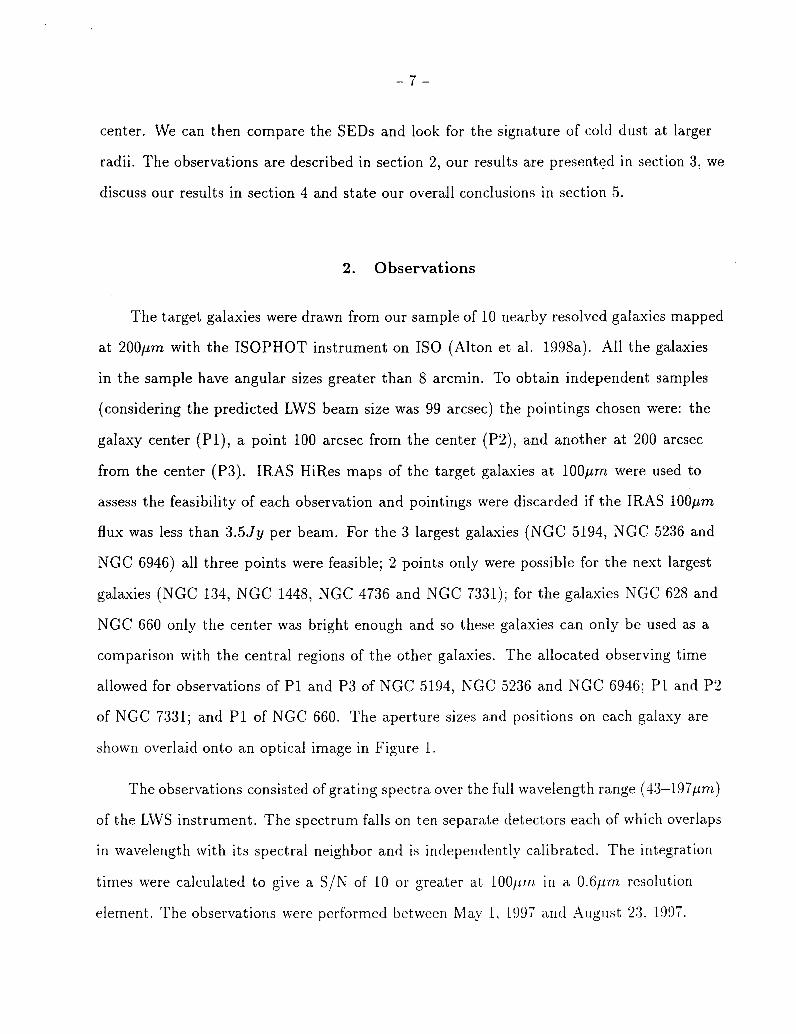
center. We can then compare the SEDs and look for the signature of cold dust at larger
radii. The observations are described in section 2, our results are presented in section 3, we
discuss our results in section 4 and state our overall conclusions in section 5.
2. Observations
The target galaxies were drawn from our sample of 10 nearby resolved galaxies mapped
at 200pm with the ISOPHOT instrument on I S 0 (Alton et al. 1998a). All the galaxies
in the sample have angular sizes greater than 8 arcmin. To obtain independent samples
(considering the predicted LWS beam size was 99 arcsec) the pointings chosen were: the
galaxy center (P l ) , a point 100 arcsec from the center (P2), and another at 200 arcsec
from the center (P3). IRAS HiRes maps of the target galaxies at lOOpm were used to
assess the feasibility of each observation and pointings were discarded if the IRAS 100pm
flux was less than 3.5Jy per beam. For the 3 largest galaxies (NGC 5194, NGC 5236 and
NGC 6946) all three points were feasible; 2 points only were possible for the next largest
galaxies (NGC 134, NGC 1448, NGC 4736 and NGC 7331); for the galaxies NGC 628 and
NGC 660 only the center was bright enough and so these galaxies can only be used as a
comparison with the central regions of the other galaxies. The allocated observing time
allowed for observations of P1 and P3 of NGC 5194, NGC 5236 and NGC 6946; PI and P2
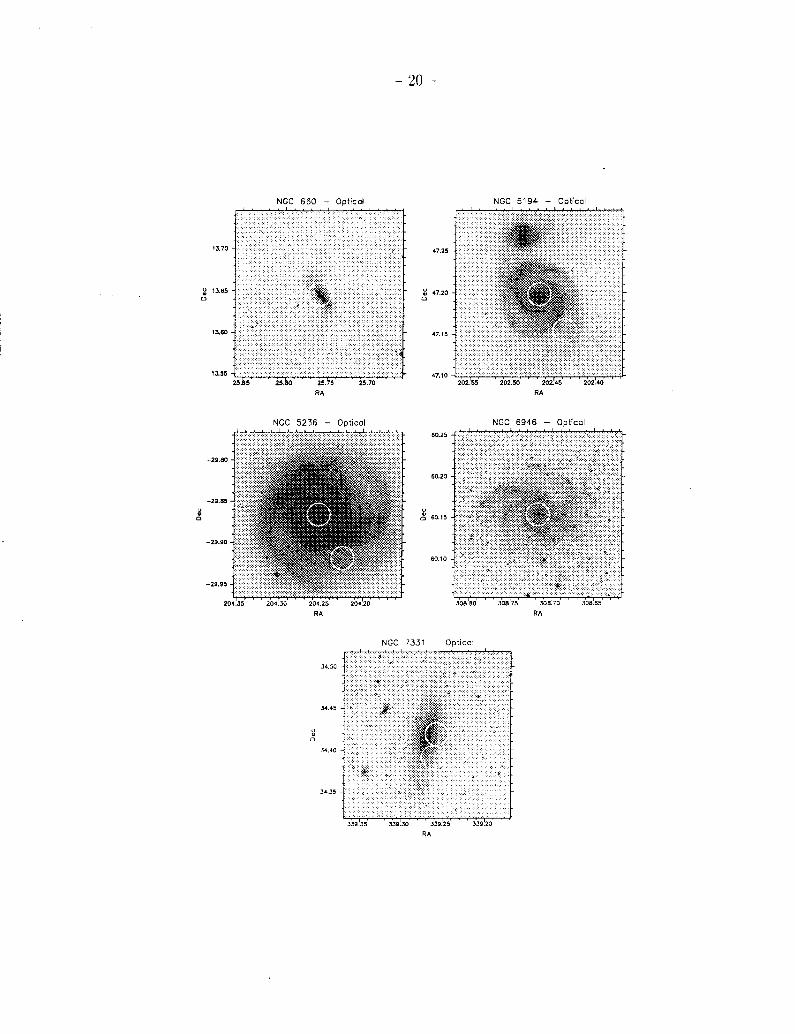
of NGC 7331; and P1 of NGC 660. The aperture sizes and positions on each galaxy are
shown overlaid onto an optical image in Figure 1.
The observations consisted of grating spectra over the full wavelength range (43-197pm)
of the LWS instrument. The spectrum falls on ten separate detectors each of which overlaps
in wavelength with its spectral neighbor and is independently calibrated. The integration
times were calculated to give a S / N of 10 or greater at 100pm in a 0 . 6 p m resolution
element. The observations were performed between May I , 1997 m c l Augllst 23, 19!)7.
- 8 -
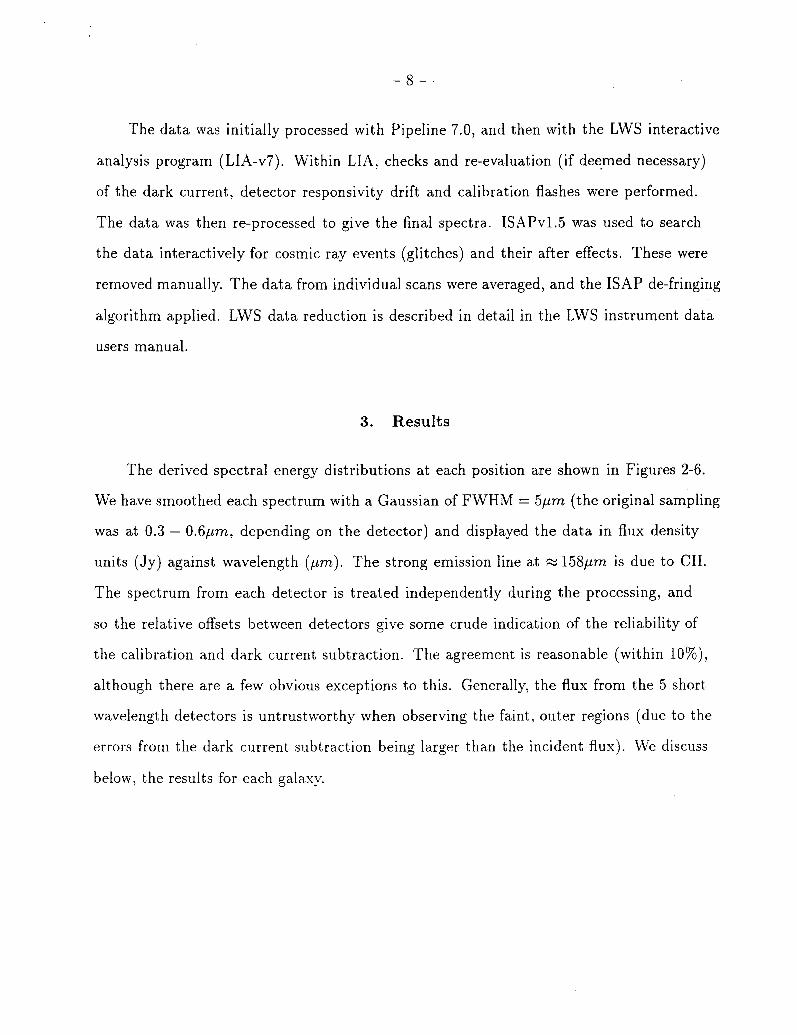
The data was initially processed with Pipeline 7.0, and then with the LWS interactive
analysis program (LIA-~7) . Within LIA, checks and re-evaluation (if deemed necessary)
of the dark current, detector responsivity drift and calibration flashes were performed.
The data was then re-processed to give the final spectra. ISAPv1.5 was used to search
the data interactively for cosmic ray events (glitches) and their after effects. These were
removed manually. The data from individual scans were averaged, and the ISAP de-fringing
algorithm applied. LWS data reduction is described in detail in the LWS instrument data
users manual.
3. Results
The derived spectral energy distributions at each position are shown in Figures 2-6.
We have smoothed each spectrum with a Gaussian of FWHM = 5 p m (the original sampling
was at 0.3 - 0 .6pm, depending on the detector) and displayed the data in flux density
units (Jy) against wavelength (pum). The strong emission line at M 1 5 8 p m is due to CII.
The spectrum from each detector is treated independently during the processing, and
so the relative offsets between detectors give some crude indication of the reliability of
the calibration and dark current subtraction. The agreement is reasonable (within lo%),
although there are a few obvious exceptions to this. Generally, the flux from the 5 short
wavelength detectors is untrustworthy when observing the faint, outer regions (due to the
errors from the dark current subtraction being larger than the incident flux). We discuss
below, the results for each galaxy.
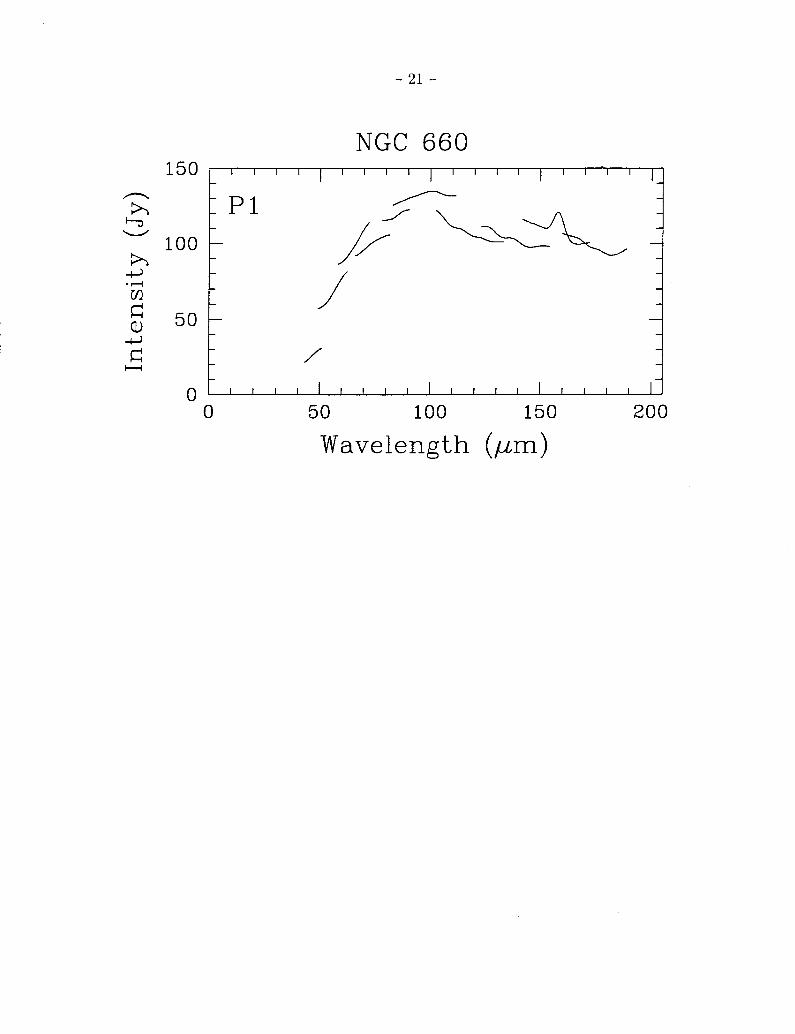
- 9 -
3.1. NGC 660
NGC 660 is a nearby polar ring galaxy, with concentrated far infrared emission
associ.ated with a nuclear starburst (Alton et al. 1998a). The nuclear starburst gives
this galaxy a high FIR/optical light ratio. It is likely to have the warmest central dust
component and therefore provides an interesting comparison to the other, more quiescent
galaxies. The LWS observations (Figure 2) show a SED that rises steeply from the
mid-infrared to peak at around lOOprn before falling off again into the far infrared.
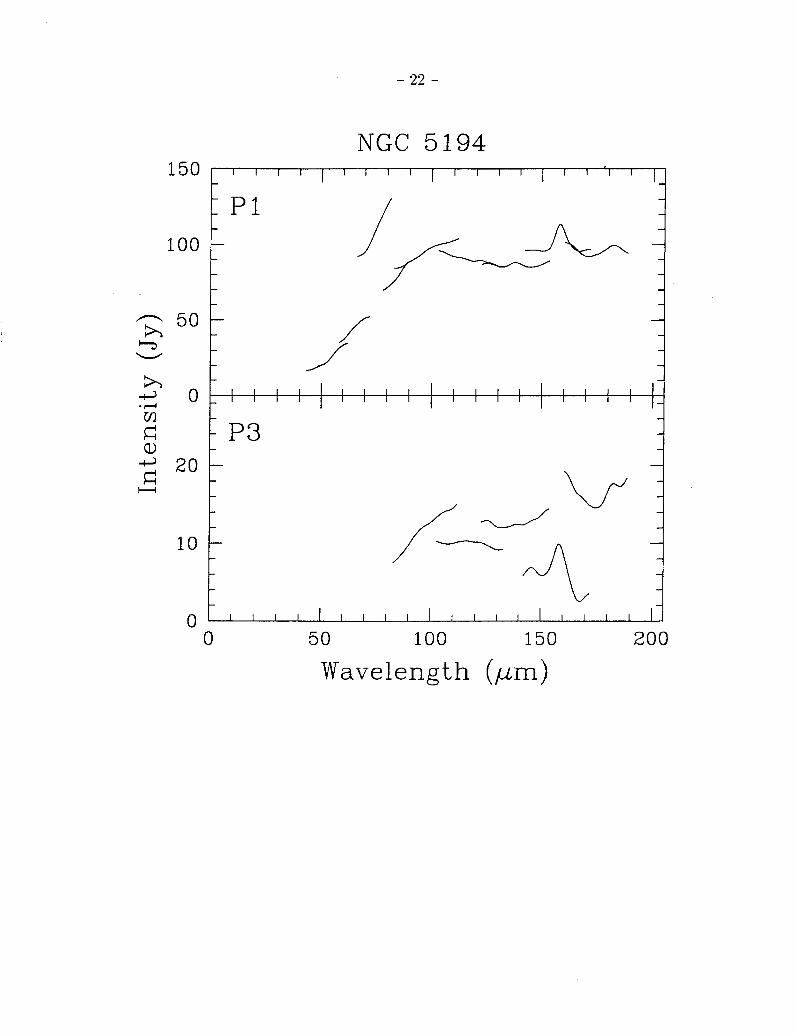
3.2. NGC 5194
The far infrared SED of the almost face-on “Whirlpool Galaxy”, M51, NGC 5194, is
shown in Figure 3. As seen for NGC 660, the spectrum of the central regions (Pl) rises
steeply from the mid-infrared until it turns over at e 100pm; although it does not appear to
drop-off beyond 100prn quite as rapidly as NGC 660. The P3 aperture lies in an inter-arm
region some 6.2 kpc or 2.2 optical (B band) scale lengths from the galactic center. The SED
of the outer regions (P3) is regrettably too noisy to be of use in this study.
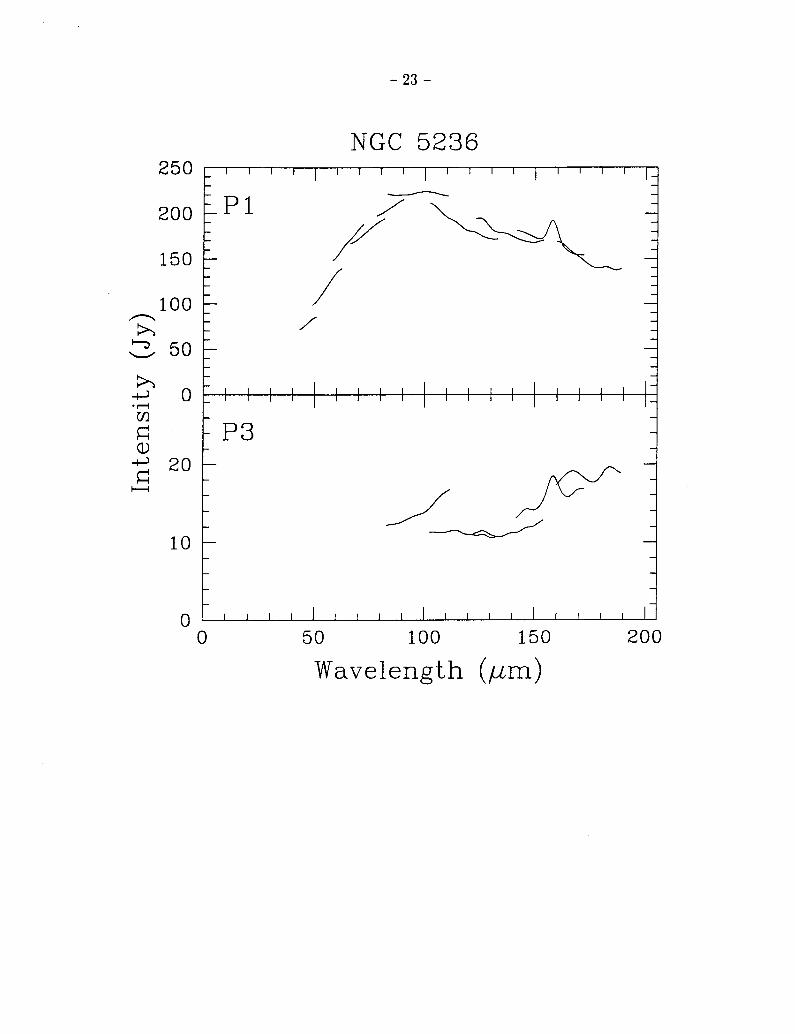
3.3. NGC 5236
This well known, nearby, barred spiral almost certainly contains a mild nuclear
starburst. As such, it might be expected that this galaxy would show a strong difference
between the nuclear and outer disk SEDs. Indeed, the nuclear ( P l ) SED (Figure 4) appears
remarkably similar to that of the starbursting NGC 660. The P3 aperture is some 6.9 kpc
or 1.6 optical scale lengths from the galactic center and appears to straddle a spiral arm.
The P3 SED rises steeply through the far infrared towards the sub-mm wi th no observed
peak and is demonstrably different from the P I spectrum.
- 10 -
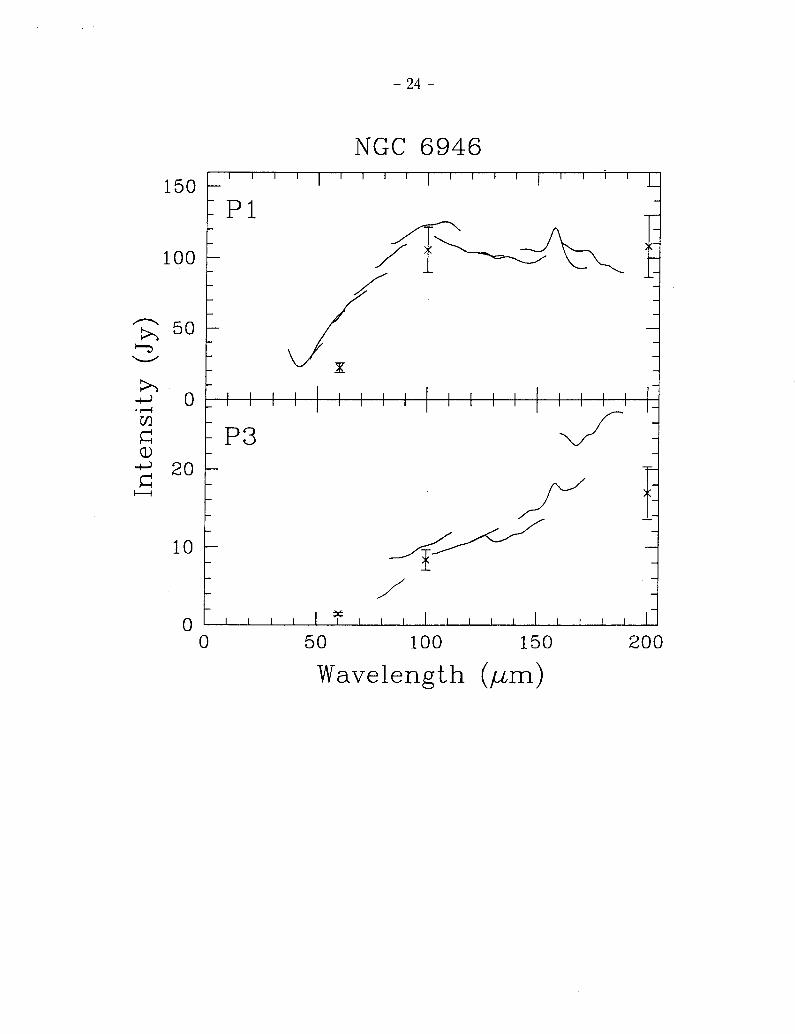
3.4. NGC 6946
This almost face-on Sc galaxy also contains a mild nuclear starburst. The SED
(Figure 5) at the P1 position is very similar to the other starburst regions (centers of
NGC 660 and NGC 5236). The P3 aperture is 10.1 kpc or 1.4 optical scale lengths from the
galactic center, devoid of very much optical emission, and apparently falling between spiral
arms. Again, the outer P3 position appears to be dominated by longer wavelength emission,
but even more dramatically than in the other galaxies. The spectrum is still steeply rising
to the long wavelength limit of LWS.
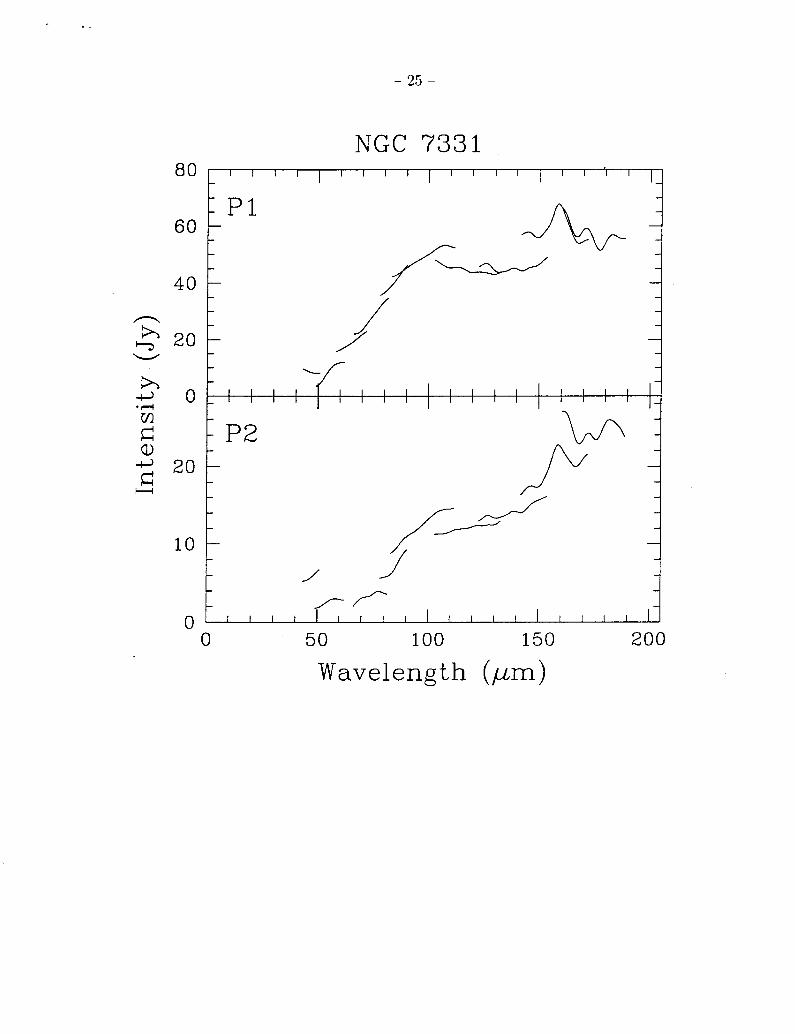
3.5. NGC 7331
For NGC 7331 there was a problem with the positioning of the apertures and they are
slightly off-set from those originally desired (Figure 1). Positions P1 and P2 were observed
(not P3 as it was too faint) and so the outer aperture is not as far from the galactic center
as in the other galaxies. But because this galaxy is inclined, the aperture does sample dust
above the galactic plane. For these reasons, we might expect a less significant difference
between the inner and outer regions. Still, P2 is 5.5 kpc or 2.2 optical scale lengths from
the center and Figure 6 shows that the spectrum of NGC 7331 displays a marked difference
between the central regions and outer disk, and may be compared with the observations of
NGC 5194.
3.6. Comparison with IRAS and ISOPHOT
Given our objective, which was to confirm or reject our assertion that cold dust
emission dominates at large distance from the galactic center, the absolute calibration of the
spectra is not crucial: the important issue is how the relative SEDs change with position.
- 11 -
Even so, we have checked the calibration against previous observations of NGC 6946 made
by IRAS and ISOPHOT. We have made simple beam-size corrections assuming a point
source (center) and constant point spread function shape (outer regions). We have included
the data points in Figure 5. The LWS calibrated data agree reasonably well to those
measured by IRAS and ISOPHOT and show similar overall trends.
A very crude scale length (from 2 points) can be determined from the LWS spectra
(assuming an exponential distribution). For NGC 6946, we find scale lengths of 60”, 70”
and 150” at 60, 100 and 200pm respectively. These compare well with the scale lengths
measured from full profiles, using the IRAS and ISOPHOT data, which were 87“, 82“ and
158” for the 60, 100 and 200pm data respectively (Alton et al. 1998a).
Considering the observations were made with different telescopes, instruments,
observing procedures and data reduction techniques and are subject to a rather uncertain
beam correction, the agreement in both the flux values and the scale lengths is reasonable
and adds confidence to our scientific results.
4. Discussion
The presence of an extended distribution of cold dust, that was entirely missed by
IRAS, was suggested from controversial interpretations of indirect evidence (Valentijn 1990,
Beckman et al. 1996). The first direct (but still controversial) observational evidence of
its existence (Zaritsky 1994) has been slow to be accepted. Early criticisms and questions
were: How could the dust get there? Or, was the result a statistical fluctuation? Certainly,
modelling with only one warm component of dust is relatively easy and opposition to
further complications is only natural. But, the gap between model and observations ha.s
steadily grown.
- 12 -
The LWS data presented in this paper clearly demonstrates that there is a distinct
change in the SED with galactocentric radius in disk galaxies. The central regions of
these galaxies are dominated by a warm component (T M 30-35K). The outer regions
have spectra dominated by dust that has a SED peak beyond 200p.m and so must be
colder than Tm20K. This highlights the misleading impression that one can obtain from
single-aperture far-infrared measurements of galaxies, which will always be dominated by
the small, warm dust component at the center. Given the poor resolution of IRAS and ISO,
the majority of detected galaxies will have very inaccurately determined dust temperatures
and masses.
To illustrate this point we have assumed an exponential far infrared surface-brightness
distribution and used the aperture photometry and approximate scale lengths calculated
in section 3.6 to estimate the global fluxes of NGC 6946 at 60, 100 and 200pm. These
are normalized to the 60p.m flux and compared to similar ratios at the center. The center
regions give (60:100:200) 1 : 2.4 : 1.8 while the global values are 1 : 3.3 : 11.2.
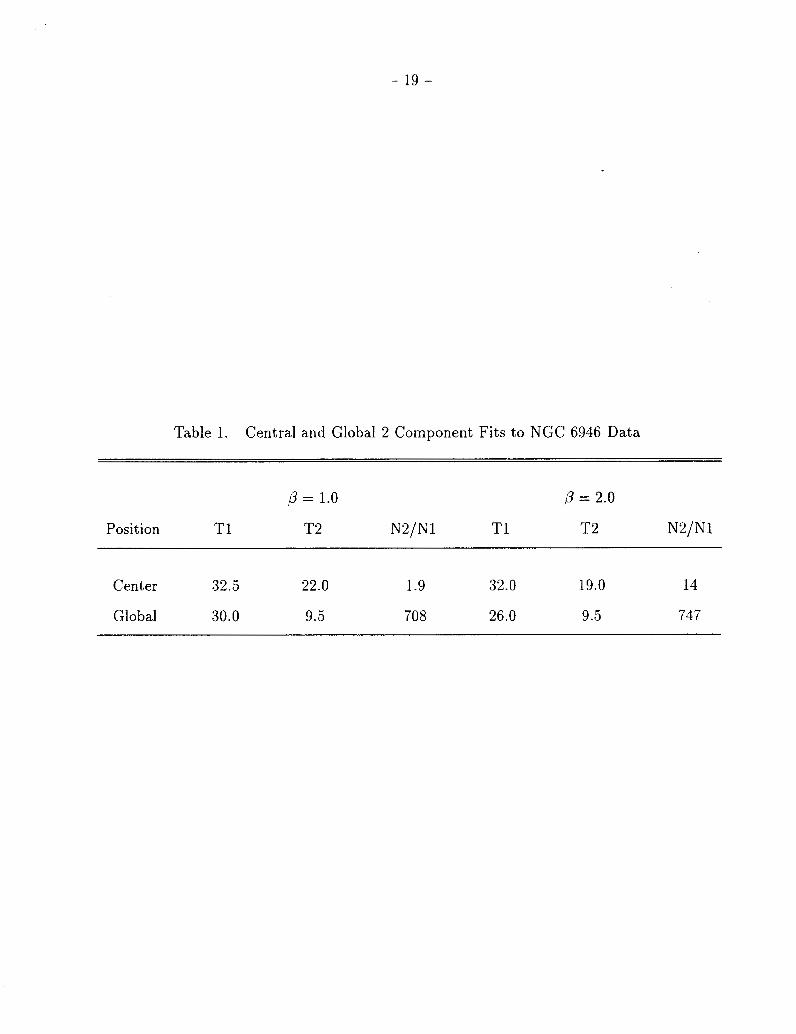
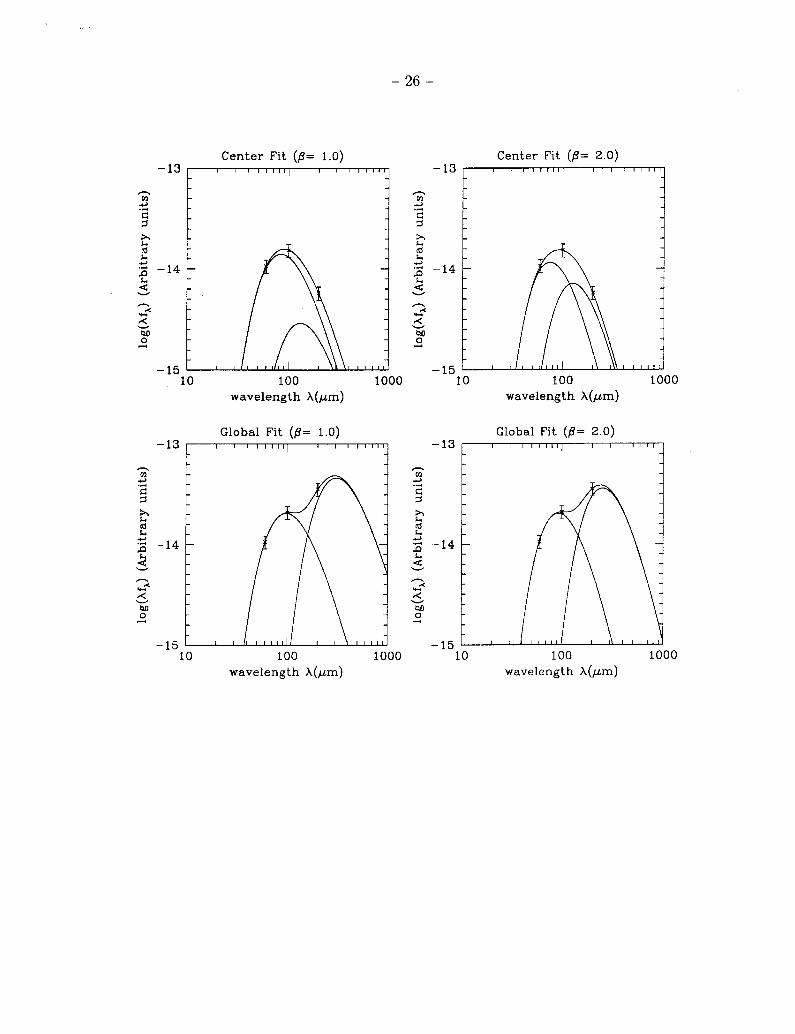
To demonstrate how this spectral change could affect our understanding of the derived
mass and temperature of the dust, we have fitted a two-component grey-body model
( p = 1.0 and /? = 2.0) to these relative spectra. The temperatures and mass ratios of the
components are given in Table 1. The model spectra are shown in Figure 7, the units
have been chosen so that the height of the graph is roughly proportional to the amount of
energy a given wavelength contributes. For the central regions, the fits require a cold dust
component with 2 - 14x the mass of the warm component. These are consistent with our
ISOPHOT results that found a central cold dust component containing 4 - l o x the mass
of the warm dust. The global fits have markedly different spectra. The fits for / j = 1.0 and
/? = 2.0 both require cold dust components with temperatures of Tc M loti; energy peaks
at wavelengths of 300 - 400pm; and htc M 700 x the ma.ss of the warm dust component.
- 13 -
Although the above provides one possible fit to the LWS spectra, we should emphasize
(as can be seen from Figure 7) that the cold dust component fits are poorly constrained
due to the lack of data a t wavelengths beyond 200p.m, and although we present the best
(least squares) fit here, a large range of formal fits are allowable within the observational
errors. The formal cold-dust temperature range is 2 < Tc < 25 and Mc could vary by up
to a factor of 100.
With the addition of the LWS results presented in this paper, there are now three
pieces of observational evidence (Davies et al. 1997, Alton et al. 1998a) that the cold dust
in galaxies is more spatially extended in the radial direction than the warm dust detected
by IRAS. There are also now three pieces of observational evidence that suggest dust can
be distributed to large distances above the plane of galaxy disks (Zaritsky 1994, Davies et
al. 1997, Alton et al. 199813).
In addition to the observational evidence, we now also have a better understanding of
how dust might populate these outer regions. Greenberg (1987) considered the transport
of dust into the halo showing that radiation pressure can expel dust to relatively large
distances ( z 15kpc) above the galactic plane. In nearby, edge-on galaxies, this dust injection
can be seen around and above the star formation regions in the disk (Howk & Savage 1997,
Ferrara 1996). We have recently investigated this further (Davies et al. 1998) and find that
the expulsion distance is very dependent on the disk opacity: where optically thin disks
can expel dust at high velocity to large distances. A significant dust enrichment of the
halo therefore may well have occurred very early on in the life of a galaxy before the disk
obtained a significant opacity. In present-day galaxies, this enrichment may only occur in
proximity to star formation regions where the radiation pressure is exceptionally high.
With a theoretical framework of the mechanisms by which dust may populate halos of
clisk galaxies (and mounting observational evidence for its existence) it seems we cannot
- 14 -
escape the conclusion that galaxies contain two components of dust: a spatially extended
distribution of cold dust, and a concentrated warm dust component in the disk which is
probably associated with star formation.
A second distinct component of dust obviously complicates the process of determining
the extinction and opacity of spiral disks and a large halo of dust may significantly increase
the obscuration of the distant Universe (Wright 1990, Fall & Pei 1993). It is also clear
that our understanding of the star formation history and/or the dust mass budget of disks
(Eales & Edmunds 1996) will have to be re-evaluated; the halo is being chemically enriched
somehow, either through in situ star formation, or through transportation of material from
star formation sites in the plane.
But, perhaps the most important implication of this result is the suggestion that the
far infrared emission could be associated with cold dense halo clouds that could make
up a significant fraction of the halo mass (Gerhard & Silk 1996). The cold dust itself
cannot possibly account for the total halo mass, but if it were linked to the dominant
mass compenent, the emission we detect could act as a tracer of the halo mass. Certainly,
other molecular material has been tentatively detected in the outer parts of the Milky
Way (Lequeus et al. 1993). Very recently H z has been discovered in enough quantity to
account for all the missing mass in NGC 891 (Valentijn and van der Werf 1999). Molecular
hydrogen is often linked with dust as it is believed that dust provides the major mechanism
for converting neutral Hydrogen into H z .
5. Conclusions
From analysis of our LWS observations of .5 disk galaxies our conclusions are:
- 15 -
1. The central SED is very similar to that inferred globally for galaxies by IRAS. The
central SED peaks at - 100pm leading to inferred dust temperatures of 30-35 K.
2. The SED in the outskirts of these galaxies is still rising at the last data point (197pm),
indicating cold dust temperatures of less than 20 K.
3. Although a global measurement of the SED distribution (for example, a measurement
of a distant galaxy subtending an angle smaller than the telescope point spread
function) would indicate dust temperatures of 30-35K. In fact, there is probably at
least an order of magnitude more cold dust than warm dust in galaxies.
4. There is increasing evidence, from a number of quite different sources, that the cold
dust component is extensive around galaxies. This cold dust may be associated with
the halos responsible for flat rotation curves.
We are extremely grateful to Sergio Molinari for his help with the data reduction and
the use of the LPVS interactive analysis software. We would also like to thank Rhodri Evans,
Steve Lord and George Helou for their early comments and discussion of the results.
- 1 6 -
REFERENCES
Alton, P.B., Trewhella, M., Davies, J.I., Evans, Rh., Bianchi, S., Gear, W., Thronson, H.,
Valentijn, E., & Witt , A. 1998a, A&A, 335, 807
Alton, P.B., Bianchi, S., Rand, R.J., Xilouris, E.M., Davies, J.I., & Trewhella, M. 199813,
ApJ, 507, L129
Beckman, J., Peletier, R., Knapen, J., Corradi, R. & Gentet, L., 1996 ApJ, 467, 175
Beichman, C. 1987, ARA&A, 25, 521
Bianchi, S., Ferrara, A., & Giovanardi, C. 1996, ApJ, 465, 127
Bianchi, S., Ph.D. Thesis, University of Wales
Davies, J., Phillipps, S., Boyce, P., & Disney M. 1993, MNRAS, 260, 491
Davies, J.I., Trewhella, M., Jones, H., Madden, A., Moss, J. & Lisk, C. 1997, MNRAS, 28,
679
Davies, J.I., Alton, P., Bianchi, S. & Trewhella, M. 1998, MNRAS, 300, 1006
Devereux, N. S: Young, J. 1990, ApJ, 359, 42
Disney, M., Davies, J.I. & Phillipps, S. 1989, MNRAS, 239, 939
Eales, S., & Edmunds, M.G. 1996, MNRAS, 280, 1167
Fall, S . M . , & Pei, Y.C. 1993, ApJ, 402, 479
Ferrara, A. 1996, in The Physics of Galactic Halos, ed. Lesch H., Springer-Verlag, Berlin
Gerhard, 0. k Silk, .J. 1996, ApJ, 472, 34
Crree1lbet-g. M.. Ferrini, F., Barsells, B., 8~ k\iello, S. 1987, Nature, 327, 213
- 1 7 -
Hiltner, W., & Johnson H., 1956, ApJ, 124, 367
Howk, J., & Savage, B. 1997, AJ,114, 2463
de Jong, R. 1996, A&A, 313, 377
Kylafis, N., & Bahcall, J. 1987, ApJ, 317, 637
Lequeux, J . , Allen, R., & Guilloteau, S. 1993, A&A, 280, L23
Ostriker, J.P., & Heisler, J., 1984, ApJ, 287, 1
Trewhella, M., Davies J.I., Disney, M., & Jones,H. 1997, MNRAS, 288, 397
Trewhella, M., Madore, B.F., & Kuchinski, L. 1999, ApJ, in preparation
Valentijn, E. 1990, Nature, 346, 153.
Witt, A.N., Thronson, H.A., & Capuano, J.M. 1992, ApJ, 393, 611
Wright, E. 1990, ApJ, 353, 411
Xilouris, E.M, “llton, P.B., Davies, J.I., Kylafis, N., Papamastorakis, J., & Trewhella, M.
199S, AScA, 331, 894
Zaritsky, D. 1994, AJ, 108, 1619
This manuscript was prepared with the AAS Dl?@ macros v4.0.
- 18 -
Fig. 1.- LWS pointings for galaxy sample. The observed effective apertures for each galaxy
are shown overlaid on optical (from DSS) and 100prn (IRAS HiRes) images.
Fig. 2.- Spectral energy distribution of NGC 660 in the central regions.
Fig. 3.- Spectral energy distribution of NGC 5194. The upper panel shows the central
regions, the lower panel shows a point 200” from the center. The detectors where the signal
is less than the errors in the dark current subtraction (SW1, SW2, SW3 and SW4) have
been omitted from the plot.
Fig. 4.- Spectral energy distribution of NGC 5236. The upper panel shows the central
regions, the lower panel shows a point 200” from the center. The detectors where the signal
is less than the errors in the dark current subtraction (SW1, SW2, SW3 and SW4) have
been omitted from the plot.
Fig. 5.- Spectral energy distribution of NGC 6946. The upper panel shows the central
regions, the lower panel shows a point 200” from the center. The detectors where the signal
is less than the errors in the dark current subtraction (SW1, SW2, SW3 and SW4) have
been omitted from the plot.
Fig. 6.- Spectral energy distribution of NGC 7331. The upper panel shows the central
regions, the lower panel shows a point 100” from the center.
Fig. 7.- Comparison of the global SED of NGC 6946 with the SED at the center. The
central fluxes are well fit by a 2 component model with 2 - 14x the mass in the cold
component as in the warm. For the global fits however, the outer regions require a cold dust
component with a mass w7OOx that of the warm dust component.
- 19 -
Table 1. Central and Global 2 Component Fits to NGC 6946 Data
p = 1.0 p = 2.0
Position T1 T2 N2/N1 T1 T2 N2/N1
Center 32.5 22.0 1.9 32.0 19.0 14
Global 30.0 9.5 708 26.0 9.5 747
- 20 -
NGC 660 - Optical NGC 5194 - Optical
RA
NGC 5236 - O~t ico l
RA
NGC 6946 - Ooticol
20d3.5 ' Z04hd ' ' 204.'25' 201'20 RA
NGC 7331 - Ootical
RA
R A
- 21 -
150
100
50
0
NGC 660
Ip1 i 0 50 100 150
Wavelength (pm) 200
- 22 -
150
100
50
0
20
10
0 0 50 100 150
Wavelength (pm) 200
- 23 -
NGC 5236 250
200
150
W 5 0 1
/
k H
10 1 - - - - - - -
0 I l l I l l l l l l l l l l l l l l l I
0 50 100 150 200
-
Wavelength (prn)
- 24 -
NGC 6946 150
100
n +a 50 5 W
z l P 3 Q) t -I
10 I
Wavelength (pm)
80
- 25 -
NGC 7331 c " " " " " " " " " ' ~ ~
60
40
n
5 20 W
k H
10
0 0 50 100 150 200
Wavelength ( p m )
- 26 -
Center Fit (@= 1.0)
h
2 G 1
VI
- 13 ~
Center Fit (@= 2.0)
wavelength A(pm) wavelength X(pm)
- 1 3 4 Global Fit (@= 1.0)
- 1 3 z Global Fit (@= 2 . 0 )
- 1
-1
wavelength X(pm) wavelength h(,um)
Related Documents


