J.M. Butler - ISFG 2011 CE Workshop August 30, 2011 http://www.cstl.nist.gov/strbase/NISTpub.htm 1 Fundamentals of Capillary Electrophoresis John M. Butler, PhD National Institute of Standards and Technology (NIST) [email protected] +1-301-975-4049 http://www.cstl.nist.gov/biotech/strbase/training.htm ISFG Pre-Conference Workshop Vienna, Austria August 30, 2011 Presentation Outline • History and background on CE • Fundamentals of CE – sample prep, injection, separation, detection BREAK • ABI 3500 • Troubleshooting strategies and solutions • Questions My Goal: To help you understand the basic chemistry behind DNA separations and to help make CE instruments less of a “black box” NIST and NIJ Disclaimer Funding: Interagency Agreement between the National Institute of Justice and NIST Office of Law Enforcement Standards Points of view are mine and do not necessarily represent the official position or policies of the US Department of Justice or the National Institute of Standards and Technology. Certain commercial equipment, instruments and materials are identified in order to specify experimental procedures as completely as possible. In no case does such identification imply a recommendation or endorsement by the National Institute of Standards and Technology nor does it imply that any of the materials, instruments or equipment identified are necessarily the best available for the purpose. Our publications and presentations are made available at: http://www.cstl.nist.gov/biotech/strbase/NISTpub.htm Steps in DNA Analysis DNA Extraction Multiplex PCR Amplification Sample Collection & Storage Buccal swab Blood Stain DNA Quantitation Slot Blot 1 ng 0.3 ng 1 ng 1 ng 0.7 ng 0.5 ng 0.5 ng No DNA Usually 1-2 day process (a minimum of ~5 hours) If a match occurs, comparison of DNA profile to population allele frequencies to generate a case report with probability of a random match to an unrelated individual Technology Biology Genetics DNA Database Search Collection Extraction Quantitation STR Typing Interpretation of Results Database Storage & Searching Specimen Storage Multiplex PCR Calculation of Match Probability Steps Involved Pioneers of Capillary Electrophoresis James Jorgenson University of North Carolina Barry Karger Northeastern University Stellan Hjertén Uppsala University 1967 First high voltage CE system (with rotating 3 mm i.d. capillaries) 1981 First “modern” CE experiments (with 75 μm i.d. capillaries) 1988/90 First DNA separations in a capillary (gel-filled/ sieving polymer) Stellan Hjertén In 2003 at age 75 With first fully automated capillary free zone electrophoresis apparatus in 1967 http://www.rsc.org/delivery/_ArticleLinking/DisplayArticleForFree.cfm?doi=b307798p&JournalCode=AN Uppsala University (Sweden) Received his PhD (1967) under Professor Arne Tiselius who had developed moving boundary zone electrophoresis in 1937 (Noble Prize in 1948)

ISFG2011-CEworkshop
Oct 26, 2014
Welcome message from author
This document is posted to help you gain knowledge. Please leave a comment to let me know what you think about it! Share it to your friends and learn new things together.
Transcript

J.M. Butler - ISFG 2011 CE Workshop August 30, 2011
http://www.cstl.nist.gov/strbase/NISTpub.htm 1
Fundamentals of
Capillary
Electrophoresis John M. Butler, PhD
National Institute of Standards and Technology (NIST)
+1-301-975-4049
http://www.cstl.nist.gov/biotech/strbase/training.htm
ISFG Pre-Conference Workshop
Vienna, Austria
August 30, 2011
Presentation Outline
• History and background on CE
• Fundamentals of CE
– sample prep, injection, separation, detection
BREAK
• ABI 3500
• Troubleshooting strategies and solutions
• Questions
My Goal:
To help you understand the basic chemistry behind DNA separations
and to help make CE instruments less of a “black box”
NIST and NIJ Disclaimer
Funding: Interagency Agreement between the National
Institute of Justice and NIST Office of Law
Enforcement Standards
Points of view are mine and do not necessarily represent
the official position or policies of the US Department of Justice or the
National Institute of Standards and Technology.
Certain commercial equipment, instruments and materials are identified
in order to specify experimental procedures as completely as
possible. In no case does such identification imply a
recommendation or endorsement by the National Institute of
Standards and Technology nor does it imply that any of the
materials, instruments or equipment identified are necessarily the
best available for the purpose.
Our publications and presentations are made available at:
http://www.cstl.nist.gov/biotech/strbase/NISTpub.htm
Steps in DNA Analysis
DNA
Extraction
Multiplex PCR Amplification
Male: 13,14-15,16-12,13-10,13-15,16
Interpretation of Results
Sample Collection
& Storage
Buccal swab Blood Stain
DNA
Quantitation
Slot Blot 1 ng
0.3 ng
1 ng
1 ng
0.7 ng
0.5 ng
0.5 ng
No DNA
Usually 1-2 day process (a minimum of ~5 hours)
If a match occurs, comparison of
DNA profile to population allele
frequencies to generate a case
report with probability of a random
match to an unrelated individual
STR Typing
DNA separation and sizing
Tec
hn
olo
gy
B
iolo
gy
Ge
ne
tic
s
DNA
Database
Search
Collection
Extraction
Quantitation
STR Typing
Interpretation
of Results
Database Storage & Searching
Specimen Storage
Multiplex PCR
Calculation of
Match Probability
Steps Involved
Pioneers of Capillary Electrophoresis
James Jorgenson
University of North Carolina
Barry Karger
Northeastern University
Stellan Hjertén
Uppsala University
1967 First high voltage CE
system (with rotating
3 mm i.d. capillaries)
1981 First “modern” CE
experiments (with 75 µm
i.d. capillaries)
1988/90 First DNA separations in
a capillary (gel-filled/
sieving polymer)
Stellan Hjertén
In 2003 at age 75
With first fully automated capillary free
zone electrophoresis apparatus in 1967
http://w
ww
.rsc.o
rg/d
eliv
ery
/_A
rtic
leLin
kin
g/D
isp
layA
rtic
leF
orF
ree.c
fm?d
oi=
b30
7798
p&
Journ
alC
ode
=A
N
Uppsala University (Sweden)
Received his PhD (1967) under Professor
Arne Tiselius who had developed moving
boundary zone electrophoresis in 1937
(Noble Prize in 1948)

J.M. Butler - ISFG 2011 CE Workshop August 30, 2011
http://www.cstl.nist.gov/strbase/NISTpub.htm 2
A Brief History of Capillary Electrophoresis
• 1937 – Tiselius develops moving boundary electrophoresis
• 1967 – Hjertén uses rotating 3 mm i.d. tubes for CE
• 1981 – Jorgenson and Lukacs demonstrate first high performance CE separations with 75 µm i.d. capillary
• 1988 – Karger‟s group shows DNA separations of single stranded oligonucleotides with gel-filled capillaries
• 1990 – Karger‟s group shows DNA separations with sieving polymers on DNA restriction fragments
• 1991 – Grossman expands work with sieving polymers
• 1992 – Bruce McCord starts working on PCR product separations with STR allelic ladders
My Experience with CE, STRs, etc.
• May 1993 – began working in Bruce McCord‟s lab at Quantico
• Sept 1993 – developed mtDNA amplicon quantitation method (used in FBI casework from 1996 to present)
• Nov 1993 – first demonstration of STR typing by CE (using dual internal standards and TH01 ladder)
• July 1995 – defended Ph.D. dissertation entitled “Sizing and Quantitation of Polymerase Chain Reaction Products by Capillary Electrophoresis for Use in DNA Typing”
• July 1995 – ABI 310 Genetic Analyzer was released
150 bp 300 bp
TH01 allelic
ladder
Technology Implementation Takes Time – the FBI did not start
running casework samples using STRs and CE until January 1999
Performed in December 1993
Research performed at FBI
Academy in the Forensic
Science Research Unit
First Rapid STR Typing with Capillary Electrophoresis
Single color detection with dual internal size standards
Butler et al. (1994) BioTechniques 17: 1062-1070
My Experience with CE, STRs, etc.
(cont.)
• 1996-1997 Developed STRBase while a postdoc at NIST
• Nov 1998 – GeneTrace Systems purchased a 310; typed several hundred samples with Profiler Plus and Cofiler kits and compared results to mass spec STR analysis
• 1999-present – Run thousands of samples with all STR kits available (except PP 1.2) and developed a number of new STR multiplex systems
• Jan 2001 – Published “Forensic DNA Typing: Biology and Technology behind STR Markers” (2nd Edition in Feb 2005)
• April 2001-present – Use of ABI 3100 16-capillary array system
Scanned
Gel Image Capillary Electropherogram
STR Allele Separation Can Be Performed by Gel or
Capillary Electrophoresis with Detection of
Fluorescent Dyes Labeling Each PCR Product
8 repeats
10 repeats Locus 1
8 repeats
9 repeats Locus 2
Why Use CE for DNA Analysis?
1. Injection, separation, and detection are automated.
2. Rapid separations are possible
3. Excellent sensitivity and resolution
4. The time at which any band elutes is precisely determined
5. Peak information is automatically stored for easy retrieval
Gels Symbol first used in Oct 1994
at the Promega meeting when I
had a poster introducing the
use of CE for STR typing

J.M. Butler - ISFG 2011 CE Workshop August 30, 2011
http://www.cstl.nist.gov/strbase/NISTpub.htm 3
Important Differences Between CE and Gels
• Room temperature control is essential for run-to-run
precision
– CE uses sequential rather than simultaneous separations
– Usually need <
2.0 oC (must inject allelic ladder regularly)
• Lower amount of DNA loaded (injection = nL vs µL)
and thus detection sensitivity must be better
• Electrokinetic injection enables dye artifacts (blobs) to
enter the capillary or microchip CE channel and thus
possibly interfere with STR allele interpretation
More Differences between CE and Gels…
• Filling the capillary (or microchip CE channel) is analogous to pouring a gel into a tiny tube…
• Must be more clean around a CE system – Because the capillaries (µCE channels) are small,
particles of dust or urea crystals can easily plug them
– Tips of capillary cannot dry out (once buffer solutions have been run through them) for the same reasons
• Bubbles are a BIG problem in CE as they can easily block current flow in the capillary…
Inlet
(cathode)
Outlet
(anode)
Capillary Electrophoresis (CE)
Argon Ion
Laser
Fill with Polymer
Solution
50-100 µm x 27 cm
5-20 kV
- + Burn capillary
window
DNA Separation occurs in
minutes...
Sample
tray
Sample tray moves
automatically beneath the
cathode end of the capillary
to deliver each sample in
succession
Data Acquisition and Analysis
ABI 310
GeneAmp 9700 Typical Instruments Used
for STR Typing
ABI 3100
16-capillary array single capillary
Thermal Cycler for
PCR Amplification
Capillary electrophoresis instruments for separating and sizing PCR products
Genetic Analyzers from Applied Biosystems
ABI Genetic
Analyzer
Years Released
for Human ID
Number of
Capillaries Laser
Polymer
delivery Other features
373 (gel system)
1992-2003 -- 40 mW Ar+
(488/514 nm) --
PMTs and color filter wheel
for detection
377 (gel system)
1995-2006 -- 40 mW Ar+
(488/514 nm) -- CCD camera
310 1995- 1 10 mW Ar+
(488/514 nm) syringe
Mac operating system &
Windows NT (later)
3100 2000-2005 16 25 mW Ar+
(488/514 nm) syringe
3100-Avant 2002-2007 4 25 mW Ar+
(488/514 nm) syringe
3130 2003-2011 4 25 mW Ar+
(488/514 nm) pump
3130xl 2003-2011 16 25 mW Ar+
(488/514 nm) pump
3500 2010- 8 10-25 mW diode
(505 nm) new pump
110V power; RFID-tagged
reagents; .hid files;
normalization & 6-dye
detection possible 3500xl 2010- 24
3700 2002-2003 96 25 mW Ar+
(488/514 nm)
cuvette-
based Split beam technology
3730 2005- 48 25 mW Ar+
(488/514 nm) pump
3730xl 2005- 96 25 mW Ar+
(488/514 nm) pump
Information courtesy of Michelle S. Shepherd, Applied Biosystems, LIFE Technologies.
J.M. Butler (2011) Advanced Topics in Forensic DNA Typing: Methodology, Table 6.1
ABI Genetic Analyzer Usage at NIST (All instruments were purchased using NIJ funds)
ABI 310 • 1st was purchased in 1996 as Mac (A230, now B233)
• 2nd was purchased in June 2002 as NT (B261)
ABI 3100 3130xl • 1st purchased in April 2001 as ABI 3100
– upgraded to 3130xl in Sept 2005
– Located in a different room (A230, now B219)
• 2nd purchased in June 2002 as ABI 3100
– Original data collection (v1.0.1) software retained
– updated to 3130xl in Jan 2007 (B219, now B261)
ABI 3500 • Purchased Nov 2010 (B233)
Single capillary
16 capillaries
8 capillaries
J.M. Butler - ISFG 2011 CE Workshop August 30, 2011
http://www.cstl.nist.gov/strbase/NISTpub.htm 4
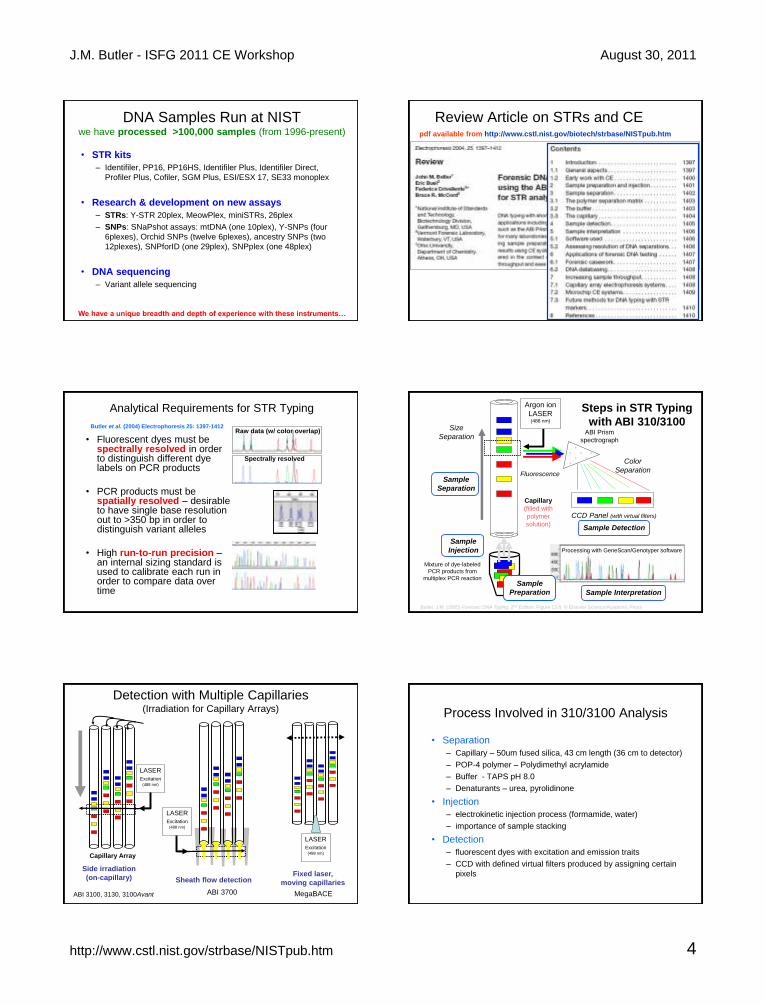
DNA Samples Run at NIST we have processed >100,000 samples (from 1996-present)
• STR kits
– Identifiler, PP16, PP16HS, Identifiler Plus, Identifiler Direct,
Profiler Plus, Cofiler, SGM Plus, ESI/ESX 17, SE33 monoplex
• Research & development on new assays
– STRs: Y-STR 20plex, MeowPlex, miniSTRs, 26plex
– SNPs: SNaPshot assays: mtDNA (one 10plex), Y-SNPs (four
6plexes), Orchid SNPs (twelve 6plexes), ancestry SNPs (two
12plexes), SNPforID (one 29plex), SNPplex (one 48plex)
• DNA sequencing
– Variant allele sequencing
We have a unique breadth and depth of experience with these instruments…
Review Article on STRs and CE pdf available from http://www.cstl.nist.gov/biotech/strbase/NISTpub.htm
Analytical Requirements for STR Typing
• Fluorescent dyes must be spectrally resolved in order to distinguish different dye labels on PCR products
• PCR products must be spatially resolved – desirable to have single base resolution out to >350 bp in order to distinguish variant alleles
• High run-to-run precision – an internal sizing standard is used to calibrate each run in order to compare data over time
Raw data (w/ color overlap)
Spectrally resolved
Butler et al. (2004) Electrophoresis 25: 1397-1412
Mixture of dye-labeled
PCR products from
multiplex PCR reaction
CCD Panel (with virtual filters)
Argon ion
LASER (488 nm)
Color
Separation Fluorescence
ABI Prism
spectrograph
Size
Separation
Processing with GeneScan/Genotyper software
Sample Interpretation
Sample
Injection
Sample
Separation
Sample Detection
Butler, J.M. (2005) Forensic DNA Typing, 2nd Edition, Figure 13.8, © Elsevier Science/Academic Press
Steps in STR Typing
with ABI 310/3100
Sample
Preparation
Capillary
(filled with
polymer
solution)
LASER
Excitation (488 nm)
Capillary Array
ABI 3100, 3130, 3100Avant
LASER
Excitation (488 nm)
Side irradiation
(on-capillary) Sheath flow detection
Detection with Multiple Capillaries (Irradiation for Capillary Arrays)
ABI 3700
LASER
Excitation (488 nm)
Fixed laser,
moving capillaries
MegaBACE
Process Involved in 310/3100 Analysis
• Separation
– Capillary – 50um fused silica, 43 cm length (36 cm to detector)
– POP-4 polymer – Polydimethyl acrylamide
– Buffer - TAPS pH 8.0
– Denaturants – urea, pyrolidinone
• Injection
– electrokinetic injection process (formamide, water)
– importance of sample stacking
• Detection
– fluorescent dyes with excitation and emission traits
– CCD with defined virtual filters produced by assigning certain
pixels

J.M. Butler - ISFG 2011 CE Workshop August 30, 2011
http://www.cstl.nist.gov/strbase/NISTpub.htm 5
Separation
Ohm‟s Law
• V = IR (where V is voltage, I is current, and R is resistance)
• Current, or the flow of ions, is what matters most in
electrophoresis
• CE currents are much lower than gels because of a
higher resistance in the narrow capillary
• CE can run a higher voltage because the capillary offers
a higher surface area-to-volume ratio and can thus
dissipate heat better from the ion flow (current)
DNA and Electrophoresis
“From a practical point of view it is disappointing that
electrophoresis cannot be used to fractionate or analyze
DNA‟s on the basis of size” Olivera, Biopolymers 1964, 2, 245
ep = q/6r
A T G C
PO- PO- PO-
As size increases so does charge!
small ions with high
charge move fastest
(a)
Larger DNA molecules interact
more frequently with the gel and are
thus retarded in their migration
through the gel
Gel
(b)
Ogston Sieving Reptation
Small DNA
molecules
Long DNA
molecules
Gel
Figure 12.4, J.M. Butler (2005) Forensic DNA Typing, 2nd Edition © 2005 Elsevier Academic Press
Separation Issues
• Electrophoresis buffer – – Urea for denaturing and viscosity
– Buffer for consistent pH
– Pyrolidinone for denaturing DNA
– EDTA for stability and chelating metals
• Polymer solution -- POP-4 (but others work also)
• Capillary wall coating -- dynamic coating with polymer – Wall charges are masked by methyl acrylamide
• Run temperature -- 60 oC helps reduce secondary structure on DNA and improves precision. (Temperature control affects DNA sizing)
What is in POP-4 and Genetic Analyzer Buffer?
POP-4 (4% poly-dimethylacrylamide, 8 M urea, 5% 2-pyrrolidinone)
Running buffer contains 100 mM
TAPS and 1 mM EDTA (adjusted
to pH 8.0 with NaOH) TAPS = N-
Tris-(hydroxymethyl)methyl-3-
aminopropane-sulfonic acid
US Patent 5,552,028 covers POP-4 synthesis
See also Wenz et al. (1998) Genome Research 8: 69-80
O
N
O
N
O
N
O
N
O
N
ON
J.M. Butler - ISFG 2011 CE Workshop August 30, 2011
http://www.cstl.nist.gov/strbase/NISTpub.htm 6
+
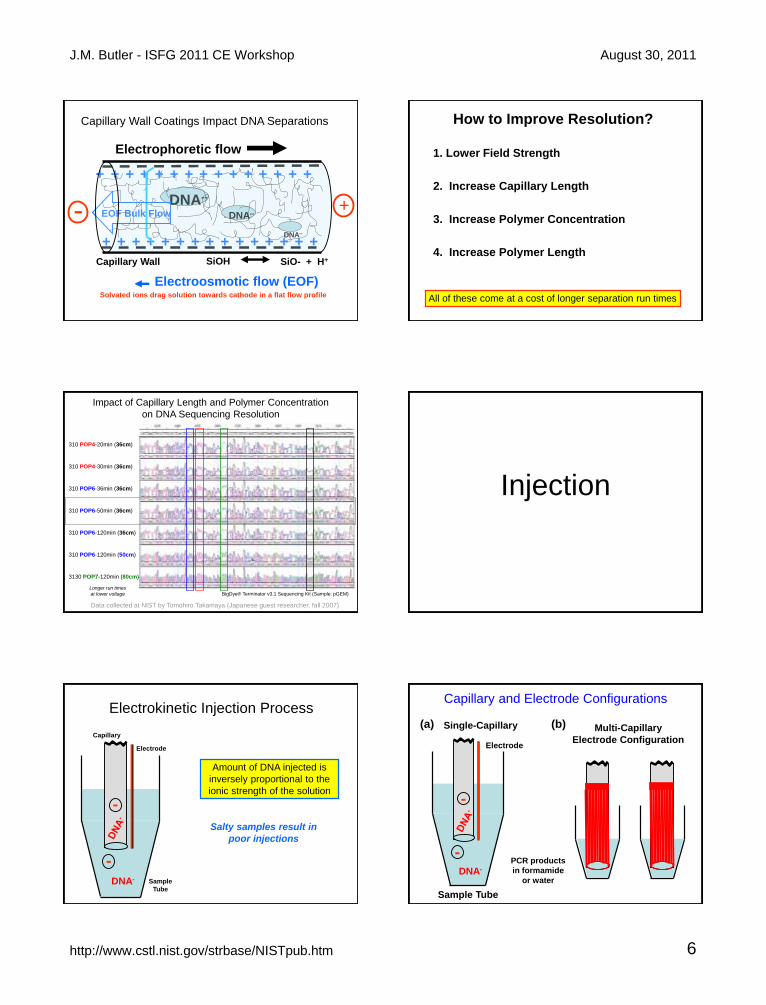
Capillary Wall Coatings Impact DNA Separations
Electrophoretic flow
SiOH SiO- + H+ Capillary Wall
Electroosmotic flow (EOF)
DNA--
DNA--
DNA--
+ + + + + + + + + + + + + + +
+ + + + + + + + + + + + + +
EOF Bulk Flow
Solvated ions drag solution towards cathode in a flat flow profile
+ -
How to Improve Resolution?
1. Lower Field Strength
2. Increase Capillary Length
3. Increase Polymer Concentration
4. Increase Polymer Length
All of these come at a cost of longer separation run times
310 POP4-20min (36cm)
310 POP4-30min (36cm)
310 POP6-36min (36cm)
310 POP6-50min (36cm)
310 POP6-120min (36cm)
310 POP6-120min (50cm)
3130 POP7-120min (80cm)
BigDye® Terminator v3.1 Sequencing Kit (Sample: pGEM)
Impact of Capillary Length and Polymer Concentration
on DNA Sequencing Resolution
Data collected at NIST by Tomohiro Takamaya (Japanese guest researcher, fall 2007)
Longer run times
at lower voltage
Injection
Sample
Tube DNA-
-
Electrokinetic Injection Process
Electrode
Capillary
-
Amount of DNA injected is
inversely proportional to the
ionic strength of the solution
Salty samples result in
poor injections
Sample Tube
DNA-
-
Electrode
Single-Capillary
-
PCR products
in formamide
or water
(a) (b) Multi-Capillary
Electrode Configuration
Capillary and Electrode Configurations
J.M. Butler - ISFG 2011 CE Workshop August 30, 2011
http://www.cstl.nist.gov/strbase/NISTpub.htm 7
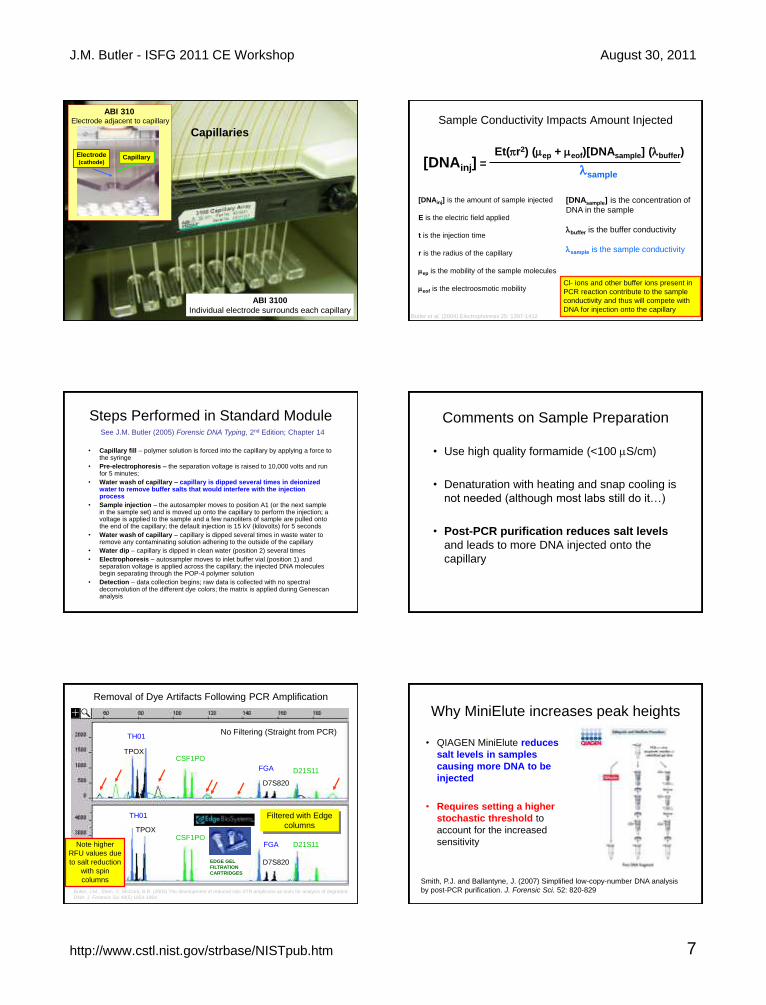
Capillaries
ABI 3100
Individual electrode surrounds each capillary
ABI 310
Electrode adjacent to capillary
Electrode (cathode)
Capillary
[DNAinj] is the amount of sample injected
E is the electric field applied
t is the injection time
r is the radius of the capillary
ep is the mobility of the sample molecules
eof is the electroosmotic mobility
Et(r2) (ep + eof)[DNAsample] (buffer)
sample [DNAinj] =
Butler et al. (2004) Electrophoresis 25: 1397-1412
[DNAsample] is the concentration of
DNA in the sample
buffer is the buffer conductivity
sample is the sample conductivity
Sample Conductivity Impacts Amount Injected
Cl- ions and other buffer ions present in
PCR reaction contribute to the sample
conductivity and thus will compete with
DNA for injection onto the capillary
Steps Performed in Standard Module
• Capillary fill – polymer solution is forced into the capillary by applying a force to the syringe
• Pre-electrophoresis – the separation voltage is raised to 10,000 volts and run for 5 minutes;
• Water wash of capillary – capillary is dipped several times in deionized water to remove buffer salts that would interfere with the injection process
• Sample injection – the autosampler moves to position A1 (or the next sample in the sample set) and is moved up onto the capillary to perform the injection; a voltage is applied to the sample and a few nanoliters of sample are pulled onto the end of the capillary; the default injection is 15 kV (kilovolts) for 5 seconds
• Water wash of capillary – capillary is dipped several times in waste water to remove any contaminating solution adhering to the outside of the capillary
• Water dip – capillary is dipped in clean water (position 2) several times
• Electrophoresis – autosampler moves to inlet buffer vial (position 1) and separation voltage is applied across the capillary; the injected DNA molecules begin separating through the POP-4 polymer solution
• Detection – data collection begins; raw data is collected with no spectral deconvolution of the different dye colors; the matrix is applied during Genescan analysis
See J.M. Butler (2005) Forensic DNA Typing, 2nd Edition; Chapter 14
Comments on Sample Preparation
• Use high quality formamide (<100 S/cm)
• Denaturation with heating and snap cooling is
not needed (although most labs still do it…)
• Post-PCR purification reduces salt levels
and leads to more DNA injected onto the
capillary
Butler, J.M., Shen, Y., McCord, B.R. (2003) The development of reduced size STR amplicons as tools for analysis of degraded
DNA. J. Forensic Sci 48(5) 1054-1064.
Filtered with Edge
columns
No Filtering (Straight from PCR) TH01
TPOX CSF1PO
D21S11
D7S820
FGA
TH01
TPOX CSF1PO
D21S11
D7S820
FGA
EDGE GEL
FILTRATION
CARTRIDGES
Removal of Dye Artifacts Following PCR Amplification
Note higher
RFU values due
to salt reduction
with spin
columns
Why MiniElute increases peak heights
• QIAGEN MiniElute reduces
salt levels in samples
causing more DNA to be
injected
• Requires setting a higher
stochastic threshold to
account for the increased
sensitivity
Smith, P.J. and Ballantyne, J. (2007) Simplified low-copy-number DNA analysis
by post-PCR purification. J. Forensic Sci. 52: 820-829

J.M. Butler - ISFG 2011 CE Workshop August 30, 2011
http://www.cstl.nist.gov/strbase/NISTpub.htm 8
Stochastic Effects and Thresholds
Regular Injection Injection Following Desalting (MiniElute)
False homozygote
Allele failed to amplify
When PCR amplifying low levels of
DNA, allele dropout may occur Stochastic threshold
must be raised
Allele failed to amplify
Detection
Dichroic Mirror
Capillary Holder
Microscope Objective Lens Laser Shutters
Laser Filter
Diverging Lens
Capillary
Long Pass Filter Re-imaging Lens
Focusing Mirror
CCD Detector
Diffraction
Grating
Argon-Ion
Laser (488/514 nm)
Optics for ABI 310
hex hem 1
2
3
So
S‟1
S1 energy
Excitation Emission
Wavelength (nm)
1 3
ex max em max
Flu
ore
scen
ce Stokes
shift
Fluorescence
Ethidium
bromide
DNA labeled with
intercalating dye
Unlabeled DNA
SYBR Green
Intercalator inserts
between base pairs on
double-stranded DNA (a)
Fluorescent dNTPs are incorporated
into both strands of PCR product
(b)
One strand of PCR product is
labeled with fluorescent dye Fluorescent dye
labeled primer (c)
Methods for Fluorescently Labeling DNA
Scanned
Gel Image Capillary Electropherogram
The polymerase chain reaction (PCR) is used to
amplify STR regions and label the amplicons with
fluorescent dyes using locus-specific primers
8 repeats
10 repeats Locus 1
8 repeats
9 repeats Locus 2

J.M. Butler - ISFG 2011 CE Workshop August 30, 2011
http://www.cstl.nist.gov/strbase/NISTpub.htm 9
FAM (blue)
JOE (green)
TAMRA (yellow)
ROX (red)
ABI Fluorescent Dyes Used in Four-Color Detection
ABI 310 Filter Set F
520 540 560 580 600 620 640
WAVELENGTH (nm)
100
80
60
40
20
0
5-FAM JOE NED ROX
Laser excitation
(488, 514.5 nm)
Fluorescent Emission Spectra for ABI Dyes
NED is a brighter
dye than TAMRA
Butler, J.M. (2001) Forensic DNA Typing, Figure 10.4, ©Academic Press
Scan number
Rela
tive F
luore
scence U
nits
DNA size in base pairs
Rela
tive F
luore
scence U
nits
Region shown below
(a)
(b)
Importance of Spectral Calibration
Before Color Separation
After Color Separation
ABI 310 Data
Matrix with 4 Dyes on ABI 310
I540= bxb + gyb + yzb + rwb intensity of blue
I560= bxg + gyg + yzg + rwg intensity of green
I580= bxy + gyy + yzy + rwy intensity of yellow
I610= bxr + gyr + yzr + ywr intensity of red
Where
b is the %blue labeled DNA
g is the %green labeled DNA, etc.
x,y,z,w are the numbers in the
matrix (sensitivity to each color)
If you solve xyzw for each dye individually
Then you can determine dye contribution for any mixture
5 x 5 matrix for 5-dye analysis on ABI 310
6FAM
VIC
NED
PET
LIZ
Raw Data for Matrix Standards Processed Data (matrix applied with baselining)
From Identifiler User‟s Manual
J.M. Butler - ISFG 2011 CE Workshop August 30, 2011
http://www.cstl.nist.gov/strbase/NISTpub.htm 10
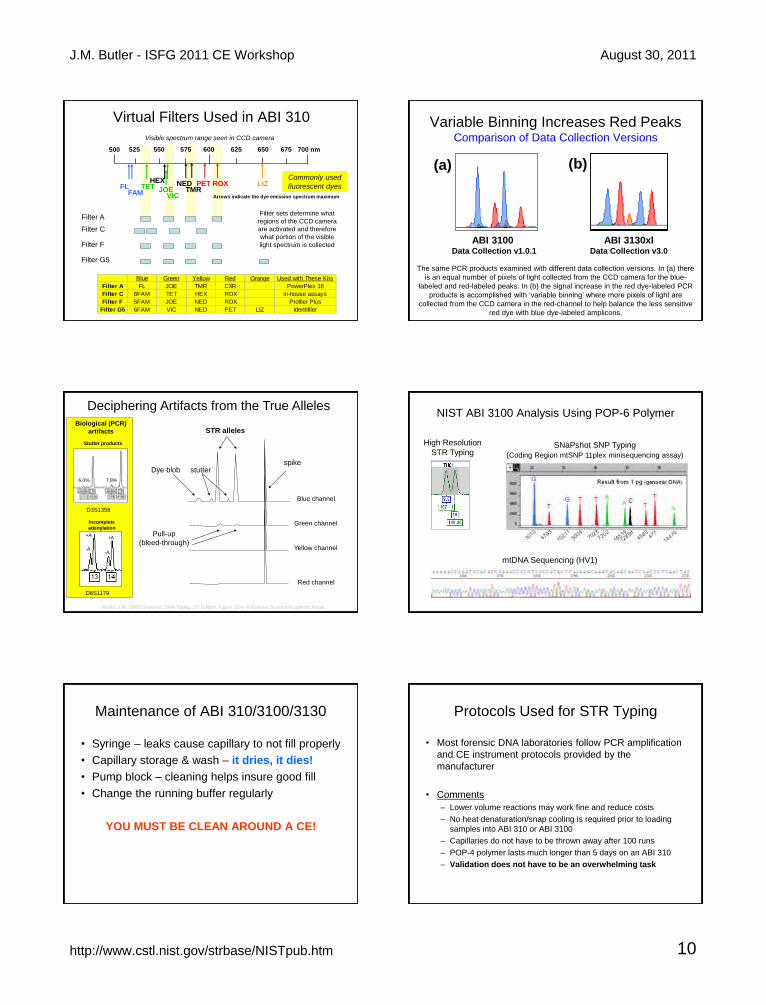
Virtual Filters Used in ABI 310
Blue Green Yellow Red Orange Used with These Kits
Filter A FL JOE TMR CXR PowerPlex 16
Filter C 6FAM TET HEX ROX in-house assays
Filter F 5FAM JOE NED ROX Profiler Plus
Filter G5 6FAM VIC NED PET LIZ Identifiler
500 600 700 nm 525 550 575 625 650 675
Filter A
Filter C
Filter F
Filter G5
FL FAM
TET
VIC JOE
HEX NED TMR
PET ROX LIZ
Visible spectrum range seen in CCD camera
Commonly used
fluorescent dyes
Filter sets determine what
regions of the CCD camera
are activated and therefore
what portion of the visible
light spectrum is collected
Arrows indicate the dye emission spectrum maximum
ABI 3100 Data Collection v1.0.1
ABI 3130xl Data Collection v3.0
(a) (b)
Variable Binning Increases Red Peaks Comparison of Data Collection Versions
The same PCR products examined with different data collection versions. In (a) there
is an equal number of pixels of light collected from the CCD camera for the blue-
labeled and red-labeled peaks. In (b) the signal increase in the red dye-labeled PCR
products is accomplished with „variable binning‟ where more pixels of light are
collected from the CCD camera in the red-channel to help balance the less sensitive
red dye with blue dye-labeled amplicons.
Dye blob
STR alleles
stutter
Pull-up
(bleed-through)
spike
Blue channel
Green channel
Yellow channel
Red channel
Butler, J.M. (2005) Forensic DNA Typing, 2nd Edition, Figure 15.4, © Elsevier Science/Academic Press
Deciphering Artifacts from the True Alleles
D3S1358
Stutter products
6.0% 7.8%
Incomplete
adenylation
D8S1179
-A
+A
-A
+A
Biological (PCR)
artifacts
SNaPshot SNP Typing
(Coding Region mtSNP 11plex minisequencing assay)
mtDNA Sequencing (HV1)
NIST ABI 3100 Analysis Using POP-6 Polymer
High Resolution
STR Typing
Maintenance of ABI 310/3100/3130
• Syringe – leaks cause capillary to not fill properly
• Capillary storage & wash – it dries, it dies!
• Pump block – cleaning helps insure good fill
• Change the running buffer regularly
YOU MUST BE CLEAN AROUND A CE!
Protocols Used for STR Typing
• Most forensic DNA laboratories follow PCR amplification
and CE instrument protocols provided by the
manufacturer
• Comments
– Lower volume reactions may work fine and reduce costs
– No heat denaturation/snap cooling is required prior to loading
samples into ABI 310 or ABI 3100
– Capillaries do not have to be thrown away after 100 runs
– POP-4 polymer lasts much longer than 5 days on an ABI 310
– Validation does not have to be an overwhelming task
J.M. Butler - ISFG 2011 CE Workshop August 30, 2011
http://www.cstl.nist.gov/strbase/NISTpub.htm 11
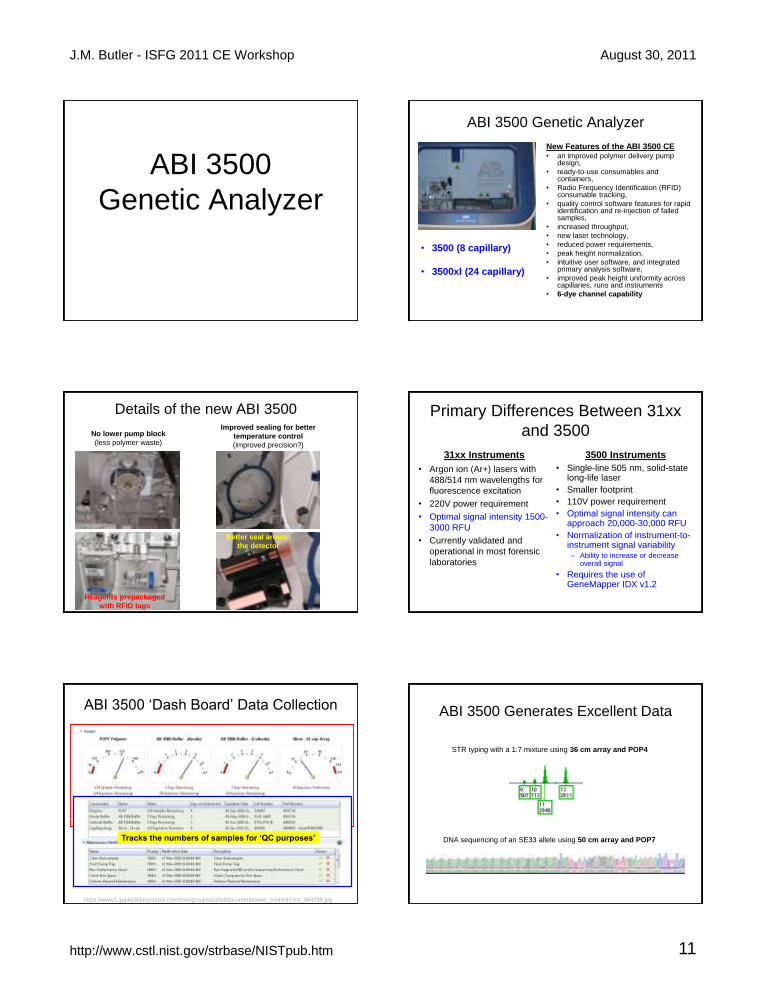
ABI 3500
Genetic Analyzer
ABI 3500 Genetic Analyzer
• 3500 (8 capillary)
• 3500xl (24 capillary)
New Features of the ABI 3500 CE
• an improved polymer delivery pump design,
• ready-to-use consumables and containers,
• Radio Frequency Identification (RFID) consumable tracking,
• quality control software features for rapid identification and re-injection of failed samples,
• increased throughput,
• new laser technology,
• reduced power requirements,
• peak height normalization,
• intuitive user software, and integrated primary analysis software,
• improved peak height uniformity across capillaries, runs and instruments
• 6-dye channel capability
Details of the new ABI 3500 Improved sealing for better
temperature control
(improved precision?)
Better seal around
the detector
No lower pump block
(less polymer waste)
Reagents prepackaged
with RFID tags
Primary Differences Between 31xx
and 3500
31xx Instruments
• Argon ion (Ar+) lasers with
488/514 nm wavelengths for
fluorescence excitation
• 220V power requirement
• Optimal signal intensity 1500-
3000 RFU
• Currently validated and
operational in most forensic
laboratories
3500 Instruments
• Single-line 505 nm, solid-state long-life laser
• Smaller footprint
• 110V power requirement
• Optimal signal intensity can approach 20,000-30,000 RFU
• Normalization of instrument-to-instrument signal variability – Ability to increase or decrease
overall signal
• Requires the use of GeneMapper IDX v1.2
ABI 3500 „Dash Board‟ Data Collection
https://www3.appliedbiosystems.com/cms/groups/portal/documents/web_content/cms_064299.jpg
Tracks the numbers of samples for „QC purposes‟
ABI 3500 Generates Excellent Data
DNA sequencing of an SE33 allele using 50 cm array and POP7
STR typing with a 1:7 mixture using 36 cm array and POP4

J.M. Butler - ISFG 2011 CE Workshop August 30, 2011
http://www.cstl.nist.gov/strbase/NISTpub.htm 12
Identifiler Result on ABI 3500xl
40,002 RFU
27,684 RFU
32,763 RFU
No pull-up observed
3500xl Low Injection, GS 600 v2
NIST Calculated Cost per Sample for
ABI 3130xl vs. 3500 and 3500xl Reagents
$0.79
$1.11
$1.50
$0.96
$0.00
$0.20
$0.40
$0.60
$0.80
$1.00
$1.20
$1.40
$1.60
Cost Per Sample
3130
3130 (ABAssumptions)
3500
3500xl
Running two plates per day (10 plates per week)
Troubleshooting: Strategies and Solutions
Bruce McCord‟s Profiles in DNA Article
Volume 6 (2), Sept 2003, pp. 10-12
http://marketing.appliedbiosystems.com/images/forensic/volume11/docs/52808_FN_FAS_r3.pdf
External Factors
• Room temperature
– Variations in room temperature can cause mobility shifts with
band shifts and loss of calibration
– Temperature is also important due to effects of high humidity on
electrical conductance
• Cleanliness
– Urea left in sample block can crystallize and catalyze further
crystal formation causing spikes, clogs and other problems.
– Best bet is to keep polymer in system and not remove or change
block until polymer is used up.

J.M. Butler - ISFG 2011 CE Workshop August 30, 2011
http://www.cstl.nist.gov/strbase/NISTpub.htm 13
Effect of temperature on allele size
FGA Allele 30
253
256
259
262
265
268
40 45 50 55 60 65 70 75
Temperature
Siz
e
Slope is 0.14 bases/degree centigrade
Therefore a small change in temperature has a big effect
(A 1-2 degree shift in temperature of the heat plate can produce an OL allele)
Hartzell, B., et al. (2003). Response of short tandem repeat systems to temperature and sizing methods.
Forensic Science International, 133, 228-234.
Temperature Effects Off-Ladder “OL Alleles”
“OL alleles ” - look at the 250 peak
-0.44 bp
“OL allele re-injected”

J.M. Butler - ISFG 2011 CE Workshop August 30, 2011
http://www.cstl.nist.gov/strbase/NISTpub.htm 14
And the 250 peak...
-0.12 bp
Monitoring Room Temperature Over Time
10 oC spread
(over many weeks)
Temperature Probes
Room temperature monitoring
Refrigerator and freezer monitoring
Frig/Freeze Monitors $240
#DT-23-33-80 – USB Temperature Datalogger
PLUS Software $79.00 (#DT-23-33-60)
Room Monitors, # DT-23039-52 – USB
Temperature-Humidity Datalogger $91.00
( Cole Parmer, Vernon Hills IL)
227/A230
227/B219-1
Temperature
Monitoring of two
separate
instrument rooms.
Box area is a 24
hour period where
temperature
control is not
stable.
Monitoring Instrument Room Temperature Fluctuations
Ladder Overlay, 6FAM
Combo1, 3130xl
Poor Temperature Control
Causes DNA Sizing Imprecision
Use of Second Allelic Ladder to Monitor Potential Match
Criteria Problems
1st Injection (standard for typing)
15th Injection (treated as a sample)
These alleles have drifted outside of their
genotyping bins due to temperature shifting
over the course of the sample batch
-0.75 bp -0.54 bp
J.M. Butler - ISFG 2011 CE Workshop August 30, 2011
http://www.cstl.nist.gov/strbase/NISTpub.htm 15
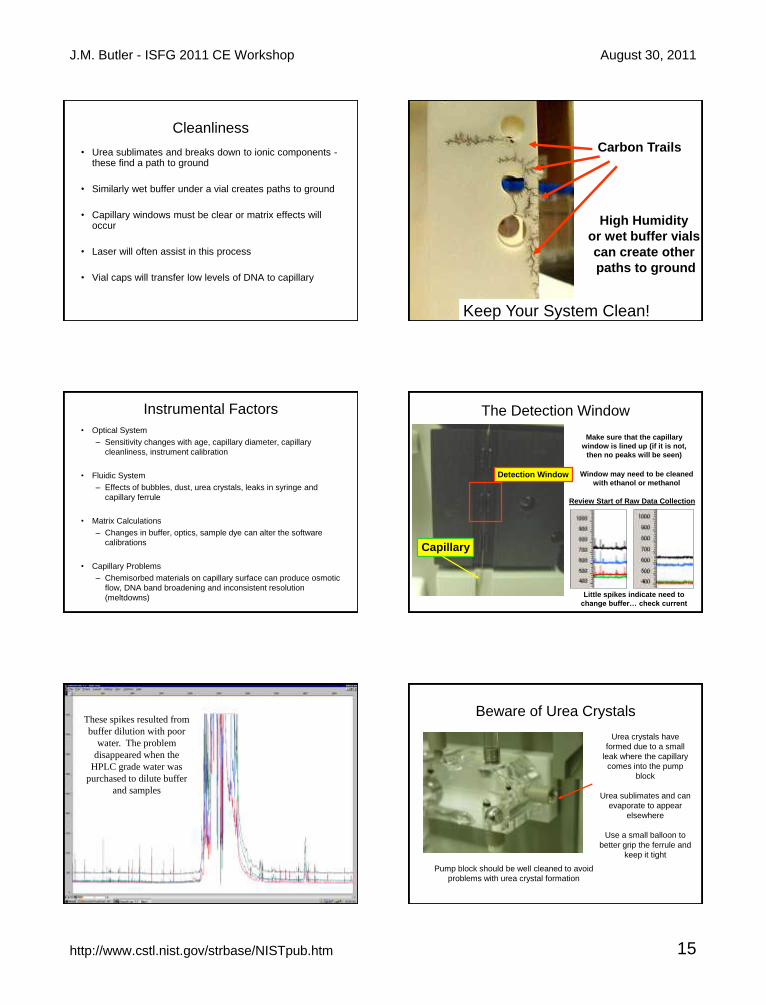
Cleanliness
• Urea sublimates and breaks down to ionic components - these find a path to ground
• Similarly wet buffer under a vial creates paths to ground
• Capillary windows must be clear or matrix effects will occur
• Laser will often assist in this process
• Vial caps will transfer low levels of DNA to capillary
Carbon Trails
High Humidity
or wet buffer vials
can create other
paths to ground
Keep Your System Clean!
Instrumental Factors
• Optical System
– Sensitivity changes with age, capillary diameter, capillary
cleanliness, instrument calibration
• Fluidic System
– Effects of bubbles, dust, urea crystals, leaks in syringe and
capillary ferrule
• Matrix Calculations
– Changes in buffer, optics, sample dye can alter the software
calibrations
• Capillary Problems
– Chemisorbed materials on capillary surface can produce osmotic
flow, DNA band broadening and inconsistent resolution
(meltdowns)
The Detection Window
Make sure that the capillary
window is lined up (if it is not,
then no peaks will be seen)
Window may need to be cleaned
with ethanol or methanol
Capillary
Detection Window
Review Start of Raw Data Collection
Little spikes indicate need to
change buffer… check current
These spikes resulted from
buffer dilution with poor
water. The problem
disappeared when the
HPLC grade water was
purchased to dilute buffer
and samples
Beware of Urea Crystals
Urea crystals have
formed due to a small
leak where the capillary
comes into the pump
block
Urea sublimates and can
evaporate to appear
elsewhere
Use a small balloon to
better grip the ferrule and
keep it tight
Pump block should be well cleaned to avoid
problems with urea crystal formation

J.M. Butler - ISFG 2011 CE Workshop August 30, 2011
http://www.cstl.nist.gov/strbase/NISTpub.htm 16
Buffer Issues
• The buffer and polymer affect the background
fluorescence- affecting the matrix
• Urea crystals and dust may produce spikes
• High salt concentrations may produce reannealing of
DNA
• High salt concentrations affect current
• Low polymer concentrations affect peak resolution
Meltdowns can be permanent or transitory as we have seen these may result from sample contamination effects
Does the capillary need to be replaced?
No! The next injection looks fine…
Meltdowns may be the result of
• Bad formamide
• Excess salt in sample/renaturation
• Water in the polymer buffer
• Syringe leak or bottom out
• Poisoned capillary
• Conductive polymer buffer due to urea degradation
• Crack/shift in capillary window
• Detergents and metal ions
Troubleshooting benchmarks
• Monitor run current
• Observe syringe position and movement during a batch
• Examine ILS (ROX) peak height with no sample
• Observe “250 bp” peak in GS500 size standard
• Monitor resolution of TH01 9.3/10 in allelic ladder and
size standard peak shapes
• Keep an eye on the baseline signal/noise
• Measure formamide conductivity
• Reagent blank – are any dye blobs present?
• See if positive control DNA is producing typical peak
heights (along with the correct genotype)
Measurement of Current
• V/I = R where R is a function of capillary diameter,
[buffer], and buffer viscosity
• In a CE system the voltage is fixed, thus changes in
resistance in the capillary will be reflected in the
current observed
• Air bubbles, syringe leaks, alternate paths to ground,
changes in temperature, changes in zeta potential,
and contamination, will be reflected in the current
• A typical current for a CE system with POP4 buffer is
8-12 µA (microamps)
Capillary
Heat plate
Detection
window
electrode
Autosampler
Gel block
Syringe
(with polymer)
Outlet buffer
reservoir Inlet buffer
reservoir
Sample tray
Samples

J.M. Butler - ISFG 2011 CE Workshop August 30, 2011
http://www.cstl.nist.gov/strbase/NISTpub.htm 17
Syringe Travel
• The ABI 310 instrument also keeps track of the position
of the syringe (in the log file)
• Depending on the resistance to flow, the syringe will
travel different lengths
• Syringe leaks may be reflected in a longer distance
traveled prior to each injection
• These leaks occur around the barrel of the syringe and
at the connection to the capillary block
Use of ABI 310 Log File to Monitor Current and Syringe Travel
Current
Syringe Position
ABI 3100 ABI 3130xl (upgraded from 3100)
Manually filled syringes
replaced by mechanical
pump with polymer
supplied directly from bottle
Mechanical pump
(for polymer delivery)
Polymer
bottle
Outlet
buffer
reservoir
Dual syringes
(for polymer
delivery)
Outlet
buffer
reservoir
Dye Blobs in the Negative Control Sample
Measuring Formamide Conductivity
(not this way)
The key is to measure the bottle when it comes in or buy the good
stuff and immediately pipette it out into small tubes with or without
ROX already added. Then freeze the tubes.
Do not ever open a cold bottle of formamide. Water will condense
inside and aid in the formation of conductive formic acid.
Conclusion:
Troubleshooting is more than
following the protocols
It means keeping watch on all aspects of the
operation
1. Monitoring conductivity of sample and
formamide
2. Keeping track of current and syringe position
in log.
3. Watching the laser current
4. Watching and listening for voltage spikes
5. Monitoring room temperature and humidity
J.M. Butler - ISFG 2011 CE Workshop August 30, 2011
http://www.cstl.nist.gov/strbase/NISTpub.htm 18
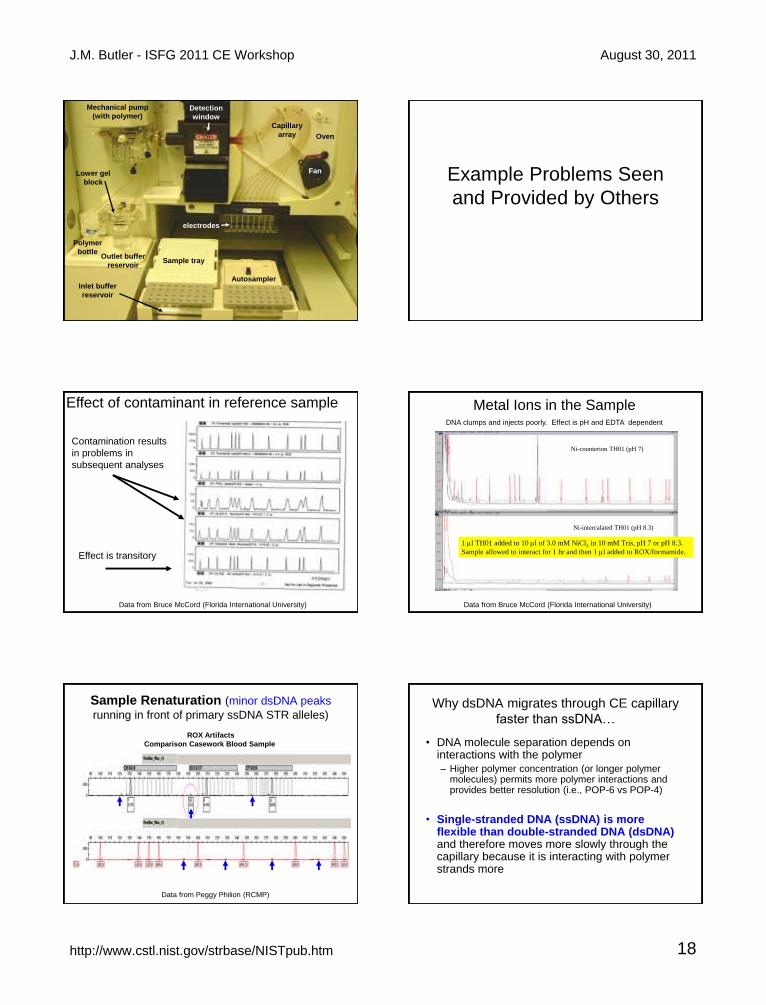
Mechanical pump
(with polymer)
Capillary
array Oven
Detection
window
electrodes
Autosampler
Lower gel
block
Polymer
bottle Outlet buffer
reservoir
Inlet buffer
reservoir
Sample tray
Fan Example Problems Seen
and Provided by Others
Effect of contaminant in reference sample
Contamination results
in problems in
subsequent analyses
Effect is transitory
Data from Bruce McCord (Florida International University)
Ni-counterion TH01 (pH 7)
Ni-intercalated TH01 (pH 8.3)
1 l TH01 added to 10 l of 3.0 mM NiCl2 in 10 mM Tris, pH 7 or pH 8.3.
Sample allowed to interact for 1 hr and then 1 l added to ROX/formamide.
Metal Ions in the Sample DNA clumps and injects poorly. Effect is pH and EDTA dependent
Data from Bruce McCord (Florida International University)
Sample Renaturation (minor dsDNA peaks
running in front of primary ssDNA STR alleles)
Data from Peggy Philion (RCMP)
ROX Artifacts
Comparison Casework Blood Sample
Why dsDNA migrates through CE capillary
faster than ssDNA…
• DNA molecule separation depends on interactions with the polymer – Higher polymer concentration (or longer polymer
molecules) permits more polymer interactions and provides better resolution (i.e., POP-6 vs POP-4)
• Single-stranded DNA (ssDNA) is more flexible than double-stranded DNA (dsDNA) and therefore moves more slowly through the capillary because it is interacting with polymer strands more

J.M. Butler - ISFG 2011 CE Workshop August 30, 2011
http://www.cstl.nist.gov/strbase/NISTpub.htm 19
dsDNA vs ssDNA CE Migration
• If a small amount of the complementary strand
re-hybridizes to the labeled STR allele strand,
then a little peak will be seen in-front of each
internal lane standard peak and
STR allele
(ssDNA)
Stutter
product
STR allele
(dsDNA)
•Height of dsDNA peak will depend on
amount of re-hybridization between
the two strands (some loci will re-
hybridize more readily giving rise
to larger dsDNA peaks)
•Local temperature environment of
capillary impacts amount of re-
hybridization (may change over time)
Split Peaks (amplification reagents starting
to go bad – dNTPs, polymerase, etc.)
Split Peaks
Positive Control – FTA® Blood Sample
Data from Peggy Philion (RCMP)
Acknowledgments
Funding from interagency agreement 2008-DN-R-121 between the National Institute of Justice and the
NIST Office of Law Enforcement Standards
NIST Human Identity Project Team
Many wonderful collaborators from industry,
university, and government laboratories.
Bruce McCord (Florida International University) for many of the slides
Leading the Way in Forensic DNA…
Becky
Hill
Mike
Coble
Dave
Duewer
Margaret
Kline
John
Butler
Kristen Lewis
O‟Connor
Erica
Butts
Pete
Vallone
Contact Information
John Butler
NIST Fellow
Group Leader of Applied Genetics
+1-301-975-4049
http://www.cstl.nist.gov/biotech/strbase
Thank you for your attention
Our team publications and presentations are available at:
http://www.cstl.nist.gov/biotech/strbase/NISTpub.htm