ISBN 978-602-71138-0-0

Welcome message from author
This document is posted to help you gain knowledge. Please leave a comment to let me know what you think about it! Share it to your friends and learn new things together.
Transcript

ISBN 978-602-71138-0-0
BOOK 1
iii
PUBLIC HEALTH DEPARTMENT FACULTY OF SPORTS SCIENCE
SEMARANG STATE UNIVERSITY
BOOK 1
iv
FIRST INTERNATIONAL SEMINAR ON PUBLIC HEALTH AND EDUCATION (ISPHE)
PROCEEDINGS
Public Health Department, Semarang State University
Published by:
Public Health Department
Faculty of Sports Science
F1 Building, 2nd
Floor, Sekaran Campus, Gunungpati
Semarang City, Central Java Province, 50229
Email : [email protected]; [email protected]; [email protected]
Telp. +6224 8508107, Fax. +6224 8508007
This publication is in copyright. Subject to statutory expection and to the provisions of relevant collective
licensing agreements, no reproduction of any part may take place without the written permission of the
Public Health Department, Semarang State University.
First published in September 2014
Editor : Oktia Woro K.H., Tandiyo Rahayu, Soegiyanto K.S., Mungin Edy Wibowo, Doune
MacDonald, Songpol Tornee, Maria Consorcia LIM Quizon
Manuscript Team : Dina Nur A.N., Chatila Maharani, Muhammad Azinar, Lukman Fauzi
Layout : Efa Nugroho
Cover design : Muhammad Iqbal
Library cataloguing in Publication Data:
First International Seminar on Public Health and Education (ISPHE) Proceedings published by the Public
Health Department, Semarang State University – includes bibliographical references.
Series ISBN 978-602-71138-0-0
Distributed by:
Public Health Department, Semarang State University
F1 Building, 2nd
Floor, Sekaran Campus, Gunungpati
Semarang City, Central Java Province, 50229
Email : [email protected]; [email protected]; [email protected]
Telp. +6224 8508107, Fax. +6224 8508007
v
PREFACE Assalamu’alaikum warrahmatullahi wabarakatuh
Firstly, may we made our highest praise and thank to Allah The Almighty, for His bless so that we are able
to conduct such an precious moment; First International Seminar on Public Health and Education 2014 in
Semarang Indonesia, to share our knowledge and ideas with so much warm and friendship from worldwide
public health and education community.
International Seminar on Public Health and Education 2014 is aimed to gather all of experts, researchers,
academicians and practitioners in health education field in general as well as national and international
level in one prestigious academic forum which to discuss all health-education-related issues, ranging from
human resources, curriculum, institutionalization etc. The seminar also proposed to contribute to the focus
of health development direction; by considering also situation and the status of local health condition from
each region, both national and regional levels as well as its relation to global health trends
I would like to deliver our highest respect and appreciation to our honorable speakers, Prof. Dr. Ir. H.
Musliar Kasim, M.S (Indonesia vice Minister of Education and Culture for Education Affairs) and to the
Rector of Semarang State University for their support and appreciation on this seminar; and my deep
gratitude to our honorable guests: Prof. Doune Macdonald (Queensland University Australia), Maria
Consorcia LIM Quizon, MD (South Asia Field Epidemiology and Technology Network, Inc , Philippine), Dr.
Khancit Limpakarnjanarat (WHO Indonesia Representative), and also Assist. Prof. Dr. Songpol Tornee
(Srinakharinwirot University, Thailand). I really expect that this seminar will be beneficial for all of us and to
the development of the Public Health and Education field.
Allow me to express my gratitude to the participants and audiences from Indonesia and other foreign
countries who are enthusiastic in attending this seminar. I do hope that all audiences will gain important
values and collaborate it into our own fields and make significant changes in the future. Besides that, I also
convey my appreciation to all of organizing committee who has given their outstanding commitment for
presenting this occasion.
Wassalamu’alaikum warrahmatullahi wabarakatuh
Sincerely yours
Rudatin Windraswara

vi
vii
Content
Cover ............................................................................................................................................................... i
Preface ............................................................................................................................................................. v
Content ............................................................................................................................................................. vii
ORAL PRESENTATIONS
HEALTH EDUCATION AND PROMOTION FOR STUDENT, COMMUNITY, AND SOCIETY
1. Implementation of Worksite Health Promotion for Management of Metabolic Syndrome on Workers
Zahtamal; Riau University, Indonesia ...................................................................................................................................................... 5
2. Child Nutritionist for Improving Food Safety Children's Behaviour in Samarinda East Kalimantan
Riyan Ningsih1, Ratih Wirapuspita1, Iwan Muhammad Ramdan1; 1Mulawarman University, Indonesia ............................................... 22
3. The Influence of Children’s Caries Prevention on The Caries Incident on 1st Molar Permanent
(Case Study in Sumberejo Elementary School, Kaliwungu Kendal)
Yunita Dyah Puspita Santik; Semarang State University, Indonesia .................................................................................................... 31
4. Association Between Daily Steps and Cardiometabolic Risk Factors in University Employees
Masitah Abdullah1, Nur Zakiah Mohd Saat1, Nor Farah Muhamad Fauzi1; University Kebangsaan, Malaysia .................................... 41
5. Effectivity of Diari Ceria to Improve Prevention Behavior of Gout on Unnes Employees
Dias Irawan Prasetya1, Arulita Ika Fibriana1; Semarang State University, Indonesia ....................................................................... 48
6. Instant Noodles Consumption Patterns, Body Mass Index and Quality of Life of
Female Students in Islamic Boarding School
Aprilia Devi Fatimah1, Siti Rahayu Nadhiroh1; 1 Airlangga University, Indonesia .................................................................................. 58
7. The Influence of Peers Towards Drop Out Children’s Smoking Behavior
Tria Astika Endah Permatasari1, Amir Syafruddin1; 1University of Muhammadiyah Jakarta, Indonesia ............................................. 68
8. Health Numeracy: Requirement for Public Health Students
Eti Rimawati1, Sri Handayani2; 1 Dian Nuswantoro University, Indonesia,
2 Diponegoro University, Indonesia .... 80
9. Inflammation is Associated with The Hypoadiponectinema and Elevated Blood Pressure in
Male Central Obese Young Adults
Frans Wantania1, Karel Pandelaki1; 1 Sam Ratulangi University, Indonesia ........................................................................................ 89
viii
10. Factors Related to Occupational Stress Among Furniture Workers in Jepara
Dina Lusiana Setyowati; Mulawarman University, Indonesia ................................................................................................................ 102
11. Determinant Factors of the Level of Adoption for the Skill-Based Health Education Innovation
Among Uks Teachers at Elementary Schools in Semarang City
Sutopo Patria Jati; Diponegoro University, Indonesia ............................................................................................................................ 110
12. Education for Using Pesticide by Safely and Right to the Children of Farmer
MG.Catur Yuantari1, Eti Rimawati1, Kismi Mubarokah1, Supriyono Asfawi1; 1Dian Nuswantoro University, Indonesia ...................... 124
13. Correlation Between Fitness with Women Work Productivity
Cahyo Yuwono1, Wahadi1, Sugiharto1 ; 1 Semarang State University, Indonesia .................................................................................. 131
14. Developing PHBS-as Books into Braille Letters in its Effect on Knowledge, Attitude and Practice
of PHBS for Blind Students of SDLB
Irwan Budiono, Hadi Setyo Subiyono; Semarang State University, Indonesia ..................................................................................... 138
15. Contribution of Social Support Element in Supporting the Nutritional Status of Toddlers
(A Case Study In Sangkanjoyo Village, Kajen Sub-District, Pekalongan Regency)
Oktia Woro KH., Tysa Runingsari; Department of Public Health Sciences, Semarang State University ............................................. 145
HEALTH AND PHYSICAL EDUCATION AT SCHOOL
16. Be Healthy Through Playing: The Role of Play on Children
Anirotul Qoriah; Semarang State University, Indonesia .......................................................................................................................... 159
17. Strengthening Youth Access to Sexual and Reproductive Health and Rights in Semarang
Diana Pakasi1, Andi Cipta Asmawati1, Efa Nugroho2; 1 University of Indonesia, Indonesia, 2 IPPA-Central Java, Indonesia ............ 164
18. Training of Healthy Adolescent Cadre (HAC) as Efforts to Increase Student Health of
Islamic Junior High School Walisongo Kedungwuni Year 2014
Nur Siyam1, Oktia Woro K.H.1; 1 Semarang State University, Indonesia ............................................................................................... 177
REDUCING CHILD MORTALITY
19. Determinants of Birth Asphyxia in The Province of Yogyakarta
Rifqatussa'adah1 , Dewi Purnamawati2; 1University of YARSI, Indonesia, 2Stikes Kharisma Falkirk, Indonesia.................................. 189
IMPROVING HEALTH, CHILDCARE, AND QUALITY OF MOTHER
20. Fulfillment Description of Reproductive Rights on Women Offenders
(Case Study at Kembangarum Village West Semarang Subdistrict Semarang City)
Risa Nur Amalia1, Intan Zainafree1; 1Semarang State University, Indonesia ......................................................................................... 197
ix
21. Behavior of Mother Toddler to Manage Healthy Balanced Dietm in Karawang
Dewi Purnamawati1, Yosi Irawati1; 1Stikes Kharisma Karawang, Indonesia ......................................................................................... 208
22. Traditional Birth Attendant (TBA) on Maternal Care
Nurul Aeni; Research and Development Office, Distric of Pati, Indonesia ............................................................................................. 217
23. Breastfeeding Support Group: Women Empowerment In the Effort to Broaden
the Exclusive Breastfeeding Coverage in Samarinda, East Kalimantan
Annisa Nurrachmawati1, Ratih Wirapuspita Wisnuwardhani1, Ike Anggraeni1; 1Mulawarman University, Indonesia .......................... 227
24. Developing Standard Operating Procedure (SOP) in Maternity Center for Success
of Exclusive Breastfeeding
Chatila Maharani1, Galuh Nita Prameswari1; 1Semarang State University, Indonesia........................................................................... 241
25. Oral Contraceptive in HPV Infected Women and the Risk of Cervical Neoplasia
Vitri Widyaningsih; Sebelas Maret University, Indonesia ........................................................................................................................ 250
26. Mothers’ Mindset, Food Pattern, and Health
Eunike R. Rustiana1, Fitri Indrawati1; 1Semarang State University, Indonesia ...................................................................................... 262
ELIMINATING HIV AIDS, MALARIA, AND OTHER DIESEASE
27. Foodpoisoning Outbreak Following a Circumcision Celebration:
an Epidemiological Investigation in Sleman, Indonesia
Lukman Fauzi1, C. Heriana2, Berty Murtiningsih3, Alexander Prasudi3; 1Public Health Department,
Semarang State University, Indonesia, 2Public Health Department, Stikes Kuningan, Indonesia,
3Provincial Health Office of Special Region of Yogyakarta, Indonesia .................................................................................................. 273
28. Potential Predation of Larvivorous Fish as a Biological Control Agent of Dengue Fever Vector :
Due toits Digestive Organ
Dyah Mahendrasari Sukendra; Semarang State University, Indonesia ................................................................................................. 281
29. Effectiveness Comparative of Plastic and Cans Ovitrap As Aedes Aegypti Larvae Trap
Widya Hary Cahyati; Semarang State University, Indonesia .................................................................................................................. 293
30. Factors Associated with Blood Sugar Control of Type 2 Diabetes Mellitus Patients
in the Area of Public Health Service Kedungmundu Semarang
Irawan Prasetyo1, Mardiana1; 1 Semarang State University, Indonesia ................................................................................................ 303
31. HIV/AIDS Related Stigma and VCT Utilization among Female Sex Workers
in Bandungan Semarang District
Fitri Indrawati; Semarang State University, Indonesia ........................................................................................................................... 312
x
32. Factors Related Incident of TB Suspect Cases in Parungponten Primary Health Care Tasikmalaya
Siti Nurjanah1, Suharyo1; 1 Dian Nuswantoro University, Indonesia ...................................................................................................... 321
33. Factors Influencing the Use of Condom among Female Sex Workers in Localization
Mahalul Azam1, Arulita Ika Fibriana1, Muhammad Azinar1 ; 1Semarang State University, Indonesia .................................................. 328
ENSURE ENVIRONMENTAL SUSTAINABILITY AND HEALTH IN PUBLIC DEVELOPMENT
34. Cholinestrase Level and Liver Dysfunction on Childbearing-Age Women in Farming Area
Arum Siwiendrayanti; Semarang State University, Indonesia ............................................................................................................... 339
35. Sufficiency Analysis of Evacuation Facilities in H Building Semarang State University
Evi Widowati; Semarang State University, Indonesia ................................................................................ 347
36. Workplace Productivity Differences with Different Intensity Lighting
Herry Koesyanto1, Yeni Pamela1, Martha Hertiningrum1; 1Semarang State University, Indonesia ...................................................... 352
37. Nitrification and Denitrification Alternative Method by an Algal-Bacterial Consortium
Rudatin Windraswara1, Peter Van der Steen2, Carlos Lopez Vazquez2 ;1Semarang State University, Indonesia,
2UNESCO-IHE Institute for Water Education, Netherlands .................................................................................................................. 359
POSTER PRESENTATIONS
HEALTH EDUCATION AND PROMOTION FOR STUDENTS, COMMUNITY, AND SOCIETY
38. Effect of Supplements of Spinach (Amaranthus) to Hemoglobin Content of Changes
(Studies Laboratory of Mice)
Ika Esti Anggraeni, Supriyana2, Sri Rahayu2; 1STIKes Bhakti Mandala Husada Slawi, Indonesia,
2Polytechnic Semarang, Indonesia ........................................................................................................................................................ 373
39. Bullying in Gender Perspective
Susi Muryani1, Dr.Sunanta Thongpat2, Dr.PrangthipThasanoah Elter3; 1STIKES Bhakti Mandala Husada Slawi, Indonesia,
2Faculty of NopparatVajira College of Nursing, Thailand, 3Faculty of NakhonRatchasima College of Nusing .................................... 381
40. Attitude and Satisfaction Level Among Users of Facebook
as a Learning Medium in Faculty of Health Sciences Ukm Malaysia
Ismarulyusda Ishak, Syarif Husin Lubis, Yanti Rosli; University Kebangsaan Malaysia, Malaysia ....................................................... 388
41. Android Apps for Indonesian Adolescents Nutrition
Ratri Ciptaningtyas; UIN Syarif Hidayatullah, Indonesia ........................................................................................................................ 395
xi
HEALTH AND PHYSICAL EDUCATION AT SCHOOL
42. Consolidation of Professional Competence in School Physical Education Teacher
Nurhadi santoso; Yogyakarta State University, Indonesia ...................................................................................................................... 407
43. Maintenance and Marketing, Problem or Challenge for Sports Facilities Manager?
Sulistiyono; Yogyakarta State University, Indonesia ............................................................................................................................... 418
44. Cycling as an Alternative to Start Exercising
Fatkurahman Arjuna; Yogyakarta State University, Indonesia ............................................................................................................... 427
45. Food Consumption Patterns Effect on Secondary Sexual Development
of Middle School Students
Khotijah 1, Ipop Sjarifah 1; 1Sebelas Maret University, Indonesia .......................................................................................................... 436
46. The Analysis of Tendangan Samping Technique (T) of Pesilat Daerah Istimewa
Yogyakarta (A Study of Sport Biomechanic)
Awan Hariono; Yogyakarta State University .......................................................................................................................................... 441
REDUCING CHILD MORTALITY
47. Associated Factors with the Growth and Development of
Children Under 5 Years Old
Eny Retna Ambarwati1, Miftah1, Sukani Edi1; 1Midwifery Academy of Yogyakarta, Indonesia ............................................................. 457
IMPROVING HEALTH, CHILDCARE, AND QUALITY OF MOTHER
48. Lotus Birth in Relationship with Growth and Development Status
of Infantsages 0-12 Months in The Year 2013 BPM Tegal
Siswati1, Ani Margawati2, Mundarti3; 1STIKES Bhakti Mandala Husada Slawi, Indonesia, 2Diponegoro University, Indonesia,
3Polytechnic Semarang, Indonesia ......................................................................................................................................................... 471
49. Effect of Combination Methods to Massage Woolwich and
Endorphine Hormone Prolactin Levels and Breast Milk Volume
(On Mothers Postpartum Study in Healthy Pregnant Griya Mejasem Tegal)
Siti Erniyati Berkah Pamuji1, Supriyana2, Sri Rahayu3; 1Bhakti Mandala Husada Slawi, Indonesia,
2Diponegoro University, Indonesia, 3Politechnic Semarang, Indonesia ................................................................................................ 482
ELIMINATING HIV AIDS, MALARIA, AND OTHER DIESEASE
50. Risk Factors of Host The Elderly Acute Respiratory Infections (ARI)
In Ulak Karang Health Center
Fauziah Elytha1, Masrul1, Rafni Mustika1; 1University of Andalas, Indonesia ........................................................................................ 495
51. Do Child to Child Approach Prevent Dengue Hemorrhagic Fever?
Forman Novrindo Sidjabat1, Sitti Badrah2, Ridwan2 ; 1 Diponegoro University, Indonesia, 2 Mulawarman University, Indonesia ........ 504

xii
ENSURE ENVIRONMENTAL SUSTAINABILITY AND HEALTH IN PUBLIC DEVELOPMENT
52. The Relationship of Living Clean and Healthy Behavior in Household Order with
Occurrence of Diarrhea in Toddlers in Lubuk Buaya Village Padang City in 2012
Masrizal Dt.Mangguang; University of Andalas, Indonesia..................................................................................................................... 521

Public Health Department, Faculty of Sports Science, F1 Building, 2nd
Floor, Sekaran Campus Gunungpati, Semarang City, Central Java Province, Indonesia, 50229 Phone/ Fax. +6224 8508007
1
ORAL PRESENTATIONS

2
Public Health Department, Faculty of Sports Science, F1 Building, 2nd
Floor, Sekaran Campus Gunungpati, Semarang City, Central Java Province, Indonesia, 50229 Phone/ Fax. +6224 8508007

Public Health Department, Faculty of Sports Science, F1 Building, 2nd
Floor, Sekaran Campus Gunungpati, Semarang City, Central Java Province, Indonesia, 50229 Phone/ Fax. +6224 8508007
3
HEALTH EDUCATION AND PROMOTION STUDENTS, COMMUNITY, AND SOCIETY
PAPERS

4
Public Health Department, Faculty of Sports Science, F1 Building, 2nd
Floor, Sekaran Campus Gunungpati, Semarang City, Central Java Province, Indonesia, 50229 Phone/ Fax. +6224 8508007
Public Health Department, Faculty of Sports Science, F1 Building, 2nd
Floor, Sekaran Campus Gunungpati, Semarang City, Central Java Province, Indonesia, 50229 Phone/ Fax. +6224 8508007
5
IMPLEMENTATION OF WORKSITE HEALTH PROMOTION FOR MANAGEMENT OF METABOLIC SYNDROME
ON WORKERS
Zahtamal
Riau University
Corresponding Author: [email protected]
Abstract Introduction: Metabolic syndrome (MS) be the disease most often occurs in the current workers. One effort that can be done to prevent and manage MS is worksite health promotion/WHP. The purpose of this study was to reveal the implementation of WHP in the management of MS on workers. Methods: This research is a qualitative research. Subject are executing and policy makers in the company as well as some selected workers by accidental sampling. Instrument in this study was the interview guide and questionnaire. Analysis study of a descriptive analysis using content analysis. Results: The results showed that the implementation of the WHP for the MS management, among other components that support are strong company commitment, availability of infrastructure and funding/financing. Some things are not optimal, among others, there is no specific company policy to the management of specific cases, including diseases that occur in corporate priorities, comprehensive collaborative coordination and WHP methods appropriate. Conclusion, the implementation of WHP in the management of SM on worker has not performed optimally. Key Words: Metabolic syndrome, worksite health promotion, company commitment Introduction
National Center for Health Statistics, Centers for Disease Control and Prevention, U.S.
Department of Health and Human Services 2000 cit National Alliance for Nutrition and Activity
(NANA) (2003) states that the cause of death of the worker is the highest heart disease, ie, the
number of cases of death by 710 760, 553 091 cancer cases and 167 661 cases of stroke.
Meanwhile, cases of deaths caused by workplace accidents only 97 900 cases. Huang (2008) in
Taiwan found that the three main causes of worker death are heart disease, cancer, and
accidental injury.
Based on the statistical data it is known that degenerative disease is the most common
disease and the cause of death to the worker. One of the triggers of the degenerative disease is
metabolic syndrome. Metabolic syndrome is a group of metabolic risk factors that are directly
related to the occurrence of degenerative diseases. Criteria of the International Diabetes
Federation (IDF) in 2005 and supported by a joint statement of the IDF, the National Heart, Lung,
and Blood Institute (NHLBI), World Heart Federation (WHF), the International Atherosclerosis
Society (IAS) and the American Heart Association (AHA) (O 'Riordan, 2009), a person suffering
from MS if there are three of the five following criteria: (1) central obesity (abdominal circumference
≥ 90 cm for Asian men and ≥ 80 cm for Asian women; (2) Triglycerides ≥150 mg / dl or being in
treatment for hypertriglyceride; (3) HDL-C; <40 mg / dl in men and <50 mg / dl in women or is on
6
Public Health Department, Faculty of Sports Science, F1 Building, 2nd
Floor, Sekaran Campus Gunungpati, Semarang City, Central Java Province, Indonesia, 50229 Phone/ Fax. +6224 8508007
medication to increase HDL-C levels; (4) blood pressure: systolic ≥130 mmHg or diastolic ≥ 85
mmHg or under treatment for hypertension; and (5) fasting blood sugar (FBG) ≥100 mg / dl or type
2 diabetes.
Metabolic syndrome incidence in the world tend to be increased by about 10-40%. Of course,
this figure is also the contribution of the incident on the worker. Several studies showed an
increased incidence of metabolic syndrome among workers (of whom study Davila et al., 2010;
Alegria et al., 2005; Lohsoonthorn et al., 2007). Metabolic syndrome incidence among Indonesian
workers also tend to increase. Semiardji (2004) found that the disease among workers about
24.4% is related to case of Metabolic Syndrome. Data diseases from PT Krakatau Steel in 2005
showed that 15.8% is a disease associated with Metabolic Syndrome and Andini research in 2007
in the same PT increased by 19.7% (Sayogo, 2009). Windarwati (2011) found the proportion of
nurses who work at the regular time in the Dr. Sardjito Hospital suffering from Metabolic Syndrome
as much as 26.6% The results of a survey conducted in two companies in Riau Province also
showed that the prevalence of metabolic syndrome about 20-25%.
The primary cause of metabolic syndrome is insulin resistance (IDF, 2006; Shahab, 2007)
and central obesity (IDF, 2006). Other causes consist of atherogenic dyslipidemia, elevated blood
pressure and plasma glucose, a prothrombotic state, and proinflammatory (Semiardji, 2004). Many
factors associated with the onset of metabolic syndrome. These factors include occupational
factors, which cause a particular type of work a person tends to behave in unhealthy behaviors
such as sedentary, unhealthy diet, smoking, stress and others. The work tends to make people
become sedentary, among others, is a secretary job, workers who carry out administrative tasks,
lecturer, computer operators, managers, and others. Many workers complained about her getting
fat, but do not realize that calories consumed too much, which is usually due to activities
conducted snacking or eating too frequently. As a result, the body hoards calories which if not
used by a lot of physical activity will accumulate as fat (Bararah, 2011).
The impact of diseases that are often occur on workers, especially degenerative diseases, of
course, is a huge loss for the company. According to WHO, many countries are expected to lose
billions of dollars due to degenerative disease. In order to overcome the problem of degenerative
diseases and metabolic syndrome among workers, necessary efforts aimed to reduce morbidity
and mortality associated with the disease. Efforts to do is occupational health. One form of
occupational health activities is the worksite health promotion (WHP).
WHP is the science and art to help workers change their lifestyle to move toward health
status and optimal working capacity, thereby contributing to the health and safety at work, and can
improve the performance and productivity of the company. WHP is a component maintenance
service activities / health protection of workers from an occupational health services (Mojo, 2007).
The implementation of WHP to be comprehensive, that is aimed at the target are multilevel and
involve many parties. The target consists of a multilevel ie the primary target (workers), the
secondary target (family, health workers, supervisors and others) as well as the target tertiary
Public Health Department, Faculty of Sports Science, F1 Building, 2nd
Floor, Sekaran Campus Gunungpati, Semarang City, Central Java Province, Indonesia, 50229 Phone/ Fax. +6224 8508007
7
(decision makers or policy makers in the company). Furthermore, the implementation of the WHP
is not only done by health experts, but also involves many parties in multidisciplinary science and
also by groups of independent workers' health.
WHP general purpose is to influence attitudes about the health of individual workers, so that
from day to day they can make informed decisions on personal choice, leading a healthy lifestyle
and more positive. Furthermore, a special purpose WHP is; 1) affect workers to receive and
maintain a healthy lifestyle and positive, 2) receive and maintain the habit of eating foods with
optimal nutrition, 3) stop smoking, 4) stop the abuse of drugs and alcohol, 5) helping workers to be
able to cope with stress experienced in his life, and 6) teach workers about common illnesses and
diseases associated with the work to prevent and minimize the consequences and conduct a
thorough medical assessment as well as the ability P3K and CPR (Buchari, 2007).
WHP benefits for the management of the workplace, among others; increased; support for
K3 programs in the workplace, staff morale and work productivity. Furthermore, providing a
positive image (advanced workplace and health care), the decline; absenteeism rate due to illness
and health care costs. Meanwhile, WHP benefits for workers, among others; decreasing stress,
increasing; self-confidence, morale, the ability to recognize and prevent disease as well as the
health of individuals, families and communities (WHO, 2013).
WHP was organized by a conceptual framework, which was built through several locks, such
as; approaches, strategies, priority areas, and the factors that affect support. Based on the
framework, necessary to study the needs of the WHP. Programs that priority should be prioritized
for implementation. Furthermore, the program is not popular be gradual and tailored to the
interests and needs of workers. WHP is a voluntary activity, but proved to be useful for workers
and an activity that is quite popular and is done in stages according to the availability of facilities at
the workplace. The focus of the WHP program helpful in addition to improve the health and fitness
or work capacity, also can prevent chronic degenerative diseases such as coronary heart disease,
stroke, cancer, chronic obstructive pulmonary disease and others. Targets to be diintervensikan in
WHP include smoking cessation programs in the workplace, physical activity, nutrition and weight
control programs, cessation of consumption and drug abuse, psychosocial factors related
programs (mental health), ergonomic factors (WHO, 2013).
Based on the above problems, it is known that the cases of worker illness and death due to
degenerative diseases, one of which is caused by metabolic syndrome is still quite high.
Furthermore, it is known that the high incidence of metabolic syndrome among workers regardless
of the WHP program implementation in the company. Throughout the researchers knowledge,
there is no studies that illustrate the implementation of WHP, especially for the management of
metabolic syndrome. Based on the above explanation, the problem posed in this study, namely:
How does the implementation of health promotion in the workplace in managing diseases or
metabolic syndrome in workers?
8
Public Health Department, Faculty of Sports Science, F1 Building, 2nd
Floor, Sekaran Campus Gunungpati, Semarang City, Central Java Province, Indonesia, 50229 Phone/ Fax. +6224 8508007
The general objective of this study was to reveal the implementation of WHP in managing
metabolic syndrome among workers. Furthermore, the special purpose of this study was to reveal
the factors related to the implementation of WHP in particular that led to the management of
metabolic syndrome among workers, among others; commitment and company policies, worker
involvement in helping to shape the implementation of the K-3 program for the management of
disease, especially in the workplace, social support derived from enterprise resource availability
(availability of facilities, the existence and role of officers K3 / related parties, the source of funds /
financing) and WHP efforts that have been made to the management company of metabolic
syndrome.
This research is expected to contribute in the development of science and technology and
social-cultural. The contribution of the others are a matter between the input and the reference of
best practices for the company / industry, especially for practitioners K3 companies to implement
WHP. The results of this study can also be input for other researchers and policy makers (both
public and private sectors) who are interested in further researching and or make policy on matters
relating to the implementation of the WHP, especially in managing the metabolic syndrome among
workers, as well as design models WHP with a variety of approaches to manage disease or other
health problems in workers in the company / industry.
Methods
This study is a qualitative study conducted in company with a number of cases and the
metabolic syndrome or degenerative diseases, especially high CHD and metabolic diseases.
Subjects were those related to implementing and holders and policy makers in the company or in
the management of metabolic syndrome in the workplace as well as some workers (to cross check
the data) were selected by accidental sampling. Sampling technique used was purposive
sampling, where the study was not conducted on the entire population, but focused on the target.
Instrument in this study is the interview guide, and the workers perception questionnaire on
WHP. Interview guide is used to describe the implementation of the WHP is a modification of the
questionnaire of healthy worksite health and performance improvement (HPI) Advisors (2007).
Aspects of those asked in the interview are; condition of the company in the management of
metabolic syndrome in the workplace, such as; commitment and company policies related to the
WHP program, especially in the effort that led to the management of metabolic syndrome among
workers, worker involvement, social support derived from the availability of facilities and
infrastructure, the existence and role of stakeholders in the implementation of the WHP and the
source of funding / financing. Furthermore, an overview WHP especially in efforts that lead to the
management of metabolic syndrome among workers. Management of data obtained from the
results of qualitative research conducted on the data. Data in the form of in-depth interviews with
computer processed. Analysis of the results of studies conducted with descriptive analysis.
Analysis of the data using content analysis to obtain in-depth information about the variables
Public Health Department, Faculty of Sports Science, F1 Building, 2nd
Floor, Sekaran Campus Gunungpati, Semarang City, Central Java Province, Indonesia, 50229 Phone/ Fax. +6224 8508007
9
studied by means of notes, making the matrix and analysis manually. The analysis process is done
in stages; 1) Collecting data from various sources in-depth interviews; 2) Process data by
analyzing the transcripts of all the data obtained from in-depth interviews. Transcripts of data is
done without waiting for the completion of data collection in order to avoid the accumulation of
data; 3) Set up and create a sequence that has a relationship with qualitative research; 4) to
facilitate the gathering of data categorization and interpretation of data; and 5) Interpret the data
according to the findings and compare with theory and or the results of the study support.
Results And Discussions
Has done research on three companies which are in the province of Riau. The company is
the oil company, the plantations company and pulp and paper company. This research effort
related to the implementation of health promotion in the company, particularly in managing
metabolic syndrome on workers. Presented the following components or variables that were
examined in the study:
Commitment and policies related to the implementation of WHP particular company that
leads and is associated with the management of metabolic syndrome among workers.
The company basically already has a strong commitment in achieving healthy workers,
including efforts to prevent and manage metabolic syndrome. The company considers it important
to realize that a healthy worker / productive for several reasons, among others; 1) the company's
assets and employees will support the achievement of organizational goals and will improve the
performance of the company. 2) the amount of costs to be incurred by the company, if the workers
are sick or experiencing health problems, especially degenerative diseases and metabolic
disorders. 3) demand the implementation of labor laws. It is revealed from several informants
following statement:
Pentingnya kesehatan sudah tertulis dalam manajemen perusahaan, tetapi ini secara umum termasuk ke dalam lingkup manajemen kesehatan dan keselamatan kerja. Kesehatan bagi pekerja sangat penting karena aset bagi perusahaan..maka kita perlu maintaneance supaya mereka tetap produktif..supaya produktif maka upaya maintenance ini dari berbagai aspek…misalnya terkait aspek ke sdman maupun dari aspek kesehatannya..dari kesehatannya yakni dari aspek benefit dan pencegahan dalam bentuk promosi dan prevensi. (Informant 1 company 1).
(Mewujudkan pekerja yang sehat).. Itu pasti…pekerja yang sehat sudah menjadi komitmen kita..karena akan menentukan produktivitas perusahaan..maka dari itu sekarang HSE itu lebih digalakkkan..karena setelah dikaji..ternyata biaya untuk orang sakit..misalnya hanya untuk satu orang bisa sampai 2,5 juta..ternyata banyak lagi kerugian yang lain dialami perusahaan. (Informant 2 company 1). “ini berkaitan dengan target-target yang diharapkan perusahaan.. salah satunya target produksi..”nah untuk mencapai target produksi dibutuhkan karyawan yang paham terhadap apa yang dikerjakannnya dan pekerja tersebut harus sehat. Dibutuhkan tubuh yang sehat, karena hampir sebagian besar kerjanya adalah kerja fisik..sehingga dengan tubuh yang sehat maka diharapkan produktivitas pekerja meningkat. (Informant 3 company 2).
10
Public Health Department, Faculty of Sports Science, F1 Building, 2nd
Floor, Sekaran Campus Gunungpati, Semarang City, Central Java Province, Indonesia, 50229 Phone/ Fax. +6224 8508007
Perusahaan sangat peduli terhadap kesehatan karyawan..walaupun itu juga sudah diatur dalam UU..UU ketenagakerjaan..bahwa setiap perusahaan wajib menjamin pekerja dalam keadaan sehat. (Informant 4 company 3).
A strong commitment, such as the above information, has not been followed by assessment
or review of health needs of the workers to the fullest. Because there are companies that have not
made, if any, and even then not optimal. Assessment in question is the impact of its workers
unhealthy (diseased / injured at work) on the performance of the company and its employees,
including costs incurred of the direct costs, indirect costs and opportunity cost. So what the
company has done, has not evaluated the level of effective and efficient in tackling health problems
that occur and address the needs of the health of workers. It is revealed from several informants
following statement:
Memang pengkajian yang mendalam tentang ini yang nanti menunjukkan angka-angka tidak pernah..cuman, ee..kita secara menyeluruh,,..tetapi penelitian-penelitian dalam rentang waktu tertentu untuk mengkaji berapa biaya, dsb belum ada..cuman untuk trend biaya pengobatan dari tahun ke tahun ada.. dan ini hampir sama. (Informant 3 company 2).
Seringkali yang muncul dari sisi cost..karena kita concern dengan biaya kesehatan..kita punya sekitar 14 ribu karyawan di Indonesia..di Dumai sekitar 1100-1200 karyawan, itu dikomparasi dari biaya perkapitanya.yang pertama dari sisi keuangan..kajian-kajian dari sisi kesehatan.. biasanya dari faktor-faktor yang terkait dengan sindroma metabolik..karena penyakit terkait sindroma metabolik di kita itu tinggi..kita punya laporan tentang kajian absensi pekerja..ini tentang non efektive rate, severity rate, disability rate. kita kaji setiap tiga bulan..langsung dilakukan oleh industrial health dan kita laporkan ke coorporate..termasuk biaya medical check up (MCU), promosi kesehatan, dll..dan trendnya biaya kesehatan makin lama makin meningkat..kecuali non efektive rate/abesenteism kita masih bisa menahannya..ya kita kendalikan. (Informant 1 company 1).
A strong commitment to be followed by the policies in the form of regulations, standard
operating procedures (SOP), work rules and others. Based on the interview results revealed that
specific policies related to metabolic syndrome are not yet available. Existing policy is health policy
in general and for the things done routinely, such as MCU and extent of activities undertaken to
comply with the regulations / legislation. This policy has been put in the form of health programs
are conducted regularly every year. Policy is already socialized health program / disseminated to
all levels of employees and stakeholders, outsourcing, visitors, etc.
…dalam kebijakan detailnya kita wujudkan dalam bentuk program kerja..program kerja secara keseluruhan sudah ada setiap tahun..kebijakan ini karena berupa program kerja dia berlaku di fungsi tetapi efeknya ke karyawan..program-program ini tak muncul tetapi pelaksanaan program ini terinformasi ke karyawan..misalnya MCU kita informasikan baik ke kepala bagiannya maupun ke individu yang bersangkutan..baik melalui surat maupun broadcasting di portal kita..kemudian misalnya upaya promkes..misalnya kayak pembukaan gerakan hidup sehat (GHS)..kita broadcast kan..tetapi program kerja tidak kita broadcast.. kebijakan umum ya..kita broadcast ke semua…karena di portal kita semua termasuk outsourcing..misalnya ada MCU ..mereka udah tau aja..karena sudah diinfokan.(Informant 1 company 1)
Public Health Department, Faculty of Sports Science, F1 Building, 2nd
Floor, Sekaran Campus Gunungpati, Semarang City, Central Java Province, Indonesia, 50229 Phone/ Fax. +6224 8508007
11
Secara tertulis…kita MCU setiap tahun…khusus daerah tertentu ada yang sekali 3 bulan (pemeriksaan khusus) dan itu tertulis ada SOPnya.. ...kemudian informasi itu..kita setiap minggu dua kali kita berikan melalui email (semua karyawan)..kita punya website.. xxxx..setiap program kita infokan di public messenger..apa pun program kita infokan disitu..kita infokan juga ke outsourcing..termasuk ke sektor…kontraktor pertama kali masuk kita MCUkan. (Informant 5 company 3). General policy only has an impact on not focused the completion of the health problems
experienced by workers. Another implication is the priority issue is not handled properly, so the
health problems / diseases that are common to remain high, and the need for occupational health
services are also not being met and felt by workers. Specific policy is required for the handling of
priority issues. With the policy that is binding on all parties, it would be optimal handling problems.
Employee involvement in assisting the implementation of the K-3 program, particularly for
disease management in the workplace.
Involvement (participation) of workers in any health program (WHP programs in particular)
felt is still lacking. Some reasons for the inactivity of these workers according to the assumption of
health program managers is a matter hours / working time, the role of leadership, application of the
rules, a system of rewards and punishmen is not maximized, the behavior of workers who have not
been ideal and packaging activities perceived less attractive so impressed the onset of saturation
workers. It is revealed from the interview:
Kalau partisipasi pekerja saya tidak bisa bilang bagus tidak bisa bilang jelek…misalnya MCU capaiannya 88%...ada juga untuk kegiatan promosi kesehatan..misalnya senam tiap hari jumat..itu kehadirannya 30%..selama ini kita yang rancang program..mereka datang..tetapi yang datang sudah kita prediksi..itu-itu aja..alasan klise pekerja adalah masalah waktu..shift..shift berkendala banget..kadang-kadang mereka datang besoknya nggak..ya trus disini juga ada event yang cukup panjang seperti turn arround (TA)..bisa stop sampai sebulan atau 40 hari..jadi kalau ada yang terjeda..mereka mulai lagi berat…kenapa di MCU bagus..karena pendekatannya formal..begitu tak datang kita surati kepala bagiannya)..tidak ada punishment. (Informant 1 company 1) Pengalaman kita..kalau masalah kesehatan awal-awal biasanya semangat sekali..tetapi ujung-ujung menurun…. kita ada senam sehat di fiber…di sana ya..itukan sukerela (boleh datang boleh tidak)..yang terkadang ada ketertarikan..ada yang tidak…dan terkadang naik turun juga…terkadang dari hasil MCU kita kabari ke departemen mereka..banyak yang bermasalah…kita sampaikan mereka perlu informasi, tetapi kurang ditanggapi juga…kalau kita adakan seminar dalam skala besar…kalau diundang perdepartemen..di utus dua orang mereka mau datang.. ...tetapi kalau untuk program-program yang harus diterapkan ke depan…di awal bagus dia..,kalau tidak diinfokan..kalau program yang sudah kita lakukan secara rutinitas.. biasanya timbul kejenuhan mereka. (Informant 5 company 3). Kalau penyuluhan ada yang datang..partisipasi pekerja bagus.untuk setiap kegiatan yang kita laksanakan..menurut saya lebih peduli karyawan yang dikebun......jadi perusahaan ini peduli..tetapi nyangkutnya pada pekerja…jadi apakah ideal?..belum lah…mungkin itu berkesinambungan. (Informant 3 company 2).
Furthermore, the existence of groups of workers who are specifically assist companies in
managing health problems, both of which formed independently by the worker or under the
12
Public Health Department, Faculty of Sports Science, F1 Building, 2nd
Floor, Sekaran Campus Gunungpati, Semarang City, Central Java Province, Indonesia, 50229 Phone/ Fax. +6224 8508007
coordination of the health of its action has not appeared. However, there are some movements that
take the form of activities that aim to achieve a healthy workers established by the company (under
the coordination of the health) involving workers, but do not follow the high participation of workers.
Several groups of workers have also been identified by health authorities were formed
independently, but do not coordinate with the health, so it is not monitored, nurtured and lack of
coordination with health authorities. It also makes health authorities do not know the role and
benefits of the activities carried out by the group. It is revealed from the interview:
..Club (misalnya jantung sehat) belum ada..tetapi mungkin dari beberapa inisiator..mungkin ada di area masing-masing..jadi kelompok khusus yang membantu masalah-masalah kesehatan overall kita belum ada..kita beluma ada record secara jelas keberadaan kelompok-kelompok yang mungkin ada (di setiap departemen). (Informant 5 company 3).
Kayaknya belum ada….club sepeda ada…tetapi yang lain belum ada..club sepeda belum kita koordinir..kegiatan olahraga ada...tetapi kelompok atau pekerja yang melakukan kegiatan olahraga atas inisiatif sendiri aja..tidak terorganisir. (Informant 3 company 2).
...jadi kelompok yang dibentuk atau mereka (kelompok pekerja) membentuk sendiri untuk gerakan hidup sehat belum ada..tetapi club-club yang dibentuk pekerja dan berdampak ke kesehatan itu ada..kita disini punya bapor..badan pembina olah raga..ada club sepeda..setiap unit punya..setiap minggu misalnya unit produksi…kemudian manajemen setiap rebo..itu mandiri mereka bentuk..namun tidak secara formal ada koordinasi dengan IH..namun jika ada event mereka minta bantuan dari kita..berupa asistensi. (Informant 1 company 1) Ideal behavior of workers who have not been supported also by questionnaire to employees
(for behavior management of the metabolic syndrome, ie, physical exercise and management of
food) found that most still have a neutral attitude (68.6%). Related still weak/lack of participation,
compliance and does not make a healthy lifestyle as a culture, then it needs to be done with the
WHP implementation approaches, models, methods and strategies appropriate. WHP applications
used in labor behavior change interventions is a comprehensive approach to health behavior
change. This comprehensive approach is a means to integrate multiple models of behavior change
in the context of a more comprehensive, so in this case and the many parties involved and the
predictors used as a measure of the success of behavior change.
WHP implementation should use systematic models, logical and aplikabel. Several
theoretical approaches have been used in model development WHP. Social cognitive theory
approach, discovered the effects of environmental factors and a counterforce related behavior
(Kremers et al., 2006; Swinburn et al., 2005). Environmental factors, among others; availability of
infrastructure (eg, availability of sports facilities and a variety of healthy foods), management
commitment and support organizations (health problems included in the company's policy, for
example, the company canteen policy, the cost (price of food), to facilitate time for physical
exercise and others), social support (family, co-worker), (Hill, 2009). In addition, to overcome the
barriers of intentions into behavior, environmental opportunities should be facilitated by the
Public Health Department, Faculty of Sports Science, F1 Building, 2nd
Floor, Sekaran Campus Gunungpati, Semarang City, Central Java Province, Indonesia, 50229 Phone/ Fax. +6224 8508007
13
decision maker in order to create an environment that allows workers to change behavior related.
Thus, interventions that best environmental changes, may also be aimed at decision makers (Brug
et al., 2005). The principle of the theory of (social) ecology by Moos Bronfenbrenner 1979 and
1980 (Glanz et al., 2008) can also be used in the development of WHP models, which uses a
multilevel intervention to alter the behavior of workers, namely at the level; individuals, families and
the environment / organization. Furthermore, the Integrative Model of Behavioral Prediction by
Fishbein and Ajzen's (2010, cit. Yzer, 2012) is used to describe the determinant factors/predictors
that influence behavior change. The learning process that will affect the behavior of people with
metabolic syndrome can be provided through several methods. In accordance with these
objectives, the method of education that can be given an individual education (The Diabetes
Prevention Program Research Group, 2002), groups (the number of participants as much as 10-20
people) (Wadden et al., 2004) or a combination of group and individual (Ryan et al., 2003). For
many communities, the group communication methods can be provided through lecture question
and answer that is by promoting discussion and learning strategies are centered on the client. The
learning process in patients with metabolic syndrome aims to modify lifestyle, specifically
recommended in diet and physical exercise (Grave et al., 2010). Health education topics that may
be provided include basic things about metabolic syndrome include; definition and diagnosis,
causes, impacts and management. Furthermore, in an effort to improve behavior, patients may be
given material metabolic syndrome effort to increase self-motivation, learning principles to change
behavior, how to accept change, efforts to increase self-efficacy, and other psychological factors
(Graves et al., 2010) .Next, behavioral changes are expected to occur, would have an impact on
changes in labor conditions metabolic syndrome characterized by the improvement in markers of
metabolic syndrome disorders in workers. Implementation of WHP programs is a very important
contributing factor to improving the health of workers. Implementation of WHP in addition to the
provision of educational methods also designed to support the activities of the organization healthy
lifestyle. The activities may include screening, and designing interventions to change behavior
directed workers to achieve a better health status (Commission on Health and Safety and Workers'
Compensation, 2010).
Social support derived from the availability of resources companies in WHP, especially
relating to the management of metabolic syndrome among workers
Availability facilities
Commitment and concrete action from the policy of this company has been manifested in the
form of health programs. In general, the concept of health programs have been designed to be
comprehensive, in the form of programs promotive, preventive, curative and rehabilitative. This
health program has been supported by the availability of facilities (health infrastructure in the
company) for workers. All companies are being sampled, already has a facility/facilities to support
program implementation. Especially for curative measures, means most of the services available at
the hospital or clinic. Health and medical care that is available is in the form of hospital and clinic
14
Public Health Department, Faculty of Sports Science, F1 Building, 2nd
Floor, Sekaran Campus Gunungpati, Semarang City, Central Java Province, Indonesia, 50229 Phone/ Fax. +6224 8508007
services companies as well as referral services to big hospital (privately run) around the area of the
company. It is revealed from several informants following statement:
..Sehingga komitmen perusahaan ini.. ketika pertama kali membuat kebun, maka bebarengan dengan mendirikan rumah sakit di tengah-tengah perusahaan/pabrik /perkebunan.. membuat poliklinik-poliklinik lagi di sentra-sentra yang jauh dari pabrik. Di mana klinik-klinik ini nanti akan merujuk pasien-pasien yang tidak dapat dilayani di klinik, di bawa ke rumah sakit. jika ada case. (Informant 3 company 2). ..kesehatan sudah menjadi tanggung jawab perusahaan, tetapi yang kita lakukan sudah melebihi apa yang diminta UU…..kita juga telah memiliki klinik sendiri dan tersebar di semua sektor termasuk dokter, perawat dan ambulan. fasilitasnya. klinik kita tidak ada rawat inap..jadi kalau ada kasus-kasus berat kita rujuk ke RS-RS besar yang ada di Pekanbaru dan Pelalawan .. kemudian kita punya dokter perusahaan di setiap klinik selama 24 jam. (Informant 4 company 3).
Facility / facilities for promotive, preventive, and rehabilitative also sufficient. It is powered by
a questionnaire to employees (especially for physical fitness facilities), the majority of respondents
(98%) consider that the company already provides the means for exercising. However, based on
interviews and observations in the field, utilization is still not optimal. Although there are no specific
facilities for the management of metabolic syndrome, but the facilities are available, directly or
indirectly, can be utilized for the management of metabolic syndrome among workers. In fact, the
allocation and utilization of the facility is still not optimal. Facilities are available, but would be used
by anyone and can be used to manage problems / diseases which, have not been identified and
realized with a well in the field.
The existence and role of officers K3 / stakeholders in the implementation of the WHP
Already contained unit / department / section in the organizational structure that specifically assist
companies in managing health problems. The department or the equivalent of middle
management. These units have an important position in the organizational structure of the
company. The existence of this unit is considered very important and very helpful in managing the
health of the company. Availability of human resources to develop strategies to improve the health
status of workers perceived optimal quantity is sufficient. It is revealed from several informants
following statement: Industrial Health..selevel middle manajemen. (Informant 1 company 1)
Ada departemen khusus..ya HRD, ada bagian lagi di bawah HRD.. yaitu pengelolaan kesehatan..yakni mengelola kesehatan...ada OHS (di lingkup operasional/yang kerja di dalam pabrik) juga dan satu lagi di luar operasional ada lagi orang KEK (sector). OHS selevel middle manajemen. (Informant 5 company 3) Kita ada bagian kesehatan.kepala bagian kesehatan satu level di bawah direksi..jadi direksi itu direktur bidang. di bawah direktur bidang sdm dan umum membawahi bagian kesehatan,,jadi dia staffing dalam pengelolaan bidang kesehatan. Kemudian ada RS wilayah yang langsung di bawah kendali direktur..bagian ini sebagai timteng. (Informant 3 company 2).
Public Health Department, Faculty of Sports Science, F1 Building, 2nd
Floor, Sekaran Campus Gunungpati, Semarang City, Central Java Province, Indonesia, 50229 Phone/ Fax. +6224 8508007
15
The role of the unit / department / section that specifically assist companies in managing
health problems is good enough. With a clear function, section / unit has been trying to do the job
according to the job description and SOP. Designing programs and activities undertaken by these
units, based on the interviews revealed already patterned in the form of problem-solving cycle.
Begins with recognizing the needs and health problems (generally based on MCU and worker
health risk assessment), resolving design, implement and evaluate. It is powered from the
questionnaire to the employee, as an example for physical fitness programs, 76.5% considered
that the status of physical fitness has been evaluated by the company. It is revealed from several
informants following statement:
Di IH terkait masalah kesehatan pekerja, proses identifikasi dari hasil MCU kita. MCU kita evaluasi apa akhirnya yang dapat kita intervensi..disusunlah sebuah program kalau disini disebut namanya GHS..ada tiga program, yakni penurunan berat badan,, ada pengendalian faktor risiko dan kebugaran..tetapi isi programnya sendiri terkait pemberdayaan pada pekerja..isinya bisa macam-macam..edukasi..misalnya media leaflet..dengan seminar-seminar atau diskusi-diskusi yang dilakukan disini (rumah sakit) kita undang ahli gizi, mereka (karyawan) hadir ..dan mereka diskusi..konsennya kepada pekerja yang bermasalah..tetapi untuk menarik minat pekerja..itu menjadi masalah sendiri bagi kita disini..sehingga kita buka GHS itu pada semua pekerja..kita lebarkan cakupannya kepada semua pekerja..bahkan ke pasangannya..mitra kerja pun boleh…sehingga kalau rame akan timbul minat pekerja untuk gabung di gerakan ini..pada saat ini pesertanya yang terlibat itu ada sekitar 180an.. tetapi pekerjanya baru 40 orang..kemudian implikasi yang lain disini ada jarak antara kilang dengan rumah sakit (jarak cukup jauh).. Jadi untuk promosi kesehatan kita dasarnya adalah MCU..tetapi kita juga mengadop isu-isu dari kegiatan nasional.. (Informant 1 company 1)
Melalui HRD. Mulai dari tahap awal kita adanya pemeriksaan kesehatan pra employee..ke dua kita lakukan pemeriksaan annual sekali setahun..setiap tahun kita juga melakukan hazard assessment dengan HRA dengan Hazard identification, risk assessment and risk control (HIRARC)..di departemen kita jika ada indikasi (bapak ini ada gangguan ni) dengan HRA tersebut..kita akan melakukan pemeriksaan kesehatan sesuai dengan risiko kerjanya..kita sudah ada datanya..misalnya orang-orang yang terpapar kebisingan..dari debu..dengan radio aktif kita akan lakukan pemeriksaan kesehatan sesuai dengan paketnya....dari sistem ini kita lakukan monitoring..apakah kita peru lakukan advice ke pihak manajemen apakah perlu rotasi..atau ada beberapa kasus juga (kasusnya jelek sekali) kita lakukan JSA..(job safety analisis..kita laporkan ke pihak manajemen..dan nanti manajemen yang memutuskan. (Informant 5 company 3)
Based on the above information, there is an effort to use the resolution of the problem
solving cycle. For example look of the program has been designed and implemented based on
existing data. However, the design has not been patterned for WHP well. If the condition / situation
of the field (the data most diseases, the metabolic syndrome related diseases and degenerative
diseases), the implementation of programs specifically to address the issue of the disease has not
been optimal. This is evidenced by the absence of a special pattern that is applied, the lack of a
good guide book for workers and for health professionals that contains, among other information,
or SOP references in the prevention and management of metabolic syndrome or diseases
associated with the metabolic syndrome. Hawe et al. (1998); Western Australian Centre for Health
16
Public Health Department, Faculty of Sports Science, F1 Building, 2nd
Floor, Sekaran Campus Gunungpati, Semarang City, Central Java Province, Indonesia, 50229 Phone/ Fax. +6224 8508007
Promotion Research (2013), describes the stages in the process of health promotion, which
consists of a needs assessment, program planning, program implementation and evaluation. This
stage takes place in cyclical (cycle), uninterrupted and continuous underway. After the evaluation
process (which consists of the evaluation of assessment, evaluation of impact (impact) and the
evaluation of results (outcomes) process can be resumed with the redesign (redesign) and
reimplementasi, to the maximum extent possible to reach the desired ideal conditions.
Parties involved in behavior modification efforts (particularly the management of metabolic
syndrome) is a multidisciplinary team of science, with the composition of physician and non-
medical health professionals, such as nutritionists (dieticians), a physical fitness (exercise
physiology), psychologist (behavioral psychology), and personnel health educator (Bellentani et al.,
2008). Based on the findings in the field, for the management of diseases of the workers,
especially metabolic syndrome is supported by the availability of health personnel (quantity), but
qualifying is not available with optimum power. On the other hand, is also not supported by optimal
coordination. This is probably due to the unavailability of SOPs and guidelines metabolic syndrome
case management, so it has not seen the coordination of the parties in the management of
metabolic syndrome.
Source of funding / financing
Availability of funds to develop strategies to increase optimal health status of workers felt
quite available. However, when viewed from the large and the proportion of funds for promotion
and prevention programs have not been adequate. In terms of financing health services (especially
perlayanan curative), already in excess of what the demands of regulations (legislation). Especially
for medical expenses, there are several companies that provide compensation infinite (unlimited),
all handling of the case require such services. For example, for a person in need of care workers at
a cost of up to 1 billion dollars, the overall borne by the company. It is revealed from the statement
following informant:
Dana relatif tidak menjadi kendala bagi kami..karena perusahaan selalu mensupport..setiap kita buat rencana anggaran…didukung penuh oleh perusahaan....kalau untuk program…terkait promotif preventif sekitar 250 juta dari 8 M..dari 8M alokasi terbesarnya untuk kuratif dan rehalbilitatif..kenapa begitu..karena..ini adalah organisasi yang baru. dulu namanya head of medical di bawah HR..jadi di bawah HR dia mengurusi semua biaya penyakit yang terkait masalah kesehatan, nah di bawah IH kerjaan ini terbawak..termasuk pasien konsul di luar.. di Jakarta…Dengan proses yang berjalan sekarang..dirasa ada yang kurang…(terutama utk promotif dan preventif) (Informant 1 company 1)
....kita akan menanggulangi masalah penyakit yang timbul itu secara paripurna..tidak ada batasan kualitas penyakit..atau hanya pada batasan tertentu penanganannya.. apa pun case nya.. itu akan ditanggulangi semuanya oleh perusahaan.. dan itu sama untuk semua karyawan, tanpa melihat strata2. biaya berobat un limited.. semua kita cover..lebih 1 Miliar pun kita bayar..walaupun tetap berazazkan cost efektifness..tetapi nggak terbatas,., jadi kalau emang dibutuhkan. (Informant 3 company 2)

Public Health Department, Faculty of Sports Science, F1 Building, 2nd
Floor, Sekaran Campus Gunungpati, Semarang City, Central Java Province, Indonesia, 50229 Phone/ Fax. +6224 8508007
17
..setiap karyawan sakit tidak dikenakan biaya sama sekali (dicover asuransi) dan unlimited asal ke provider yang sudah kerjasama dengan kita. (Informant 4 company 3)
WHP efforts by the company to the management of metabolic syndrome among workers.
Based on interviews and field observations, some WHP programs (particularly related to the
management of the metabolic syndrome) has been done in the company include:
Nutrition and body weight control program
Weight management program workers have generally not been implemented in the
company. However, a nutrition program providing food for workers already done. This is done in
the form of the provision of canteen / catering that provide / sell food / snack is made by outsiders /
vendors in the corporate environment (workers obtain subsidized 100% of the company / not pay /
receive a coupon for which funds borne by the company). However, in some companies, like
canteen management form is intended only for employees who work in shifts. Pengelolaaan
canteen in the company are considered and sanitation in general, both of the food provided and
the food handlers. However, the provision of food value / maximum nutrient content has not been
so prepared for a health condition or nutritional status of workers. Submission of information on
nutrition mass has been done, but the nutritional value of information and the choice of food that is
suitable for the type of medical condition or nutritional status of individual workers do not
maximized. It is revealed from several informants following statement:
Ini hanya untuk pekerja perusahaan yang shift.. Kita bersama ahli gizi ke sana (kantin perusahaan).diperhatikanlah kebersihannya serta food handlernya. jadi menunya sekaligus food handlernya. (Informant 1 company 1). satu bulan sekali kita inspeksi (orangnya, kelayakan kantin, bagaimana penyajian, ini sejauh yanga da di dalam komplek saja)..ada food court, xx café, dll..yang di luar belum kita jangkau..yang di luar (RM. xxx) kita belum bisa lihat.(Informant 5 company 3). pemberian porsi atau pilihan makanan disesuaikan dengan kebutuhan/kondisi kesehatan pekerja belum kita lakukan.(Informant 5 company 3).
In some companies, for non-shift employees who shape the form of providing canteen /
caterer sells meals / snacks are made by an outsider / contractor / vendor in the enterprise
environment and workers pay for itself or not obtain a subsidy from the company. Furthermore,
especially for non-shift employees are also allowed to find their own food outside the company or
going home to eat at recess. Furthermore, weight management program for workers who
experience malnutrition (especially nutrition) has not been done specifically.
Physical fitness
Basically component activities in the physical fitness program at work already exists or is
available. This is supported by the results of the questionnaire that most of the respondents
(76.5%) consider that the company has been carrying out a physical fitness program for workers in
the workplace. However, not packed in a program aimed at the management of certain diseases.
18
Public Health Department, Faculty of Sports Science, F1 Building, 2nd
Floor, Sekaran Campus Gunungpati, Semarang City, Central Java Province, Indonesia, 50229 Phone/ Fax. +6224 8508007
Included in this is to manage and prevent diseases related to metabolic syndrome and
degenerative diseases. Physical fitness effort has been supported by adequate facilities, both on-
site indoor and outdoor on-site. It is revealed from several informants following statement:
Ada golf. lapangan Sepakbola, lapangan voli 30 buah.. setiap bagian memanfaatkan…masih di kompleks..dimanfaat tetapi tidak semua..tergantung bagian.. dikoordinasi oleh bagian masing-masing.ada juga kolam renang.(Informant 1 company 1). Kita hanya on site-out door berupa lapangan tenis, badminton ada.. Sarana fitness center kita tak punya. (Informant 3 company 2). …Di “XX” ada fasilitas fitness..tetapi berbayar. (Informant 5 company 3). Furthermore, in terms of utilization of the facility is still lacking by workers. In certain
companies still use the facilities free of charge to workers especially indoor facilities on-site.
Accessibility to facilities is relatively easy for workers. In addition to the remote location, as well as
a less flexible in its utilization (especially in hours of work). As informant following statement:
Kalau dalam jam kerja tidak boleh melakukan olahraga secara mandiri.. kecuali senam yang terjadwal (setiap jumat) ..sepeda setiap rabu… kita belum mengadakan di kilang.. karena yang mengawasi juga tak ada. (Informant 1 company 1).
Behavioral smoking cessation program
Basically cessation program activity components in smoking behavior in the workplace
already exists or is available. However, not packed in a special program. Some activities or things
that have been supporting this program include the existence of a written policy regarding the
prohibition of smoking in certain places (in the work area), but still allow smoking in the smoking
area of workers in the enterprise environment. Related information restrictions and dangers
merokokpun already available in the company. It is revealed from the statement following
informant:
Kita ada aturan di perusahaan boleh merokok di smoking area..ditempat yang selain itu nggak boleh.. kita membawa mancis nggak boleh..karena di setiap area sudah tersedia.. kita ada information board termasuk media informasi dilarang merokok. (Informant 5 company 3).
Stress management program
In general, stress management programs in the workplace have not been optimally
implemented by the company. It is revealed from pernahnya yet identified stress levels of workers,
special counseling facilities are not available for work stress, lack of specialized personnel /
counselor who ditugasakan to manage employee stress / worker. However, the components of
stress management activities within existing programs that do, among others, in the form of
involving employees in social activities at least once a year. In addition, there is also a special
room for the employees perform religious activities as well as the in-house training for time
Public Health Department, Faculty of Sports Science, F1 Building, 2nd
Floor, Sekaran Campus Gunungpati, Semarang City, Central Java Province, Indonesia, 50229 Phone/ Fax. +6224 8508007
19
management and relationships among workers. It is revealed from the statement following
informant:
Belum menjadi prioritas kita disini. Dalam poin GHS sudah ada kita sampaikan…kendalikan stres..tetapi dalam satu program belum. (Informant 1 company 1).
Closing
Some of the benefits (best practices) to be the strength of the implementation of the WHP
(especially in the management of metabolic syndrome), among others: 1) The existence of a
strong commitment and a good perception of the management in the prevention and treatment of
disease in workers, 2) availability of resources both funds and number of workers (health human
resources), leadership, as well as the carrying capacity of the delivery of information to employees.
Furthermore, the identified weaknesses or barriers, among others; 1) a strong corporate
commitment has not been followed by a health needs assessment for workers to the maximum, 2)
There are no specific policies in response metabolic syndrome workers, 3) The weakness of the
composition and coordination of health workers and between departments / sections / stakeholders
in metabolic syndrome management, 4) Not ideal behavior of workers in the management of
metabolic syndrome, 5) Not optimal role of secondary objectives that can assist the implementation
of WHP (including assisting in the management of metabolic syndrome in the workplace), 6) Low
utilization of available physical exercise in the company and there are still companies do not have
a means of physical fitness (fitness centers) are representative within the company easily
accessible worker.
Furthermore, the recommendations related to the research, in particular to the company,
among others: 1) It is recommended to improve the quality of WHP with a model that is more
systematic, logical and aplikabel. One of the WHP model of the multilevel intervention approach by
involving workers as the main target and social support (family, from colleagues, the management
company), 2) Increase the environmental factors component that can assist the implementation of
WHP; optimizing the provision of infrastructure (especially sports facilities for promotional efforts,
such as fitness facilities are near or easily accessible to workers and the provision of information
as well as healthy food), 3) Management metabolic syndrome included in company policy, 4) Need
SOP handling specific cases accompanied by mapping the management of problems / diseases
suffered by workers by maximizing the utilization of infrastructure / facilities owned by the
company, 5) Completing support personnel in the management of metabolic syndrome, or with the
involvement of support personnel from outside the company so that a comprehensive disease
management can be realized.
References
Alegría, E., Cordero, A., Laclaustra, M., Grima, A., León, M., Casasnovas, J.A. 2005. Prevalence of metabolic syndrome in the Spanish working population: MESYAS registry. Rev Esp Cardiol, 58 (7): 797-806.
20
Public Health Department, Faculty of Sports Science, F1 Building, 2nd
Floor, Sekaran Campus Gunungpati, Semarang City, Central Java Province, Indonesia, 50229 Phone/ Fax. +6224 8508007
Bararah, V.F. 2011. Butuhkan kalori sedikit, pekerja kantoran jangan banyak makan. Available at: http://www.detikhealth.com/read/2011/05/19/072529/1642099 /766/butuh-kalori-sedikit-pekerja-kantoran-jangan-banyak-makan. [Downloaded on February 1, 2012].
Bellentani, S., Dalle Grave, R., Suppini, A., Marchesini, G. 2008. Fatty Liver Italian Network. Behavior therapy for nonalcoholic fatty liver disease: the need for a multidisciplinary approach. Hepatology, 47 (2): 746–754.
Buchari, 2007. Manajemen kesehatan kerja. Available at: http://library.usu.ac.id /download/ft/07002748.pdf. [Downloaded June 20, 2012].
Brug, J., Conner, M., Harre, N., Kremers, S., McKella, R.S., Whitelaw, S. 2005. The Transtheoretical Model and stages of change: a critique: observations by five commentators on the paper by Adams, J. and White, M. (2004) why don't stage-based activity promotion interventions work?. Health Educ Res, 20: 244-258.
Commission on Health and Safety and Workers‘ Compensation. 2010. Guidelines for integrating occupational health and safety with workplace wellness programs. Commission on Health and Safety and Workers’ Compensation. Department of Industrial Relations, University of California, Los Angeles.
Davila, E.P., Florez, H., Fleming, L.E., Lee, D.J., Goodman, E., Leblanc, W.G., et al. 2010. Prevalence of the metabolic syndrome among U.S. Workers. Diabetes Care, 33 (11): 2390-
2395. Glanz, K., Rimer, B.K., Viswanath, K. 2008. Health bahavior and health education. Theory,
research, and practice (4th edition). Published by Jossey-Bass, San Fransisco, CA 94103-1741, USA.
Grave, R.D., Calugi, S., Centis, E., Marzocchi, R., Ghoch, M.E., Marchesini, G.. 2010. Lifestyle modification in the management of the metabolic syndrome: achievements and challenges. Diabetes, Metabolic Syndrome and Obesity: Targets and Therapy, 3: 373–385.
Hawe, P., Degeling, D., Hall, J. 1998. Evaluating Health Promotion. A health workers guide.
Maclennan and Petty Pty Limited, Australia. Health and performance improvement (HPI) Advisors. 2007. Healthy worksite questionnaire.
Available at: http://www.healthandperformance.info/Private/ HPICompany Assessment.pdf. [Downloaded on January 20, 2013].
Hill, J.O. 2009. Can a small-changes approach help address the obesity epidemic? A report of the Joint Task Force of the American Society for Nutrition, Institute of Food Technologists, and International Food Information Council. Am J Clin Nutr, 89: 477-484.
Huang, S. 2008. Fatalities cancer is the main cause of death for Taiwan‘s population in general, but accidental injury is the second-most common cause among workers. Available at: http://www.taipeitimes.com/News/taiwan/archives/2010/02/08/ 2003465463. [Downloaded on May 13, 2011].
International Diabetes Federation. 2006. The IDF consensus worldwide definition of the metabolic syndrome . Available at: http://www. idf .org. [Downloaded on May 20, 2010].
Kremers, S.P., de Bruijn, G.J., Visscher, T.L., van Mechelen, W., de Vries, N.K., Brug, J. 2006. Environmental influences on energy balance-related behaviors: a dual-process view. Int J Behav Nutr Phys Act, 3: 9.
Lohsoonthorn, V., Lertmaharit, S., dan Williams, M.A. 2007. Prevalence of metabolic syndrome among profesional and office workers in Bangkok, Thailand. J Med Assoc Thai, 90 (9): 1908-1915.
Mojo, R. 2007. Modul promosi kesehatan dan keselamatan kerja. Available at: http://staff.ui.ac.id/internal/132096019/material/ModulPromosiKesehatanK3RobianaModjo.pdf. [Downloaded on May 13, 2011].
National Alliance for Nutrition and Activity (NANA). 2003. Obesity and other diet-and inactivity-related diseases; national impact, costs, and solution. Available at: http://www.spencer. k12.ia.us/pages/hs_library/NANA_advocates national policies.pdf. [Downloaded on May 13, 2011].
O‘Riordan, M. 2009. New joint statement streamlines definition of metabolic syndrome. Tersedia di http://www. medscape.com. [Downloaded on January 12, 2013].
Ryan, D.H., Espeland, M.A., Foster, G.D., Haffner S.M., Hubbard, V.S., Johnson, K.C., et al. 2003.
Look AHEAD (Action for Health in Diabetes): design and methods for a clinical trial of weight
Public Health Department, Faculty of Sports Science, F1 Building, 2nd
Floor, Sekaran Campus Gunungpati, Semarang City, Central Java Province, Indonesia, 50229 Phone/ Fax. +6224 8508007
21
loss for the prevention of cardiovascular disease in type 2 diabetes. Control Clin Trials. 24 (5): 610–628.
Sayogo, S. 2009. Sindroma Metabolik. Available at: http://repository.ui.ac.id /contents/koleksi/11/36cb5aa0e4ec8aefe11c838129af61c9d2765de8.pdf. [Downloaded on May 13, 2011].
Semiardji, G. 2004. The significant of visceral fat in metabolic syndrome. Jakarta. Diabetes
meeting; Jakarta. 19-10 Oktober Swinburn, B., Gill, T., Kumanyika, S. 2005. Obesity prevention: a proposed framework for
translating evidence into action. Obes Rev 6: 23-33. Wadden, T.A., Butryn, M.L., Byrne, K.J. 2004. Efficacy of lifestyle modification for long-term weight
control. Obes Res. 12 Suppl: 151S–162S. Western Australian Centre for Health Promotion Research. 2013. Checklist for Planning and
Evaluating Health Promotion Programs. Curtin University of Technology. Available at: http://www.kemh.health.wa.gov.au/services/amssu/docs/Planning Evaluating HP_Checklist. pdf. [Downloaded on February 13, 2013]
WHO. 2013. Workplace health promotion. Available at: http://www.who.int/ occupational health/topics/ workplace/en/index1.html. [Downloaded on February 28, 2013].
Windarwati. 2011. Sindrom metabolik perawat shift dan perawat reguler di RSUP DR. Sardjito tahun 2010. Tesis S2 program Pasca Sarjana Universitas Gajah Mada. Yogyakarta.
Yzer, M. 2012. The integrative model of behavioral prediction as a tool for designing health messages. Available at: http://www.sagepub.com/upm-data/43568_2.pdf [Downloaded on February 13, 2013]
22
Public Health Department, Faculty of Sports Science, F1 Building, 2nd
Floor, Sekaran Campus Gunungpati, Semarang City, Central Java Province, Indonesia, 50229 Phone/ Fax. +6224 8508007
CHILD NUTRITIONIST FOR IMPROVING FOOD SAFETY CHILDREN'S BEHAVIOUR IN SAMARINDA EAST KALIMANTAN
Riyan Ningsih1, Ratih Wirapuspita1, Iwan Muhammad Ramdan1
1Mulawarman University, Indonesia
Corresponding Author: [email protected]
Abstract Introduction: 39.92% food and drink poisoning in Samarinda (BPOM, 2011). Diarrhea is the thrid biggest diseases at Segiri Public Health Center (PHC). This PHC is including 2 elementary school (SDN.028 and SDN.011 Kedondong Voorfo). The aims of this study was to implement interventions such as the establishment of a nutritionist in SDN 011 school children and 028 who brought the concept of community-based problem solving. Methods: Problem identification, media preparation, training of nutritionists and nutritionist ambassador formation. Held also raising assistance from stakeholders and BPOM / PHC, health education to socialization of nutritionist ambassadors. Final evaluation to determine public acceptance of nutritionist ambassadors. Results: Examination of food samples containing 17.24% dangerous chemicals such as formaldehyde, borax, rhodamine B and cyclamate. There was difference between knowledge before and after training. Need monitoring and evaluation for sustainability this program. Keywords: nutritionists, school children Introduction
Food is something that is very important in human life, It is not only nutrition and have
interesting shapes, but also to be safe in the sense that it does not contain microorganisms and
chemicals that can cause of disease.
Food safety is one of the important factors in addition to physical quality, nutrition and taste.
Food safety is defined as a state of being free from danger of injury or damage to the use, safety
aspects if not addressed then the food can be turned into a source of harm, the source of disease
and death.
Student of elementary school is an investment of the nation because they are the future
generation. The quality of the nation in the future is determined by the quality of the children at this
time. Efforts to improve the quality of human resources should be done early, systematic and
continuous. Growing development of student dependent optimal nutrition with good quality and
quantity and correct. During the growth and development of nutrition or food intake in children can
not always be implemented perfectly. Children are especially vulnerable to disease student of
elementry school indigestion caused by certain microorganisms, such as diarrhea and typhoid.
More than 70% incidence of diarrheal diseases caused by consumption of contaminated food.
(Cahyadi, 2009).
Based on BPOM survey in 2004 in elementary schools (throughout Indonesia) showed
that of consumption snaks in elementary school 60% uneligible of standart of quality and safety.
Mentioned that 56% of samples containing rhodamine B and 33% containing borax. FDA Survey
Public Health Department, Faculty of Sports Science, F1 Building, 2nd
Floor, Sekaran Campus Gunungpati, Semarang City, Central Java Province, Indonesia, 50229 Phone/ Fax. +6224 8508007
23
BPOM of 2007, there were 4500 schools in Indonesia proves that 45% of snacks in elementary
dangerous schools (Suci, 2009).
Snacks consumed by children, especially in Indonesia contain substances that are harmful
for consumption because it can cause disease. These harmful substances found in food due to
contamination. Contamination of food caused by many things, such as improper handling during
production, storage, and presentation of the food supply. Contaminants that can contaminate one
food additive. (Suparianto,2006)
Now, many food and beverage products that use food additives in producing it without
knowing the dangers of the ingredient in foods and beverages. The reason manufacturers using
food additives is possible unknown of the possibility of danger posed, get desire for maximum profit
because the price is cheaper than the original food additives and weak surveillance systems and
taking action against the offenders.
Carelessly at school snack habit can affect the learning process takes place when the pain
occurs as a result of consuming unhealthy foods, quality and safety can lead to infection and
disease due to food poisoning cases. Thus indirectly the food can cause learning achievement of
children being dropped off. It is necessary for the formation of an nutritionist ambassador program
in elementary school (SDN 011 and SDN 028) as an effort to improve the child's behavior in
choosing healthy snacks, quality and safety.
Methods
Based on the objectives and expected results, the study will begin with a review of the
identification of existing problems related to nutrition of school children and design appropriate
learning media. In detail, the following activities: (1) Socialization formation nutritionist ambassador
program school children, (2) Recruitment of child in SDN 011 and SDN 028 were willing and able
to be a school child nutrition, (3) Knowing the chemical quality of the food sold in vending
environment SDN 011 and 028, (4) Training child nutritionist ambassador SDN 011 SDN 028
regarding hygiene and sanitation of food and beverages as well as election of a healthy snack
food, quality and safety, (5) Formation nutritionist ambassador SDN 011 and 028 children, (6)
Dissemination any child nutritionist ambassador SDN SDN 011 and 028, (7) Ask for support to
other parties involved in the handling of food safety issues, (7) The creation of a model of
community empowerment, especially elementary school children.
Results and Discussion
This study was conducted at 2 locations: SDN 011, SDN 028 Samarinda.
SDN 011
SDN 011 addressed St. Kedondong Voorfo No. 08 Village Mount, Samarinda Ulu
subdistrict. B. Accreditation Decree No. 116 / BAP-S / M / OT / XI / 2010. Teaching and learning
activities in the morning and afternoon. The number of students there are 521 men 284 (54.12%)
24
Public Health Department, Faculty of Sports Science, F1 Building, 2nd
Floor, Sekaran Campus Gunungpati, Semarang City, Central Java Province, Indonesia, 50229 Phone/ Fax. +6224 8508007
and 237 were women (45.48%) where each level there are 2 classes. Number canteen 3 pieces
and merchants who sell around the school yard there are 17 people.
SDN 028
SDN 011 addressed at St. Kedondong Voorfo No. 20 Village Mount Samarinda Ulu
subdistrict. B. Accreditation of teaching and learning activities in the morning and afternoon. The
number of students there are 480 men 266 (55.41%) and 214 were women (44.58%) where each
level there are 2 classes. Number canteen and merchants selling the same as the one on SDN 011
because of its location in a place that is 3 pieces canteen and merchants who sell around the
school yard there are 17 people. What distinguishes the SDN 011 dan SDN 028 has canteen
hawker selling food and drinks.
Trainee nutritionist of 25 people consisting of 13 people from SDN 011 and 12 of the
participants of this program SDN 028. fourth grade and fifth grade classes selected participants are
expected to not give the information obtained during training and is quite capable of hurling
opinions. Based on the results of the identification of problems in the field found that snack foods
containing food additives are prohibited such as borax, formalin, rhodamine B and cyclamate was
17.24%, which can be detrimental to health. Consumption of snack foods that are less safe it self
can have a negative impact on the health of children. in the short term the child may suffer
diarrhea, intestinal worms, and other digestive diseases. As for the long term, cognitive abilities,
physical, and intelligence will be disturbed children and betpotensi cancer because of harmful
chemicals that are carcinogenic. of course, our country will be difficult to develop if many seeds the
next generation that are less qualified. It is necessary for the formation of an ambassador program
nutritionist primary elementary school (SD) as an effort to improve the child's behavior in choosing
healthy snacks, quality and safety. Obtained the following results:
Socialization program nutrition nutritionist ambassador formation of primary school
children (SD) as an effort to increase awareness of children in choosing snacks that are healthy
and safe. (a) Socialization 011 held at SDN 28 and SDN particular class IV and V are willing and
able to follow it. Socialization is held by visiting each school to provide information to principals and
classroom teachers regarding the activities of the school child nutrition expert training.
Socialization is also done outside of school hours has been completed, to conduct a meeting
between the principal and second grade elementary school teacher and discuss the proposal the
names of the participants will be trained. (b) Recruitment of elementary school children who are
able and willing to be an ambassador nutritionist with some requirements. Recruitment
ambassador nutritionists school children selected from the class teacher with the requirements of
willing and able to be a school child nutrition expert. Nutritionists school children are expected to
convey information problems in the selection of healthy snacks and safe. Rekuitmen done by
looking at the proposed bio-grade teacher and want to follow the training. (c) Examination of the
quality of food is chemically to determine the content of food sold street food sellers in the school
environment and SDN 028 SDN 011. Examination of samples of whole food snacks that are sold
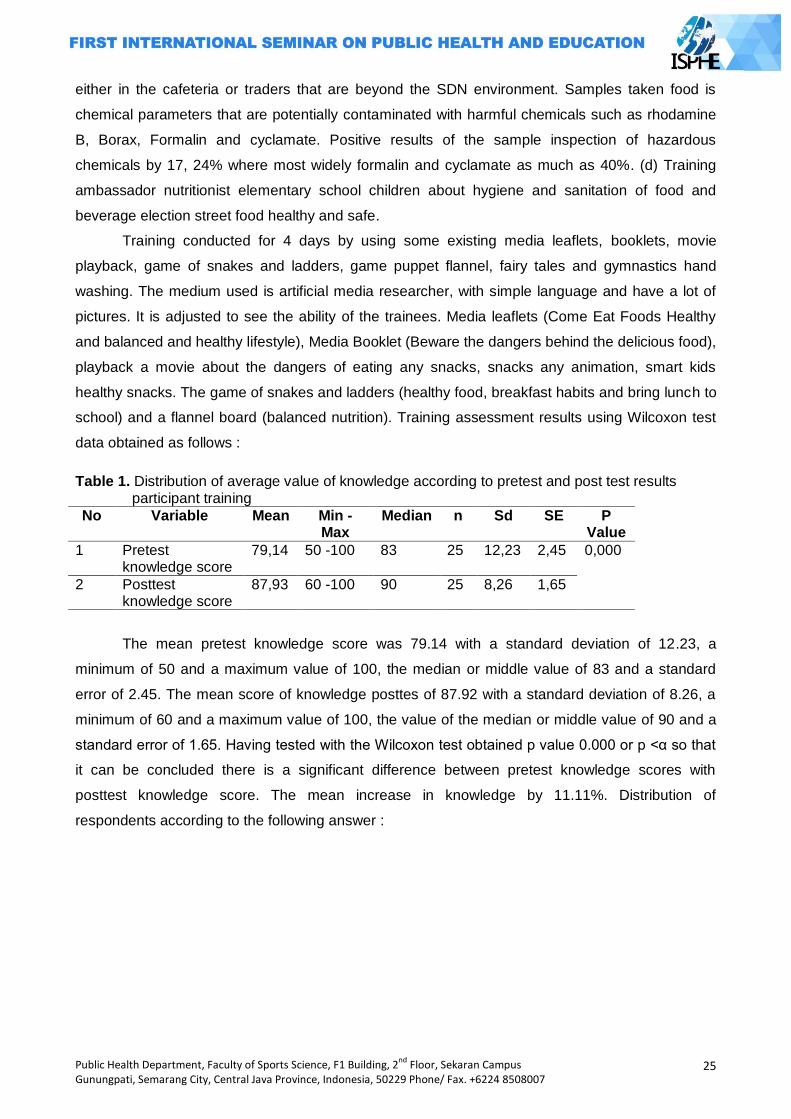
Public Health Department, Faculty of Sports Science, F1 Building, 2nd
Floor, Sekaran Campus Gunungpati, Semarang City, Central Java Province, Indonesia, 50229 Phone/ Fax. +6224 8508007
25
either in the cafeteria or traders that are beyond the SDN environment. Samples taken food is
chemical parameters that are potentially contaminated with harmful chemicals such as rhodamine
B, Borax, Formalin and cyclamate. Positive results of the sample inspection of hazardous
chemicals by 17, 24% where most widely formalin and cyclamate as much as 40%. (d) Training
ambassador nutritionist elementary school children about hygiene and sanitation of food and
beverage election street food healthy and safe.
Training conducted for 4 days by using some existing media leaflets, booklets, movie
playback, game of snakes and ladders, game puppet flannel, fairy tales and gymnastics hand
washing. The medium used is artificial media researcher, with simple language and have a lot of
pictures. It is adjusted to see the ability of the trainees. Media leaflets (Come Eat Foods Healthy
and balanced and healthy lifestyle), Media Booklet (Beware the dangers behind the delicious food),
playback a movie about the dangers of eating any snacks, snacks any animation, smart kids
healthy snacks. The game of snakes and ladders (healthy food, breakfast habits and bring lunch to
school) and a flannel board (balanced nutrition). Training assessment results using Wilcoxon test
data obtained as follows :
Table 1. Distribution of average value of knowledge according to pretest and post test results participant training
No Variable Mean Min -Max
Median n Sd SE P Value
1 Pretest knowledge score
79,14 50 -100 83 25 12,23 2,45 0,000
2 Posttest knowledge score
87,93 60 -100 90 25 8,26 1,65
The mean pretest knowledge score was 79.14 with a standard deviation of 12.23, a
minimum of 50 and a maximum value of 100, the median or middle value of 83 and a standard
error of 2.45. The mean score of knowledge posttes of 87.92 with a standard deviation of 8.26, a
minimum of 60 and a maximum value of 100, the value of the median or middle value of 90 and a
standard error of 1.65. Having tested with the Wilcoxon test obtained p value 0.000 or p <α so that
it can be concluded there is a significant difference between pretest knowledge scores with
posttest knowledge score. The mean increase in knowledge by 11.11%. Distribution of
respondents according to the following answer :
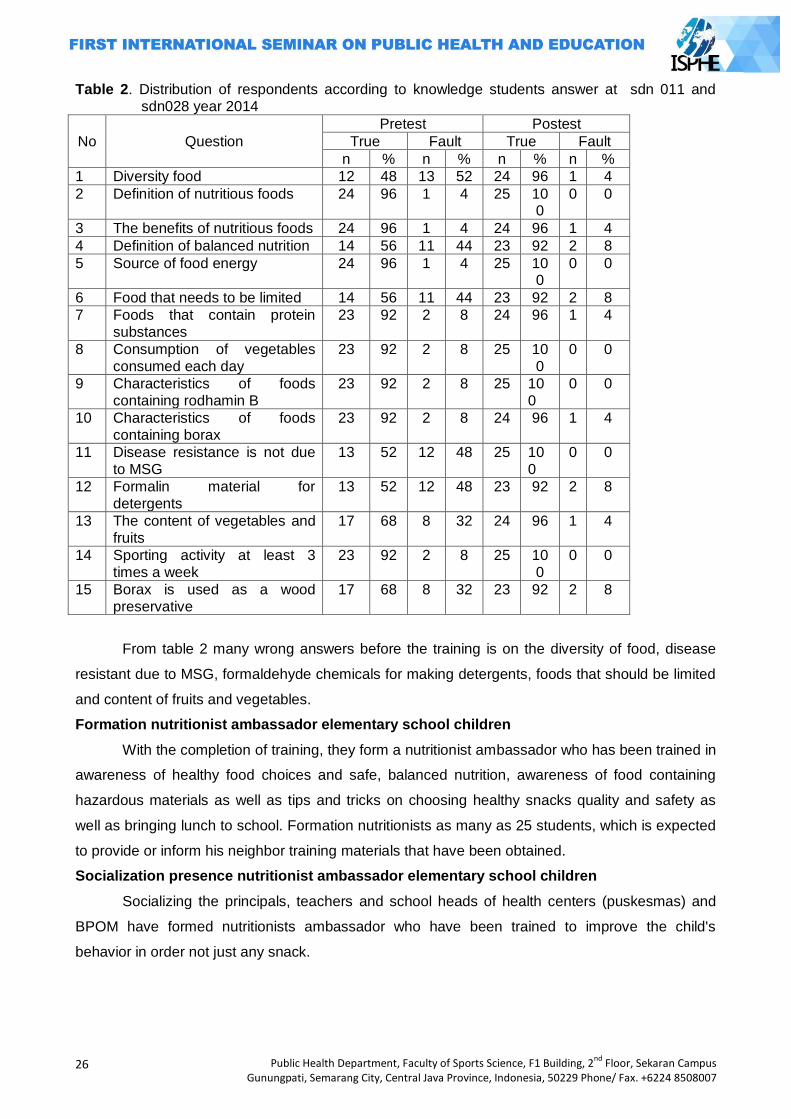
26
Public Health Department, Faculty of Sports Science, F1 Building, 2nd
Floor, Sekaran Campus Gunungpati, Semarang City, Central Java Province, Indonesia, 50229 Phone/ Fax. +6224 8508007
Table 2. Distribution of respondents according to knowledge students answer at sdn 011 and sdn028 year 2014
No Question
Pretest Postest
True Fault True Fault
n % n % n % n %
1 Diversity food 12 48 13 52 24 96 1 4
2 Definition of nutritious foods 24 96 1 4 25 100
0 0
3 The benefits of nutritious foods 24 96 1 4 24 96 1 4
4 Definition of balanced nutrition 14 56 11 44 23 92 2 8
5 Source of food energy 24 96 1 4 25 100
0 0
6 Food that needs to be limited 14 56 11 44 23 92 2 8
7 Foods that contain protein substances
23 92 2 8 24 96 1 4
8 Consumption of vegetables consumed each day
23 92 2 8 25 100
0 0
9 Characteristics of foods containing rodhamin B
23 92 2 8 25 100
0 0
10 Characteristics of foods containing borax
23 92 2 8 24 96 1 4
11 Disease resistance is not due to MSG
13 52 12 48 25 100
0 0
12 Formalin material for detergents
13 52 12 48 23 92 2 8
13 The content of vegetables and fruits
17 68 8 32 24 96 1 4
14 Sporting activity at least 3 times a week
23 92 2 8 25 100
0 0
15 Borax is used as a wood preservative
17 68 8 32 23 92 2 8
From table 2 many wrong answers before the training is on the diversity of food, disease
resistant due to MSG, formaldehyde chemicals for making detergents, foods that should be limited
and content of fruits and vegetables.
Formation nutritionist ambassador elementary school children
With the completion of training, they form a nutritionist ambassador who has been trained in
awareness of healthy food choices and safe, balanced nutrition, awareness of food containing
hazardous materials as well as tips and tricks on choosing healthy snacks quality and safety as
well as bringing lunch to school. Formation nutritionists as many as 25 students, which is expected
to provide or inform his neighbor training materials that have been obtained.
Socialization presence nutritionist ambassador elementary school children
Socializing the principals, teachers and school heads of health centers (puskesmas) and
BPOM have formed nutritionists ambassador who have been trained to improve the child's
behavior in order not just any snack.
Public Health Department, Faculty of Sports Science, F1 Building, 2nd
Floor, Sekaran Campus Gunungpati, Semarang City, Central Java Province, Indonesia, 50229 Phone/ Fax. +6224 8508007
27
Ask for support to related parties abaut in a matter of habit careless snack
This can be evidenced by signing the charter's commitment to support the school child
nutrition expert. Expected no assistance from the clinic, especially Segiri health center for
sustainability of the program and monitoring can be done periodically.
The creation of a model of community empowerment, especially elementary school children
SDN 011 and SDN 028 including public school favorite. State Elementary School (SDN) is
a favorite elementary school which is the nickname of the local community that the school shows a
lot of interest and either unseeded or graduates from academic achievement to reach 100% with
an average value of UAN (national test) is also good (above average all participants UAN). From 2
locations ie SDN SDN SDN 028 011 and the total number of students there are 1001 students. In
this case if they eat street food in unsanitary conditions so that as many as 1001 people at risk of
pain plus the teachers and parents who also deliver the snack foods. Due to unhealthy food is a
cause of disease transmission caused by food (food borne diseases). Moreover, when the time of
his illness at the lessons learned process mengajarpun impaired that will mepengaruhi academic
values, if it lasts for a long time affects his future, because childrens are the future generation
(Profile SDN 011 and SDN 028).
Based on in-depth interviews with the principal of SDN 011 and SDN 028 show that the
school will feel restless behavior snack their students especially school children outside the
boundary fence of the school environment (not in the school cafeteria). Instead of prohibiting
school for snacks outside, the school expects that children who snack after school hours outside
the fence is completed. At snack time, accompanied by the parents or the people who pick, so in
choosing snacks that children eat can control. Therefore, with the observation of the child's parents
are expected to follow arbitrarily choosing snacks. So with these problems there needs to be action
to pocket child's behavior is not arbitrary and can choose a healthy snack food, quality and safety
need to be established ambassador nutritionist charge schoolchildren convey information /
education to their peers, older level and younger level ( Laksmi W, et,all, 2008)
Through nutrition education in the form of training is expected to not only the child has an
attitude and way of practice in food consumption but they also can affect friends and even his own
family, so the family and its members can change the wrong habits into good habits. Elementary
school children are candidates for future development actors then in its infancy need adequate
nutrition. Street food plays an important role in providing an additional contribution to nutritional
adequacy, in particular energy and protein. Habit of eating snacks in schools occurs because 3-4
hours after breakfast stomach will feel hungry again (Sihadi, 2004). The low contribution of
nutrients from food snacks that caused most of the elementary school children consume snack
foods lacking nutritional content varies because it only consists of 1 or 2 types of nutrients alone
(Hermina et al, 2000). Street food should not be consumed at main meal times. Consumption of
snacks children can maintain adequate energy before the main meal arrived. However, excessive
28
Public Health Department, Faculty of Sports Science, F1 Building, 2nd
Floor, Sekaran Campus Gunungpati, Semarang City, Central Java Province, Indonesia, 50229 Phone/ Fax. +6224 8508007
consumption of snacks can also contribute to weight gain if a choice snack foods high in calories,
fat, sugar, and low in nutrients needed by the children (Koukel S, 2009).
To improve the ability to choose healthy foods, quality and safety need to be established
later nutritionists who obtained information during training can be delivered back to the peers,
brother and sister level rate even to his parents. Trainee nutritionist attended by 25 students from
SDN 011 as many as 13 people and 12 people from SDN 028. Trainees dietician was taken from
class IV and class V as in the classroom or learning study period was long enough levels are
expected to guide younger in choosing healthy foods, quality and safety. In addition to the class IV
and V already has good communication with friends, older level, younger level even with their
teachers. It is expected that the formation of the nutritionist ambassador intent and purpose of the
formation of a nutritionist can be achieved. At the time of the training the participants were very
enthusiastic event for the event with a variety of questions. Based on the results of questions and
answers with a trainee dietician most 13 children (52%) like a good meatball. Meatballs snacks
soup, sauce or bulb bulb burn. Based on the information behavior of participants conducted in the
school cafeteria snack and outside of school. (Muhilal, 2006)
Based on research Wijaya R (2009) Knowledge of nutrition and food safety is the cognitive
aspect of the respondents showed an understanding of nutrition and food safety. The level of
knowledge of nutrition and food safety practices in a person's influence on food selection,
processing and storage of food.
Trainees who have a good understanding of the possibilities because it can be the subjects
of such information on the biology and health of physical education (Penjaskes). While that is less
understood is the new informations obtained at the time research. Besides this factor also comes
from the knowledge level of the participants themselves proficiency level as the level of intelligence
of children 4% of the participants who have good skills pretest and posttest values always have a
value of 100.
Knowledge is the result of the idea, and it occurred after the conduct of sensing towards a
particular object. Domain knowledge is very important in shaping a person's actions (Notoatmodjo,
2007). From existing studies, although the awareness and knowledge about the health community
has been high, but the practice is still low health or behavior. After assessment by the World Health
Organization (WHO), especially in developing countries was a factor supporting or not supporting
community facilities for healthy behavior (Notoatmodjo 2007). Meanwhile, according Suprapti
(2004), a lot of factors that affect the practice / one person's action is a habit that has been done
for generations in everyday life. The habit may be less good, but it is difficult to change it.
From the results of the study are positive foods contain harmful chemicals as much as
17.24% as formalin, borax, rhodamine B, and cyclamate where formaldehyde is used as a
preservative commonly used for food preservative corpse. Cyclamate is usually used as a low-
energy sweetener for diabetics special diet. So from the research that has been conducted
examinations of school children sampled street food either microbiologically or chemically ineligible
Public Health Department, Faculty of Sports Science, F1 Building, 2nd
Floor, Sekaran Campus Gunungpati, Semarang City, Central Java Province, Indonesia, 50229 Phone/ Fax. +6224 8508007
29
because they found that had the same positive bacteria and E. coli contain harmful chemicals such
as formaldehyde, borax and rhodamine B. Hazardous chemicals such as formaldehyde are
commonly used corpse if it is used as a preservative in foods can damage the health of children.
Formaldehyde vapors can irritate the eyes and nose if eaten in large doses of more than 90 ml of
blood can cause vomiting, diarrhea, lung cancer, blood urine convulsions can even cause death.
Borax is commonly used as a wood preservative materials and detergents. The effects of
chemicals there are acute and chronic. Acute short time in large doses, while chronic small doses
for a long time (Saparinto,2006).
Closing
The results of this study can be summarized as follows: it has been socialized programs
dietician school children, it has been merekuit the students who are willing and able to be an
ambassador nutritionist nutrition problems of school children, already inspected street food
samples contained 17% positive for hazardous chemicals, nutritionist training has been carried out
for 4 days, with 5 media training, formation ambassador nutritionist nutrition problems of school
children, it has been socialized existence nutritionist nutrition problems of school children at a local
school principal, ask for support in the clinic and the FDA in the treatment of nutrition problems of
school children
Advice can be given as follows: the training should be done every month, for training as a
form of reward for the ambassador nutritionist, a means to exchange ideas and nutrition experts is
one of the activities in maintaining the sustainability of the program, need for guidance and
assistance of stakeholders, including school health centers and BPOM to school nutrition problems
of school children, especially street food, need for monitoring and evaluation activities nutritionist,
so this empowerment model can be continued.
The researchers gratefully acknowledge the cooperation of the school SDN 011 and 028.
Researcher appreciation for the spirit of learning and sharing experiences from the student SDN
011 and SDN 028.
References
Agustina, et al, 2009. Sanitation Hygiene In Food Traders Traditional Snacks In The Village Elementary School Environment Demang Lebar Daun Palembang. Uppm.fkm.unsri.ac.id/uploads/files/u February 2014
Aminah, 2007. Food Safety Knowledge Seller Environment Food Snacks In Wonodri Village School District of South Semarang
Cahyadi, 2009. Malnutrition and Poverty. Daily Mind. May 5, 2009 Cahyadi, Vishnu, 2008. Analysis and Material Aspects of Food Additives. New York: Publisher
Earth Literacy Hermina TS, Hidayat N, Afriansyah, Salimar, Susanto D. 2000. Feeding behavior of primary
school pupils receiver PMT-AS in village Ciheuleut dan Pasir Gaok Kabupaten Bogor. Bogor: Pusat Penelitian dan Pengembangan Gizi
Koukel S. 2009. Choosing healthy snacks for children. Extension Faculty Health, Home, and
Family Development University of Alaska Fairbanks 5 Maret 2014 URL:
30
Public Health Department, Faculty of Sports Science, F1 Building, 2nd
Floor, Sekaran Campus Gunungpati, Semarang City, Central Java Province, Indonesia, 50229 Phone/ Fax. +6224 8508007
http//:www.uaf.edu. Laksmi W, Chriswardhani S, Anung S. 2008. Influence comics healthy snacks and nutritious foods
for improving the knowledge and attitudes of elementary school children. Report Risbinkes: Badan Penelitian dan Pengembangan Kesehatan Depkes RI Semarang
Muhilal, D. Damayanti . 2006. Balanced Nutrition For Elementary School Age Children. Jakarta : PT. Primamedia Pustaka.
Minanlerat, et al. 2010. Bacteriological study of street food in school children in Manokwari, West Papua Province. Bulletin of epidemiological surveillance and technology. Engineering Center for Environmental Health and Communicable Disease Ambon.
Notoatmodjo S. 2007, Public health sciences and the arts.. Jakarta: PT Rineka Cipta. Ningsih, R. 2012. Knowledge Level Differences, Sanitation Hygiene Practices At Food Merchants
Snack Food Before and After Given Guidance on the Quality of food sold in the city of Samarinda Environment SDN Favorites of 2012
Suci, 2009. Overview Student Behavior Elementary School Snack in Jakarta. Psikobuana. BPOM, 2011. Annual Report Center for Food and Drug Administration.
Shepherd R, Sparks P. 1999. Modelling food chioce. In: Mac Fie HJH, Thomson DMH. Measurement of Food Preferences. Gaithersburg, MD: Aspen
Saparinto C dan D. Hidayati. 2006.Food Additives. Yogyakarta : Kanisius Sihadi, 2004. Snack food for school children. Jurnal Kedokteran Yarsi Wijaya R, 2009, Implementation of Food Safety Regulations and practices Snaks School Children
in Bogor
Public Health Department, Faculty of Sports Science, F1 Building, 2nd
Floor, Sekaran Campus Gunungpati, Semarang City, Central Java Province, Indonesia, 50229 Phone/ Fax. +6224 8508007
31
THE INFLUENCE OF CHILDREN’S CARIES PREVENTION ON THE CARIES INCIDENT ON 1ST MOLAR PERMANENT
(Case Study in Sumberejo Elementary School, Kaliwungu Kendal)
Yunita Dyah Puspita Santik
Semarang State University, Indonesia
Corresponding Author: [email protected]
Abstract Introduction: Caries is a disease characterized by damage on dental hard tissues by microorganisms which involve email, dentin and sementum. The caries frequency in 1st molar permanent on children‘s is very high. 66-88% 1st molar permanent childrens‘s had caries. Because of that, so need to know about the influence of children‘s caries prevention.on the caries incident on 1st molar permanent. Methods: This study is an observational analytic with case-control approach. Data collection are
done by observation, in-depth interviews, questionnaires and examination. Population of study are student Sumberejo elementary school, Kaliwungu Kendal. Samples were determined using purposive sampling technique, acquired 75 children‘s who have caries on 1st molar as a case and 75 children‘s who do not have caries on 1st molar as a control. The study subjects aged between 8-14 years. Results: The result of multivariate analysis states that worst dental plaque sqore (OR=9,6; 95%
CI=3,5-26,5), children‘s with worst way of brushing teeth (OR=4,6; 95% CI=2,0-10,4), rarely
consumtion non-cariogenic drinking (OR=2,6; 95% CI=1,2-5,7) are risk factors for caries incident
on 1st molar permanent. Children‘s caries prevention behaviour that have significant relationship
with caries incident on 1st molar permanent are children‘s with worst way of brushing teeth and
rarely consumtion non-cariogenic drinking, resulting worst dental plaque sqore. Parents and
children‘s must increase knowledge and practice about caries prevention for 1st molar permanent.
Key Words: Caries, teeth, 1st molar, dental plaque, way of brushing teeth, eating habits Introduction
Caries is a progressive demineralization process, causing the disintegration of mineral
components that result in the formation of cavities (Fejerskov & Kidd, 2003; McLtire, 2005;
Selwitz.at.al, 2007). The permanent molars (M1) is susceptible to caries as the first permanent
teeth grow and supported anatomic shape with a lot of gaps and knurl. The growth of the
permanent teeth begin to gear down the M1, which is growing at the age of 6 years old. Dental
caries attacked M1 is 66-88% of all teeth in children (Cahyadi, 1997; Noronha.et.al, 1999;
Luca.et.al, 2001).
The frequency of tooth brushing, teeth brushing time, and the amount of carbohydrate
associated with caries experience of primary school children (Cahyadi, 1997). Research Anggraeni
et.al in 2010, stated that the high prevalence of caries in children with mental retardation related to
poor eating habits, dental hygiene habits and customs overcome dental problems. Research by
32
Public Health Department, Faculty of Sports Science, F1 Building, 2nd
Floor, Sekaran Campus Gunungpati, Semarang City, Central Java Province, Indonesia, 50229 Phone/ Fax. +6224 8508007
Luca.et.al in 2000, showed that parental knowledge about the timing of tooth eruption and position
of M1 is still low, there is a difference between knowledge of dental health in theory with the
practice of dental hygiene, so that required dental caries prevention program in M1. Tin Research
Oo.et.al in 2011, to measure the prevalence of caries in children a mixed dentition period.
Wang.et.al (2012), reported that there is a high prevalence of caries in deciduous and permanent
teeth of children aged 7-8 years. Research Samadani and Ahmad in 2012, reported a high
prevalence of caries in children's teeth M1 mixture dentition period associated with increasing age,
than the level of knowledge is also associated with the incidence of caries.
Methods
This study was an observational analytic approach to case-control (Armenian, 2009). Data
was collected through observation, in-depth interviews and questionnaires. Sampling technique
using purposive sampling technique.
Child's diet daily Quessioner measured using Food Frequency (FFQ) (Lakshmi, 2009;
Rossana, 2010). Measurement of dental plaque scores using O'Leary plaque index (Caranza &
Newman, 2002).
The dependent variable is the M1 caries. The independent variables are: the factors
characteristic of the child, how to brush your child's teeth, kids brushing frequency, brushing a
child's teeth, regular dental checkups, child's diet, salivary pH, the composition of the teeth, dental
plaque.
Data were analyzed using the computer program Statistical Package for Social Science
(SPSS) for Windows version 16.0. Test analysis consisted of univariate, bivariate and multivariate
analyzes. penlitian results The results of the analysis of the characteristics of the study subjects
showed that there was no significant relationship between age, gender, parental education levels
and occupations of parents with the incidence of dental caries in M1.
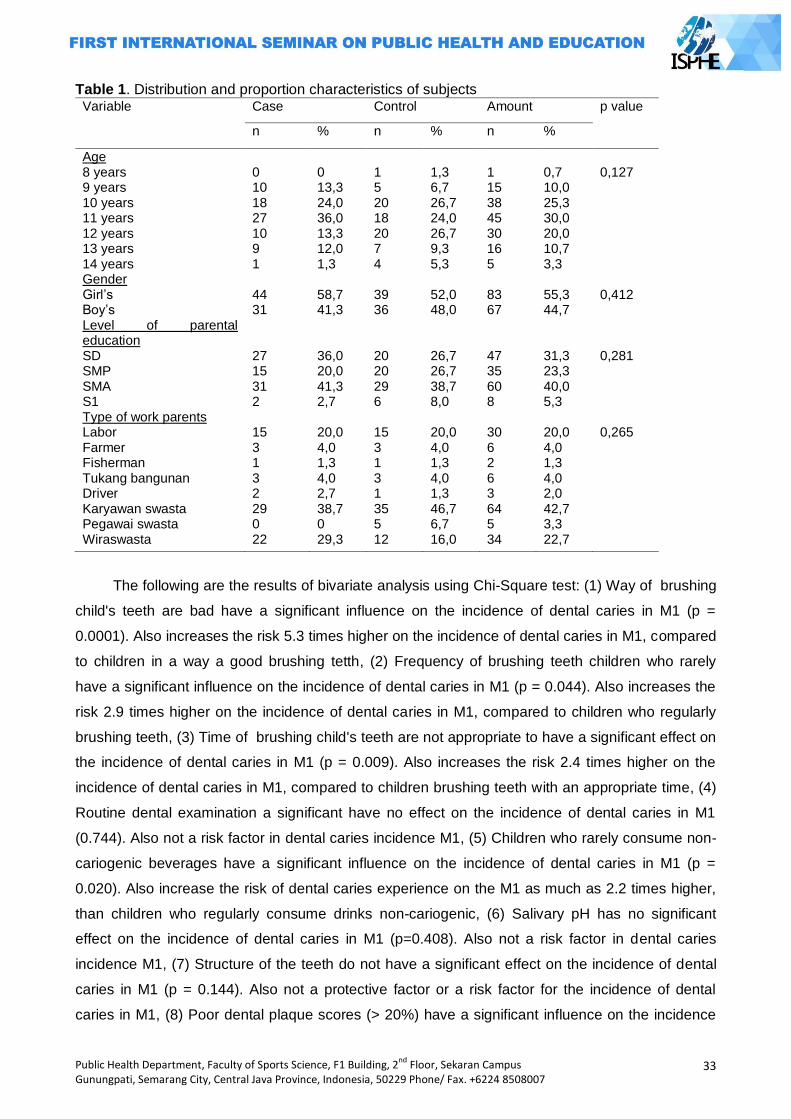
Public Health Department, Faculty of Sports Science, F1 Building, 2nd
Floor, Sekaran Campus Gunungpati, Semarang City, Central Java Province, Indonesia, 50229 Phone/ Fax. +6224 8508007
33
Table 1. Distribution and proportion characteristics of subjects Variable Case Control Amount p value
n % n % n %
Age 8 years 9 years 10 years 11 years 12 years 13 years 14 years Gender Girl‘s Boy‘s Level of parental education SD SMP SMA S1 Type of work parents Labor Farmer Fisherman Tukang bangunan Driver Karyawan swasta Pegawai swasta Wiraswasta
0 10 18 27 10 9 1 44 31 27 15 31 2 15 3 1 3 2 29 0 22
0 13,3 24,0 36,0 13,3 12,0 1,3 58,7 41,3 36,0 20,0 41,3 2,7 20,0 4,0 1,3 4,0 2,7 38,7 0 29,3
1 5 20 18 20 7 4 39 36 20 20 29 6 15 3 1 3 1 35 5 12
1,3 6,7 26,7 24,0 26,7 9,3 5,3 52,0 48,0 26,7 26,7 38,7 8,0 20,0 4,0 1,3 4,0 1,3 46,7 6,7 16,0
1 15 38 45 30 16 5 83 67 47 35 60 8 30 6 2 6 3 64 5 34
0,7 10,0 25,3 30,0 20,0 10,7 3,3 55,3 44,7 31,3 23,3 40,0 5,3 20,0 4,0 1,3 4,0 2,0 42,7 3,3 22,7
0,127 0,412 0,281 0,265
The following are the results of bivariate analysis using Chi-Square test: (1) Way of brushing
child's teeth are bad have a significant influence on the incidence of dental caries in M1 (p =
0.0001). Also increases the risk 5.3 times higher on the incidence of dental caries in M1, compared
to children in a way a good brushing tetth, (2) Frequency of brushing teeth children who rarely
have a significant influence on the incidence of dental caries in M1 (p = 0.044). Also increases the
risk 2.9 times higher on the incidence of dental caries in M1, compared to children who regularly
brushing teeth, (3) Time of brushing child's teeth are not appropriate to have a significant effect on
the incidence of dental caries in M1 (p = 0.009). Also increases the risk 2.4 times higher on the
incidence of dental caries in M1, compared to children brushing teeth with an appropriate time, (4)
Routine dental examination a significant have no effect on the incidence of dental caries in M1
(0.744). Also not a risk factor in dental caries incidence M1, (5) Children who rarely consume non-
cariogenic beverages have a significant influence on the incidence of dental caries in M1 (p =
0.020). Also increase the risk of dental caries experience on the M1 as much as 2.2 times higher,
than children who regularly consume drinks non-cariogenic, (6) Salivary pH has no significant
effect on the incidence of dental caries in M1 (p=0.408). Also not a risk factor in dental caries
incidence M1, (7) Structure of the teeth do not have a significant effect on the incidence of dental
caries in M1 (p = 0.144). Also not a protective factor or a risk factor for the incidence of dental
caries in M1, (8) Poor dental plaque scores (> 20%) have a significant influence on the incidence
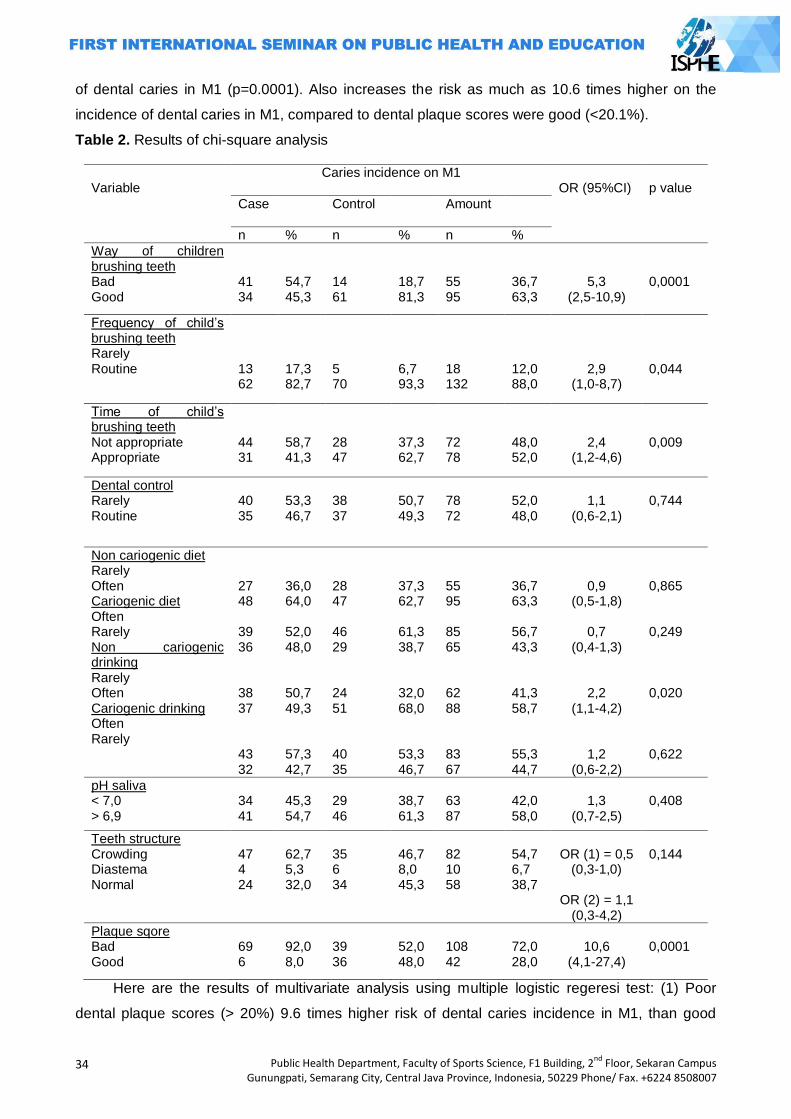
34
Public Health Department, Faculty of Sports Science, F1 Building, 2nd
Floor, Sekaran Campus Gunungpati, Semarang City, Central Java Province, Indonesia, 50229 Phone/ Fax. +6224 8508007
of dental caries in M1 (p=0.0001). Also increases the risk as much as 10.6 times higher on the
incidence of dental caries in M1, compared to dental plaque scores were good (<20.1%).
Table 2. Results of chi-square analysis
Variable
Caries incidence on M1
OR (95%CI)
p value Case
Control Amount
n % n % n %
Way of children brushing teeth Bad Good
41 34
54,7 45,3
14 61
18,7 81,3
55 95
36,7 63,3
5,3 (2,5-10,9)
0,0001
Frequency of child‘s brushing teeth Rarely Routine
13 62
17,3 82,7
5 70
6,7 93,3
18 132
12,0 88,0
2,9 (1,0-8,7)
0,044
Time of child‘s brushing teeth Not appropriate Appropriate
44 31
58,7 41,3
28 47
37,3 62,7
72 78
48,0 52,0
2,4 (1,2-4,6)
0,009
Dental control Rarely Routine
40 35
53,3 46,7
38 37
50,7 49,3
78 72
52,0 48,0
1,1
(0,6-2,1)
0,744
Non cariogenic diet Rarely Often Cariogenic diet Often Rarely Non cariogenic drinking Rarely Often Cariogenic drinking Often Rarely
27 48 39 36 38 37 43 32
36,0 64,0 52,0 48,0 50,7 49,3 57,3 42,7
28 47 46 29 24 51 40 35
37,3 62,7 61,3 38,7 32,0 68,0 53,3 46,7
55 95 85 65 62 88 83 67
36,7 63,3 56,7 43,3 41,3 58,7 55,3 44,7
0,9 (0,5-1,8)
0,7
(0,4-1,3)
2,2 (1,1-4,2)
1,2 (0,6-2,2)
0,865 0,249 0,020 0,622
pH saliva < 7,0 > 6,9
34 41
45,3 54,7
29 46
38,7 61,3
63 87
42,0 58,0
1,3
(0,7-2,5)
0,408
Teeth structure Crowding Diastema Normal
47 4 24
62,7 5,3 32,0
35 6 34
46,7 8,0 45,3
82 10 58
54,7 6,7 38,7
OR (1) = 0,5
(0,3-1,0)
OR (2) = 1,1 (0,3-4,2)
0,144
Plaque sqore Bad Good
69 6
92,0 8,0
39 36
52,0 48,0
108 42
72,0 28,0
10,6
(4,1-27,4)
0,0001
Here are the results of multivariate analysis using multiple logistic regeresi test: (1) Poor
dental plaque scores (> 20%) 9.6 times higher risk of dental caries incidence in M1, than good
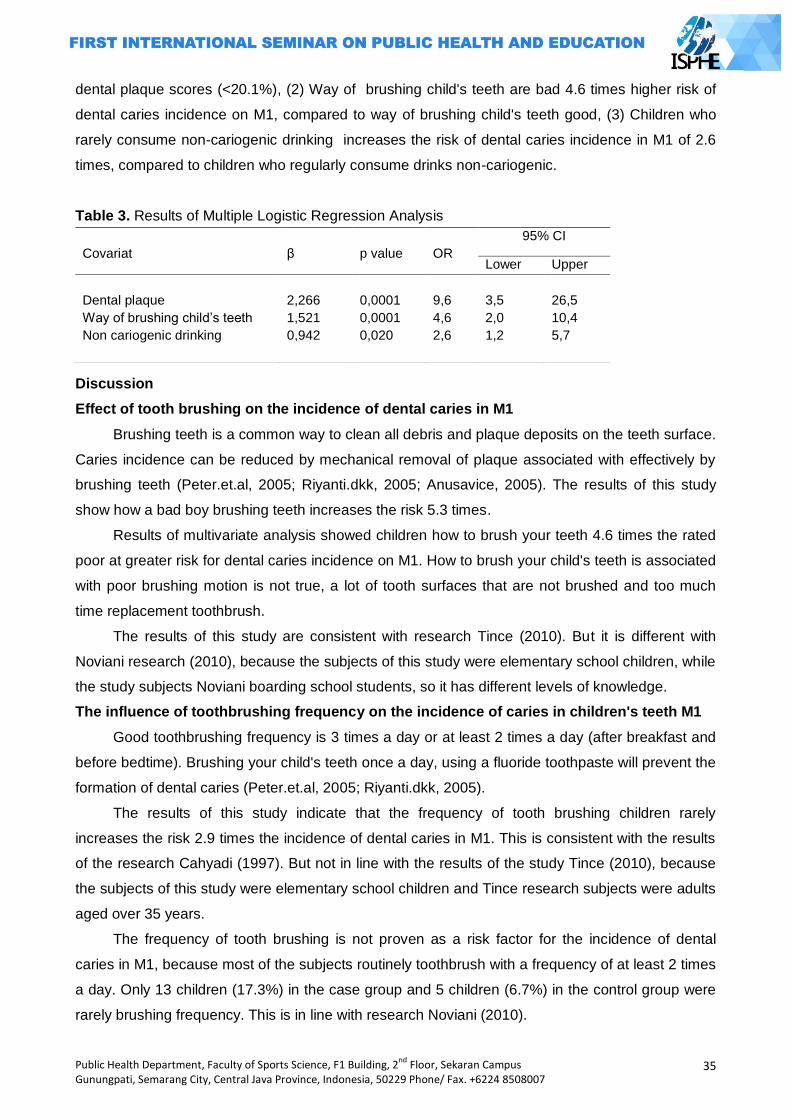
Public Health Department, Faculty of Sports Science, F1 Building, 2nd
Floor, Sekaran Campus Gunungpati, Semarang City, Central Java Province, Indonesia, 50229 Phone/ Fax. +6224 8508007
35
dental plaque scores (<20.1%), (2) Way of brushing child's teeth are bad 4.6 times higher risk of
dental caries incidence on M1, compared to way of brushing child's teeth good, (3) Children who
rarely consume non-cariogenic drinking increases the risk of dental caries incidence in M1 of 2.6
times, compared to children who regularly consume drinks non-cariogenic.
Table 3. Results of Multiple Logistic Regression Analysis
Discussion
Effect of tooth brushing on the incidence of dental caries in M1
Brushing teeth is a common way to clean all debris and plaque deposits on the teeth surface.
Caries incidence can be reduced by mechanical removal of plaque associated with effectively by
brushing teeth (Peter.et.al, 2005; Riyanti.dkk, 2005; Anusavice, 2005). The results of this study
show how a bad boy brushing teeth increases the risk 5.3 times.
Results of multivariate analysis showed children how to brush your teeth 4.6 times the rated
poor at greater risk for dental caries incidence on M1. How to brush your child's teeth is associated
with poor brushing motion is not true, a lot of tooth surfaces that are not brushed and too much
time replacement toothbrush.
The results of this study are consistent with research Tince (2010). But it is different with
Noviani research (2010), because the subjects of this study were elementary school children, while
the study subjects Noviani boarding school students, so it has different levels of knowledge.
The influence of toothbrushing frequency on the incidence of caries in children's teeth M1
Good toothbrushing frequency is 3 times a day or at least 2 times a day (after breakfast and
before bedtime). Brushing your child's teeth once a day, using a fluoride toothpaste will prevent the
formation of dental caries (Peter.et.al, 2005; Riyanti.dkk, 2005).
The results of this study indicate that the frequency of tooth brushing children rarely
increases the risk 2.9 times the incidence of dental caries in M1. This is consistent with the results
of the research Cahyadi (1997). But not in line with the results of the study Tince (2010), because
the subjects of this study were elementary school children and Tince research subjects were adults
aged over 35 years.
The frequency of tooth brushing is not proven as a risk factor for the incidence of dental
caries in M1, because most of the subjects routinely toothbrush with a frequency of at least 2 times
a day. Only 13 children (17.3%) in the case group and 5 children (6.7%) in the control group were
rarely brushing frequency. This is in line with research Noviani (2010).
Covariat
β
p value
OR
95% CI
Lower Upper
Dental plaque
Way of brushing child‘s teeth
Non cariogenic drinking
2,266
1,521
0,942
0,0001
0,0001
0,020
9,6
4,6
2,6
3,5
2,0
1,2
26,5
10,4
5,7
36
Public Health Department, Faculty of Sports Science, F1 Building, 2nd
Floor, Sekaran Campus Gunungpati, Semarang City, Central Java Province, Indonesia, 50229 Phone/ Fax. +6224 8508007
Effect of time brushing their teeth against dental caries incidence on M1
Brushing the teeth, especially at night is very important, aiming to prevent plaque and debris
(food scraps) are attached on the surface of the teeth every night (Riyanti.dkk, 2005). Brushing
teeth is well done regularly every morning 30 minutes after breakfast and at night before bed
(Angela, 2005).
The results of this study indicate that the time to brush your child's teeth that do not fit a 2.4
times increased risk of dental caries incidence on M1. This is consistent with the results of the
research Cahyadi (1997) and Pakpahan (2002). This is not in line with the research Noviani
(2010), dealing with the subject of this study of elementary school children and Noviani research
subjects are boarding students, which both have a different tooth brushing habits.
Effect of routine dental examination on the incidence of dental caries in M1
Regular dental checkups to the clinic, hospital, and dentist once every six months is vital as
early detection of caries. Routine dental examination and consultation as a means to a good
psychological effect on the child to the dentist (Anusavice, 2005; Riyanti, 2005; Andini, 2007).
The results of this study indicate that routine dental examination is not a risk factor for the
incidence of dental caries in M1. This is consistent with the purpose of a routine dental examination
(Riyanti, 2005). But not in line with the results of studies Tri Widyastuti (2010), because of
differences in the age range of study subjects were selected. The study subjects aged 8-14 years,
while the Tri Widyastuti study subjects aged 3-5 years.
Effect of child's diet on the incidence of dental caries in M1
Frequently consuming foods and sugary drinks, fruits are not fresh, the addition of sugar to
the liquid or food are the factors that affect the high incidence of caries in children (Nishimura.et.al,
2012; Anggraeni.dkk, 2010). Diet associated with the frequency or how often the consumption of
food and beverages (Hooley.et.al, 2012; Burt & Pai, 2001).
The results showed that children who rarely consume non-cariogenic drinks 2.2 times higher
risk of dental caries incidence in M1. This is consistent with the theory that too often cariogenic
beverage consumption being offset many non-cariogenic beverage consumption, does not allow
remineralization of tooth enamel to make it perfectly (Nishimura.et.al, 2012).
The results of this study are consistent with the results of the study Made et.al (2010).
Multivariate analysis showed that children rarely non-cariogenic beverage consumption was 2.6
times higher risk of dental caries incidence on M1. This is consistent with the theory that too often
consume beverages cariogenic (sweet or sugary liquids), the longer will be in contact with the tooth
enamel (Kidd & Fejerskov, 2004). This is not in line with the results of the study Noviani (2010) and
Lili (2005), because the research focused on Noviani and Lili cariogenic food consumption habits,
without regard to the consumption of food or drink non-cariogenic.
Public Health Department, Faculty of Sports Science, F1 Building, 2nd
Floor, Sekaran Campus Gunungpati, Semarang City, Central Java Province, Indonesia, 50229 Phone/ Fax. +6224 8508007
37
Effect of pH of saliva on the incidence of dental caries in M1
Saliva is the primary host defense system against caries. Saliva acts as a self-cleansing and
buffers. The ability of saliva as a buffer also related to the viscosity and volume of saliva (Fejerskov
& Kidd, 2003; McLtire, 2005). Saliva plays a role in the development and maturation of the email as
well as help the enamel remineralization process that has been demineralized (Kidd & Fejerskov,
2004; Fejerskov, 2004).
The results showed that the pH of saliva is not a risk factor for the incidence of dental caries
in M1. The results of this study are consistent with research Ekky (2012).
The effect of composition on the incidence of dental caries in M1
Arrangement of teeth or crowding crowding and uneven, it will be difficult cleansing naturally,
also mechanically. The result is a buildup of dental plaque accumulation. Such conditions can
cause caries (Fejerskov & Kidd, 2003; McLtire, 2005; Noviani, 2010).
The results showed that the arrangement of the teeth is not a risk factor for the incidence of
dental caries in M1. Because of the arrangement of the teeth berjejalnya child is not too severe
and occurs because the subject is in a mixed dentition period. The results of this study are not in
line with the research Buczkowska (2012), due to the age range of the study subjects 8-12 years,
while the age range of study subjects aged 15-19 years Buczkowska. This is supported by
research Hafez et.al (2013).
Effect of dental plaque on the incidence of dental caries in M1
Plaque is a layer of semitransparent polysaccharide firmly attached to the tooth surface and
contains many microbial pathogens. Plaques formed on all the teeth every day because of the
intake of food. There are a lot of cariogenic bacteria that live in plaque, which could potentially
trigger a process of demineralization on teeth to cavities formed (Fejerskov & Kidd, 2003; McLtire,
2005; Kidd & Fejerskov, 2004).
The results showed that poor dental plaque scores (> 20%) had a 10.6 times greater risk of
the incidence of dental caries in M1, compared to dental plaque scores were good (<20.1%).
Results of multivariate analysis, poor dental plaque scores assessed 9.6 times higher risk of dental
caries incidence in M1.
The results of this study are consistent with research Wang.et.al (2012) and Quroti et.al
(2000). Poor dental plaque scores relate to how to brush your child's teeth and diet of children.
Recall bias is limited by providing clues that may help memory of the subject, so it is
expected that the information given is almost close to the truth. Bias information is limited by
always reminding the subject that the grains questions must be filled in accordance with the daily
habit. Besides informing that the assessment questionnaire is not a test that assessed right or
wrong. Selection bias by restricting the subjects aged between 8-14 years, so the results of this
study can provide a general description of the risk of dental caries experience on the M1 in the
group of children aged 8-14 years.
38
Public Health Department, Faculty of Sports Science, F1 Building, 2nd
Floor, Sekaran Campus Gunungpati, Semarang City, Central Java Province, Indonesia, 50229 Phone/ Fax. +6224 8508007
O'Leary index usage in this study has a limitation only detect plaque on the tooth surface.
The surplus can determine the accumulation of dental plaque on all tooth surfaces.
Closing
Based on the results of the analysis menunujukan that poor dental plaque scores, how to
brush your child's teeth are bad, and non-cariogenic drinking patterns are rarely a risk factor that
plays an important role on the incidence of dental caries in M1. Advice:
City Health Department Kendal: (1) Improving guidance and supervision of the child dental
health programs, (2) Supervise children's dental health programs in environmental health centers,
clinics and private practices, (3) In collaboration with education authorities to build the School
Dental Health Unit (UKGS).
Health centers in the region Kaliwungu: (1) Improve outreach to the community (parents,
elementary school children) about dental health, (2) Improving education about how to brush teeth
properly to parents and elementary school children, (3) Perform routine checks once a month to
SD.
People Kaliwungu region, especially the parents: (1) Increase knowledge about dental health,
(2) Increase knowledge about the correct way of brushing teeth, (3) Supervise their children in the
practice of dental hygien, (4) Adjusting the diet of children with either.
Reference
Al-Samadani KHM, Ahmad SM. 2012. Prevalence of First Permanent Molar Caries in and Its Relationship to the Dental Knowledge of 9–12-Year Olds from Jeddah, Kingdomof Saudi Arabia. ISRN Dentistry. Article ID 391068. 6 pages doi:10.5402/2012/391068.
Anggraeni A, Soelarso H, Martin L. 2010. Peran Orang tua / Pengasuh terhadap Prevalensi Karies Molar Pertama Rahang Bawah Permanen pada Anak - Anak Retardasi Mental. Dental Public
Heatlh Journal. Volume 2. No 2. hlm. 1‐4.
Anusavice J.K. 2005. Present and Future Approaches for The Control of Caries. Journal of Dental Education. Volume 69. No. 5. hlm. 538-554.
Angela A. 2005. Pencegahan Primer Pada Anak Beresiko Karies Tinggi. Majalah Kedokteran Gigi.
Dent. J. Volume Volume 38. No 3. hlm. 130–133. Andini A. Pentingnya Pemeriksaan Dini Gigi Dan Mulut Anak. 2007. diakses Maret 2013.
(http://www.permata cibubur.com/en/see.php?id=pro45&lang=id) Armenian HK. 2009. The Case-Control Method, Design and Applications. Oxford University Press
Inc. Buczkowska J, Szyszka L, Wozniak K. 2012. Anterior Tooth Crowding and Prevalence of Dental
Caries in Children in Szczecin, Poland. Dental Health. Volume 29. No 2. hlm. 1. Bedos C, Brodeur JM, Arpin S, Nicolau B. 2007. Edentulous Motherhood Is Associated with Child
Caries. J Evid Base Dent Pract. Volume 7. hlm. 27-28. Burt BA, Pai S. 2001. Sugar Consumption and Caries Risk : A Systemic Review. Journal of Dental
Education. Volume 65. No. 10. Bloom, Benyamin S. 2003. Taxonomy of Educational Objective: Handbook Cognative Domain.
New York: Longman Budiharto. 2010. Pengantar Ilmu Perilaku Kesehatan dan Kendidikan Kesehatan gigi. Jakarta:
Penerbit Buku Kedokteran EGC. Budiarto E. 2002. Biostatistika untuk Kedokteran dan Kesehatan Masyarakat. Jakarta: EGC. Caranza, Newman. 2002. Clinical Periodontolgy, 9th Edition. Saunders Company.
Public Health Department, Faculty of Sports Science, F1 Building, 2nd
Floor, Sekaran Campus Gunungpati, Semarang City, Central Java Province, Indonesia, 50229 Phone/ Fax. +6224 8508007
39
Cahyadi NS. Faktor-Faktor yang Berhubungan dengan Status Karies Gigi Anak Sekolah Dasar Kelas 6 di Kecamatan Tanjung Priok Jakarta Utara tahun 1997. Diakses Maret 2013.
(http://lontar.ui.ac.id/opac/themes/libri2/ detail.jsp?id=78111&lokasi=lokal) Caufield PW, Griffen AL. 2000. Dental caries: An infectious and Transmissible Disease. Pediatri
Clin North Am. Volume 47. hlm. 1001-1019. Castilho FRA. 2013. Influenced of Family Environment on Children’s Oral Health : Systemic
Review. J Pediatr (Rio J). Volume 89. No. 2. hlm. 116-123. Depkes RI. 2005. Survey Kesehatan Rumah Tangga 2004. Jakarta: DepKes Dinkes Kendal. 2010. Profil Kesehatan Kabupaten Kendal. Kendal: Dinkes Depkes RI. 2000. Pedoman Upaya Kesehatan Gigi dan Mulut Puskesmas. Jakarta: Direktorat
Kesehatan Gigi. Dian N. 2013. Hubungan Perilaku Pencegahan Karies Gigi dan Kejadian Karies Gigi pada Anak di
Dusun Sumberpanggang Desa Lopang Kecamatan Kembanghau Kabupaten Lamongan. Jurnal Kedokteran Gigi Universitas Indonesia. Volume XIV. No. 1. hlm. 51-56.
Ekky W. 2012. Pengaruh pH Saliva dan Kemampuan Buffer terhadap DMF-T dan def-t pada Anak Periode Gigi Bercampur Usia 6-12 Tahun. http://FKIKUMY.
Fejerskov O, Kidd EAM. 2003. Clinical Cariology and Operative Dentistry in the Twenty-First Century. In: Fejerskov O, Kidd E, editors. Dental Caries. The Disease and Its Clinical
Management. Denmark, Copenhagen. Blackwell Publishing Ltd. hlm. 179–188. Fejerskov O. 2004. Changing Paradigms in Concepts on Dental Caries: Consequences for Oral
Health Care. Caries Research.Volume 38. hlm.182–91. Featherstone JDB. 2004. The Continuum of Dental Caries-Evidence for a Dynamic Disease
Process. J Dent Res 83. Volume C. hlm. C39-C42. Green, L.W., and Hiatt, R.A. 2009. Behavioural Determinants of Health and Disease. In Detels, R.,
Beaglehole R, et.al (Eds). Oxford Textbook of Public Health. 5th edition. Oxford: Oxford University Press
Hooley M, et.al. 2012. Parental Influenced and The Development of Dental Caries in Children Aged 0-6 Years : A Systemic Review of the Literature. Journal of Dentistry. Volume 40. hlm. 873-885.
Hafez HS, Sharaway SM, Al-Sakiti AA, Mostafa YA. 2013. Dental Crowding as A Caries Risk Factor. USA:EDB. hlm. p.443-5.
Indriyanti R, Pertiwi ASP, Sasmita IS. 2006. Pola Erupsi Gigi Permanen Ditinjau dari Usia Kronologis Pada Anak Usia 6 Sampai 12 Tahun di Kabupaten Sumedang. FKG Universitas Padjadjaran.
Ji Ying, et.al. 2006. Risk Behaviors and its Association with Caries Activity and Dental Caries in Japanese Children. Pediatric Dental Journal. Volume 16. No. 1. hlm. 91-195.
Kleinbaum DG, Klein M. 2010. Logistic Regression, 3th ed. Spinger. hlm. 218-609. Kagihara LE, Niederhauser VP, Stark. 2009. Assessment, Management, and Prevention of Early
Childhood Caries. Journal of The American Academy of Nurse Practitioner. Volume 21. hlm. 1-10.
Kidd EAM, Fejerskov O. 2004 What Constitutes Dental Caries? Histopathology of Carious Enamel and Dentin Related to the Action of Cariogenic Biofilms. C35-C38.
Lilik H. 2005. Hubungan Karakteristik Keluarga dan Kebiasaan Konsumsi Makanan Kariogenik dengan Keparahan Karies Gigi Anak Sekolah Dasar. Tesis. Program Pascasarjana UNDIP.
Luca R, et.al. Pit and Fissure Caries in the First Permanent Molars of a Group of Romanian Schoolchildren. 6th Congress of the Balkan Stomatological Society, 3-6 May 2001, Bucharest.Abstract O191, 71.
Luca, et.al. Knowledge on the first permanent molar - audit on 215 Romanian mothers. European Journal of Paediatric Dentistry, 2000; 3:165. Abstract P70.
Li Y, Wang W. Predicting Caries in Permanent Teeth from Caries in Primary Teeth: an Eight-Year Cohort Study. J Dent Res, 2002; 81(8):561–6.
Laksmi W. Survey Konsumsi Gizi. FKM UNDIP, 2009:30-35. McLtire JM. Dental Caries – The Major Cause of Tooth Damages. Pada Hume WR, Mount J.
Preservation and Restoration of Tooth Structure. 2end ed. Queensland : Knowledge Books & Software, 2005 : 21-33.
Melvin CS. A Collaborative Community-Based Oral Care Program For School-Age Children. Clinical Nurse Specialist, 2006; 20:18-22.
40
Public Health Department, Faculty of Sports Science, F1 Building, 2nd
Floor, Sekaran Campus Gunungpati, Semarang City, Central Java Province, Indonesia, 50229 Phone/ Fax. +6224 8508007
Mannaa A, Carlen A, Lingstrom P. Dental Caries and Associated Factors in Mothers and Their Preschool and School Children – A Cross-Sectional Study. Journal of Dental Sciences, 2013; 8:101-108.
Made AB, Oktarina, Muhamad AM. Hubungan Pola Makan dan Kebiasaan Menyikat Gigi dengan Kesehatan Gigi dan Mulut (Karies) di Indonesia. Buletin Penelitian Sistem Kesehatan, 2010; 13(1):83-91.
Noronha JC, et.al. First Permanent Molar: First Indicator of Dental Caries Activity in Initial Mixed Dentition. Braz Dent J, 1999; 10 (2): 99-104, ISSN 0103-6440.
Nishimura M, et.al. Influences of Diet on Caries Activities and Caries-Risk Grouping in Children, and Changes in Parenting Behavior. Pediatric Dental Journal, 2012; 22 (2):117-124.
Noviani N. Faktor-Faktor yang Berhubungan dengan Status Karies Gigi (DMFT) Santri Pesantren Al Ashriyyah Nurul Iman Parung Bogor. FKM UI, 2010:Tesis.
Peter FF, Arthur RV, John LG. The Periodontic Syllabus. Ed.4. 2005 : 73-83. Pratiwi NL, Basuki H, Soeprapto A. Pengaruh Akses Pelayanan Kesehatan, Performed Treament
Index/Pti Requirement Treatment Index/Rti, Terhadap Perilaku Oral Hygiene. Buletin Penelitian Sistem Kesehatan, 2010; 13(2): 169–180.
Pakpahan O. Hubungan Waktu Sikat Gigi dengan Tingkat Keparahan Karies Murid Sekolah Dasar di Kecamatan Tanah Abang Jakarta Pusat Tahun 2002. Universitas Indonesia : Disertasi.
Quroti A, Julita H, Al.Supartinah S, Lukito EN. Prediction About The Incidence of Caries Based on Children‘s Behaviour, Parents and Environment. Proceeding of International Symposium on Oral and Dental Sciences, 2013 : 149-155.
Riset Kesehatan Dasar (RISKESDAS). Badan Penelitian dan Pengembangan Kesehatan Departemen Kesehatan, Republik Indonesia. Desember 2007.
Riset Kesehatan Dasar Jawa Tengah (RISKESDAS Jateng). 2007. Reisine TS, Psoter W. Sosioeconomic Status and Selected Behavioral Determinants as Risk
Factors for Dental Caries. Journal of Dental Education, 2001; 65(10) : 1009-1016. Riyanti E, dkk. Hubungan Pendidikan Penyikatan Gigi Dengan Tingkat Kebersihan Gigi Dan Mulut
Siswa-Siswi Sekolah Dasar Islam Terpadu (SDIT) Imam Bukhari. 2005. Seminar Sehari Kesehatan Psikologi Anak. 2006.
Riyanti E. Pengenalan Dan Perawatan Kesehatan Gigi Anak Sejak Dini. Seminar Sehari Kesehatan Psikologi Anak. 2005.
Rossana V. Validation of Food Frequency Quetionare to Assess the Consumption Among Adolescents the Method of Triads. Rio de Janeiro, 2010; 26(11):2090-2100.
Selwitz RH, et.al. 2007. Dental Caries. Lancet. Volume 369. hlm. 51-59. Scottish Intercollegiate Guidelines Network. SIGN Guideline. 2000. Preventing dental caries in
children at high caries risk; targeted prevention of dental caries in the permanent teeth of 6–16 years olds presenting for dental care. Edinburgh: SIGN Publication
Smith AG, Riedford K. 2013. Epidemiology of Early Childhood Caries : Clinical Application. Journal of Pediatric Nursing. Volume 28. hlm. 369-373.
Scheid RC. 2002. Dental Anatomy: Its Relevance to Dentistry. 6th ed. Baltimore: Lippincott Williams & Wilkins.
Tinanoff N, Reisine S. 2009. Update on Early Childhood Caries Since The Surgeon General’s report. Academic Pediatrics. Volume 9. hlm. 396-403.
Tang Ru-Shing, et.al. 2013. The Association between Oral Hygiene Behavior and Knowledge of Caregivers of Children with Severe Early Childhood Caries. Journal of Dental Science. Volume XX. hlm.1-6.
Tin Oo, et.al. 2011. Dental Caries Experience and Treatment Needs in the Mixed Dentition in North East Malaysia. Arch Orofac Sci. Volume 6. No. 2. hlm. 1-8.
Tri W. 2010. Kejadian Karies Aktif pada Anak Usia 3-5 Tahun yang Tercatat Di Posyandu Wilayah Kerja Puspkesmas Mohamad Ramdan Kota Bandung Tahun 2010 dan Faktor yang Mempengaruhinya. Tesis. Universitas Indonesia
Tince AJ. 2010. Pengaruh Kebiasaan Menyikat Gigi terhadap Status Pengalaman Karies. Tesis. FKM UI
Wang, et.al. 2012. Dental Caries and First Permanent Molar Pit and Fissure Morphology in 7- to 8-Year-Old Children in Wuhan, China. International Journal of Oral Science. Volume 4. hlm.
157–160.
Public Health Department, Faculty of Sports Science, F1 Building, 2nd
Floor, Sekaran Campus Gunungpati, Semarang City, Central Java Province, Indonesia, 50229 Phone/ Fax. +6224 8508007
41
ASSOCIATION BETWEEN DAILY STEPS AND CARDIOMETABOLIC RISK FACTORS IN UNIVERSITY EMPLOYEES
Masitah Abdullah1, Nur Zakiah Mohd Saat1, Nor Farah Muhamad Fauzi1
1University Kebangsaan, Malaysia
Corresponding Author : [email protected]
Abstract
Introduction: Walking is the simplest form of physical activity in the prevention of cardiometabolic disease. The aim of this study was to investigate the association between walking and cardiovascular risk factors in a working adult population. Walking activity was assessed using a pedometer worn over three consecutive days. Anthropometric measurements of height, weight, waist circumference, blood pressure, as well as blood glucose and lipid profile were also determined. Methods: In this cross-sectional study, 123 employees aged 20-65 years include males (35%) and
females (65%) of university employees were recruited. Participants recorded an average of 7521 ± 3723 steps per day, which is below the recommended target of 10,000 steps per day. Average of waist circumference for males (92.42 ± 10.67) and females (82.84 ± 10.55) is higher than normal. Systolic blood pressure (121 ± 15.2 mmHg) was in a normal level. Results: Body mass index (BMI) have a significant differences between employees. Glucose, systolic and diastolic blood pressure have a significance difference between group of ages (p<0.05). In conclusion, walking activity level of the university employees is categorised as ‗moderate active‘. Key Words: Walking, steps per day, pedometer, cardiovascular risk factors
Introduction
Cardiovascular disease is the leading cause of mortality for non-communicable disease
worldwide (WHO, 2012). The disease caused 30% of death in 2008 which is the total of 17.3
million people worldwide (WHO 2011). Individual death in 2030 is expected to be increase to about
23.3 million due to cardiovascular disease (Mathers & Loncar 2006; WHO, 2011). In Malaysia,
32% of death is caused by cardiovascular disease (WHO, 2011).
According to the latest National Health and Morbidity Survey (NHMS) 2011, the prevalence
of diabetes was 15.2% (IPH, 2011). While, NHMS III reported people with obesity is 17.4% (IPH,
2008). These cardiometabolic disease contribute to cardiovascular risk factors and measured with
body mass index (BMI), waist circumference, blood pressure, blood glucose and lipid profile
(Paniagua et.al. 2008; NCEP 2001; Vazquez et.al. 2007).
Physical activity is defined as the body movement which produce by contraction of skeletal
muscle that increase the energy expenditure (CDC & Prevention 1996). According to the report
from Malaysian Adult Nutritional Survey (MANS) only 14% of adults performed enough physical
activity and 74% of majority the Malaysian adults allocate most of their daily time being sedentary
(Poh et.al. 2010). Previous studies indicated that walking is encouraged for people to increase their
physical activity and improve health (Tudor-Locke et.al., 2011). Number of steps per day can be
42
Public Health Department, Faculty of Sports Science, F1 Building, 2nd
Floor, Sekaran Campus Gunungpati, Semarang City, Central Java Province, Indonesia, 50229 Phone/ Fax. +6224 8508007
accumulated by doing household chores and works in office (Tudor-Locke et.al., 2011). Steps per
day can be assessed using a device called pedometer and classified into physical activity category
(Tudor-Locke & Bassett, 2004). The category showed the cut-points for healthy adults, <5,000
steps per day is sedentary, 5,000 to 7,499 steps per day is low active, 7,500 to 9,999 steps per day
is somewhat active, 10,000 to 12,499 steps per day is active and ≥12,500 steps per day is highly
active. However, Tudor-Locke & Bassett (2004) suggested 10,000 steps per day is the target value
for healthy adults.
Studies have found that increased walking have strong evidence for lowering the risk of
cardiovascular disease (Bertoni et.al. 2009; Boone-Heinonen et.al., 2009). A study showed there
was a significant correlation between steps per day with BMI (Krumm et.al. 2006). While, increase
of steps per day caused decrease size in waist circumference (Dwyer et.al. 2007). Furthermore,
increase of steps per day can lower the systolic blood pressure (Bravata et.al. 2007).
This study was conducted to assess the association between the number of steps per day
with cardiometabaolic risk factors in university employees.
Methods
This cross sectional study was conducted in Universiti Kuala Lumpur . A total number of
120 employees were recruited, age of 20 to 65 years old. Subject included was in a healthy
physical condition and able to walk without effects of a disease. A pregnant women and person
who were unable to walk were excluded.
This study included a questionnaire, measurement of blood pressure, anthropometric
measures and analyses of fasting blood glucose and lipid profile. Anthropometric measurements
included height, weight and waist circumference. Height and weight were measured using SECA
Digital Column Scale and body mass index (BMI) was calculated. Meanwhile, waist circumference
was measured between iliac crest and lower ribs using two meter long of Lufkin tape (Ness-
Abramorf & Apovian, 2008).
Each subject was given a pedometer, model Yamax Digi-Walker SW200 to measure their
steps within three consecutive days (Tudor-Locke et al, 2008). The accuracy and validity of
pedometer was approved and the assessment of physical activity has also been studied (Pavlidou
et.al. 2011). Subjects wore the pedometers during waking hours and only removed them when
going to bed. Each subject have to record their time wearing this device in the morning and
recorded time of removal at night within three days.
Fasting blood sample were drawn in the morning to determine serum glucose, total
cholesterol, triglycerides and high density lipoprotein (HDL) cholesterol. These clinical blood
measures were assessed using model BTS-350 BioSystems Semiautomatic Analyzer. Friedewald
formula of LDL cholesterol was applied to estimate the level of LDL cholesterol from the measures
of total cholesterol minus HDL cholesterol and minus triglycerides divide by 2.17 (Bachorik et.al.,
Public Health Department, Faculty of Sports Science, F1 Building, 2nd
Floor, Sekaran Campus Gunungpati, Semarang City, Central Java Province, Indonesia, 50229 Phone/ Fax. +6224 8508007
43
2001). This study was approved by the Research Ethics Committee of Universiti Kebangsaan
Malaysia.
Results and discussion
According to the sociodemographic data on Table 1 showed 123 employees involve were
academician (29%) and non-academician (71%). The distribution according to races Malay which
was 97% and others subjects which was 3%.
Table 2 showed the average of anthropometric, blood pressure, blood glucose and lipid
profile measures.. The mean age of adult subjects was 39.94 ± 9.46 years old. They recorded an
average of 7521 ± 3707 steps per day which was lower than the target of 10,000 steps per day
(Tudor-Locke & Bassett 2004). All the parameters were normal except for BMI (26.17 ± 4.64
kg/m2) and waist circumference of male(92.42±10.67 ) and female (82.84 ± 10.55 mmol/L).
According to the table 3, the majority of employees (33%) were in the category of low active
based on pedometer-determined physical activity. The category followed by moderate active (26%)
and sedentary (24%). While, 4% of employees were in very active category and 13% of employees
were in active category.
Table 4 showed that male , non-academician, age above 50 has higher number of steps
per day. However there was no significance mean difference of steps per day between gender,
employment, group of age and transportation among subjects(p<0.05). According to table 5 there
was positive and significance correlation between Steps per day and TG. Meanwhile the WC,
systolic blood pressure , diastolic blood pressure and glucose showed positive correlation with age.
This means as the age increase all these variable also increasing significantly(p<0.05).
In this study, 10,000 steps per day is the target for healthy adults (Tudor-Locke & Bassett,
2004). However, results of the average of steps per day only achieve below than target value
which is in moderate active category. Majority of the employees have low active physical activity
according to the steps per day measured by pedometer. However, few employees were very
active. Reason for low active person was caused by working environment which take a longer time
to sit and doing work related on a computer (Ryan et.al,. 2011). Other studies indicate those who
are working in low physical activity environment such as in office will contribute a sedentary
lifestyle (Parry & Straker, 2013). This is also caused by the advance of technology such as the
usage of computers and low expose to physical activity (Matthews et.al. 2008; Owen et.al., 2011).
In this study indicated that male have higher steps per day compared to female. This study
is parallel with other study which showed that male have higher steps per day compared to female
(Bennett et.al. 2006). Meanwhile, Ryan et.al. (2011), noted that person who works in office
environment have a longer period of sit and cause lower in their steps per day. This study also
have almost similar finding with the previous study by Tudor-Locke et.al.(2011) which found that
adult age 20 to 65 years old have approximately 7,000 steps per day (Tudor-Locke et.al. 2011).
The increasing steps per day may increase the level of triglycerides in this study. However,
in Thompson et.al. (2012) the level of triglycerides decrease when steps per day is increase. In this
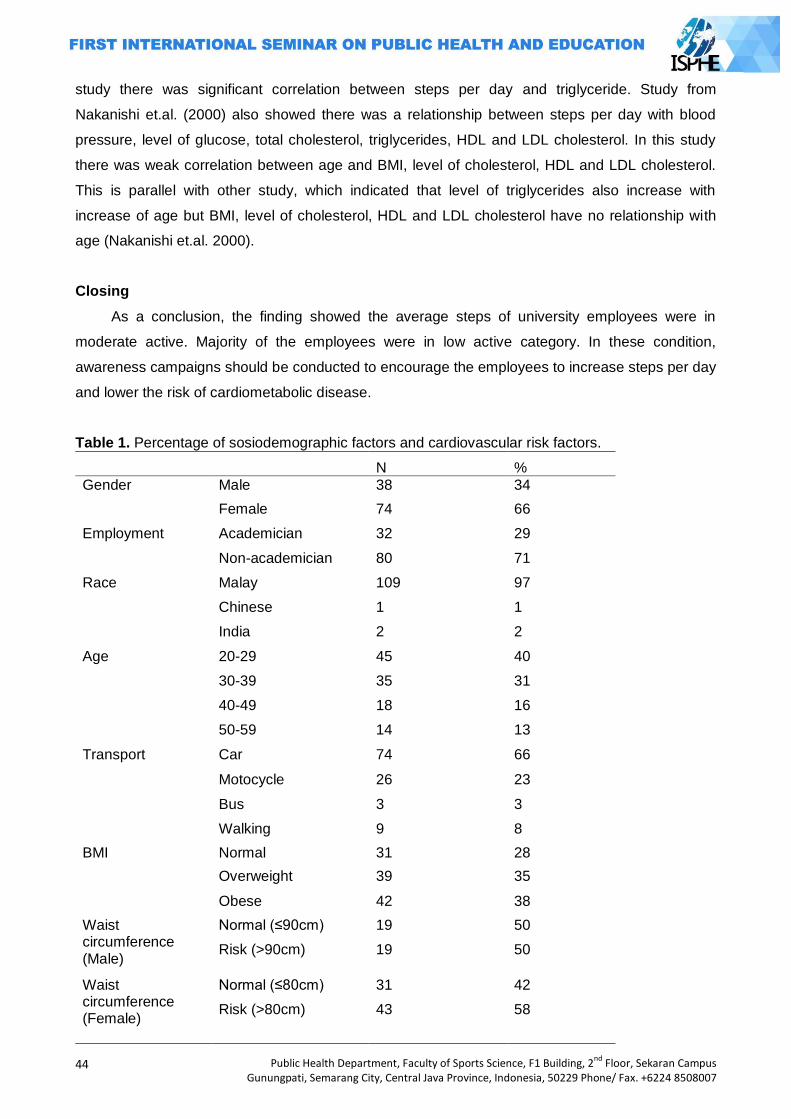
44
Public Health Department, Faculty of Sports Science, F1 Building, 2nd
Floor, Sekaran Campus Gunungpati, Semarang City, Central Java Province, Indonesia, 50229 Phone/ Fax. +6224 8508007
study there was significant correlation between steps per day and triglyceride. Study from
Nakanishi et.al. (2000) also showed there was a relationship between steps per day with blood
pressure, level of glucose, total cholesterol, triglycerides, HDL and LDL cholesterol. In this study
there was weak correlation between age and BMI, level of cholesterol, HDL and LDL cholesterol.
This is parallel with other study, which indicated that level of triglycerides also increase with
increase of age but BMI, level of cholesterol, HDL and LDL cholesterol have no relationship with
age (Nakanishi et.al. 2000).
Closing
As a conclusion, the finding showed the average steps of university employees were in
moderate active. Majority of the employees were in low active category. In these condition,
awareness campaigns should be conducted to encourage the employees to increase steps per day
and lower the risk of cardiometabolic disease.
Table 1. Percentage of sosiodemographic factors and cardiovascular risk factors.
N %
Gender Male 38 34
Female 74 66
Employment Academician 32 29
Non-academician 80 71
Race Malay 109 97
Chinese 1 1
India 2 2
Age 20-29 45 40
30-39 35 31
40-49 18 16
50-59 14 13
Transport Car 74 66
Motocycle 26 23
Bus 3 3
Walking 9 8
BMI Normal 31 28
Overweight 39 35
Obese 42 38
Waist circumference (Male)
Normal (≤90cm) 19 50
Risk (>90cm) 19 50
Waist circumference (Female)
Normal (≤80cm) 31 42
Risk (>80cm) 43 58
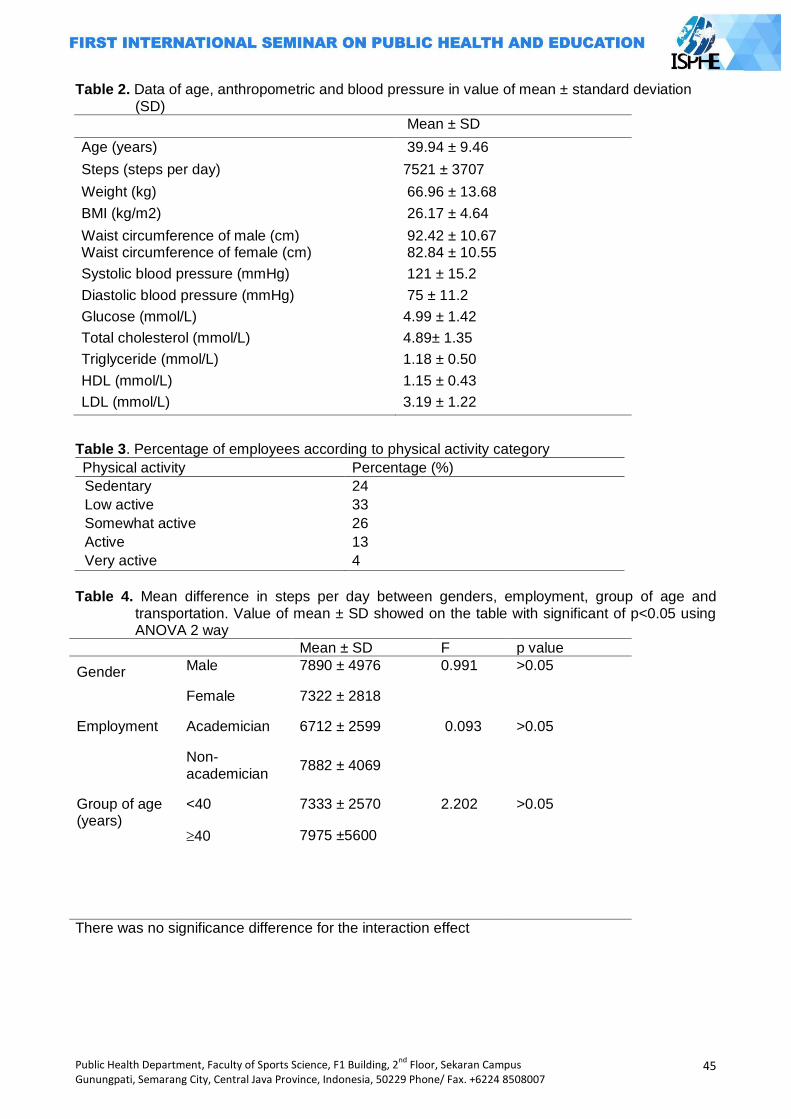
Public Health Department, Faculty of Sports Science, F1 Building, 2nd
Floor, Sekaran Campus Gunungpati, Semarang City, Central Java Province, Indonesia, 50229 Phone/ Fax. +6224 8508007
45
Table 2. Data of age, anthropometric and blood pressure in value of mean ± standard deviation (SD)
Mean ± SD
Age (years) 39.94 ± 9.46
Steps (steps per day) 7521 ± 3707
Weight (kg) 66.96 ± 13.68
BMI (kg/m2) 26.17 ± 4.64
Waist circumference of male (cm) 92.42 ± 10.67 Waist circumference of female (cm) 82.84 ± 10.55
Systolic blood pressure (mmHg) 121 ± 15.2
Diastolic blood pressure (mmHg) 75 ± 11.2
Glucose (mmol/L) 4.99 ± 1.42
Total cholesterol (mmol/L) 4.89± 1.35
Triglyceride (mmol/L) 1.18 ± 0.50
HDL (mmol/L) 1.15 ± 0.43
LDL (mmol/L) 3.19 ± 1.22
Table 3. Percentage of employees according to physical activity category
Physical activity Percentage (%)
Sedentary 24
Low active 33
Somewhat active 26
Active 13
Very active 4
Table 4. Mean difference in steps per day between genders, employment, group of age and
transportation. Value of mean ± SD showed on the table with significant of p<0.05 using ANOVA 2 way
Mean ± SD F p value
Gender Male 7890 ± 4976 0.991 >0.05
Female 7322 ± 2818
Employment Academician 6712 ± 2599 0.093 >0.05
Non-academician
7882 ± 4069
Group of age (years)
<40 7333 ± 2570 2.202 >0.05
40 7975 ±5600
There was no significance difference for the interaction effect
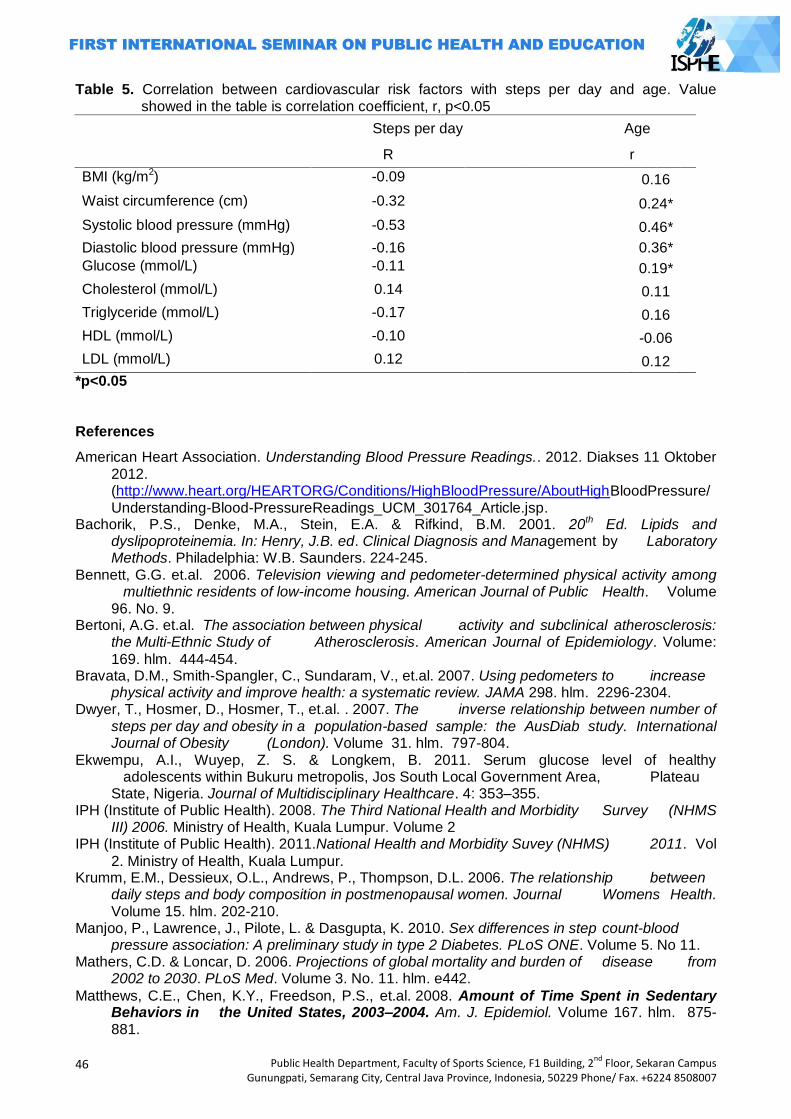
46
Public Health Department, Faculty of Sports Science, F1 Building, 2nd
Floor, Sekaran Campus Gunungpati, Semarang City, Central Java Province, Indonesia, 50229 Phone/ Fax. +6224 8508007
Table 5. Correlation between cardiovascular risk factors with steps per day and age. Value showed in the table is correlation coefficient, r, p<0.05
Steps per day Age
R
r
BMI (kg/m2) -0.09 0.16
Waist circumference (cm) -0.32 0.24*
Systolic blood pressure (mmHg) -0.53 0.46*
Diastolic blood pressure (mmHg) -0.16 0.36*
Glucose (mmol/L) -0.11 0.19*
Cholesterol (mmol/L) 0.14 0.11
Triglyceride (mmol/L) -0.17 0.16
HDL (mmol/L) -0.10 -0.06
LDL (mmol/L) 0.12 0.12
*p<0.05
References
American Heart Association. Understanding Blood Pressure Readings.. 2012. Diakses 11 Oktober 2012. (http://www.heart.org/HEARTORG/Conditions/HighBloodPressure/AboutHighBloodPressure/Understanding-Blood-PressureReadings_UCM_301764_Article.jsp.
Bachorik, P.S., Denke, M.A., Stein, E.A. & Rifkind, B.M. 2001. 20th Ed. Lipids and dyslipoproteinemia. In: Henry, J.B. ed. Clinical Diagnosis and Management by Laboratory Methods. Philadelphia: W.B. Saunders. 224-245.
Bennett, G.G. et.al. 2006. Television viewing and pedometer-determined physical activity among multiethnic residents of low-income housing. American Journal of Public Health. Volume 96. No. 9.
Bertoni, A.G. et.al. The association between physical activity and subclinical atherosclerosis: the Multi-Ethnic Study of Atherosclerosis. American Journal of Epidemiology. Volume:
169. hlm. 444-454. Bravata, D.M., Smith-Spangler, C., Sundaram, V., et.al. 2007. Using pedometers to increase
physical activity and improve health: a systematic review. JAMA 298. hlm. 2296-2304. Dwyer, T., Hosmer, D., Hosmer, T., et.al. . 2007. The inverse relationship between number of
steps per day and obesity in a population-based sample: the AusDiab study. International Journal of Obesity (London). Volume 31. hlm. 797-804.
Ekwempu, A.I., Wuyep, Z. S. & Longkem, B. 2011. Serum glucose level of healthy adolescents within Bukuru metropolis, Jos South Local Government Area, Plateau State, Nigeria. Journal of Multidisciplinary Healthcare. 4: 353–355.
IPH (Institute of Public Health). 2008. The Third National Health and Morbidity Survey (NHMS III) 2006. Ministry of Health, Kuala Lumpur. Volume 2
IPH (Institute of Public Health). 2011.National Health and Morbidity Suvey (NHMS) 2011. Vol
2. Ministry of Health, Kuala Lumpur. Krumm, E.M., Dessieux, O.L., Andrews, P., Thompson, D.L. 2006. The relationship between
daily steps and body composition in postmenopausal women. Journal Womens Health. Volume 15. hlm. 202-210.
Manjoo, P., Lawrence, J., Pilote, L. & Dasgupta, K. 2010. Sex differences in step count-blood pressure association: A preliminary study in type 2 Diabetes. PLoS ONE. Volume 5. No 11.
Mathers, C.D. & Loncar, D. 2006. Projections of global mortality and burden of disease from 2002 to 2030. PLoS Med. Volume 3. No. 11. hlm. e442.
Matthews, C.E., Chen, K.Y., Freedson, P.S., et.al. 2008. Amount of Time Spent in Sedentary Behaviors in the United States, 2003–2004. Am. J. Epidemiol. Volume 167. hlm. 875-881.
Public Health Department, Faculty of Sports Science, F1 Building, 2nd
Floor, Sekaran Campus Gunungpati, Semarang City, Central Java Province, Indonesia, 50229 Phone/ Fax. +6224 8508007
47
Nakanishi, N., Nakamura, K., et.al. 2000. Asssociation of body mass index and percentage of body fat by bioelectrical impedance analysis with cardiovascular risk factor in Japanese male workers. Industrial Health. Volume 38. hlm. 273-279.
Ness-Abramof, R. & Apovian, C.M. 2008. Waist Circumference Measurement in Clinical Practice. American Society for Parenteral and Enteral Nutrition. Volume 23. No 4. hlm. 397-404.
Owen, N., Sugiyama, T., et.al. 2011. Adults sedentary behaviour determinants and interventions. American Journal of Preventive Medicine. Volume 41. No. 2. hlm. 189-196.
Paniagua, L., Lohsoonthorn, V. 2008. Comparison of Waist Circumference, Body Mass Index, Percent Body Fat, and other Measure of Adiposity in Identifying Cardiovascular Disease Risks among Thai Adults. Obesity Research and Clinical Practice. Volume 2. No. 3. hlm.
215-223. Parry, S., Straker, L. 2013. The contribution of office work to sedentary behaviour
associated risk. BMC Public Health. 13:2906 (1471-2458). Pavlidou, S., Michalopoulou, M. et.al. 2011. Validation of a three-day physical activity record and
the SW200 pedometer in Greek children. Biology of Execise. Volume 7. No. 1. Poh, B.K., Safiah, M.Y., et.al. 2010. Physical activity pattern and energy expenditure of Malaysian
adults: Findings from the Malaysian Adult Nutrition Survey (MANS). Malaysia Journal of Nutrition. Volume 16. No 1. hlm. 13-37.
Ryan, C.G., Grant, M.P. et.al. 2011. Sitting patterns at work: objective measurement of adherence to current recommendations. Ergonomics. Volume 54. No. 6: hlm. 531-538.
Thompson, J.L., Landry, A.S. et.al. 2012. Several steps/day indicators predict changes in anthropometric outcomes: HUB City Steps. BMC Public Health. 12:983.
Tudor-Locke, C. & Bassett D.R. Jr. 2004. How many steps/day are enough? Preliminary pedometer indices for public health. Sports Medicine. Volume 34. No. 1. hlm. 1-8.
Tudor-Locke, C., Williams, J.E., Reis, J.P. & Pluto, D. 2004. Utility of pedometers for assessing physical activity: construct validity. Sports Medicine. 34:281-291.
Tudor-Locke, C. 2009. Promoting Lifestyle Physical Activity: Experiences With the First Steps Program. American Journal of Lifestyle Medicine. Volume 3. 50S-54S.
--------------------. 2010. Steps to better cardiovascular Health: How many steps does it take to achieve good health and how confident are we in this number? Curr Cardio Risk Rep 4: 271-
276. Tudor-Locke, C. & Myers, A.M. 2001. Challenges and opportunities for measuring physical
activity in sedentary adults. Sports and Medicine. Volume 31. No. 2. hlm. 91-100. Tudor-Locke, C., Bassett Jr, D.R. et.al. 2008. BMI-Referenced Cut Points for Pedometer-
Determined Steps per Day in Adults. Journal of Physical Activity Health 5(Suppl 1): S126-S139.
Tudor-Locke, C., Craig, C.L., et.al. 2011. How many steps/day are Enough? For Adults. International Journal of Behavioural Nutrition and Physical Activity. Volume 8. hlm. 79
Vazquez, G., Duval, S., Jacobs, D.R. Jr., Silventoinen, K. 2007. Comparison of Body Mass Index, Waist Circumference, and Waist/Hip Ratio in Predicting Incident Diabetes: A Meta-Analysis. Epidemiol Rev. Volume 29. hlm. 115–28.
WHO. 2012. Cardiovascular Disease. World Health Organization. WHO. 2011. Global status report on noncommunicable diseases 2010. Geneva, World Health
Organization. WHO. 2011. Global atlas on cardiovascular disease prevention and control. Geneva, World Health
Organization.
48
Public Health Department, Faculty of Sports Science, F1 Building, 2nd
Floor, Sekaran Campus Gunungpati, Semarang City, Central Java Province, Indonesia, 50229 Phone/ Fax. +6224 8508007
EFFECTIVITY OF DIARI CERIA TO IMPROVE PREVENTION BEHAVIOR OF GOUT ON UNNES EMPLOYEES
Dias Irawan Prasetya1, Arulita Ika Fibriana1
1Semarang State University, Indonesia
Corresponding Author: [email protected]
Abstract Introduction: Hyperuricemic is a major risk factor for gout, more than 90% of people with gout is hyperuricemic patients. The prevention of gout can be done with low-purine diet, drinking water consumption settings and activities. This study aims to determine the effectiveness of media (diary ceria (prevent hyperuricemic)), which contains guidelines for low purine diet, water consumption and increase behavioral activity in the prevention of gout employees of UNNES (Semarang State University) Methods: This research is a quasi-experimental research design with non-equivalent control group
design for 2 months. The study population was patients with hyperuricemic employees at Semarang State University. This study used a total sampling of employees which have hyperuricemic. The number of samples of the experimental group was 13 and the control group was 13. Data analysis was performed using univariate and bivariate (Mann Whitney test). Results: From this research, showed significance (posttest in the experimental group and the control was 0.015). Because the p-value (0.015) <0.05, then the provision of media diari ceria can improve behavior prevention of gout in patients with hyperuricemic. The use of diari ceria behavior positively related to an increase in gout disease prevention in patients with hyperuricemic UNNES employees. Key Words : Hyperuricemic, diari ceria, gout
Introduction
Health development in Indonesia today are faced with a double burden, on one hand,
infectious disease remains a public health problem because there are still many unresolved cases,
and on the other hand has been an increase in cases of non-communicable diseases, which is a
disease caused by lifestyle and degenerative process. Household Health Survey (HHS) 1980,
1986, 1995, and 2001, showed the trend of the proportion of causes of death have shifted from
infectious diseases to non-communicable diseases (Dept.Health of Indonesia, 2008: 1). One of the
non-communicable diseases are increasing the number of events is gout (gout) where the
increasing incidence of arthritis gout when uric acid levels increased or high (Dept.Health of
Indonesia, 2006: 54).
Gout is a process of inflammation / swelling that occurs due to deposition, the deposit / uric
acid crystals deposited in tissues around the joints or tophi is caused by too much or not normal
levels of uric acid in the body because the body can not secrete normal uric acid / balanced
(Misnadiarly, 2008: 57). The increase of the threshold of saturation of serum uric acid in body
fluids, causing monosodium urate crystals and stored in and around the joints, especially those
located in the peripheral synovial joints. Uric acid crystals are sharp, like needles contained in the
Public Health Department, Faculty of Sports Science, F1 Building, 2nd
Floor, Sekaran Campus Gunungpati, Semarang City, Central Java Province, Indonesia, 50229 Phone/ Fax. +6224 8508007
49
joint capsule, cartilage, ligaments and tendons. The most commonly affected areas are the first
metatarsophalangeal joint or referred to as the first book of the big toe (Dufton, 2011: 1).
Hyperuricemic is a state of elevated levels of uric acid in the blood above normal. In bio-
chemically test will make hipersaturation the solubility of uric acid in the serum that crossed the
threshold limit. Benchmark levels of uric acid> 7 mg / dL in men and> 6 mg / dL in women (Pratt,
Nata, 2013: 1; Saraswati, S, 2009: 11; Misnadiarly, 2007: 10). Hyperuricemic is a major risk factor
for gout, but some patients with normal serum uric acid can also get gout attack. More than 90% of
people with arthritis gout is hyperuricemic patients (Eggeben, 2007: 804). Aside from being a risk
factor for gout, hyperuricemic can increase the incidence of cardiovascular disease, kidney
damage, and even death (Chun, Wan, et al, 2012: 541).
The incidence of hyperuricemic each year has increased, according to data the incidence of
hyperuricemic in America and Asia, the prevalence in a large population study found cases of
hyperuricemic is 5% (Emerson BT, 1998: 519; Woong 2008: 109), in Taiwan the incidence of
hyperuricemic in surveys in 1993-1996 showed 22% of men and 23% of women experience
hyperuricemic (Ching, L, 2003: 690) and in Japan is estimated that 30% of adult men having
hyperuricemic (Hakoda, M, 2012: 319). High prevalence was also found in the Maori population,
which found the incidence of hyperuricemic was 27.1% in men and 26.6% in women (Finn R, et al
1966: 185), but there is no definitive data regarding the incidence of hyperuricemic in Indonesia,
the prevalence of hyperuricemic in Indonesia reached 2.6 to 47.2% estimated (Hospital Pantai
Indah Kapok, 2013: 1). The prevalence of hyperuricemic in adolescents in Tomohon was 25% and
18.2% in Denpasar (Manampiring 2011: 20; Vardhani, 2010: 23).
Semarang State University (UNNES) is one of the biggest state universities in Indonesia
which was established in 1965. It is the first university that declared itself as the Conservation
University in Indonesia. When it was first established in 1965, it was a Teacher Training College
(IKIP). It accommodated the need of teachers around Central Java and gave a great attention to
education. Then, by the Indonesian Presidential Decree No. 124 in 1999, IKIP Semarang was
converted to be Semarang State University. The incidence in UNNES, based on the results of tests
carried by UNNES Health Services Center at 166 employees (male employees 123 people and 43
women employees), found 18% of employees had hyperuricemic. The incidence of in the first rank
hyperuricemic compared to the incidence of other diseases, such as hypertension (11%) and
diabetes mellitus (4%) (Puslakes, 2013: 1).
Prevention of hyperuricemic can be done in various ways, both pharmacological and non-
pharmacological. Prevention and management of pharmacologic drug allopurinol could use to
maintain or reduce levels of uric acid in the blood plasma, while non-pharmacological able to limit
the consumption of foods high in purines, adequate water intake and maintain a normal weight.
Proper diet low in purines can produce benefits equivalent to drug therapy in patients with
hyperuricemic with a more affordable cost and without any side effects (Do, Maria, 2001: 472).
50
Public Health Department, Faculty of Sports Science, F1 Building, 2nd
Floor, Sekaran Campus Gunungpati, Semarang City, Central Java Province, Indonesia, 50229 Phone/ Fax. +6224 8508007
Certain steps that can be taken for prevention and treatment of this degenerative process is
to change people‘s behavior, especially in choosing daily meal. People's behavior can be changed
through the health education with nutrition education (Karyadi, 2006: 56). Nutrition education is an
attempt in the health sector to help individuals, groups or communities in improving the knowledge
and ability of the respondents toward the consumption of healthy and nutritious food which suits
the needs of the body (Widhayati, 2009: 48). Nutrition education is given to the patients with
hyperuricemia in order to develop knowledge about the disease and increase the awareness to
prevent and to treat the disease, especially in reducing the intake of purines.
Individual or family behavior toward a disease depends on their knowledge, attitudes, and
actions of the individual, if the individual's knowledge of the disease is not yet known, then
attitudes and actions in prevention efforts was sometimes neglected (Notoatmodjo, 2005: 46).
Knowledge is influenced by several factors: experience, education, verbal instructions and
acceptance of verbal information from the other party, occupation, age, information, and media.
Each of these factors did not stand alone it is often a combination of several factors. Information
that might affect the person's knowledge can be obtained from many ways such as print media and
electronic media.
Media was a tool used by educators in delivering educational materials or teaching. The
principle of making the media is that the existing knowledge on each person received or captured
through the five senses. According to the experts, the most sensuous channel knowledge is the
eye to the brain (approximately 75% - 87%), while 13% - 25% of human knowledge acquired or
distributed through other senses (Maulana, 2009: 172).
There is a significant effect of nutritional counseling using the module diet on uric acid
levels in patients with hyperuricemic in hospitals Noongan North Sumatra (Reppie, 2007: 1) and by
Budi (2013: 1), there are differences in the effects of low-purine diet information to the decrease of
blood uric acid levels in the elderly in the village Gedongan, Sukoharjo.
One way to provide information, monitory, and encourage gout employees to improve the
behavior against disease is to provide an abbreviated Diari ceria (cegah hiperurisemia) to Prevent
Hyperuricemic. This diari ceria (cegah hiperurisemia-prevent hyperuricemic) contains a discussion
of hyperuricemic, from the definition, causes, signs and symptoms, treatment and prevention, and
provide a low-purine diet schedule everyday, list the amount of water intake per day, schedule of
daily events, list of purine content of foods along with sample menus purine diet and how to
calculate the consumption of purine per day. So it is not just a module that is used only once and
after it is laid, this diari ceria (cegah hiperurisemia-prevent hyperuricemic) requires open and read
every day, because of the daily schedule sheets of low-purine diet, drinking water consumption
schedule and schedule of daily activities that must be filled, so that the patient will be remembered
and will be easier to memorize the contents of the diary in the form of guidelines for the prevention
of arthritis and gout they become a habit.
Public Health Department, Faculty of Sports Science, F1 Building, 2nd
Floor, Sekaran Campus Gunungpati, Semarang City, Central Java Province, Indonesia, 50229 Phone/ Fax. +6224 8508007
51
Research Objective: The aim of this study was to determine the effectiveness of the use of
diari ceria to improve behavior prevention of gout in patients with hyperuricemic UNNES
employees.
Methods
This method used in this study was a quasi-experimental research design using the design
of Nonequivalent control group design. Sample of the study were employees of the State
University of Semarang which consist of 32 people suffering from hyperuricemic. Sampling
technique used in the research was the total sampling with inclusion and exclusion criteria. The
inclusion criteria as follows: (1) Sample is hiperuricemic patient; (2) The sample has never
experienced an attack or suffering from gout; (3) The minimum degree of education was equal to
high school / vocational highschool; (4) Having a middle and upper income levels (> Rp.
1,500,000.00); (5) Willing to follow the research and assistance for 2 months. Exclusion criteria as
follow samples were subjected to attack or suffer from gout
Time of the observation and assistance is 2 months with 1 office visits and 1 weekly home
visits either the experimental group or the control group.
Tabel 1. Differences way of intervention given to experiment and control group
Experiment Control
1. Pretest with filling the behavior observation sheet about gout prevention by charging sheet
1. Pretest with filling the behavior observation sheet about gout prevention by charging sheet
2. General description of the condition of hyperuricemic and gout
2. General description of the condition of hyperuricemic and gout
3. Explanation of gout prevention attempt
3. Explanation of gout prevention attempt
4. diari ceria give away 4. Leaflet give away
5. Posttest and follow-up plan (family assistance
5. Posttest and follow-up plan (family assistance
The instrument used in this study was the Diari ceria (prevent hyperuricemic) containing
daily purine diet sheets, drinking water consumption, and activities, as well as the observation
sheet which contains multiple gout disease prevention behaviors components. The data was
analyzed using the Mann Whitney.
Results and Discussion
There were 32 people included but based on the inclusion and exclusion criteria, 26 people
qualified. Of these, 13 people received intervention for experiment group and 13 people for control
group.
Characteristics of the sample were viewed based on gender, age, qualification,
employment, and income. The age distribution of sample was devided into 5 categories, i.e. 17-25,
26-35, 36-45, 46-55, and 56-65 years. The qualification was devided into 4 categories, i.e. high
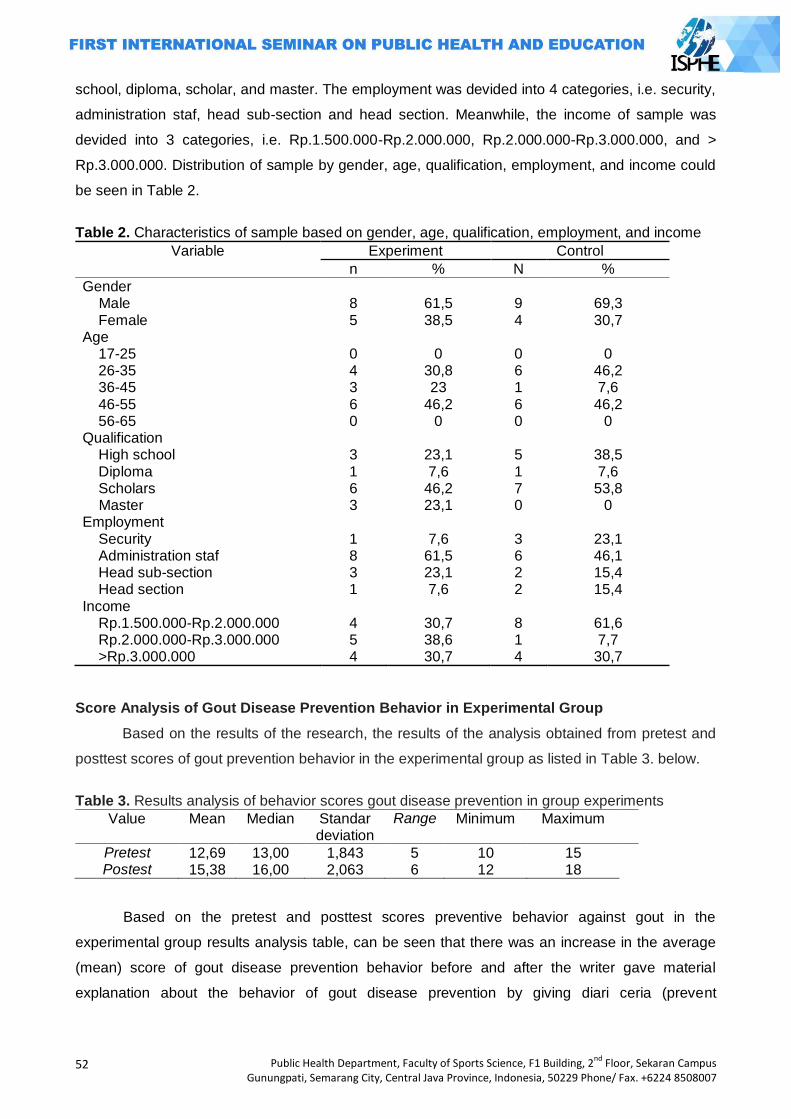
52
Public Health Department, Faculty of Sports Science, F1 Building, 2nd
Floor, Sekaran Campus Gunungpati, Semarang City, Central Java Province, Indonesia, 50229 Phone/ Fax. +6224 8508007
school, diploma, scholar, and master. The employment was devided into 4 categories, i.e. security,
administration staf, head sub-section and head section. Meanwhile, the income of sample was
devided into 3 categories, i.e. Rp.1.500.000-Rp.2.000.000, Rp.2.000.000-Rp.3.000.000, and >
Rp.3.000.000. Distribution of sample by gender, age, qualification, employment, and income could
be seen in Table 2.
Table 2. Characteristics of sample based on gender, age, qualification, employment, and income
Variable Experiment Control
n % N %
Gender Male Female
8 5
61,5 38,5
9 4
69,3 30,7
Age 17-25 26-35 36-45 46-55 56-65
0 4 3 6 0
0
30,8 23
46,2 0
0 6 1 6 0
0
46,2 7,6 46,2
0 Qualification High school Diploma Scholars Master
3 1 6 3
23,1 7,6
46,2 23,1
5 1 7 0
38,5 7,6 53,8
0 Employment Security Administration staf Head sub-section Head section
1 8 3 1
7,6
61,5 23,1 7,6
3 6 2 2
23,1 46,1 15,4 15,4
Income Rp.1.500.000-Rp.2.000.000 Rp.2.000.000-Rp.3.000.000 >Rp.3.000.000
4 5 4
30,7 38,6 30,7
8 1 4
61,6 7,7 30,7
Score Analysis of Gout Disease Prevention Behavior in Experimental Group
Based on the results of the research, the results of the analysis obtained from pretest and
posttest scores of gout prevention behavior in the experimental group as listed in Table 3. below.
Table 3. Results analysis of behavior scores gout disease prevention in group experiments
Value Mean Median Standar deviation
Range Minimum Maximum
Pretest 12,69 13,00 1,843 5 10 15 Postest 15,38 16,00 2,063 6 12 18
Based on the pretest and posttest scores preventive behavior against gout in the
experimental group results analysis table, can be seen that there was an increase in the average
(mean) score of gout disease prevention behavior before and after the writer gave material
explanation about the behavior of gout disease prevention by giving diari ceria (prevent
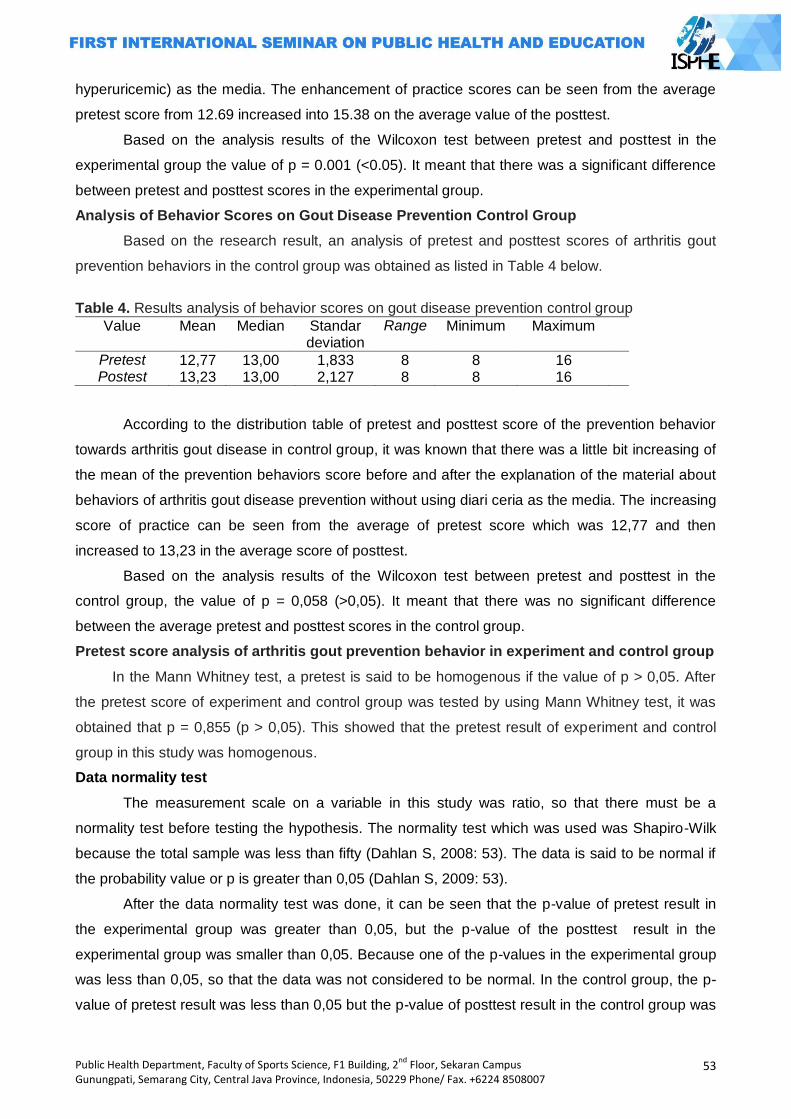
Public Health Department, Faculty of Sports Science, F1 Building, 2nd
Floor, Sekaran Campus Gunungpati, Semarang City, Central Java Province, Indonesia, 50229 Phone/ Fax. +6224 8508007
53
hyperuricemic) as the media. The enhancement of practice scores can be seen from the average
pretest score from 12.69 increased into 15.38 on the average value of the posttest.
Based on the analysis results of the Wilcoxon test between pretest and posttest in the
experimental group the value of p = 0.001 (<0.05). It meant that there was a significant difference
between pretest and posttest scores in the experimental group.
Analysis of Behavior Scores on Gout Disease Prevention Control Group
Based on the research result, an analysis of pretest and posttest scores of arthritis gout
prevention behaviors in the control group was obtained as listed in Table 4 below.
Table 4. Results analysis of behavior scores on gout disease prevention control group
Value Mean Median Standar deviation
Range Minimum Maximum
Pretest 12,77 13,00 1,833 8 8 16 Postest 13,23 13,00 2,127 8 8 16
According to the distribution table of pretest and posttest score of the prevention behavior
towards arthritis gout disease in control group, it was known that there was a little bit increasing of
the mean of the prevention behaviors score before and after the explanation of the material about
behaviors of arthritis gout disease prevention without using diari ceria as the media. The increasing
score of practice can be seen from the average of pretest score which was 12,77 and then
increased to 13,23 in the average score of posttest.
Based on the analysis results of the Wilcoxon test between pretest and posttest in the
control group, the value of p = 0,058 (>0,05). It meant that there was no significant difference
between the average pretest and posttest scores in the control group.
Pretest score analysis of arthritis gout prevention behavior in experiment and control group
In the Mann Whitney test, a pretest is said to be homogenous if the value of p > 0,05. After
the pretest score of experiment and control group was tested by using Mann Whitney test, it was
obtained that p = 0,855 (p > 0,05). This showed that the pretest result of experiment and control
group in this study was homogenous.
Data normality test
The measurement scale on a variable in this study was ratio, so that there must be a
normality test before testing the hypothesis. The normality test which was used was Shapiro-Wilk
because the total sample was less than fifty (Dahlan S, 2008: 53). The data is said to be normal if
the probability value or p is greater than 0,05 (Dahlan S, 2009: 53).
After the data normality test was done, it can be seen that the p-value of pretest result in
the experimental group was greater than 0,05, but the p-value of the posttest result in the
experimental group was smaller than 0,05. Because one of the p-values in the experimental group
was less than 0,05, so that the data was not considered to be normal. In the control group, the p-
value of pretest result was less than 0,05 but the p-value of posttest result in the control group was
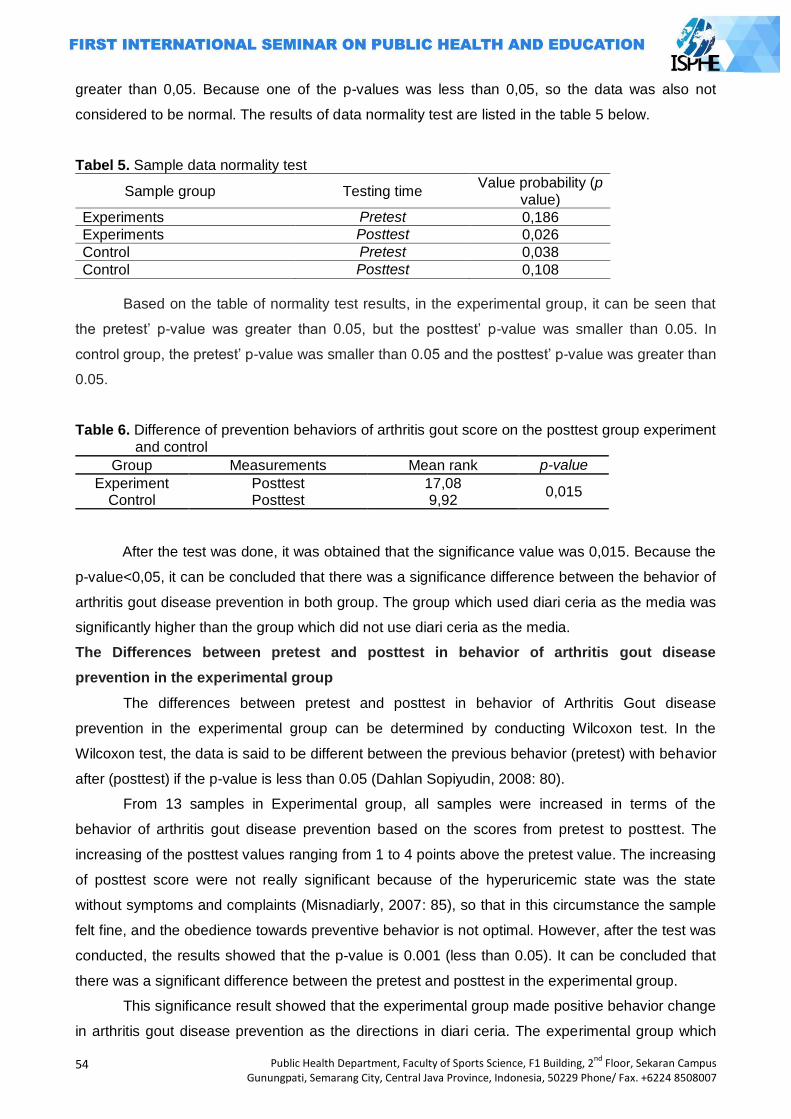
54
Public Health Department, Faculty of Sports Science, F1 Building, 2nd
Floor, Sekaran Campus Gunungpati, Semarang City, Central Java Province, Indonesia, 50229 Phone/ Fax. +6224 8508007
greater than 0,05. Because one of the p-values was less than 0,05, so the data was also not
considered to be normal. The results of data normality test are listed in the table 5 below.
Tabel 5. Sample data normality test
Sample group Testing time Value probability (p
value)
Experiments Pretest 0,186
Experiments Posttest 0,026
Control Pretest 0,038
Control Posttest 0,108
Based on the table of normality test results, in the experimental group, it can be seen that
the pretest‘ p-value was greater than 0.05, but the posttest‘ p-value was smaller than 0.05. In
control group, the pretest‘ p-value was smaller than 0.05 and the posttest‘ p-value was greater than
0.05.
Table 6. Difference of prevention behaviors of arthritis gout score on the posttest group experiment and control
Group Measurements Mean rank p-value
Experiment Posttest 17,08 0,015
Control Posttest 9,92
After the test was done, it was obtained that the significance value was 0,015. Because the
p-value<0,05, it can be concluded that there was a significance difference between the behavior of
arthritis gout disease prevention in both group. The group which used diari ceria as the media was
significantly higher than the group which did not use diari ceria as the media.
The Differences between pretest and posttest in behavior of arthritis gout disease
prevention in the experimental group
The differences between pretest and posttest in behavior of Arthritis Gout disease
prevention in the experimental group can be determined by conducting Wilcoxon test. In the
Wilcoxon test, the data is said to be different between the previous behavior (pretest) with behavior
after (posttest) if the p-value is less than 0.05 (Dahlan Sopiyudin, 2008: 80).
From 13 samples in Experimental group, all samples were increased in terms of the
behavior of arthritis gout disease prevention based on the scores from pretest to posttest. The
increasing of the posttest values ranging from 1 to 4 points above the pretest value. The increasing
of posttest score were not really significant because of the hyperuricemic state was the state
without symptoms and complaints (Misnadiarly, 2007: 85), so that in this circumstance the sample
felt fine, and the obedience towards preventive behavior is not optimal. However, after the test was
conducted, the results showed that the p-value is 0.001 (less than 0.05). It can be concluded that
there was a significant difference between the pretest and posttest in the experimental group.
This significance result showed that the experimental group made positive behavior change
in arthritis gout disease prevention as the directions in diari ceria. The experimental group which
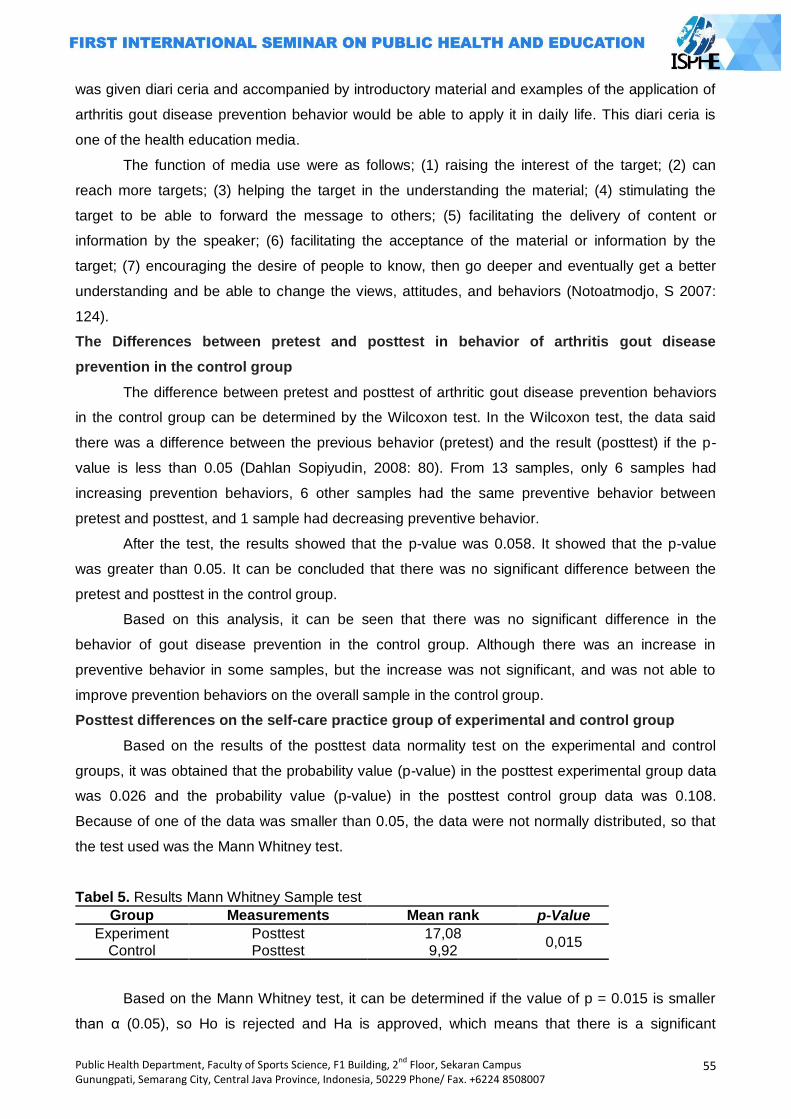
Public Health Department, Faculty of Sports Science, F1 Building, 2nd
Floor, Sekaran Campus Gunungpati, Semarang City, Central Java Province, Indonesia, 50229 Phone/ Fax. +6224 8508007
55
was given diari ceria and accompanied by introductory material and examples of the application of
arthritis gout disease prevention behavior would be able to apply it in daily life. This diari ceria is
one of the health education media.
The function of media use were as follows; (1) raising the interest of the target; (2) can
reach more targets; (3) helping the target in the understanding the material; (4) stimulating the
target to be able to forward the message to others; (5) facilitating the delivery of content or
information by the speaker; (6) facilitating the acceptance of the material or information by the
target; (7) encouraging the desire of people to know, then go deeper and eventually get a better
understanding and be able to change the views, attitudes, and behaviors (Notoatmodjo, S 2007:
124).
The Differences between pretest and posttest in behavior of arthritis gout disease
prevention in the control group
The difference between pretest and posttest of arthritic gout disease prevention behaviors
in the control group can be determined by the Wilcoxon test. In the Wilcoxon test, the data said
there was a difference between the previous behavior (pretest) and the result (posttest) if the p-
value is less than 0.05 (Dahlan Sopiyudin, 2008: 80). From 13 samples, only 6 samples had
increasing prevention behaviors, 6 other samples had the same preventive behavior between
pretest and posttest, and 1 sample had decreasing preventive behavior.
After the test, the results showed that the p-value was 0.058. It showed that the p-value
was greater than 0.05. It can be concluded that there was no significant difference between the
pretest and posttest in the control group.
Based on this analysis, it can be seen that there was no significant difference in the
behavior of gout disease prevention in the control group. Although there was an increase in
preventive behavior in some samples, but the increase was not significant, and was not able to
improve prevention behaviors on the overall sample in the control group.
Posttest differences on the self-care practice group of experimental and control group
Based on the results of the posttest data normality test on the experimental and control
groups, it was obtained that the probability value (p-value) in the posttest experimental group data
was 0.026 and the probability value (p-value) in the posttest control group data was 0.108.
Because of one of the data was smaller than 0.05, the data were not normally distributed, so that
the test used was the Mann Whitney test.
Tabel 5. Results Mann Whitney Sample test
Group Measurements Mean rank p-Value
Experiment Posttest 17,08 0,015
Control Posttest 9,92
Based on the Mann Whitney test, it can be determined if the value of p = 0.015 is smaller
than α (0.05), so Ho is rejected and Ha is approved, which means that there is a significant
56
Public Health Department, Faculty of Sports Science, F1 Building, 2nd
Floor, Sekaran Campus Gunungpati, Semarang City, Central Java Province, Indonesia, 50229 Phone/ Fax. +6224 8508007
difference in the posttest score between the experimental and control group. Based on this
research, it can be concluded that the use of diari ceria was effective in improving behavioral
prevention of arthritic gout in patients with hyperuricemic employees. This research results were in
line with Roudy et al (2007) and Budi N (2013) who stated that after the diet booklet given to
hyperuricemic, patients can improve the control of hyperuricemic purine intake (behavior) and
repair the uric acid.
Diari ceria was one of media to facilitate in providing knowledge and explanation to the
public. The contents of diari ceria were not only introductory material on hyperuricemic, arthritic
gout, and prevention efforts, but also a diary sheets requiring patients to fill out and follow the
guidelines in the diari ceria every day. According to Eko Mahfoedz and Syriac (2009: 25) one of the
behavior establishments can be reached by the conditioning or habit. By pledging to behave as
expected, it eventually formed the behavior. The filling period of diari ceria for 2 months (8 weeks)
will become a habit and eventually turned into a behavior as the direction of the diari ceria which
was forming arthritic gout disease prevention behaviors.
The Diari ceria is one of health promotion media. Health promotion media is educational
aids or props. The tools would be very helpful in socializing health messages more clearly and the
target society can receive the message clearly and accurately (Notoatmojo, S 2007: 63).
According to Ircham Mahfoedz and Eko Suryani (2009: 57), health education can be carried
out by spreading the message and making sure so that people are not only aware but also willing
and able to perform health suggestions.
Closing
There was a significant difference of prevention behaviors of arthritis gout after the
application of diari ceria. The provision and application of diari ceria is effective in improving
behavioral prevention of arthritic gout at Semarang State University employees who have
hyperuricemic.
The recommendations for people with hyperuricemic were to keep the intake of purines in
foods, replenish water consumption by at least 8 glasses a day, and regular exercise at least 2
times a week to maintain body condition and fitness. For association organizer, cleary and provide
timely information to members about gout management, such as a low purine diet, physical
exercise, and regular giving health checks for employees. The further research is expected to
conduct research in the form of technology-based applications in the gadget or software.
References
Budi, Nugraeni Damayanti, 2013, Differences in Giving Effect Low Purine Diet Information Response Against Blood Uric Acid Levels Decline In Elderly Elderly IHC Gedongan Village Subdistrict Baki, Sukoharjo. Thesis , Sebelas Maret University, Surakarta.
Ching, Li Lyu, Chi-Yin Hsu, Ching-Ying Yeh, Meei-Shyuan Lee, Su-Hua Huang, Ching-Lan Chen, 2003, A Case Control study of The Association of Diet and Obesity with Gout in Taiwan. AM J Clin Nutr 2003;78; Hal 690-701
Public Health Department, Faculty of Sports Science, F1 Building, 2nd
Floor, Sekaran Campus Gunungpati, Semarang City, Central Java Province, Indonesia, 50229 Phone/ Fax. +6224 8508007
57
Chun, Wan Liu, Chi-Chin Hung, Szu-Chia Chen, Shih-Meng Yeh, Ming-Yen Lin, Yi-Wen Chiu, Mei-Chuan Kuo, Jer-Ming Chang, Shang-Jyih Hwang, Hung-Chun Chen, 2012, Association of Hyperuricemic with Renal Outcomes, Cardiovascular Disease, and Mortality. Clinical Journal of the American Society of Nephrology, Vol. 7 April 2012.
Dafton,J. MD, 2011, The Pathophysiology and Pharmaceutical Treatment of Gout. United State of America.
Dahlan, Sopiyudin, 2008, Statistics for Medical and Health. Salemba Medika, Jakarta. Departement of Health of Indonesia, 2006, Pharmaceutical Care for Patients Artrithis Rheumatic
Diseases. Dikjen Binfar & Alkes, Jakarta. ________, 2008, Technical Guidelines for Management of Hypertension discovery. Dikjen PP &
PL, Jakarta. Do, Maria Rosario, Estelamaris Tronco Monego, Paulo Cesar B Veiga Jardim, Magna Maria
Carvalho, 2001, Diet and Medication in the Treatment of Hyperuricemic in Hypertensive Patients. Arq Bras Cardiol, volume 76, no. 468-472
Eggebeen, AT, 2007, Gout: an update, Am Fam Physician, 76:801-810 Emerson BT, 1998, Hyperlipidemia in hyperuricemic and gout. Ann Rheum Dis 1998: 57, 509-519 Finn R, Jones PO, Tweedie MCK, Dinsdale OF, Hall SM, Boudillon RE 1966. Frequency-
distribution curve of uric acid in the general population. The Lancet, 23; 185-187. Hakoda, Masayuki, 2012, Recent Trends in Hyperuricemic and Gout in Japan. JMAJ 55(4): 319-
323. Karyadi, E. 2006, Life with Hypertension Disease, Gout, Coronary Heart. Intisasi Mediatama,
Jakarta. Machfoedz, Ircham, Eko Suryani, 2009. Part of the Health Education Health Promotion. Fitramaya.
Jakarta Manampiring, E, Widdy Bodhy, 2011, Prevalence of Hyperuricemic in Obese Adolescents in
Tomohon. University of Sam Ratulangi. Manado. Maulana, Heri DJ. 2009, Health Promotions. EGC, Jakarta Misnadiarly, 2007, Rheumatism, Gout, Hyperuricemic, Gout, Pustaka Obor Populer. Jakarta Nata, Pratama HL, 2013, Nefropati Urat. CDK-204, Volume 4, no.5 tahun 2013. Jakarta. Notoatmodjo, S, 2007, Health Promotion and Behavioral Sciences, Rineka Cipta, Jakarta _____________, 2005, Health Promotion Theory and Applications, Rineka Cipta, Jakarta Puslakes, 2013, Health Inspection Reports Employee G, H and I UNNES. Semarang. Roudy, Maxie Reppie, HAH Asdie, Herni Astuti, 2007, Effect of Nutrition Counseling with Diet
Handbook Hyperuricemic in Patients in Hospital Outpatient Noongan North Sulawesi.
Thesis. Gajah Mada University. Jogjakarta Saraswati, Sylvia, 2009, Healthy Diet for Gout, Diabetes, Hypertension, and Stroke, A Plus,
Jogjakarta. Vardhani, Pramadya M. 2010, Assosiation between hiperuricemic and hypertension. Skripsi.
Sebelas Maret University, Surakarta. Widhayati, RE. 2009, Effect of Nutrition Education on BMI Changes in Energy Consumption and
Excess Weight Gain in Adolescents. Thesis. Diponegoro University Semarang Woong, J Choi, Earl S Ford, Xiang Gao, Hyon K Choi. 2008, Sugar-Sweetened Soft Drinks, Diet
Soft Drinks, and Serum Uric Acid Level: The Third National Health and Nutrition Examination Survey. Arthtritis & Rheumatism. Vol. 59, No. 1 Januari 15, 2008.
58
Public Health Department, Faculty of Sports Science, F1 Building, 2nd
Floor, Sekaran Campus Gunungpati, Semarang City, Central Java Province, Indonesia, 50229 Phone/ Fax. +6224 8508007
INSTANT NOODLES CONSUMPTION PATTERNS, BODY MASS INDEX AND QUALITY OF LIFE OF FEMALE STUDENTS IN ISLAMIC BOARDING SCHOOL
Aprilia Devi Fatimah1, Siti Rahayu Nadhiroh1
1 Airlangga University, Indonesia
Corresponding Author: [email protected]
Abstract Introduction: Instant noodles is one of the most popular foods in Indonesia. However it contains high carbohydrates but low in protein and other nutrients. The aim of this study was to analyze the relationship between nutrients intake, body mass index (BMI), quality of life and instant noodles consumption patterns of female students in Islamic Boarding School. Methods: This study was an analytical observational research with cross sectional design. Sample was 80 female students from Roudhotul Islam Islamic boarding school Pasuruan that taken by simple random sampling. Spearman's test was used to determine the correlation between variables. Most of respondents ate instant noodle daily but in small portions. Most of them had less intakes of energy, mineral and vitamin, except sodium. Most of them had normal nutritional status, high quality of life in the psychological and social domain but low in physical domain. Results: There were no relationship between instant noodles consumption pattern and BMI,
quality of life and nutrient intake except sodium. In conclusion, sodium is associated with instant noodle consumption pattern. Instant noodle intake is in small portion but frequent and it does not associate with BMI and quality of life.
Key Words: Instant noodles, body mass index, quality of life
Introduction
Santri is a term for a student who studied in islamic boarding school and usually live in it‘s
surroundings. Most santri are teenager. Teens is a unique period in life because in that period
they‘ll experience either physical, psychosocial and cognitive development thoroughly, therefore,
their calories and proteins intake are increasing (Spear in Rao, 2007). Compared to other ages,
insufficient diet is the most common problem faced by girl teenager. Some specific behavior that
are thought to be tha cause of teen‘s nutrition problem are skipping one or more meals in a day;
improper snack choice; lack of parents monitoring in choosing foods out of home; afraid of getting
obesed particularly in girl; and lack of time to consume food regularly (Poltekkes Depkes Jakarta,
2010).
Insufficient diet will affect teenager‘s nutritional status thus affect their health status when
they‘re adult. In islamic boarding school, food availibilty could influence how santri choose their
daily meal. Santri would choose food ingredients that easily found or available in boarding school
and nearby market as their daily meal. The results of research conducted by Nadhiroh (2006) to
female student of islamic boarding school (santriwati) in coastal and non-coastal area found that
santriwati who live in coastal area boarding school consumed fish more often than those living in
non-coastal area.
Public Health Department, Faculty of Sports Science, F1 Building, 2nd
Floor, Sekaran Campus Gunungpati, Semarang City, Central Java Province, Indonesia, 50229 Phone/ Fax. +6224 8508007
59
Based on preliminary study in Roudhotul Islam boarding school Pasuruan, most santriwati
ate instant noodles at least once a day. Instant noodles in boarding school area are more
accessible than other food ingredients such as vegetables, meats and fruits. Most santriwati were
cooking each day, so meals management in Roudhotul Islam boarding school was arranged by
santriwatis themselves, inclucing meal choices. The results of research conducted by Salmiati
(2012) to 65 santri showed that 47,7% of them suffered energy deficiency; 7,7% suffered protein
deficiency; 80% had lack calcium intake and 93,8% suffered iron deficiency.
In the last two decade, instant noodles become one of the most popular foods in Indonesia.
Instant noodles is delicious, tasty, instaneous and inexpensive. Based on World Instant Noodles
Association or WINA data (2013), Indonesia rank as number two of the highest instant noodle sale
in the world after China.
Consuming instant noodles over and over could affect health badly. Reseach results of junior
high school students in Japan about the relationship between instant noodles consumption and
quality of life showed that students who ate instant noodles at least three times a week had quality
of life 1,49 times less than those who didn‘t ate it. They also had gastric (stomach) cancer risk 4,76
times higher (Chen, 2004).
Considering the importance of balanced diet for girl teenagers and the lack of human
resources awareness in islamic boarding school, therefore the aim of this research was to analyze
the relationship between consumption patterns of instant noodles and nutrition intake, body mass
index and also quality of life of santriwati in islamic boarding school.
Methods
This research is a analitic observational research with cross sectional design. This research was
conducted from January to July 2013. The sampel of this research were 12-19 years old santriwati who live
in Roudhotul Islam boarding school, Gondangwetan district area, Pasuruan. Sample size of this research was
obtained by a formula. Total sample of this research was 80 santriwatis which obtained by simple random
sampling method.
Research instrument that used in this research were Food Frequency Questionaire (FFQ) to identify
consumption pattern of instant noodles and another meals in a day, a week and a month frequency; Food
Recall 2x24 Hours (to be used both in holiday and effective days) to count nutrient intake (energy, proteins,
calcium, iron, vitamin B1, vitamin C and sodium) which then will be processed by Nutrisurvey software and
World Health Organization Quality of Life (WHOQOL) Form to measure quality of life, including physical,
psychological and social domain. Nutrition status was determined according to 2007 WHO’s standar by age.
Body weight was measured by bathroom scale whereas height was measured by microtoise. To identify the
relationship between instant noodle’s consumption pattern and nutrient intake, body mass index and also
quality of life, spearman correlation test was applied. This research had already passed ethical test and could
be carried out.
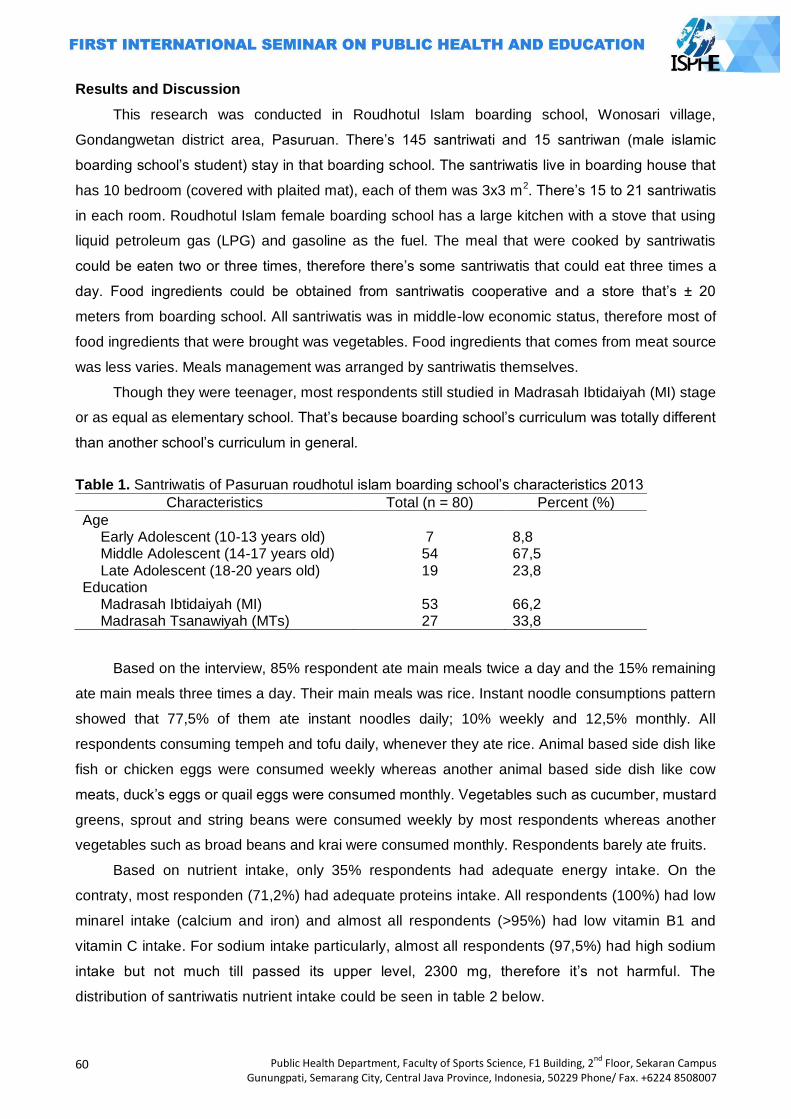
60
Public Health Department, Faculty of Sports Science, F1 Building, 2nd
Floor, Sekaran Campus Gunungpati, Semarang City, Central Java Province, Indonesia, 50229 Phone/ Fax. +6224 8508007
Results and Discussion
This research was conducted in Roudhotul Islam boarding school, Wonosari village,
Gondangwetan district area, Pasuruan. There‘s 145 santriwati and 15 santriwan (male islamic
boarding school‘s student) stay in that boarding school. The santriwatis live in boarding house that
has 10 bedroom (covered with plaited mat), each of them was 3x3 m2. There‘s 15 to 21 santriwatis
in each room. Roudhotul Islam female boarding school has a large kitchen with a stove that using
liquid petroleum gas (LPG) and gasoline as the fuel. The meal that were cooked by santriwatis
could be eaten two or three times, therefore there‘s some santriwatis that could eat three times a
day. Food ingredients could be obtained from santriwatis cooperative and a store that‘s ± 20
meters from boarding school. All santriwatis was in middle-low economic status, therefore most of
food ingredients that were brought was vegetables. Food ingredients that comes from meat source
was less varies. Meals management was arranged by santriwatis themselves.
Though they were teenager, most respondents still studied in Madrasah Ibtidaiyah (MI) stage
or as equal as elementary school. That‘s because boarding school‘s curriculum was totally different
than another school‘s curriculum in general.
Table 1. Santriwatis of Pasuruan roudhotul islam boarding school‘s characteristics 2013
Characteristics Total (n = 80) Percent (%)
Age Early Adolescent (10-13 years old) Middle Adolescent (14-17 years old) Late Adolescent (18-20 years old)
Education Madrasah Ibtidaiyah (MI) Madrasah Tsanawiyah (MTs)
7 54 19
53 27
8,8 67,5 23,8 66,2 33,8
Based on the interview, 85% respondent ate main meals twice a day and the 15% remaining
ate main meals three times a day. Their main meals was rice. Instant noodle consumptions pattern
showed that 77,5% of them ate instant noodles daily; 10% weekly and 12,5% monthly. All
respondents consuming tempeh and tofu daily, whenever they ate rice. Animal based side dish like
fish or chicken eggs were consumed weekly whereas another animal based side dish like cow
meats, duck‘s eggs or quail eggs were consumed monthly. Vegetables such as cucumber, mustard
greens, sprout and string beans were consumed weekly by most respondents whereas another
vegetables such as broad beans and krai were consumed monthly. Respondents barely ate fruits.
Based on nutrient intake, only 35% respondents had adequate energy intake. On the
contraty, most responden (71,2%) had adequate proteins intake. All respondents (100%) had low
minarel intake (calcium and iron) and almost all respondents (>95%) had low vitamin B1 and
vitamin C intake. For sodium intake particularly, almost all respondents (97,5%) had high sodium
intake but not much till passed its upper level, 2300 mg, therefore it‘s not harmful. The
distribution of santriwatis nutrient intake could be seen in table 2 below.
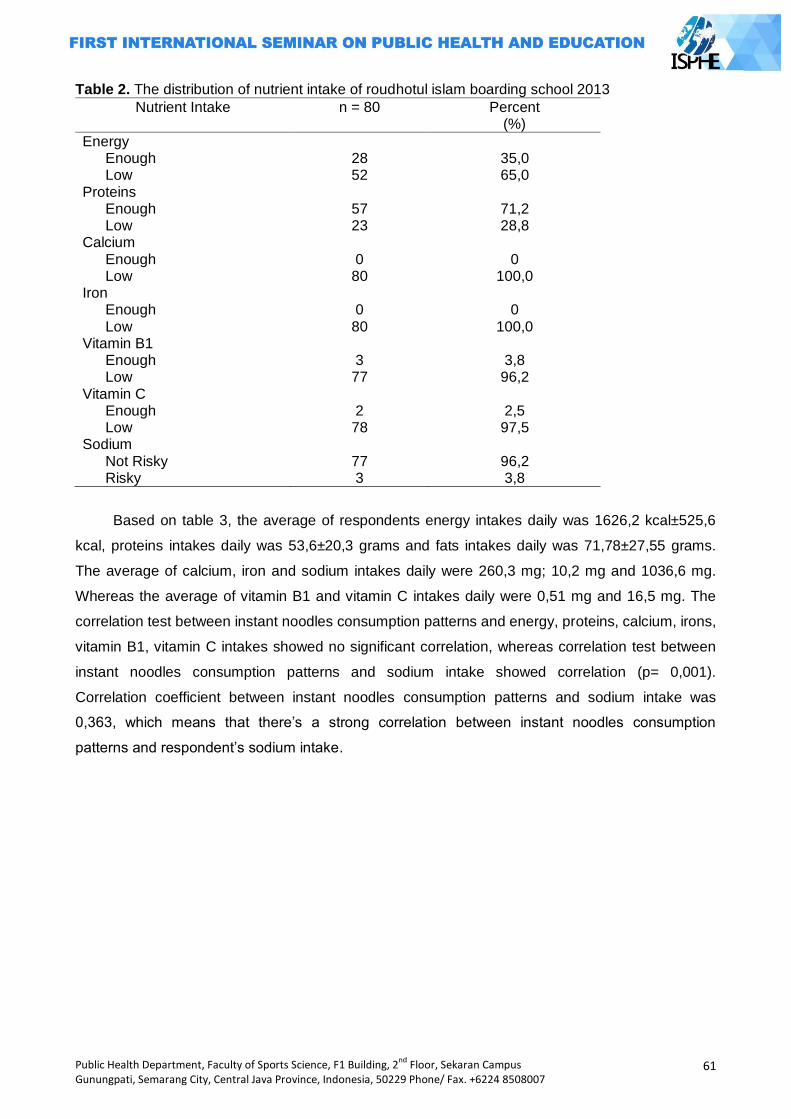
Public Health Department, Faculty of Sports Science, F1 Building, 2nd
Floor, Sekaran Campus Gunungpati, Semarang City, Central Java Province, Indonesia, 50229 Phone/ Fax. +6224 8508007
61
Table 2. The distribution of nutrient intake of roudhotul islam boarding school 2013
Nutrient Intake n = 80 Percent (%)
Energy Enough Low
Proteins Enough Low
Calcium Enough Low
Iron Enough Low
Vitamin B1 Enough Low
Vitamin C Enough Low
Sodium Not Risky Risky
28 52
57 23 0 80 0 80 3 77 2 78
77 3
35,0 65,0
71,2 28,8
0
100,0 0
100,0
3,8 96,2
2,5 97,5
96,2 3,8
Based on table 3, the average of respondents energy intakes daily was 1626,2 kcal±525,6
kcal, proteins intakes daily was 53,6±20,3 grams and fats intakes daily was 71,78±27,55 grams.
The average of calcium, iron and sodium intakes daily were 260,3 mg; 10,2 mg and 1036,6 mg.
Whereas the average of vitamin B1 and vitamin C intakes daily were 0,51 mg and 16,5 mg. The
correlation test between instant noodles consumption patterns and energy, proteins, calcium, irons,
vitamin B1, vitamin C intakes showed no significant correlation, whereas correlation test between
instant noodles consumption patterns and sodium intake showed correlation (p= 0,001).
Correlation coefficient between instant noodles consumption patterns and sodium intake was
0,363, which means that there‘s a strong correlation between instant noodles consumption
patterns and respondent‘s sodium intake.
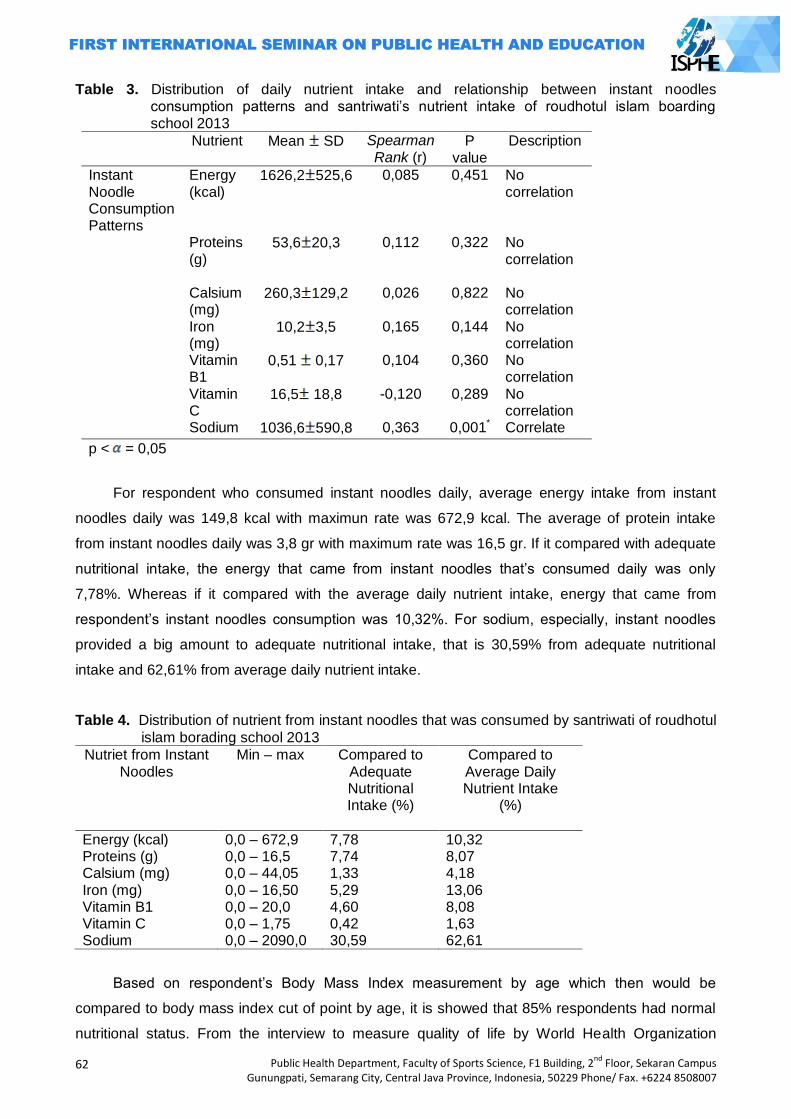
62
Public Health Department, Faculty of Sports Science, F1 Building, 2nd
Floor, Sekaran Campus Gunungpati, Semarang City, Central Java Province, Indonesia, 50229 Phone/ Fax. +6224 8508007
Table 3. Distribution of daily nutrient intake and relationship between instant noodles consumption patterns and santriwati‘s nutrient intake of roudhotul islam boarding school 2013
Nutrient Mean SD Spearman Rank (r)
P value
Description
Instant Noodle Consumption Patterns
Energy (kcal)
1626,2 525,6 0,085 0,451 No correlation
Proteins (g)
53,6 20,3 0,112 0,322 No correlation
Calsium
(mg) 260,3 129,2 0,026 0,822 No
correlation Iron
(mg) 10,2 3,5 0,165 0,144 No
correlation Vitamin
B1 0,51 0,17 0,104 0,360 No
correlation Vitamin
C 16,5 18,8 -0,120 0,289 No
correlation Sodium 1036,6 590,8 0,363 0,001* Correlate
p < = 0,05
For respondent who consumed instant noodles daily, average energy intake from instant
noodles daily was 149,8 kcal with maximun rate was 672,9 kcal. The average of protein intake
from instant noodles daily was 3,8 gr with maximum rate was 16,5 gr. If it compared with adequate
nutritional intake, the energy that came from instant noodles that‘s consumed daily was only
7,78%. Whereas if it compared with the average daily nutrient intake, energy that came from
respondent‘s instant noodles consumption was 10,32%. For sodium, especially, instant noodles
provided a big amount to adequate nutritional intake, that is 30,59% from adequate nutritional
intake and 62,61% from average daily nutrient intake.
Table 4. Distribution of nutrient from instant noodles that was consumed by santriwati of roudhotul
islam borading school 2013
Nutriet from Instant Noodles
Min – max Compared to Adequate Nutritional Intake (%)
Compared to Average Daily Nutrient Intake
(%)
Energy (kcal) 0,0 – 672,9 7,78 10,32 Proteins (g) 0,0 – 16,5 7,74 8,07 Calsium (mg) 0,0 – 44,05 1,33 4,18 Iron (mg) 0,0 – 16,50 5,29 13,06 Vitamin B1 0,0 – 20,0 4,60 8,08 Vitamin C 0,0 – 1,75 0,42 1,63 Sodium 0,0 – 2090,0 30,59 62,61
Based on respondent‘s Body Mass Index measurement by age which then would be
compared to body mass index cut of point by age, it is showed that 85% respondents had normal
nutritional status. From the interview to measure quality of life by World Health Organization
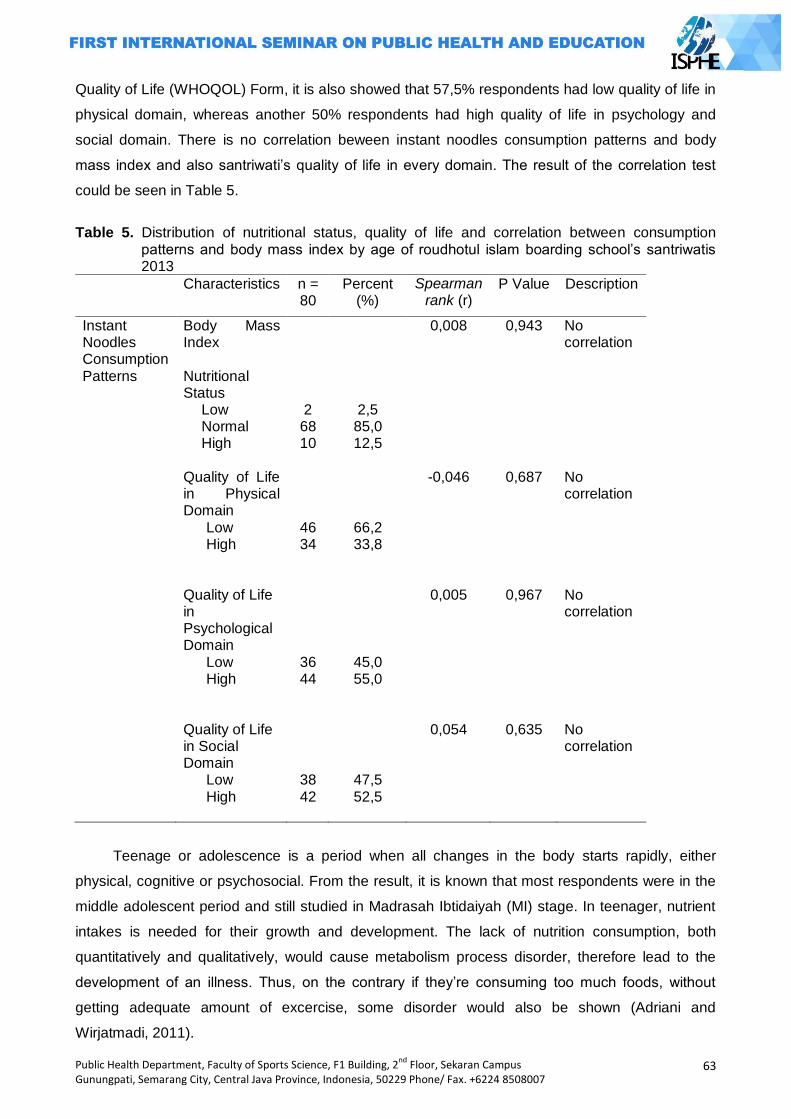
Public Health Department, Faculty of Sports Science, F1 Building, 2nd
Floor, Sekaran Campus Gunungpati, Semarang City, Central Java Province, Indonesia, 50229 Phone/ Fax. +6224 8508007
63
Quality of Life (WHOQOL) Form, it is also showed that 57,5% respondents had low quality of life in
physical domain, whereas another 50% respondents had high quality of life in psychology and
social domain. There is no correlation beween instant noodles consumption patterns and body
mass index and also santriwati‘s quality of life in every domain. The result of the correlation test
could be seen in Table 5.
Table 5. Distribution of nutritional status, quality of life and correlation between consumption
patterns and body mass index by age of roudhotul islam boarding school‘s santriwatis 2013
Characteristics n = 80
Percent (%)
Spearman rank (r)
P Value Description
Instant Noodles Consumption Patterns
Body Mass Index Nutritional Status
Low Normal High
Quality of Life in Physical Domain
Low High
Quality of Life in Psychological Domain
Low High
Quality of Life in Social Domain
Low High
2 68 10
46 34
36 44
38 42
2,5 85,0 12,5
66,2 33,8
45,0 55,0
47,5 52,5
0,008
-0,046
0,005
0,054
0,943
0,687
0,967
0,635
No correlation No correlation No correlation No correlation
Teenage or adolescence is a period when all changes in the body starts rapidly, either
physical, cognitive or psychosocial. From the result, it is known that most respondents were in the
middle adolescent period and still studied in Madrasah Ibtidaiyah (MI) stage. In teenager, nutrient
intakes is needed for their growth and development. The lack of nutrition consumption, both
quantitatively and qualitatively, would cause metabolism process disorder, therefore lead to the
development of an illness. Thus, on the contrary if they‘re consuming too much foods, without
getting adequate amount of excercise, some disorder would also be shown (Adriani and
Wirjatmadi, 2011).
64
Public Health Department, Faculty of Sports Science, F1 Building, 2nd
Floor, Sekaran Campus Gunungpati, Semarang City, Central Java Province, Indonesia, 50229 Phone/ Fax. +6224 8508007
Most respondents consumed main meal such as rice twice a day, instant noodles and plant
based side dish daily and animal based side dish, vegetables and fruits both weekly and monthly.
The same result also obtained in another research about santriwati‘s consumption patterns in
coastal and non-coastal area islamic boarding school. It is known that all santriwatis, both in
coastal and non-coastal area, ate rice as their main meal everytime they eat. Most santriwatis in
both boarding school also consumed tempeh and tofu as the side dish whenever they eat. They
also ate vegetables weekly and fruits monthly (Nadhiroh, 2006). In another research conducted by
Mudjianto et. al., it is showed that instant noodles became the first choice for breakfast and dinner.
Instant noodles also became the second choice for lunch.
Most respondents had instant noodles daily consumption patterns, lack of energy, calcium,
iron, vitamin C and also vitamin B1 intakes.Most respondents had enough protein intake, but it
was dominated by plant based protein which were consumed everytime they eat. The high but
harmless sodium intake came from santriwati‘s habit consuming instant noodles that have high
sodium contents. The research result in Korea to respondents who‘s consuming instant noodles
showed higher natrium intake in those who consuming instant noodles than those who didn‘t
(Park, 2011).
Energy intakes that‘s unsuitable with body needs either more or less could affect one‘s
conditions (Dwiningsih, 2013). Based on the measurement, respondent‘s average energy
intakes in a day was 1626,2 kcal which spread 525,6 kcal from the average point. Teenage
energy requirement per day based on recommended dietary allowance (RDA) is 1809,5 kcal.
Most respondents had low energy intake.
The habit of consuming instant noodles daily only make 10% of energy requirements. This
showed that instant noodles could only consumed in a small portion and act as an addition of main
meal such as rice. If we looked closely to energy contribution, fats become the highest energy
contributor for respondents, up to 40%. Whereas average proteins and carbohidrates proportion
were 13% and 46%. The main source of fats in respondents meals came from frying oil which was
used to fry all the side dish. Oil also came from instant noodles. The same result also obtained
from a research to teenager in urban and suburban area. It is showed that a part of respondent‘s
energy came from fats. It happened because both urban and suburban respondents were
consuming meals that were fried or sauted. They also consumed instant noodles, snack and fast
food (Dwiningsih, 2013). Adiningsih et., al. (2012) said that a menu could be called as balanced if
in it‘s composition there‘s 50-60% of carbohydrates, 20-25% of fats and 15-20% of proteins. The
result of Harika‘s research (2011), from 30 states data compilation, showed that unsaturated fat
consumptions in kids and teenagers has already passed WHO‘s recommendation. Therefore,
efforts should be focused to restore fats composition in their diets since they were kids to prevent
the upsurge of chronic dissease risk when they‘re adult.
The lack of mineral and vitamin‘s intake was caused by the lack of food consumption which
become the main source of those vitamin and mineral. Respondents consumed vegetables, fruits
Public Health Department, Faculty of Sports Science, F1 Building, 2nd
Floor, Sekaran Campus Gunungpati, Semarang City, Central Java Province, Indonesia, 50229 Phone/ Fax. +6224 8508007
65
and animal based side dish weekly and monthly. The availability of those ingredients in nearby
store also less varies, moreover for vegetables and animal side dish needs. Infact, there‘s no fruits
at all in that store. Respondent would consume vegetables and animal based side dish if their
parents came or if their caretaker held some events. Vitamin is organic components that needed in
a little amount and should be supplied from foods because body can‘t synthesize it (Muhtadi,
2009). Another research to another boarding school‘s santriwati showed that most santriwatis had
lack of energy, vitamin C and iron intake (Dewi, 2011).
From this research it is showed that although most respondent had normal nutritional status,
most of them also had lack energy intake. It might be cause their lack of energy release. Based on
observational result, respondents were not doing a lot of physical activity such as excercising or
cleaning up their room. Activities such as cleaning up their room and surroundings were done by
picketing, therefore respondents wouldn‘t do it everyday. Moreover, most of their activities were
studying which also done in boarding school. This caused the lack of energy release. Almaister
(2009) stated that energy balance could be achieved if the amount of energy entered our body
through our food is the same with the amount of energy that exited. Therefore, if the amount of
energy that entered our body is a little, and the amount of energy that released also a little, this
could result in ideal or normal body weight.
Lack of physical activity in teenage age can affect badly when they grew older. A longitudinal
study showed that kid‘s or teenager‘s physical health degree can determine their adult physical
health degree. The lack of physical fitness at those age may be correlated to cardiovascular
dissease such as hiperlypidemic, high-blood pressure and obesity (Boreham et. al. In Moreno et.
al., 2008).
This research also showed the lack of santriwati‘s quality of life in physical domain.
Questions in physical domain including sickness complaint, physical ability to do physical activities
and sleeping satisfaction. Based on observational result, respondent‘s bedroom was 3x3 m2 in size
and inhabitted by 15 to 20 respondents. Respondents slept without any base or bed. Moreover,
their drinking water was not boiled. According to Blum and Nasution (2004), factors that affect
one‘s physical health are the environment, including physical (natural and synthetic), chemical
(organic/anorganic, heavy metal and dust) and socio-cultural (economy, education and
employment) environment; behavior, including attitude, habit and actions; health services,
including promotif, preventive, treatment, therapy, disability prevention and rehabilitaton; hereditary
that was brought by the dissease. Siren‘s et. al., (2003) research showed that the excessive health
complaint such as headace or stomachache correlated linearly to high stressed level in school and
low time period to do physical activities.
The question in psychological domain of quality of life were about life satisfaction,
appearance and the self. Most respondents answered good enough in psychological domain. A
thought that was taught by one of the teacher in that boarding school is to accept and be grateful of
66
Public Health Department, Faculty of Sports Science, F1 Building, 2nd
Floor, Sekaran Campus Gunungpati, Semarang City, Central Java Province, Indonesia, 50229 Phone/ Fax. +6224 8508007
what had been given by God. This taught was well accepted by every respondents. In line with
Whitford et. al., in Skevington et. al. (2013), spiritual well-being is important in health treatment.
Most respondents answered good enough in social domain which include question about the
satisfaction of social relation and support from others. To live together in a small room, eat together
and study in the same environment and friends built unity and tolerance between santriwatis. All
respondents had middle-low economic status and equal. This trigger adaptation process to going
on fast and without disruption. Therefore, social aspect also set in santriwatis solidly. Moreover,
according to Purwoko (2012), peers have a big influence in teenager. Peers could affect teenage
opinion and decision over their behavior.
The result of correlation test of instant noodles consumption patterns and body mass index,
quality of life and also nutrient intakes showed no correlation between them except for sodium
intake. Instant noodles provided respondents a lot in average sodium intake. Access to obtained
instant noodles was easier than access to obtained vegetables. Furthermore, respondents
purchasing power over animal based side dish and fruits was low. Instant noodles were consumed
by most respondents as addition to rice without any side dish or vegetables. Most respondents
consumed less than 100 grams instant noodles everytime they eat, so instant noodles were not the
main source of energy intake. All respondent‘s physical activities were done inside boarding school
since they wake up, study and pray. The habit of eat in a big tray with all santriwatis enable them to
have a high quality of life in psychological and social domain. This eating habit was not only for
instant noodles but also another kind of food such as snack. Besides, respondent‘s environment
was all identical so respondent consumption patterns were also the same.
Closing
Most respondents were in the middle adolescents stage and studied in Madrasah Ibtidaiyah
(MI). Most respondents had consumption patterns that is rice twice a day, instant noodles and
plant based side dish daily. Vegetables and animal side dish were consumed weekly and monthly
by most respondents. Even though instant noodles were consumed daily, it‘s only in a small
portion and provide a small amount of energy and other nutrients except for sodium. Most
respondents had normal nutritional status and high quality of life in psychological and social
domain but low in physical domain. There‘s no corelation between instant noodles consumption
patterns and body mass index, quality of life and nutrient intake except for sodium. It is suggested
that santriwatis boost their energy, vitamin and mineral consumption through a balanced menu.
Boarding school‘s caretaker should also provide another food source, especially energy, vitamin
and mineral source that accessible and enhace santriwati‘s quality of life, in physical domain
particularly.
References
Adininingsih, Sri dkk. 2012. Praktikum Gizi. Universitas Airlangga.Surabaya
Public Health Department, Faculty of Sports Science, F1 Building, 2nd
Floor, Sekaran Campus Gunungpati, Semarang City, Central Java Province, Indonesia, 50229 Phone/ Fax. +6224 8508007
67
Adriani, M., & Wirjatmadi, B. 2012. Peran Gizi dalam Siklus Kehidupan. Jakarta, Indonesia: Kencana Prenada Grup.
Almatsier, S. 2009. Prinsip Dasar Ilmu Gizi. Jakarta, Indonesia: Gramedia Chen, X., Sekine, M., Hamanishi, S., Wang, H., Gaina, A., Yamagami, T., Kagamimori, S. 2005.
Lifestyles and Health-Related Quality of Life in Japanese School Children: a Cross-Sectional Study. Journal of Preventing Medicine, vol 40, no. 6, hh 668-678. .
Dewi, C. K. 2011. Hubungan Antara Tingkat Kecukupan Gizi (Energi, Protein, Vitamin A, Vitamin C, dan Zat Besi) Dengan Status Gizi santriwati (Studi di Asrama Putri PP Al Islam Kecamatan Sukomoro Kabupaten Nganjuk). Skripsi. Universitas Airlangga, Surabaya, Indonesia.
Dwiningsih, A. P., 2013, Perbedaan Asupan Energi, Protein, Lemak, Karbohidrat dan Status Gizi pada Remaja yang Tinggal di Wilayah Perkotaan dan Pedesaan. Journal of Nutrition College, vol.2, no. 2, hh. 212-226.
Harika, Rajwinder K; Cosgrove, Maeve C; Osendarp, Saskia J M; Verhoef, Petra; Zock, Peter L. 2011. Fatty acid intakes of children and adolescents are not in line with the dietary intake recommendations for future cardiovascular health: a systematic review of dietary intake data from thirty countries. The British Journal of Nutrition 106.3 (Aug 14, 2011): 307-16
Haugland, Siren; Wold, Bente; Torsheim, Torbjoern. 2003. Relieving the pressure? The role of physical activity in the relationship between school-related stress and adolescent health complaints. Research Quarterly for Exercise and Sport 74.2 (Jun 2003): 127-35.
Klimis, D. & Wolinsky, Z. I. 2004. Nutrition Concerns of Women. New York, USA: CRC Press. Moreno, LA; González-Gross, M; Kersting, M; Molnár, D; de Henauw, S; et al. 2008. Assessing,
understanding and modifying nutritional status, eating habits and physical activity in European adolescents: The HELENA (Healthy Lifestyle in Europe by Nutrition in Adolescence) Study. Public Health Nutrition 11.3 (Mar 2008): 288-99
Muchtadi, D. 2009. Pengantar Ilmu Gizi. Bandung, Indonesia; Alfabeta. Mudjianto, T. T., Susanto, D., Luciasari, E., Hermina. 2005. Kebiasaan Makan Remaja di Enam
Kota Besar di Indonesia. Ejournal Litbangkes Depkes RI. Diakses dari http://ejournal.litbang.depkes.go.id
Nadhiroh, S. R. 2006. Perbedaan Prevalensi Anemi dan Tingkat Kesegaran Jasmani Antara Santriwati di Pondok Pesantren Pesisir dan Non Pesisir (Studi di PP Al Amanah Al Fathimiyah Tambak Beras Jombang dan PP Mazra‘atul Ulum Paciran Lamongan). Media Gizi Indonesia, Vol 1, No 3, Tahun 2006.
Nasution, S. K. 2004. Meningkatkan Status Kesehatan Melalui Pendidikan Kesehatan dan Perapan Pola Hidup Sehat. Sumatera Utara, Indonesia: Universitas Sumatera Utara.
Park, J. 2011. A Comparison Of Food And Nutrient Intake Between Instant Noodle Consumers And Non-Instant Noodle Consumers In Korean Adults. Journal of Nutrition Research and Practice, vol.5, no. 5, hh.443-449. Poltekes Depkes Jakarta, 2010. Kesehatan Remaja Problem dan Solusi. Salemba Medika. Jakarta.
Purwoko, S.B. 2012. Psikologi Remaja. Jakarta, Indonesia: Indonesia Health Community Rao, D Raghunatha; Vijayapushpam, T; Subba Rao, G M; Antony, G M, Sarma, K V R. 2007.
Dietary habits and effect of two different educational tools on nutrition knowledge of school going adolescent girls in Hyderabad, India. European Journal of Clinical Nutrition 61.9 (Sep 2007): 1081-5.
Salmiati, N. F. 2013. Hubungan Pengetahuan Gizi dan Asupan Makanan dengan Status Gizi Santri. Skripsi. Universitas Airlangga, Surabaya, Indonesia.
Skevington, Suzanne M; Gunson, Keely Sarah; O'connell, Kathryn Ann. 2013. Introducing the WHOQOL-SRPB BREF: developing a short-form instrument for assessing spiritual, religious and personal beliefs within quality of life. Quality of Life Research 22.5 (Jun 2013): 1073-83.
WHO. 2004. The World Health Organization Quality of Life (WHOQOL)- BREF. Genewa, USA; WHO.
_____. 2007. BMI-for-age Girls. Genewa, USA: WHO reference. WINA. 2013. Global Demand For Instant Noodles. Osaka, Jepang: WINA reference.
68
Public Health Department, Faculty of Sports Science, F1 Building, 2nd
Floor, Sekaran Campus Gunungpati, Semarang City, Central Java Province, Indonesia, 50229 Phone/ Fax. +6224 8508007
THE INFLUENCE OF PEERS TOWARDS DROP OUT CHILDREN’S SMOKING BEHAVIOR
Tria Astika Endah Permatasari1, Amir Syafruddin1
1University of Muhammadiyah Jakarta, Indonesia
Corresponding Author: [email protected]
Abstract Introduction: Indoneisa is a country which still has low Education Development Index, with the rank of 69th out of 127 countries, based on UNESCO report in 2011. The high number of drop out children becomes one of the causes of the higher number of children labors. This condition has an impact on the higher prevelance of childern smoking year by year. The prevelance of children smoking in indonesia reaches up to 26,6% (Riskesdas, 2010). Methods: The research objective was to analyze the dominant factors related to smoking behavior of drop out children in Jabal Thariq Children‘s Shelter in Subang-West Java, Indonesia using cross sectional study design. The samples are the total population, which includes drop out children aged 11-19 years old in the amount of 70 children during April-May in 2013 taken with total sampling technique. Results: There is no smoking prohibition in Children‘s Shelter. About 41,4% of the children smoke. The multivariate analysis with predictive modeling using logistic regression analysis shows that the peers variable is the most dominant variable which influences smoking behavior {OR 7,054 (95%CI; 1,932-25,748)}. Children‘s Shelter should be designated as a ―Non Smoking‖ Area so it becomes health education tools and an attempt to improve children‘s health status.
Key Words: Smoking behavior, drop out children, ―Non Smoking‖ area, peers, children labors Introduction
Cigarette consumption has become a global epidemic that is part of the lifestyle of some
communities in Indonesia. Cigarettes are basically chemical plants, containing 4000 harmful
chemicals that can lead to disability, illness, decreased productivity and even death in smokers and
people around him, of which 80% occurs developing countries (Gondodiputro, 2007). World Health
Organization (2011) predicts that by 2030, deaths caused by smoking as much as 70% will occur
in developing countries, including Indonesia. Smoking at an early age can lead to addict, because
nicotine and tar which are carcinogenic. Smoking in the early stages of a child becomes inititate to
drugs consumption so that can impact health status of children in the future (Papalia, 2004).
The prevalence of smokers increasing can caused by the high number of drop out children.
Indonesia is one of the Low Education Development Index country, with ranks ranks 69 of 127
based on UNESCO report in 2011. The Ministry of Education and Culture said that every minute,
there are four drop out children and 2.5 million children are labors in Indonesia (BPS, 2011). The
prevalence of smokers increases in line with the increasing number of child labors. The learn
period at this age, instead used to work and socialize who could be at risk of smoking exposure
(Mitchell, 1994)
The ASEAN Tobacco Control Report in 2008, shows off 124 691 684 smokers in ASEAN,
Indonesia has the largest number of smoker are 57,563,866 (46.16%) (Dorotheo, Lian &
Public Health Department, Faculty of Sports Science, F1 Building, 2nd
Floor, Sekaran Campus Gunungpati, Semarang City, Central Java Province, Indonesia, 50229 Phone/ Fax. +6224 8508007
69
Ritthiphakdee, 2008). The prevalence of children's smokers reaches op to 26.6%. (Riskedas,
2010). The Global Youth Tobacco Survey (GYTS), conducted a survey on high school in Jakarta,
Bekasi in 2009 shows as much as 20.3% of students were smokers. Although regulation of
Smoking Area (KTR) has been applied in the school by The Minister of Culture (No. 4 / U / 1997)
about Free Smoking Environment in the School, but is still difficult to stop smoking behavior, the
fact as many as 20.3% of the smokers were 15,1% students smoked in their house.
The results of Faculty of Economics (FE) Trisakti University survey, showed 31.3% of 1,435
junior and senior high school students /SMK in Jakarta, aged 11-19 years are smokers, with the
proportion of active smokers (tobacco consumption every day) as much as 20.6% in 2012.
Students who never smoked is 10.7% and smoked rarely (Amindoni, 2012). The highest number of
first time of children to try smoking at the age of 15-19 years is 43.3%. As many as 17.5% at 10-14
years, 17.5% at 20-24 years, and a few children start smoking since the age of 5-9 years.
Children‘s smokers as light smokers, where about 52.3% of smokers consuming 1-10 cigarettes
per day (Riskesdas, 2010). Smet (1994) describes that the early stages of a child to start smoking
are done with their friends (46%), with their family members (who are not parents) about 23%, and
about 14% with their parents.
Drop out children‘s smoking behavior can caused by the multifactorial including predisposing
factors, enabling factors and reinforcing factors. Predisposing factors consist of age, gender,
history of child labor, the amount of pocket money, education and occupation of father, the attitude
of children towards smoking and their knowledge about the dangers of smoking. Enabling Factors
that influencing children to consume cigarettes are the cigarette availability and affordability of
cigarettes. Reinforcing factors of children‘s smoking behavior are the influence of peers, family
smoking behavior and where their member of family are usually smoking. This factors be able to
influence the child to imitate and decided to start smoking (Green, 1991).
Thera are many reasons for children to start smoking. According to the Department of Health
(2006), thera are four main reasons that cause children to start smoking: (1) the child's curiosity
about cigarettes, (2) children's perception of maturity is synonymous with smoking, (3) exposure to
cigarette advertising in various media wich often become sponsors in a variety of sports events,
and (4) the pressure of the peers group, especially smoking is the requirement of a friendship
social environment. Many reserachs shows that the influence of peers as the most dominant
influence to encourage children to start smoking primarily especially if by best friend (Wulandari,
2005). Peers have greater strength for the children to decide smoking than teir parents (Ennet and
Bauman, 1994). Research from the Health and Walfare shows the results that children children
who have friends smoker risk 7 times more likely to be smokers than children who do not have
friends of smokers in their social environment (Van Roosemalen and Mc. Daniel, 1992).
Research on cigarette consumption, particularly in drop out children is very essential not only
have an impact on the problem of improving educational opportunities for children's intellectual but
70
Public Health Department, Faculty of Sports Science, F1 Building, 2nd
Floor, Sekaran Campus Gunungpati, Semarang City, Central Java Province, Indonesia, 50229 Phone/ Fax. +6224 8508007
also about the health status of the children in the future. The long-term effects of smoking behavior
in childhood will determine the quality of Indonesian human resources.
This research needs to be done also considering the proportion of the drop out children is
still high and to collect information about this data is difficult enough. The availability of data are
often not in accordance with the real data. This study differs from the others study cigarette
consumption because of this research done on shellter that used as a special palce that provides
non-formal education for drop outchildren in Jabal Thariq‘s Shelter in Subang. All of children in
child-care shelter to be given education during the period of approximately 2 months. The purpose
of this program in the shelter is to reduce the number of child laborers.
Unfortunately, smoking behavior in the shelter is very free both inside and outside the
shelter. There is no smoking prohibition in Children‘s Shelter and effect the shelter becomes
smoke-filled area. Furthermore, interaction among friends in the shelter may be a risk to exposure
smoking behavior. Another thing, there is no supervision of smoking behavior from the child
facilitator during the program at shelter. Shelter‘s program focusing on formal education and non-
formal debriefing, but does not provide education for clean and healthy behavior to improve the
health of children. Subang, is a agriculturala region with urban and rural areas as one of the region
that accounted for the biggest nutritional problem in Indonesia, particularly child undernutrition
(BPS, Subang 2010).
The objective of this reasearch was to analyze the most dominant factor related to smoking
behavior of drop out children in Jabal Thariq Children‘s Shelter in Subang. The results of this study
are expected to be one of the considerations of clan and healthy behavior education which can be
applied in the program. Other expectations are the application of Non-Smoking Area in Jabal
Thariq Children‘s sehlter. Early prevention efforts can be performed on non smokers children not to
bcome smoker. It can also prevent the influence of peers to provide smoking behavior exposure
Methods
This research was conducted of drop out children in Jabal Tariq Children‘s shelter in Subang
using cross-sectional study design (cross-sectional). The dependent variable is the smoking
behavior of drop out children, and independent variables are age, sex, history of child labor, the
amount of pocket money, education and occupation of father, children‘s attitude towards smoking
and their knowledge about the dangers of smoking as a predisposing factor, for enabling factors
that availability and affordability of cigarette smoking and reinforcing factors include peers
influence, smoking behavior of family including places where family members usually smoked.
Children‘s shelter in Subang contained in two main locations, one of which is Jabal Tariq
Thariq as a biggest shelter which consists of several shelters. Drop out childrens in this shelter
come from all over the Subang region which combination from urban and rural areas were
collected by the Department of Labor and Transmigration in Subang during for approximately 2
months, from April to May in 2013.
Public Health Department, Faculty of Sports Science, F1 Building, 2nd
Floor, Sekaran Campus Gunungpati, Semarang City, Central Java Province, Indonesia, 50229 Phone/ Fax. +6224 8508007
71
The population in this study are all of the drop out childrens who are given education by
department of labor and transmigration in Jabal Thariq Children‘s Shelter in Subang-West Java,
Indonesia, aged 11-19 years, totaled 80 children. But, the small number of children do not take
part until program completion because many reasons such as felt home sick, visit their parents
who were ill, and became seriously ill and had to be treated in hospital. Therefore, the number of
children to be sampled only 70 children were taken with a total sampling technique.
The data collection includes primary and secondary data. Primary data consists of the
smoking behavior that collect by interview using systematic questionnaire. This variable assessed
based on question ―does the child smoke?‖ and answer options consisting of: (1) yes, smoking, (2)
had never smoked, (3) never smoking. Next, if children includid in the smoking category, to asses
the smoker classification used Brinkman Index that calculated based on a formula: the average
number of number of cigarettes smoked daily x smoking duration (years). From this results,
smokers classified are: (1) light smokers, consume 0-199 cigarettes, (2) cigarette smokers are
taking 200-599 cigarettes, and (3) heavy smokers, consume ≥600 cigarettes.
Another primary data that is characteristic of childrens are age and gender, a history of child
labor, the amount of pocket money, children's attitudes toward smoking and children's knowledge
about the dangers of smoking, cigarette availability and affordability of cigarette prices and
reinforcing factors include the influence of peers, family smoking behavior and place where usually
a family member smoking were also collected by interview using a questionnaire tool. Before the
questionnaire used in this reserach, validity and reliability tests performed as the first step in the
use of questionnaires. Questionnaire was valid if the r calculate value > r table value and also
reliable if Cronbach alpha value > r table value (Hastono, 2007). Variable of father's education and
father's occupation also assesed directly as primarily data which checking with secondary data
from the data department of labor and transmigration in Subang region. Secondary data collected
includes drop out childrens characteristics and their family characteristics, Jabal Thariq Children‘s
Shelter and Subang-West Java profiles.
The stages of data processing includes data editing, data coding, data entry and data
cleaning and then the data were analyzed using univariate, bivariate and multivariate analyzes.
Multivariate analysis was to analyze the most dominant variable related to smoking behavior as
depnden variables. Multivariate analysis with predictive modeling using logistic regression analysis
(95% CI).
Results and Discussion
Data analysis of this research includes univariate, bivariate and multivariate. The results of
the data analysis are as follows:
Univariate analysis
Shelter is free smoking area, not only children can smoke everywhere in shelter but also the
most of facilitators can smoke in that place. The proportion of drop out childrens who smoke as
72
Public Health Department, Faculty of Sports Science, F1 Building, 2nd
Floor, Sekaran Campus Gunungpati, Semarang City, Central Java Province, Indonesia, 50229 Phone/ Fax. +6224 8508007
many as 41.4% (light smokers categories based on Brinkman Index classification), and more than
half child smokers are boys. Average consumption is 3-6 cigarettes per day with a minimum
number of cigarettes is one sticks of cigarettes and 12 cigarettes maximum per day. Nearly 42%
children admitted to smoke because of their peers which trial and error reason generally. They
calimed that smoking is an absolute requirement for friendship between them and showed their
maturity. However, from 41.4% children who smoke, only 14.3% admitted that they smoking
because of the peers compulsion.
The proportion of boys less than 45%. Most of the children aged ≥14 years old (>70%) with
the average age is 15 years (range of age is 11-19 years). About 72.9% said that they dropout at
the age of ≤13 year. The number of children who had worked as many as 41.4%. The types of their
works are factory workers, waitress, become a nanny in the household, helping their parents to
sell in the traditional market or shop, and help their parents to farm. Several children also had
become beggars on the streets. Their parents expectations that they children can support their
economics. This condition is caused by their father‘s low education level (88,6%) with the
proportion of elementary level about 70%. Their father‘s occupation are work as farmers mostly.
Another reason if they got the money, they can continue their school, but evetually they stop
working because of low wages, overload of body capacity and excessive working time, and work
underpressure.
Nearly 62% of the children said that they can bought cigarettes easily. In general, available
they bought in a shop near their house or in the street vendors or hawkers. Childrens who had
rejected when buying cigarettes no more than 5% because they are still under age. According to
their opinion, cigarette prices quit affordable, because they bought with retailing only 1-2 sticks.
The amount of their pocket money an average of 8000 rupiahs per day (with the lowest 1000 -
15.000 rupiahs per day). The children who smoked usan used their money to bougth cigarettes an
average is 3000 rupiahs per day.
Nearly half of the children had a negative attitude towards smoking. About 66% of children
had a good knowledge about the dangers of cigarettes. Children who received tobacco advertising
exposure frequency >10 times per day as much as 28.6%. As much as 81.4% of children said that
their family members who smoke especially their father and more than half their family members
smoking in the house about 55.7% (Table 1).
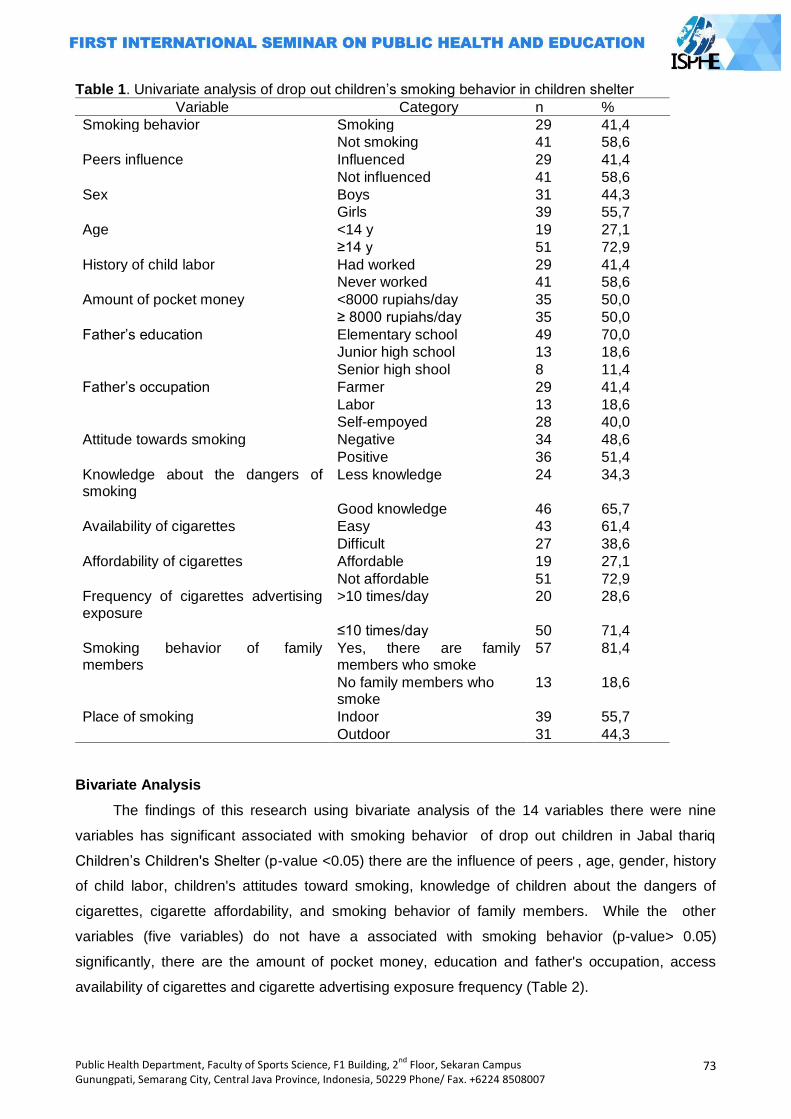
Public Health Department, Faculty of Sports Science, F1 Building, 2nd
Floor, Sekaran Campus Gunungpati, Semarang City, Central Java Province, Indonesia, 50229 Phone/ Fax. +6224 8508007
73
Table 1. Univariate analysis of drop out children‘s smoking behavior in children shelter
Variable Category n %
Smoking behavior Smoking 29 41,4
Not smoking 41 58,6
Peers influence Influenced 29 41,4
Not influenced 41 58,6
Sex Boys 31 44,3
Girls 39 55,7
Age <14 y 19 27,1
≥14 y 51 72,9
History of child labor Had worked 29 41,4
Never worked 41 58,6
Amount of pocket money <8000 rupiahs/day 35 50,0
≥ 8000 rupiahs/day 35 50,0
Father‘s education Elementary school 49 70,0
Junior high school 13 18,6
Senior high shool 8 11,4
Father‘s occupation Farmer 29 41,4
Labor 13 18,6
Self-empoyed 28 40,0
Attitude towards smoking Negative 34 48,6
Positive 36 51,4
Knowledge about the dangers of smoking
Less knowledge 24 34,3
Good knowledge 46 65,7
Availability of cigarettes Easy 43 61,4
Difficult 27 38,6
Affordability of cigarettes Affordable 19 27,1
Not affordable 51 72,9
Frequency of cigarettes advertising exposure
>10 times/day 20 28,6
≤10 times/day 50 71,4
Smoking behavior of family members
Yes, there are family members who smoke
57 81,4
No family members who smoke
13 18,6
Place of smoking Indoor 39 55,7
Outdoor 31 44,3
Bivariate Analysis
The findings of this research using bivariate analysis of the 14 variables there were nine
variables has significant associated with smoking behavior of drop out children in Jabal thariq
Children‘s Children's Shelter (p-value <0.05) there are the influence of peers , age, gender, history
of child labor, children's attitudes toward smoking, knowledge of children about the dangers of
cigarettes, cigarette affordability, and smoking behavior of family members. While the other
variables (five variables) do not have a associated with smoking behavior (p-value> 0.05)
significantly, there are the amount of pocket money, education and father's occupation, access
availability of cigarettes and cigarette advertising exposure frequency (Table 2).
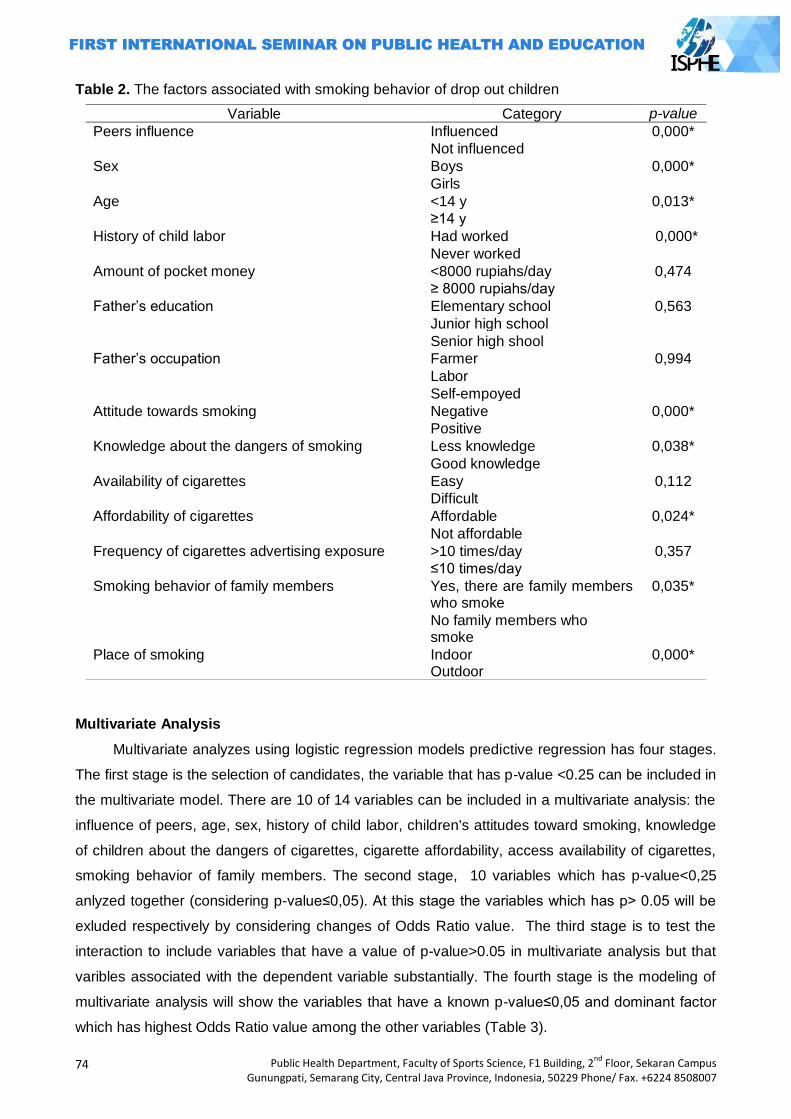
74
Public Health Department, Faculty of Sports Science, F1 Building, 2nd
Floor, Sekaran Campus Gunungpati, Semarang City, Central Java Province, Indonesia, 50229 Phone/ Fax. +6224 8508007
Table 2. The factors associated with smoking behavior of drop out children
Multivariate Analysis
Multivariate analyzes using logistic regression models predictive regression has four stages.
The first stage is the selection of candidates, the variable that has p-value <0.25 can be included in
the multivariate model. There are 10 of 14 variables can be included in a multivariate analysis: the
influence of peers, age, sex, history of child labor, children's attitudes toward smoking, knowledge
of children about the dangers of cigarettes, cigarette affordability, access availability of cigarettes,
smoking behavior of family members. The second stage, 10 variables which has p-value<0,25
anlyzed together (considering p-value≤0,05). At this stage the variables which has p> 0.05 will be
exluded respectively by considering changes of Odds Ratio value. The third stage is to test the
interaction to include variables that have a value of p-value>0.05 in multivariate analysis but that
varibles associated with the dependent variable substantially. The fourth stage is the modeling of
multivariate analysis will show the variables that have a known p-value≤0,05 and dominant factor
which has highest Odds Ratio value among the other variables (Table 3).
Variable Category p-value
Peers influence Influenced 0,000*
Not influenced
Sex Boys 0,000*
Girls
Age <14 y 0,013*
≥14 y
History of child labor Had worked 0,000*
Never worked
Amount of pocket money <8000 rupiahs/day 0,474
≥ 8000 rupiahs/day
Father‘s education Elementary school 0,563
Junior high school
Senior high shool
Father‘s occupation Farmer 0,994
Labor
Self-empoyed
Attitude towards smoking Negative 0,000*
Positive
Knowledge about the dangers of smoking Less knowledge 0,038*
Good knowledge
Availability of cigarettes Easy 0,112
Difficult
Affordability of cigarettes Affordable 0,024*
Not affordable
Frequency of cigarettes advertising exposure >10 times/day 0,357
≤10 times/day
Smoking behavior of family members Yes, there are family members who smoke
0,035*
No family members who smoke
Place of smoking Indoor Outdoor
0,000*
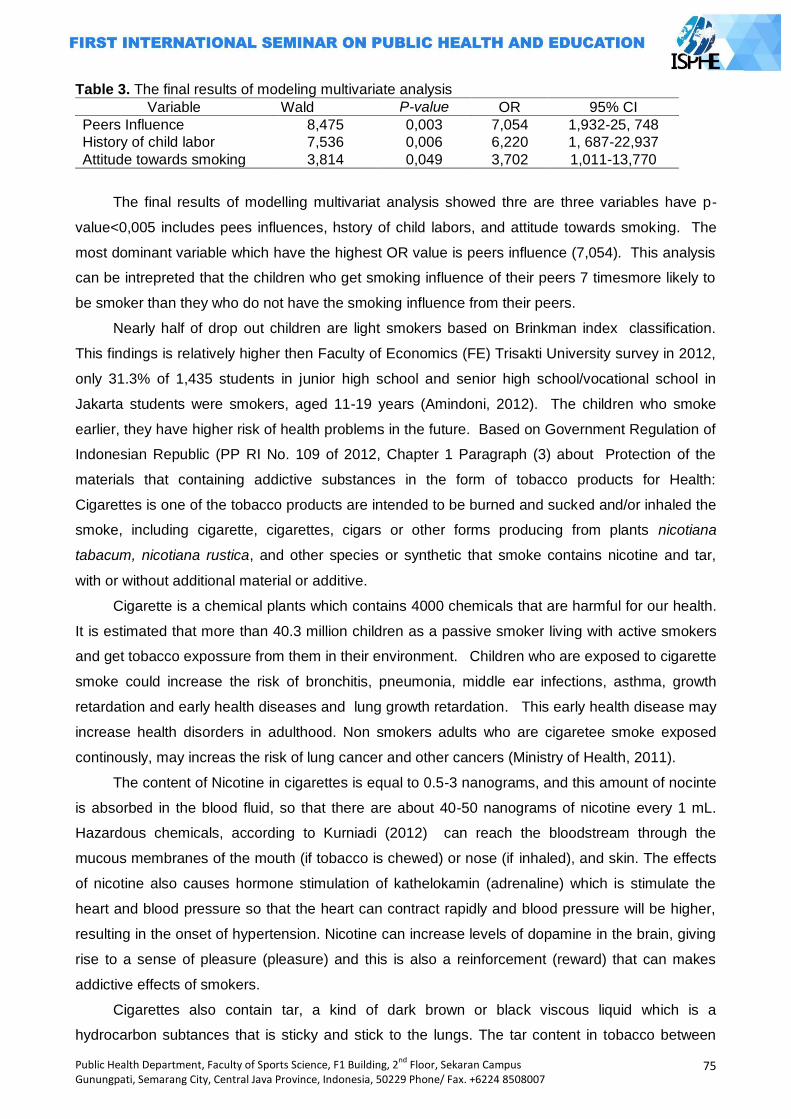
Public Health Department, Faculty of Sports Science, F1 Building, 2nd
Floor, Sekaran Campus Gunungpati, Semarang City, Central Java Province, Indonesia, 50229 Phone/ Fax. +6224 8508007
75
Table 3. The final results of modeling multivariate analysis
Variable Wald P-value OR 95% CI
Peers Influence 8,475 0,003 7,054 1,932-25, 748
History of child labor 7,536 0,006 6,220 1, 687-22,937
Attitude towards smoking 3,814 0,049 3,702 1,011-13,770
The final results of modelling multivariat analysis showed thre are three variables have p-
value<0,005 includes pees influences, hstory of child labors, and attitude towards smoking. The
most dominant variable which have the highest OR value is peers influence (7,054). This analysis
can be intrepreted that the children who get smoking influence of their peers 7 timesmore likely to
be smoker than they who do not have the smoking influence from their peers.
Nearly half of drop out children are light smokers based on Brinkman index classification.
This findings is relatively higher then Faculty of Economics (FE) Trisakti University survey in 2012,
only 31.3% of 1,435 students in junior high school and senior high school/vocational school in
Jakarta students were smokers, aged 11-19 years (Amindoni, 2012). The children who smoke
earlier, they have higher risk of health problems in the future. Based on Government Regulation of
Indonesian Republic (PP RI No. 109 of 2012, Chapter 1 Paragraph (3) about Protection of the
materials that containing addictive substances in the form of tobacco products for Health:
Cigarettes is one of the tobacco products are intended to be burned and sucked and/or inhaled the
smoke, including cigarette, cigarettes, cigars or other forms producing from plants nicotiana
tabacum, nicotiana rustica, and other species or synthetic that smoke contains nicotine and tar,
with or without additional material or additive.
Cigarette is a chemical plants which contains 4000 chemicals that are harmful for our health.
It is estimated that more than 40.3 million children as a passive smoker living with active smokers
and get tobacco expossure from them in their environment. Children who are exposed to cigarette
smoke could increase the risk of bronchitis, pneumonia, middle ear infections, asthma, growth
retardation and early health diseases and lung growth retardation. This early health disease may
increase health disorders in adulthood. Non smokers adults who are cigaretee smoke exposed
continously, may increas the risk of lung cancer and other cancers (Ministry of Health, 2011).
The content of Nicotine in cigarettes is equal to 0.5-3 nanograms, and this amount of nocinte
is absorbed in the blood fluid, so that there are about 40-50 nanograms of nicotine every 1 mL.
Hazardous chemicals, according to Kurniadi (2012) can reach the bloodstream through the
mucous membranes of the mouth (if tobacco is chewed) or nose (if inhaled), and skin. The effects
of nicotine also causes hormone stimulation of kathelokamin (adrenaline) which is stimulate the
heart and blood pressure so that the heart can contract rapidly and blood pressure will be higher,
resulting in the onset of hypertension. Nicotine can increase levels of dopamine in the brain, giving
rise to a sense of pleasure (pleasure) and this is also a reinforcement (reward) that can makes
addictive effects of smokers.
Cigarettes also contain tar, a kind of dark brown or black viscous liquid which is a
hydrocarbon subtances that is sticky and stick to the lungs. The tar content in tobacco between
76
Public Health Department, Faculty of Sports Science, F1 Building, 2nd
Floor, Sekaran Campus Gunungpati, Semarang City, Central Java Province, Indonesia, 50229 Phone/ Fax. +6224 8508007
0.5-35 mg/cigarette. Tar contains hundreds of chemicals that most are carcinogenic (Bustan,
2007). In addition to nicotine and tar containing in the cigarette, there are many other harmful
chemicals such as carbon monoxide, cadmium, cyanide, and others chemicals in cigarettes. In
consequence, the person who starts to smoke earlier, they have the higher content of chemicals
which accumulate in their body and may increas the risk of that person become worse also people
around them in the future. Furthermore, the effects of nicotine in the cigarette can causes the
children who smoke in the early age, may increase the risk of children to start smoking so that
they have a high dependence on cigarettes. This condition has an impact for them to stop
smoking more difficult and to be continued until adulthood and elderly. Those who have ever tried
smoking during the childhood will also be at risk of smoking in adulthood (Ministry of Health,
2011).
Smoking behavior in children is due to social encouragement from friends, family members
such as parents, brother, etc, and the mass media (Smet, 1994). The age range of 11-19 years
was transition period in various aspects such as the child's emotional transition, the transition in
socialization, religious transition, transition in relationship with the family, as well as transitions in
morality (Soetjiningsih, 2004). Smoking on some children are best option to indicate the existence
and degree of their maturity in social environment. This risk is may increas if they get
underpressure from social environmental sepecially smoking challenge from their peers (Ministry
of Health, 2006).
The findings of this results also showed that as many as 41.4% of children attained the
influence of their peers to smoke. In addition, this study also proves that the influence of peers
become the most dominant factor affecting drop out children to smoke. They are influenced by
their peers at risk seven times more likely to smoke than thosenot affected their peers. Smoking
for some children is a part of lifestyle and majority of the hildren who smoke in this study are boys.
The analysis results of this study are consistent with Fatah (2013) on the smoking behavior of SMK
Purnama I Jakarta students, that peers significantly influence the smoking behavior of students in
that school.
Health and walfare also shows the similar results with this study, that children who have a
friend of smoker have seven times the risk to becomes a smoker than children who do not have
friends of smokers in their social environment (Van Roosemalen and Mc. Daniel, 1992). The
children will attempt to have the same characteristics with their peer, especially with best friend.
Any differences with the average of their peers will cause anxiety and often arises because of
feeling unsafe and fear of rejection in relationships (Cahyaningsih, 2011).
Children who have dropped out of school may have a higher risk for smoking because they
have a wider time to interact with their friends, and be at increased risk if they become child
laborers. Not only from peers, but also smoking exposure form the work environment such as in
factories, restaurants, and other workplaces that most of even the majority of workers are also
smokers. The probablity of the children to buy cigarette higher than those who donot work because
Public Health Department, Faculty of Sports Science, F1 Building, 2nd
Floor, Sekaran Campus Gunungpati, Semarang City, Central Java Province, Indonesia, 50229 Phone/ Fax. +6224 8508007
77
they have enough money. This research also showed that children who had worked significantly
related to smoking behavior. Those who had worked at risk to smoke as much as 6.2 times greater
than children who never worked. Therefore, even though the child's knowledge about the dangers
of smoking have been well (65.7%), but does not preclude the child to try smoking (Wulandari,
2005). Moreover, Non-Smoking Area in the shelter is not applicable, so that the child can smoke
freely without supervision. Smokers in the shelter can easily affect their friends to try smoking.
About 14.3% children admitted that they forced their friends to smoke as a requirements of
friendship.
The results of this study also showed that children's attitudes toward smoking have
association with smoking behavior significantly. Based on multivariate analysis of this results,
children who have a positive attitude towards smoking 3.7 greater risk to smoke than children who
have negative attitudes toward cigarettes. The attitude is a readiness to react to certain objects in
the environment as an appreciation of the object. Attitude has three main components are: (1) trust
(belief), the idea and concept of an object, (2) emotional life or evaluation of an object, and (3) the
tendency to act (tend to behave). These three components establish a comprehensive attitude
(Notoatmodjo, 2007).
In this study, children's attitudes towards smoking variable consists of 10 statements which
consist of 5 (five) positive statements (such as the statement that not smoking is the human rights)
and five (5) negative statements (such as cigarettes can add a number of friends). Notoatmodjo
(2007) also outlines that attitude also has a level that is receiving (receiving), responding
(responding), respect (valuing), and responsible (responsible). Thus, if a child has a negative
attitude towards smoking, they will not to smoke. Health behaviors formed from the combiation of
knowledge and attitudes to achieve a clean and healthy behaviors for better health in the future.
Closing
In this research can be concluded that almost half of the number of drop out childrens as
many as 41.4% are smokers (light smokers category). Nearly half of total proportion also received
influence from peers to smoke, and they gets compulsion to smoke from their friends (14.3%). The
hypothesis in this study proved that the peer is the most dominant factor influencing the smoking
behavior (OR: 7, 054), the others variable which have strong signifacnt association are the history
of child labor variable (OR: 6.2) and variable children‘s attitudes toward smoking (OR: 3,7). OR
value in the most dominant variable is peers influence. It can be concluded that the children who
get smoking influence of their peers 7 timesmore likely to be smoker than they who do not have the
smoking influence from their peers.
Recommendations can be given based on the results of this study are the inclusion of health
education and practices for children, particularly regarding the Clean and Healthy Behaviors in the
shelter such as health education about the dangers of smoking. This recommendation expected to
increase the children‘s knowledge of cigarette consumption and encouraging children to behave
78
Public Health Department, Faculty of Sports Science, F1 Building, 2nd
Floor, Sekaran Campus Gunungpati, Semarang City, Central Java Province, Indonesia, 50229 Phone/ Fax. +6224 8508007
negatively towards cigarette consumption. It can be early prevention efforts so that children are not
affected by the environment, especially their peers to smoke.
Other suggestion are for organizers in this program especially for Labor and Transmigration
department in Subang should be cooperated with the Health Department can assign that shelter as
Non-Smoking Area, so that the shelter be a smoke-free place and a tool of health education to
realize clean and health behavior. Strict smoking supervision also needs to be done primarily by
the facilitator or the companion. Moreover, it can be applied sanctions for children who bring even
the cigarette smoke in the shelter. The best solutions are also to be given for children who are
smokers to stop smoking. For example through hypnotherapy to quit smoking. Further research on
smoking behavior shoul be done with different study design such as experimental studies to
determine the effect of health education intervention, particularly about smoking using pre and
post intervention.
Early education also needs to be given by all of the family who have the children. However,
childhood is a period of behavior imitating. Therefore, parents should be a good model for the
children, such as not smoking at home and surroundings. In addition, parents also play a role to
provide knowledge about the dangers of smoking and to supervise their children in order to avoid
the negative influence from the environment. People as a passive smokers must say No to people
who smoke in a private or public areas. The real sanctions against for cigarette manufacturers to
include a picture of the dangers of smoking cigarettes in packs need to be enforced.
In general, all of the sectors who responsible in preventing an increase in the number of
smokers in Indonesia needs cooperated. This effort is intended to reduce the number of children
suffering many dangerous diseases in the adulthood.
References
Amindoni, Ayomi. 2012. 31 Persen pelajar di Jakarta sandang predikat perokok. Jakarta. Diakses melalui http://www.metrotvnews.com/metronews/read/2013/02/13/3/130870/313-Persen-Pelajar-di-Jakarta-Sandang-Predikat-Perokok. [Diunduh 15 Desember 2013]
Badan Pusat Statistik Kabupaten Subang, 2011. Subang dalam angka. Bustan, M.N, 2007. Epidemiologi penyakit tidak menular. Jakarta: Rineka Cipta. Cahyaningsih, Dwi Sulistyo. 2011. Pertumbuhan perkembangan anak dan remaja. Jakarta: CV
Trans Info Media Departemen Kesehatan RI. 2006. Panduan Promosi Perilaku Tidak Merokok. Jakarta: Depkes RI. Dorotheo, Ulysses, Tan Yen Lian dan Bungon, Ritthiphakdee. 2008. The ASEAN Tobacco Control
Report Card. Bangkok: South East Tobacco Control Alliance. Ennett, Susan T.; Bauman, Karl E, 1994. The contribution of influence and selection to adolescent
peer group homogeneity: The case of adolescent cigarette smoking. Journal of Personality and Social Psychology, Vol 67(4), Oct 1994, 653-663 [Diakses Mei 17 Mei 2014]
Fatah, Rifki Abdul, 2013. Gambaran dan faktor-faktor yang berhubungan denganperilaku merokok pada remaja di SMK Purnama 1 Jakarta tahun 2013. Fakultas Kedokteran dan Kesehatan Universitas Muhammadiyah Jakarta.
Global Youth Tobacco Survey Collaborative Group. 2012. Global Youth Tobacco Survey (GYTS): Core Questionnaire with Optional Questions, Version 1.0.
Gondodiputro, S. 2007. Bahaya tembakau dan bentuk-bentuk sediaan tembakau. Bandung:
Bagian Ilmu Kesehatan Masyarakat Fakultas Kedokteran Universitas Padjajaran.
Public Health Department, Faculty of Sports Science, F1 Building, 2nd
Floor, Sekaran Campus Gunungpati, Semarang City, Central Java Province, Indonesia, 50229 Phone/ Fax. +6224 8508007
79
Green, W. Lawrence dan Marshall W. Kreuter. 1991. Health promotion planning: An educational and ecological approach. Third Edition. United States of America: Mayfield Publishing
Company. Hastono, Sutanto Priyo. 2007. Analisis Data Kesehatan. Depok: FKM UI. Hapsari, Dwi T, , Puti Sari H., Supraptini Supraptini, 2008. Hubungan perilaku merokok, aktivitas
fisik dan polusi udara indoor dengan penyakit asma pada usia ≥15 tahun (analisis data SUSENAS 2004 dan SKRT 2004). Media Penelitian dan Pengembangan Kesehatan, Vol 18 No 1 Maret 2008. [Diakses 20 Mei 2014)
Indonesia Global Youth Tobacco Survey 2009 (Fact Sheet). Kementerian Kesehatan RI. 2012. Merokok membahayakan kesehatan dan merugikan
perekonomian masyarakat. Media Release. Jakarta: Kemenkes RI. http://depkes.go.id/index.php/berita/press-release/2078-merokok-membahayakan-kesehatan-dan-merugikan-perekonomian-masyarakat.html [Diakses tanggal 15 Januari 2013
__________________________________, 2011. Pengembangan Kawasan Tanpa Rokok. __________________________________, 2010. Riset Kesehatan Dasar 2010. Jakarta Kurniadi, Hartati. 2012. ‗Perilaku merokok: kebiasaan atau ketergantungan?‘ dalam Hasbullah
Thabrany (ed.). Rokok, Mengapa Haram? Depok: Unit Pengendalian Tembakau FKM-UI Notoatmodjo, Soekidjo. 2007. Promosi kesehatan dan ilmu perilaku. Jakarta: Rineka Cipta. Nugraha, Ika, CA, 2010. Hubungan derajat berat merokok berdasarkan Indeks Brinkman
dengan derajat berat PPOK. Akper Patria Husada Surakarta.
Papalia, D.E, et al, 2004. Human development (9th.ed., international ed). New York:McGrow-Hill Peraturan Pemerintah Republik Indonesia Nomor 109 tahun 2012 tentang Pengamanan Bahan
yang Mengandung Zat Adiktif Berupa Produk Tembakau bagi Kesehatan. Smet, Bart. 1994. Psikologi kesehatan. Jakarta: PT Grasindo Soetjiningsih. 2004. Pertumbuhan somatik pada remaja. dalam Soetjiningsih (ed.). 2004. Tumbuh
Kembang Remaja dan Permasalahannya. Jakarta: CV Sagung Seto Van Roosmalen, E, McDaniel, SA, 1992. Adolescent smoking intentions: gender differences
in peer context. Pubmed.gov. Adolescence. 1992 Spring;27(105):87-105. [Diakses 10 April 2014].
World Health Organization. 2011. WHO Report on the Global Tobacco Epidemic. Wulandari, D, 2005. Adolescent smoking behavior: determinant of smoking in Indonesian
Adolescent. Jurnal Psikologi Kesehatan Universitas Paramadina, 3(3):1-29.
80
Public Health Department, Faculty of Sports Science, F1 Building, 2nd
Floor, Sekaran Campus Gunungpati, Semarang City, Central Java Province, Indonesia, 50229 Phone/ Fax. +6224 8508007
HEALTH NUMERACY: REQUIREMENT FOR PUBLIC HEALTH STUDENTS
Eti Rimawati1, Sri Handayani2
1 Dian Nuswantoro University, Indonesia 2 Diponegoro University, Indonesia
Corresponding Author: [email protected]
Abstract Introduction: One of the public health competency is capability to manage and planning of financial resource. Health numeracy is the degree to which individuals have the capacity to access, process, interpret, communicate and act on numerical, quantitative, graphical, statistical and probabilistic health information needed to make effective health decision. This study aimed to describe the numeracy level of public health students. Methods: Collecting data applied to 73 health students by filling the questionnaires, that taken by purposive sampling. The data analysis was used descriptive to describe the level of numeracy among the health students in Dian Nuswantoro University. Results: Most of their background education of senior high school were natural science (65, 7%), social science (20%), engineering (5,7%), linguistic (2,9%), pharmacy (2,9%) and accounting (2,9%). The highest level of health numeracy was Level 2, but only 24,7% reached Level 1, 64,6% in Entry Level 3; 9,6% in Level Entry 2 and 1,4% in Level Entry 1. Most of public health students which reached Level 1 came from natural science majors (77,8%) than others. They already have capability to understanding straight forward mathematical information, doing simple percentages or converting units of measure. Key Words: Numeracy, students, public health competence Introduction
Health Law No. 36/2009 established that; Medicals resources should be directed to
implement the Individual Health Efforts (UKP), and Public Health Efforts (SMEs). One of the critical
professions for the main task of SMEs, including the execution of tasks UKP in the field of
promotion and prevention is strategic profession of public health (Depkes RI, 2009).
Benchmarking results from the academic drafting team of public health profession stated that
basic science of public health sciences are framed by 5 sciences, namely; Biostatistics,
Epidemiology Environmental Health Sciences/occupational health, Administration and Health
Policy, Social and Behavioral Sciences. The profile of public health graduates are MIRACLE
(Manager, Innovator, Researcher, Apprenticer, Communitarian, Leader and Educator). Based on
that profile, the public health professional should have skill to analyze and assess the situation also
financial planning and Management Skills (Thaha, 2014). It can be concluded that numeracy skill is
needed to help the public health students to fulfill the public health competencies.
Numeracy is the ability to reason and to apply simple numerical concepts (Brooks, 2010).
Basic numeracy skills consist of comprehending fundamental mathematics such as addition,
subtraction, multiplication, and division. For example, if one can understand simple mathematical
equations such as, 2 + 2 = 4, then one would be considered possessing at least basic numeric
knowledge. Substantial aspects of numeracy also include number sense, operation sense,
Public Health Department, Faculty of Sports Science, F1 Building, 2nd
Floor, Sekaran Campus Gunungpati, Semarang City, Central Java Province, Indonesia, 50229 Phone/ Fax. +6224 8508007
81
computation, measurement, geometry, probability and statistics. A numerically literate person can
manage and respond to the mathematical demands of life (Statistic Canada).
The previous research showed low numeracy was also associated with greater susceptibility
to extraneous factors (i.e., factors that do not change the objective numerical information). That is,
low numeracy increases susceptibility to effects of mood or how information is presented (e.g., as
frequencies vs. percentages) and to biases in judgment and decision making (e.g., framing and
ratio bias effects) (Reyna et al., 2009).
Health numeracy defined as those skills needed to understand quantitative health
information. Since adults with limited literacy or numeracy skill or both are likely to have limited
functional skills. It influence to carry out the health recommendation, one‘s behavioral choices, as
well as one‘s understanding and application of oftentimes complex pieces of health related
information (Marks, 2012).
Health numeracy is degree to which individuals have the capacity to access, process,
interpret, communicate and act on numerical, quantitative, graphical, statistical and probabilistic
health information needed to make effective health decision (Donelle et al., 2007). The concept of
health numeracy is a part of the concept of health literacy. Health numeracy and health literacy are
the combination of skills needed for understanding risk and making good choices in health-related
behavior.
As candidate of public health officer, the public health students should have numeracy skill to
support their competence to manage the public health problems, perform the diagnosis,
investigation, and surveillance to plan, implementing and monitoring programs of health effectively.
This research aimed to describe numeracy level of public health students and their
demographic characteristic background.
Methods
The study design: the research was design to describe demographic characteristics i.e.: sex,
age, background of senior high school and numeracy questions. It used survey method to gain the
information and designed as case study that it aimed to explain the uniqe features of health
numeracy among public health student in Dian Nuswantoro University.
Data collection techniques and data sources: the data collection used standardized
instrument ―Numeracy Initial Assessment‖ which developed by Skill for Health
(www.skillforhealth.org.uk). There were 25 questions were distributed to the participants and
should be answered in 30 minutes. The participants were 73 public health students which taken
purposive sampling, by criteria: public health students in 2nd semester and has presence minimal
50% in class.
Statistical Analysis: all the questions are worth 1 mark. And to determine the level at which
the user is working: (http://www.nationalnumeracy.org.uk).
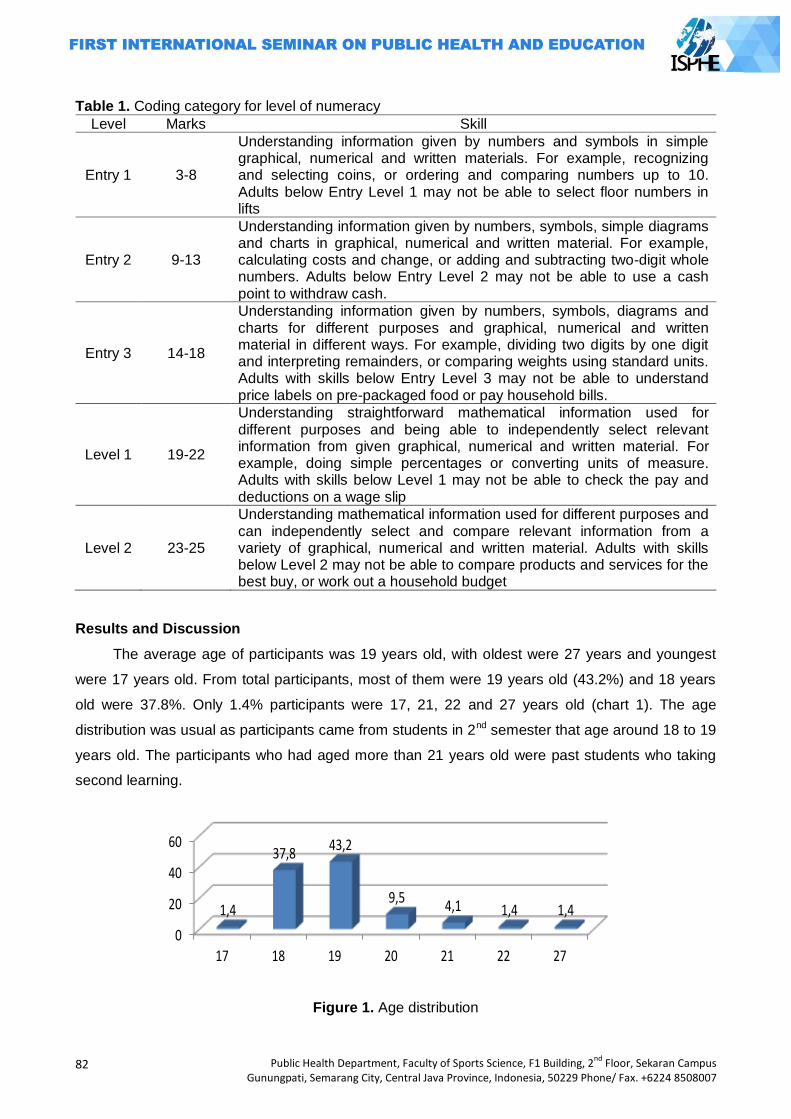
82
Public Health Department, Faculty of Sports Science, F1 Building, 2nd
Floor, Sekaran Campus Gunungpati, Semarang City, Central Java Province, Indonesia, 50229 Phone/ Fax. +6224 8508007
Table 1. Coding category for level of numeracy
Level Marks Skill
Entry 1 3-8
Understanding information given by numbers and symbols in simple graphical, numerical and written materials. For example, recognizing and selecting coins, or ordering and comparing numbers up to 10. Adults below Entry Level 1 may not be able to select floor numbers in lifts
Entry 2 9-13
Understanding information given by numbers, symbols, simple diagrams and charts in graphical, numerical and written material. For example, calculating costs and change, or adding and subtracting two-digit whole numbers. Adults below Entry Level 2 may not be able to use a cash point to withdraw cash.
Entry 3 14-18
Understanding information given by numbers, symbols, diagrams and charts for different purposes and graphical, numerical and written material in different ways. For example, dividing two digits by one digit and interpreting remainders, or comparing weights using standard units. Adults with skills below Entry Level 3 may not be able to understand price labels on pre-packaged food or pay household bills.
Level 1 19-22
Understanding straightforward mathematical information used for different purposes and being able to independently select relevant information from given graphical, numerical and written material. For example, doing simple percentages or converting units of measure. Adults with skills below Level 1 may not be able to check the pay and deductions on a wage slip
Level 2 23-25
Understanding mathematical information used for different purposes and can independently select and compare relevant information from a variety of graphical, numerical and written material. Adults with skills below Level 2 may not be able to compare products and services for the best buy, or work out a household budget
Results and Discussion
The average age of participants was 19 years old, with oldest were 27 years and youngest
were 17 years old. From total participants, most of them were 19 years old (43.2%) and 18 years
old were 37.8%. Only 1.4% participants were 17, 21, 22 and 27 years old (chart 1). The age
distribution was usual as participants came from students in 2nd semester that age around 18 to 19
years old. The participants who had aged more than 21 years old were past students who taking
second learning.
0
20
40
60
17 18 19 20 21 22 27
1,4
37,843,2
9,54,1 1,4 1,4
Chart 1. Age Distribution
Figure 1. Age distribution
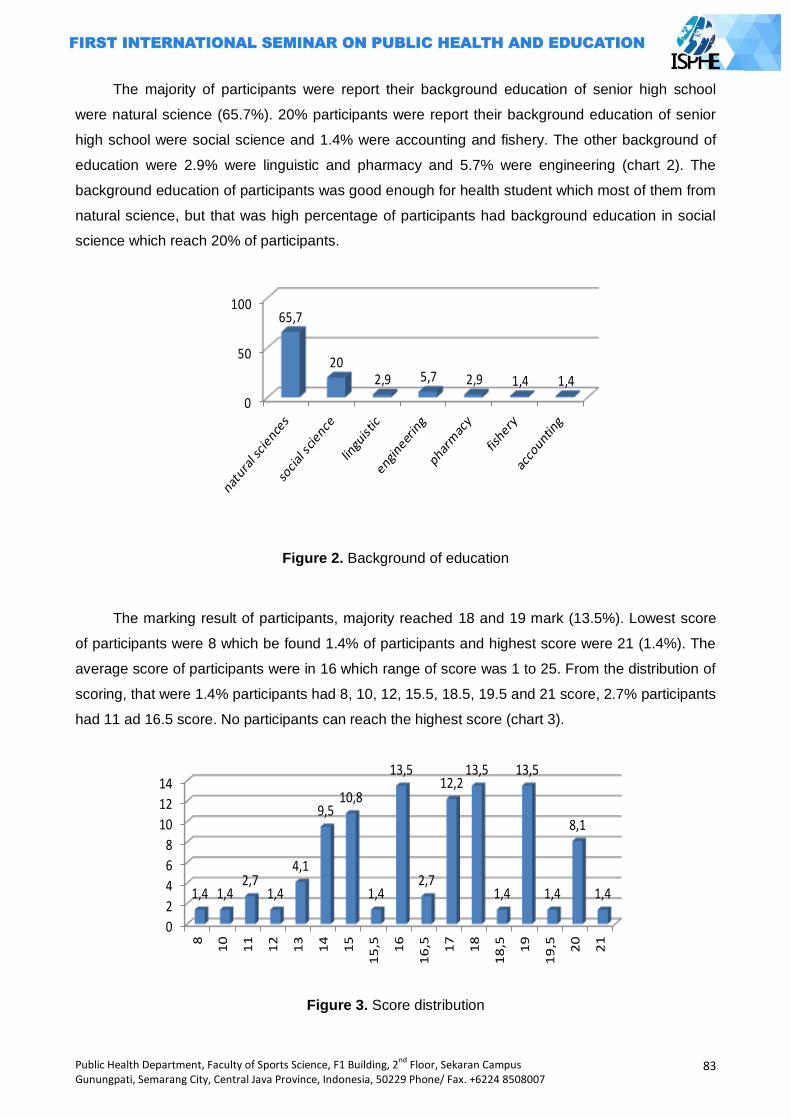
Public Health Department, Faculty of Sports Science, F1 Building, 2nd
Floor, Sekaran Campus Gunungpati, Semarang City, Central Java Province, Indonesia, 50229 Phone/ Fax. +6224 8508007
83
The majority of participants were report their background education of senior high school
were natural science (65.7%). 20% participants were report their background education of senior
high school were social science and 1.4% were accounting and fishery. The other background of
education were 2.9% were linguistic and pharmacy and 5.7% were engineering (chart 2). The
background education of participants was good enough for health student which most of them from
natural science, but that was high percentage of participants had background education in social
science which reach 20% of participants.
0
50
10065,7
202,9 5,7 2,9 1,4 1,4
Chart 2. Background of Education
Figure 2. Background of education
The marking result of participants, majority reached 18 and 19 mark (13.5%). Lowest score
of participants were 8 which be found 1.4% of participants and highest score were 21 (1.4%). The
average score of participants were in 16 which range of score was 1 to 25. From the distribution of
scoring, that were 1.4% participants had 8, 10, 12, 15.5, 18.5, 19.5 and 21 score, 2.7% participants
had 11 ad 16.5 score. No participants can reach the highest score (chart 3).
0
2
4
6
8
10
12
14
8
10
11
12
13
14
15
15
,5 16
16
,5 17
18
18
,5 19
19
,5 20
21
1,4 1,42,7
1,4
4,1
9,510,8
1,4
13,5
2,7
12,213,5
1,4
13,5
1,4
8,1
1,4
Chart 3. Score Distribution
Figure 3. Score distribution
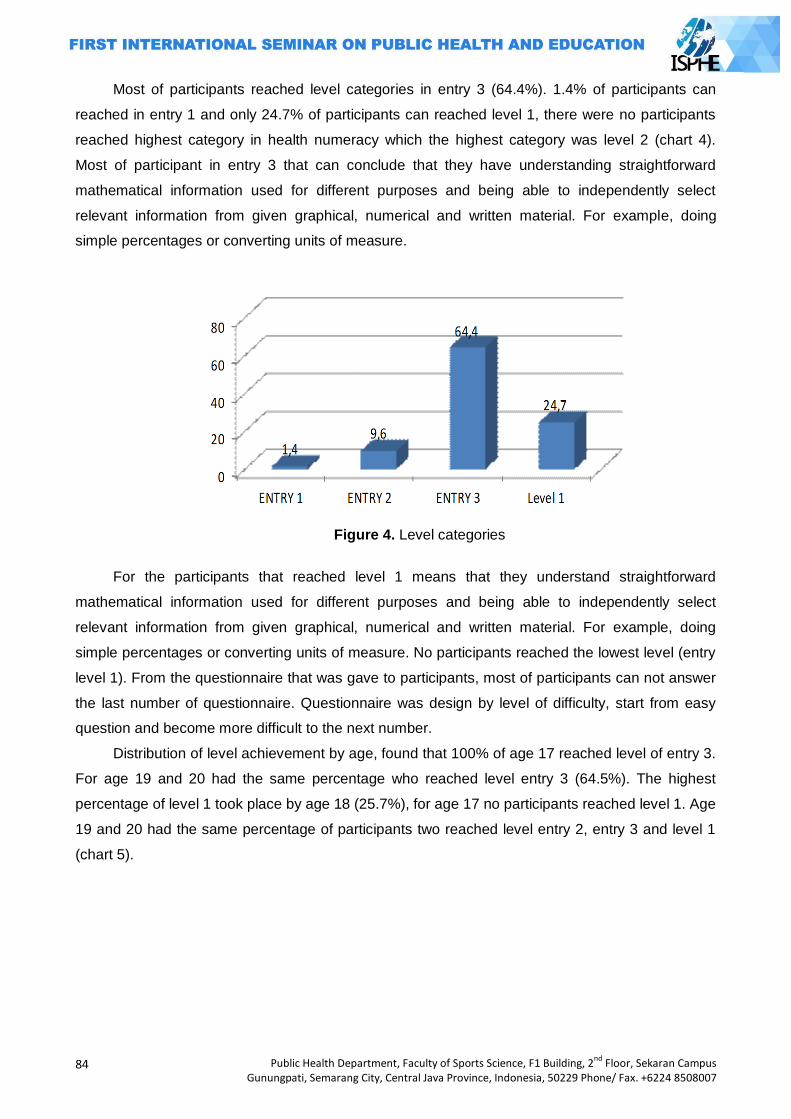
84
Public Health Department, Faculty of Sports Science, F1 Building, 2nd
Floor, Sekaran Campus Gunungpati, Semarang City, Central Java Province, Indonesia, 50229 Phone/ Fax. +6224 8508007
Most of participants reached level categories in entry 3 (64.4%). 1.4% of participants can
reached in entry 1 and only 24.7% of participants can reached level 1, there were no participants
reached highest category in health numeracy which the highest category was level 2 (chart 4).
Most of participant in entry 3 that can conclude that they have understanding straightforward
mathematical information used for different purposes and being able to independently select
relevant information from given graphical, numerical and written material. For example, doing
simple percentages or converting units of measure.
Figure 4. Level categories
For the participants that reached level 1 means that they understand straightforward
mathematical information used for different purposes and being able to independently select
relevant information from given graphical, numerical and written material. For example, doing
simple percentages or converting units of measure. No participants reached the lowest level (entry
level 1). From the questionnaire that was gave to participants, most of participants can not answer
the last number of questionnaire. Questionnaire was design by level of difficulty, start from easy
question and become more difficult to the next number.
Distribution of level achievement by age, found that 100% of age 17 reached level of entry 3.
For age 19 and 20 had the same percentage who reached level entry 3 (64.5%). The highest
percentage of level 1 took place by age 18 (25.7%), for age 17 no participants reached level 1. Age
19 and 20 had the same percentage of participants two reached level entry 2, entry 3 and level 1
(chart 5).
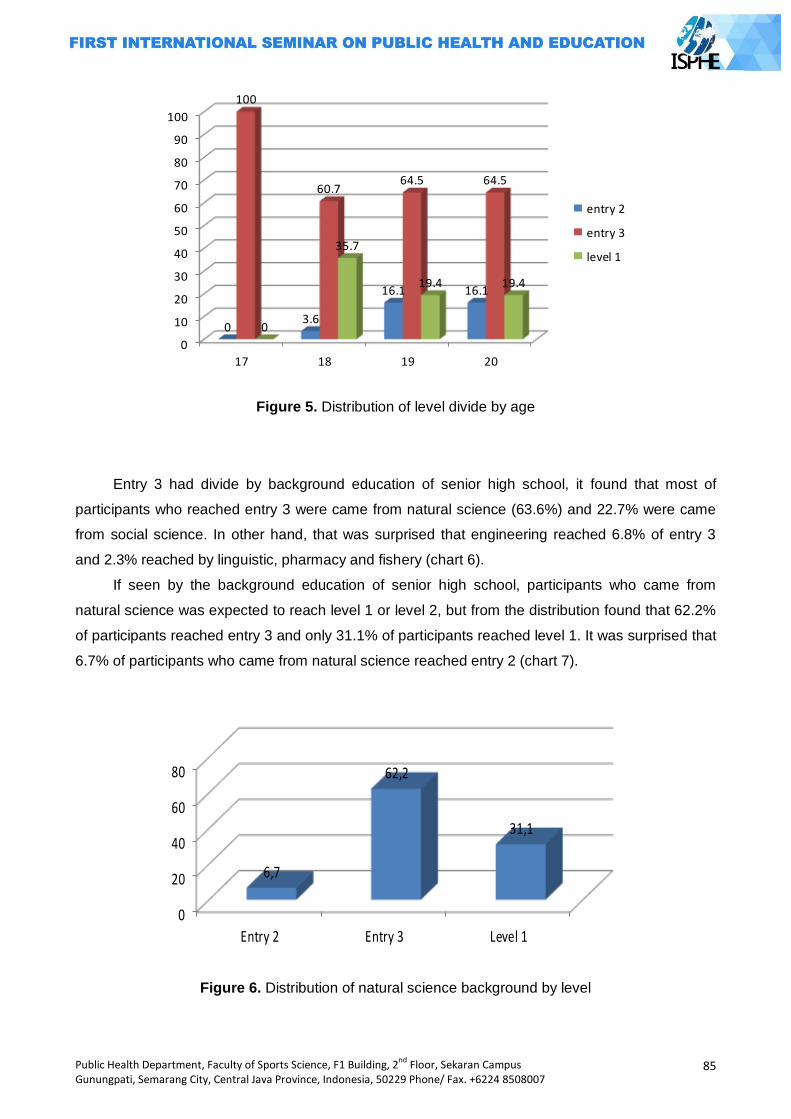
Public Health Department, Faculty of Sports Science, F1 Building, 2nd
Floor, Sekaran Campus Gunungpati, Semarang City, Central Java Province, Indonesia, 50229 Phone/ Fax. +6224 8508007
85
0
10
20
30
40
50
60
70
80
90
100
17 18 19 20
03.6
16.1 16.1
100
60.764.5 64.5
0
35.7
19.4 19.4
entry 2
entry 3
level 1
Figure 5. Distribution of level divide by age
Entry 3 had divide by background education of senior high school, it found that most of
participants who reached entry 3 were came from natural science (63.6%) and 22.7% were came
from social science. In other hand, that was surprised that engineering reached 6.8% of entry 3
and 2.3% reached by linguistic, pharmacy and fishery (chart 6).
If seen by the background education of senior high school, participants who came from
natural science was expected to reach level 1 or level 2, but from the distribution found that 62.2%
of participants reached entry 3 and only 31.1% of participants reached level 1. It was surprised that
6.7% of participants who came from natural science reached entry 2 (chart 7).
0
20
40
60
80
Entry 2 Entry 3 Level 1
6,7
62,2
31,1
Chart 7. Distribution of Natural Science Background by Level
Figure 6. Distribution of natural science background by level
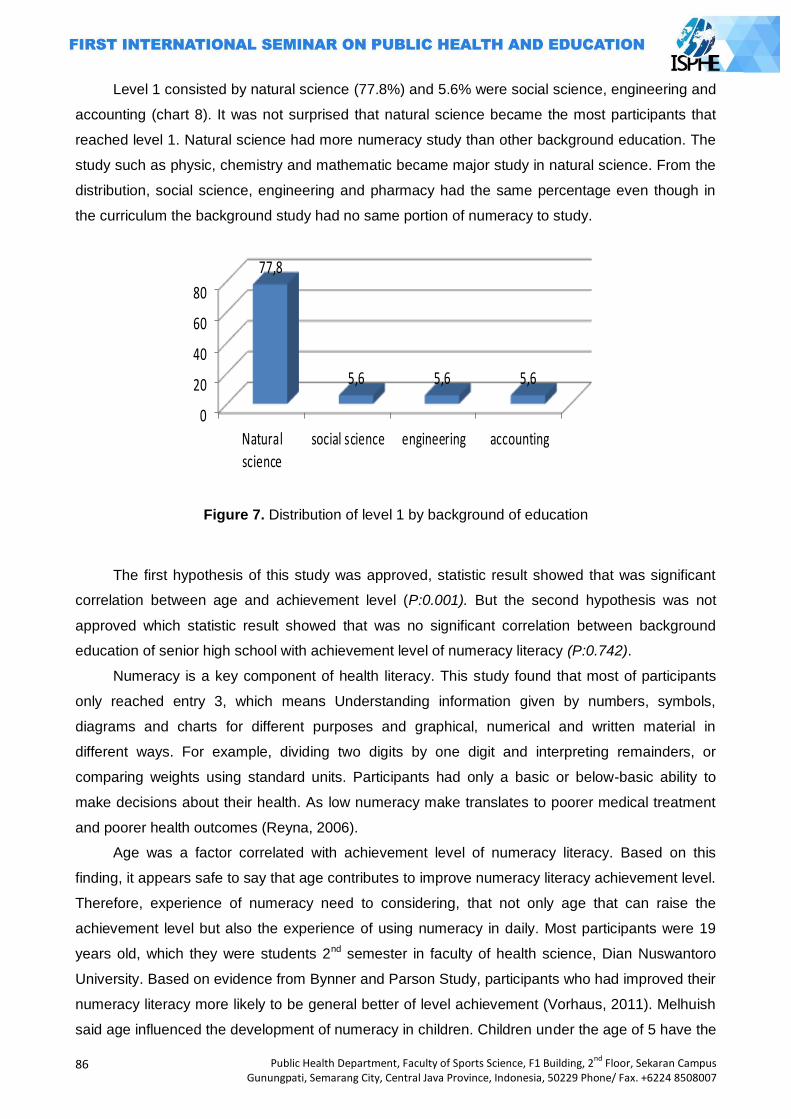
86
Public Health Department, Faculty of Sports Science, F1 Building, 2nd
Floor, Sekaran Campus Gunungpati, Semarang City, Central Java Province, Indonesia, 50229 Phone/ Fax. +6224 8508007
Level 1 consisted by natural science (77.8%) and 5.6% were social science, engineering and
accounting (chart 8). It was not surprised that natural science became the most participants that
reached level 1. Natural science had more numeracy study than other background education. The
study such as physic, chemistry and mathematic became major study in natural science. From the
distribution, social science, engineering and pharmacy had the same percentage even though in
the curriculum the background study had no same portion of numeracy to study.
0
20
40
60
80
Natural
science
social science engineering accounting
77,8
5,6 5,6 5,6
Chart 8. Distribution of Level 1 by Background of Education
Figure 7. Distribution of level 1 by background of education
The first hypothesis of this study was approved, statistic result showed that was significant
correlation between age and achievement level (P:0.001). But the second hypothesis was not
approved which statistic result showed that was no significant correlation between background
education of senior high school with achievement level of numeracy literacy (P:0.742).
Numeracy is a key component of health literacy. This study found that most of participants
only reached entry 3, which means Understanding information given by numbers, symbols,
diagrams and charts for different purposes and graphical, numerical and written material in
different ways. For example, dividing two digits by one digit and interpreting remainders, or
comparing weights using standard units. Participants had only a basic or below-basic ability to
make decisions about their health. As low numeracy make translates to poorer medical treatment
and poorer health outcomes (Reyna, 2006).
Age was a factor correlated with achievement level of numeracy literacy. Based on this
finding, it appears safe to say that age contributes to improve numeracy literacy achievement level.
Therefore, experience of numeracy need to considering, that not only age that can raise the
achievement level but also the experience of using numeracy in daily. Most participants were 19
years old, which they were students 2nd semester in faculty of health science, Dian Nuswantoro
University. Based on evidence from Bynner and Parson Study, participants who had improved their
numeracy literacy more likely to be general better of level achievement (Vorhaus, 2011). Melhuish
said age influenced the development of numeracy in children. Children under the age of 5 have the
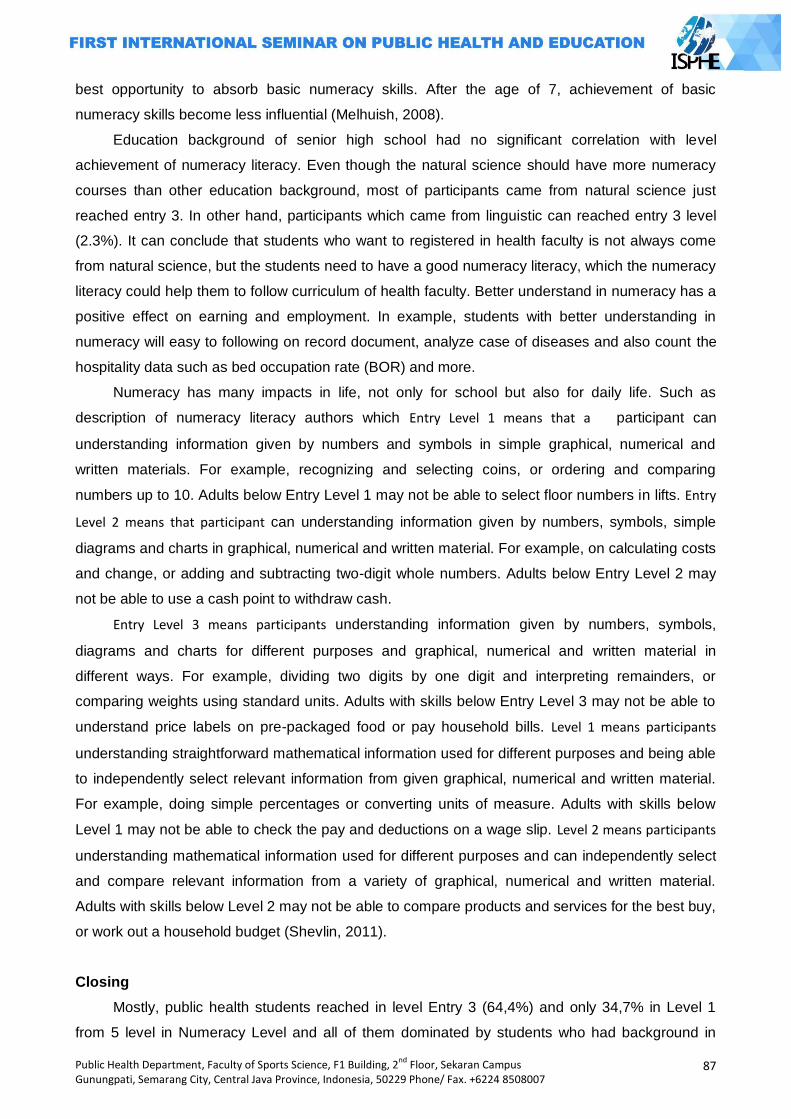
Public Health Department, Faculty of Sports Science, F1 Building, 2nd
Floor, Sekaran Campus Gunungpati, Semarang City, Central Java Province, Indonesia, 50229 Phone/ Fax. +6224 8508007
87
best opportunity to absorb basic numeracy skills. After the age of 7, achievement of basic
numeracy skills become less influential (Melhuish, 2008).
Education background of senior high school had no significant correlation with level
achievement of numeracy literacy. Even though the natural science should have more numeracy
courses than other education background, most of participants came from natural science just
reached entry 3. In other hand, participants which came from linguistic can reached entry 3 level
(2.3%). It can conclude that students who want to registered in health faculty is not always come
from natural science, but the students need to have a good numeracy literacy, which the numeracy
literacy could help them to follow curriculum of health faculty. Better understand in numeracy has a
positive effect on earning and employment. In example, students with better understanding in
numeracy will easy to following on record document, analyze case of diseases and also count the
hospitality data such as bed occupation rate (BOR) and more.
Numeracy has many impacts in life, not only for school but also for daily life. Such as
description of numeracy literacy authors which Entry Level 1 means that a participant can
understanding information given by numbers and symbols in simple graphical, numerical and
written materials. For example, recognizing and selecting coins, or ordering and comparing
numbers up to 10. Adults below Entry Level 1 may not be able to select floor numbers in lifts. Entry
Level 2 means that participant can understanding information given by numbers, symbols, simple
diagrams and charts in graphical, numerical and written material. For example, on calculating costs
and change, or adding and subtracting two-digit whole numbers. Adults below Entry Level 2 may
not be able to use a cash point to withdraw cash.
Entry Level 3 means participants understanding information given by numbers, symbols,
diagrams and charts for different purposes and graphical, numerical and written material in
different ways. For example, dividing two digits by one digit and interpreting remainders, or
comparing weights using standard units. Adults with skills below Entry Level 3 may not be able to
understand price labels on pre-packaged food or pay household bills. Level 1 means participants
understanding straightforward mathematical information used for different purposes and being able
to independently select relevant information from given graphical, numerical and written material.
For example, doing simple percentages or converting units of measure. Adults with skills below
Level 1 may not be able to check the pay and deductions on a wage slip. Level 2 means participants
understanding mathematical information used for different purposes and can independently select
and compare relevant information from a variety of graphical, numerical and written material.
Adults with skills below Level 2 may not be able to compare products and services for the best buy,
or work out a household budget (Shevlin, 2011).
Closing
Mostly, public health students reached in level Entry 3 (64,4%) and only 34,7% in Level 1
from 5 level in Numeracy Level and all of them dominated by students who had background in
88
Public Health Department, Faculty of Sports Science, F1 Building, 2nd
Floor, Sekaran Campus Gunungpati, Semarang City, Central Java Province, Indonesia, 50229 Phone/ Fax. +6224 8508007
natural science. As a candidate of public health professional they already have skill for
understanding information given by numbers, symbols, diagrams and charts for different purposes
and graphical, numerical and written material in different ways. But to gain the public health
competency, the public health students should have capability in Level 2 which has skill to
understand mathematical information used for arranges health budget/financial planning. Learning
with whole numbers in each course could help students closer and familiar with numeracy and
essential to improve health numeracy skill.
References
Brooks, M; Pui. 2010. "Are individual differences in numeracy unique from general mental ability? A closer look at a common measure of numeracy." Individual Differences Research. 4 8: 257–
265. Depkes RI.2009. UU No.36 tahun 2009 tentang Kesehatan. Depkes RI. Jakarta Donelle, L.; Hoffman-Goetz, L.; Arocha, J. F. 2007. "Assessing health numeracy among
community-dwelling older adults". Journal of Health Communication. 7 12: 651–665. doi:10.1080/10810730701619919
Marks, Ray. 2012. Health Literacy: What is it ans Why Should We Care? Health Literacy and School Based Health Educatioan. Emerald Group Publishing Limited, UK
Melhuish, Edward C.; Phan, Mai B.; Sylva, Kathy; Sammons, Pam; Siraj-Blatchford, Iram; Taggart, Brenda (2008). "Effects of the Home Learning Environment and Preschool Center Experience upon Literacy and Numeracy Development in Early Primary School". Journal of Social Issues 64 (1): 95–114.
Reyna, V. 2006. Numeracy and Health: Helping Americans Do the Math. Research report, Department of Human Development, Cornell University.
Reyna, Valerie F.; Nelson, Wendy L.; Han, Paul K.; Dieckmann, Nathan F. 2009. How numeracy influences risk comprehension and medical decision making. Psychological Bulletin, Vol 135(6), Nov 2009, 943-973. doi: 10.1037/a0017327
Shevlin, L. 2011. Developing literacy and numeracy for safe, effective healthcare. Skills for Health Statistics Canada. "Building on our Competencies: Canadian Results of the International Adult
Literacy and Skills Survey". Statistics Canada. p. 209. Thaha, Ridwan. 2014. Naskah Akademik Pendidikan Kesehatan Masyarakat. Paper was
presented at the Seminar Kapasitasi Pendididikan Kesehatan Masyarakat. FKM UI Depok. May 12-16.
Vorhaus, J & Lister, J.2011. Review of research and evaluation on improving adult literacy and numeracy skills. Research report, BIS: Department for Business Innovation & Skills.
Public Health Department, Faculty of Sports Science, F1 Building, 2nd
Floor, Sekaran Campus Gunungpati, Semarang City, Central Java Province, Indonesia, 50229 Phone/ Fax. +6224 8508007
89
INFLAMMATION IS ASSOCIATED WITH THE HYPOADIPONECTINEMA AND ELEVATED BLOOD PRESSURE IN MALE CENTRAL OBESE YOUNG ADULTS
Frans Wantania1, Karel Pandelaki1
1 Sam Ratulangi University, Indonesia
Corresponding Author: [email protected]
Abstract Introduction: Inflammation in obesity may increase adult‘s blood pressure whereas its effect on adolescent‘s or young adult‘s blood pressure has not been widely studied. Adiponectin is the one of antiinflammatory cytokines in human body but its level is influenced by fat tissue on human body particularly in abdomen. Aim of this study is to investigate association of Hypoadiponectinemia with the inflammation and elevated blood pressure in male central obese young adults. Methods: Fifty-nine central obese and non central obese young adults (<30 years old) with no history of diabetes were recruited in this cross-sectional study. Plasma adiponectin and TNF alpha level were measured with radioimmunoassay and blood pressure measurement was taken 2 times using the standard digital blood pressure measurement in the hospital. Results: Plasma TNF alpha level, reflecting inflammation, was higher in central obese group as compare to non central obese group (2,655+2,62 pg/ml vs 0,721+0,22 pg/ml p<0,01). Most of hypoadiponectin group developed hypertension or prehypertension (60%) compare to 20% in normal adiponectin group. In Hypoadiponectinemia group, plasma TNF alpha level was higher than normoadiponectin group (3,3817+3,25 pg/ml vs 1,6899+0,809 pg/ml; p<0,05) and correlates positively to both sistolic (Spearman Coeff R=0,584, p<0,01) and diastolic blood pressure (Spearman Coeff R=0,688, p<0,01). Key Words: Adiponectin, inflammation, blood pressure, central obese
Introduction
Obesity is the epidemic of the 21st century. In developing countries, the prevalence of
obesity continues to rise, and obesity is occuring at younger ages. The WHO estimates that
globally there are more than 1 billion overweight adults, > 300 million of whom are
obese.(Greenberg, 2006) This conditions are associated with chronic inflammatory responses
characterized by abnormal cytokine production, increased acute-phase reactants, and activation of
inflammatory signaling pathways (Wellen, 2003).
An important consequence of adipose cell enlargement is the development of local
inflammation in the adipose tissue with infiltration of monocytes/ macrophages. In addition,
adipose cell enlargement leads to increased secretion of cytokines and chemokines, which in turn
attract monocytes/ macrophages into the tissue. Obesity-associated inflammation leads to highly
dysregulated adipose tissue impairs the differentiation of preadipocytes, reduces adiponectin
secretion, and promotes a proinflammatory state, which in turn further promotes the local secretion
of cytokines and chemokines (Isakson, 2009).
In obese people, adipose tissues are characterized by inflammation and progressive
infiltration by macrophages as obesity developes (Wellen KE, 2003). Macrophages are responsible
for most of the cytokine production in obese adipose tissue. In fact, adipose tissue macrophages
90
Public Health Department, Faculty of Sports Science, F1 Building, 2nd
Floor, Sekaran Campus Gunungpati, Semarang City, Central Java Province, Indonesia, 50229 Phone/ Fax. +6224 8508007
are responsible for almost all adipose tissue TNF-alpha expression and significant amounts of IL-6
and inducible nitric oxide synthase expression. Of particular note, Xu et al reported that the
increased expression of inflammation-specific genes by macrophages in the adipose tissue of
obese mice preceded a dramatic increase in insulin production. Furthermore, when those mice
were treated with rosiglitazone, an insulin-sensitizing drug, the expression of these genes declined.
Thus, the chronological appearance of these inflammatory molecules before the development of
insulin resistance, as well as their known ability to promote insulin resistance and other
complications of obesity, strongly suggests adipose tissue inflammation as an important
protagonist in the development of obesity-related complications. Inflammation is thought to
contribute to the development of the sequelae of obesity. Certain cytokines are thought to reduce
adiponectin expression (Greenberg, 2006).
Adiponectin, a hormone also known as adipoQ or adipocyte complement-related protein, is
specifically and very highly expressed in adipose tissue (Scherer PE, 1995). This hormone
enhances insulin sensitivity in muscle and liver and increases FFA oxidation in several tissues,
including muscle fibers. It also decreases serum FFA, glucose, and triacylglycerol concentrations:
if normal, lean mice are given injections of adiponectin in conjunction with a meal high in fat and
sugar, the normal postprandial increases in plasma glucose, FFA, and triacylglycerol
concentrations are smaller as the result of an increased rate of clearance from the blood rather
than a reduced rate of absorption from the gut. In humans, plasma adiponectin concentrations fall
with increasing obesity, and this effect is greater in men than in women (Arita, 1999).
Adiponectin is the one of antiinflammatory cytokines in human body but its level is influenced
by fat tissue on human body particularly in abdomen (Hajer GR, 2008). Several in-vitro studies
have demonstrated that adiponectin has anti-inflammatory and anti-atherosclerotic actions that
include reducing expression of adhesion molecules on endothelial cells and increasing NO
production (Xi W, 2005). The circulating levels of adiponectin are approximately one thousand-fold
higher than other adipocytokines and hormones. This disparity implies that over and above its
central role in glucose and lipid homeostasis, adiponectin may also protect the vascular
endothelium from injury. In obesity, adiponectin level is decreased secondarily to TNF-alpha‘s
action (Berg, 2002).
Among cardiovascular risk factors, arterial hypertension, an established major risk factor for
coronary artery disease, has been suggested to exert pro-inflammatory actions through the
increased expression of several mediators, including leukocyte adhesion molecules, chemokines,
specific growth factors, heat shock proteins, endothelin- 1, and angiotensin. Direct relationship
between treatment-induced blood pressure reduction and decrease in some circulating
inflammatory markers further confirms hypertension as a potentially pro-inflammatory condition (Li
and Chen, 2005).
A possible link between inflammation and elevated blood pressure has been suggested by
several cross-sectional and longitudinal studies. Possible mechanisms include an imbalance
Public Health Department, Faculty of Sports Science, F1 Building, 2nd
Floor, Sekaran Campus Gunungpati, Semarang City, Central Java Province, Indonesia, 50229 Phone/ Fax. +6224 8508007
91
between vasoconstrictors and vasodilators, amplified thrombogenesis and platelet activation, and
perhaps a direct effect of inflammatory mediators (Ghanem, 2007).
The associations between inflammation and elevated blood pressure have also been
observed in prehypertensive individuals (systolic blood pressure ranging from 120 to 139 mm Hg
and/or diastolic blood pressure of 80 to 89 mm Hg). Compared with normotensives,
prehypertensives exhibited higher levels of inflammatory markers like CRP, white blood cells, IL-6,
TNF alpha, amyloid-a, homocysteine, and fibrinogen (Chrysohoou, 2004).
Obesity results in a proinflammatory state starting in the metabolic cells (adipocyte,
hepatocyte, or myocyte) and also recruiting immune cells with the consequent release of
inflammatory cytokines (TNF-α, IL-6, adiponectin, etc.). It has been hypothesized that the obesity-
induced inflammatory process may lead to complications such as hypertension, atherosclerosis,
dyslipidaemia, insulin resistance, and diabetes mellitus (Emanuela, 2012).
Aim of this study is to investigate association of Hypoadiponectinemia with the inflammation
and elevated blood pressure in male central obese young adults.
Methods
The study was performed as a cross-sectional survey on youth male with the age of 16-30
years. The sample were selected in students of Senior High School in Manado and students in
Internal Medicine Department, Medical Faculty, Sam Ratulangi University Manado, that had waist
circumferences of >90 cm. Sampling was carried out until the required number was sufficient. The
sampling data consistent of age, blood pressure, waist cirfumference, body weight, Tumor
Necrosis Factor Alpha (TNF-alpha), and adiponectin level. Laboratory examination was done at
Parasitology Clinical Laboratory, Faculty of Medicine, Sam Ratulangi University, Manado after
subjects signed the informed consent.
Fifty-nine abdominal obesity and non abdominal obesity subjects with no history and
laboratory finding (fasting blood sugar < 100 mg/dL) of diabetes were recruited consecutively in
this cross-sectional study. Abdominal obesity is determined if Waist Circumferences > 90 cm.
The concentrations of Tumor Necrosis Factor alpha level in blood serum were measured by using
a commercially available highly sensitive ELISA kit. Plasma adiponectin concentration was
determined by using the ELISA kit. Brachial blood pressure was measurement by after at least 30
minutes of rest in the supine position and the average of 2 recording was used. Hypertension if
blood pressure > 140/90 mmHg.
The data were shown as the mean + SD. All statistical analyses were performed using the
SPSS. Spearman correlation analysis was used to test the correlation between TNF-alpha and
both sistolic and diastolic blood pressure. Mann Whitney test was used to see the TNF-alpha‘s
mean differences between central obese group and non obese.
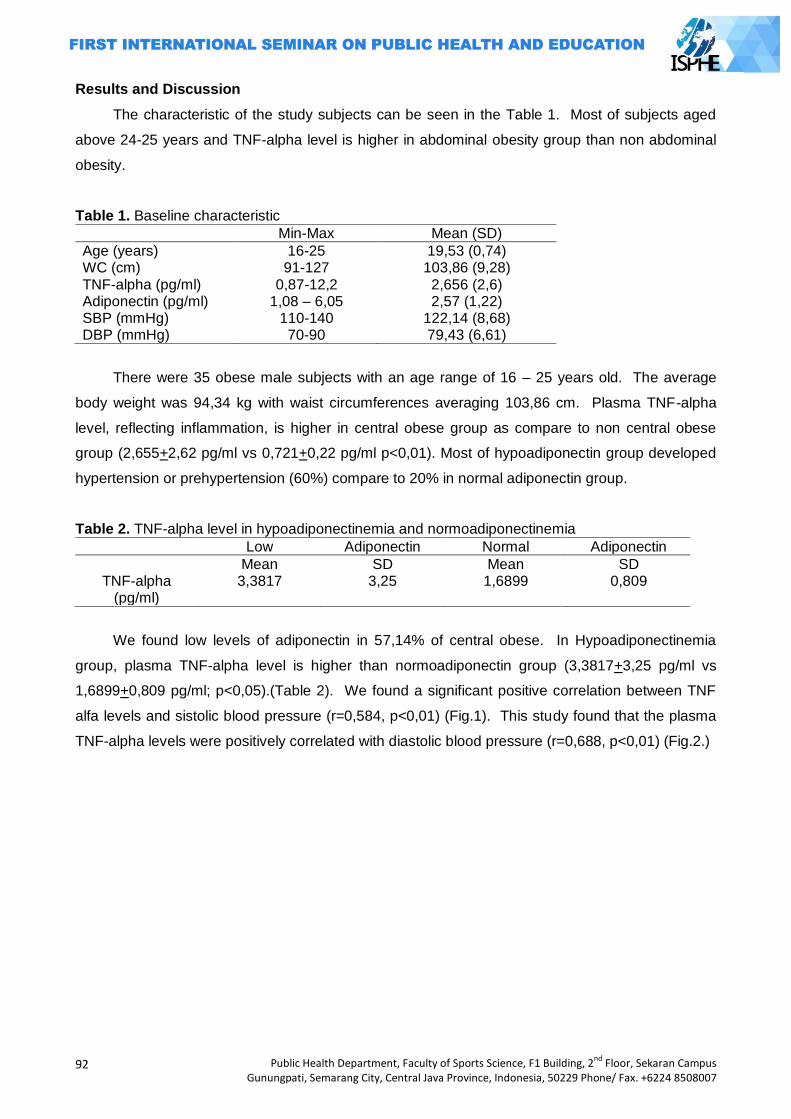
92
Public Health Department, Faculty of Sports Science, F1 Building, 2nd
Floor, Sekaran Campus Gunungpati, Semarang City, Central Java Province, Indonesia, 50229 Phone/ Fax. +6224 8508007
Results and Discussion
The characteristic of the study subjects can be seen in the Table 1. Most of subjects aged
above 24-25 years and TNF-alpha level is higher in abdominal obesity group than non abdominal
obesity.
Table 1. Baseline characteristic
Min-Max Mean (SD)
Age (years) WC (cm) TNF-alpha (pg/ml) Adiponectin (pg/ml) SBP (mmHg) DBP (mmHg)
16-25 91-127
0,87-12,2 1,08 – 6,05
110-140 70-90
19,53 (0,74) 103,86 (9,28) 2,656 (2,6) 2,57 (1,22)
122,14 (8,68) 79,43 (6,61)
There were 35 obese male subjects with an age range of 16 – 25 years old. The average
body weight was 94,34 kg with waist circumferences averaging 103,86 cm. Plasma TNF-alpha
level, reflecting inflammation, is higher in central obese group as compare to non central obese
group (2,655+2,62 pg/ml vs 0,721+0,22 pg/ml p<0,01). Most of hypoadiponectin group developed
hypertension or prehypertension (60%) compare to 20% in normal adiponectin group.
Table 2. TNF-alpha level in hypoadiponectinemia and normoadiponectinemia
Low Adiponectin Normal Adiponectin
Mean SD Mean SD TNF-alpha
(pg/ml) 3,3817 3,25 1,6899 0,809
We found low levels of adiponectin in 57,14% of central obese. In Hypoadiponectinemia
group, plasma TNF-alpha level is higher than normoadiponectin group (3,3817+3,25 pg/ml vs
1,6899+0,809 pg/ml; p<0,05).(Table 2). We found a significant positive correlation between TNF
alfa levels and sistolic blood pressure (r=0,584, p<0,01) (Fig.1). This study found that the plasma
TNF-alpha levels were positively correlated with diastolic blood pressure (r=0,688, p<0,01) (Fig.2.)
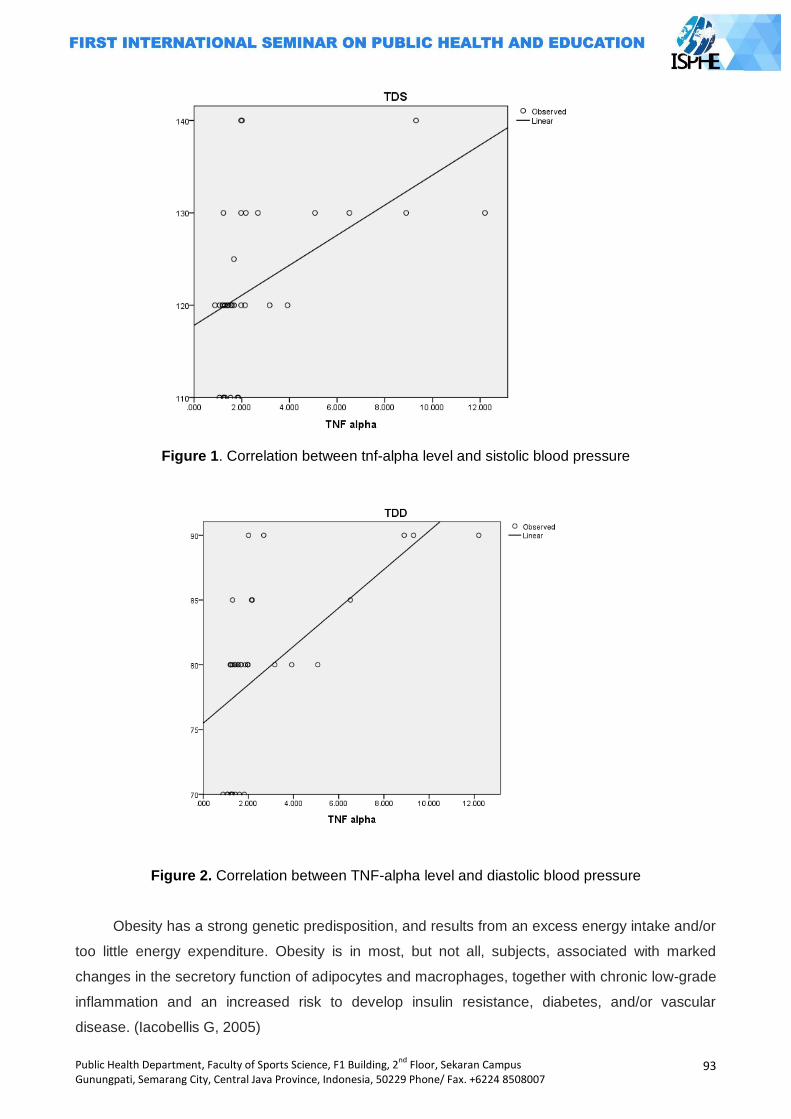
Public Health Department, Faculty of Sports Science, F1 Building, 2nd
Floor, Sekaran Campus Gunungpati, Semarang City, Central Java Province, Indonesia, 50229 Phone/ Fax. +6224 8508007
93
Figure 1. Correlation between tnf-alpha level and sistolic blood pressure
Figure 2. Correlation between TNF-alpha level and diastolic blood pressure
Obesity has a strong genetic predisposition, and results from an excess energy intake and/or
too little energy expenditure. Obesity is in most, but not all, subjects, associated with marked
changes in the secretory function of adipocytes and macrophages, together with chronic low-grade
inflammation and an increased risk to develop insulin resistance, diabetes, and/or vascular
disease. (Iacobellis G, 2005)
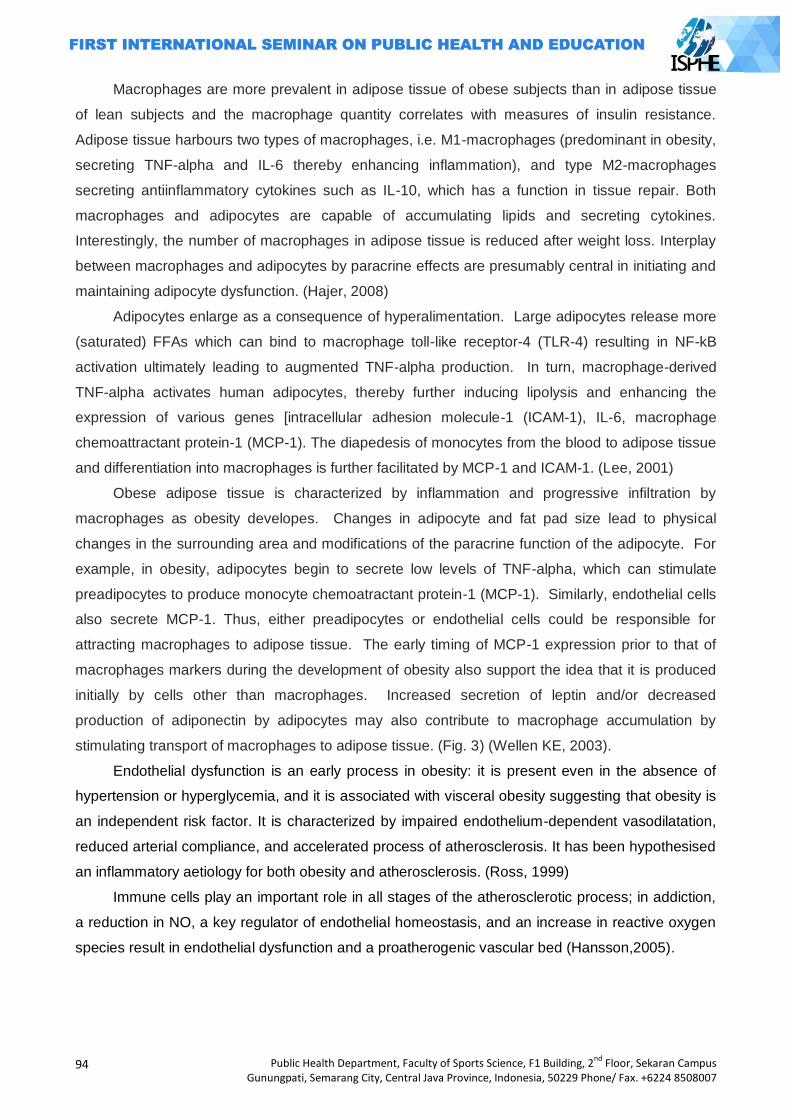
94
Public Health Department, Faculty of Sports Science, F1 Building, 2nd
Floor, Sekaran Campus Gunungpati, Semarang City, Central Java Province, Indonesia, 50229 Phone/ Fax. +6224 8508007
Macrophages are more prevalent in adipose tissue of obese subjects than in adipose tissue
of lean subjects and the macrophage quantity correlates with measures of insulin resistance.
Adipose tissue harbours two types of macrophages, i.e. M1-macrophages (predominant in obesity,
secreting TNF-alpha and IL-6 thereby enhancing inflammation), and type M2-macrophages
secreting antiinflammatory cytokines such as IL-10, which has a function in tissue repair. Both
macrophages and adipocytes are capable of accumulating lipids and secreting cytokines.
Interestingly, the number of macrophages in adipose tissue is reduced after weight loss. Interplay
between macrophages and adipocytes by paracrine effects are presumably central in initiating and
maintaining adipocyte dysfunction. (Hajer, 2008)
Adipocytes enlarge as a consequence of hyperalimentation. Large adipocytes release more
(saturated) FFAs which can bind to macrophage toll-like receptor-4 (TLR-4) resulting in NF-kB
activation ultimately leading to augmented TNF-alpha production. In turn, macrophage-derived
TNF-alpha activates human adipocytes, thereby further inducing lipolysis and enhancing the
expression of various genes [intracellular adhesion molecule-1 (ICAM-1), IL-6, macrophage
chemoattractant protein-1 (MCP-1). The diapedesis of monocytes from the blood to adipose tissue
and differentiation into macrophages is further facilitated by MCP-1 and ICAM-1. (Lee, 2001)
Obese adipose tissue is characterized by inflammation and progressive infiltration by
macrophages as obesity developes. Changes in adipocyte and fat pad size lead to physical
changes in the surrounding area and modifications of the paracrine function of the adipocyte. For
example, in obesity, adipocytes begin to secrete low levels of TNF-alpha, which can stimulate
preadipocytes to produce monocyte chemoatractant protein-1 (MCP-1). Similarly, endothelial cells
also secrete MCP-1. Thus, either preadipocytes or endothelial cells could be responsible for
attracting macrophages to adipose tissue. The early timing of MCP-1 expression prior to that of
macrophages markers during the development of obesity also support the idea that it is produced
initially by cells other than macrophages. Increased secretion of leptin and/or decreased
production of adiponectin by adipocytes may also contribute to macrophage accumulation by
stimulating transport of macrophages to adipose tissue. (Fig. 3) (Wellen KE, 2003).
Endothelial dysfunction is an early process in obesity: it is present even in the absence of
hypertension or hyperglycemia, and it is associated with visceral obesity suggesting that obesity is
an independent risk factor. It is characterized by impaired endothelium-dependent vasodilatation,
reduced arterial compliance, and accelerated process of atherosclerosis. It has been hypothesised
an inflammatory aetiology for both obesity and atherosclerosis. (Ross, 1999)
Immune cells play an important role in all stages of the atherosclerotic process; in addiction,
a reduction in NO, a key regulator of endothelial homeostasis, and an increase in reactive oxygen
species result in endothelial dysfunction and a proatherogenic vascular bed (Hansson,2005).
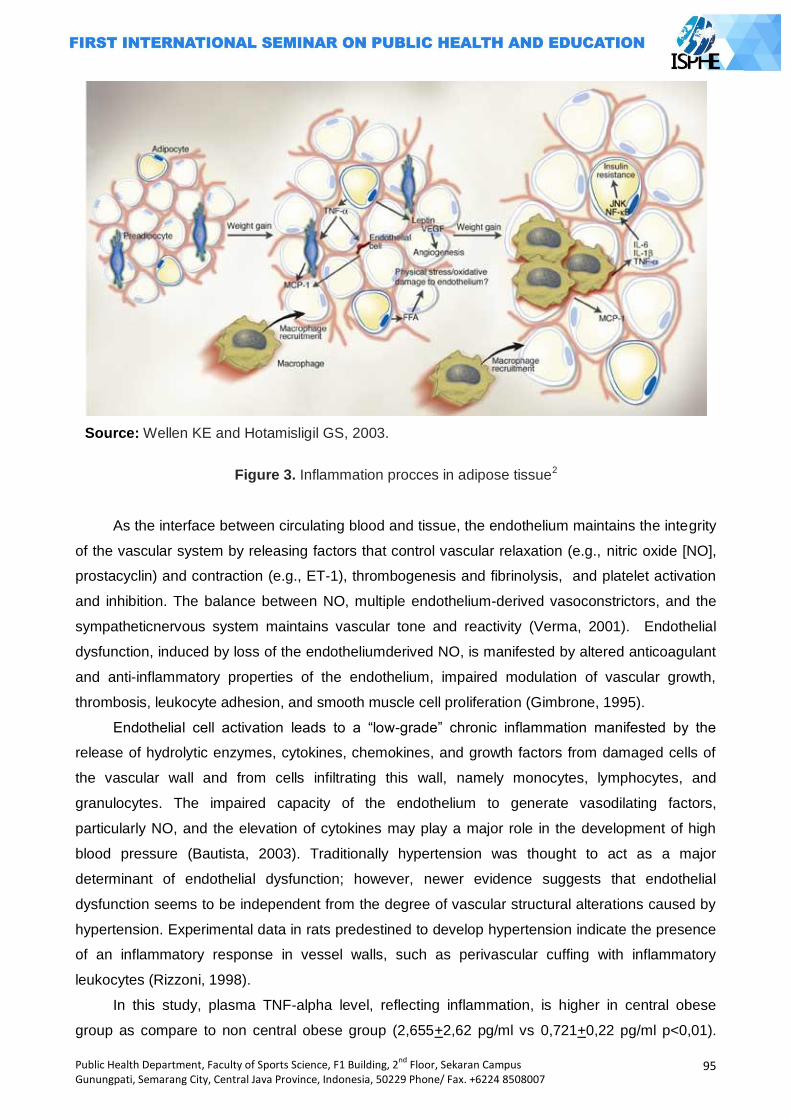
Public Health Department, Faculty of Sports Science, F1 Building, 2nd
Floor, Sekaran Campus Gunungpati, Semarang City, Central Java Province, Indonesia, 50229 Phone/ Fax. +6224 8508007
95
Source: Wellen KE and Hotamisligil GS, 2003.
Figure 3. Inflammation procces in adipose tissue2
As the interface between circulating blood and tissue, the endothelium maintains the integrity
of the vascular system by releasing factors that control vascular relaxation (e.g., nitric oxide [NO],
prostacyclin) and contraction (e.g., ET-1), thrombogenesis and fibrinolysis, and platelet activation
and inhibition. The balance between NO, multiple endothelium-derived vasoconstrictors, and the
sympatheticnervous system maintains vascular tone and reactivity (Verma, 2001). Endothelial
dysfunction, induced by loss of the endotheliumderived NO, is manifested by altered anticoagulant
and anti-inflammatory properties of the endothelium, impaired modulation of vascular growth,
thrombosis, leukocyte adhesion, and smooth muscle cell proliferation (Gimbrone, 1995).
Endothelial cell activation leads to a ―low-grade‖ chronic inflammation manifested by the
release of hydrolytic enzymes, cytokines, chemokines, and growth factors from damaged cells of
the vascular wall and from cells infiltrating this wall, namely monocytes, lymphocytes, and
granulocytes. The impaired capacity of the endothelium to generate vasodilating factors,
particularly NO, and the elevation of cytokines may play a major role in the development of high
blood pressure (Bautista, 2003). Traditionally hypertension was thought to act as a major
determinant of endothelial dysfunction; however, newer evidence suggests that endothelial
dysfunction seems to be independent from the degree of vascular structural alterations caused by
hypertension. Experimental data in rats predestined to develop hypertension indicate the presence
of an inflammatory response in vessel walls, such as perivascular cuffing with inflammatory
leukocytes (Rizzoni, 1998).
In this study, plasma TNF-alpha level, reflecting inflammation, is higher in central obese
group as compare to non central obese group (2,655+2,62 pg/ml vs 0,721+0,22 pg/ml p<0,01).
96
Public Health Department, Faculty of Sports Science, F1 Building, 2nd
Floor, Sekaran Campus Gunungpati, Semarang City, Central Java Province, Indonesia, 50229 Phone/ Fax. +6224 8508007
Previous studies reported the increased expression of the TNF-alpha mRNA in the adipose tissues
of obese rodents and in obese human subjects. (Hotamisligil, 1995) Body weight reduction in
obese subjects was associated with a decrease in TNF-alpha mRNA expression in fat tissues and
serum (Zahorska, 2000).
Previous study reported that serum adiponectin was decreased and TNF-alpha levels were
increased in obese Korean children. Their findings suggested that childhood obesity is associated
with inflammatory processes. (Shin, 2008) Our findings suggest that the same processes happen
in male central obese young adults. In obesity, adipocytes begin to secrete low levels of TNF-
alpha, which can stimulate preadipocytes to produce monocyte chemoattractant protein-1 (MCP-
1). In response to cytokine, endothelial cells also secrete MCP-1. Thus, either preadipocytes or
endothelial cells could be responsible for attracting macrophages to adipose tissue. (Hopkins,
2007) Once these cells are present and active, they along with adipocytes and other cell types,
could perpetuate a vicious cycle of macrophage recruitment, production of inflammatory cytokines,
and impairment of adipocyte function (Wellen, 2003).
We found low levels of adiponectin in 57,14% of central obese. In Hypoadiponectinemia
group, plasma TNF-alpha level is higher than normoadiponectin group (3,3817+3,25 pg/ml vs
1,6899+0,809 pg/ml; p<0,05) and correlates positively to both sistolic (r=0,584, p<0,01) and
diastolic blood pressure (r=0,688, p<0,01). Plasma levels of adiponectin in humans are
substantially high but it levels are negatively correlated with body mass index. (Matsuzawa, 2004)
Shin observed that serum adiponectin level was decreased in Korean obese children. (Shin, 2008)
Matsuzawa reported that TNF-alfa was a strong inhibitor of adiponectin promoter activity. The
negative correlation between visceral adiposity and adiponectin levels might be explained by the
increased secretion from the accumulated visceral fat. (Matsuzawa, 2004) Furukawa showed that
in nondiabetic human subjects, fat accumulation closely correlated with the markers of systemic
oxidative stress. They demonstrated that plasma adiponectin levels were correlated inversely with
systemic oxidative stress (Furukawa, 2004).
The precise mechanism by which inflammation leads to hypertension is unknown. However
our understanding of this highly complex process has increased in recent years, by recognising the
fundamental role of the endothelium in vascular homeostasis (Verma, 2002). Nonetheless, a
detailed treatise on the endothelium in hypertension is beyond the scope of this overview, and has
been the subject of recent reviews. Under physiological conditions, there is a balanced release of
relaxing and contracting factors. Endothelium dependent vasodilation is regulated primarily by NO,
but also by an endothelium-derived hyperpolarizing factor, prostacyclin (PGI2), as well as
acetylcholine and bradykinin acting on specific receptors, and finally, by mechanical forces, such
as shear stress (Spieker, 2000).
Endothelium-derived contracting factors include endothelin-1, vasoconstrictor prostanoids
(thromboxane A2 and prostaglandin H2), ang II and superoxide anions. Hypertension is caused by
an imbalance between the above mentioned endothelial derived. Under normal conditions NO
Public Health Department, Faculty of Sports Science, F1 Building, 2nd
Floor, Sekaran Campus Gunungpati, Semarang City, Central Java Province, Indonesia, 50229 Phone/ Fax. +6224 8508007
97
acts locally to prevent platelet and leucocyte aggregation and inhibits vascular smooth muscle cell
proliferation. Hence, reduced NO availability can radically shift the balance in favour of a
prothrombotic and inflammatory state, with increased vascular smooth muscle proliferation. We
know that inflammation leads to endothelial dysfunction and downregulation of eNOS, strongly
suggesting the importance of NO as a key factor linking inflammation to hypertension (Boos, 2006;
Ghanem, 2007).
Ouchi et al found that plasma adiponectin levels are correlated with an endothelial
vasodilation response. These results were confirmed in animal studies by showing that
adiponectin-deficient mice display impaired endothelium-dependent vasodilation and NO
production (Ouchi, 2003). The obesity-associated metabolic syndrome causes a decrease in the
expression and secretion of adiponectin. The dysregulated production of adiponectin may be one
of the critical factors mediating obesity-associated NO decrease, endothelial dysfunction, and
cardiovascular disease (Wang, 2008).
Adiponectin may play a role in the downregulation of inflammatory responses involving TNF
alfa. An inverse relationship has been shown to exist between TNF alfa and adiponectin. This
effect is bidirectional, that is, primary changes in TNF alfa can influence adiponectin concen
trations and vice versa. TNF alfa suppresses the expression and secretion of adiponectin from
murine and human adipocytes in cell cultures. Conversely, primary alterations in adiponectin result
in inverse correlation with TNF alfa. Adiponectin KO mice show high levels of TNF alfa mRNA in
adipose tissue and high plasma TNF alfa concentrations, with reversal of these changes seen
following viral-mediated adiponectin expres sion in these mice. Additionally, adiponectin strongly
inhibits LPS-induced TNF alfa gene expression in macrophages (Robinson, 2011).
Vascular endothelial dysfunction plays a pivotal role in the pathogenesis of atherosclerosis
and enhances the risk of future cardiovascular events. Because adiponectin may protect the
endothelium from early atherosclerotic events such as the expression of adhesion molecules or the
attachment of monocytic cells, hypoadiponectinemia could be related to endothelial damage
(Ekmekci, 2006).
The precise mechanismes by which TNF-alpha influences hypertension are uncertain, but
TNF alfa decreases eNOS mRNA levels by increasing the rate of mRNA degradation and
shortening its half-leading to a reduction in NO bioavailability (Yoshizumi, 1993). The vascular
endothelium is a major target for the action of TNF-alpha. This cytokine can decrease the release
of endothelial NO and induce impairment of endothelium-dependent vasodilation in a variety of
vascular beds (Zhang, 2006). Recent evidence supports the idea that effect of TNF-alpha is NO
dependent by producing a rapid inhibitory action on NO synthase in the endothelium via activation
of a sphingomyelinase/ ceramide signaling pathway (Fig.4) (Zhang, 2002; Boos, 2006).
Of interest, the Attica study demonstrated an association between elevated TNF-alpha levels
and prehypertension, even after correcting for multiple comparisons and adjusting for age, body
mass index, bloodlipids, glucose, food groups consumed, and other potential confounders
98
Public Health Department, Faculty of Sports Science, F1 Building, 2nd
Floor, Sekaran Campus Gunungpati, Semarang City, Central Java Province, Indonesia, 50229 Phone/ Fax. +6224 8508007
(Chrysohoou, 2004). There is also evidence to support the synthesis of TNF-alpha in adipose
tissue. (Bullo, 2003) This may contribute to both the maintenance of a chronic low-grade
inflammatory state in obese patients and to the associated comorbidities, such as hypertension
(Lee, 2005).
TNF-alpha is a multifunctional cytokine that plays an important role in diverse physiological
and pathophysiological processes, such as inflammation, cell survival, growth, differentiation, and
apoptosis (Mann, 2002). Because inflammation is a key component in the pathogenesis of
hypertension and cardiovascular disease, the interaction between Ang II and TNF-alpha may play
an important role in the modulation of hypertensive response. Several in vitro and in vivo studies
suggest the existence of cross-talk between the RAS and TNF-alpha (Sasamura, 1997; Arenas,
2004).
Administration of the AT1 receptor antagonist valsartan inhibited the expression of TNF-
alpha in a murine model of arterial injury (Wu, 2001). In patients with hypertension or heart failure,
chronic blockade of AT1 resulted in a significant decrease in the circulating levels of TNF-alpha.
(Cottone, 1998). A recent study showed that mice treated with etanercept prevented the
hypertension and blunted the increase in superoxide production in response to Ang II (Sriramula,
2008).
Our previous study found that aspirin is associated with the controlled blood pressure in
hypertensive patients, so antiinflammatory drugs may helpful to prevent inflammatory procces in
central obese young adults (Wantania, 2014).
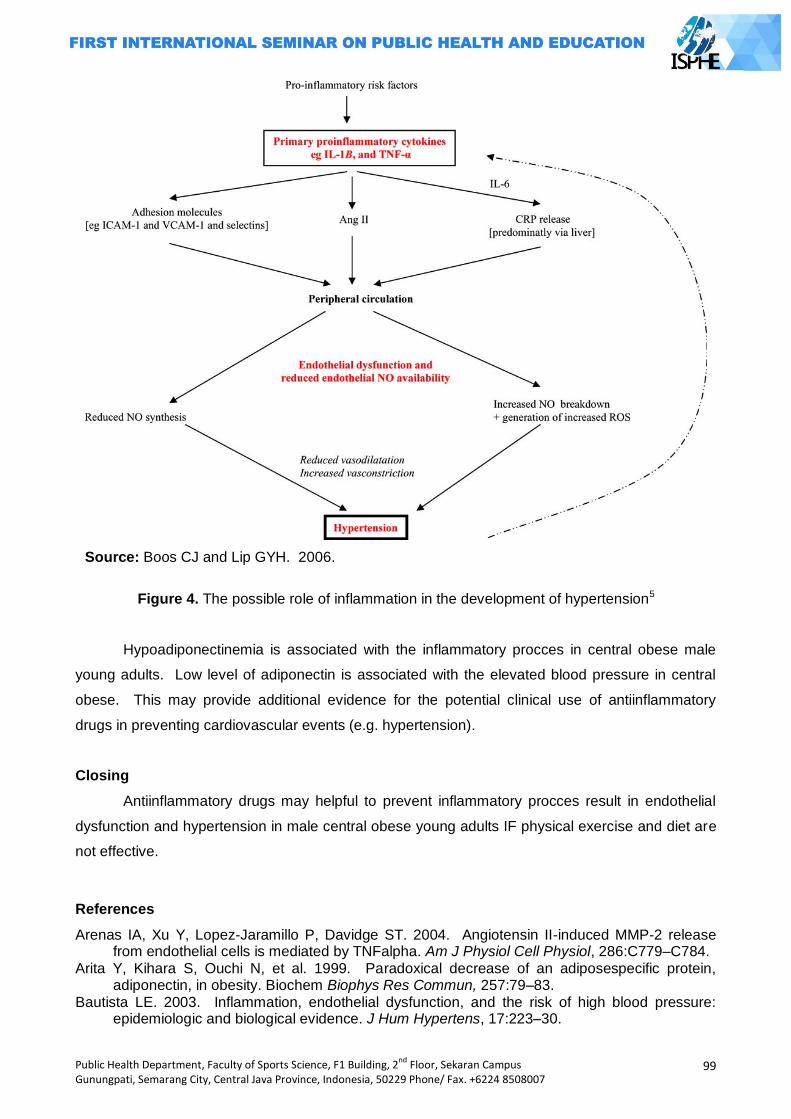
Public Health Department, Faculty of Sports Science, F1 Building, 2nd
Floor, Sekaran Campus Gunungpati, Semarang City, Central Java Province, Indonesia, 50229 Phone/ Fax. +6224 8508007
99
Source: Boos CJ and Lip GYH. 2006.
Figure 4. The possible role of inflammation in the development of hypertension5
Hypoadiponectinemia is associated with the inflammatory procces in central obese male
young adults. Low level of adiponectin is associated with the elevated blood pressure in central
obese. This may provide additional evidence for the potential clinical use of antiinflammatory
drugs in preventing cardiovascular events (e.g. hypertension).
Closing
Antiinflammatory drugs may helpful to prevent inflammatory procces result in endothelial
dysfunction and hypertension in male central obese young adults IF physical exercise and diet are
not effective.
References
Arenas IA, Xu Y, Lopez-Jaramillo P, Davidge ST. 2004. Angiotensin II-induced MMP-2 release from endothelial cells is mediated by TNFalpha. Am J Physiol Cell Physiol, 286:C779–C784.
Arita Y, Kihara S, Ouchi N, et al. 1999. Paradoxical decrease of an adiposespecific protein, adiponectin, in obesity. Biochem Biophys Res Commun, 257:79–83.
Bautista LE. 2003. Inflammation, endothelial dysfunction, and the risk of high blood pressure: epidemiologic and biological evidence. J Hum Hypertens, 17:223–30.
100
Public Health Department, Faculty of Sports Science, F1 Building, 2nd
Floor, Sekaran Campus Gunungpati, Semarang City, Central Java Province, Indonesia, 50229 Phone/ Fax. +6224 8508007
Berg AH, Combs TP, Scherer PE. 2002. ACRP30/ adiponectin: an adipokine regulating glucose and lipid metabolism. J Endo Metab, 13:84-9
Boos CJ and Lip GYH. 2006. Is hypertension an inflammatory process? Curr Pharm Des, 12 (13): 1325-35
Bullo M, Garcia-Lorda P, Megias I, Salas-Salvado J. 2003. Systemic inflammation, adipose tissue tumor necrosis factor, and leptin expression. Obes Res, 11: 525-31
Chrysohoou C, Pitsavos C, Panagiotakos DB, Skoumas J, Stefanadis C. 2004. Association between prehypertension status and inflammatory markers related to atherosclerotic disease: the ATTICA Study. Am J Hypertens, 17:568 –73.
Cottone S, Vadala A, Vella MC, Nardi E, Mule G, Contorno A, Riccobene R, Cerasola G. 1998. Changes of plasma endothelin and growth factor levels, and of left ventricular mass, after chronic AT1-receptor blockade in human hypertension. Am J Hypertens, 11:548 –553.
Ekmekci H and Ekmekci OB. 2006. The role of adiponectin in atherosclerosis and thrombosis. Clin Appl Thrombosis Hemostasis, 12(2):163-8.
Emanuela F. 2012. Inflammation as a Link between Obesity and Metabolic Syndrome Journal of Nutrition and Metabolism Volume, Article ID 476380, 7 pages doi:10.1155/2012/476380
F.A. Ghanem and A. Movahed. 2007. Journal of the American Society of Hypertension, 113–119 Furukawa S, Fujita T, Shimabukuro M, Iwaki M, Yamada Y, Nakajima Y, et al. 2004. Increased
oxidative stress in obesity and its impact on metabolic syndrome. J Clin Invest., 114:1752-61 Ghanem FA and Movahed A. 2007. Inflammation in high blood pressure: a clinician perspective.
Journal of the American Society of Hypertension, 113-9 Gimbrone MA Jr. 1995. Vascular endothelium: an integrator of pathophysiologic stimuli in
atherosclerosis. Am J Cardiol, 75:67B–70B. Greenberg AS and Obin MS. 2006. Obesity and the role of adipose tissue in inflammation and
metabolism. Am J Clin Nutr, 83(S):461-5 Hajer GR, Haeften TW, and Visseren FLJ. 2008. Adipose tissue dysfunction in obesity, diabetes,
and vascular diseases. Eur Heart Journal, 29:2959-71 Hansson,2005 ―Mechanisms of disease: inflammation, atherosclerosis, and coronary artery
disease,‖ New England Journal of Medicine, vol. 352, no. 16, pp. 1685–1695 Hopkins TA, Ouchi N, Shibata R, Waish K. 2007. Adiponectin actions in the cardiovascular system.
Cardiovasc Res, 74:11-8. Hotamisligil GS, Arner P, Caro JF, Atkinson RL, Spiegelman BM. 1995. Increased adipose tissue
expression of tumor necrosis factor-alpha in human obesity and insulin resistance. J Clin Invest, 95:2409-15.
Lacobellis G, Ribaudo MC, Zappaterreno A, Iannucci CV, Leonetti F. 2005. Prevalence of uncomplicated obesity in an Italian obese population. Obes Res, 13: 1116–1122.)
Lee YH, Pratley RE. 2005. The evolving role of inflammation in obesityand the metabolic syndrome. Curr Diab Rep, 5: 70-5
Lee JY, Sohn KH, Rhee SH, Hwang D. 2001. Saturated fatty acids, but not unsaturated fatty acids, induce the expression of cyclooxygenase-2 mediated through Tolllike receptor 4. J Biol Chem, 276:16683–16689.
Mann DL. 2002. Inflammatory mediators and the failing heart: past, present, and the foreseeable future. Circ Res, 91:988 –998.
Matsuzawa Y, Funahashi T, Kihara S, Shimomura I. 2004. Adiponectin and metabolic syndrome. Arterioscler thromb Vasc Biol, 24:29-33
Ouchi N, Ohishi M, Kihara S, Funahashi T, Nakamura T, Nagaretani H, et al. 2003. Association of hypoadiponectinemia with impaired vasoreactivity. Hypertension, 42:231-4
Rizzoni D, Porteri E, Castellano M, Bettoni G, Muiesan ML, Tiberio G, et al. 1998. Endothelial dysfunction in hypertension is independent from the etiology and from vascular structure. Hypertension, 31:335– 41.
Robinson et al. 2011. Clinical review: Adiponectin biology and its role in inflammation and critical illness. Critical Care 2011, 15:221
Ross R. 1999. ―Atherosclerosis—An inflammatory disease,‖ New England Journal ofMedicine, vol. 340, no. 2, pp. 115–126
Sasamura H, Nakazato Y, Hayashida T, Kitamura Y, Hayashi M, Saruta T. 1997. Regulation of vascular type 1 angiotensin receptors by cytokines. Hypertension, 30:35– 41

Public Health Department, Faculty of Sports Science, F1 Building, 2nd
Floor, Sekaran Campus Gunungpati, Semarang City, Central Java Province, Indonesia, 50229 Phone/ Fax. +6224 8508007
101
Srinivas Sriramula, Masudul Haque, Dewan S.A. Majid, Joseph Francis. 2008. Involvement of Tumor Necrosis Factor-alpha in Angiotensin II–Mediated Effects on Salt Appetite, Hypertension, and Cardiac Hypertrophy. Hypertension, 51:1345-1351
Scherer PE, Williams S, Fogliano M, Baldini G, Lodish HF. 1995. A novel serum protein similar to C1q, produced exclusively in adipocytes. J Biol Chem, 270 : 26746-9.
Shin JY, Kim SY, Jeung MJ, Eun DH, Woo CW, Yoon SY, et al. 2008. Serum adiponectin, C- reactive protein, and TNF-alpha levels in obese Korean children. Journal of Pediatric Endocrinology & Metabolism, 21:23-9.
Spieker LE, Noll G. Ruschitzka FT, Maier W, Luscher TF. 2000. Working under pressure: the vascular endothelium in arterial hypertension. J Hum Hypertens, 14:617-30.
Verma S, Anderson TJ. 2001. The ten most commonly askedquestions about endothelial function in cardiology. Cardiol Rev, 9:250 –2.
Verma S, Anderson TJ. 2002. Fundamentals of endotheliasl function for the clinical cardiologist. Circulation, 105:546-9.
Wang ZV and Scherer PE. 2008. Adiponectin, cardiovascular function, and hypertension. Hypertension, 51:8-14.
Wantania F, Pesik S, and Ascer. 2014. Aspirin is associated with the controlled blood pressure. Paper was presented at The 8th Annual Scientific Meeting of InaSH, March 6-8.
Weisberg SP, McCann D, Desai M, Rosenbaum M, Leibel RL, Ferrante AW, et al. 2003. Obesity is associated with macrophage accumulation in adipose tissue. J Clin Invest, 112:1796-1808
Wellen KE and Hotamisligil GS. 2003. Obesity-induced inflammatory changes in adipose tissue. J Clin Invest, 112:1785-8
Wu L, Iwai M, Nakagami H, Li Z, Chen R, Suzuki J, Akishita M, de Gasparo M, Horiuchi M. 2001. Roles of angiotensin II type 2 receptor stimulation associated with selective angiotensin II type 1 receptor blockade with valsartan in the improvement of inflammation-induced vascular injury. Circulation, 104:2716 –2721.
Xi W, Satoh H, Kase H, Suzuki K, Hattori Y. 2005. Stimulated HSP90 binding to eNOS and activation of the P13-Akt pathway contribute in response to globular adiponectin. Biochem Biophys Res Commun, 332:200-5
Yokoyama T, Sekiguchi K, Tanaka T, Tomaru K, Arai M, Suzuki T, Nagai R. 1999. Angiotensin II and mechanical stretch induce production of tumor necrosis factor in cardiac fibroblasts. Am J Physiol, 276: H1968–H1976.
Yoshizumi M, Perrella MA, Burnett JC Jr, Lee ME. 1993. Tumor necrosis factor downregulates an endothelial nitric oxide synthase mRNA by shortening its half-life. Circ Res, 73:205-9
Zahorska B, Janowska J, Olszanecka M, and Zurakowski A. 2000. Serum concentrations of TNF-alfa and soluble TNF-alfa receptors in obesity. International Journal of Obesity, 24:1392-5.
Zhang C, Xu X, Wang W, Michael L, Kuo L, and Chilian WM. 2006. TNF-alpha contributes to endothelial dysfunction in ischmia/ reperfusion injury. Arterioscler Thromb Vasc Biol ,
26:475-80 Zhang DX, Yi FX, Zou AP, Li PL. 2002. Role of ceramide in TNF-alpha induced impairment of
endothelium-dependent vasorelaxation in coronary arteries. Am J Physiol Heart Circ Physiol, 282:1785-94
102
Public Health Department, Faculty of Sports Science, F1 Building, 2nd
Floor, Sekaran Campus Gunungpati, Semarang City, Central Java Province, Indonesia, 50229 Phone/ Fax. +6224 8508007
FACTORS RELATED TO OCCUPATIONAL STRESS AMONG FURNITURE WORKERS IN JEPARA
Dina Lusiana Setyowati
Mulawarman University, Indonesia
Corresponding Author: [email protected]
Abstract Introduction: Occupational Stress was caused by complex phenomena from various factors in modern industries. A Northwestern National Life survey report concluded that 40% of workers experience felt heavy stress, and one of four workers expressed that his work had one stressor in his life. One of the high potential workers to suffer occupational stress is furniture workers, as a result of ever-more demanding requirements from their work. This study is aimed to find out the factors related to occupational stress case of furniture workers in Jepara. Methods: Design of this study was analitic survey with cross-sectional method. A random sample
of furniture worker (n= 70 respondents) was observed (63 male and 7 female). General Health Questionnaire was used to measure psychological distress. Generic Job Stress Questionnaire was used to measure perception of work load. Data was analysed using Chi-Square by SPSS 16 Program. Results: Results of the research indicated that the relationship between age of 35 yr or more and occupational stress was not statistical significant (RP= 0.312; 95% CI= 0.034-2.830; p = 0.401). There was no significant relationship between gender (RP= 1.933; 95% CI= 0.193-19.394, p = 0.482), work of service (RP= 0.176; 95% CI= 0.020-1.597; p = 0.198), perception of work load (RP= 1.370; 95% CI= 0.257-7.319; p = 1.000) and occupational stress. Key Word : Occupational stress, GHQ, GJSQ
Introduction
According to Selye theory, that stress as the reaction of the organism to a threatening
situation, and distinguished between the stressor as the external cause and stress as the reaction
of the human body. Stress was essentially a chain of neuroendocrine mechanisms, beginning with
an excitation in the brain stem, followed by an increased secretion of some hormones from the
adrenal gland, especially of adrenalin and noradrenalin, known as performance hormones
(catecholamine), since they keep the whole organism in a state of heightened alertness. Stress
based on National Institute for Occupational Health & Safety (NIOSH) that stressof work is
the harmful emotional and physical response that occurs when the requirements of the job do not
match the needs, capabilities and resources of the worker.
Based ona survey by Northwestern National Life report, that 40% worker experience of
heavy stress and one from four workers express that its work is including one of stressor in their
life, (NIOSH, 1999). Princeton Survey Research Associates report that three from four workers
believe worker now more stress from at previous generation worker. St. Paul Fire Marine
Insurance Co express that problem at work more interconnected to health problem than other life
problem, even more than finance problem and family problem, (WHO, 2003).
Public Health Department, Faculty of Sports Science, F1 Building, 2nd
Floor, Sekaran Campus Gunungpati, Semarang City, Central Java Province, Indonesia, 50229 Phone/ Fax. +6224 8508007
103
Workload is emerged from an interaction between duty demand, environmental of work
where used as a workplace, skill, perception and worker behavior. Each; Every accepted workload
by someone has to be acceptable or well-balanced. Someone does convenient by considering
physical ability, cognitive ability, workers limitation, and mental& physical Activities. Hence,
everyone has his/her own workload level.
Intensity of workload level will be able to be reached when there no stress and pressure
through physically and mentally, for example, pressure can come from duties, organizational and
environment work. As a result, there is a reaction of worker individually due to not getting
appropriate desire, while stress is a logical consequence of effect that accepted by pressure
workers (Tarwaka, 2010). Research of Kawada and Ooya express that there is a significant
relationship between workload, work overtime with health complaint that is stress work and fatigue
(Ooya, 2005).
Methods
Design of this study was analitic survey with cross-sectional method. The sample of this
study was 70 respondents of 84 Pembahanan workers. This research was used probability
sampling technique by using stratified proportionate random sampling.All of the questionnaire had
been reliability and validity test. Instrument of the research were General Health Questionnaire
(GHQ) that was used to measure psychological distress, Generic Job Stress Questionnaire
(GJSQ) that was used to measure perception of workload. Psychological distress of the target
subjects were divided into two groups, according to the score of a self-administered questionnaire.
Two scoring system were used for the four point responses scale. The likert scoring method (0, 1,
2, 3) summed the responses of the 11 items to give continuous distribution of the scores, ranging
from 0 to 33. Given the possible range of scores from 0 to 11, the threshold for case classification
was 4 or higher. It means that all employees scoring four or more of the 11 items were considered
to represent probable cases of psychological distress.Statistical significance was set at p < 0.05.
All analysis were performed using Chi-Square test by SPSS 16.0 Program.
Results and Discussion
Characteristics of respondent: Table 1 shows information on age and work of service. The subject
in the present study (n= 70) were furniture workers in Jepara. Mean (SD, Range) age of the
respondent was 33.91 (95% CI: 31.47 - 36.36) years. Respondent work of service mean (SD,
Range) of 6.87 year (95% CI: 5.88 - 7.86).
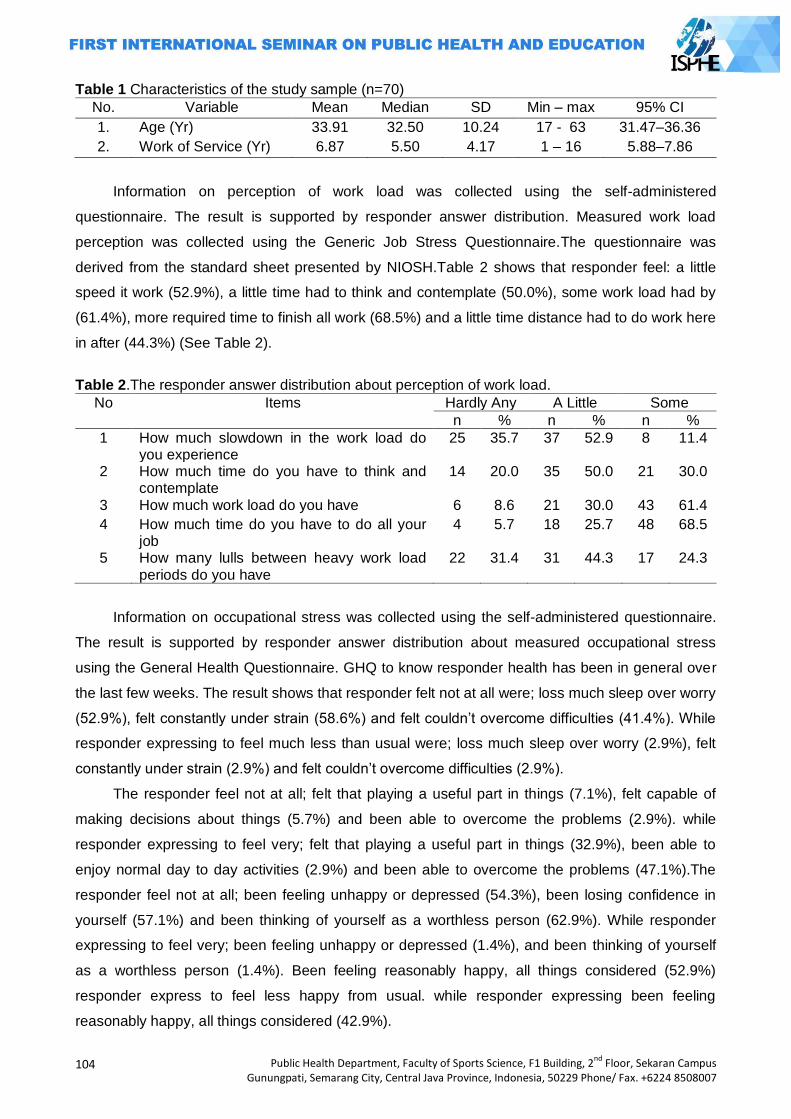
104
Public Health Department, Faculty of Sports Science, F1 Building, 2nd
Floor, Sekaran Campus Gunungpati, Semarang City, Central Java Province, Indonesia, 50229 Phone/ Fax. +6224 8508007
Table 1 Characteristics of the study sample (n=70)
No. Variable Mean Median SD Min – max 95% CI
1. Age (Yr) 33.91 32.50 10.24 17 - 63 31.47–36.36
2. Work of Service (Yr) 6.87 5.50 4.17 1 – 16 5.88–7.86
Information on perception of work load was collected using the self-administered
questionnaire. The result is supported by responder answer distribution. Measured work load
perception was collected using the Generic Job Stress Questionnaire.The questionnaire was
derived from the standard sheet presented by NIOSH.Table 2 shows that responder feel: a little
speed it work (52.9%), a little time had to think and contemplate (50.0%), some work load had by
(61.4%), more required time to finish all work (68.5%) and a little time distance had to do work here
in after (44.3%) (See Table 2).
Table 2.The responder answer distribution about perception of work load.
No Items Hardly Any A Little Some
n % n % n %
1 How much slowdown in the work load do you experience
25 35.7 37 52.9 8 11.4
2 How much time do you have to think and contemplate
14 20.0 35 50.0 21 30.0
3 How much work load do you have 6 8.6 21 30.0 43 61.4
4 How much time do you have to do all your job
4 5.7 18 25.7 48 68.5
5 How many lulls between heavy work load periods do you have
22 31.4 31 44.3 17 24.3
Information on occupational stress was collected using the self-administered questionnaire.
The result is supported by responder answer distribution about measured occupational stress
using the General Health Questionnaire. GHQ to know responder health has been in general over
the last few weeks. The result shows that responder felt not at all were; loss much sleep over worry
(52.9%), felt constantly under strain (58.6%) and felt couldn‘t overcome difficulties (41.4%). While
responder expressing to feel much less than usual were; loss much sleep over worry (2.9%), felt
constantly under strain (2.9%) and felt couldn‘t overcome difficulties (2.9%).
The responder feel not at all; felt that playing a useful part in things (7.1%), felt capable of
making decisions about things (5.7%) and been able to overcome the problems (2.9%). while
responder expressing to feel very; felt that playing a useful part in things (32.9%), been able to
enjoy normal day to day activities (2.9%) and been able to overcome the problems (47.1%).The
responder feel not at all; been feeling unhappy or depressed (54.3%), been losing confidence in
yourself (57.1%) and been thinking of yourself as a worthless person (62.9%). While responder
expressing to feel very; been feeling unhappy or depressed (1.4%), and been thinking of yourself
as a worthless person (1.4%). Been feeling reasonably happy, all things considered (52.9%)
responder express to feel less happy from usual. while responder expressing been feeling
reasonably happy, all things considered (42.9%).
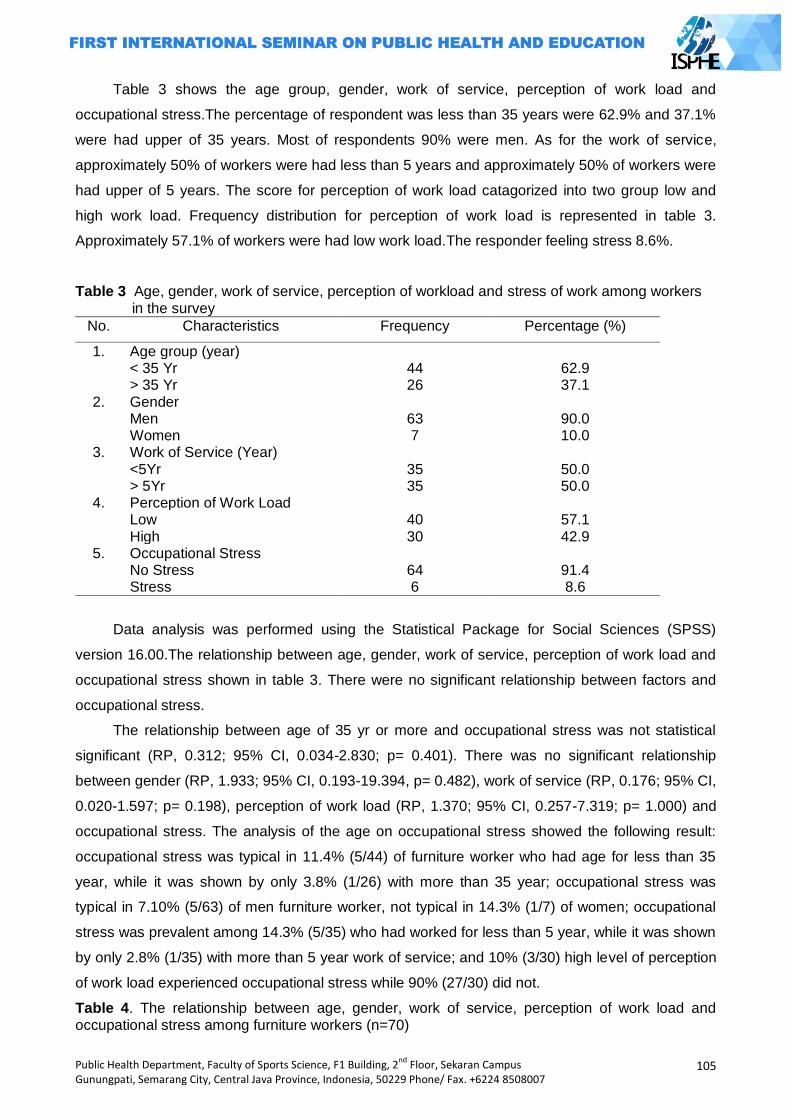
Public Health Department, Faculty of Sports Science, F1 Building, 2nd
Floor, Sekaran Campus Gunungpati, Semarang City, Central Java Province, Indonesia, 50229 Phone/ Fax. +6224 8508007
105
Table 3 shows the age group, gender, work of service, perception of work load and
occupational stress.The percentage of respondent was less than 35 years were 62.9% and 37.1%
were had upper of 35 years. Most of respondents 90% were men. As for the work of service,
approximately 50% of workers were had less than 5 years and approximately 50% of workers were
had upper of 5 years. The score for perception of work load catagorized into two group low and
high work load. Frequency distribution for perception of work load is represented in table 3.
Approximately 57.1% of workers were had low work load.The responder feeling stress 8.6%.
Table 3 Age, gender, work of service, perception of workload and stress of work among workers in the survey
No. Characteristics Frequency Percentage (%)
1. Age group (year) < 35 Yr 44 62.9 > 35 Yr 26 37.1
2. Gender Men 63 90.0 Women 7 10.0
3. Work of Service (Year) <5Yr 35 50.0 > 5Yr 35 50.0
4. Perception of Work Load Low 40 57.1 High 30 42.9
5. Occupational Stress No Stress 64 91.4 Stress 6 8.6
Data analysis was performed using the Statistical Package for Social Sciences (SPSS)
version 16.00.The relationship between age, gender, work of service, perception of work load and
occupational stress shown in table 3. There were no significant relationship between factors and
occupational stress.
The relationship between age of 35 yr or more and occupational stress was not statistical
significant (RP, 0.312; 95% CI, 0.034-2.830; p= 0.401). There was no significant relationship
between gender (RP, 1.933; 95% CI, 0.193-19.394, p= 0.482), work of service (RP, 0.176; 95% CI,
0.020-1.597; p= 0.198), perception of work load (RP, 1.370; 95% CI, 0.257-7.319; p= 1.000) and
occupational stress. The analysis of the age on occupational stress showed the following result:
occupational stress was typical in 11.4% (5/44) of furniture worker who had age for less than 35
year, while it was shown by only 3.8% (1/26) with more than 35 year; occupational stress was
typical in 7.10% (5/63) of men furniture worker, not typical in 14.3% (1/7) of women; occupational
stress was prevalent among 14.3% (5/35) who had worked for less than 5 year, while it was shown
by only 2.8% (1/35) with more than 5 year work of service; and 10% (3/30) high level of perception
of work load experienced occupational stress while 90% (27/30) did not.
Table 4. The relationship between age, gender, work of service, perception of work load and occupational stress among furniture workers (n=70)
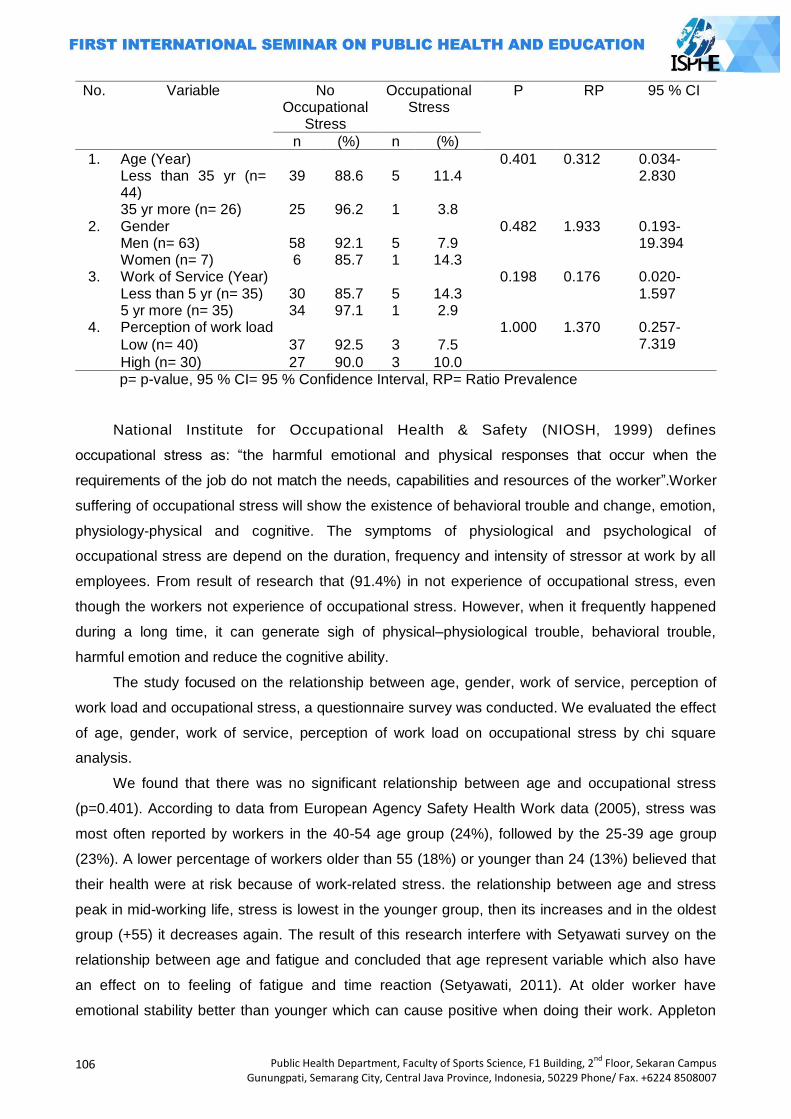
106
Public Health Department, Faculty of Sports Science, F1 Building, 2nd
Floor, Sekaran Campus Gunungpati, Semarang City, Central Java Province, Indonesia, 50229 Phone/ Fax. +6224 8508007
No. Variable No Occupational
Stress
Occupational Stress
P RP 95 % CI
n (%) n (%)
1. Age (Year) 0.401 0.312 0.034-2.830 Less than 35 yr (n=
44) 39 88.6 5 11.4
35 yr more (n= 26) 25 96.2 1 3.8 2. Gender 0.482 1.933 0.193-
19.394 Men (n= 63) 58 92.1 5 7.9 Women (n= 7) 6 85.7 1 14.3
3. Work of Service (Year) 0.198 0.176 0.020-1.597 Less than 5 yr (n= 35) 30 85.7 5 14.3
5 yr more (n= 35) 34 97.1 1 2.9 4. Perception of work load 1.000 1.370 0.257-
7.319 Low (n= 40) 37 92.5 3 7.5
High (n= 30) 27 90.0 3 10.0 p= p-value, 95 % CI= 95 % Confidence Interval, RP= Ratio Prevalence
National Institute for Occupational Health & Safety (NIOSH, 1999) defines
occupational stress as: ―the harmful emotional and physical responses that occur when the
requirements of the job do not match the needs, capabilities and resources of the worker‖.Worker
suffering of occupational stress will show the existence of behavioral trouble and change, emotion,
physiology-physical and cognitive. The symptoms of physiological and psychological of
occupational stress are depend on the duration, frequency and intensity of stressor at work by all
employees. From result of research that (91.4%) in not experience of occupational stress, even
though the workers not experience of occupational stress. However, when it frequently happened
during a long time, it can generate sigh of physical–physiological trouble, behavioral trouble,
harmful emotion and reduce the cognitive ability.
The study focused on the relationship between age, gender, work of service, perception of
work load and occupational stress, a questionnaire survey was conducted. We evaluated the effect
of age, gender, work of service, perception of work load on occupational stress by chi square
analysis.
We found that there was no significant relationship between age and occupational stress
(p=0.401). According to data from European Agency Safety Health Work data (2005), stress was
most often reported by workers in the 40-54 age group (24%), followed by the 25-39 age group
(23%). A lower percentage of workers older than 55 (18%) or younger than 24 (13%) believed that
their health were at risk because of work-related stress. the relationship between age and stress
peak in mid-working life, stress is lowest in the younger group, then its increases and in the oldest
group (+55) it decreases again. The result of this research interfere with Setyawati survey on the
relationship between age and fatigue and concluded that age represent variable which also have
an effect on to feeling of fatigue and time reaction (Setyawati, 2011). At older worker have
emotional stability better than younger which can cause positive when doing their work. Appleton
Public Health Department, Faculty of Sports Science, F1 Building, 2nd
Floor, Sekaran Campus Gunungpati, Semarang City, Central Java Province, Indonesia, 50229 Phone/ Fax. +6224 8508007
107
et al, in stress study work in English get that age factor has no relationship with psychological
symptom, health of physical, and satisfaction of work (Appleton, 1998).Result of this research as
conducted by Kim (r= 0.068; p= 0.518; n= 92), and Allen et al (r= -0.12; p> 0.05; n= 255) indicated
that there was no relationship between old age and occupational stress (Kim (2006), Salami
(2009), Allen (2004)). Pallesen found worker at group old age 35 - 44 year feel more stress
compared to other age group, but that way result of statistical test found there was no significant
relationship between occupational stress and age (p= 0.786) (Pallesen, 2007).
The findings of the 4th EWCS (2005) revealed that 37% of men and 31% of women believed
that work affects their health. Men reported work-related stress more frequently than women,
although this difference was not a big one (23 and 20% respectively). Mental stress symptoms,
such as overall fatigue and irritability, were also slightly more frequently reported by men. Based
on the research that gender showed no significant relationship with occupational stress (p=0.482).
This matter can happened because in this research, total worker sample has fewer gender woman
than men. Furthermore, the research needed with amount of sample which is proportional to
ensure that result of this finding is stabilize. Result of this research is similar with the one which
conducted by Allen et al. (r= -0.01), Pallesen (p= 0.498), Lambert (r= -0.02) showing that there was
no relationship between sex and occupational stress (Kim (2006), Salami (2009), Allen (2004),
(Pallesen, 2007), Lambert (2007)).
Work of service showed that no significant relationship with occupational stress (p= 0.198).
Result of this research is similar with research result conducted by Allen et al indicating that there
was no work of service relationship with occupational stress (r= 0.02). Kim (r= 0.06), Hail (r= 0.10),
(Kim (2006), Salami (2009), Allen (2004). On the other side, result of this research was not similar
research result conducted by Azamet al (r=0.649) and Lambert et al (r=0.14) indicating that there
isa positive relationship between work of service and occupational stress (Lambert (2007), (Azam,
2005). Our data contradict that with only short-term work experience (less than 5 year) that was not
very long in the coaching profession. They are sensitive to the pressures from the people
surrounding them and the stress of work. Consequently, their stress levels are higher. The fact that
working for more than 5 years show lower levels of stress. This supports the statement that
working for a long time are able to adapt to ever-more demanding requirements.
Based on the perception of work load that is responder got (57.1%) responder with low work
load category, 7.5% experienced occupational stress while the other responders did not. There are
42.9% responders with high work load category, 10.0% experienced occupational stress while the
other responders did not. The result showed that Perception of work load has no significant
relationship with occupational stress (p= 1.000).
The possible matter is also caused by adaptation process which have been experienced by
workers. The adaptation process can degrade stress and improve performance (Rohmet, Helbig,
1998). Perception of work load will influence the condition of someone‘s psychology. Stressor in
the form of work load cause mechanism reaction of neuro hormonal where cerebral cortex will
108
Public Health Department, Faculty of Sports Science, F1 Building, 2nd
Floor, Sekaran Campus Gunungpati, Semarang City, Central Java Province, Indonesia, 50229 Phone/ Fax. +6224 8508007
react at stressor. Autonomic Nervous System (ANS) give input at hypothalamus. Then, it will
stimulate Sympathetic Nervous System (SNS) for the response of stress. Two important functions
of system sympathetic-adrenal-medullary that;first, catecholamine which consist of epinephrine
hormone and norepinephrine, which issynthesisin adrenal medulla and by SNS. Second, system
pituitary-adrenal-cortical will produce the corticosteroids, whenthe production of adrenaline is
decreasing related to depression and irritation sigh of psychosomatic (Cooper, 1987).Result of this
research strengthened that responder feel: a little speed it work (52.9%), a little time had to think
and contemplate (50.0%), some work load had by (61.4%), more required time to finish all work
(68.5%) and a little time distance had to do work herein after (44.3%). Result of this research is
disagree with result of research of Akerstedt that physical work load, occupational stress and shift
work relate to fatigue (Akerstedt, 2002).
Closing
The present results provide evidence that there was no relationship between age, gender,
work of service, perception work load and occupational stress (p > 0.05).Recommendation which
can be given for the company is stressor minimization in the work load and apply stress
management in the workplace to prevent of occupational stress occurrence.
References
Akerstedt T, Fredlund P, Gillbers M, Jansson B. 2002. Workload and Work Hour in Relation to Disturbed Sleep and Fatigue. Swedia : Journal of Psychosomatic Research. Vols. 53: 585-588.
Allen RI, Lambert EG, Pasupuleti S, Cluse-Tolar, Ventura LA. 2004. The Impact of Job Characteristic on Social and Human Services Workers. Social Work & Society. 2(2): 173-88.
Appleton K, House A, Dowell A. 1998. A Survey of Job Satisfaction, Sources of Stress and Psychological Symptoms among General Practitioners in Leeds. Br J Gen Pract. 48(428):1059-63.
Azam K, Pourmahabadian M, Rezaeian A. 2005. Work related stress assessment in a vegetable oil production industry, Iran. Occup Environ Med. 62: e31
European Agency for Safety and Health at Work. 2009. OSH in figures: Stress at work – facts and figures. European Risk Observatory Report. Luxembourg.
Lambert EG, Cluse-Tolar T. 2007. The Impact of Job Characteristic on Correctional Staff Job Stress. Applied Psychology in Criminal Justice. 3(2): 117-42. (http://www.apcj.org/documents/3 2 corretionalstaff.pdf) Diakses tanggal 21 April 2010
National Institute for Occupational Safety and Health. 1999. Stress at Work. NIOSH Publication No.
99-101. (http://www.cdc.gov/niosh/jobstress.html).Diakses tanggal: 27 Maret 2009.
Ooya, Tomoyuki Kawada dan Machiko. 2005. Workload and health complaints in overtime worker: A Survey. Archives of Medical Research, Vols. 36 : 594-597.
Pallesen ES. 2007. Work-related Stress and Health among Hotel Employees in Malmo.Tesis. Raija Kalimo, Mostafa A. El-Batawai, Cary L. Cooper. 1987. Psychosocial Factors at Work and Their
Relation to Health. Geneva : World Health Organization. Rolf Helbig, Walter Rohmert. 1998. Encyclopedia of occupational health and safety 4th Edition.
Fatigue and Recovery. ILO. Salami SO. 2009. Job-related stress, personality, social support and burnout among college of
educations lectures. Paper presented at the 4th Regional Conference on Higher Education Research for Sustainable Development in Africa organized by Higher Education Research and Policy Network (HERPNET) in collaboration with Kampala International University,

Public Health Department, Faculty of Sports Science, F1 Building, 2nd
Floor, Sekaran Campus Gunungpati, Semarang City, Central Java Province, Indonesia, 50229 Phone/ Fax. +6224 8508007
109
Kampala, Uganda held on August 17 – 20. (http://www.airweb.org/images/herpnet v2 no3.pdf) diakses tanggal 20 Maret 2010.
Setyawati, L.2011. Selintas Tentang Kelelahan Kerja. Yogyakarta : Amara Books. Tarwaka. 2010.Ergonomi Industri. Dasar-Dasar Pengetahuan Ergonomi dan Aplikasi di Tempat
Kerja. Surakarta : Harapan Press. Tee Sook Kim. 2006.Stres Kerja Di Kalangan Guru AliranTeknik Di Sekolah Menengah Teknik Di
Negeri Johor, Melaka Dan Negeri Sembilan.Tesis. Malaysia: Universiti Teknologi Malaysia. World Health Organization. 2003.The Solid Facts – Social Determinants of Health. 2nd ed. WHO.
110
Public Health Department, Faculty of Sports Science, F1 Building, 2nd
Floor, Sekaran Campus Gunungpati, Semarang City, Central Java Province, Indonesia, 50229 Phone/ Fax. +6224 8508007
DETERMINANT FACTORS OF THE LEVEL OF ADOPTION FOR THE SKILL-BASED HEALTH EDUCATION INNOVATION AMONG UKS TEACHERS AT ELEMENTARY SCHOOLS IN
SEMARANG CITY
Sutopo Patria Jati
Diponegoro University, Indonesia
Corresponding Author: [email protected]
Abstract Introduction: As basic improvement of education and health program, formed a strategic to improve the achievement of healthy school known Focus Resources on Effective School Health (FRESH). Health development to school-age in Indonesia,mostly through Usaha Kesehatan Sekolah (UKS). After three years declaration,FRESH implementation in UKS was still facing obstacles. Purpose of study to analyze the factors influence the level of adoption elementary UKS teachers to the innovation of skills-based health education in Semarang. Methods: Study used quantitative research design.It used descriptive research and verification with method survey in the context of confirmatory. Used models Second Order Confirmatory Factor Analysis. Instrument of analysis was based on the pattern of linear relationship between variables known as Structural Equation Model (SEM). Results: Skill-based health education is an innovation that its implementation fixed by level of adoption. Study proved the determinant factors that influence the level of adoption were performance satisfaction, innovation assessment, communication behavior, environmental support, personality, and socio-economic. Suggested to encourage the integration of subjects with thematic approach in accordance with Educational Ministerial Regulation No.22/ 2006, used mass media can be a reference to the teacher to get health informations.Improved the ability of teachers to adopt health education skill-based must be considered determinant factors were found in the study.
Key Words: Adoption, skill-based health education, UKS
Introduction
One of the important changes in education occurred in April 2000 in the city of Dakar
(Senegal), in which the world community launched a movement and commitment in the new
format, which is The Dakar Framework for Action, Education for All 2000 was used as a basic
guideline for the preparation of objectives and new strategies in order to achieve the education
targets by 2015 worldwide (Brun-Barry, 2000)
Later, the agency UNESCO, UNICEF, WHO and the World Bank made an agreement
strategic cooperation in an effort to improve the health of school achievement, known as Focus
Resources on Effective School Health or "FRESH." Through the approach of "FRESH", expected
that all schools can improve the effectiveness of the financing for education and health programs
through the creation and implementation of a framework that can integrated the four (4) major
components, including: (1) school policies related to health, (2) the provision of clean water and
sanitation as a first step in the creation of a healthy educational environment , safe and
comfortable; (3) skills-based health education, and (4) school-based health and nutrition services.
(UNESCO, 2000)
Public Health Department, Faculty of Sports Science, F1 Building, 2nd
Floor, Sekaran Campus Gunungpati, Semarang City, Central Java Province, Indonesia, 50229 Phone/ Fax. +6224 8508007
111
Health development attempts on school-age children in Indonesia, generally through the Unit
Kesehatan Sekolah (UKS) / Health School Unit and judicially has been declared by the Law
Decree No. 36 of 2009 on Health Article 79, paragraph 1, but the implementation was not optimal
acoording to General Secretary of the Department of Health, Sjafii Ahmad due to several factors,
were: the teacher does not have the commitment and concern in implementing the program, the
role of local government was not optimal, limited infrastructure and untrained UKS teachers.
(Haryanto, 2007).
After almost of three (3) years since officially announced, it turned out the implementation of
the FRESH framework in the UKS program was still facing with difficulties and problems. Results
of pre-interview survey by researchers at March 25, 2006 with one of the officers, program
managers of UKS in Semarang City Health Office complained in the level of reporting and
coordination of the implementation of UKS Team, both at the district or school.
The results of observations of UKS annual reporting program in Semarang Health Office,
also found indications of management throughout the Elementary School (SD / MI) still used the
old format. The reason that the implementation plan of the FRESH framework was not listed
explicitly in the document UKS work plan in 2006, due to during this there was no clear design
guidelines from the central government, even today the Office Health of Semarang have not
received the last copy of result of UKS National Meeting.
In this progress, in 2008 the steering committee of the UKS center, have been perfecting
Coaching and Development Guidelines of UKS, where one of the measures taken; optimizing
programs "life skills education" in an effort to improve skills in psychosocial packed on health
education. (UKS Team coach, 2008).
The adoption of a policy change from the UKS implementation using the FRESH framework,
particularly the changes in the components of skills-based health education by individuals in
schools, especially UKS teachers, it will take much time or stages respectively.
In general, the process of adoption of the innovation by individuals can be divided into the
following stages: (1) knowledge, when the individual began to be exposed information about the
existence of an innovation and they will add to the understanding of how changes in the function;
(2) persuasion; when the formation of attitudes that support or hinder such innovation; (3) decision,
during the decision to accept / reject the adoption of innovation; (4) implementation, which is when
individuals are already implementing innovations in the activities; and (5) confirmation, which is
individuals seek strength in innovation decision set, or returning to the decision reject / accept
change if it turns out a conflict arises. (Rogers, 1995)
The main purpose of this study to analyze and systematically discussion of the various
determinants factors that affect the level of adoption elementary UKS teachers toward innovation
skills-based health education in the city of Semarang.
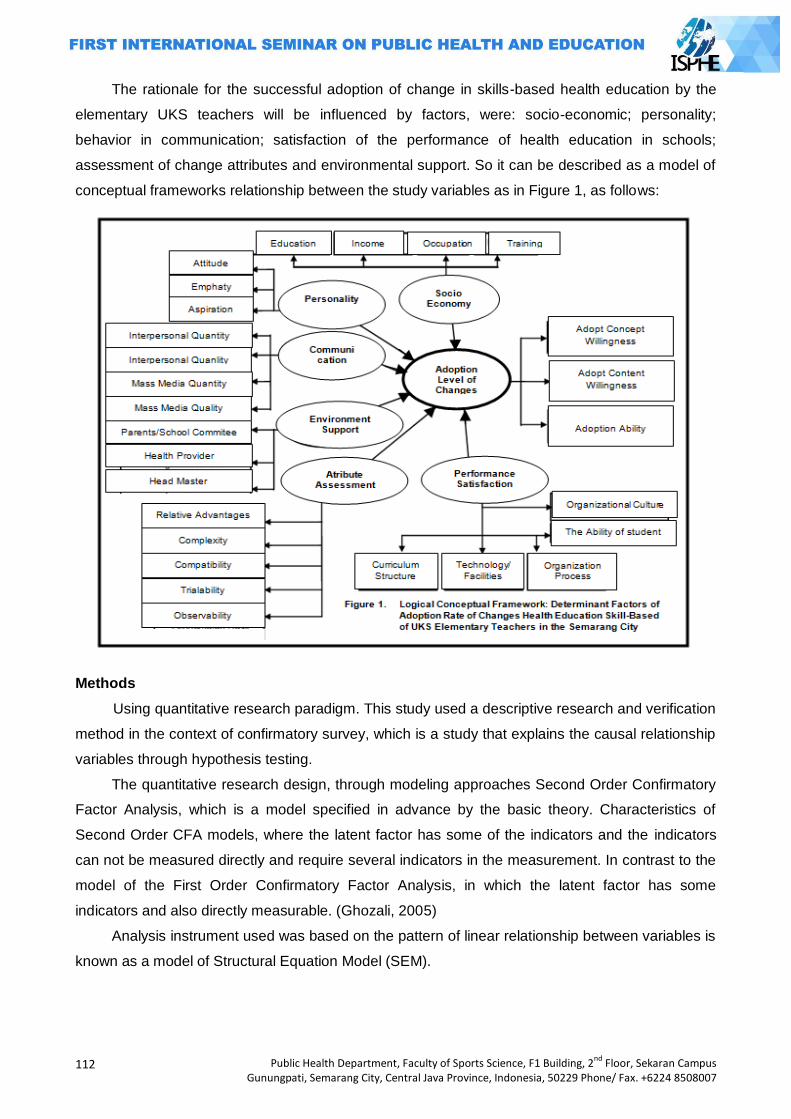
112
Public Health Department, Faculty of Sports Science, F1 Building, 2nd
Floor, Sekaran Campus Gunungpati, Semarang City, Central Java Province, Indonesia, 50229 Phone/ Fax. +6224 8508007
The rationale for the successful adoption of change in skills-based health education by the
elementary UKS teachers will be influenced by factors, were: socio-economic; personality;
behavior in communication; satisfaction of the performance of health education in schools;
assessment of change attributes and environmental support. So it can be described as a model of
conceptual frameworks relationship between the study variables as in Figure 1, as follows:
Methods
Using quantitative research paradigm. This study used a descriptive research and verification
method in the context of confirmatory survey, which is a study that explains the causal relationship
variables through hypothesis testing.
The quantitative research design, through modeling approaches Second Order Confirmatory
Factor Analysis, which is a model specified in advance by the basic theory. Characteristics of
Second Order CFA models, where the latent factor has some of the indicators and the indicators
can not be measured directly and require several indicators in the measurement. In contrast to the
model of the First Order Confirmatory Factor Analysis, in which the latent factor has some
indicators and also directly measurable. (Ghozali, 2005)
Analysis instrument used was based on the pattern of linear relationship between variables is
known as a model of Structural Equation Model (SEM).
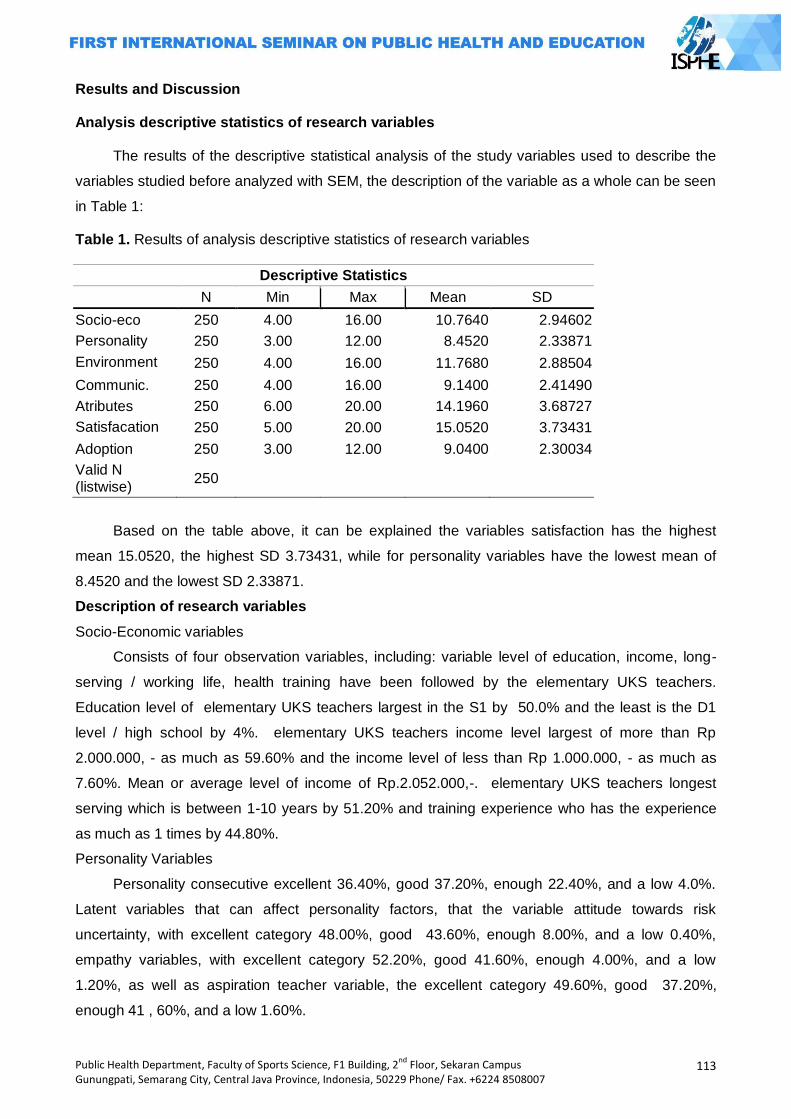
Public Health Department, Faculty of Sports Science, F1 Building, 2nd
Floor, Sekaran Campus Gunungpati, Semarang City, Central Java Province, Indonesia, 50229 Phone/ Fax. +6224 8508007
113
Results and Discussion
Analysis descriptive statistics of research variables
The results of the descriptive statistical analysis of the study variables used to describe the
variables studied before analyzed with SEM, the description of the variable as a whole can be seen
in Table 1:
Table 1. Results of analysis descriptive statistics of research variables
Descriptive Statistics
N Min Max Mean SD
Socio-eco 250 4.00 16.00 10.7640 2.94602
Personality 250 3.00 12.00 8.4520 2.33871
Environment 250 4.00 16.00 11.7680 2.88504
Communic. 250 4.00 16.00 9.1400 2.41490
Atributes 250 6.00 20.00 14.1960 3.68727
Satisfacation 250 5.00 20.00 15.0520 3.73431
Adoption 250 3.00 12.00 9.0400 2.30034
Valid N (listwise)
250
Based on the table above, it can be explained the variables satisfaction has the highest
mean 15.0520, the highest SD 3.73431, while for personality variables have the lowest mean of
8.4520 and the lowest SD 2.33871.
Description of research variables
Socio-Economic variables
Consists of four observation variables, including: variable level of education, income, long-
serving / working life, health training have been followed by the elementary UKS teachers.
Education level of elementary UKS teachers largest in the S1 by 50.0% and the least is the D1
level / high school by 4%. elementary UKS teachers income level largest of more than Rp
2.000.000, - as much as 59.60% and the income level of less than Rp 1.000.000, - as much as
7.60%. Mean or average level of income of Rp.2.052.000,-. elementary UKS teachers longest
serving which is between 1-10 years by 51.20% and training experience who has the experience
as much as 1 times by 44.80%.
Personality Variables
Personality consecutive excellent 36.40%, good 37.20%, enough 22.40%, and a low 4.0%.
Latent variables that can affect personality factors, that the variable attitude towards risk
uncertainty, with excellent category 48.00%, good 43.60%, enough 8.00%, and a low 0.40%,
empathy variables, with excellent category 52.20%, good 41.60%, enough 4.00%, and a low
1.20%, as well as aspiration teacher variable, the excellent category 49.60%, good 37.20%,
enough 41 , 60%, and a low 1.60%.
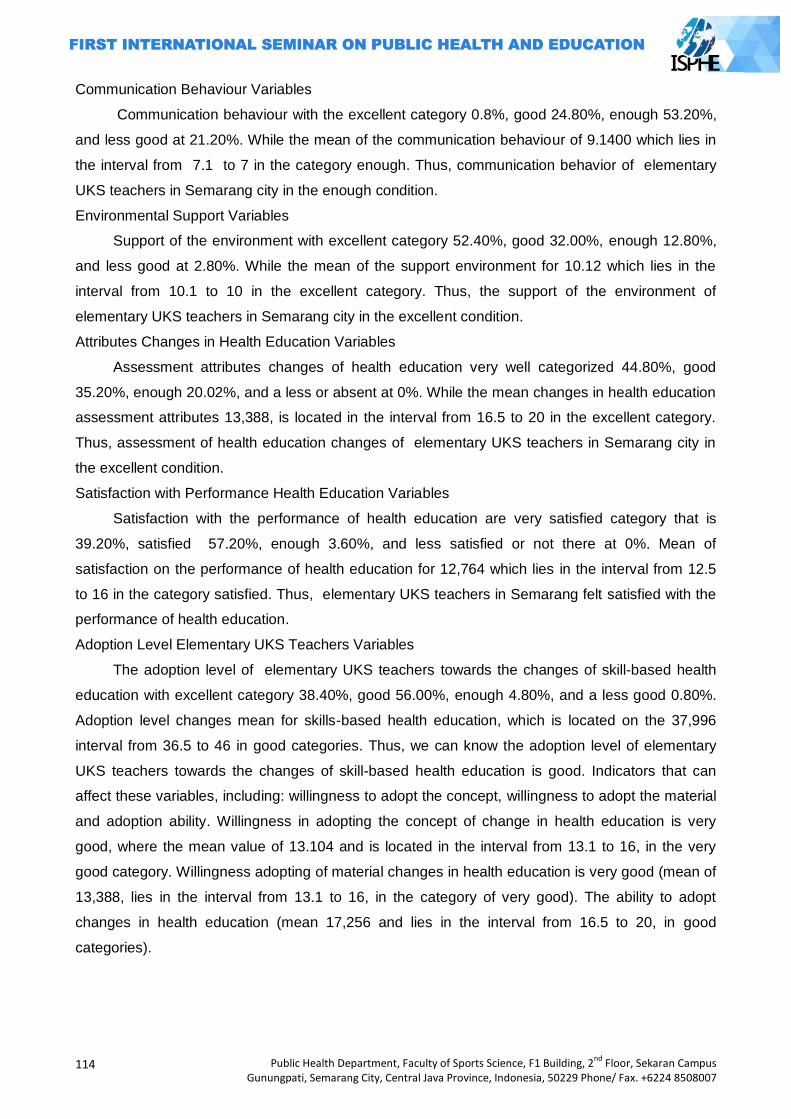
114
Public Health Department, Faculty of Sports Science, F1 Building, 2nd
Floor, Sekaran Campus Gunungpati, Semarang City, Central Java Province, Indonesia, 50229 Phone/ Fax. +6224 8508007
Communication Behaviour Variables
Communication behaviour with the excellent category 0.8%, good 24.80%, enough 53.20%,
and less good at 21.20%. While the mean of the communication behaviour of 9.1400 which lies in
the interval from 7.1 to 7 in the category enough. Thus, communication behavior of elementary
UKS teachers in Semarang city in the enough condition.
Environmental Support Variables
Support of the environment with excellent category 52.40%, good 32.00%, enough 12.80%,
and less good at 2.80%. While the mean of the support environment for 10.12 which lies in the
interval from 10.1 to 10 in the excellent category. Thus, the support of the environment of
elementary UKS teachers in Semarang city in the excellent condition.
Attributes Changes in Health Education Variables
Assessment attributes changes of health education very well categorized 44.80%, good
35.20%, enough 20.02%, and a less or absent at 0%. While the mean changes in health education
assessment attributes 13,388, is located in the interval from 16.5 to 20 in the excellent category.
Thus, assessment of health education changes of elementary UKS teachers in Semarang city in
the excellent condition.
Satisfaction with Performance Health Education Variables
Satisfaction with the performance of health education are very satisfied category that is
39.20%, satisfied 57.20%, enough 3.60%, and less satisfied or not there at 0%. Mean of
satisfaction on the performance of health education for 12,764 which lies in the interval from 12.5
to 16 in the category satisfied. Thus, elementary UKS teachers in Semarang felt satisfied with the
performance of health education.
Adoption Level Elementary UKS Teachers Variables
The adoption level of elementary UKS teachers towards the changes of skill-based health
education with excellent category 38.40%, good 56.00%, enough 4.80%, and a less good 0.80%.
Adoption level changes mean for skills-based health education, which is located on the 37,996
interval from 36.5 to 46 in good categories. Thus, we can know the adoption level of elementary
UKS teachers towards the changes of skill-based health education is good. Indicators that can
affect these variables, including: willingness to adopt the concept, willingness to adopt the material
and adoption ability. Willingness in adopting the concept of change in health education is very
good, where the mean value of 13.104 and is located in the interval from 13.1 to 16, in the very
good category. Willingness adopting of material changes in health education is very good (mean of
13,388, lies in the interval from 13.1 to 16, in the category of very good). The ability to adopt
changes in health education (mean 17,256 and lies in the interval from 16.5 to 20, in good
categories).
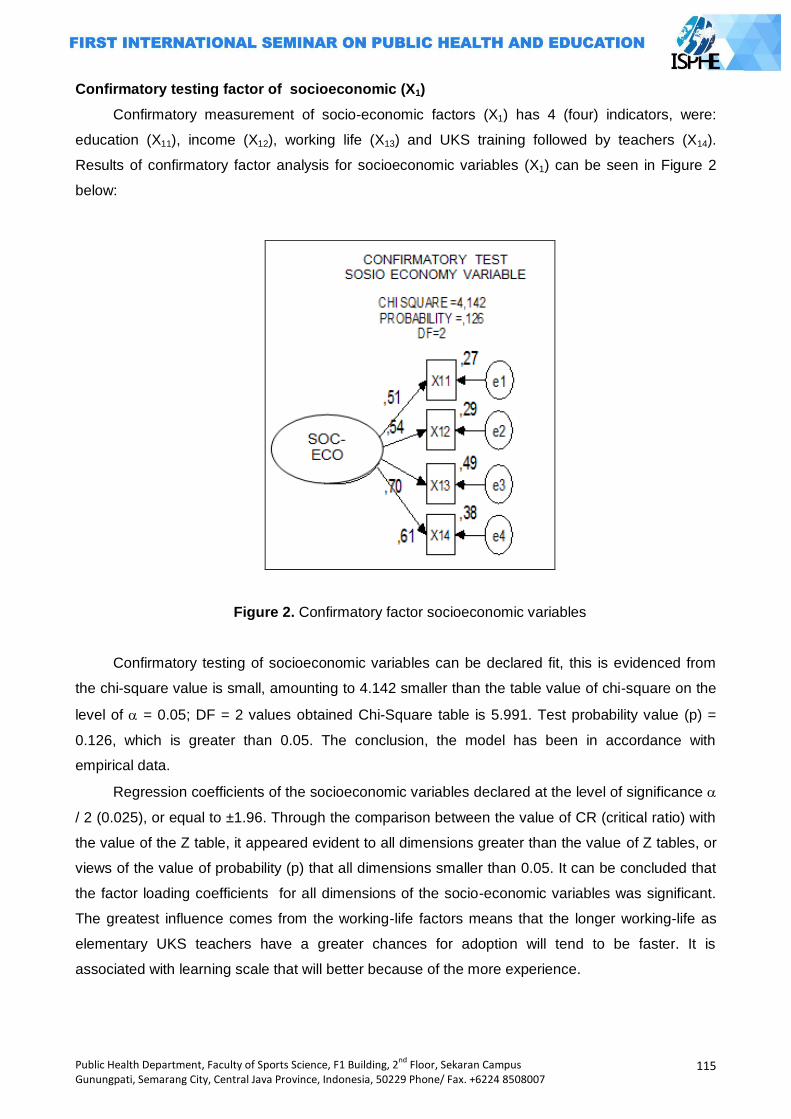
Public Health Department, Faculty of Sports Science, F1 Building, 2nd
Floor, Sekaran Campus Gunungpati, Semarang City, Central Java Province, Indonesia, 50229 Phone/ Fax. +6224 8508007
115
Confirmatory testing factor of socioeconomic (X1)
Confirmatory measurement of socio-economic factors (X1) has 4 (four) indicators, were:
education (X11), income (X12), working life (X13) and UKS training followed by teachers (X14).
Results of confirmatory factor analysis for socioeconomic variables (X1) can be seen in Figure 2
below:
Figure 2. Confirmatory factor socioeconomic variables
Confirmatory testing of socioeconomic variables can be declared fit, this is evidenced from
the chi-square value is small, amounting to 4.142 smaller than the table value of chi-square on the
level of = 0.05; DF = 2 values obtained Chi-Square table is 5.991. Test probability value (p) =
0.126, which is greater than 0.05. The conclusion, the model has been in accordance with
empirical data.
Regression coefficients of the socioeconomic variables declared at the level of significance
/ 2 (0.025), or equal to ±1.96. Through the comparison between the value of CR (critical ratio) with
the value of the Z table, it appeared evident to all dimensions greater than the value of Z tables, or
views of the value of probability (p) that all dimensions smaller than 0.05. It can be concluded that
the factor loading coefficients for all dimensions of the socio-economic variables was significant.
The greatest influence comes from the working-life factors means that the longer working-life as
elementary UKS teachers have a greater chances for adoption will tend to be faster. It is
associated with learning scale that will better because of the more experience.
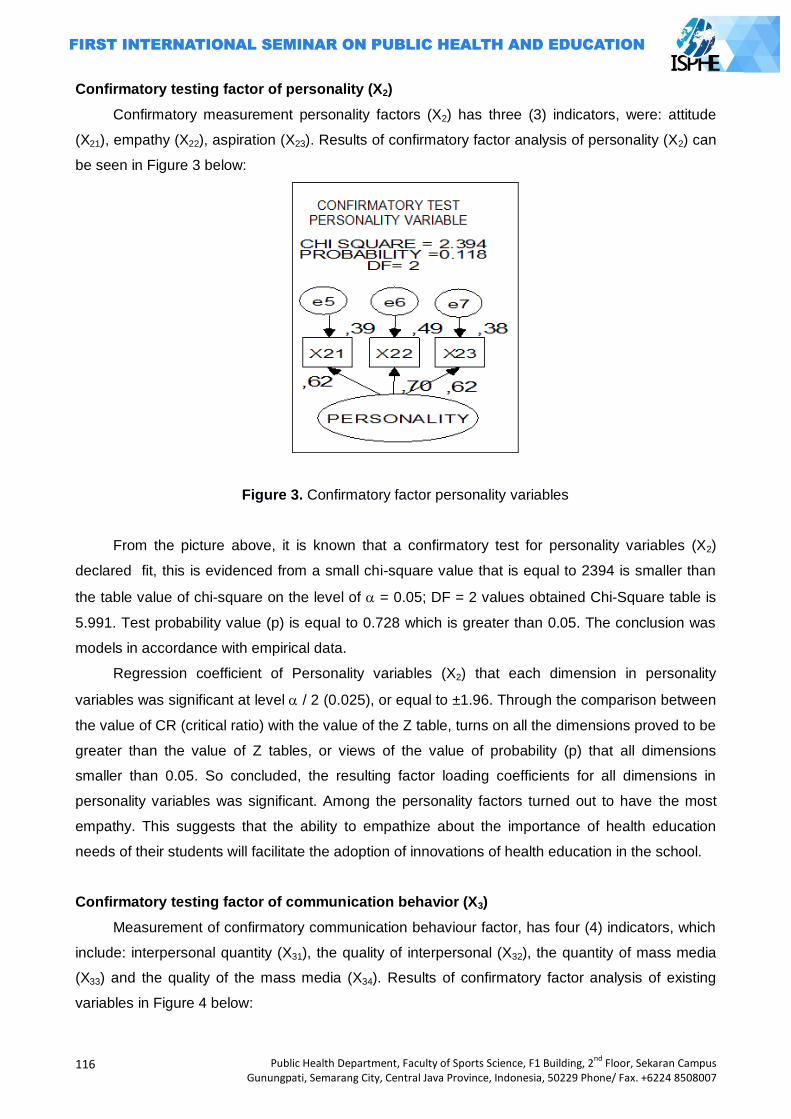
116
Public Health Department, Faculty of Sports Science, F1 Building, 2nd
Floor, Sekaran Campus Gunungpati, Semarang City, Central Java Province, Indonesia, 50229 Phone/ Fax. +6224 8508007
Confirmatory testing factor of personality (X2)
Confirmatory measurement personality factors (X2) has three (3) indicators, were: attitude
(X21), empathy (X22), aspiration (X23). Results of confirmatory factor analysis of personality (X2) can
be seen in Figure 3 below:
Figure 3. Confirmatory factor personality variables
From the picture above, it is known that a confirmatory test for personality variables (X2)
declared fit, this is evidenced from a small chi-square value that is equal to 2394 is smaller than
the table value of chi-square on the level of = 0.05; DF = 2 values obtained Chi-Square table is
5.991. Test probability value (p) is equal to 0.728 which is greater than 0.05. The conclusion was
models in accordance with empirical data.
Regression coefficient of Personality variables (X2) that each dimension in personality
variables was significant at level / 2 (0.025), or equal to ±1.96. Through the comparison between
the value of CR (critical ratio) with the value of the Z table, turns on all the dimensions proved to be
greater than the value of Z tables, or views of the value of probability (p) that all dimensions
smaller than 0.05. So concluded, the resulting factor loading coefficients for all dimensions in
personality variables was significant. Among the personality factors turned out to have the most
empathy. This suggests that the ability to empathize about the importance of health education
needs of their students will facilitate the adoption of innovations of health education in the school.
Confirmatory testing factor of communication behavior (X3)
Measurement of confirmatory communication behaviour factor, has four (4) indicators, which
include: interpersonal quantity (X31), the quality of interpersonal (X32), the quantity of mass media
(X33) and the quality of the mass media (X34). Results of confirmatory factor analysis of existing
variables in Figure 4 below:
Public Health Department, Faculty of Sports Science, F1 Building, 2nd
Floor, Sekaran Campus Gunungpati, Semarang City, Central Java Province, Indonesia, 50229 Phone/ Fax. +6224 8508007
117
Figure 4. Confirmatory Factor Communication behavior Variables
Figure 4 above, explaining that the test variable confirmatory factor in communication
behavior (X3) can be declared fit, this proved of little chi-square value is equal to 4.781 which is
smaller than the table value of chi-square on the level of = 0.05; DF = 2 and obtained the value
of Chi-Square table is 5.991. Test probability value (p) = 0.92 which is greater than 0.05. The
conclusion obtained by the model has been fit to the data.
The magnitude of regression coefficients in communication behavior variables (X3) that each
dimension of the variable behavior of these communications was significant at level / 2 (0.025),
or equal to ± 1.96. Through the comparison between the value of CR (critical ratio) with the value
of the Z table, it appeared evident to all dimensions greater than the value of Z tables, or views of
the value of probability (p) that all dimensions smaller than 0.05. So concluded, the coefficients of
the resulting factor loading for all dimensions of the communication behavior variables was
significant. The quality of the mass media has the greatest influence in shaping the behavior of
effective communication for adoption.
Confirmatory testing factor of environmental support (X4)
Measurement of confirmatory factor environmental support (X4), has three (3) indicators,
namely: the components of the school committee (X41), health workers (X42), the principal (X43).
Results of confirmatory factor analysis support environment variables can be seen in Figure 5
below:
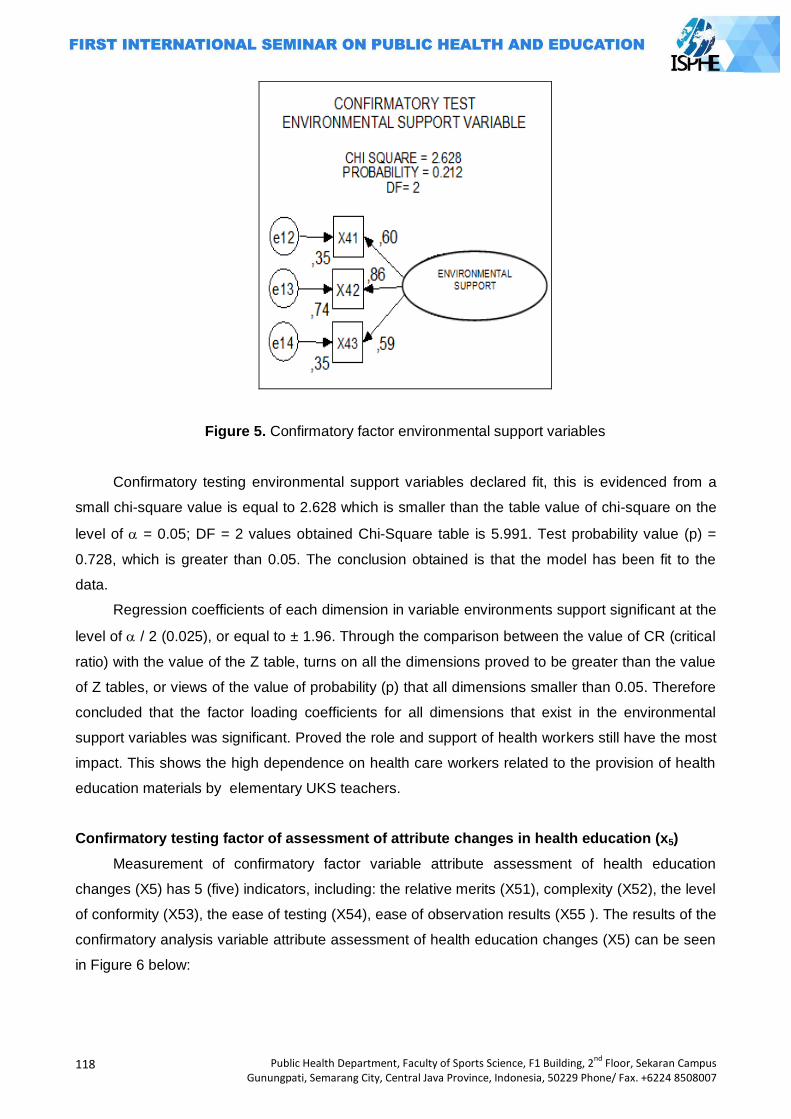
118
Public Health Department, Faculty of Sports Science, F1 Building, 2nd
Floor, Sekaran Campus Gunungpati, Semarang City, Central Java Province, Indonesia, 50229 Phone/ Fax. +6224 8508007
Figure 5. Confirmatory factor environmental support variables
Confirmatory testing environmental support variables declared fit, this is evidenced from a
small chi-square value is equal to 2.628 which is smaller than the table value of chi-square on the
level of = 0.05; DF = 2 values obtained Chi-Square table is 5.991. Test probability value (p) =
0.728, which is greater than 0.05. The conclusion obtained is that the model has been fit to the
data.
Regression coefficients of each dimension in variable environments support significant at the
level of / 2 (0.025), or equal to ± 1.96. Through the comparison between the value of CR (critical
ratio) with the value of the Z table, turns on all the dimensions proved to be greater than the value
of Z tables, or views of the value of probability (p) that all dimensions smaller than 0.05. Therefore
concluded that the factor loading coefficients for all dimensions that exist in the environmental
support variables was significant. Proved the role and support of health workers still have the most
impact. This shows the high dependence on health care workers related to the provision of health
education materials by elementary UKS teachers.
Confirmatory testing factor of assessment of attribute changes in health education (x5)
Measurement of confirmatory factor variable attribute assessment of health education
changes (X5) has 5 (five) indicators, including: the relative merits (X51), complexity (X52), the level
of conformity (X53), the ease of testing (X54), ease of observation results (X55 ). The results of the
confirmatory analysis variable attribute assessment of health education changes (X5) can be seen
in Figure 6 below:
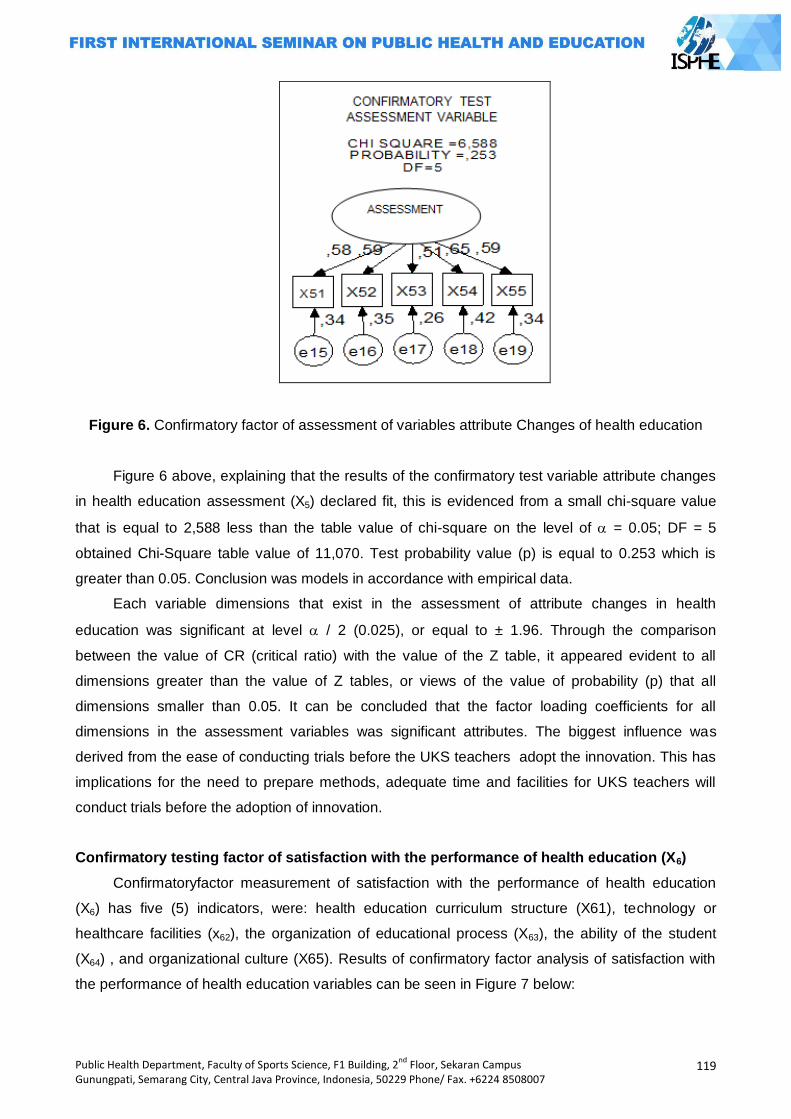
Public Health Department, Faculty of Sports Science, F1 Building, 2nd
Floor, Sekaran Campus Gunungpati, Semarang City, Central Java Province, Indonesia, 50229 Phone/ Fax. +6224 8508007
119
Figure 6. Confirmatory factor of assessment of variables attribute Changes of health education
Figure 6 above, explaining that the results of the confirmatory test variable attribute changes
in health education assessment (X5) declared fit, this is evidenced from a small chi-square value
that is equal to 2,588 less than the table value of chi-square on the level of = 0.05; DF = 5
obtained Chi-Square table value of 11,070. Test probability value (p) is equal to 0.253 which is
greater than 0.05. Conclusion was models in accordance with empirical data.
Each variable dimensions that exist in the assessment of attribute changes in health
education was significant at level / 2 (0.025), or equal to ± 1.96. Through the comparison
between the value of CR (critical ratio) with the value of the Z table, it appeared evident to all
dimensions greater than the value of Z tables, or views of the value of probability (p) that all
dimensions smaller than 0.05. It can be concluded that the factor loading coefficients for all
dimensions in the assessment variables was significant attributes. The biggest influence was
derived from the ease of conducting trials before the UKS teachers adopt the innovation. This has
implications for the need to prepare methods, adequate time and facilities for UKS teachers will
conduct trials before the adoption of innovation.
Confirmatory testing factor of satisfaction with the performance of health education (X6)
Confirmatoryfactor measurement of satisfaction with the performance of health education
(X6) has five (5) indicators, were: health education curriculum structure (X61), technology or
healthcare facilities (x62), the organization of educational process (X63), the ability of the student
(X64) , and organizational culture (X65). Results of confirmatory factor analysis of satisfaction with
the performance of health education variables can be seen in Figure 7 below:
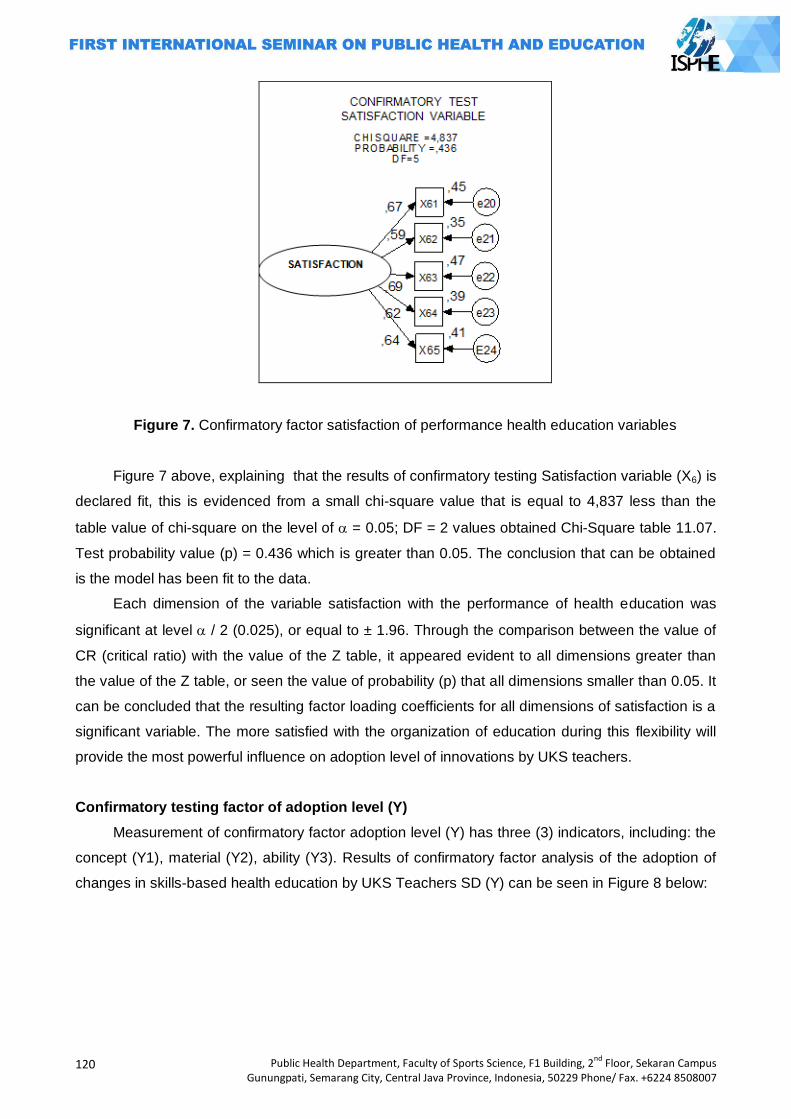
120
Public Health Department, Faculty of Sports Science, F1 Building, 2nd
Floor, Sekaran Campus Gunungpati, Semarang City, Central Java Province, Indonesia, 50229 Phone/ Fax. +6224 8508007
Figure 7. Confirmatory factor satisfaction of performance health education variables
Figure 7 above, explaining that the results of confirmatory testing Satisfaction variable (X6) is
declared fit, this is evidenced from a small chi-square value that is equal to 4,837 less than the
table value of chi-square on the level of = 0.05; DF = 2 values obtained Chi-Square table 11.07.
Test probability value (p) = 0.436 which is greater than 0.05. The conclusion that can be obtained
is the model has been fit to the data.
Each dimension of the variable satisfaction with the performance of health education was
significant at level / 2 (0.025), or equal to ± 1.96. Through the comparison between the value of
CR (critical ratio) with the value of the Z table, it appeared evident to all dimensions greater than
the value of the Z table, or seen the value of probability (p) that all dimensions smaller than 0.05. It
can be concluded that the resulting factor loading coefficients for all dimensions of satisfaction is a
significant variable. The more satisfied with the organization of education during this flexibility will
provide the most powerful influence on adoption level of innovations by UKS teachers.
Confirmatory testing factor of adoption level (Y)
Measurement of confirmatory factor adoption level (Y) has three (3) indicators, including: the
concept (Y1), material (Y2), ability (Y3). Results of confirmatory factor analysis of the adoption of
changes in skills-based health education by UKS Teachers SD (Y) can be seen in Figure 8 below:
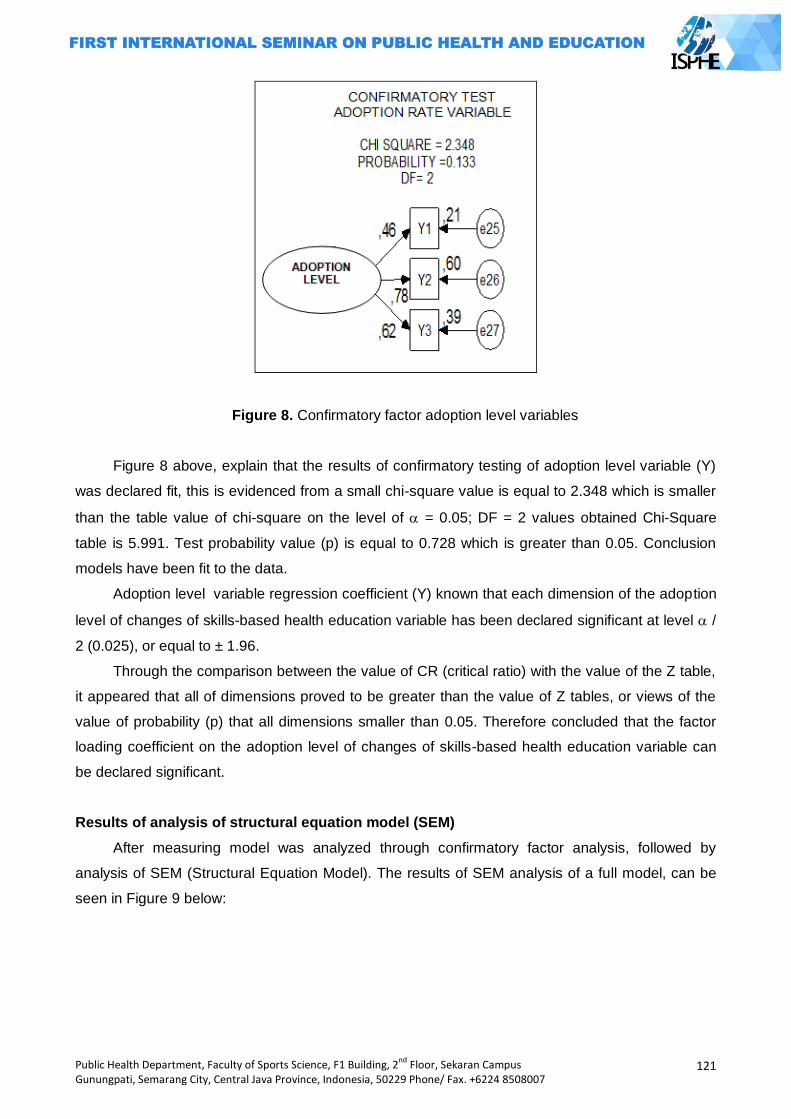
Public Health Department, Faculty of Sports Science, F1 Building, 2nd
Floor, Sekaran Campus Gunungpati, Semarang City, Central Java Province, Indonesia, 50229 Phone/ Fax. +6224 8508007
121
Figure 8. Confirmatory factor adoption level variables
Figure 8 above, explain that the results of confirmatory testing of adoption level variable (Y)
was declared fit, this is evidenced from a small chi-square value is equal to 2.348 which is smaller
than the table value of chi-square on the level of = 0.05; DF = 2 values obtained Chi-Square
table is 5.991. Test probability value (p) is equal to 0.728 which is greater than 0.05. Conclusion
models have been fit to the data.
Adoption level variable regression coefficient (Y) known that each dimension of the adoption
level of changes of skills-based health education variable has been declared significant at level /
2 (0.025), or equal to ± 1.96.
Through the comparison between the value of CR (critical ratio) with the value of the Z table,
it appeared that all of dimensions proved to be greater than the value of Z tables, or views of the
value of probability (p) that all dimensions smaller than 0.05. Therefore concluded that the factor
loading coefficient on the adoption level of changes of skills-based health education variable can
be declared significant.
Results of analysis of structural equation model (SEM)
After measuring model was analyzed through confirmatory factor analysis, followed by
analysis of SEM (Structural Equation Model). The results of SEM analysis of a full model, can be
seen in Figure 9 below:
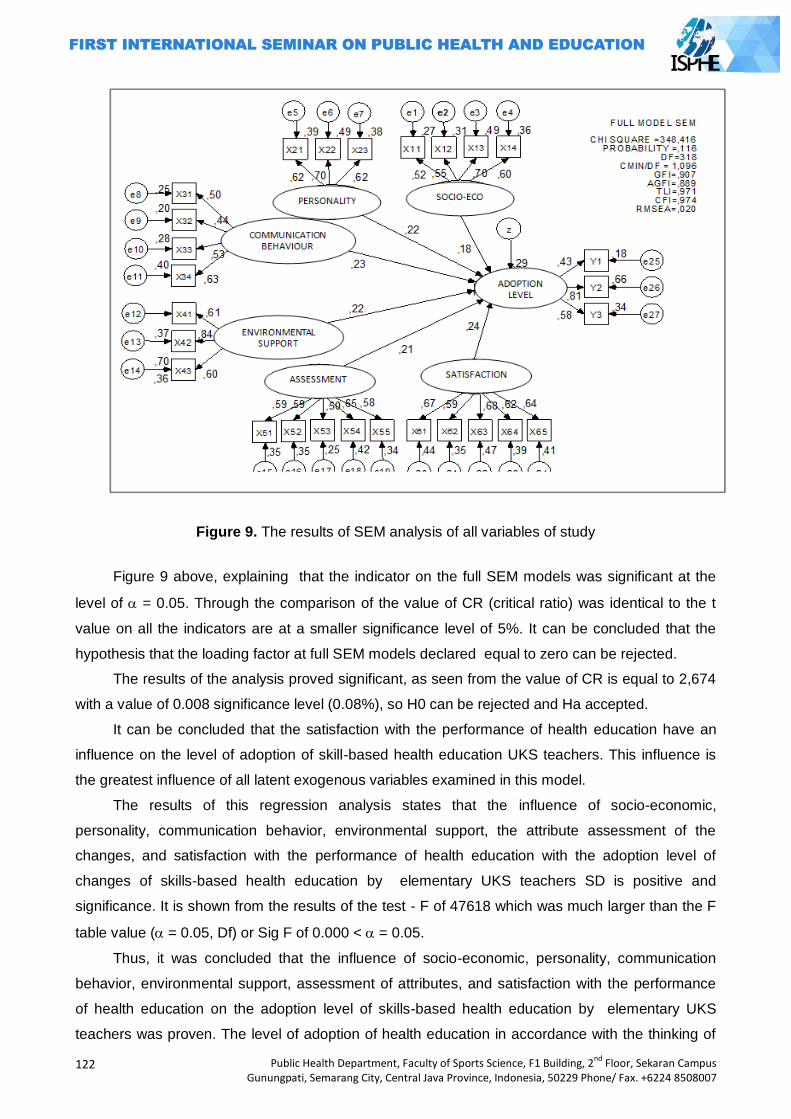
122
Public Health Department, Faculty of Sports Science, F1 Building, 2nd
Floor, Sekaran Campus Gunungpati, Semarang City, Central Java Province, Indonesia, 50229 Phone/ Fax. +6224 8508007
Figure 9. The results of SEM analysis of all variables of study
Figure 9 above, explaining that the indicator on the full SEM models was significant at the
level of = 0.05. Through the comparison of the value of CR (critical ratio) was identical to the t
value on all the indicators are at a smaller significance level of 5%. It can be concluded that the
hypothesis that the loading factor at full SEM models declared equal to zero can be rejected.
The results of the analysis proved significant, as seen from the value of CR is equal to 2,674
with a value of 0.008 significance level (0.08%), so H0 can be rejected and Ha accepted.
It can be concluded that the satisfaction with the performance of health education have an
influence on the level of adoption of skill-based health education UKS teachers. This influence is
the greatest influence of all latent exogenous variables examined in this model.
The results of this regression analysis states that the influence of socio-economic,
personality, communication behavior, environmental support, the attribute assessment of the
changes, and satisfaction with the performance of health education with the adoption level of
changes of skills-based health education by elementary UKS teachers SD is positive and
significance. It is shown from the results of the test - F of 47618 which was much larger than the F
table value ( = 0.05, Df) or Sig F of 0.000 < = 0.05.
Thus, it was concluded that the influence of socio-economic, personality, communication
behavior, environmental support, assessment of attributes, and satisfaction with the performance
of health education on the adoption level of skills-based health education by elementary UKS
teachers was proven. The level of adoption of health education in accordance with the thinking of
Public Health Department, Faculty of Sports Science, F1 Building, 2nd
Floor, Sekaran Campus Gunungpati, Semarang City, Central Java Province, Indonesia, 50229 Phone/ Fax. +6224 8508007
123
Rogers, the novelty of innovation as measured subjectively by the individual who receives the
view.
If the communication was intended to introduce an innovation to many audiences and
widespread, it was more appropriate communication channels, fast and efficient, was the mass
media. But if the communication was intended to change the attitude of the recipient personally,
the most appropriate communication channel was the channel of interpersonal. Rogers stated that
the mass media more effectively create the knowledge about innovation and effective interpersonal
channels in the formation of attitudes toward new ideas in an effort to adopt / reject new ideas.
Closing
Skills-based health education is an innovation in the implementation was determined by how
much the ability of teachers to adopt it. In this case, adoption is the teacher's ability to absorb
external information and the ability to accept risk changes, to be implemented in the school life of
the students and other school community.
In this study, was evidenced that the adoption level of innovations of skills-based health
education in elementary UKS teachers in Semarang influenced by performance satisfaction,
innovation assessment, communication behavior, environmental support, personality, and socio
ecomonic.
Based on the description of the research results and conclusions above, then the advice that
can be given were, it should be an effort to encourage the integration of subjects with thematic
approach in accordance with the Educational Ministerial Regulation No.22/2006 that is expected to
increase the satisfaction of the discretion in the trial and organizing innovation skills-based health
education, it should be provided that the mass media can be a reference for teachers to obtain
health information and increase teachers empathy about various need / skills based health
education materials of their students, dependency on the role of health workers need to be
gradually reduced by doing various activities in cooperation with health centers in the form of
training and mentoring to increase ability and commitment elementary UKS teachers in the
innovation skills-based health education at each school.
References
Brun, U. dan P. Barry (eds). 2000. The Dakar Framework for Action Education for All 2000. Paris : UNESCO.
Ghozali I. 2005. Model Persamaan Struktural : Konsep dan Aplikasi dengan Program AMOS Ver. 5.0. Semarang : Badan Penerbit Universitas Diponegoro.
Haryanto, D. 2007. Inovasi Pembelajaran. Perpektif Ilmu Pendidikan Vol. 16 Th. VIII Oktober 2007. Available URL http://jurnal.pdii.lipi.go.id/admin/jurnal/16807102119.pdf [Accessed 26 April 2011]. Rogers M. E. 1995. Diffusion Of Innovations. 4th Ed. New York. USA : The Free
Press. UNESCO. 2000. World Education Forum. FRESH a Comprehensive School Health Approach to
Acheve EFA. Hlm. 3-8. Available URL http://www.unesco.org/education/fresh.[Accessed 29 March 2006].
Tim Pembina UKS. 2008. Pedoman Pembinaan Usaha Kesehatan Sekolah. Jakarta : DEPKES RI.

124
Public Health Department, Faculty of Sports Science, F1 Building, 2nd
Floor, Sekaran Campus Gunungpati, Semarang City, Central Java Province, Indonesia, 50229 Phone/ Fax. +6224 8508007
EDUCATION FOR USING PESTICIDE BY SAFELY AND RIGHT TO THE CHILDREN OF FARMER
MG.Catur Yuantari1, Eti Rimawati1, Kismi Mubarokah1, Supriyono Asfawi1
1Dian Nuswantoro University, Indonesia
Corresponding Author: [email protected]
Abstract
Introduction: Children are the future generation of farmers so culturally safe and healthy behavior in usage of pesticides should be established early. Based on the results of surveys and interviews of children of farmers, showing the results of 76.8% children do not know about pesticides, 88.5% do not know what is meant of pesticides, 61.5% do not know how to use pesticides and 69.2% do not know the dangers pesticides for the body. Methods: This research was action research, beginning stages of Focus Group Discussion to the Principal and District Education Office Penawangan Grobogan in designing materials of pesticides and its danger. Furthermore implement and evaluate environmental education about the pesticides and its danger on 26 pupils in Curut elementary school Results: Discussion of the results expected pesticide materials delivered to students by giving the concrete examples based on the problems faced by farmers in the region. Results of the evaluation of the delivery of the material by the book and flip chart on "Pesticides and danger" indicates that 87% of students were able to explain again about pesticides and the types, 85% know how to use the pesticides, 87% know how the storage and 90% know its danger to the body. Key Words: Children of farmers, pesticides, education, environment
Introduction
Pesticides are chemical substances used to kill or control pests. The word of pesticide came
from of the word of pest and cida with its meaning is killer. So simply said pesticides is pest killer.
Pest for farmers has a very broad sense, namely mites viruses, bacteria, nematodes (worms that
damage the roots), snails, mice, birds and other animals are considered damaging. (Agriculture
Department, 2012)
In Curut, Purwodadi, the practice of farmer in using of pesticides are inconsistent by
procedure. There are 25,6% farmers mix the pesticide near by the water resource, 30% farmers do
not use special case to cleaning up the pesticides equipments, no consider the blow of wind on
spraying time, 44.2% do not have a ventilated pesticide storage area, and 93% rooms was not
locked. There is a 25.6% do not use labeled pesticides. There are some farmers who do not use
the appropriate protective equipment standard, which are 53.3% did not use cap, 69.77% did not
use gloves, 30.2% did not use a mask and 100% did not use boots.
Based on the results of surveys and interviews showed that the knowledge of pesticide
among the farmer children still low. It shown by 76.8% of children have less information about
pesticides, 88.5% have no information of insecticides, 61.5% did not know the usage of pesticides,
69.2% did not know the dangers of pesticides to the body. There are 40.4% children who do not
yet know how to store the pesticides, 86.5% answered do not know how to dispose of pesticides,
Public Health Department, Faculty of Sports Science, F1 Building, 2nd
Floor, Sekaran Campus Gunungpati, Semarang City, Central Java Province, Indonesia, 50229 Phone/ Fax. +6224 8508007
125
40.4% did not know how to clean the appliance. Beside it, there are 55.8% did not know the
protective equipment in agricultural land and 65.4% of children have never been told about
pestisida.
Based on interview to the farmer children, the lack of their knowledge about pesticides were
no education and information about pesticides from their teachers in schools. The content of
planting curriculum has been no material on the dangers of pesticides and their impact on health
and the environment.
Using pesticide could affect to the human health. Previous accident have occurred in
Kanigoro Magelang. There were 10 people killed cause poisoning pesticides in July 2007. Chronic
poisoning due to pesticides currently the most feared, because it can be carcinogenic toxic effects
(formation of cancerous tissue in the body), mutagenic (genetic damage to future generations), and
teratogenic (birth defects of the poisoned mother). Jenifer research in 2009, proved that raising risk
of cancer among people who exposed by pesticides. Result showed that 88% pregnant woman
exposed by pesticides and 55% pregnant woman contaminated by high pesticides in their body.(
Rusiecki, 2009) Highly exposure of pesticides in pregnant woman that have a risk of hypertension
could harm their pregnancy.(Saldana, 2009) Organophosphate pesticides influence development
of neurotoxin and also metabolism in baby. (Adigun, 2010)
This research had applied education base of environmental with take a course about
pesticides and usage to children in Grobogan district. With the expectation that negative effect
from usage of pesticides can be avoid and children‘s health as a future generation can be raise.
Methods
Based on the aim of this research, this research was action research which done by activity
and action to revise to be better by doing step of planning, implementation and evaluation.
(Gunawan, 2004) This research took place in department of education area Penawangan sub
district Grobogan district.
Planning step was done by focus group discussion among department of education
Grobogan district and 39 principals to design course of pesticides and the danger. Secondly,
applied and evaluated the environmental education of pesticides and the danger among 26
students in 6th grade of Curut primary school. In the evaluation, was done with giving questions to
the students about pesticides to know the changing of knowledge about pesticides and the danger.
Results and Discussion
Based on the result of focus group discussion with department of education and principal
about result of research before, farmers behavior of using pesticides and knowledge of farmer‘s
child about pesticides, most of them participants agree if course about pesticides teach to the
students in primary school. As the answer of the participant:
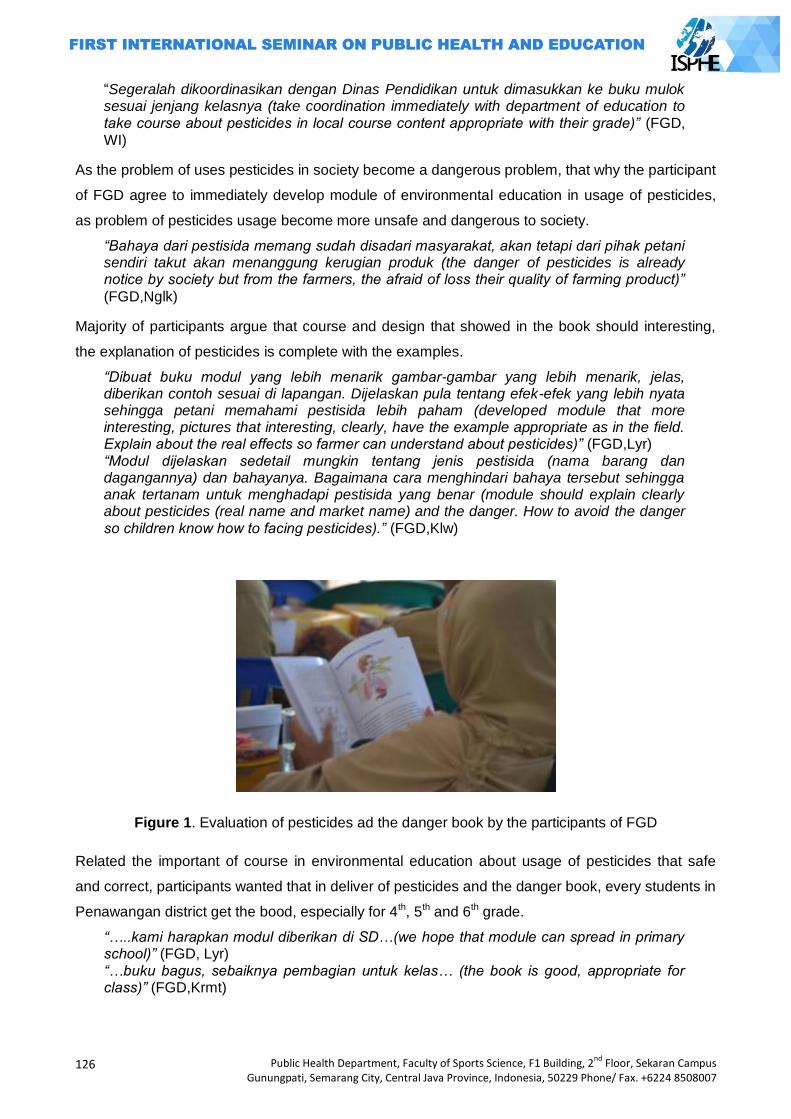
126
Public Health Department, Faculty of Sports Science, F1 Building, 2nd
Floor, Sekaran Campus Gunungpati, Semarang City, Central Java Province, Indonesia, 50229 Phone/ Fax. +6224 8508007
―Segeralah dikoordinasikan dengan Dinas Pendidikan untuk dimasukkan ke buku mulok sesuai jenjang kelasnya (take coordination immediately with department of education to take course about pesticides in local course content appropriate with their grade)” (FGD, WI)
As the problem of uses pesticides in society become a dangerous problem, that why the participant
of FGD agree to immediately develop module of environmental education in usage of pesticides,
as problem of pesticides usage become more unsafe and dangerous to society.
“Bahaya dari pestisida memang sudah disadari masyarakat, akan tetapi dari pihak petani sendiri takut akan menanggung kerugian produk (the danger of pesticides is already notice by society but from the farmers, the afraid of loss their quality of farming product)”
(FGD,Nglk)
Majority of participants argue that course and design that showed in the book should interesting,
the explanation of pesticides is complete with the examples.
“Dibuat buku modul yang lebih menarik gambar-gambar yang lebih menarik, jelas, diberikan contoh sesuai di lapangan. Dijelaskan pula tentang efek-efek yang lebih nyata sehingga petani memahami pestisida lebih paham (developed module that more interesting, pictures that interesting, clearly, have the example appropriate as in the field. Explain about the real effects so farmer can understand about pesticides)” (FGD,Lyr) “Modul dijelaskan sedetail mungkin tentang jenis pestisida (nama barang dan dagangannya) dan bahayanya. Bagaimana cara menghindari bahaya tersebut sehingga anak tertanam untuk menghadapi pestisida yang benar (module should explain clearly about pesticides (real name and market name) and the danger. How to avoid the danger so children know how to facing pesticides).” (FGD,Klw)
Figure 1. Evaluation of pesticides ad the danger book by the participants of FGD
Related the important of course in environmental education about usage of pesticides that safe
and correct, participants wanted that in deliver of pesticides and the danger book, every students in
Penawangan district get the bood, especially for 4th, 5th and 6th grade.
“…..kami harapkan modul diberikan di SD…(we hope that module can spread in primary school)” (FGD, Lyr) “…buku bagus, sebaiknya pembagian untuk kelas… (the book is good, appropriate for class)” (FGD,Krmt)
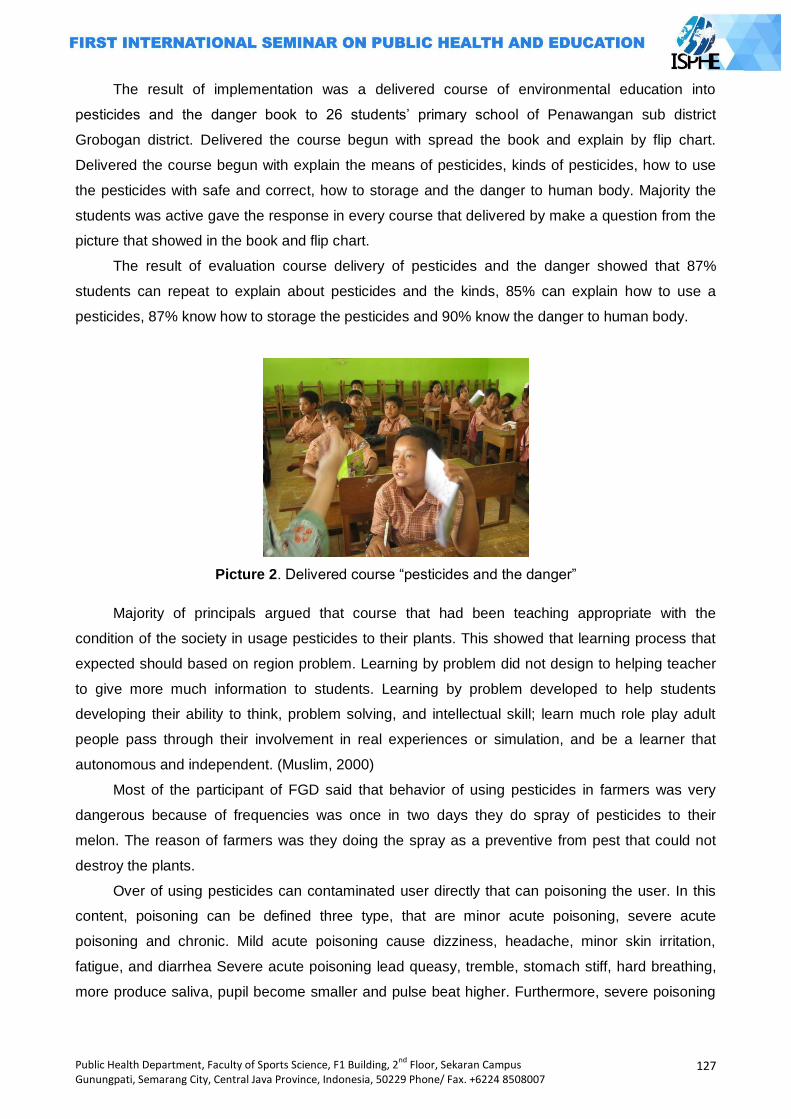
Public Health Department, Faculty of Sports Science, F1 Building, 2nd
Floor, Sekaran Campus Gunungpati, Semarang City, Central Java Province, Indonesia, 50229 Phone/ Fax. +6224 8508007
127
The result of implementation was a delivered course of environmental education into
pesticides and the danger book to 26 students‘ primary school of Penawangan sub district
Grobogan district. Delivered the course begun with spread the book and explain by flip chart.
Delivered the course begun with explain the means of pesticides, kinds of pesticides, how to use
the pesticides with safe and correct, how to storage and the danger to human body. Majority the
students was active gave the response in every course that delivered by make a question from the
picture that showed in the book and flip chart.
The result of evaluation course delivery of pesticides and the danger showed that 87%
students can repeat to explain about pesticides and the kinds, 85% can explain how to use a
pesticides, 87% know how to storage the pesticides and 90% know the danger to human body.
Picture 2. Delivered course ―pesticides and the danger‖
Majority of principals argued that course that had been teaching appropriate with the
condition of the society in usage pesticides to their plants. This showed that learning process that
expected should based on region problem. Learning by problem did not design to helping teacher
to give more much information to students. Learning by problem developed to help students
developing their ability to think, problem solving, and intellectual skill; learn much role play adult
people pass through their involvement in real experiences or simulation, and be a learner that
autonomous and independent. (Muslim, 2000)
Most of the participant of FGD said that behavior of using pesticides in farmers was very
dangerous because of frequencies was once in two days they do spray of pesticides to their
melon. The reason of farmers was they doing the spray as a preventive from pest that could not
destroy the plants.
Over of using pesticides can contaminated user directly that can poisoning the user. In this
content, poisoning can be defined three type, that are minor acute poisoning, severe acute
poisoning and chronic. Mild acute poisoning cause dizziness, headache, minor skin irritation,
fatigue, and diarrhea Severe acute poisoning lead queasy, tremble, stomach stiff, hard breathing,
more produce saliva, pupil become smaller and pulse beat higher. Furthermore, severe poisoning
128
Public Health Department, Faculty of Sports Science, F1 Building, 2nd
Floor, Sekaran Campus Gunungpati, Semarang City, Central Java Province, Indonesia, 50229 Phone/ Fax. +6224 8508007
can caused unconscious, stiff, and also cause death. Chronic poisoning harder to detected
because have no specific symptoms. (Sinulingga, 2006)
This is proved by practice of using pesticides by melon‘s farmers in Grobogan district Curut
and Wedoro village Penawangan Sub district, much of them that used pesticides not in
appropriate such as 25.6% farmers mix the pesticides near fount, 30% of farmers did not used a
special place to cleaning sprayer. 44.2% of farmers did not pay attention of wind direction, storage
place of pesticides in room without any ventilation and 93% of room did not locked. 25.6% farmers
still used pesticides without label. Safety equipments that used by farmers were not in standard
and not complete in used. 53.5% did not used hat, 69.77% did not used gloves, 30.2% did not
used mask and 100% did not used boot.
Teaching method was conceptual design pass through systematic procedures into organized
teaching experience to get the aim of teaching and have a function as guide to planner learning to
design and doing activities of teaching. (Sukayati, 2004)
Giving complete explanation about pesticides and the examples that used by local society
was expected to give understanding based on daily problem. Learning model based on problems is
an effective approach to learning process of high level thinking. This learning can help students to
process information that they know before and develop their own knowledge about social world
and around. This learning is match to develop basic knowledge although complex knowledge.
(Sukayati, 2004)
Information media were book and flip chart, that was quite effective to raising the students
knowledge about pesticides and the danger. Media is a physically tool to delivered content or
education course. The benefits of media was make the process of learning become more efficient
and interactive and also learning process can be two ways learning. Media make the students able
to remembered about course that they ever attended. (Chomsin, 2008)
Based on Lawrence Green, knowledge is predisposing factor to lead changing of behavior.
Lawrence Green also described about enabling factor is also become the variable to lead changing
of behavior, that is from the availability infrastructure of supporting behavior.(Green, 1980) That is
why behavior of safe and correct in using pesticides influence by better knowledge and the
availability of information media that is book of pesticides and the danger to students in primary
school that can fulfill necessary of society information especially students (farmer‘s child) about
pesticides.
Result of research about necessary of information students to the availability collection
showed that there was positively correlation and significant between necessary of information
students with the availability collection in library with the correction value 0.98. Coefficient
determination is 0.96. Which showed that necessary of information students can explain the
availability collection in library of St. Pertus high school Sidikalang was 96%, whereas 4%
explained by other factor that did not explain in this research.(Sihite, 2011) To support the
Public Health Department, Faculty of Sports Science, F1 Building, 2nd
Floor, Sekaran Campus Gunungpati, Semarang City, Central Java Province, Indonesia, 50229 Phone/ Fax. +6224 8508007
129
availability of information about pesticides, then was done delivered of 3.000 books ―pesticides and
the danger‖ to all students in 4th, 5th and 6th grade Penawangan sub district Grobogan district.
Closing
Environmental education about safe and correct of using pesticides really needed by
students and can be accepted as a local course in education curriculum base on environmental.
The Interactive learning with book and flip-chart ―pesticides and its danger‖, really helping to
achieve better learning result. It was proved by half of the students can re-explain of course that
was teach (87%). Main tools support such book ―pesticides and the danger‖ aims to wider the
covered of socialization environmental education model in safe and correct of using pesticides.
Commitment of department education and principals to realist environmental education about
using pesticides is influence to effect of education, which is raising the understanding of society in
safe and correct of using pesticides. Development of environmental education model on using
pesticides by school, really needed with adjust demand of development interactive learning
students.
Acknowledgement
The authors would like to thank the Ministry of Education and Culture of Indonesia, which
has helped to fund this research.
References
Adigun, A.A., Wrench, N., Seidler, F.J., Slotkin, T.A., 2010. Neonatal organophosphorus pesticide exposure alters developmental trajectory of cell signaling cascades controlling metabolism: Differential effects of diazinon and parathion. Evironmental Health Perspectives, 118(2), 210-215
Agriculture Department. 2012 Guidelines for Technical Assessment and Circulating Registered Pesticides. General Directorate of Agricultural Infrastructure. Ministry of Agriculture.
Chomsin. 2008. Develop guidelines competency-based teaching materials. London: Elex Media Komputindo
Green, Lawrence. 1980. Health education planning: a diagnostic approach. Post a Comment. W.Publisher: Mayfield Pub. Co. (Palo Alto, Calif.); 1980; 1st edition.
Gunawan. 2004. Papers for the meeting UKDW lecturer who will carry out the study in 2005; available from: URL: http://uny.ac.id,
Muslim, Ibrahim, et al. 2000. Cooperative learning. New York: University Press Rusiecki, Jennifer A., et.al. 2009. Cancer incidence among pesticides applicators exposed to
permethrin in the Agricultural Health Study, Environmental Health Perspectives; volume 117, number 4, April.
Saldana, Tina M., et al. 2009. Pesticides exposure and hypertensive disorders during pregnancy. Journal Environmental Health Perspectives; Volume 117 No. 9
Sinulingga. 2006. Residue study on carrot Daucus carota organoklor L in the center of the district. Karo of North Sumatra. Journal of Industrial Engineering Systems. Volume 7, No. January 1.
Sukayati. 2004. Examples of models of learning mathematics in elementary education and training delivered to the instructor: Available from: http: //p4tkmatematika.org/downloads/sd/ ModelPembelajaran.pdf

130
Public Health Department, Faculty of Sports Science, F1 Building, 2nd
Floor, Sekaran Campus Gunungpati, Semarang City, Central Java Province, Indonesia, 50229 Phone/ Fax. +6224 8508007
Sihite, Kristina. 2011. Relationship with the availability of the information needs of students in library school collections support learning in high school St. Peter Sidikalang; Available from: http://repository.usu.ac.id/handle/123456789/24161.
Public Health Department, Faculty of Sports Science, F1 Building, 2nd
Floor, Sekaran Campus Gunungpati, Semarang City, Central Java Province, Indonesia, 50229 Phone/ Fax. +6224 8508007
131
CORRELATION BETWEEN FITNESS WITH WOMEN WORK PRODUCTIVITY
Cahyo Yuwono1, Wahadi1, Sugiharto1
1 Semarang State University, Indonesia
Corresponding Author:[email protected]
Abstract
Introduction: The problem is there any correlation between fitness with women work productivity in spinning unit 5 subdivision ring frame morning shift PT Apac Inti Corpora Bawen. Purpose of the research is: how to know correlation between fitness with women work productivity in spinning unit 5 subdivision ring frame morning shift PT Apac Inti Corpora Bawen. Methods:Type of the research is an explanatory research by using an anatycal survey method and cross-sectional approach. Population of the research was all of women employee in spining unit 5 subdivision ring frame morning shift PT Apac Inti Corpora Bawen year 2009 with 58 people. The research is sample was 46 people how take from inclusion-eclusion technique. Data that was obtained with questionnaire and Harvard Step-Up Test. Data it was analyzed by using chi-square statistical test at significance degree of (α=5%). Results:The research result univariat indicated there is respondent have a less fitness 39.1%, medium fitness 54.3% and good fitness 6.5%. Respondent who have a low fitness is 67.4% and high fitness is 32.67%. From test statistical get obtained is there correlating between fitness with work productivity (p=0.002).
Key Words : Fitness, harvard step-up test, work productivity.
Introduction
Improvement of health, the more encouraged tune in with the changing times. It aims to
achieve the World Health (WHO), is covering physical health, spiritual and social. In the whole
Indonesian human development, absolute fitness of each individual must be owned by Indonesian
peoples as needed.
Labor as human resources have an important role in the industrial development process. For
a company workforce is an asset that determine the success of the company, both in gain and in
the continuity of the company and business development.
The globalization era brings many changes and challenges which need to be anticipated
earlier. Prominent features in all aspects of life raises the interdependence, the need for
competition on the quality of the product or service as well as the human element of its workforce
(AM Sugeng Budiono, 2003).
According to Len Kravits (2001) physical fitness is a way of life that allows your body to
function and get the best look. It is a harmonious consideration of the provision of exercise, healthy
eating habits, maintaining health, managing stress effectively, and think a healthy lifestyle.
General overview of organs ability to function in a state of someone who is relatively passive,
expressed in terms of static health, and the situation of human organs to function normally. On the
contrary, if the organs are able to function normally in a state of a person moving and working
stints, this condition is expressed in terms of dynamic health. Therefore, it is easy to understand if

132
Public Health Department, Faculty of Sports Science, F1 Building, 2nd
Floor, Sekaran Campus Gunungpati, Semarang City, Central Java Province, Indonesia, 50229 Phone/ Fax. +6224 8508007
health quality is an dynamic absolute demand in everyday life. A dynamic healthis a foundation for
an adequate fitness. Similarly, fatigue recovery process will take place smoothly through a routine
mechanism. Hardwork could cause fatigue and so recovery happens until someone feels fit again
and ready to run the next task. The higher a person's level of fitness, the higher the productivity of
its work (Rusli Lutan, 2000).
Apac Inti Corpora is one of the industrial company centers are located in Bawen Region
Semarang Regency, with a workforce of different educational background. Based on the results of
the initial survey of 20 workers, those with less fitness as many as 12 people (60%) and who has a
good fitness as many as 8 people (40%). Workers with low productivity as many as 15 people
(75%) and the high productivity of 5 people (25%). They work for 8 hours a day. Activity in from
08.00 pm until 16.00 pm and break in at 12:00 to 13:00 pm. In the production process the company
uses machines and work in units of the ring frame 5 Spining performed by workers who are mostly
women, from 60 workers in the ring frame of which there are 58 women and 2 labor labor male.
Because women have physically weaker than men, women owned muscle mass is also not as
strong as men. Thus they need to support fitness activities. With a good level of fitness, it is
expected that the labor productivity of PT APAC INTI CORPORA Bawen will be higher.
Problem formulation
Based on the above description of the background, the formulation of the problem in this
study is: Is there a relationship between fitness and productivity of female workers at Spining Unit 5
Ring Frame Part, Morning Shift in PT APAC INTI CORPORATION
Theorical framework
The fitness is generally used, has the same meaning as physical fitness which is the physical
aspects of total fitness. Fitness have a different levels for everyone, such as the level of fitness of a
housewife is not the same as a Marine or fitness level sportsmen, doctors, and so forth, so that the
experts give a different meaning from the each perspective because in it contains very complex of
fitness things. Fitness is the body ability of someone to perform daily work tasks without causing
significant fatigue and ready to do the next job (Dangsina Moeloek, 1984).
From the point of view Fitness is the physiological capacity to adjust to a grueling workout and
recover from the effects of the exercise (Arma Abdullah, 1994). M. Sajoto (1988) fitness is the ability
to complete the daily tasks without spending considerable energy to meet the needs of motion and
enjoy leisure time as well as to meet emergency needs at any time if necessary. Meanwhile,
according to Sudarno SP (2000) fitness is a condition when the body is able to perform their dailly
task well and efficiently, without significant fatigue and body still has a good back-up power to cope
with sudden emergencies or to enjoy leisure with active leisure .
Physical fitness function
Humans always craved a satisfaction and happiness in his life. Necessities of life that is
increasingly growing makes humans strive to fulfill it, then with the harder people try to face
life's challenges in meeting the needs required so that the human body healthy will be easier to
Public Health Department, Faculty of Sports Science, F1 Building, 2nd
Floor, Sekaran Campus Gunungpati, Semarang City, Central Java Province, Indonesia, 50229 Phone/ Fax. +6224 8508007
133
perform activities well. And function of physical fitness is to develop the capability, ability
creative ability and durability of every human being useful to enhance their power (Kamiso A.,
1991).
There are various elements of fitness are closely interrelated with each other. Sorts of
elements of physical fitness are as follows: cardiorespiratory ability, muscle strength, pace,
agility, flexibility, balance, coordination, speed reaction, bodycomposition. In general, fitness
directed to: (1) durability; (2) balance; (3) attitude and behavior are elements of mental health. From
the above description clearly proved that fitness is not just a problem can be separated from the
elements of speed, agility, balance, and strength (Kamiso A., 1988).
Generally, women are preferred elements: speed, agility to change direction, balance, strength
(Hasnan Said, 1980).
Factors that affecting the physical fitness
Fitness of each individu are different, it is influenced by:
Heredity
Heredity is responsible for 25% to 40% of the difference in the value of VO2max. More than
half the maximal aerobic power difference due to genotype differences, with other environmental
factors as a cause (Brian J. Sharkey, 2003).
Exercise
Exercise is a planned and structured body movement and carried out repeatedly to enhance
or maintain fitness components (Rusli Lutan, 2002). Meanwhile, according to Dangsina Moeloek
(1984) Physical exercise is a physical activity in the manner and certain rules that have targeted
improving the efficiency of the body's physiology and the end result is an increase in fitness.
If the purpose of the exercise just to maintain or to improve fitness is not to improve sports
performance, then the frequency of moderate exercise 3-5 times a week. Each practice time spent
between 15-60 minutes to exercise its core (Sudarno SP, 1992).
Gender
Before entering puberty boys and women have slightly different aerobic fitness, but after
that the girls are far behind. Average young woman has aerobic fitness between 15 to 25%
smaller than young men, depending on their activity level (Brian J. Sharkey, 2003).
Age
With the decline of 8 to 10% per decade for individuals who are not active, regardless of
their initial fitness level. For the active, can stop half of the decline 4 to 5% per decade, and
involved in fitness training can stop the other half 2.5% per decade (Brian J. Sharkey, 2003).
Activity
Physical activity is a variety of gestures produced by skeletal muscle system which results
in energy expenditure (Rusli Lutan, 2000).
Fitness goals and objectives will always depend on an object, an object that is(1)
Expandthe Physical Fitness for the student and the student's ability and willingness to learn;
134
Public Health Department, Faculty of Sports Science, F1 Building, 2nd
Floor, Sekaran Campus Gunungpati, Semarang City, Central Java Province, Indonesia, 50229 Phone/ Fax. +6224 8508007
(2) Physical Fitness for athletes to maintain the condition and improve performance; (3) Fitness
for manpower, personnel and farmers to improve efficiency and work productivity
Work Productivity
Labor productivity is the efficiency of the process generating the resources used (banner
Anoraga, 2006). Productivity The term comes from the English language are: product, meaning
that it produces, and productivity which means the ability to generate productivity is the ratio of
multiple outputs with multiple inputs or the results obtained persumber power used during
production (J. Ravianto in Kartikasari C., 1999).
According A.M. Sugeng Boediono (2003) productivity have some understanding. Firstly,
according to physiological sense, productivity implies a mental attitude that always has the view
that quality of life should be better today than yesterday, tomorrow should be better than today. In
a company or a factory, management must continually make improvements of production
processes, work systems, work environment, technology, and others. Second, productivity is the
ratio between the output (output) and input (input).
Labor is any person who is able to do the job of producing a good or service to meet the
needs of both themselves and society. While every person who works for a wage or
compensation in the form of money called a worker or laborer (AMSugeng Boediono, 2001).
Factors affecting labor productivity
In order for a labor in a state of conformity as well as possible which means it can be
guaranteed health status and work productivity as high, it is necessary to have a favorable balance
of several factors among which the workload factors, the additional load due to work environment,
work capacity (Suma 'nut PK, 1999).
The ability of labor differ from each other and are influenced by several factors: gender, age,
years of service, the health and nutritional status (Suma'mur PK, 1999).
Fitness is supporting someone productivity in the work. The fitness starts since entering the
job and continues to be maintained during the work, even after the work stopped. Fitness does not
only reflect the physical and mental health, but also one's picture adjustments harmony with their
job, which is heavily influenced by the ability, experience, education and knowledge they have.
According Suma'mur PK (1996), there are differences between men and women was
labor which includes the following aspects: the physical body size and muscle strength of
female labor relatively less when compared to men. This fact as a result of a calm hormonal
influences between women and men.
Biological nature of women workers experienced a menstrual and pregnancy. Although
the work does not interfere with normal menstruation but in Indonesian female workers are not
allowed to work on the first day and the second day of menstruation.
Fitness Relationship with Work Productivity
Humans have always craved satisfaction and happiness in his life. Necessities of life that
is increasingly bertambahmembuat man trying hard to fulfill, and in that case people try to face
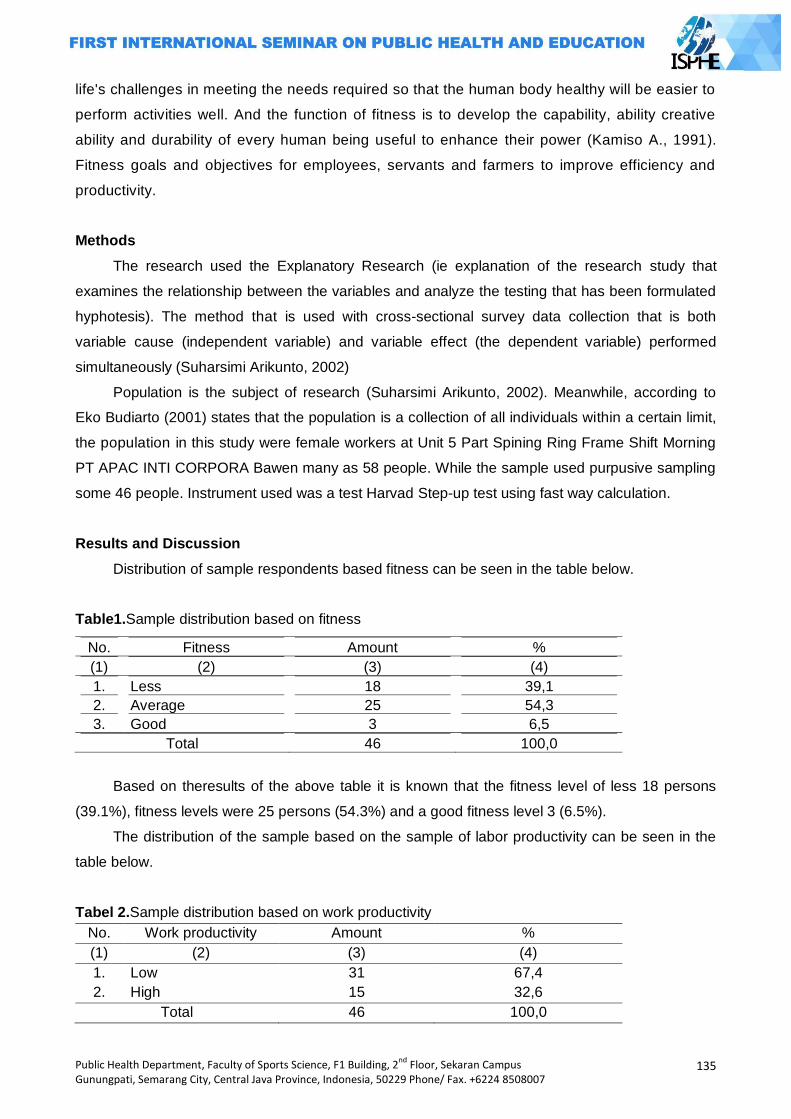
Public Health Department, Faculty of Sports Science, F1 Building, 2nd
Floor, Sekaran Campus Gunungpati, Semarang City, Central Java Province, Indonesia, 50229 Phone/ Fax. +6224 8508007
135
life's challenges in meeting the needs required so that the human body healthy will be easier to
perform activities well. And the function of fitness is to develop the capability, ability creative
ability and durability of every human being useful to enhance their power (Kamiso A., 1991).
Fitness goals and objectives for employees, servants and farmers to improve efficiency and
productivity.
Methods
The research used the Explanatory Research (ie explanation of the research study that
examines the relationship between the variables and analyze the testing that has been formulated
hyphotesis). The method that is used with cross-sectional survey data collection that is both
variable cause (independent variable) and variable effect (the dependent variable) performed
simultaneously (Suharsimi Arikunto, 2002)
Population is the subject of research (Suharsimi Arikunto, 2002). Meanwhile, according to
Eko Budiarto (2001) states that the population is a collection of all individuals within a certain limit,
the population in this study were female workers at Unit 5 Part Spining Ring Frame Shift Morning
PT APAC INTI CORPORA Bawen many as 58 people. While the sample used purpusive sampling
some 46 people. Instrument used was a test Harvad Step-up test using fast way calculation.
Results and Discussion
Distribution of sample respondents based fitness can be seen in the table below.
Table1.Sample distribution based on fitness
No. Fitness Amount %
(1) (2) (3) (4)
1. Less 18 39,1
2. Average 25 54,3
3. Good 3 6,5
Total 46 100,0
Based on theresults of the above table it is known that the fitness level of less 18 persons
(39.1%), fitness levels were 25 persons (54.3%) and a good fitness level 3 (6.5%).
The distribution of the sample based on the sample of labor productivity can be seen in the
table below.
Tabel 2.Sample distribution based on work productivity
No. Work productivity Amount %
(1) (2) (3) (4)
1. Low 31 67,4
2. High 15 32,6
Total 46 100,0
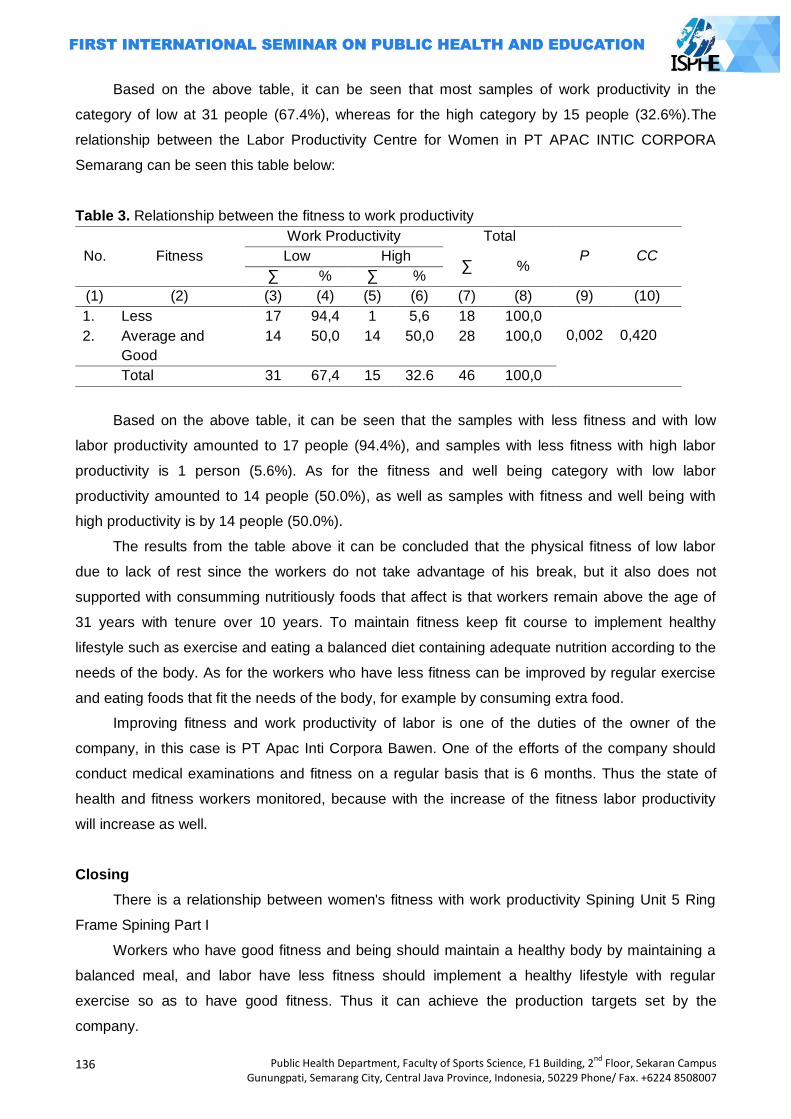
136
Public Health Department, Faculty of Sports Science, F1 Building, 2nd
Floor, Sekaran Campus Gunungpati, Semarang City, Central Java Province, Indonesia, 50229 Phone/ Fax. +6224 8508007
Based on the above table, it can be seen that most samples of work productivity in the
category of low at 31 people (67.4%), whereas for the high category by 15 people (32.6%).The
relationship between the Labor Productivity Centre for Women in PT APAC INTIC CORPORA
Semarang can be seen this table below:
Table 3. Relationship between the fitness to work productivity
No. Fitness
Work Productivity Total
P CC Low High ∑ %
∑ % ∑ %
(1) (2) (3) (4) (5) (6) (7) (8) (9) (10)
1. Less 17 94,4 1 5,6 18 100,0
0,002
0,420 2. Average and
Good
14 50,0 14 50,0 28 100,0
Total 31 67,4 15 32.6 46 100,0
Based on the above table, it can be seen that the samples with less fitness and with low
labor productivity amounted to 17 people (94.4%), and samples with less fitness with high labor
productivity is 1 person (5.6%). As for the fitness and well being category with low labor
productivity amounted to 14 people (50.0%), as well as samples with fitness and well being with
high productivity is by 14 people (50.0%).
The results from the table above it can be concluded that the physical fitness of low labor
due to lack of rest since the workers do not take advantage of his break, but it also does not
supported with consumming nutritiously foods that affect is that workers remain above the age of
31 years with tenure over 10 years. To maintain fitness keep fit course to implement healthy
lifestyle such as exercise and eating a balanced diet containing adequate nutrition according to the
needs of the body. As for the workers who have less fitness can be improved by regular exercise
and eating foods that fit the needs of the body, for example by consuming extra food.
Improving fitness and work productivity of labor is one of the duties of the owner of the
company, in this case is PT Apac Inti Corpora Bawen. One of the efforts of the company should
conduct medical examinations and fitness on a regular basis that is 6 months. Thus the state of
health and fitness workers monitored, because with the increase of the fitness labor productivity
will increase as well.
Closing
There is a relationship between women's fitness with work productivity Spining Unit 5 Ring
Frame Spining Part I
Workers who have good fitness and being should maintain a healthy body by maintaining a
balanced meal, and labor have less fitness should implement a healthy lifestyle with regular
exercise so as to have good fitness. Thus it can achieve the production targets set by the
company.
Public Health Department, Faculty of Sports Science, F1 Building, 2nd
Floor, Sekaran Campus Gunungpati, Semarang City, Central Java Province, Indonesia, 50229 Phone/ Fax. +6224 8508007
137
For owners of the company should be an effort to maintain and improve fitness is the fitness
health checks and periodic checks every 6 months so that worker productivity will increase. Due to
the increasing fitness workforce, it will also increase the productivity of the worker.
References
A. Kamiso, 1991, Dasar-dasar Kepelatihan, Semarang: FPOK IKIP Semarang.
A.M. Sugeng Budiono, dkk, Bunga Rampai Hiperkes dan KK, Semarang: Badan Penerbit UNDIP.
Arma Adullah, 1994, Dasar-dasar Pendidikan Jasmani, Jakarta: KBI.
Brian J Sharkey, 2003, Kebugaran dan Kesehatan, Jakarta: PT Raja Grafindo Persada.
Dale Carmegie, 1996, Bagaimana Mencari Kawan dan Mempengaruhi Orang Lain, Jakarta:
Binarupa Aksara.
Dangsina Moeloek, 1984,Kesehatan dan Olahraga, Jakarta: FKUI.
Depdikbud, 1996, Ketahuilah Tingkat Kesegaran Jasmani Anda, Jakarta: Depdikbud.
Depkes RI, 1996, Modul Kesehatan Olahraga untuk Perawat, Jakarta: Depkes.
______, 2003, Modul PelatihanBagi Fasilitator Kesehatan Kerja, Jakarta: Depkes.
Edmund R Bruke, 2001, Latihan Kebugaran di Rumah, Jakarta: PT Raja Grafindo Persada.
Hasnan Said, 1987,ErobikaKegiatan Sehari-hari, Jakarta: Balai Pustaka.
Len Kravits, 2001,Panduan Lengkap Bugar Total, Jakarta: PT Raja Grafindo Persada.
Lynne Brick, 2002, Bugar dengan Senam Aerobik, Jakarta:PT Raja Grafindo Persada.
Mary P.M.C Gowan, 2001, Menjaga Kebugaran Jantung, Jakarta: PT Raja Grafindo Persada.
M. Sajoto,1988,Pembinaan Kondisi Fisik dalam Olahraga, Jakarta: Depdikbud.
Sendarmayanti, 2001, Sumber Daya Manusia dan Produktivitas Kerja, Bandung: CV Mandar Maju.
Soekidjo Notoatmodjo, 2000, Metodologi Penelitian Kesehatan, Jakarta: Rineka Cipta.
Sopiyudin Dahlan, 2004, Statistika untuk Penelitian, Bandung: CV Alfa Beta.
Sudarno SP, 1992,Pendidikan Kesegaran Jasmani, Jakarta: Depdikbud.
Wignojosoebroto dkk, 2000, Ergonomi Studi Gerak dan Waktu Teknik Analisis untuk Peningkatan
Produktivitas Kerja, Surabaya: Institut Teknolodi Sepuluh November.
Sugiyono, 2005, Statistika untuk Penelitian, Bandung: CV Alfa Beta.
Suharsimi Arikunto, 2002, Prosedur Penelitian, Jakarta: Rineka Cipta.
Tarwaka, dkk, 2004, Ergonomi untuk Keselamatan Kesehatan Kerja dan Produktivitas, Surakarta:
UNIBA Press.
138
Public Health Department, Faculty of Sports Science, F1 Building, 2nd
Floor, Sekaran Campus Gunungpati, Semarang City, Central Java Province, Indonesia, 50229 Phone/ Fax. +6224 8508007
DEVELOPING PHBS-AS BOOKS INTO BRAILLE LETTERS IN ITS EFFECT ON KNOWLEDGE, ATTITUDE AND PRACTICE OF PHBS FOR BLIND STUDENTS OF SDLB
Irwan Budiono, Hadi Setyo Subiyono
Semarang State University, Indonesia
Corresponding Author:[email protected]
Abstract Intriduction: Health education at every level of formal education is the important development investments, including in Extraordinary primary schools (SLB). The results of a preliminary study on the SLB in Semarang showed 60% of students with visual impairment have lacking knowledge to live in clean and healthy behaviors (PHBS), and it was also found that PHBS book media with Braille letters is not available. Therefore, research on the development of health education with PHBS books in braille letters was in need to be carried out. Methods:This experimental study used before and after intervention design without a control
group. The variables observed were knowledge, attitudes, and practices of PHBS for students before and after the intervention. The sample of the study included all students with visual impairments in SLB A DriaAdi and State SLB of Semarang in academic year 2012/2013 with 24 students. Results: The results show that the intervention in health education with PHB Braille lettered books could improve the knowledge, attitude and practice of PHBS for the students. For wider application it is suggested to give special assistance to students who are not fluent in reading braille letters. Besides, it is also needed the support from the other parties in directing students to carry message about littering and the selection of street food. Keywords: PHBS-AS, blind, braille
Introduction
Indonesia is currently facing an epidemiological transition that results in the emergence of
the double burden of health. On one side, the occurrence of the infectious diseases remains high,
and on the other hand, the occurrence of chronic degenerative diseases also increases. Thus, it is
required the awareness of all parties to improve the quality of health education that starts from the
most basic formal education. There is no exception in this regard, this means that it also includes
health education for primary school children with special needs, (SLB) blind students (Suhardjo,
2003).
For school-age children, health education should include cognitive, affective, and
psychomotor behavior to build a clean and healthy life (PHBS) in the school environment
(Khomsan, 2003). The results of a preliminary study in January 2013 in the SLB A (blind) in
Semarang showed 60% of students' knowledge of PHBS was in the category of less. In addition,
preliminary studies have also found that there has been no PHBS media / book for blind people in
Braille letters. This condition should be the concern of many parties to create a PHBS book for
school children (PHBS-AS) in Braille.
Blind children have slightly different characteristics with normal children. Although the
calculation skills, receive information and vocabulary almost equal to normal children, but there are
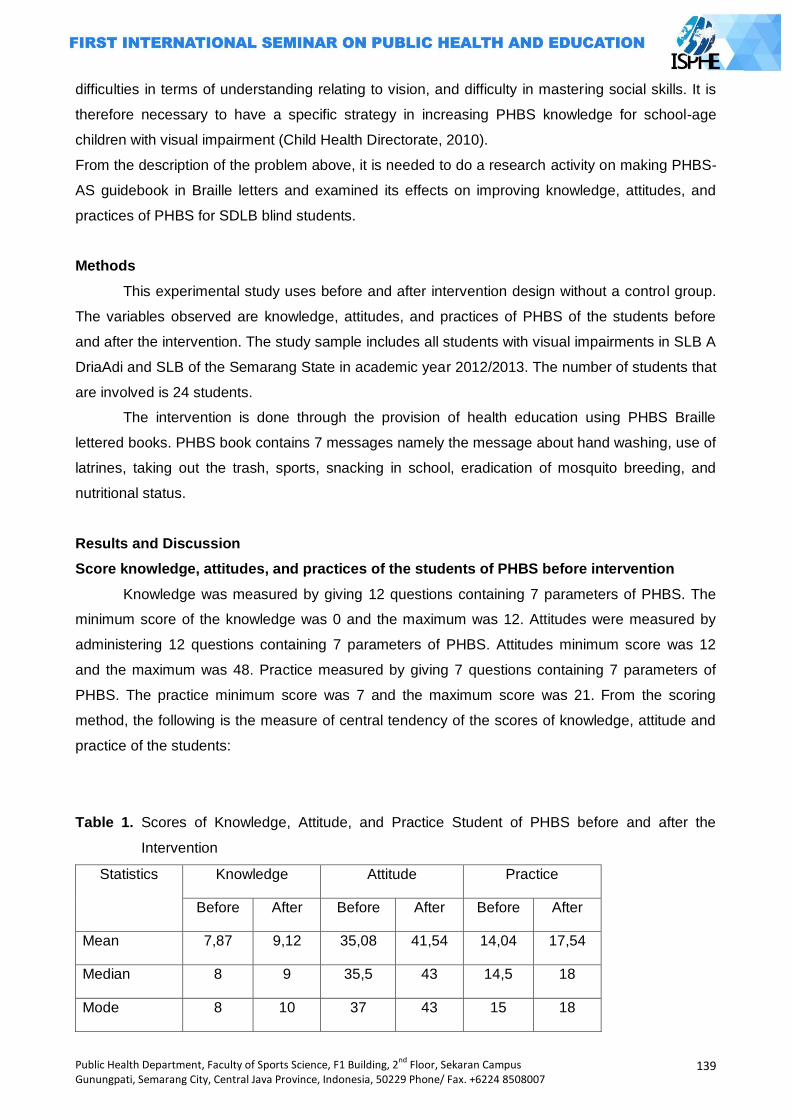
Public Health Department, Faculty of Sports Science, F1 Building, 2nd
Floor, Sekaran Campus Gunungpati, Semarang City, Central Java Province, Indonesia, 50229 Phone/ Fax. +6224 8508007
139
difficulties in terms of understanding relating to vision, and difficulty in mastering social skills. It is
therefore necessary to have a specific strategy in increasing PHBS knowledge for school-age
children with visual impairment (Child Health Directorate, 2010).
From the description of the problem above, it is needed to do a research activity on making PHBS-
AS guidebook in Braille letters and examined its effects on improving knowledge, attitudes, and
practices of PHBS for SDLB blind students.
Methods
This experimental study uses before and after intervention design without a control group.
The variables observed are knowledge, attitudes, and practices of PHBS of the students before
and after the intervention. The study sample includes all students with visual impairments in SLB A
DriaAdi and SLB of the Semarang State in academic year 2012/2013. The number of students that
are involved is 24 students.
The intervention is done through the provision of health education using PHBS Braille
lettered books. PHBS book contains 7 messages namely the message about hand washing, use of
latrines, taking out the trash, sports, snacking in school, eradication of mosquito breeding, and
nutritional status.
Results and Discussion
Score knowledge, attitudes, and practices of the students of PHBS before intervention
Knowledge was measured by giving 12 questions containing 7 parameters of PHBS. The
minimum score of the knowledge was 0 and the maximum was 12. Attitudes were measured by
administering 12 questions containing 7 parameters of PHBS. Attitudes minimum score was 12
and the maximum was 48. Practice measured by giving 7 questions containing 7 parameters of
PHBS. The practice minimum score was 7 and the maximum score was 21. From the scoring
method, the following is the measure of central tendency of the scores of knowledge, attitude and
practice of the students:
Table 1. Scores of Knowledge, Attitude, and Practice Student of PHBS before and after the
Intervention
Statistics Knowledge Attitude Practice
Before After Before After Before After
Mean 7,87 9,12 35,08 41,54 14,04 17,54
Median 8 9 35,5 43 14,5 18
Mode 8 10 37 43 15 18
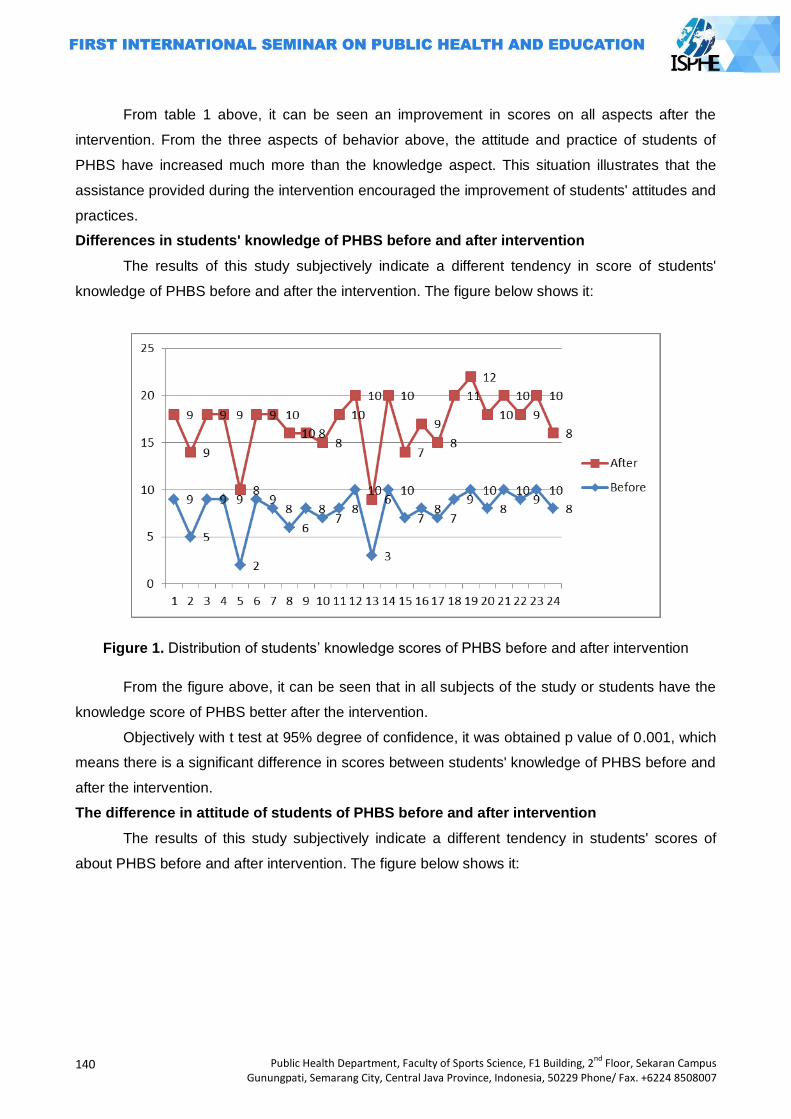
140
Public Health Department, Faculty of Sports Science, F1 Building, 2nd
Floor, Sekaran Campus Gunungpati, Semarang City, Central Java Province, Indonesia, 50229 Phone/ Fax. +6224 8508007
From table 1 above, it can be seen an improvement in scores on all aspects after the
intervention. From the three aspects of behavior above, the attitude and practice of students of
PHBS have increased much more than the knowledge aspect. This situation illustrates that the
assistance provided during the intervention encouraged the improvement of students' attitudes and
practices.
Differences in students' knowledge of PHBS before and after intervention
The results of this study subjectively indicate a different tendency in score of students'
knowledge of PHBS before and after the intervention. The figure below shows it:
Figure 1. Distribution of students‘ knowledge scores of PHBS before and after intervention
From the figure above, it can be seen that in all subjects of the study or students have the
knowledge score of PHBS better after the intervention.
Objectively with t test at 95% degree of confidence, it was obtained p value of 0.001, which
means there is a significant difference in scores between students' knowledge of PHBS before and
after the intervention.
The difference in attitude of students of PHBS before and after intervention
The results of this study subjectively indicate a different tendency in students' scores of
about PHBS before and after intervention. The figure below shows it:
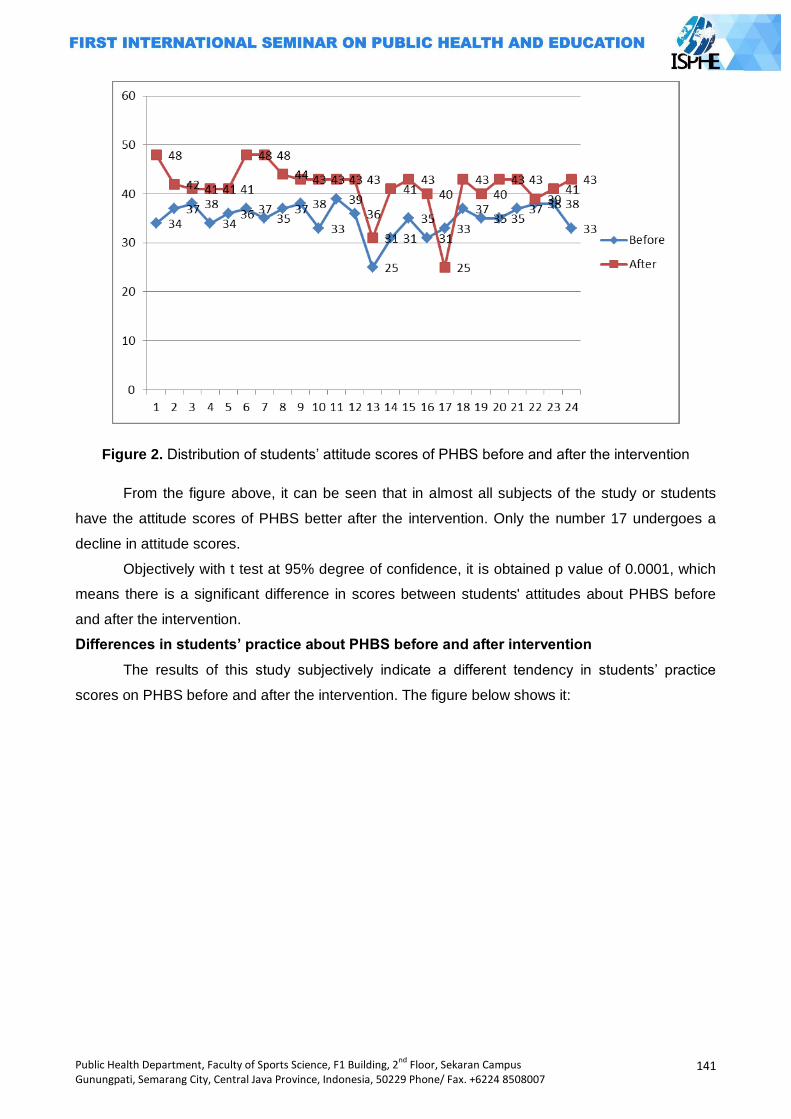
Public Health Department, Faculty of Sports Science, F1 Building, 2nd
Floor, Sekaran Campus Gunungpati, Semarang City, Central Java Province, Indonesia, 50229 Phone/ Fax. +6224 8508007
141
Figure 2. Distribution of students‘ attitude scores of PHBS before and after the intervention
From the figure above, it can be seen that in almost all subjects of the study or students
have the attitude scores of PHBS better after the intervention. Only the number 17 undergoes a
decline in attitude scores.
Objectively with t test at 95% degree of confidence, it is obtained p value of 0.0001, which
means there is a significant difference in scores between students' attitudes about PHBS before
and after the intervention.
Differences in students’ practice about PHBS before and after intervention
The results of this study subjectively indicate a different tendency in students‘ practice
scores on PHBS before and after the intervention. The figure below shows it:
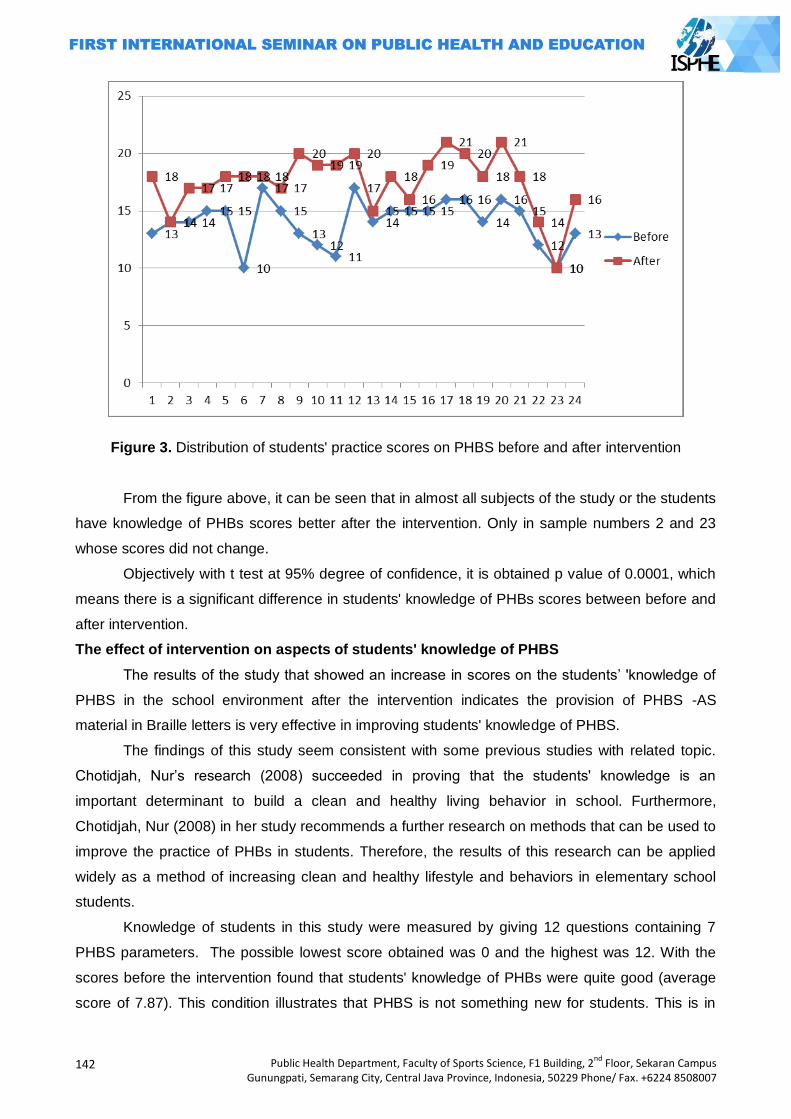
142
Public Health Department, Faculty of Sports Science, F1 Building, 2nd
Floor, Sekaran Campus Gunungpati, Semarang City, Central Java Province, Indonesia, 50229 Phone/ Fax. +6224 8508007
Figure 3. Distribution of students' practice scores on PHBS before and after intervention
From the figure above, it can be seen that in almost all subjects of the study or the students
have knowledge of PHBs scores better after the intervention. Only in sample numbers 2 and 23
whose scores did not change.
Objectively with t test at 95% degree of confidence, it is obtained p value of 0.0001, which
means there is a significant difference in students' knowledge of PHBs scores between before and
after intervention.
The effect of intervention on aspects of students' knowledge of PHBS
The results of the study that showed an increase in scores on the students‘ 'knowledge of
PHBS in the school environment after the intervention indicates the provision of PHBS -AS
material in Braille letters is very effective in improving students' knowledge of PHBS.
The findings of this study seem consistent with some previous studies with related topic.
Chotidjah, Nur‘s research (2008) succeeded in proving that the students' knowledge is an
important determinant to build a clean and healthy living behavior in school. Furthermore,
Chotidjah, Nur (2008) in her study recommends a further research on methods that can be used to
improve the practice of PHBs in students. Therefore, the results of this research can be applied
widely as a method of increasing clean and healthy lifestyle and behaviors in elementary school
students.
Knowledge of students in this study were measured by giving 12 questions containing 7
PHBS parameters. The possible lowest score obtained was 0 and the highest was 12. With the
scores before the intervention found that students' knowledge of PHBs were quite good (average
score of 7.87). This condition illustrates that PHBS is not something new for students. This is in
Public Health Department, Faculty of Sports Science, F1 Building, 2nd
Floor, Sekaran Campus Gunungpati, Semarang City, Central Java Province, Indonesia, 50229 Phone/ Fax. +6224 8508007
143
accordance with the Indonesian Ministry of Health actually have rolled out the PHBS program for
various environments, including schools (MOH, 2007).
Although the students' knowledge scores after the intervention showed a significant
improvement, there is still a need to evaluate to improve PHBS-AS program in the future. Based on
the survey results revealed that there are some aspects of PHBS braille book that need to be
improved, namely: (a) There is a need to emphasize that the habit of washing hands before eating
cannot be replaced simply by wiping hand. Actually all students have understood that before they
eat, they should wash their hands with water and soap. However, there are some students who
have a poor understanding who consider that hand washing with soap and water can be replaced
simply wiping hands with cloth; (b) Trash bin. The results showed all the students understand that
the waste must be disposed of in the trash bin. However there are some difficulties, especially if
there is only few of the trash bin available. For blind students, they need clearer instructions in
which they must dispose of the garbage; (c) Identifying healthy snacks. This becomes a typical
difficulty for blind students. Students‘s difficulties in choosing healthy snacks should receive an
assistance from teachers and school staff.
Effect of intervention on aspects of students' attitudes about PHBS
The results of the study showed an increase in attitude scores after the intervention. The
statistical test also showed a significant difference in attitude scores of students before and after
the intervention. This suggests that the provision of PHBS Braille material can be applied to
improve students‘ attitudes to build a clean and healthy living behavior.
There are some notes that need to be used as improvement material for school children of
PHBS program. The data of the results of this study show, although the attitude scores of students
on PHBS are pretty good, but in some aspects, some students have not demonstrated a positive
attitude. The attitude has not fully been positive supporting PHBS is about students‘ weight. Body
weight is an important anthropometic parameter for assessing nutritional status of the children. In
this study, this was revealed after the intervention that there are still some students who consider
weight monitoring is less important.
The effect of intervention on student practice aspects about PHBS
The results of this study showed an increase in students' scores on PHBs practices in the
school environment after intervention. The statistical results also reinforce the findings which say
that there is a significant difference between the practice scores of student before and after
intervention.
The results of this study are consistent with Mamdy‘s research (2001) which indicates that
a health education intervention program would improve cognitive and affective aspects.
Psychomotor aspects (the practice of a thing) will be formed with the support of good cognitive and
affective aspects. The results of the study showed an increase in scores of knowledge and attitude
of students on PHBs in this case, this seems to contribute to the expectations of student‘s
achievement in behavior about the appropriate PHBS.
144
Public Health Department, Faculty of Sports Science, F1 Building, 2nd
Floor, Sekaran Campus Gunungpati, Semarang City, Central Java Province, Indonesia, 50229 Phone/ Fax. +6224 8508007
The PHBS practice for school children consists of 7 behaviors, namely: (1) Hand washing with
clean water and soap; (2) Defecation / minor use latrines; (3) Disposing of waste in the trash bin;
(4) Exercise regularly (5) Consuming healthy snacks; (6) Eradicate mosquito larv; (7) Body weight
and height checked at least once every 6 months.
From the 7 expected behaviors, after the intervention of giving out the PHBS materials, all
behaviors have been carried out by students. This can be seen from the mode score of the
variable of the practice which has the value as expected (approaching the maximum score), which
means that the students have made a practice of PHBs according to the expectation.
Closing
Giving out the intervention increased students' score on knowledge of PHBS. Statistical test
showed a significant difference between the students' knowledge of PHBS before and after
intervention. The provision of intervention improved students' scores on attitudes of PHBS.
Statistical test showed a significant difference between the attitudes of students of PHBs before
and after intervention.
The provision of intervention improved students‘ scores on practice of PHBS. Statistical test
showed a significant difference between the practice of students of PHBS before and after
intervention.
In the implementation of the intervention, there are constraints that not all students know
how to read Braille letters. Therefore, if the PHBS braille books produced from this study will be
used, it is suggested the need for special assistance for students to understand the material
presented by the tutor PHBs. Especially about taking out the trash, it is necessary to support
facilities and infrastructure so that blind students can be assisted in the practice.
To improve the contents of the message about snacking in school, the results showed the difficulty
for students in choosing snacks in the absence of a teacher or assistant in directing the student's
choice. It is therefore recommended that schools provide nutrition education to parents about
healthy and nutritious food.
References
Chotidjah, Nur. 2008. Faktor-faktor yang berhubungandenganPerilakuHidupBersihdanSehat (PHBS) PadaSiswaKelas IV, V dan VI SekolahDasarNegeriJombang I KecamatanCiputat, KabupatenTangerang, BantenTahun 2008. Skripsi. Jakarta: FIKES UHAMKA
DirektoratBinaKesehatanAnak, 2010. PedomanPelayananKesehatanAnak di SekolahLuarBiasa (SLB) bagiPetugasKesehatan, KementerianKesehatan RI
Machfoedz, IrchamdanEkoSuryani, 2009. PendidikanKesehatanBagiandariPromosiKesehatan. Yogyakarta: Fitramaya
Fitriani, Sinta. 2011, PromosiKesehatan, Yogyakarta, GrahaIlmu Notoatmodjo, Soekidjo, 2010. PendidikandanPerilakuKesehatan. Jakarta: RinekeCipta Suhardjo. 2003. BerbagaiPendidikanGizi. Jakarta: BumiAksara Mamdy, Zulazmi. 2001. PendidikanKesehatandanIlmuPerilaku.JurnalIlmuKesehatan UHAMKA 1
(1): 10--25. 2001
Public Health Department, Faculty of Sports Science, F1 Building, 2nd
Floor, Sekaran Campus Gunungpati, Semarang City, Central Java Province, Indonesia, 50229 Phone/ Fax. +6224 8508007
145
CONTRIBUTION OF SOCIAL SUPPORT ELEMENT IN SUPPORTING THE NUTRITIONAL
STATUS OF TODDLERS
(A Case Study in Sangkanjoyo Village, Kajen Sub-district, Pekalongan Regency)
Oktia Woro KH., Tysa Runingsari
Semarang State University, Indonesia
Corresponding author: [email protected]
ABSTRACT
Malnutrition remains a development priority since it did not achieve the MDGs target by 2015. There are various factors that can affect nutritional status, one of the factors is social capital. In the social capital, there is social support element. So the purpose of this study was to determine the contribution of social support element that includes several aspects of the nutritional status of the toddlers in the Sangkanjoyo Village, Kajen Sub-district, Pekalongan Regency. This study uses qualitative research methods with the initial informant retrieval techniques using purposive sampling, then it takes an additional informant who come from the toddlers‘ family with a snow ball technique so that informants totaling 12 people. Techniques to collect data are by observation, in-depth interview, focus group discussions (FGD), and documentation study.
Analysis technique used is the analysis model of Miles and Huberman (Basrowi, 2008). The result of this study is that the toddlers in the Sangkanjoyo village have good nutritional status due to; the form of support provided is emotional support in the form of concern and attention toward the toddlers, instrumental support in the form of money, goods and services aid required to meet daily needs, informational support in the form of information, advice, suggestions or instructions concerning the care and nurturing infants, and esteem support in the form of positive expression or appreciation in parenting a toddler. Element of social support that contributes in supporting the nutritional status of toddlers is from family support, the support of neighbors, friends‘ support, the support of community leaders, government officials‘ support, values, norms, and beliefs (trust). While the elements that do not contribute in supporting the nutritional status of toddlers is of the support of political leaders and Non-Government Organizations (NGOs).
Keyword: Social Support, Nutritional Status, Toddler
INTRODUCTION
Nutritional problems nowadays do not only exist in Indonesia but a global problem that is
contained in the Millennium Development Goals (MDGs) that is to eradicate extreme poverty and
hunger (WHO, 2012). Indonesia itself has a double burden of nutritional problems, they are
malnutrition and over nutrition. According to the World Health Organizations (WHO), malnutrition
and over nutrition are closely related to an increased risk of mortality and morbidity. Malnutrition
and over nutrition also increases the risk of infectious and non-infectious diseases. But the problem
is still a priority at this time is the alleviation of malnutrition (WHO, 2012).
Malnutrition is the condition of a person's status is a lack of nutrients, or nutritional
substandard. In the malnutrition cases, women and young children will bear the burden of the
disease (Krisnansari, 2010). Toddlers exposed to malnutrition or poor nutrition will experience
health problems such as impaired growth, susceptible to infectious diseases, mental retardation,
146
Public Health Department, Faculty of Sports Science, F1 Building, 2nd
Floor, Sekaran Campus Gunungpati, Semarang City, Central Java Province, Indonesia, 50229 Phone/ Fax. +6224 8508007
and many more consequences. This will affect the quality of human resources and can damage
future generations so that they can influence the development of the nation (Hand, 2011: 11).
Various studies related to the nutrition stated that nutritional status can be caused by
medical conditions, family socioeconomic status, and other environmental factors such as the
community / culture, including social capital in society (Suhardjo, 1992; Baliwati, Yayuk et al,
2004). Social capital is a resource that can be viewed as an investment to get new resources.
Elements of social capital is social support, citizenship, and associations (social organization)
(Hasbullah, Jousairi., 2006: 5). In Indonesia with any form of social relations in the form of mutual
help, a sense of kinship, and a high sense of togetherness that allows for the development of
social capital, especially with regard to the social support.
In this case the social support is the social support provided by the local community and the
support of the social environment in order to support the nutritional status of toddlers. In the social
support element there is support for some aspects of the community as seen from the support of
family, neighbors, friends, community leaders, political leaders, and government officials. In the
interactions in society, it needs cooperation and social support to establish a pattern of reciprocal
and mutually beneficial and built on trust underpinned by norms and social values which are
positive and strong, especially for the purpose of getting a good nutritional status (Hasbullah,
Jousairi., 2006: 9).
Indonesia is in the fifth rank in cases of malnutrition. Statistics show that there is a
decrease in prevalence of malnutrition (from 14.8% in 2005 to 13.0% in 2011) and malnutrition
(9.7% in 2005 to 4.9 % in 2010), the national prevalence of malnutrition and malnutrition in 2010
amounted to 17.9% (WNPG, 2012). while according to the 2013 Basic Health Research
(RISKESDAS) showed that the prevalence of malnutrition and undernourishment in 2013
increased to comprising 19.6% 5.7% 13.9% malnutrition and malnutrition. These data illustrate that
the issue of nutrition should still be a priority because the development has not yet reached the
target Millennium Development Goals (MDG's) in 2015 is 15.5% (WNPG, 2012). Central Java has
entered the top 5 ranked malnutrition cases (1,597 cases). From reports 34 regencies / cities in
Central Java the highest number is of Pekalongan (129 cases) (MOH, 2011). The number of
Toddler Malnutrition in Pekalongan in 2010 are as many as 42 cases (0.08%) and the Lower Red
Line (BGM ) as many as 701 cases (1.29%) of the number of infants who weighed as much as 54
450 infants (DHO Pekalongan 2011: 21). For the year 2011 alone new cases appearing at least
138 cases (0.19%), making the total number of remaining cases in 2010 (62 cases / 0, 08%) and
combined in 2011 to 200 cases (0.27%) (Central Java Health Office, 2011).
In Pekalongan Regency there are 19 sub-district, one of the district that there are cases of
malnutrition and malnutrition which is high enough in the Kajen Sub-district. Kajen subdistrict is
divided into 10 villages and 1 sub-district, where cases of malnutrition and malnutrition spread
almost his entire villages and wards. However, there is a village consisting of 92 toddlers with
better nutritional status of children under five and the 114 number is not a case of malnutrition and
Public Health Department, Faculty of Sports Science, F1 Building, 2nd
Floor, Sekaran Campus Gunungpati, Semarang City, Central Java Province, Indonesia, 50229 Phone/ Fax. +6224 8508007
147
poor in the village, the Sangkajoyo Village (PHC Profile Kajen I, 2012). If the environment is
observed from 10 villages and 1 urban village community is homogeneous or nearly equal in terms
of income, education or work. So the purpose of this study is how the contribution of social capital,
especially in the social support with the nutritional status of toddlers in the Sangkanjoyo Village.
METHOD
This study uses qualitative research methods. The technique of taking informants
purposive sampling (Moleong, Lexy J., 2010). Initial informants in this study were 10 people
consisting of a field of nutritional health center staff, village head, village midwives, posyandu
cadres, community leaders and informants of family 5 toddlers. Criteria for the family informant that
families with toddlers toddlers aged 1 to 5 years old and resides in the area of research since birth
to toddler with this study took place, the family informant toddlers can consist of father / mother /
grandmother / grandfather / housekeeper or nanny toddler, informants family who is determined
based on the recommendation of village midwives and posyandu cadres who knows the state of
toddlers in their working area. Additional informants needed are 2 people from families with
toddlers who determined snowball sampling technique, so the total is 12 informants.
Previously made observations to determine the socio-cultural community, then all key
informants were interviewed in depth (depth interview), to obtain information that is valid, relevant
and sufficient also conducted Focus Group Discussion (FGD) to complement existing informants. It
also conducted a recall of food consumption at 5 informants from family toddlers to complement
discussion of nutritional intake, which is to look at the nutritional adequacy rate, the adequacy of
energy and protein adequacy level. Secondary data in this study is a data nutrition status by using
anthropometry based body weight according to height (weight / height) were obtained from the
GMP or midwife and Data education, employment, and income by way of study documentation
obtained from the office of the village head Sangkanjoyo. Instrument in this study is the
researcher's own data collection tool with the observation guide, interview guide, guide Focus
Group Discussion (FGD) and a questionnaire sheet food recall. Data analysis technique used is a
model analysis of Miles and Huberman (Basrowi, 2008).
RESULTS AND DISCUSSION
1. Toddler Nutritional Status
Nutritional status was measured using the method antopometri with weight index
according to height. Based on the results of studies in which the data is obtained based on the
data from secondary data or measurements cadres in posyandu, weighing from 3 post in the
Sangkanjoyo Village concluded all nutritional status of children under five was good and it was not
obtained toddlers with less or poor nutritional status. Even, toddlers with over nutritional status did
not exist.
148
Public Health Department, Faculty of Sports Science, F1 Building, 2nd
Floor, Sekaran Campus Gunungpati, Semarang City, Central Java Province, Indonesia, 50229 Phone/ Fax. +6224 8508007
2. Association or Organization Related to Health
Association or organization is a social group, or entity which is a set of people who live
together, because of the relationship between them. The other concerns the relationship between
the reciprocal relationship of mutual influence and also an awareness to help each other. Social
groups can also influence the behavior of its members. (Soekanto, Soe R jono, 2006: 104).
Sangkanjoyo Village itself has several associations or organizations such as religious
organizations, and NGOs. The results showed that organizations that contribute to the nutritional
status of toddlers is the PKK (Family Welfare Empowerment) and posyandu (Integrated Services
Post).
Posyandu activity is the embodiment of community participation in maintaining and improving
health status. Posyandu activities are executed by a designated health volunteers from the
community who have a fundamental role in maintaining and improving health. Nearly all health
workers are members of the PKK. The role of health officer in this case is to coordinate the
activities of the health institutions (health centers) as well as implementing growth monitoring
sessions related to treatment and other health care professionals such as family planning services
(KB). Targets of posyandu are a toddler, the pregnant mother, nursing mothers and fertile age
couples. Growth monitoring sessions are held once a month for approximately 3 hours at the place
easily accessible to the public and is determined by the community itself. In terms of activities
posyandu consists of 5 main programs MCH (Maternal and Child Health), family planning,
immunization, nutrition and the prevention of diarrhea which is conducted with 5 tables system,
(Hand, OW, 2011).
Based on this research, neighborhood health center in the Sangkanjoyo Village have already
done posyandu with appropriate activities and programs in accordance with the system 5 system
table, and belongs to the independent posyandu level (blue color) since it has performed activities
on a regular basis, the coverage of 5 main programs is already good, there are additional
programs that have a healthy fund that has reached more than 50% of households. Health funds in
Sangkanjoyo Village called ADD (Village Fund Accommodation). Posyandu also get rewards and
win the posyandu competition in the sub-district level.
3. The Contribution of Social Support Element
1) Family Support
The family is the smallest social part that consists of a set of components that are very
dependent and influenced by the internal structure and other systems (Padilla, 2012). There are 4
forms of social support is emotional support, instrumental support, informational support, and
esteem support. Emotional support is emotional support, this form of support in the form of an
expression of empathy, care and attention to the individual. Instrumental support is p emberian
support involving direct aid such as money, goods or services aid. This support can help carry out
daily activities. Whereas for informational support is d ukungan information provided in the form of
Public Health Department, Faculty of Sports Science, F1 Building, 2nd
Floor, Sekaran Campus Gunungpati, Semarang City, Central Java Province, Indonesia, 50229 Phone/ Fax. +6224 8508007
149
advice, instructions, or advice to individuals. The provision of this support can assist in dealing with
or solving problems. Esteem spport an award of support expressed by the expression of positive or
positive reward to the individual, to push forward or approval to the idea or feeling of the individual
and a positive comparison between individuals with others (Sarafino, 1998).
From 7 informants who are the toddlers‘ family, entirely got emotional support and
instrumental support from family. Toddler needs support in the form of daily food, clothing,
education, or when the toddlers get sick which are given by the family. Such support will affect the
nutritional status of toddlers into good nutrition. This is the way to research of De Maria (2005: 385)
which states that the availability of social support, especially support for borrowing money and the
absence of a spouse affects the incidence of malnutrition. Results of focus group discussions (
FGD) also showed the presence of emotional support and instrumental support Good in a family
that enables contribute in supporting nutritional status of children for the better. Almost all dining
needs of toddlers tried to be fulfilled, such as formula feeding, filling food that is most desired by
the toddler snacks or meals associated with the desired toddler snacks. This of course will greatly
affect the nutritional status of children in the family. Provision of health services when sick children
are also considered, although the first aid done is to the health centers that provide health care
services that is free of charge.
While informational support and esteem support in a family of children, only 7 per cent
obtained from informants. Information and more awards to come from outside the family, such as
health centers (especially midwives), from tetnagga, as well as from other environmental
information (TV, Radio and other health promotions). While the research of Saifah, A. (2011: 109)
states that the family is very dominant role in healthy nutrition behaviors in family members,
including children. Although still lack some form of social support from family, but from the results
of the weighing in posyandu evidenced by the data Health Card (KMS) of each informant toddler
shows the nutritional status of children is good. Food recall results also showed that the rate of
Energy Adequacy Level (TKE) and Protein Adequacy Level (TKP) is included in the normal criteria.
As portrayed on food recall results as follows:
Staple foods toddlers over one year is rice, vegetables, side dishes, fruit and milk. Based on
observational data obtained food recall that the most frequent side dish. Giving vegetables are also
given but not much more than a side dish. Toddler food consumption patterns have informants
Daily Intake of protein ranged from 21.4 grams to 44.1 grams with the average is 31.5 grams.
Sufficient levels of protein (TKP) ranged from 61.1% to 169.6% with an average of 130.1% which is
included in the normal criteria. Toddlers protein consumption comes from milk, fish, meat, tofu, and
eggs temped. High crime scenes came from the egg and milk. Energy Daily Intake (RDI energy)
ranges from 1019.3 to 14 93 grams, 9 grams with an average was 1358.3 grams. Sufficient levels
of energy (TKE) ranged from 90.6% up to 1 3 2, 7% with an average of 107.8% which is included
in the normal criteria.
150
Public Health Department, Faculty of Sports Science, F1 Building, 2nd
Floor, Sekaran Campus Gunungpati, Semarang City, Central Java Province, Indonesia, 50229 Phone/ Fax. +6224 8508007
2) Support from Neighbors and Friends
Neighbors are people who live adjacent or contiguous. Emotional support, instrumental
support and informational support have been felt well in the neighborly life. According to one
informant, the relationship between the proximity of a very good neighbor bleak like brothers. This
is in line with research Hand, OW (2011), which states that the majority of people in Indonesia,
especially in rural areas there is a culture where most neighbors have a sense of family bonding,
the system mutual cooperation and mutual help - help that exists in the community is very close
and thus affects parenting toddler nutrition. Instead of a concern as if someone is sick, the
neighbors would visit to provide support, drove to the doctor if necessary, a side dish to share their
babies, oversee and keep the toddlers who are playing in his home, warn if there is growth
monitoring sessions and the distribution of vitamin A .
Form of esteem support is the least form of support given by a neighbor in Sangkanjoyo
Village. Support is only given orally without knowing its goal or meaning related to the health or
nutritional status of children, as saying: "His son is healthy, isn‘t he?" to the toddler with good
weight, agile and active.
Friends can be a neighbor, but can also people who domicile outside the nearby environment.
In this study, the friends in question is a friend of the family of a toddler. According to Kail and
Neilsen (Suhita, 2005) close friend is a source of social support as it can provide a sense of love
and support while experiencing a problem. Forms of social support given byy friends the same as
what is given by a neighbor, as a friend do not meet at any time either with the mothers, infants
and other family members, then the frequency of social support given is not as much as the social
support given by neighbors.
3) Support from Community leaders
In an order of social life, the role of leadership is absolutely necessary in realizing the wishes
of the people they lead. The results show that the community leaders in this research is the head
of Sangkanjoyo Village who contributes in providing social support to the people especially who
have toddlers. Forms of social support given by the leader is primarily instrumental support and
informational support. As funding for supplementary feeding (PMT) each month, which is deducted
from the accommodation village funds (ADD). Variety of important information, especially with
regard to neighborhood health center, such as a healthy toddler competition, neighborhood health
center competition, health worker training, information about health services or information of
health centers and related services obtained from the office of the village head. At certain moments
the village head is directly involved in the activities. Such research Ulumiyah, I. (2011: 894) which
states that the pe role the village government especially the village head is very important
especially in empowering rural communities to enhance progress in all fields. Village government
especially the village head acted as adviser in various fields, one of which is to support the health
sector growth monitoring sessions. Results of focus group discussion (FGD) on the steering group
Public Health Department, Faculty of Sports Science, F1 Building, 2nd
Floor, Sekaran Campus Gunungpati, Semarang City, Central Java Province, Indonesia, 50229 Phone/ Fax. +6224 8508007
151
or person in charge of the health sector also explains that the leaders of the community strongly
supports programs and activities that aim to improve nutritional status of toddlers.
As for the emotional support and esteem support, given in the form of, for example, when
someone is sick, the village chief showed concern and care by providing assistance in
administration for a referral to the hospital or when there is activity on special events, the village
head will come and directly involved. The form of awards given directly by the village head is not
so perceived by a family of toddlers, because the award is obtained primarily from the health
authorities or central government. So for emotional support and esteem support, it cannot be
perceived by the public.
4) Support from Political Leaders
Within an organization or party it is needed a leader, political leaders here also play a role in
nation building, especially in the field of health. One of the functions of a political party is a political
participation, which may affect the process of making and implementing public policy (economic,
education, health and others) and can also determine the leadership of the government (Yudhi, IP,
2011: 33).
Based on the data obtained social support Sangkanjoyo Village given by political leaders
drawn from interviews, where all of the informants said that there is no and do not know the form of
social support given by political leaders in the village Sangkanjoyo. These results are also
confirmed by the results of focus group discussion (FGD) that is there is not any form of support
given by political leaders in the village Sangkanjoyo. So from the support of political leaders there
is no contribution of social support to support the nutritional status of toddlers in the Sangkanjoyo
Village.
5) Support from Government Officials
According to Law No. 9 of 2010, government officials are officials occupying certain positions
in government both at central and regional levels. Government support in the form of policies and
programs. In the field of health, especially nutrition, the existing national policies which include an
increase in the availability, access, consumption and food security, as well as clean and healthy
lifestyle behaviors including nutrition conscious. Policy in the field of nutrition in the region by
providing nutritional interventions on issues directly or indirectly. Direct intervention for toddlers is
the promotion of breastfeeding (breast milk) and MP-ASI (Complementary feeding),
Supplementary Feeding (PMT), administration of sow nutrition (micronutrients), vitamin A
supplementation, food fortification, coaching posyandu cadre and handling of toddlers‘ malnutrition.
As for the indirect intervention activities carried out in the form of improved access to clean water,
improved security and access to food (BAPPENAS, 2013; RAN-PG 2011-2015: 39; UNICEF,
2013).
152
Public Health Department, Faculty of Sports Science, F1 Building, 2nd
Floor, Sekaran Campus Gunungpati, Semarang City, Central Java Province, Indonesia, 50229 Phone/ Fax. +6224 8508007
In the study conducted in Sangkanjoyo Village, social support given government officials are:
1) in the form instrumental support in the form of policy implementation -kebijakan made by the
department for particular nutritional health. Policies that have been implemented include the
provision of supplementary food assistance program (Feeding) for less nutrition, health operational
assistance to poor nutrition, namely the provision of additional sow mineral nutrition, coaching
posyandu cadre, and PMT (Feeding) and extension -penyuluhan. This is in accordance with local
policy for nutrition programs so that rural communities can Sangkanjoyo free from malnutrition. 2)
In b entuk informational support from government officials in the form of information about health
provided by the clinic staff in the form of counseling per scarecrow and classical, information about
the health of the race to be held. 3) In the form of emotional support and esteem support,
motivation and reward in the form of giving the toddler a healthy and well-nourished in a healthy
toddler contest. But emotionally community feel that the award was obtained from the central
government program, not a direct motivation of the health centers. Proximity and directly support
more midwives as perceived by health center staff.
6) Non-Government Support Organozations (NGOs)
Non Government Organozations (NGOs) is an organized institution that is open, voluntary,
self-contained, self-supporting at least in part, autonomous from the state and bound by rules of
law or set of rules together (Suharko, 2003: 206). The Role of Non-Government Organozations
(NGOs) important to build a nation, especially a nation in crisis or problem. Indonesia itself also
has a variety of charities or non-governmental organization whose role is to assist people who
have difficulty or problems in various fields.
Pekalongan District, particularly the area of Kajen itself is also still rare NGOs or NGO that
provides assistance for improving the nutritional status. According to the head of D esa
Sangkanjoyo, assistance provided generally to the field of environment, natural disasters, or rural
development. Unlike his thing with research conducted in Niger where the WFP (World Food
Council) which is the UN body that acts under the FAO food and logistic assistance to communities
in the Niger food crisis (Ndaru, Defrina Herjuno and Diamond, 2005: 51).
In terms of social support that can support the nutritional status of children in the Sangkanjoyo
Village, it is necessary punched well as how values, norms and beliefs that exist with regard to
nutrition parenting in the village. From the results, the data-DTA related to:
1) Values
The health examination, that is when the sick people usually will go to a shaman or wise man, but
now they go to the midwife or doctor. According to the midwife, the shift value also occurs on a visit
to a neighborhood health center, which formerly was rarely mothers and toddlers who go to
neighborhood health center, but now many are aware of the importance of neighborhood health
Public Health Department, Faculty of Sports Science, F1 Building, 2nd
Floor, Sekaran Campus Gunungpati, Semarang City, Central Java Province, Indonesia, 50229 Phone/ Fax. +6224 8508007
153
center to monitor their toddler nutrition. In addition, any other value is the value of a child who once
said to a lot of kids a lot of luck, now becoming obsolete. One of the informants said that children
use values in the family and society are the next generation and is a gift from God. Another
informant stated that the value of children in their families is very important, because in one of the
purposes of marriage is to have children. As in the study of Ade, Aditya (2011) argued that the
values of children in the family vary depending on how the parents see it, it can be seen from both
economic and non-economic.
2) Norms
It wasn‘t obtained any norms that support social support associated with nutritional status of
toddlers.
3) Trust (Belief)
In this case the trust is the assumption or belief that something is true or real trust (e.g. trust in the
spirits), something that is believed (e.g. the people to the leaders), the expectations and beliefs
such as honesty and kindness (Ministry of Education and Culture, 2001).
According to the interview, the belief of Sangkanjoyo Village towards ghosts or dietary
restrictions do not exist anymore. However, according to the results of focus group discussion
(FGD), the trust would arise from the village midwives, cadres, community leaders and village
heads than the health department or clinic staff. Trust is the most powerful and influential of the
citizens of the village midwife. This is because the midwife had served almost 12 years in the
Sangkanjoyo Village. Another belief is considered to be influential to the cadre of citizens and
community leaders involved in the provision of information and advice when people have
problems, especially in the field of health. The Sangkanjoyo Villagers also have great respect for
their leaders. These beliefs will affect the nutritional status of toddlers either directly or indirectly,
because the mothers of toddlers will listen to the advice for their babies' health.
The values and beliefs that contribute to the existing forms of social support and ultimately will
support the nutritional status of toddlers. For example, children high value causes the entire the
social component, especially family seeks to maintain and care for their children properly depicted
in the form of support from family and neighbors. While the presence of high confidence in the
midwife and the village head causing a form of social support, especially from the government in
the form of policies and programs can be supported to run smoothly.
CONCLUSION
Based on research on the contribution of social support element in supporting the nutritional
status of toddlers in the Sangkanjoyo Village, the conclusions in this study is the subdistrict Kajen
which almost every village there suffer from the cases of malnutrition and undernourishment, there
is Sangkanjoyo Village which is free from malnutrition and undernourishment. The toddlers in the
154
Public Health Department, Faculty of Sports Science, F1 Building, 2nd
Floor, Sekaran Campus Gunungpati, Semarang City, Central Java Province, Indonesia, 50229 Phone/ Fax. +6224 8508007
Sangkanjoyo village have good nutritional status due to; the form of support provided is emotional
support in the form of concern and attention toward the toddlers, instrumental support in the form
of money, goods and services aid required to meet daily needs, informational support in the form of
information, advice, suggestions or instructions concerning the care and nurturing infants, and
esteem support in the form of positive expression or appreciation in parenting a toddler. Element of
social support that contributes in supporting the nutritional status of toddlers is from family support,
the support of neighbors, friends‘ support, the support of community leaders, government officials‘
support, values, norms, and beliefs (trust). While the elements that do not contribute in supporting
the nutritional status of toddlers is of the support of political leaders and Non-Government
Organizations (NGOs).
ACKNOWLEDGEMENTS
Our thanks to the Head of Puskesmas Kajen I, Sangkanjoyo Village Head, Sangkanjoyo
Village Midwife, Sangkanjoyo Village citizens, who have been willing to participate in the study.
REFERENCES
Ade, Aditya N.,2011,Hubungan Tingkat Pendidikan Dengan Persepsi Orang Tua Terhadap Nilai Anak Dalam Keluarga Di Kelurahan Argasoka Kecamatan Banjarnegara Kabupaten Banjarnegara Tahun 2010,Skripsi,Universitas Negeri Semarang.
Badan Penelitian dan Pengembangan Kesehatan, 2010, Riset Kesehatan Dasar (RISKESDAS) 2010, Kementerian Kesehatan RI, Jakarta
_______________________________________, 2013, Riset Kesehatan Dasar (RISKESDAS) 2013, Kementerian Kesehatan RI, Jakarta.
BAPPENAS, 2011, Rencana Aksi Nasional Pangan dan Gizi 2011-2015, Jakarta. Departemen Pendidikan dan Kebudayaan, 2001, Kamus Besar Bahasa Indonesia, Balai Pustaka,
Jakarta. De Maria, et all, 2005, Social Support and Infant Malnutrition: A Case-Control Studi in An Urban
Area of Southastern Brazil, British Journal Of Nutrition, Vol 94, hlm 383-389. Dinas Kesehatan Kabupaten Pekalongan, 2011, Laporan Status Gizi Kabupaten Pekalongan
tahun 2010, Kabupaten Pekalongan. Dinas Kesehatan Propinsi Jawa Tengah, 2011, Perkembangan Kasus Gizi Buruk Menurut
Kabupaten/Kota di Jawa Tengah tahun 2011, Semarang. Handayani, O.W., 2011, Nilai Anak Dan Jajanan Dalam Konteks Sosiokultural Studi Tentang
Status Gizi Balita Pada Lingkungan Rentan Gizi Di Desa Pecuk Kecamatan Mijen Kabupaten Demak Jawa Tengah, Disertasi, Universitas Kristen Satya Wacana.
Hasbullah, Jousairi, 2006, Social Capital (Menuju Keunggulan Budaya Manusia Indonesia), MR-
United Press, Jakarta. Krisnansari, Diah, 2010, Nutrisi dan Gizi Buruk, Mandala Of Health, Volume 4, Nomor 1, Januari
2010 , hlm 60-68. Moleong, Lexy J., 2010, Metodologi Penelitian Kualitatif, Remaja Rosdakarya, Bandung. Ndaru, Herjuno dan Intan Defrina, 2005, Peran UN World Food Programme dalam Penanganan
Krisis Pangan dan Kelaparan : Studi Kasus “Silent Hunger” di Niger, Journal Global, Volume 8, No 5, November 2005.
Padila, 2012, Buku Ajar Keperawatan Keluarga, Nuha Medika, Jakarta. Saifah, A., 2011, Hubungan Peran Keluarga, Guru, Teman Sebaya, dan Media Massa Dengan
Perilaku Gizi Anak Usia Sekolah Dasar di Wilayah Kerja Puskesmas Mabelopura Kota Palu, Tesis, Universitas Indonesia, Depok.
Public Health Department, Faculty of Sports Science, F1 Building, 2nd
Floor, Sekaran Campus Gunungpati, Semarang City, Central Java Province, Indonesia, 50229 Phone/ Fax. +6224 8508007
155
Sarafino, E.P., 1998, Health Psychology: Biopsychososial Interactions, Third edition, John Wiley and Sons, Inc, New York.
Soekanto, Soerjono, 2006, Sosiologi Suatu Pengantar, Raja Grafindo, Jakarta. Suharko, 2003, NGO, Civil Society Dan Demokrasi Kritik Atas Pandangan Liberal, Jurnal Ilmu
Sosial Dan Ilmu Politik,Volume 7, No 2, Nopember 2003, hlm 205-226. Ulumiyah, I, dkk., 2011, Peran Pemerintah Desa Dalam Memberdayakan Masyarakat Desa,Jurnal
Administrasi Publik, Volume 1, No 5, hlm 890-899.
World Health Organization (WHO), 2012, Development of a strategy towards promoting optimal
fetal growth [Online] http://www.who.int/nutrition/topics/feto_ maternal/en.html. Yudhi, I.P., 2011, Pergeseran Peran Ideologi Dalam Partai Politik, Jurnal Ilmu Politik dan Ilmu
Pemerintahan, Volume 1, No 1, hlm 30-40.

156
Public Health Department, Faculty of Sports Science, F1 Building, 2nd
Floor, Sekaran Campus Gunungpati, Semarang City, Central Java Province, Indonesia, 50229 Phone/ Fax. +6224 8508007

Public Health Department, Faculty of Sports Science, F1 Building, 2nd
Floor, Sekaran Campus Gunungpati, Semarang City, Central Java Province, Indonesia, 50229 Phone/ Fax. +6224 8508007
157
HEALTH AND PHYSICAL EDUCATION AT SCHOOL
PAPERS

158
Public Health Department, Faculty of Sports Science, F1 Building, 2nd
Floor, Sekaran Campus Gunungpati, Semarang City, Central Java Province, Indonesia, 50229 Phone/ Fax. +6224 8508007
Public Health Department, Faculty of Sports Science, F1 Building, 2nd
Floor, Sekaran Campus Gunungpati, Semarang City, Central Java Province, Indonesia, 50229 Phone/ Fax. +6224 8508007
159
BE HEALTHY THROUGH PLAYING: THE ROLE OF PLAY ON CHILDREN
Anirotul Qoriah
Semarang State University, Indonesia
Corresponding Author: [email protected]
Abstract
Introduction: Child is one of the targets of health education and promotion in school, community, and society, but there is almost no special program for children. Being different from teenage or adult that needs to be active through exercising, children are already active by nature. Children love playing. Instead of inviting them to exercise, they need to be encouraged to play. Metods: Playing can be effective approach to promote children‘s health, but not all play is considered as health-promoted activity. There are two kind of play: active play and passive play that have different characteristic and function in children‘s life. By understanding those differences, parents and teachers will know what activity to be encouraged for their children and pupils. Playing may be opposite activity to learning, but for physical health and development, playing can be more important than learning. In certain time and place, children should not be restricted to play. Results: This paper is intended to discuss the role of play on children, especially its function to children health and psychological well-being; what activity that is prioritized for children and how to do that. In the end, author will give some suggestions for family and school about how to promote children‘s health through playing. Key words: children, school, family, play, kid activity
Introduction
Children health is not only concerning how to treat illness on children. It is also including
children physical, psychological, emotional, and social well-being (Trastotenojo, 1981). According
to International Pediatric Association (IPA), children health is ―the state in which the child achieves
the best use of his genetic endowment and accomplishes the most satisfactory adjustment to the
environment into which he must mature, this includes the study of the normal child and his
development from conception, of his mental and emotional as well as his physical well-being, and
of the family and social environment in which he lives‖ (in Trastotenojo, 1981, pp. 1-2).
Various health problems threaten children. For example, obesity and bad life style as
characterized by inactivity. Children in this era are pleased by many games and toys. They already
use gadget, spend much time to watch television programs, play games in computer or laptop, etc.
Those all give much fun and enjoyment, but are detrimental for general well-being, and specifically
for physical illness. They lack physical activity since they become unmotivated to go outside and
play outdoor game. Worsened by bad eating habit, indicated by consumption of junk food and less
vegetables and fruits, they are vulnerable to gain more and more weight. On children (age 5-15)
obesity prevalence reach 8.3% (Sartika, 2011).
One factor that accounts for obesity is lack of exercise (Sartika, 2011), but how to make
children do exercising or any physical activity is another problem. It is especially if their families
don‘t live with healthy life style which is they do exercise regularly as family program. The problem
160
Public Health Department, Faculty of Sports Science, F1 Building, 2nd
Floor, Sekaran Campus Gunungpati, Semarang City, Central Java Province, Indonesia, 50229 Phone/ Fax. +6224 8508007
is a rather solved if parents or educators aware of the nature of the children. Children are naturally
active and cannot stay calm for a long time. Children are always movingwhile playing if they are
allowed to go to a free space. It gives inspirations about how to improve children health through
active and free play. Playing can be part of children health program.
The science of active playing
Playing is not a mere activity. Not until recent years, scientists finally know how playing
benefit children physically, psychologically, and socially. Playing has long been misunderstood as
a waste. It is counted as contra-productive for learning and schooling. Children who like playing are
even called lazy. But now, scientists show how playing is a valuable learning experience (Hurlock,
1978).
Playing is defined as any activity that is done for the sake of pleasure, without concerning
the results. Playing is done voluntary without force, external stressor, or obligation. Playing has no
rule but what is decided by its player alone (Hurlock, 1978). Thus, playing is different from working.
Working is activity that has expected ends. In playing, the result is not the matter. Children look for
pleasure while playing, not competition and championship.
Generally, playing can be divided into kind, namely active playing and passive playing
(Hurlock, 1978). Active playing is playing whose pleasure arises from the activity itself. Active play
is characterized by act of reproduction or production new things, or physical activity, such as
running, jumping, jogging, walking, bicycling, etc. Passive playing or amusement is a kind of
activity which children gain pleasure with minimum effort from other person playing. Children enjoy
watching other people playing in television or stadium, or reading book, watching movie, and
listening to radio.
Active playing is more useful for children health than passive playing.There are many kinds
of active playing. Some of them that is relevant are:
Spontaneous and free playing
Free playing is an opportunity for children to do whatever they like as they wish. There is no
rule and regulation. Children can play as long as it continues giving pleasure. Children can stop it
when their attention is decreasing and the pleasure is gone. Stimulus for free playing is everything
new and different in the environment or toy that is designed for exploration. The more complex the
toy, the longer time spent to explore.
Spontaneous and free play has three characteristic: 1) mostly, the player play alone. A child
may lose interest to play when he/ she begin to have playmate, 2) the pleasure comes from
exploration. When child‘s curiosity is already satisfied, his/ her interest is decreased, and 3) the
playing is characterized as simple playing. Since child gets more intelligent, he/ she gain pleasure
from more complex activity.
Spontaneous and free play may cause anger on parents. While doing exploration, child
may break down goods or do dangerous activity. This kind of playing has advantage. It helps child

Public Health Department, Faculty of Sports Science, F1 Building, 2nd
Floor, Sekaran Campus Gunungpati, Semarang City, Central Java Province, Indonesia, 50229 Phone/ Fax. +6224 8508007
161
to gain knowledge about his/ her environment. It motivates child to use his/ her intelligence and
take initiative to amuse him/ her-self even without playmate.
Game and sport
Game and sport are competition with certain rule that is done for pleasure. While sport are
always physical activity, game can be physical or mental. Sport usually uses more physical
movement and more rigid rule than game. Sport refers to organized competition between teams,
like football, soccer, basketball, sprint, etc. For child, sport can be count as playing. Along with
development of interest on sport, children build skills to participate in sport. Younger children are
not good team player, but gradually they will learn how to work in team and gain satisfaction from
sport.
Playing has so many influences to children development. As explained by Hurlock (1978),
they are:
Physical development
Active play is important for child to build their muscle and train all part of their body.
Through playing, children release their energy and psychological tension. That is how children can
be healthy physically and psychologically if they do enough playing.
Social development
Playing is an important method for socialization. While playing, children meet their peer and
they do interaction each other. Through playing, a child learns to be social-being and build social
skills like leadership, team work, being responsible, empathy, etc. Children also build
communication skill, like how to use language properly, to understand each other speech, to listen
each other, etc. Through playing with playmates, children learn how to live in society. Children
learn how to make group, to relate each other, and to solve problem that arises. Also they learn
about moral standard like fairness, responsibility, tolerance, being kind, etc.
Intellectual development
Playing is a good method to learn. It gives children opportunity to learn so many things that
is not provided in home or school. It stimulates creativity too. While playing, children do
experimentation, design and produce something new and different, or manipulate their physical
environment.
Active playing as health promotion program
The problem is that the nature and amount of active and free play in children has changed,
as noted by Burdette and Whitaker (2005). They said that children of today no longer play the way
children in the past used to play. Children do not play or less play, or they have less time doing it
outdoor. Children tend to do passive activities such as watching television, using the computer,
playing video game or play-station. The amounts of time they use outdoor is decreasing as well as
the active and free play that usually done outside. In Indonesia, it may be indicated by the
disappearing of traditional playing/ games. Many traditional games are played outside. But now,
162
Public Health Department, Faculty of Sports Science, F1 Building, 2nd
Floor, Sekaran Campus Gunungpati, Semarang City, Central Java Province, Indonesia, 50229 Phone/ Fax. +6224 8508007
children are no longer playing that and prefer the ―modern‖ one, like video game or computer
game. Using playing as health promotion program should consider this hampering factor.
Children are hard to be motivated to exercise if they perceive exercising as an obligation
with many rules. Since children naturally love playing, and some playing is inherently active
physically, the persuasion to exercise may use this. Rather than ask children to do exercise,
parents or educators may ask or motivate them to play. For example, to prevent obesity, a person
should do moderate physical activity, like playing football, walking, jogging, or bicycling, at least 30
minutes or more a week (Sartika, 2011). Those activities are fortunately part of children life since
children love chasing each other and bicycling as playing.
Encouraging physical activeness in school and family
Children or students sometimes are not cared enough. In their break time, adult leave them
alone to do whatever they like, no matter it is good or bad. Active play is better done by guidance
and support from adult. It is to ensure that what children play is good for them and safe.In school
and family, it is good for educators and parents to provide game equipment. In Indonesia, they can
prepare the field and equipment for some traditional game, like ―ular naga‖, ―benteng‖, ―lompat tali‖,
―gobak sodor‖, ―sepak bola‖, ―gasing‖, ―kelereng‖, ―congklak‖. Adult also introduce the rule or how
to play the game to children.
“Let’s go play” as encouraging motto
Approaching children to do exercising should use different language. Children are
physically active in different way than adolescent or adult. They use gross motor muscle while play.
So, to encourage and promote children to play, it is better use word ―play‖ than ―sport‖ or
―exercising‖ or ―physical activity‖ (see, Burdette & Whitaker, 2005).
By using word ―play‖, children may perceive it positively as fun and enjoyable activity. Children and
adult have different understanding about what physical activity is. Adult may think it as aerobic
activity and sport, but children think it as game and playing. Word ―play‖ is more motivating than
―sport‖.
Sharing knowledge about the benefit of active playing
Parents or teachers may misunderstand the nature of playing as not useful activity that
playing make children lazy and don‘t want to study for school. Playing, for a certain extent, is good
for children physical, cognitive, social, and emotional development (Burdette & Whitaker, 2005).
Through playing, children become attentive. It is a sign of cognitive functioning as foundation of
learning. They become more skilled at controlling impulse and integrating sensory-motor
movement. Having interaction with playmate, children become more skilled socially and finally,
playing makes children happy.
Play time
Instead of letting children to watching television in their spare time, or keeping children at
home all day, parents may allocate some time for their children to meet their friends and play
together outside. Instead of letting children to do whatever they like in their break time in school,
Public Health Department, Faculty of Sports Science, F1 Building, 2nd
Floor, Sekaran Campus Gunungpati, Semarang City, Central Java Province, Indonesia, 50229 Phone/ Fax. +6224 8508007
163
teacher may invite their students to go outside and play in the field for some minutes. Teacher may
prepare balls, rackets, nets, ropes, and many other equipment for some traditional games. In both
situations, parents and teachers may also join them.
Closing
Persuading children to be physically active is actually easy. Children, by nature, are already
active and love to play. Going outside and playing with friend are fun for them. That‘s why sport
and exercising should be perceived in the same way if they are introduced as playing in the first
place. But, there are two kind of hampering factor, they are: 1) parents and teachers‘
misunderstanding that playing is bad as sign of laziness and dangerous, and 2) children are more
favor passive playing, like watching television and playing video game or computer game. To
design a health promotion program using playing, these problems should be solved first. Parents
and teachers should be educated that playing has positive influence on children development and
adults should prepare what is needed for children to play freely and safely (space, time,
equipment, guidance, and monitoring).
References
Burdette, H. L. & Whitaker, R. C. (2005). Resurrecting Free Play in Young Children. Looking Beyond Fitness and Fatness to Attention, Affiliation, and Affect. Archives of Pediatrics & Adolescent Medicine. 159: 46-50. Diunduh dari: http://www.attitudematters.org/
documents/Restructuring%20Free%20Play%20in%20Young%20Children.pdf. Hurlock, E. B. (1978). Perkembangan Anak Jilid 1. Edisi Keenam. Jakarta: Erlangga. Sartika, R. A. D. (2011). Faktor Risiko Obesitas pada Anak 5-15 Tahun di Indonesia. Makara,
Kesehatan. Vol. 15, No. 1, Juni 2011, h. 37-43. Trastotenojo, Moeljono S. (1981) Beberapa Masalah dan Perspektif Kesehatan Anak di Indonesia.
Pidato Pengukuhan Guru Besar. Semarang: Diponegoro University Press. Diunduh dari: http://eprints.undip.ac.id/153/1/Moeljono_Trastotenojo.pdf.
164
Public Health Department, Faculty of Sports Science, F1 Building, 2nd
Floor, Sekaran Campus Gunungpati, Semarang City, Central Java Province, Indonesia, 50229 Phone/ Fax. +6224 8508007
STRENGTHENING YOUTH ACCESS TO SEXUAL AND REPRODUCTIVE HEALTH AND RIGHTS IN SEMARANG
Diana Pakasi1, Andi Cipta Asmawati1, Efa Nugroho2
1 University of Indonesia, Indonesia
2 IPPA-Central Java, Indonesia
Corresponding Author: [email protected]
Abstract Introduction: Sexual and reproductive health problems generally faced by teenagers in assisted areas of Indonesian Planned Parenthood Association (IPPA) are relatively similar. Adolescents getting sexually active but not accompanied with good knowledge, so the cases of unwanted pregnancy and unsafe abortion was found in high school adolescents. Parents are still limited in providing sexual and reproductive health and rights education (SRHE), because the strength of the taboo and still uncomfortable to talk about sexuality with their children. Methods: This study was an observational study using quantitative and qualitative methods. The study was conducted in three schools in Semarang, with a total sample 118 students and 14 teachers. Results: A total of 63.2% of respondents (SMK N 9), 97.5% of respondents (SMA N 14), and
94.9% of respondents (SMA Gita Bahari), claimed was obtain SRHE in high school. Although the majority of respondents said they get SRHE, but their knowledge of sexual and reproductive health was still very limited. As many as 50% of teachers in three schools, argued reproductive health needs to be a subject in school, 57.1% of teachers believe the need for a national curriculum related to SRHR, and 85.7% of teachers agreed that it is necessary for the implementation of government policies about SRHE in school. Key Words: Strengthening, youth, reproductive health, rights
Introduction
Population Census data on 2010 shows that adolescents between the ages of 10-24 years in
Indonesia was the largest number of Indonesian population. More specifically, adolescents aged
10-19 years amounted to 43.5 million or 18% of the total population. In addition to the largest
number, adolescents was also a population groups who are vulnerable to sexual and reproductive
health issues, such as teenage marriage, early pregnancy, unwanted pregnancies, sexually
transmitted diseases such as HIV and AIDS, unsafe abortion, and gender-based violence.
According to Riskesdas (Basic Health Research) in 2010, the 15-19 age group is the age group
with the largest percentage of the first marriage, as much as 41.9%, followed by 20-24 years age
group with a percentage of 33.6%.
On the other side, Indonesia Young Adult Reproductive Health Survey (IYARHS) in 2007
revealed that there was unmarried adolescents who have been sexually active. Based on the
survey, adolescents aged less than 19 years who have not been married and had a sexual
experience by 3.6%. Adolescent having sex before marriage for several reasons, including for the
highest reason in woman is because it just happens (38.4%); forced by a partner (21.2%).
Whereas in men, the highest reason is because their curiosity (51.3%); and because it just
Public Health Department, Faculty of Sports Science, F1 Building, 2nd
Floor, Sekaran Campus Gunungpati, Semarang City, Central Java Province, Indonesia, 50229 Phone/ Fax. +6224 8508007
165
happens (25.8%). The survey also showed that 84 people (1%) of the respondents had
experienced unwanted pregnancy, and 60% had or have an abortion. The data shows that this age
group is at risk of sexual and reproductive health problems. Furthermore, data from the Ministry of
Health in 2010 showed that the percentage of AIDS cases by age are also highest occupied by the
younger age groups, that is betwen 20-29 years at 47.4%.
These data demonstrate the importance of sexuality education/comprehensive SRHR for
adolescents. Indeed, Sexualy and Reproductive Health and Rights Education (SRHE) for young
people has been widely implemented in Indonesia. However, the dominant discourse in SRHE
material for the younger age groups is just sex for young people is unhealthy and dangerous.
Gender and Sexuality Study Center research in 2009 in Karawang, Sukabumi and Tasikmalaya
also showed that about 60% of female respondents aged 15-24 years had received SRHE, but the
majority of them (70%) stated that the material supplied is the danger of sex (Hidayana, Noor &
Pakasi, 2010). SRHE of this kind does not empower young people to make the best decisions for
their sexual and reproductive health. SRHE for young people should provide information that helps
them understand their sexuality and protect them from unwanted pregnancy, sexually transmitted
infections, and increased risk of infertility. Furthermore, SRHE needs to be accompanied by
education to boys in order to appreciate the autonomy and shared responsibility with the girls in
terms of sexuality and reproduction.
SRHE for adolescents is more complex and challenging than SRHE for adults because a
variety of things. First, there are many assumptions that adolescents are too young to know the
sex and as sexual beings. Secondly, SRHE for adolescents need to balance between protection
and empowerment. Third, SRHE in the perspective of rights is still very limited. Rights proficiency
level is not only the right of young people to be protected but also the right of adolescents to
participate and be responsible for their Sexual and Reproductive Health and Rights (SRHR).
SRHR Task Force developed by HIVOS with IPPA (Indonesian Planed Parenthood
Association), Rahima, Women's Journal Foundation, and Gender and Sexuality Study Center
University of Indonesia, motivated by the lack of availability of comprehensive SRHR education
and rights that based on youth in Indonesia. The purpose of this program was for the development
and implementation of education of sexual and reproductive health and rights in schools. In
particular, the program was aimed at developing and strengthening local initiatives for SRHE and
empowerment of adolescents and civil society organizations to advocate SRHR issues. This
baseline was part of the advocacy of SRHR in SRHR Task Force.
Comprehensive SRHE needs to consider the socio-cultural context including cultural values
and norms related to sexuality and reproductive health issues in the assisted area of IPPA. Sexual
and reproductive health issues generally faced by adolescents in assisted areas of IPPA relatively
similar, the adolescents were sexually active but not accompanied with sufficient knowledge, so
that cases of unwanted pregnancy, unsafe abortion was found in high school students. Parents
were still limited in providing sexual and reproductive health education because the strong
166
Public Health Department, Faculty of Sports Science, F1 Building, 2nd
Floor, Sekaran Campus Gunungpati, Semarang City, Central Java Province, Indonesia, 50229 Phone/ Fax. +6224 8508007
presumption of taboo and uncomfortable talking about sexuality to the child. Schools provide
SRHE still limited to the subjects of Biology, Physical Education and Health, and Religion that was
not comprehensive yet. SRHE was face the challenges of pornographic material that more easily
to access, many places of entertainment, consumerism culture that may contribute to adolescent
risky sexual behavior.
Semarang as one of the major cities in Java and tourist destination can not be separated
from cases related to SRHR. According to Suryoputro, et al (2006), in 5 years (2000-2005), cases
of HIV and AIDS in Central Java province has increased significantly. Of the 14 cases in 2000 to
158 cases in 2005 with the largest proportion of HIV occurred in the age group 20-24 years. For
the case of AIDS, the largest proportion of cases found in the age group 25-29 years. If AIDS
cases are found in that age group, it is likely that people living with HIV risk behavior have started
when they were adolescents. Adolescents in Semarang tendency to do risky sex that was
indicated by the results of previous studies which show that between 5% -10% of women and 18-
38% of men aged 16-24 years have had sex before marriage.
On the other side, risky sexual behavior among adolescents is not accompanied by a
comprehensive knowledge regarding sexual and reproductive health. Adolescents tend to look for
misleading information from the internet. The level of knowledge of adolescents in Semarang on
adolescent reproductive health was still lacking, including openness, practices, and their care on
adolescent reproductive health. This knowledge gap is coupled with access to the internet to
satisfy the curiosity of an impact on risky sexual behavior.
This research conducted by the Gender and Sexuality Study Center University of Indonesia
collaboration with IPPA of Central Java. This research program was held to analyze the initial
conditions associated with the expected results based on the result framework program, before the
program is run by the IPPA of Central Java.
Methods
Baseline study was conducted in Semarang on Juli 2012. Baseline study uses quantitative
and qualitative methods in data collection. Data collection techniques are:
Survey: the collection of quantitative data through surveys. In Semarang conducted in two
schools assisted by the IPPA of Central Java and one of control school. The number of students
surveyed were 40 students in SMAN 14 and 39 students at SMK 9 (IPPA assisted schools), and 39
students in SMA Gita Bahari (control schools). For a number of teachers surveyed was 6 teachers
at SMAN 14 and 3 teachers at SMK 9 and 5 teachers at the SMA Gita Bahari.
The selection of respondents can not be determined by the researcher. The school was more
decisive in the selection of respondents. Therefore, respondents were randomly withdrawal can not
be done. For the teacher survey, teachers were selected as respondents in the survey was a
Biology teacher, Counseling Guidence, Religion, Physical Education, and vice-headmaster. The
number of teachers who were respondents in each school varies depending on the number of
Public Health Department, Faculty of Sports Science, F1 Building, 2nd
Floor, Sekaran Campus Gunungpati, Semarang City, Central Java Province, Indonesia, 50229 Phone/ Fax. +6224 8508007
167
teachers who administer the subjects and the presence of the teacher when data collection is
done. The headmaster of the school was fill the survey quesionair. If the headmaster is absent
replaced by the vice-headmaster.
Indepth interviews: indepth interviews conducted with school (the headmaster),
representatives of parents, government (department of education, health, religious ministry, family
planning office and the empowerment of women), members of the legislative committee related to
SRHR, religious or community leaders. Total informants for indepth interview is about 9 informants.
Some areas difficult to conduct interviews with legislators, religious leaders / community leaders,
and local governments. It is influenced also by a network that has been built by each partner in the
region. If the partners in a region has a long build cooperation with these agencies, not difficult for
researchers to conduct interviews.
Focus group discusion: FGD conducted on two groups of students (male and female), the
civil society organizations that have SRHR programs, and teacher. Each FGD involving 6-10
people participated. In FGD for students, the selection of participants made by school. Participants
in FGD for teacher were the teachers of subjects that are relevant to SRHE. Teachers who follow
the FGD among other subject teachers of biology, physical education and health, and religion.
FGD for Civil Society Organizations, was not found significant barriers, and participants are
determined by the number of organizations working in reproductive health issues.
Results and Discussion
The role of local governments and stakeholders on SRHE in schools: semarang city, as well
as the city government center, service center, industrial, educational centers, trade in Central Java,
also serves as a transit city because it is located between Surabaya and Jakarta. It also makes the
city easily accessible by various transport networks land, sea, and air. Semarang city is a seaside
town north of them bordering the Java Sea. The city is on the southern border with the District of
Semarang, on the western border with Kendal, and on the eastern border with Demak.
According to the Department of Education‘s profile, there are 80 high scools in Semarang.
The number of female students per 2008/2009 as much as 52.46% and male students 47.53%.
Something similar happened to figure graduation rates, the number of high school female
graduates (53.37%) more than the number of male graduates (46.42%). Figures proceed to higher
levels of school is dominated by the 60.99% female students than males is 52.05%. These data
indicate in terms of education, women have good access.
In terms of quality of teachers, number of high school teachers with the highest degree level
1 of diploma is 44 people, of which 81.81% are male teachers and 18.18% are female teachers.
For teachers certified level 2 diploma amounted to 8 people, have the same magnitude between
men and women (4 people each). For level 3 diploma, with a number of 173 people, male teachers
more one person (87) than female teachers (86). Teachers certified level 4 diploma or bachelor, of
a total of 2367 people more dominated by female teachers (55.51%) than male teachers (44.48%).
168
Public Health Department, Faculty of Sports Science, F1 Building, 2nd
Floor, Sekaran Campus Gunungpati, Semarang City, Central Java Province, Indonesia, 50229 Phone/ Fax. +6224 8508007
In contrast, master degree teachers achieved more by male teachers (56.21%) than female
teachers (43.79%) of the total of 151 people. In addition, only one person qualified teachers
doctoral degree which is 1 male teachers. Of the total 2744 teachers, more female teachers
(53.86%) than male teachers (46.13%).
Subjects related to reproductive health, namely Biology, Religion, Physical Education and
Health, and guidance counseling was also dominated by female teachers. More religious courses
taught by female teachers (127 people) than male teachers (105 people). For biology, more female
teachers (87 people) than male teachers (75 people). For physical and health, female teachers
also were more dominant (77 people) than male teachers (66 people). On the subject of Guidance
Counseling, as well as more female teachers (94 people) than male teachers (80 people). Local
content subjects was similar, more female teachers teaching this field of study (36 people) than
male teachers (31 people). Although the number of female teachers more than men, the principal
amount is much more dominated by men, as many as 59 people or 76.62% while the female
principals only 18 people, or 23.37%.
Non Governmental Organization (NGO) which deal with sexual and reproductive health
among one of them is IPPA Central Java. The issue of SRHE that integrated to curriculum in fact is
not a new issue. Based on media reports, in 2010 the movement of sex education in the curriculum
integration into advocacy insistence on government, especially department of education
Semarang. Advocacy is to anticipate misuse internet facilities as providers of sex information that
irresponsibly used by adolescents, because sex education is still considered taboo and prohibition.
Limitations of this information make adolescents feel curious and seek knowledge through the
internet. Limited knowledge of adolescents make sex education needs to be given. The emphasis
of sex education is a preventive measures for adolescents to not having sex before marriage.
Semarang City Government through the Departement for Community Empowerment,
Women, and Family Planning have reproductive health education programs for adolescents
through PKBR Program (Life preparation for adolescents) were carried out through the PIK-R
(Center of Information and Counseling for Adolescents). The program is a national program of the
BKKBN. The program is also based on guidelines from the BKKBN. In Semarang there are 54 PIK-
R in 2012 increased from only 19 in 2008. Most PIK-R in Semarang is based on community. From
the 54 PIK-R that has been formed, not effectively lead the provision of information and counseling
activities. Even so, there are PIK-R Risma JT (Great Mosque of Central Java‘s Teen), which have
achievements at the national level as PIK-R five national best. The achievement based
assessment that PIK-R have the ability of managers in understanding about reproductive health,
HIV and AIDS, and drugs were also informed back to other adolescents and providing counseling.
The issue of adolescent sexual and reproductive health although it is not a new issue for
local governments and relevant stakeholders in the city, but not all parties recognize the
importance of sexual and reproductive health education for adolescents. Department of Education
as a strategic sector for the advocacy sexual and reproductive health education in order to enter
Public Health Department, Faculty of Sports Science, F1 Building, 2nd
Floor, Sekaran Campus Gunungpati, Semarang City, Central Java Province, Indonesia, 50229 Phone/ Fax. +6224 8508007
169
into the curriculum, firmly stated that the burden of students in the city of Semarang was too heavy
for the new charge added. According to Mr. Soedjono (Secondary Education in Department of
Education Semarang) the burden of students in Semarang is too weight because Semarang used
to be the pilot projecet for character education that is a national curriculum. In addition, there are
also anti-corruption education and traffic education. According to informants, character education
can include anti-corruption and traffic education, because the character education there are 16
points of characters that can be related, for example, care for the environment, responsibility,
honesty, and others. Sexual and reproductive health education also can be included in them, so
that the curriculum is not too heavy for children. According to the informant, a good idea if each of
the education delivered independently, but became too heavy for students, so it takes a strategic
step that is integrated with the existing ones. Prevailing in the school curriculum is now determined
from the center of the national curriculum. Therefore, if you want to incorporate reproductive health
in the curriculum need to approach the center of the national curriculum. Nonetheless, curriculum
modification is possible because there is curriculum autonomy per school.
However, sex education is controversial. One observer even argue that sexual education that
integrated into the curriculum has not been necessary. Furthermore, sex education in the
curriculum actually cause children more curious to try sexual act. The controversy surrounding sex
education is also still to be found in this baseline. Lack of support from the government is also
evident from the absence of a policy such as local regulations in Semarang related to SRHR
education in schools.
According to the Department of Education, local government actually supports the provision
of sexual and reproductive health education, but if possible it must be integrated with existing
programs. Department of Education provide a letter of recommendation for the provision of sexual
and reproductive health education in schools through letter from head of the Department of
Education. Besides integrated in existing subjects such as Character Education, Biology, Physical
Education and Health, and Religion, opened to the provision of material through existing
extracurricular activities is through PMR (Teenagers Red Cross) or through the school health
program. According to informants from the Department of Education, if there is a program should
not carry the new names, because it is added the burden, it is better to strengthen existing
programs. According to the informant, if the program stand-alone normally when the program is
completed (completion funding) there is no sustainability. If integrated in the existing program, the
program can be forwarded by the government. Department of Education, Department of Health,
Ministry of Interior, and the Ministry of Religious Affairs has the Healthy Schools program, the
delivery of reproductive health education materials in schools was made possible through the
Healthy Schools program. Healthy Schools is a program from kindergarten to high school level. In
the Healthy Schools program, the Department of Education is a leading sector and already there
are working groups in Semarang level for this program. According to informants, SRHE program
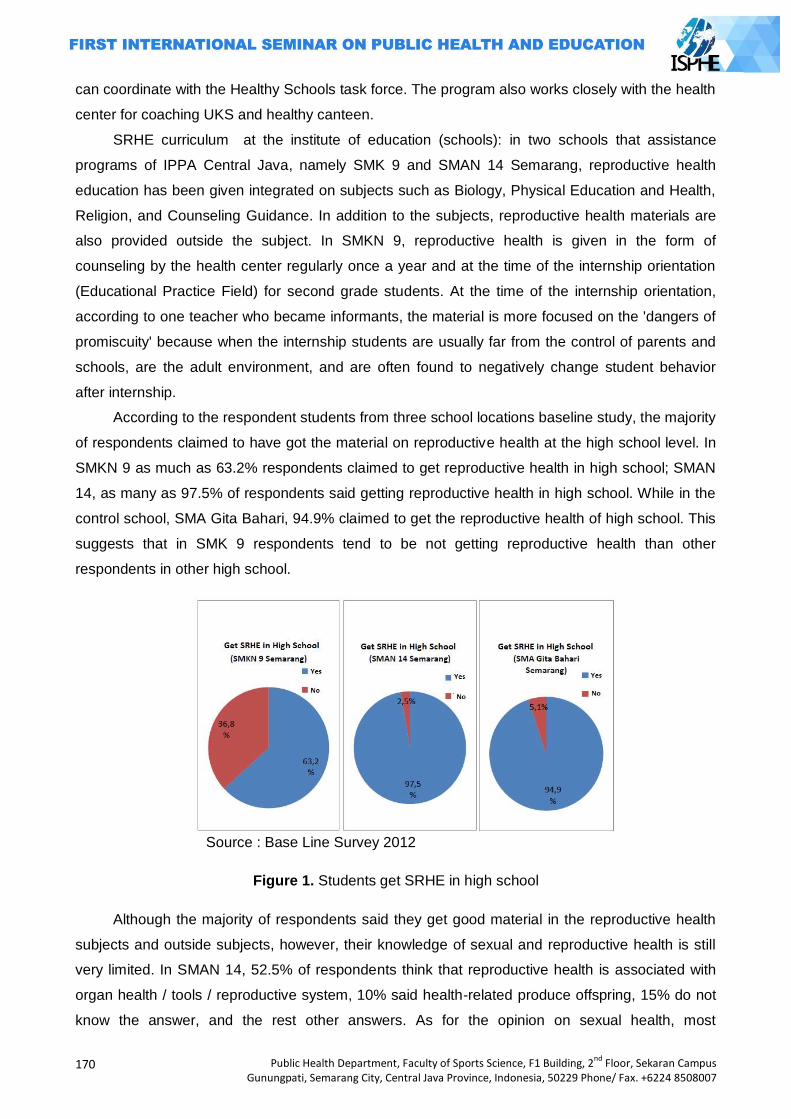
170
Public Health Department, Faculty of Sports Science, F1 Building, 2nd
Floor, Sekaran Campus Gunungpati, Semarang City, Central Java Province, Indonesia, 50229 Phone/ Fax. +6224 8508007
can coordinate with the Healthy Schools task force. The program also works closely with the health
center for coaching UKS and healthy canteen.
SRHE curriculum at the institute of education (schools): in two schools that assistance
programs of IPPA Central Java, namely SMK 9 and SMAN 14 Semarang, reproductive health
education has been given integrated on subjects such as Biology, Physical Education and Health,
Religion, and Counseling Guidance. In addition to the subjects, reproductive health materials are
also provided outside the subject. In SMKN 9, reproductive health is given in the form of
counseling by the health center regularly once a year and at the time of the internship orientation
(Educational Practice Field) for second grade students. At the time of the internship orientation,
according to one teacher who became informants, the material is more focused on the 'dangers of
promiscuity' because when the internship students are usually far from the control of parents and
schools, are the adult environment, and are often found to negatively change student behavior
after internship.
According to the respondent students from three school locations baseline study, the majority
of respondents claimed to have got the material on reproductive health at the high school level. In
SMKN 9 as much as 63.2% respondents claimed to get reproductive health in high school; SMAN
14, as many as 97.5% of respondents said getting reproductive health in high school. While in the
control school, SMA Gita Bahari, 94.9% claimed to get the reproductive health of high school. This
suggests that in SMK 9 respondents tend to be not getting reproductive health than other
respondents in other high school.
Source : Base Line Survey 2012
Figure 1. Students get SRHE in high school
Although the majority of respondents said they get good material in the reproductive health
subjects and outside subjects, however, their knowledge of sexual and reproductive health is still
very limited. In SMAN 14, 52.5% of respondents think that reproductive health is associated with
organ health / tools / reproductive system, 10% said health-related produce offspring, 15% do not
know the answer, and the rest other answers. As for the opinion on sexual health, most
Public Health Department, Faculty of Sports Science, F1 Building, 2nd
Floor, Sekaran Campus Gunungpati, Semarang City, Central Java Province, Indonesia, 50229 Phone/ Fax. +6224 8508007
171
respondents said health-related organ / tools / sexual systems (35%), health related to intercourse
(27.5%), 17.5% answered do not know. From the opinion of the respondents, it appears that the
respondent has not been able to mention the sexual and reproductive health in a comprehensive
manner. Furthermore, some respondents also considered sexual health is only associated with
sexual intercourse.
Table 1. Respondents opinions (SMAN 14 Semarang) on reproductive health and sexual
No Opinion about Reproductive
Health
Percentage
(%)
Opinion about Sexuality Percentage
(%)
1 Health related to
organ/reproductive system
52,5 Health related to sexual
system
35
2 Health associated with
producing baby
10 Health related to sexual
intercouse
27,5
3 Absence of disease /
malfunction of organs /
reproductive system
2,5 Absence of disease /
malfunction of organs /
sexual system
5
4 Caring/maintain
organs/reproductive system
12,5 Caring/maintain
organs/sexual system
7,5
5 Others 7,5 Others 7,5
6 Don‘t know 15 Don‘t know 17,5
Total 100 Total 100
At SMKN 9 Semarang, conditions are similar to the respondents. The majority of
respondents said health related organs / reproductive organs (64.1%), health to prevent diseases
of the reproductive organs (12.8%), and did not know (7.7%). As for opinion on sexual health, the
majority of respondents answering health-related sex (25.6%), health-related tools / sexual organs
(23.1%), and did not know (25.6%). The number of respondents who answered do not know the
students showed lack of sexual health.
Table 2. Respondents opinions (SMKN 9 Semarang) on reproductive health and sexual
No Opinion about Reproductive
Health
Percentage
(%)
Opinion about Sexuality Percentage
(%)
1 Health related to
organ/reproductive system
64,1 Health related to sexual
system
23,1
2 Health associated with
producing baby
5,1 Health related to sexual
intercouse
25,6
172
Public Health Department, Faculty of Sports Science, F1 Building, 2nd
Floor, Sekaran Campus Gunungpati, Semarang City, Central Java Province, Indonesia, 50229 Phone/ Fax. +6224 8508007
3 Absence of disease /
malfunction of organs /
reproductive system
12,8 Absence of disease /
malfunction of organs /
sexual system
5,1
4 Caring/maintain
organs/reproductive system
5,1 Caring/maintain
organs/sexual system
5,1
Refrain from sex free 7,7
5 Others 5,1 Others 7,7
6 Don‘t know 7,7 Don‘t know 25,6
Total 100 Total 100
In SMA Gita Bahari who became the control school, the condition of students' knowledge
about reproductive health is also not much different. The majority of respondents (51.3%) said
health reproductive health is associated with the organs / reproductive organs. 7.7% said health to
produce offspring, and only 2.6% do not know the answer. For sexual health, as many as 35.9% of
respondents thought sexual health is to maintain the health of organs / sex tools / sex /
reproduction; 15.4% said the absence of disease / functioning of the sexual organs; 10.3% of
respondents said health sexual health is associated with sexual intercourse.
Tabel 3. Respondents opinions (SMA Gita Bahari) on reproductive health and sexual
No Opinion about Reproductive
Health
Percentage
(%)
Opinion about Sexuality Percentage
(%)
1 Health related to
organ/reproductive system
51,3 Health related to sexual
system
35,9
2 Health associated with
producing baby
7,7 Health related to sexual
intercouse
10,3
3 Absence of disease /
malfunction of organs /
reproductive system
5,1 Absence of disease /
malfunction of organs /
sexual system
15,4
4 Caring/maintain
organs/reproductive system
12,8 Caring/maintain
organs/sexual system
5,1
Refrain from sex free 12,8
5 Others 20,5 Others 17,9
6 Don‘t know 2,6 Don‘t know 2,6
Total 100 Total 100
Public Health Department, Faculty of Sports Science, F1 Building, 2nd
Floor, Sekaran Campus Gunungpati, Semarang City, Central Java Province, Indonesia, 50229 Phone/ Fax. +6224 8508007
173
Based on a survey of teachers, reproductive health is also expressed by the teachers has
been given to students. All respondents (100%) at SMAN 14 states provide reproductive health
materials. Reproductive health materials are given on biology subjects (33.3%), Conseling
Guidance (33.3%), religion (16.7%) and phisical education (16.7%). While at the SMA Gita Bahari,
80% of teachers providing reproductive health in the lesson material in foster, namely Biology
subjects (40%), Counseling Guidance (20%), and others.
In all three schools, although teachers already provide reproductive health matter, not all
teachers who provide such material never received education / training specifically on reproductive
health. In SMAN 14, 66.7% of respondents had received training on reproductive health. The
materials obtained from the training, according to all respondents (100%) delivered to students by
reason of the most important material for the student of knowledge (33%). The material most often
delivered by the respondent is menstruation and puberty (33%), HIV and AIDS (17%). Therefore,
although the matter of sexual and reproductive health has been given but the material tends not
comprehensively given.
In SMA Gita Bahari, all teachers (100%) who responded to the baseline is expressed already
received training on reproductive health. According to 80% of respondents respondents material
obtained from the training delivered to students by reason of material needed by students (40%)
and because it is relevant to the subject matter that was raised (40%). All respondents (100%)
stated that the material most often is given to students about the dangers of promiscuity and
materials on reproductive organs (60%). Based on this survey, the materials provided by the
teacher to the student is more likely to focus on the dangers of sex and not the rights perspective
to provide knowledge and skills on sexual and reproductive health to students.
Although the majority of teachers who responded to the baseline have never received
training, but there are teachers who have obstacles in delivering materials on sexual and
reproductive health. In SMAN 14, 33.3% of respondents claimed to find bottlenecks when
delivering materials on reproductive health is lack of knowledge on reproductive health (50%) and
lack confidence in presenting the material reproductive health (50%). In SMA Gita Bahari, 40% of
respondents admitted to have obstacles in delivering reproductive health materials. Barriers
respondents expressed concern that the student is going to be more permissive sexual attitudes
and behavior if given the material reproductive health (100%). Opinions of respondents reflects the
lack of understanding of the teachers' sexual and reproductive health education.
The baseline results also indicate that increasing the capacity for teachers to sexual and
reproductive health education is necessary since not all teachers have received training on
reproductive health and the teacher have the barriers to deliver material of the sexual and
reproductive health. Teachers also need to develop a positive attitude towards sexual and
reproductive health education and realize that education is the right of students. Thus, teachers do
not have to worry that sexual and reproductive health education will cause students to behave
permissive.
174
Public Health Department, Faculty of Sports Science, F1 Building, 2nd
Floor, Sekaran Campus Gunungpati, Semarang City, Central Java Province, Indonesia, 50229 Phone/ Fax. +6224 8508007
The model and SRHE aproach that appropriate with local context: baseline results showed
that reproductive health education has been given are still deficiencies that can be filled in by the
program. Based on interviews with the Department of Education, on sexual and reproductive
health education should not be given in the specific subjects given the burden of student
curriculum is already too crowded. Given proposal is the integration of the existing course given
the school also has room to expand the existing curriculum. However, it requires commitment and
a school teacher. Department of Education also recommends that SRHE can be given through the
extracurricular existing PMR (Teeangers Red Cross) or infirmary. Health Department also
recommends SRHE given in coordination with the Health Center, because there are program of
health center that care about adolescent reproductive health.
In terms of teachers, all teachers from the three schools agreed that reproductive health
should be given to the student. However, not all teachers believe that reproductive health needs to
be own subjects. As many as 50% of respondents from all three school teachers who argued
reproductive health needs to be a separate subject. The reason the material is not necessary given
the material reproductive health is already entered in the subjects of Biology / Physical Education /
Religion.
A total of 57.1% of teachers respondents from the three school also believes in providing
reproductive health materials should have national curriculum guidelines. The guide is necessary
for teachers to have a guide, there is standardization of material, and also for teachers to know the
limits SRHE given to students. Concerns that SRHE can make students curious and increasingly
permissive among teachers making teachers need guidance and referral SRHE boundaries.
Furthermore, the majority of teachers (85.7%) from the three schools also agreed necessary for
the implementation of government policies about SRHE in school.
In terms of students, most students do not need SRHE to be specific subjects, but combined
with the existing ones. In SMAN 14, 47.5% thought reproductive health materials better combined
with existing subjects, 30% recommend given outside subjects, and only 22% thought reproductive
health needs to be special subjects. In SMKN 9, 38.5% thought the reproductive health material
was given outside subjects, 30.8% recommend integrated with existing subjects, 28% thought
needs to be its own subjects. Students in SMK are more likely to pick out the subjects, because
based FGD female students, the material outside the reproductive health will be much fun subjects
than in subjects who tended to saturate and boring. In SMA Gita Bahari, the majority of
respondents though that reproductive health requires special subjects (36%), 31% thought
combined with existing subjects, and 33% suggested given outside subjects. Activities that are
considered effective to deliver reproductive health materials according to the respondents in all
three schools are training and seminars. While the method is considered effective discussions with
peer educators (50% in SMAN 14), film (100% at SMK 9, and 67% in SMA Gita Bahari). This
suggests that adolescents require methods that tend fun than conventional methods such as
lecture and question and answer.
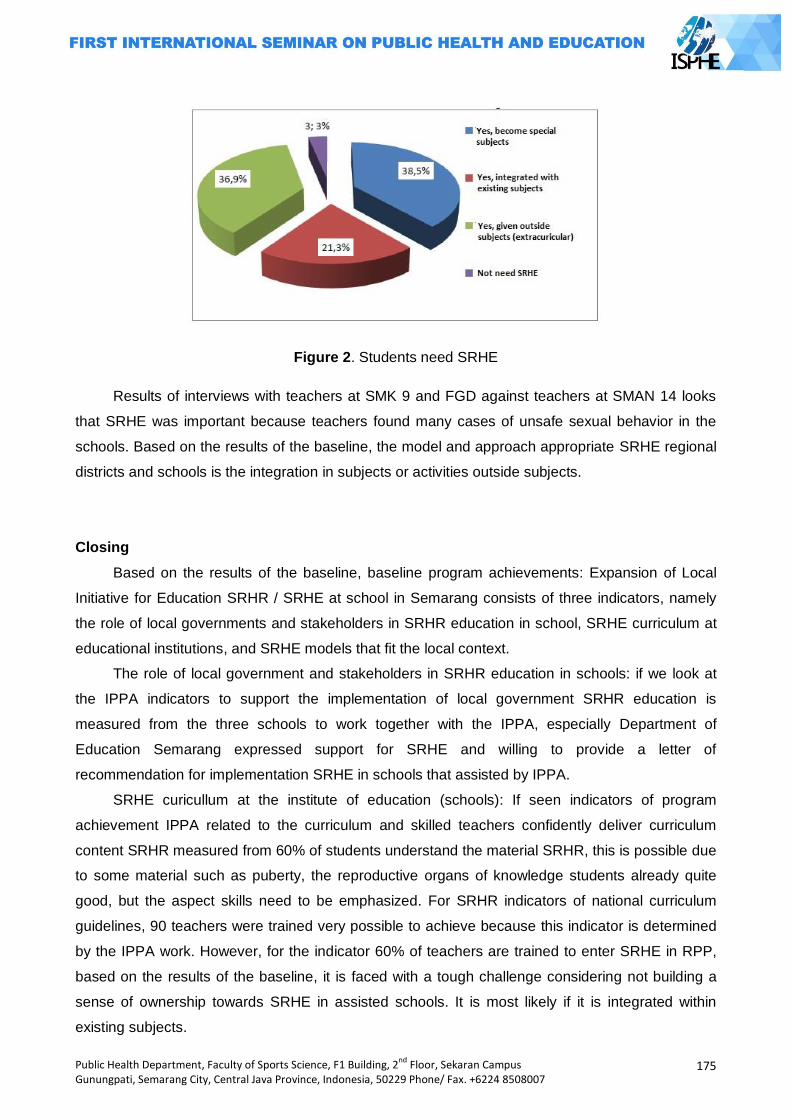
Public Health Department, Faculty of Sports Science, F1 Building, 2nd
Floor, Sekaran Campus Gunungpati, Semarang City, Central Java Province, Indonesia, 50229 Phone/ Fax. +6224 8508007
175
Figure 2. Students need SRHE
Results of interviews with teachers at SMK 9 and FGD against teachers at SMAN 14 looks
that SRHE was important because teachers found many cases of unsafe sexual behavior in the
schools. Based on the results of the baseline, the model and approach appropriate SRHE regional
districts and schools is the integration in subjects or activities outside subjects.
Closing
Based on the results of the baseline, baseline program achievements: Expansion of Local
Initiative for Education SRHR / SRHE at school in Semarang consists of three indicators, namely
the role of local governments and stakeholders in SRHR education in school, SRHE curriculum at
educational institutions, and SRHE models that fit the local context.
The role of local government and stakeholders in SRHR education in schools: if we look at
the IPPA indicators to support the implementation of local government SRHR education is
measured from the three schools to work together with the IPPA, especially Department of
Education Semarang expressed support for SRHE and willing to provide a letter of
recommendation for implementation SRHE in schools that assisted by IPPA.
SRHE curicullum at the institute of education (schools): If seen indicators of program
achievement IPPA related to the curriculum and skilled teachers confidently deliver curriculum
content SRHR measured from 60% of students understand the material SRHR, this is possible due
to some material such as puberty, the reproductive organs of knowledge students already quite
good, but the aspect skills need to be emphasized. For SRHR indicators of national curriculum
guidelines, 90 teachers were trained very possible to achieve because this indicator is determined
by the IPPA work. However, for the indicator 60% of teachers are trained to enter SRHE in RPP,
based on the results of the baseline, it is faced with a tough challenge considering not building a
sense of ownership towards SRHE in assisted schools. It is most likely if it is integrated within
existing subjects.
176
Public Health Department, Faculty of Sports Science, F1 Building, 2nd
Floor, Sekaran Campus Gunungpati, Semarang City, Central Java Province, Indonesia, 50229 Phone/ Fax. +6224 8508007
SRHR education model in accordance with the local context: for indicators of program
achievement IPPA is a model and approach to SRHR education is implemented in accordance
with the local context is measured from 18 schools PKRS implemented in accordance with the
local context, it is possible to assisted schools in Semarang. However, the schools that seem to
have the bargaining power to determine PKRS delivery approach: integrated into existing subjects
outside subjects. There may be different models PKRS in each school.
References
Badan Pemberdayaan Masyarakat, Perempuan dan Keluaraga Berencana, Panduan Pengelolaan Pusat Informasi dan Konseling Remaja, Ed. V, (Pemprov DKI Jakarta, 2010), hal. 4-5.
http://news.okezone.com/read/2010/07/03/373/349180/mendesak-pendidikan-seks-masuk kurikulum diunduh tanggal 12 Juni 2012
http://www.antaranews.com/berita/1278075833/pengamat-sex-education-harus-dimasukkan-kurikulum diunduh tanggal 12 Juni 2012
http://news.okezone.com/read/2010/07/03/373/349180/mendesak-pendidikan-seks-masuk-kurikulum tanggal 12 Juni 2012
Laporan Base Line Study, Puska Gensek FISIP UI, 2012, Universitas Indonesia, Depok Riset Kesehatan Dasar 2010 Survei Kesehatan Reproduksi Remaja Indonesia (SKRRI) tahun 2007 Ditjen PP dan PL,
Kemenkes RI 2010
Public Health Department, Faculty of Sports Science, F1 Building, 2nd
Floor, Sekaran Campus Gunungpati, Semarang City, Central Java Province, Indonesia, 50229 Phone/ Fax. +6224 8508007
177
TRAINING OF HEALTHY ADOLESCENT CADRE (HAC) AS EFFORTS TO INCREASE STUDENT HEALTH OF ISLAMIC JUNIOR HIGH SCHOOL WALISONGO
KEDUNGWUNI YEAR 2014
Nur Siyam1, Oktia Woro K.H.1
1 Semarang State University, Indonesia
Corresponding Author: [email protected]
Abstract
Introduction: Growth, development and adolescent health deserve special attention. Adolescence is vulnerable to nutritional problems. The results of observations at Islamic Junior High School Walisongo, school health program (UKS) was not functioning optimally, so that the training of healthy adolescent cadre (HAC) are needed to help resolve problems that occur. Methods: Subjects were head of school, UKS officer, 2 homeroom teachers, 10 students HAC. Respondents were 20 students who were selected based on the criteria of nutritional status that are less or more. The method used lectures, practice, and problem solving. Evaluation of training is done with the results of pre and post-test on HAC training, the success rate of solving problems in small groups and for the monitoring of nutrition. Results: The results show the percentage of students who were weighed and had a good
nutritional status through monitoring and advice by HAC much as 85%. Average student knowledge about balanced nutrition and health of the individual before the given information and brainstorming discussions by HAC with both criteria (> 80) was 40%, less knowledgeable (<80) was 60%, while after being given information from HAC, knowledgeable students either 84%, and less knowledge 16%. Average students awareness of balanced nutrition and health of the individual before the given information and brainstorming discussions by HAC with both criteria (> 80) was 45%, less conscious (<80) was 55%, while after being given information from HAC, students conscious either 80%, and 20% less awareness.
Key Words: Healthy adolescent cadre, student health, balanced nutrition Introduction
Basically someone who is a developmental life cycles, takes place on an ongoing basis,
meaning that each stage is determined by the previous stage and will determine the next stage.
During adolescence a time of rapid growth, known as the acceleration (Growth Spurt). This
accelerated the growth conditions impact by the previous stage, ie the children, toddlers, and even
since the time in the womb (Agustian, 2010).
Physical growth and maturation process of bodily functions is a process that occurs in
adolescence. Is someone in later adult life-bodied short or tall, thin or fat, sluggish or energetic,
tenacious or resigned, largely determined by the state of nutrition and health in adolescence. The
high incidence of malnutrition in adolescents can be caused by a teenager as the transition from
children to adults who need adequate nutrition. Teens also are vulnerable to environmental
influences, can affect youth lifestyle including eating habits (Kamiya, 2011). Mostly, girls pick
missed two consecutive meals and prefer street food. In fact, most of the empty-calorie snacks and
little nutrients. Not a little survey that noted the inadequacy of nutrient intake and adolescents due
to the habit of excessive eating street food.
178
Public Health Department, Faculty of Sports Science, F1 Building, 2nd
Floor, Sekaran Campus Gunungpati, Semarang City, Central Java Province, Indonesia, 50229 Phone/ Fax. +6224 8508007
Nutritional status comes from the word of nutritional and status. Status interpreted as signs
or appearance caused by a situation, whereas malnutrition is defined as the result of a process
that organisms use food normally consumed through the process of digestion, absorption,
transport, storage, metabolism and expenditure substances are not used to sustain life , growth
and normal functioning of the organs, as well as generate energy. The cause of malnutrition is
influenced by several interrelated factors, including intake is less due to the unavailability of
adequate food, children are not getting enough nutritious food, wrong diet, and children often suffer
from pain (Olack et al., 2011). Disadvantages of prolonged consumption of food, lack of
maintenance of public knowledge about child nutrition, and poor environmental health conditions
have an impact on increasing the number of infants with poor nutritional status (Pongou et al.,
2006).
Several studies have described the short-term impact of child malnutrition is becoming
apathetic, speech disorders and other developmental disorders, while the long-term effects of
malnutrition is a reduction in IQ scores, decreased cognitive development, concentration problems,
and impaired confidence decline themselves. Therefore malnutrition if not managed properly will
be life-threatening and in the long term would threaten the loss of future generation (De Silva and
Harpham, 2007).
A study conducted in 6 cities in Indonesia, showed that about 15.20% adolescent eating fast
food as a meal at noon. Figures are very dangerous and must be addressed. Especially if
considering that fast food has an energy content that is not too high, but very high fat content. This
if taken continuously, then teenagers can experience obesity (Khomsan, 2003, in (Pujiati, 2008)).
Given the highly complex causes, malnutrition management requires a comprehensive
cooperation of all parties. Not only of doctors and medical personnel only, but also of the parents,
families, community leaders, religious leaders and government. Community leaders and religious
leaders are needed in assisting the provision of education in society, especially in dealing with the
wrong habits or myths on feeding children. Similarly, health posts and health centers as a focal
point of screening or early detection and prevention services in the first cases of malnutrition (MoH
RI, 2012).
Good nutritional status in adolescence is needed, especially young women that in later
pregnancy healthy and adequate weight gain young woman with a size of Upper Arm (LLA) of less
than 23.5 cm at risk of state Chronic Energy Deficiency (CED) so as to provide unfavorable
contribution to weight gain during pregnancy. Mothers who have a history of being underweight
tend to be produced more quickly (premature) as well as the risk to the survival of the mother and
her baby.
Based on data from Pekalongan District Health Office in 2007 there were 159 cases of
malnutrition among children under five, with details of the 67 cases in 2006 and the rest of the time
is the 92 new cases in 2007 Looking at the data shows that there are still many cases of
malnutrition were not recovered, because more of 50% is an old case. At the end of 2007, showed
Public Health Department, Faculty of Sports Science, F1 Building, 2nd
Floor, Sekaran Campus Gunungpati, Semarang City, Central Java Province, Indonesia, 50229 Phone/ Fax. +6224 8508007
179
that of all cases of malnutrition, 119 cases of malnutrition children cured, 1 case died and 39 cases
of malnutrition have not healed. The persistently high malnutrition among under-fives
mengundikasikan also be occurrence of malnutrition at the age of adolescence (Pujiati, 2008).
Government programs to reduce malnutrition contained in the National Medium Term Development
Plan (RPJMN). Activities undertaken include improving early detection of malnutrition coverage
through the child's weight in neighborhood health center, improving the coverage and quality
management of malnutrition at the health center/ hospital and household. Provides PMT-Recovery
for malnourished infants from poor families, improve their knowledge and skills in the mother gives
the child's nutritional intake (breast milk/ solids) as well as providing vitamin A capsules (Pujiati,
2008).
Growth and development were not observed and adolescent health problems that often
occur in Islamic Junior High School Walisongo (SMP Islam Walisongo) needs special attention.
This, based on interviews of researchers with the school, which in this case is represented by the
head of the Islamic Junior High School Walisongo district. Kedungwuni, Kab. Pekalongan, named
Mrs. Inayah, S.Pd., explained that the problem of adolescent nutrition, whether it is likely to suffer
malnutrition, and malnutrition is likely to increase. In addition, smoking-related problems in
students and IEC (communication, information and education) on reproductive health is still
lacking. The results of preliminary observations also showed activity in the junior high school health
Islamic Walisongo also not functioning optimally. There is room UKS but not organized and
functioned as a warehouse, making it an uncomfortable room to handle the health problems that
occur.
Looking at the above, the training HAC as an Effort to Improve Student Health Islamic Junior
High School Walisongo important so that future generation can be free from malnutrition, so that
they can perform to bring the nation's progress.
The purpose of this study is able to monitor the health and nutritional status of adolescents
by HAC, expected UKS officers and student Islamic junior high school of Walisongo can apply and
continued monitoring of the nutritional status and health of the students. Another goal is monitoring
nutritional status and adolescent health, increase knowledge about nutrition and general physical
health.
Methods
Based on information obtained from a preliminary study conducted at SMP Islam Walisongo,
the nutritional status of adolescents is still not observed. In junior high Walisongo Islam does not
already exist in monitoring the activities of the UKs growth and health of students. In addition,
preliminary observations obtained from adolescents with less nutritional status. In addition, health
promotion media is still less available.
Monitoring growth and development with HAC activity is needed to determine the state/
adolescent growth and development trends, there is an increase or decrease. In addition, health
180
Public Health Department, Faculty of Sports Science, F1 Building, 2nd
Floor, Sekaran Campus Gunungpati, Semarang City, Central Java Province, Indonesia, 50229 Phone/ Fax. +6224 8508007
monitoring activities conducted by HAC will be effective and efficient in monitoring and
dissemination of information, both to the boss / UKS activity reports, for students, parents, public
health/ health services, as well as for cross-program in an effort to repair and determining future
policy.
The subjects involved in this activity is the UKS officer, all the homeroom teachers and
representatives of the students who will be KRS and is expected to disseminate the results of this
service activities to other students.
This community service activities such as training of volunteers Adolescent Health as an
effort to improve the health of students. Healthy Young Cadres Training is the activity of the
training and formation of cadres to do the physical conditions and anthropometric assessment of
adolescents to determine the growth of the nutritional status of adolescents and adolescent health
in general. Healthy Teens is a cadre of students who meet the criteria to be doing a good job, such
as highly motivated, intelligent, not smoking, and including student achievement, and siawa
precedents. KRS task is to fill and perform such Helath inidikator below (1) Identity of adolescent;
(2) Status of immunization, but in this study, immunization status is not questioned because the
data is not yet available, and the truth of the answers from survey respondents also difficult to
ascertain; (3) Signs of the healthy adolescents; (4) Maintenance of cleanliness self; (5)
Recommendation nutritious food; (6) Measure and record the growth of body weight and height
other students.
In implementing the Adolescent Growth Monitoring activities with HAC training methods used
following activities:
Method of lecture
This method is implemented with a multi-media tools such as the use of pictures, diagrams,
which are used to deliver materials on how to fill out the data in KMS Youth.
Method of practice
This method uses the form of direct practice / health monitoring Form by HAC to monitor the
health and nutritional status of adolescents. In addition, the practice of weighing and measuring the
weight correctly.
Methods of solving the problem (problem solving)
This method is in the form of the grant of example problems by speakers to small groups if
there are students who decreased their growth status, etc.., So the group hopes it can solve a
given problem based on material received when the lecture method and practice.
The evaluation of the success of the training is done by HAC:
The results of the pre and post-test on HAC Training
This evaluation is done when KRS training delivery. The benchmark indicator of success is
when there is a significant difference from the pre and post-test were given.
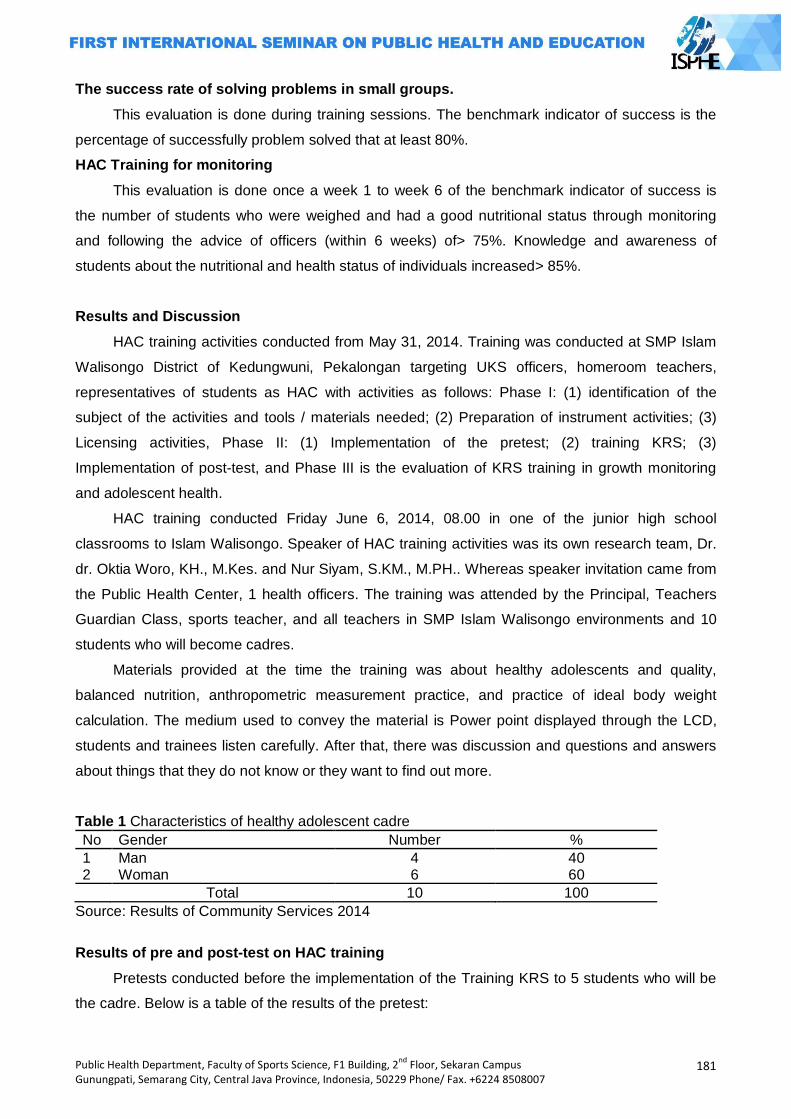
Public Health Department, Faculty of Sports Science, F1 Building, 2nd
Floor, Sekaran Campus Gunungpati, Semarang City, Central Java Province, Indonesia, 50229 Phone/ Fax. +6224 8508007
181
The success rate of solving problems in small groups.
This evaluation is done during training sessions. The benchmark indicator of success is the
percentage of successfully problem solved that at least 80%.
HAC Training for monitoring
This evaluation is done once a week 1 to week 6 of the benchmark indicator of success is
the number of students who were weighed and had a good nutritional status through monitoring
and following the advice of officers (within 6 weeks) of> 75%. Knowledge and awareness of
students about the nutritional and health status of individuals increased> 85%.
Results and Discussion
HAC training activities conducted from May 31, 2014. Training was conducted at SMP Islam
Walisongo District of Kedungwuni, Pekalongan targeting UKS officers, homeroom teachers,
representatives of students as HAC with activities as follows: Phase I: (1) identification of the
subject of the activities and tools / materials needed; (2) Preparation of instrument activities; (3)
Licensing activities, Phase II: (1) Implementation of the pretest; (2) training KRS; (3)
Implementation of post-test, and Phase III is the evaluation of KRS training in growth monitoring
and adolescent health.
HAC training conducted Friday June 6, 2014, 08.00 in one of the junior high school
classrooms to Islam Walisongo. Speaker of HAC training activities was its own research team, Dr.
dr. Oktia Woro, KH., M.Kes. and Nur Siyam, S.KM., M.PH.. Whereas speaker invitation came from
the Public Health Center, 1 health officers. The training was attended by the Principal, Teachers
Guardian Class, sports teacher, and all teachers in SMP Islam Walisongo environments and 10
students who will become cadres.
Materials provided at the time the training was about healthy adolescents and quality,
balanced nutrition, anthropometric measurement practice, and practice of ideal body weight
calculation. The medium used to convey the material is Power point displayed through the LCD,
students and trainees listen carefully. After that, there was discussion and questions and answers
about things that they do not know or they want to find out more.
Table 1 Characteristics of healthy adolescent cadre
No Gender Number %
1 Man 4 40 2 Woman 6 60
Total 10 100
Source: Results of Community Services 2014
Results of pre and post-test on HAC training
Pretests conducted before the implementation of the Training KRS to 5 students who will be
the cadre. Below is a table of the results of the pretest:
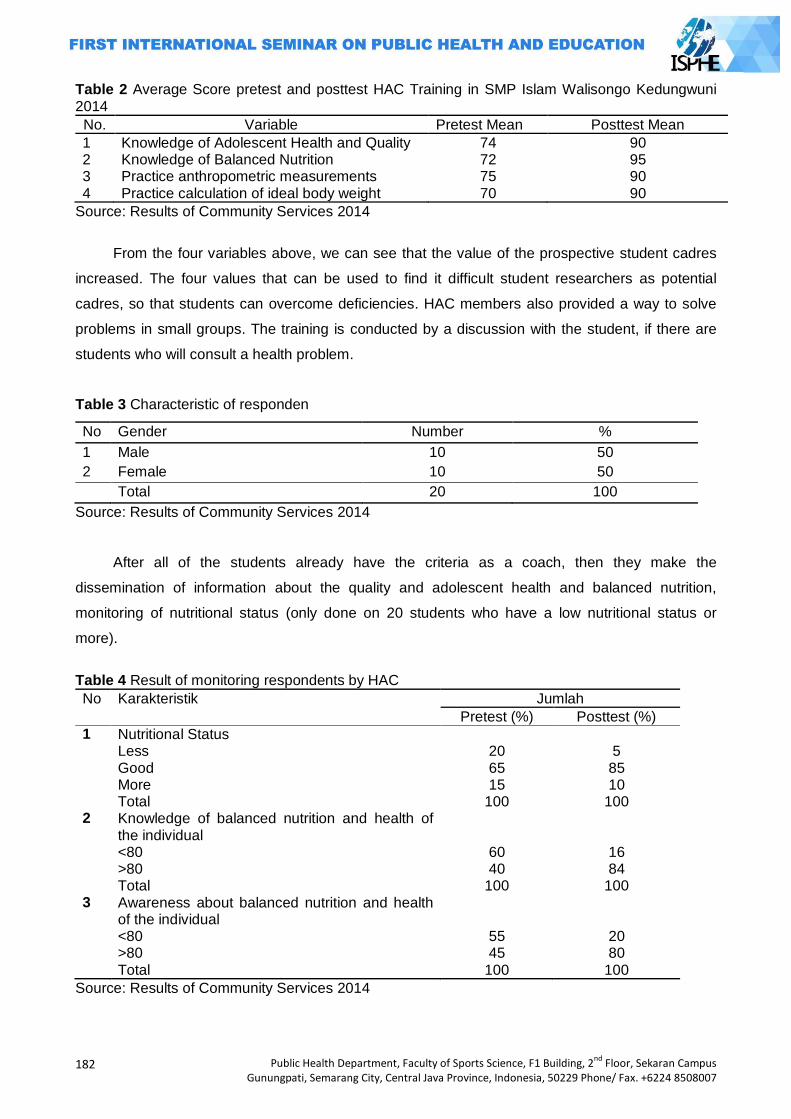
182
Public Health Department, Faculty of Sports Science, F1 Building, 2nd
Floor, Sekaran Campus Gunungpati, Semarang City, Central Java Province, Indonesia, 50229 Phone/ Fax. +6224 8508007
Table 2 Average Score pretest and posttest HAC Training in SMP Islam Walisongo Kedungwuni 2014
No. Variable Pretest Mean Posttest Mean
1 Knowledge of Adolescent Health and Quality 74 90 2 Knowledge of Balanced Nutrition 72 95 3 Practice anthropometric measurements 75 90 4 Practice calculation of ideal body weight 70 90
Source: Results of Community Services 2014
From the four variables above, we can see that the value of the prospective student cadres
increased. The four values that can be used to find it difficult student researchers as potential
cadres, so that students can overcome deficiencies. HAC members also provided a way to solve
problems in small groups. The training is conducted by a discussion with the student, if there are
students who will consult a health problem.
Table 3 Characteristic of responden
No Gender Number %
1 Male 10 50
2 Female 10 50
Total 20 100
Source: Results of Community Services 2014
After all of the students already have the criteria as a coach, then they make the
dissemination of information about the quality and adolescent health and balanced nutrition,
monitoring of nutritional status (only done on 20 students who have a low nutritional status or
more).
Table 4 Result of monitoring respondents by HAC
No Karakteristik Jumlah
Pretest (%) Posttest (%)
1 Nutritional Status Less 20 5 Good 65 85 More 15 10 Total 100 100 2 Knowledge of balanced nutrition and health of
the individual
<80 60 16 >80 40 84 Total 100 100 3 Awareness about balanced nutrition and health
of the individual
<80 55 20 >80 45 80 Total 100 100
Source: Results of Community Services 2014
Public Health Department, Faculty of Sports Science, F1 Building, 2nd
Floor, Sekaran Campus Gunungpati, Semarang City, Central Java Province, Indonesia, 50229 Phone/ Fax. +6224 8508007
183
This evaluation is done once a week 1 to week 6 indicators, the results showed that the
percentage of students who were weighed and had a good nutritional status after through
monitoring and advice from HAC (within 6 weeks) as much as 85%. Average and students'
knowledge about balanced nutrition and health of the individual before the given information and
brainstorming discussions by HAC with both criteria (> 80) was 40%, less knowledgeable (<80)
was 60%, while after being given information from HAC, students good knowledge as much as
84%, and 16% less knowledge.
Average students' awareness of balanced nutrition and health of the individual before the
given information and brainstorming discussions by HAC with both criteria (> 80) was 45%, less
knowledgeable (<80) was 55%, while after being given information from KRS, knowledgeable
students well as much as 80%, and 20% less knowledge. The conclusion was that an increase in
awareness of the students after the given information and brainstorming discussions by KRS.
Nutritional status can also be interpreted as a state caused by the status of the balance between
the amount of intake (intake) and the amount of nutrients required (requirement) by the body for
various biological functions (physical growth, development, activity, health care, and so forth)
(Supariasa et al., 2002). So the nutritional status is a sign of the physiological appearance that
causes the nutritional intake balance and its use by the organism (Gibson, 2005).
HAC training activities is expected to be taken advantage as follows: 1) To provide
convenience for UKS officers and junior high school teacher in promoting the health, nutritional
status and health of teenagers, both for itself and for teen parents. 2) Introducing teens to be able
to perform monitoring the nutritional status of themselves or fellow friends, so awareness of youth
for good nutrition and increased physical health. 3) Can identify growth / nutritional status and
physical health of adolescents in order to be promoted handling and fixes to problems that occur.
4) Improving school health program (UKS) in providing health services to students in the school
nutrition program and kesehatn in general.
According to Jelliffe et al. (1989), Assessment of nutritional status can be done by several
methods, namely: 1) Methods of assessment of nutritional status directly which can be done by:
clinical examination, anthropometry, biochemistry and biophysics test. 2) Methods of assessment
of nutritional status indirectly to do with the way: food consumption surveys, vital statistics and
ecological factors.
Each method of assessment of nutritional status has advantages and drawbacks of each.
Assessment of nutritional status can complement each other to produce more accurate data. One
of the most frequently used method to assess the nutritional status of the community is the method
of anthropometry. Anthropometric method is the size of the human body (Gibson, 2005). This
method is often used because it is easy to do and at reasonable costs. Nutritional anthropometric
measurements associated with a variety of body dimensions and body composition of various age
levels and nutrient levels. Anthropometric nutrition generally used to see imbalance of energy and
184
Public Health Department, Faculty of Sports Science, F1 Building, 2nd
Floor, Sekaran Campus Gunungpati, Semarang City, Central Java Province, Indonesia, 50229 Phone/ Fax. +6224 8508007
protein intake. Imbalance was seen in the patterns of physical growth and the proportion of body
tissues such as fat, muscle, and the amount of water in the body.
Nutritional status of adolescents is a state of adolescent body as a result of food
consumption and use of nutrients. Adolescent nutritional status can be measured by weight Body
Mass Index (BMI) / age. Body mass index is an indicator of the most commonly used and practical
to measure and monitor the nutritional status, especially with regard to shortage and excess
weight. BMI values calculated as weight in kg divided by the square of height in meters (Supariasa
et al., 2002).
Factors that affect the nutritional status Teenagers are sufficient levels of nutrition,
adolescent medical condition, social and household economics, environmental factors
(environmental sanitation), and physical activity and exercise. Sufficient levels of nutrition is one of
the factors that affect the nutritional status of adolescents. A balanced nutrient consumption in
accordance with the recommended dietary requirement numbers will result in a good nutritional
status. Nutrient consumption is less than the recommended dietary allowance rate will generate
less nutritional status, would even lead to poor nutritional status, and vice versa if excessive
nutrient consumption will lead to obesity. Obesity may increase adolescents' vulnerability to
degenerative disease, poor nutritional status while increasing adolescent infectious diseases
(Almatsier, 2009, Rodríguez et al., 2011).
Medical condition in question here is an infectious disease and chronic disease suffered by
toddlers. Toddler suffering from infectious diseases such as tuberculosis, gastrointestinal and
respiratory infection can be decreased nutritional status, because the disease can decrease
appetite, and disease-causing bacteria can seize food substances consumed toddler, so toddlers
prone to malnutrition (Supariasa, 2002; Rodríguez et al., 2011). Social and economic factors
including economic conditions / household income and other social circumstances that exist in the
family. Good socio-economic conditions will have a positive impact on the nutritional status of
children. And vice versa, poor socio-economic conditions may decrease the nutritional status of
children, such as income and social status (Pongou et al., 2006; Trimanto, 2006; Kamiya, 2011).
Based on the results of Trimanto (2006), states that social capital is one of the factors that
can affect the nutritional status of adolescents. In addition, the study De Silva et al. (2007),
indicates that high social capital is owned maternal mom in the fabric of society can provide a
positive impact on the nutritional status of children.
Poor sanitation will cause the toddler vulnerable to infectious diseases such as tuberculosis,
respiratory infections, and infectious diseases gantrointestinal. Infectious diseases suffered by
toddlers in the long term / chronic will cause a decrease in nutritional status of children, which in
turn can lead to poor nutritional status (Pongou et al., 2006; Kamiya, 2011). Adolescent nutritional
status can also be influenced by the intensity of physical activity and sport. A little physical activity
and exercise will cause adolescents are obese (Agustian, 2010).
Public Health Department, Faculty of Sports Science, F1 Building, 2nd
Floor, Sekaran Campus Gunungpati, Semarang City, Central Java Province, Indonesia, 50229 Phone/ Fax. +6224 8508007
185
The results of these HAC activities can serve media health promotion, which is to improve
the nutritional and health status of adolescents, both for itself and for teen parents and teachers at
school. Training activities cadre of healthy adolescent is capable of providing monitoring the
nutritional status of adolescents, so that awareness of youth for good nutrition and increased
physical health. In addition, identify the growth / nutritional status and physical health of
adolescents in order to be promoted handling and fixes to problems that occur. Another function
that is cultivating an attitude of healthy living behaviors (PHBs) and a healthy lifestyle, such as not
smoking, safe driving, and regular exercise. It is no less important is that it can improve the
sustainability of school health program (UKS) in providing health services to students at school
because they involve students in SMP Islami Walisongo Kedungwuni (YK et al., 2000).
Closing
Training results show that KRS average value Adolescent Health Knowledge and between
pretest and posttest Qualified candidates HAC increased from 74 into 90 Knowledge of balanced
nutrition increased from 72 to 95 Practice anthropometric measurements increased from 75 and 90
Practice calculating ideal body weight also increased from 70 to 90. Weighed and the percentage
of students who have a good nutritional status after through monitoring and advice from HAC
(within 6 weeks) as much as 85%. Average students' knowledge and awareness about balanced
nutrition and health of the individual before the given information and brainstorming discussions by
KRS with both criteria (> 80) was 40%, less knowledgeable (<80) was 60%, while after being given
information from KRS, good knowledge of students as much as 84%, and 16% less knowledge.
Average students' awareness of balanced nutrition and health of the individual before the
given information and brainstorming discussions by KRS with both criteria (> 80) was 45%, less
knowledgeable (<80) was 55%, while after being given information from KRS, knowledgeable
students well as much as 80%, and 20% less knowledge. The conclusion was that an increase in
knowledge and awareness of the students after being given information and brainstorming
discussions by HAC.
For The School, is expected to resolve the health problems that occur in students through the
Young Healthy Volunteers this to the student's health problems can be resolved properly and in
accordance with the school's ability and in accordance with the needs of students. In addition, the
school is expected to provide the material and convey health-related information to students more
aware of the importance of health.
For students, are expected to have self-motivation to always be able to increase awareness
in maintaining health, good personal hygiene, maintaining nutritional status to health is always
awake.
186
Public Health Department, Faculty of Sports Science, F1 Building, 2nd
Floor, Sekaran Campus Gunungpati, Semarang City, Central Java Province, Indonesia, 50229 Phone/ Fax. +6224 8508007
Refferences
Agustian, I. 2010. Status Gizi Remaja, Pola Makan, dan Aktivitas Olah Raga di SLTP 2 Majauleng Kabupaten Wajo. Media Gizi Pangan, Vol. IX(Januari – Juni 2010).
Almatsier, S. 2009. Prinsip Dasar Ilmu Gizi, Jakarta:PT Gramedia Pustaka Utama. De Silva, M. J. & Harpham, T. 2007. Maternal social capital and child nutritional status in four
developing countries. Health Place, 13(2): 341-55. Kamiya, Y. 2011. Socioeconomic Determinants of Nutritional Status of Children in Lao PDR:
Effects of Household and Community Factors. J Health Popul Nutr, Aug; 29(4): 339-348. Kemenkes RI. 2012 Kinerja Kegiatan Pembinaan Gizi Tahun 2011 Menuju Perbaikan Gizi
Perseorangan dan Masyarakat yang Bermutu. Jakarta: Kemenkes RI. Olack, B., Burke, H., Cosmas, L., Bamrah, S., Dooling, K., Feikin, D. R., Talley, L. E. & Breiman, R.
F. 2011. Nutritional status of under-five children living in an informal urban settlement in Nairobi, Kenya. J Health Popul Nutr, 29(4): 357-63.
Pongou, R., Ezzati, M. & Salomon, J. A. 2006. Household and community socioeconomic and environmental determinants of child nutritional status in Cameroon. BMC Public Health, 698.
Pujiati, S. 2008. Pengaruh Kompetensi Bidan di Desa Dalam Manajemen Penatalaksanaan Kasus Gizi Buruk Pada Anak Balita Terhadap Pemulihab Kasus Gizi Buruk Tahun 2008 (Studi Kasus di Dinas Kesehatan Kabupaten Pekalongan). Konsentrasi Administrasi dan Kebijakan Kesehatan, Minat Manajemen Kesehatan Ibu dan Anak, Magister, Universitas Diponegoro.
Rodríguez, L., Cervantes, L. & Ortiz, R. 2011. Malnutrition and Gastrointestinal and Respiratory Infections in Children: A Public Health Problem. Int. J. Environ. Res. Public Health, 2011; 81174-1205.
Supariasa, I. D. N., Bakri, B. & Fajar, I. 2002. Penilaian Status Gizi, Jakarta:Penerbit Buku Kedokteran EGC.
Y.K., H., Sandjaja & M.A. Husaini. 2000. KMS Remaja, Relevansinya dengan Pemantauan Tumbuh Kembang dalam Upaya Peningkatan Gizi dan Kesehatan.
Public Health Department, Faculty of Sports Science, F1 Building, 2nd
Floor, Sekaran Campus Gunungpati, Semarang City, Central Java Province, Indonesia, 50229 Phone/ Fax. +6224 8508007
187
REDUCING CHILD MORTALITY
PAPERS

188
Public Health Department, Faculty of Sports Science, F1 Building, 2nd
Floor, Sekaran Campus Gunungpati, Semarang City, Central Java Province, Indonesia, 50229 Phone/ Fax. +6224 8508007
Public Health Department, Faculty of Sports Science, F1 Building, 2nd
Floor, Sekaran Campus Gunungpati, Semarang City, Central Java Province, Indonesia, 50229 Phone/ Fax. +6224 8508007
189
DETERMINANTS OF BIRTH ASPHYXIA IN THE PROVINCE OF YOGYAKARTA
Rifqatussa'adah1 , Dewi Purnamawati2
1University of YARSI, Indonesia 2Stikes Kharisma Falkirk, Indonesia
Corresponding Author: [email protected]
Abstract
Background: Spontaneous breathing newborn is highly dependent on the state of the fetus during pregnancy and childbirth. DIY Province is one of the areas with the incidence of asphyxia is still quite high at 24% as a cause of neonatal mortality. This study aimed to determine the incidence of infant asphyxia determinant in the province this DIY. Methods: cross-sectional design. The data collection instruments were interviews with a questionnaire. The sampling technique used was multistage random sampling. Samples were taken at the hospital and maternity home. The total sample of 136 women giving birth. Results: The study was conducted in October 2012 Results of bivariate analysis showed education, K4, inspectors, birth attendants, mode of delivery, nutritional status, anemia and no association with the incidence of asphyxia. As for age, parity, K1, maternal health conditions, and low birth weight have a significant relationship with the occurrence of asphyxia. Multivariate results showed age, parity, K1, maternal health conditions, and low birth weight has proved a significant association with the incidence of asphyxia. Improving the ability and the means for birth attendants at the level of basic services and the delivery of assistance activities that have been performed should continue to be a concern. Key Words: Determinants, birth, asphyxia.
Introduction
Asphyxia is one of the risk factors that have a contribution to infant mortality, the data
obtained from the World Health Organization (WHO) mentions several factors that cause the death
of a newborn baby that is: as much as 27% of asphyxia, low birth weight infants 24%, whereas
10% of tetanus and other causes of the infection, bleeding, and nutrition issues.
Countries - the ASEAN countries, Indonesia is one country with the highest perinatal mortality
rate ranged 35 per 1,000 live births, Philippines 26 per 1,000 live births, Vietnam 28 per 1,000 live
births, Malaysia 28 per 1,000 live births, and Singapore only 3 per 1,000 live births, which is
caused by asphyxia such as (6-7%) and according to the results of the Household Health Survey
(Survey) in 2009 showed that the major cause of perinatal mortality was 34% asphyxia, low birth
weight 33%, 20% infection, abnormalities innate 4% and 9% to other causes.
One of the Government's efforts to reduce the IMR is Program Pregnancy Safer (MPS) with
the vision of all women in Indonesia can undergo pregnancy and childbirth safely, and babies who
are born alive and healthy, lower neonatal mortality rate be 15/1000 live births (Ministry of Health
2008).
According to Daga (2011), asphyxia will cause death if not treated properly and in a timely
manner on a regular antenatal monitoring and provide the management training asphyxia in
newborns for birth attendants at both hospitals and the community.
190
Public Health Department, Faculty of Sports Science, F1 Building, 2nd
Floor, Sekaran Campus Gunungpati, Semarang City, Central Java Province, Indonesia, 50229 Phone/ Fax. +6224 8508007
The perinatal mortality rate can be used as a reference to assess the success rate of health
care in the perinatal period, which is defined as perinatal mortality is the death of infants at
gestational ages ranging from 28 weeks to 28 days (1 month) after birth in every 1,000 live births
(Anne, 2010).
Special Region of Yogyakarta (DIY) is one of the areas with the incidence of asphyxia infants
were still quite high at 24% as a cause of neonatal mortality (MOH, 2009) Therefore, researchers
interested in conducting an assessment of asphyxia cases neonatorium in DIY.
Asphyxia is a condition in which a newborn baby can not breathe spontaneously and
regularly. Infants with a history of fetal distress before birth, will generally asphyxiated at birth. This
problem is closely related to maternal health disorders, abnormalities of the umbilical cord, or
issues that affect the welfare of the baby during or after childbirth (Dewi, 2010).
Neonatal asphyxia is a state where the baby can not breathe spontaneously immediately
after birth and regularly. This is caused by fetal hypoxia and hypoxia in utero is associated with
factors that arise in pregnancy, childbirth, or shortly after birth. Asphyxia consequences will grow
worse when handling the baby is not done perfectly. Actions to be performed on the baby to
sustain their survival and further limiting symptoms that may arise.
Certain conditions in pregnant women can cause uteroplacental blood circulation so that
oxygen supply to the baby is reduced. Hypoxia baby in the womb is indicated by fetal distress
which may progress to asphyxia newborns.
Several specific factors known to be the cause of asphyxia in the newborn, such as maternal
factors, infant clan cord following:
Maternal factors
(a) Preeclampsia and eclampsia, (b) Abnormal bleeding (placenta previa or placental abruption),
(c) Prolonged labor or obstructed, (d) Fever during labor Severe infections (malaria, syphilis,
tuberculosis, HIV), (e) Limitations of pregnancy (after 42 weeks gestation).
Umbilical Cord Factor
(a) Coil cord, (b) Short cord, (c) Cord knot, (d) Prolapse of the umbilical cord.
Factors Babies
(a) Premature infants (before 37 weeks gestation), (b) Childbirth with action (breech, twins,
shoulder dystocia, vacuum extraction, forceps extraction), (c) Congenital abnormalities
(congenital), (d) Meconium-stained amniotic fluid (greenish color).
Birth attendants should know the risk factors that have the potential to cause asphyxia. If
found these risk factors then it should be discussed with the mother and her family about the
possibility of the need for resuscitation. However, sometimes becomes difficult to identify the risk
factors or (knowledge helper) was not found but asphyxia persists. Therefore, the helper should
always be ready to perform neonatal resuscitation at every delivery assistance.
Asphyxia neonatorum can be divided into three: Mild neonatal asphyxia: Apgar score 7-10.
Babies are considered healthy, and does not require any special action, neonatal asphyxia were:
Public Health Department, Faculty of Sports Science, F1 Building, 2nd
Floor, Sekaran Campus Gunungpati, Semarang City, Central Java Province, Indonesia, 50229 Phone/ Fax. +6224 8508007
191
Apgar scores 4-6. On physical examination, the heart rate will look more than 100 / min, poor
muscle tone, or both, cyanosis, no reflex irritability, asfisia neonatal weight: APGAR Score 0-3. On
physical examination found the heart rate of less than 100 / min, poor muscle tone, severe
cyanosis, and sometimes pale, no reflex irritability, asphyxia with cardiac arrest in the fetal heart
sounds disappeared no more than 10 minutes before complete birth or sound heart disappeared
postpartum physical examination as severe asphyxia.
Spontaneous breathing depends on the condition of the fetus during pregnancy and childbirth.
If there is interference or transport of O2 gas exchange during pregnancy or childbirth will occur
more severe asphyxia. This situation will affect the function of cells of the body and if not resolved
will cause asphyxia deaths that occurred beginning a period of apnea is accompanied by a
decrease in frequency. In patients with severe asphyxia, breathing effort and the baby does not
seem to be in a period subsequent second apnue. At this level occurs bradycardia and fall in BP.
In asphyxia occurs also metabolic disorders and changes in acid-base balance in the body of the
baby. At the first level only respioratorik acidosis. When the baby's body will continue in a process
of anaerobic metabolism in the form of glycogen glycolysis body, so the body glycogen primarily in
the heart and liver will be reduced. At the next level will happen cardiovascular changes caused by
several circumstances including: (1) The loss of source of glycogen in the heart will affect cardiac
function, (2) The occurrence of metabolic acidosis which will lead to weakness of the heart muscle,
(3) Charging inadequate alveolar air will result in continuing high pulmonary vascular resistance so
that blood circulation to the lungs and circulatory system to another will be impaired
Neonatal be 15/1000 live births (Ministry of Health, 2008).
General Purpose
Knowledgeable determinants of infant asphyxia incidence in Yogyakarta Yogyakarta
Special Purpose: (1) Knowledgeable picture asphyxia events, education, age, parity, K1, K4,
inspectors, birth attendants, mode of delivery, nutritional status, anemia, maternal conditions and
LBW, (2) Knowing the relationship between maternal education with incidence of asphyxia, (3)
Knowing the relationship between maternal education with incidence of asphyxia, (4) Knowing the
relationship between maternal age with the incidence of asphyxia, (5) Knowledgeable parity
relationship between the incidence of asphyxia, (6) Knowing the relationship between the K1 with
incidence of asphyxia, (7) Knowing the relationship between the K4 with incidence of asphyxia , (8)
Knowing the relationship between birth attendants with incidence of asphyxia, (9) Knowing the
relationship between mode of delivery with the incidence of asphyxia, (10) Knowing the
relationship between nutritional status with the incidence of asphyxia, (11) Knowing the relationship
between the incidence of anemia of asphyxia, (12) Knowing the relationship between maternal
condition with an incidence of asphyxia, (13) Knowing the relationship between the incidence of
LBW with asphyxia, (14) Knowledgeable most influential factors on the incidence of asphyxia.
192
Public Health Department, Faculty of Sports Science, F1 Building, 2nd
Floor, Sekaran Campus Gunungpati, Semarang City, Central Java Province, Indonesia, 50229 Phone/ Fax. +6224 8508007
Methods
This study used a cross sectional design. The data collection instruments were interviews with
a questionnaire. The sampling technique used was multistage random sampling consisting of the
city of Yogyakarta and the four districts, Bantul, Kulon Progo, Gunung Kidul and Sleman. Samples
were taken at the hospital and maternity home. The total sample of 136 women giving birth. The
study was conducted in October 2012.
Data analysis was performed with the statistical analysis with the Chi Square test bivariate
and multivariate analysis. Software used for statistical analysis using SPSS version 17:00
Results and Discussion
The variables in this study were maternal education, age, parity, K1 (first visit pregnant women
in the first trimester) K4, birth attendants, mode of delivery, nutritional status, anemia, maternal
conditions and LBW. Based on the results of bivariate statistical test results were significant
variables were age (p = 0.019), parity (p = 0.010), K1 (p = 0.048), maternal health conditions (p =
0.005), and low birth weight (p = 0.034)
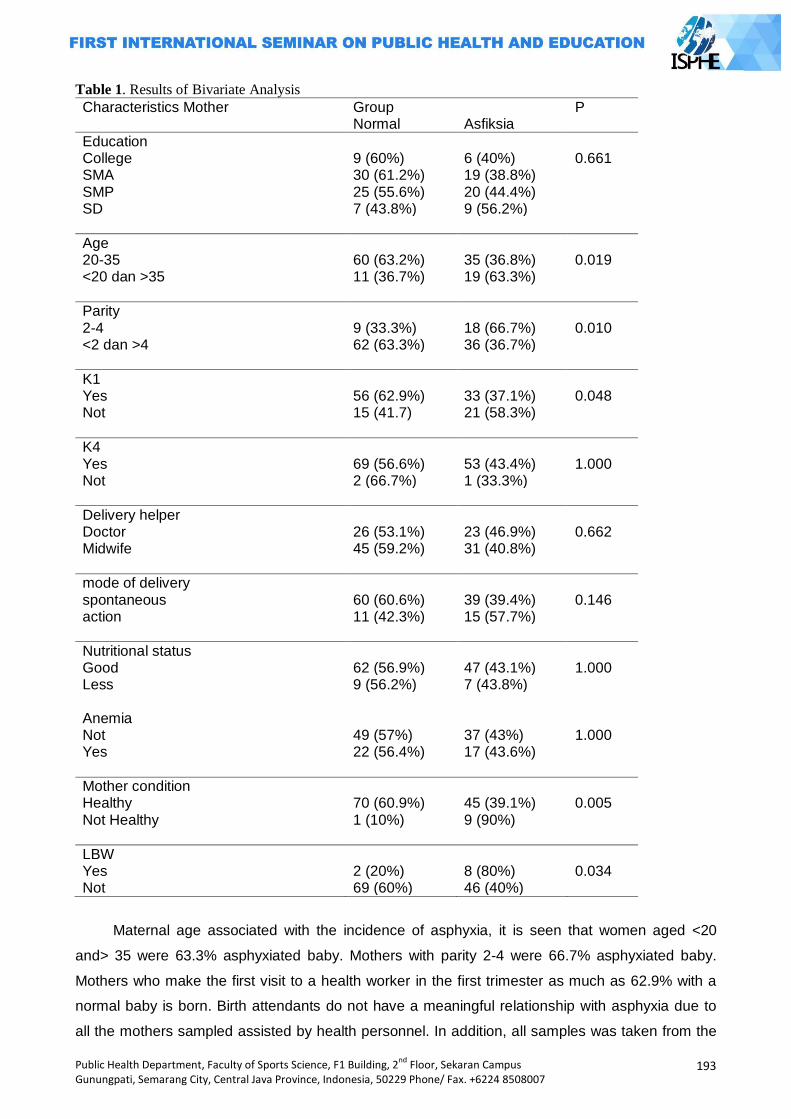
Public Health Department, Faculty of Sports Science, F1 Building, 2nd
Floor, Sekaran Campus Gunungpati, Semarang City, Central Java Province, Indonesia, 50229 Phone/ Fax. +6224 8508007
193
Table 1. Results of Bivariate Analysis
Characteristics Mother Group P Normal Asfiksia
Education College 9 (60%) 6 (40%) 0.661 SMA 30 (61.2%) 19 (38.8%) SMP 25 (55.6%) 20 (44.4%) SD 7 (43.8%) 9 (56.2%)
Age 20-35 60 (63.2%) 35 (36.8%) 0.019 <20 dan >35 11 (36.7%) 19 (63.3%)
Parity 2-4 9 (33.3%) 18 (66.7%) 0.010 <2 dan >4 62 (63.3%) 36 (36.7%)
K1 Yes 56 (62.9%) 33 (37.1%) 0.048 Not 15 (41.7) 21 (58.3%)
K4 Yes 69 (56.6%) 53 (43.4%) 1.000 Not 2 (66.7%) 1 (33.3%)
Delivery helper Doctor 26 (53.1%) 23 (46.9%) 0.662 Midwife 45 (59.2%) 31 (40.8%)
mode of delivery spontaneous 60 (60.6%) 39 (39.4%) 0.146 action 11 (42.3%) 15 (57.7%)
Nutritional status Good 62 (56.9%) 47 (43.1%) 1.000 Less 9 (56.2%) 7 (43.8%) Anemia Not 49 (57%) 37 (43%) 1.000 Yes 22 (56.4%) 17 (43.6%)
Mother condition Healthy 70 (60.9%) 45 (39.1%) 0.005 Not Healthy 1 (10%) 9 (90%)
LBW Yes 2 (20%) 8 (80%) 0.034 Not 69 (60%) 46 (40%)
Maternal age associated with the incidence of asphyxia, it is seen that women aged <20
and> 35 were 63.3% asphyxiated baby. Mothers with parity 2-4 were 66.7% asphyxiated baby.
Mothers who make the first visit to a health worker in the first trimester as much as 62.9% with a
normal baby is born. Birth attendants do not have a meaningful relationship with asphyxia due to
all the mothers sampled assisted by health personnel. In addition, all samples was taken from the
194
Public Health Department, Faculty of Sports Science, F1 Building, 2nd
Floor, Sekaran Campus Gunungpati, Semarang City, Central Java Province, Indonesia, 50229 Phone/ Fax. +6224 8508007
hospital and maternity home. No mothers delivered at home or other place. No mother also helped
other than health workers or traditional birth attendants. Maternal health conditions have a
significant relationship with the incidence of asphyxia, it appears that 60.9% of healthy mothers
with normal babies born. LBW has a significant relationship with asphyxia, low birth weight babies
who are not 60% not having asphyxia
Multivariate results showed that age, parity, K1, maternal health conditions, and LBW go all
the models. This shows that all these variables have an influence on the incidence of asphyxia.
Closing
When the antenatal care of pregnant women found that having a pregnancy complication that
can be monitored closely by health professionals. The handling of newborns with low birth weight
and asphyxia needs to be improved to increase the ability of health workers through training.
Pregnant women are expected to perform antenatal rutindan regularly and get a 5T service
standards. Pregnant women at high risk in pregnancy in order to seek adequate health care
facilities.
References
A. S. Daga, S. R. Daga and S. K. Patole. 2011. Risk Assessment in Birth Asphyxia. Journal of Tropical Pediatric
Anne CC Lee, Luke C. Mullany, James M. Tielsch. 2010. Risk Factors for Neonatal Mortality Due to Birth Asphyxia in Southern Nepal: A Prospective, Community-Based Cohort Study. Journal of Pediatric
Departemen Kesehatan RI. 1993. Pedoman Rasinalisasi Komposisi Obat Tradisional. Jakarta: Dirjen POM.
Departemen Kesehatan RI. 2009. Profil Kesehatan Indonesia 2008. Dinas Kesehatan Provinsi DIY. 2009. Profil Kesehatan Provinsi Daerah Istimewa Yogyakarta 2009. Hege Langli Ersdal, Estomih Mduma, Erling Svensen, Jeffrey Perlman. 2010. Birth Asphyxia: A
Major Cause of Early Neonatal Mortality in a Tanzanian Rural Hospital. Journal of Pediatric Kamrullah, Munir. Asfiksia Neonaturum. Diakses tanggal 12 November 2007.
(http://perawatmalut.tblog.com) Manuaba, I. 1997. Ilmu Kebidanan Penyakit Kandungan dan Keluarga Berencana Untuk
Pendidikan Bidan Kedokteran. Jakarta: EGC Nany Lia Dewi, Vivian. 2010. Asuhan Neonatus Bayi dan Anak Balita. Jakarta: Salemba Medika.
Purnamawati, Dewi. 2008, Konsumsi Jamu Sebagai Faktor Risiko Kejadian Asfiksia Pada Bayi Baru Lahir di Bekasi Tahun 2008. Tesis. Program Pascasarjana Fakultas Kesehatan Masyarakat Universitas Indonesia.
Purwadianto. A. 2000. Kedaruralan Medik. Jakarta : Bina Rupa Aksara. Wong. L Donna. 2004. Keperawatan Pediatrik Edisi 1 Kedokteran. Jakarta: EGC.
Public Health Department, Faculty of Sports Science, F1 Building, 2nd
Floor, Sekaran Campus Gunungpati, Semarang City, Central Java Province, Indonesia, 50229 Phone/ Fax. +6224 8508007
195
IMPROVING HEALTH, CHILDCARE,
AND QUALITY OF MOTHER
PAPERS

196
Public Health Department, Faculty of Sports Science, F1 Building, 2nd
Floor, Sekaran Campus Gunungpati, Semarang City, Central Java Province, Indonesia, 50229 Phone/ Fax. +6224 8508007
Public Health Department, Faculty of Sports Science, F1 Building, 2nd
Floor, Sekaran Campus Gunungpati, Semarang City, Central Java Province, Indonesia, 50229 Phone/ Fax. +6224 8508007
197
FULFILLMENT DESCRIPTION OF REPRODUCTIVE RIGHTS ON WOMEN OFFENDERS (CASE STUDY AT KEMBANGARUM VILLAGE WEST SEMARANG SUBDISTRICT SEMARANG CITY)
Risa Nur Amalia1, Intan Zainafree1
1Semarang State University, Indonesia
Corresponding Author: [email protected]
Abstract Introduction: Fulfillment of reproductive rights is one of the strategies in overcoming the problems of population and health development. Women offenders are at risk not fulling the reproductive rights. This study aims to find out fulfillment descrition of reproductive rights on women offenders at Kembangarum Village West Semarang subdistrict City Semarang. Methods: The study utilizes qualitative research methods with the technique of taking informants in purposive sampling. Informants are 3 women offenders, 3 husbands and 2 parents of women offenders. The technique of taking data uses in-depth interview technique which is then continued by descriptive data analysis. Results: The result indicates that seven rights which examined no rights that is the fulfillment includes all the elements of rights fulfillment. The rights that is the rights to get information and reproductive health education, the rights to determine the number and spacing of births, the rights to be life, the rights to get reproductive health services and protection, the rights to develop and plan a family, the rights to be freedom and security related to reproductive life and the rights to be free from abuse and bad behavior, including protection from rape, violence, torture, and sexual abuse. The Suggestion for the National Family Planning Coordinating Board, the information on the reproductive rights should be presented in health promotion activities. The Target of health promotion should include husband, wife or parents. Key words: Rights fulfillment; reproductive rights; women offenders.
Introduction
Marriage is according to Marriage Law No. 1 Year 1974 is born the inner bonding between a
man and woman as husband and wife with the intention of forming a harmonious family. According
to article 1 of Law No. 23 Year 2002 regarding Child Protection, mentioned that ―the child is a
person who is not yet 18 (eighteen) years old, including the child who is still in the womb.‖ Based
on the law of child protection, child marriage is a marriage where the man or woman is less than 18
years old. Based on the United Nations International Children‘s Emergency Fund (UNICEF) in
several countries during the period 2000-2010 on women are 20-24 years old who are married
under the age of 18 years old recorded in Mali (70%), Bangladesh (65%), Cameroon Africa (62%).
According to the data of the Ministry for Women Empowerment and Child Protection (KPP &
PA) in Profile of Indonesia Children in 2012, amount to 1.62% of daughter in Indonesia are married
and ever married status, while in Central Java is 1.47%. Semarang City is a city that has Qualifying
Child City Policy, also not free from the incidence of child marriage. Based on the data from the
Agency for Community Empowerment of Women and Family Planning (BAPERMASPER and KB)
Semarang City, during the year 2011 to 2012 recorded 803 women commit such child marriage
those are the highest at West Semarang Subdistrict. Data from KUA of West Semarang Subdistrict
shows during the year 2012 to September 2013 there are 696 cases of marriage under the age of
198
Public Health Department, Faculty of Sports Science, F1 Building, 2nd
Floor, Sekaran Campus Gunungpati, Semarang City, Central Java Province, Indonesia, 50229 Phone/ Fax. +6224 8508007
20 years old and at Kembangarum Village reaches 93 cases. Although the limitation thatis used in
KUA is 20 years old, but the data is enough to illustrate the massive problem of child marriage iat
Kembangarum Village.
The incident intensity of child marriage is at risk will not be the fulfillment of reproductive
rights, particularly on women. Reproductive rights in general defined as the rights owned by the
individual both men and women in relation to the reproductive condition. Reproductive Rights is 12,
but in this study only examined 7 rights. Selection of seven rights adapted to reproductive health
problems on women offenders, among them are the rights to be life (the rights to be protected from
the death due to pregnancy and childbirth process); the rights to be freedom and security
associated with reproductive life; the right to be free from abuse and bad behavior, including
protection from rape, violance, torture and sexual abuse; the rights to get information and
reproductive health education; the rights to develop and plan a family; the rights to determine the
number and spacing of births; and the rights to get services and reproductive health protection.
The fulfillment of seven rights viewed from the following indicators, maternal mortality Rate (AKI),
Infant Mortality Rate (AKB), child marriage caused by an unwanted pregnancy, the incidence of
Domestic Violence (KDRT), the incidence of Sexually Transmitted Infections (IMS) on women and
the scope of use of contraception (Badan Koordinasi Keluarga Berencana Nasional, 2008).
AKI in 2012 is 359 per 100000 live births, increases significant from 2007 in the amount 228
per 100000 live births (Badan Koordinasi Keluarga Berencana Nasional, 2013). Maternal mortality
rate in Central Java in 2012 based on the profile of Health, Central Java Province in 2012 is 116.34
/100000 live births, increased when compared with AKI in 2011 is 116.01 /100000 live births. While
in Semarang City in 2012, there are 22 cases of maternal mortality, and maternal mortality in the
age group <20 years old is 6.37%. Babies born by mothers with the age less than 20 years old are
also at risk of preterm birth, low birth babies weight (BBLR), and congenital deformity or disability
that has happened since in the process of pregnancy. (Badan Koordinasi Keluarga Berencana
Nasional, 2010). AKB in Indonesia in 2012 is 32 per 1000 live births, far from the target of
Millennium Development Goals (MDG's) that targets AKB in 2015 is 17 per 1000 live births (Badan
Koordinasi Keluarga Berencana Nasional, 2013). AKB in Central Java in 2012 is 10.75 /1000 live
births, increase when compared to 2011 is 10.34 /1000 live births, while AKB in Semarang City in
2012 is 10.66 per 1000 live births (Dinas Kesehatan Provinsi Jawa Tengah, 2012).
Based on the data of Integrated Service Centre (PPT) of Cahaya Kasih West Semarang,
known throughout the year 2012 to 2013 there are 5 cases that reported there is sexual assault on
a child, and one from five cases occurres at Kembangarum Village. Marriage under 20 years old is
a risk factor of transmission of Human Immunodeficiency Virus (HIV) on women, and heightens the
risk of sexually transmitted infections and cervix cancer. Other IMS such as herpes simplex virus
type 2, gonorrhea, chlamydia are often transmitted and increase risk for women exposed to HIV
(Nour, NM, 2009). HIV incidence in Indonesia is reported in June 2013 known 3.8% of HIV cases
in the age group of 15-19 years old where Central Java ranked the highest that is the fifth order
Public Health Department, Faculty of Sports Science, F1 Building, 2nd
Floor, Sekaran Campus Gunungpati, Semarang City, Central Java Province, Indonesia, 50229 Phone/ Fax. +6224 8508007
199
with the highest incidence is in Semarang City, recorded 214 cases (Direktorat Jenderal
Pengendalian Penyakit dan Penyehatan Lingkungan, 2013). Women offenders organized to defer
their pregnancy until the process grows physically and psychically ended at the age of 20 years old
(Badan Koordinasi Keluarga Berencana Nasional, 2010). There are only 2% of married couples
using contraception for men in Indonesia (Badan Koordinasi Keluarga Berencana Nasional, 2013).
Men participation in Central Java are only 3.3% in the use of men contraception, while in
Semarang City is 93.1 % of couples burden the use of contraception on women. Based on the data
from BAPERMASPER & KB West Semarang Subdistrict until October 2013, only 4% of PUS that
chooses to use men contraception. Based on the data indicates women offenders are at risk not
fulfilling the reproductive rights. The study aims to find out fulfillment description of reproductive
rights on women offenders at Kembangarum Village West Semarang Subdistrict Semarang City.
Methods
This study uses qualitative research methods. The technique of taking informants in
purposive sampling. The technique of purposive sampling is a technique which is based on certain
considerations made by the researcher him/herself in determining the sample (Notoatmojo, S.,
2005). The selection of informants is stopped when the data already experiences redundancy or
saturation (Sugiyono, 2008). Informants in this study are 8 people consisting of 3 women offenders
as key informants, 3 husbands and 2 parents of women offenders as triangulation informant. The
criteria that determined by the researcher for key informants that is married women when under
age 18 years old, living at Kembangarum Village West Semarang Subdistrict and willing to become
informants.
Collecting the data conducted by means of in-depth interview. The tools used in data
collection are in-depth interview guide and tape recorder. The test of the data validity is done by
using source triangulation technique, namely, by comparing the results of the interview between
women offenders with the results of interview with husbands and parents to check the truth of the
answers given by women offenders. The technique of data analysis in this study uses data
analysis technique of Miles and Huberman model, namely, inductive data analysis. The analysis
starts from the data reduction, displays the data and making conclusion (Sugiyono, 2008).
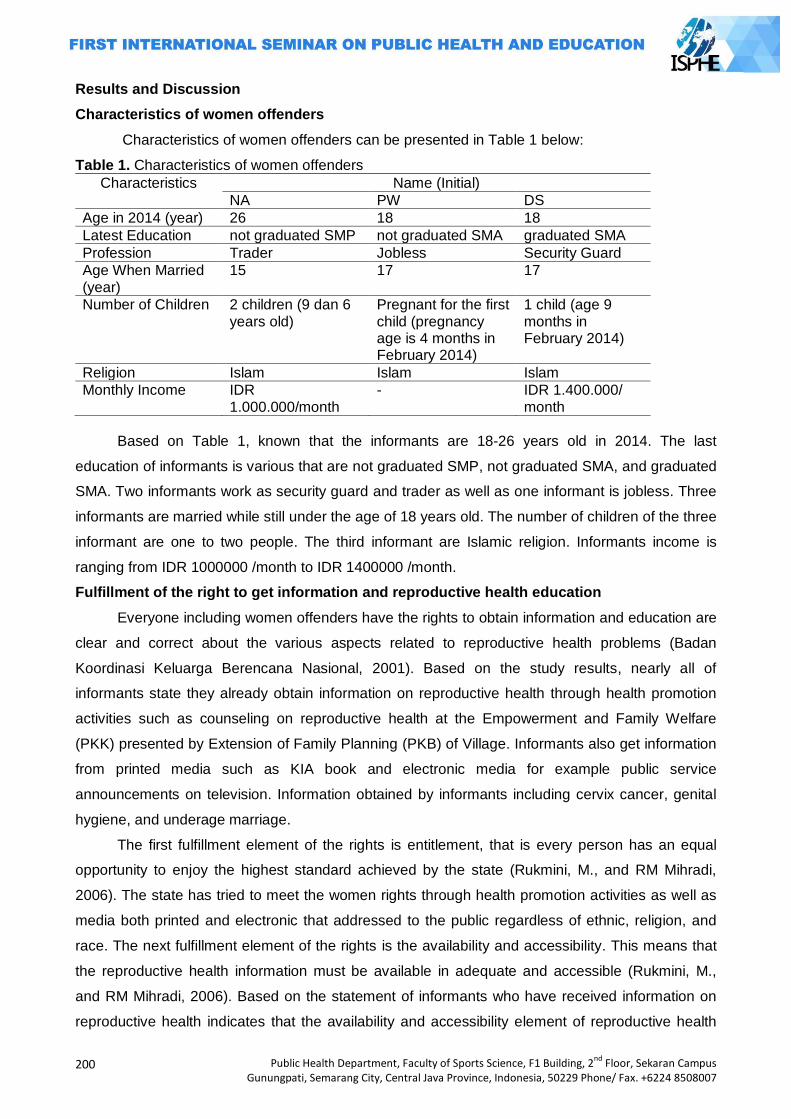
200
Public Health Department, Faculty of Sports Science, F1 Building, 2nd
Floor, Sekaran Campus Gunungpati, Semarang City, Central Java Province, Indonesia, 50229 Phone/ Fax. +6224 8508007
Results and Discussion
Characteristics of women offenders
Characteristics of women offenders can be presented in Table 1 below:
Table 1. Characteristics of women offenders
Characteristics Name (Initial)
NA PW DS
Age in 2014 (year) 26 18 18
Latest Education not graduated SMP not graduated SMA graduated SMA
Profession Trader Jobless Security Guard
Age When Married (year)
15 17 17
Number of Children 2 children (9 dan 6 years old)
Pregnant for the first child (pregnancy age is 4 months in February 2014)
1 child (age 9 months in February 2014)
Religion Islam Islam Islam
Monthly Income IDR 1.000.000/month
- IDR 1.400.000/ month
Based on Table 1, known that the informants are 18-26 years old in 2014. The last
education of informants is various that are not graduated SMP, not graduated SMA, and graduated
SMA. Two informants work as security guard and trader as well as one informant is jobless. Three
informants are married while still under the age of 18 years old. The number of children of the three
informant are one to two people. The third informant are Islamic religion. Informants income is
ranging from IDR 1000000 /month to IDR 1400000 /month.
Fulfillment of the right to get information and reproductive health education
Everyone including women offenders have the rights to obtain information and education are
clear and correct about the various aspects related to reproductive health problems (Badan
Koordinasi Keluarga Berencana Nasional, 2001). Based on the study results, nearly all of
informants state they already obtain information on reproductive health through health promotion
activities such as counseling on reproductive health at the Empowerment and Family Welfare
(PKK) presented by Extension of Family Planning (PKB) of Village. Informants also get information
from printed media such as KIA book and electronic media for example public service
announcements on television. Information obtained by informants including cervix cancer, genital
hygiene, and underage marriage.
The first fulfillment element of the rights is entitlement, that is every person has an equal
opportunity to enjoy the highest standard achieved by the state (Rukmini, M., and RM Mihradi,
2006). The state has tried to meet the women rights through health promotion activities as well as
media both printed and electronic that addressed to the public regardless of ethnic, religion, and
race. The next fulfillment element of the rights is the availability and accessibility. This means that
the reproductive health information must be available in adequate and accessible (Rukmini, M.,
and RM Mihradi, 2006). Based on the statement of informants who have received information on
reproductive health indicates that the availability and accessibility element of reproductive health
Public Health Department, Faculty of Sports Science, F1 Building, 2nd
Floor, Sekaran Campus Gunungpati, Semarang City, Central Java Province, Indonesia, 50229 Phone/ Fax. +6224 8508007
201
information have met. Informants are free to choose to look for reproductive health information
desired, either through counseling, television as well as health workers. It shows the freedom
element in the fulfillment of the rights has met. Almost all of reproductive health information
received by informants, can be accepted by informants because according to the beliefs and
values that are believed by informants. It shows the acceptance element within the rights has met.
Indonesian Ministry of Health (MOH) has determined the material of Information and Education
Communication (IEC) of reproductive health that are divided into two major groups, namely, the
main material and auxiliary material (Departemen Kesehatan Republik Indonesia, 2008).
Reproductive health information that obtained by informant only covers 1 of 5 material on the main
material and 1 of 7 material from the Department of Health guidelines, so that it can be seen that
the informant obtained the information is still lacking.
In terms of behavior form factor, according to the theory of Lawrence Green the human
behavior is determined by three factors, namely, predisposing factor, (support) enabling, and
driving (reinforcing) (Notoatmojo, S., 2012). Based on the study result, predisposing factor of
informant behavior in getting information is the level of education and employment. Supporting
factors include facilities and infrastructure. Driving factors, among others, are attitude and behavior
of the parents.
Fulfillment of the rights to determine the number of children and spacing of births
Everyone including women offenders have the rights to determine the number of children
that have and spacing of births as desired (Badan Koordinasi Keluarga Berencana Nasional,
2001). Based on the study result, most of the informants can not freely determine the number of
children who desired. Decision of children number, mostly dominated by the husband and parents,
it occurs on informants with low education, it is in line with research conducted by Nurfadhilah
(2011) who finds that the informants with the lowest education are generally not free in determining
the number of children and there is dominance of the other party (Nurfadhillah, 2011). At
determination of birth spacing, most of the informants claim to be dominant in determining the birth
spacing. The second fulfillment element of the rights is entitlement. Based on the result study,
there is only one informant who has the same opportunity with husband and parents in determining
the number of children, the informant is the informant with the highest education and work. The
results of research conducted by Nurfadhilah (2011) also finds the same thing, where married
women have high education and work have own strength which avoids dominance in marriage.
While in the determination of the birth spacing, most of the informants have the same opportunities
with husbands and parents (Nurfadhillah, 2011). Based on the research results, opinions and
perceptions of women offenders on the number and spacing of children birth is still considered by
husband and parents.
Health services related to child birth spacing is contraceptive services. Based on this
research, it is known that one informant has not unthinkable to use contraceptive, it is in line with
the result research of Nurfadhilah that says that at the beginning of marriage, so expected the
202
Public Health Department, Faculty of Sports Science, F1 Building, 2nd
Floor, Sekaran Campus Gunungpati, Semarang City, Central Java Province, Indonesia, 50229 Phone/ Fax. +6224 8508007
presence of children, so that the use of contraceptive is not done, thinking about the use of
contraceptive appears after the delivery time (Nurfadhillah, 2011). While most of the informants
when conducted research using the contraceptive with the type of injectable 3 months that the
service found in private doctors and midwives, it shows that the government has provided
contraceptives health care facilities that is accessible to the public. Based on the study result, most
of the informants state that the quality of contraceptive services that they get is good, it is also
evident from the experience of informants who have never experienced a pregnancy due to
contraceptive failure. Contraceptives is used by most of the informants is the type of injectable
contraceptives 3 months, it is in conformity with the recommendation of the National Family
Planning Coordinating Board, where contraception is recommended during pregnancy spacing is a
contraceptive device that has a fairly high reversibility and effectiveness, and not inhibit breast milk
(ASI), contraception which is recommended is IUD, injections, pills, implants and simple method
(Badan Koordinasi Keluarga Berencana Nasional, 2010).
Rights fulfillment to be life (protected from death due to pregnancy and childbirth process)
Every women including pregnant women wedding offender and will give birth have rights to
get protection in the sense of getting good health care thus avoiding the possibility of death in the
process of pregnancy and childbirth (Badan Koordinasi Keluarga Berencana Nasional, 2001). The
result in this study, shows that all the informants say that have never experienced an incident with
the risk of death due to give birth as unwanted pregnancies due to contraceptive failure,
miscarriage, abortion, and complications during childbirth, so that the analysis of the rights
fulfillment to be life, only to be seen from the respondents experience in protected from death due
to pregnancy. All informants in this study, married while still under the age of eighteen years old, so
on the advice of the National Family Planning Coordinating Board, it is advisable to delay
pregnancy and childbirth until a minimum age of 20 years old by using contraceptives. However,
based on the study result the all respondents state that there is no plan to delay pregnancy after
marriage, they assume that pregnancy is a natural thing after marriage.
Based on the study results show that women offenders can be freely to decide to get
pregnant because there is no plan to use contraceptives, so it can be concluded that the freedom
element in controlling health and body themselves women offenders have been met, but not
matched with the right knowledge, so the fulfillment of the freedom element here will increase the
risk of death on women offenders. Most of the informants claim to discuss both with husband in
making decisions when pregnant. So that both the informant and the husband has the same
opportunity to make decision when it‘s time to get pregnant. The state through the National Family
Planning Coordinating Board has sought to protect women offenders from the death due to
pregnancy through the program of maturation Age of Marriage (PUP) where there are three basic
framework on the women reproductive period, namely: 1) delay of marriage and pregnancy, 2)
spacing pregnancy, and 3) preventing pregnancy (Badan Koordinasi Keluarga Berencana
Nasional, 2010). However, the government efforts to protect women offenders through the
Public Health Department, Faculty of Sports Science, F1 Building, 2nd
Floor, Sekaran Campus Gunungpati, Semarang City, Central Java Province, Indonesia, 50229 Phone/ Fax. +6224 8508007
203
suggestion of the use of contraceptives, is not in accordance with the value which is believed by
the most of informants, where most of the informants argue that pregnant is normal thing after
marriage. When conducted the research most of the informants using the type of injectable
contraceptives 3 months that the service found in private doctors and midwives, it shows that the
government has provided contraceptives health care facilities that are accessible to the public.
Based on the study result, most of the informants state that the quality of contraceptive
services that they get is good, it is also evident from the experience of informants who have never
experienced pregnancy due to contraceptive failure. The behavior of the informant in getting
protection from death due to pregnancy and childbirth is influenced by predisposing factors,
namely, the level of knowledge and perception of the informant. Supporting factors of the behavior
which is the availability of facilities, health care facilities and infrastructure. The driving factors such
as the level of knowledge of the parents.
Rights fulfillment to get reproductive health care and protection
Everyone including women offenders have the right to obtain services and protection
associated with the reproductive life including to be avoiding from the death due to the
reproduction process (Badan Koordinasi Keluarga Berencana Nasional, 2001). The state has tried
to meet these rights by providing reproductive health services such as antenatal services, delivery
care services, and contraceptive services, that are available at the health center of Manyaran,
midwives and private practice physician. The health care facility is addressed for the whole
community especially citizens at Kembangarum Village without distinction of ethnic, religion, and
race. Antenatal care facilities, maternity care, and contraception services have already provided,
not only available in the clinic, but also in hospitals, private practice doctors and midwives. From
the research, it is known that there are no complaints from informants about the availability and
accessibility of health services they need. It becomes important in reproductive health services are
pleasure on the informants in enjoying these services. Most of the informants are comfortable and
stable get health services that have been provided, proved their visit on selected services
performed continously. Reviewed of freedom in determining the reproductive health services, all
informants state that the selection of health care is not derived from the decision themselves, but
rather from husband and their parents.
Based on the Operational Guidelines for Integrated Services in the Health Center of the
Ministry of Health to flow antenatal care should include anamnesis, physical examination, and
services including counseling customized with gestational age (Departemen Kesehatan Republik
Indonesia, 2008). Delivery Services include anamnesis, physical examination, delivery assistance,
and counseling, while family planning services include anamnesis, counseling pre services,
physical examination, contraceptive services, and counseling post-services. Based on the study
results show that the informants have received antenatal care, childbirth, and family planning in
accordance with the mechanism set by the Department of Health. All informants state that
204
Public Health Department, Faculty of Sports Science, F1 Building, 2nd
Floor, Sekaran Campus Gunungpati, Semarang City, Central Java Province, Indonesia, 50229 Phone/ Fax. +6224 8508007
antenatal care, delivery care, and contraceptive services they receive are good and appropriate
standards and no complaints are perceived.
Rights fulfillment of the to develop and plan family
Every individual including women offenders is guaranteed the right to develop and plan a
family including when, where, with whom, and how he/her will build his/her family, but can not be
separated from religion and socio-cultural norms in force (Badan Koordinasi Keluarga Berencana
Nasional, 2001). Based on the study result, all respondents are married at the age of 15 years old
until the age of 17 years old, it is different with the advice of the government where the age is
under 20 years old is age recommended to delay marriage and pregnancy (Badan Koordinasi
Keluarga Berencana Nasional, 2010). Based on the decision makers to build and plan a family,
most of perpetrators of child marriage, married for the decision of their parents. The decision is
made for several reasons, including the level of parental education, parental concerns, and
economic pressures. In addition, the occurrence of pregnancy before marriage also reinforces the
decision to marry their children as soon as possible. From the informants side, level of low
informants education, high adherence to the parents as well as the incessant of media exposure
that makes them increasingly permissive about sex, also influence them to accept decision made
by their parents.
The reasons of child marriage that are socio-cultural factor, economic pressure, level of
education, it is difficult to get a job, mass media, religion, views and beliefs (Kumalasari, I., et al,
2012). In this study the reasons for the child marriage that are the level of parental education,
parental concerns, economic pressure, level of informants education, high adherence to the
parents, the incessant of media exposure and pregnancy outside marriage. Based on Article 26,
paragraph 1 of Law No. 23 Year 2002 regarding Child Protection, stated that ―Parents are obliged
and responsible for: c. Preventing the occurrence of marriage at the age of the children‖. However,
the study results showed that the decision to marry from informants mostly taken up by informants‘
parent. This is reinforced from the statements of informants, where they claim not planning their
wedding before. Based on the elements of entitlement, it appears that the informants do not have
the same opportunity to be able to decide in planning to build their families. Although most of the
informants‘ decision to get married decided by the parents, but the informant can receive the
decision determined by his/her parents. Reviewing from the level of the formed family welfare, it
can be seen that most of the informants are still living with their parents, family income level is also
relatively minimal. Based on the Law No. 1 Year 1974 Article 7 states that ―Marriage is only
allowed if the man has reached the age of 19 years old and the woman has reached 16 years old.‖
The existance of the Law describes the availability of strong legal framework to be able to perform
marriage for women under the age of eighteen years old. Based on the results of this study,
predisposing factors that are the most influential in the fulfillment of this right are the level of
education. Supporting factors include the availability of the facilities and the means to get married.
Driving factors, among others, the role of parents supported by the government regulations.
Public Health Department, Faculty of Sports Science, F1 Building, 2nd
Floor, Sekaran Campus Gunungpati, Semarang City, Central Java Province, Indonesia, 50229 Phone/ Fax. +6224 8508007
205
Rights fulfillment to be freedom and security related to reproductive life
Everyone including women offenders have to be secured to prevent coercion or exclusion or
fear within the individual because it has the right to be freedom (Badan Koordinasi Keluarga
Berencana Nasional, 2001). Sexual life is stated healthy if it meets five conditions: 1) Consent
(free), 2) Equality (no dominance), 3) Respect, 4) Trust (sure), and 5) Safety (McKinley Health
Center, 2009).
Based on the study result known that the initiator in sexual intercourse the informants largely
dominated by their husband, only one informant states can also decite when doing sexual
intercourse. Other study result indicates that the initiator in sexual intercourse on Women of PKK
dominated by their husband, the other result is that the level of education on Women of PKK
provide a stronger bargaining position that still allows for the determination of first negotiation in
sexual intercourse (Kurniati, DPY., 2012). Similarly on the women offenders, the informants with
the highest education in this study have a stronger bargaining position allowing the informants to
determine when sexual intercourse.
The rejection of the invitation in sexual intercourse committed by the informants usually
occur due to menstruation, lazy feeling, tired, and do not want to (mood). This refusal made by
informant resulted largely the informants‘ husband gets angry, sullen and gives silent reaction
(cranky), but based on the informants‘ statement the reactions occur only a few moments.
Although only happen a few moments, but it shows their lack of mutual respect and understanding
the informants‘ condition. The case is consistent with the research results of Nurfadhilah (2011)
who finds that the wives ever refuse or discontinue sexual intercourse can result in silent reaction
or pain or anger or sadness on their husband (Nurfadhillah, 2011). Another result of the study of
Kurniati, DPY (2012) also shows rejection in sexual intercourse carried out by the PKK women
causes angry response or silence that is only temporary and does not lead to domestic violence
(Kurniati, DPY., 2012).
Women offenders claim to be able to get satisfaction in sexual intercourse with their
husband, but does not always get it every sexual intercourse because it is influenced by mood,
laziness, and tiredness. Another thing that also allows such things such as all women offenders in
this study can not be free to determine the manner desired in sexual intercourse. Most of the
informants in this study express do not feel worried about contracting sexually transmitted disease
from their husband. The lack of worry is emerging on the basis of their belief in their husband. Only
one woman offender is concerned contracting sexually transmitted diseas because of knowing
their husband to use a tattoo, using drugs and drinking alcoholic.
Rights fulfillment to be free from torture and mistreatment including protection of rape,
violence, torturing, and sexual abuse
Everyone including women offenders have rights to get protection from the possibility of a
variety of ill-treatment such as rape, violence, torturing, and sexual abuse because it can affect the
reproductive life (Badan Koordinasi Keluarga Berencana Nasional, 2001). The study results
206
Public Health Department, Faculty of Sports Science, F1 Building, 2nd
Floor, Sekaran Campus Gunungpati, Semarang City, Central Java Province, Indonesia, 50229 Phone/ Fax. +6224 8508007
indicate that most of the informants have never experienced bad treatment experiences such as
rape, violence, torturing, and sexual abuse. Only one informant who claims to have experienced
coercion in sexual intercourse with her husband, but she says that not happen until the violence
only the coercion to perform sexual intercourse. These results reinforced the secondary data from
the Integrated Service Center (PPT) of Cahaya Kasih, which throughout the year 2012 to 2013
there is no reporting of ill-treatment such as rape, violence, torturing, and sexual abuse by all
informants in this study.
The government of Semarang City already has an Integrated Management service agencies
at West Semarang Subdistrict known as PPT of Cahaya Kasih that functions to handle issues
related to gender equality and child protection, including protection from violence evidenced for the
whole society, including women offenders regardless of ethnic, religion, and race. According to the
study result, all the informants in this study do not know the existance and functions of the services
of PPT Cahaya Kasih. The study results show that if the informants suffer violence, they are willing
to report it to the complaints service facility for violence such as PPT and police.
Closing
Based on the study results about the fulfillment description of reproductive rights on women
offenders in Kembangarum Village West Semarang Subdistrict Semarang City, it can be concluded
that the rights fulfillment to get information and reproductive health education do not fully meet from
the element of information quality obtained by the informant. The rights fulfillment to determine the
number and spacing of births do not fully meet from the element of freedom. The rights fulfillment
to be protected from the death due to pregnancy and delivery birth do not fully meet from the
element of acceptability. The rights fulfillment to obtain services and reproductive health protection
do not fully meet from the element of freedom. The rights fulfillment to build and plan family do not
fully meet from the element of freedom, entitlement, and quality. The rights of women offenders in
getting healthy sexual relationship, in terms of The Healthy Sexuality Hierarchy of Wendy Maltz
(1995) has not been met from the element of freedom (consent), dominance (equality), mutual
respect (respect). the rights fulfillment to be free from persecution and ill-treatment, including
protection from rape, violence, torturing, and sexual abuse do not met all especially from the
element of accessibility. The related factor in order to be fulfillment of women reproductive rights,
among others, the level of education, level of knowledge, attitudes, employment, facilities, behavior
of the reference group (husband, parents and health workers), and government regulation.
For the National Family Planning Coordinating Board, information regarding reproductive
rights should also be delivered in health promotion activities. Health promotion target have to
include all elements in the family both husband, wife, and parents.
References Badan Koordinasi Keluarga Berencana Nasional, 2001, Tanya Jawab Hak-Hak Reproduksi,
Yayasan Mitra Inti, Jakarta.
Public Health Department, Faculty of Sports Science, F1 Building, 2nd
Floor, Sekaran Campus Gunungpati, Semarang City, Central Java Province, Indonesia, 50229 Phone/ Fax. +6224 8508007
207
----------------------------------------------------------, 2008, Penanggulangan Masalah Kesehatan Reproduksi, Badan Koordinasi Keluarga Berencana Nasional, Jakarta.
----------------------------------------------------------, 2010, Pendewasaan Usia Perkawinan & Hak-hak Reproduksi bagi Remaja Indonesia, Direktorat Remaja dan Perlindungan Hak-Hak Reproduksi, Jakarta.
----------------------------------------------------------, 2013, Survei Demografi dan Kesehatan Indonesia 2012, Badan Koordinasi Keluarga Berencana Nasional, Jakarta.
Departemen Kesehatan Republik Indonesia, 2008, Pedoman Operasional Pelayanan Terpadu di Puskesmas , Departemen Kesehatan Republik Indonesia, Jakarta.
Departemen Kesehatan Republik Indonesia, 2008, Pedoman Pelaksanaan Kegiatan Komunikasi, Informasi, Edukasi (KIE) Kesehatan Reproduksi untuk Petugas Kesehatan di Tingkat Pelayanan Dasar, Departemen Kesehatan Republik Indonesia, Jakarta.
Dinas Kesehatan Provinsi Jawa Tengah, 2012, Profil Kesehatan Provinsi Jawa Tengah tahun 2012, Dinas Kesehatan Provinsi Jawa Tengah, Semarang.
Direktorat Jenderal Pengendalian Penyakit dan Penyehatan Lingkungan, 2013, Laporan Perkembangan HIV-AIDS Triwulan II Tahun 2013, Kementerian Kesehatan RI, Jakarta.
Kementerian Pemberdayaan Perempuan dan Perlindungan Anak dan Badan Pusat Statistik, 2012, Profil Anak Indonesia 2012, Kementerian Pemberdayaan Perempuan dan Perlindungan
Anak (KPP&PA), Jakarta. Kumalasari, I., dkk, 2012, Kesehatan Reproduksi untuk Mahasiswa Kebidanan dan Keperawatan,
Salemba Medika, Jakarta. Kurniati, DPY. 2012, Pemenuhan Hak Reproduksi pada Ibu-Ibu PKK di Kelurahan Sesetan,
Kecamatan Denpasar Selatan, Bali. Thesis, Universitas Indonesia Jakarta. McKinley Health Center, 2009, Healthy Sexuality, University of Illinois, Urbana-Champaign. Notoatmojo, S., 2005, Metode Penelitian Kesehatan, Rineka Cipta, Jakarta. --------------------, 2012, Promosi Kesehatan dan Perilaku Kesehatan, Rineka Cipta, Jakarta. Nour, NM, 2009, Child Marriage: A Silent Health and Human Right Issue, Women’s Health in the
Developing World, Volume 2, No. 1, 2009, hlm. 51-56. Nurfadhillah, 2011, Studi Kasus Pemenuhan Hak Reproduksi Perempuan Muslim Menikah Tahun
2010, Volume 7, No 14, Januari 2011, hlm. 18-25.
Republik Indonesia, 1974, Undang-Undang No. 1 Tahun 1974 tentang Perkawinan, Lembaran Negara RI Tahun 1974, No. 1, Sekretariat Negara, Jakarta.
Republik Indonesia, 2002, Undang-Undang No. 23 Tahun 2002 tentang Perlindungan Anak, Lembaran Negara RI Tahun 2002, No. 23, Sekretariat Negara, Jakarta.
Rukmini, M.,dan R.M. Mihradi, 2006, Pegangan Ringkas Pemenuhan HAM Pendidikan dan Kesehatan di Daerah, Pusat Telaah dan Informasi Regional (PATTIRO), Jakarta.
Sugiyono, 2008, Metode Penelitian Kuantitatif Kualitatif dan R&D, Alfabeta, Bandung. United Nations International Children's Emergency Fund (UNICEF), Child Protection Information
Sheets, May 2006, diakses tanggal 29 Agustus 2013, (http://www.unicef.org/publications/files/Child_Protection_Information_Sheets.pdf)
208
Public Health Department, Faculty of Sports Science, F1 Building, 2nd
Floor, Sekaran Campus Gunungpati, Semarang City, Central Java Province, Indonesia, 50229 Phone/ Fax. +6224 8508007
BEHAVIOR OF MOTHER TODDLER TO MANAGE HEALTHY BALANCED DIET IN KARAWANG
Dewi Purnamawati1, Yosi Irawati1
1Stikes Kharisma Karawang, Indonesia
Corresponding Author: [email protected]
Abstract Introduction: Toddler with a wasting status are risk of morbidity and mortality. The management of a healthy balanced diet is very important to improving the nutritional status of children. This study aims to determine in depth how the toddler's mother behavior in management nutritious food balanced in Karawang Methods: This study uses qualitative method with in-depth interview and active participation observation technique. 10 Informants were purposively selected, which is consists of the mother and the midwives. The study was conducted in Karawang. Result: The results of in-depth interviews and observation showed more than half of the
informants had low education (no school, elementary and junior high school). Most informants have less knowledge in the management of nutritious food balanced, only a small proportion of informants who practice correctly about manage nutritious food. The Mother of toddler which status of nutrition very thin and skinny rarely make own food, they prefer to buy fast food like chicken porridge for two thousand to meet the food needs for the cheap and practical reasons. Conclusion, the behavior of the mother toddler in the management of nutritious food related with education and knowledge, therefore it is necessary efforts to increase knowledge with the health education. Key Words: Behavior, toddler, nutritional status Introduction
Growth and development in childhood greatly affect the quality in adolescence and
adulthood. One of the factors that affect the growth and development of infants is nutrition.
Nutritional status can improve the health of individuals especially the good nutritional status, but
malnutrition in the first 1,000 days of life, can affect in whole cycle of human life such as physical
development and cognitive development like degradation of intelligence, productivity and dexterity
to think and finally can affect to immune system and contribute to increased morbidity and mortality
(Soenardi, 2000; MOH, 2014).
Basic Health Research, 2013, showed that the nutritional skinny still one nutritional problem
in Indonesia in addition to malnutrition and very short. In 2013 the percentage of underweight
malnutrition in Indonesia amounted to 12.1%. Although this figure decreased when compared to
2007 by 13.6% and by 13.3% in 2010, but still happens disparities inter-provincial who need
handling according with specific problems in that prone area (Riskesdas 2010).
Nutritional problems are related to food availability and accessibility of population. The low
food accessibility (the ability to meet of household food needs and its members) threatened
decrease in food consumption diverse, nutritionally-balanced, and safe at the household level
(BAPPENAS, 2011). This will certainly have an impact on the pattern of food consumption in the
Public Health Department, Faculty of Sports Science, F1 Building, 2nd
Floor, Sekaran Campus Gunungpati, Semarang City, Central Java Province, Indonesia, 50229 Phone/ Fax. +6224 8508007
209
household. Hadisaputrai (2009) showed a significant association between the family income to the
nutritional status of children.
In addition to the family's ability to meet the needs of food, nutritional problems are also
associated with the mother's ability to provide food in the family. Maternal behavior in the
management of a nutritious food balanced greatly affect the nutritional status of children due to the
strong dependency between the toddler's mother. This behavior including how to choose food
ingredients, processing methods and habits are wrong in feeding infants. Prakoso (2012), showed
a significant association between mother's behavior toward nutritional status of children and
Mardiana (2006) also say that there is a significant relationship between maternal behavior of the
nutritional status of children.
In general, nutritional balanced is the daily consumption of food containing the nutrients in
the type and amount that fits the needs of each person or age. Consumption of food should pay
attention to the principle of diversity of the four pillars of food, like hygienic behavior, physical
activity and maintain a normal weight. Nutritional balanced should include components of sufficient
in quantity, sufficient in quality and contain a variety of nutrients such as energy, protein, vitamins
and minerals, that the body needs to grow especially to children. Beside that nutritional balanced
can also maintain health and to perform functions of daily life activities (for all age groups and
physiological), and storing nutrients to meet the body's needs when consumption of foods do not
contain the nutrients needed. In other words, balanced nutrition is a series of attempts to balance
the nutrients that in and out with monitored the body weight regularly.
In addition to the behavior of mother to manage healthy food balanced, parents' knowledge
about nutrition also affecting the management of the food in the family. Parents, especially mother
should possess knowledge about nutrition balanced, because the nutritional disorders in
household are not only found in families with low income but in the family with enough income too,
this situation shows that lack of knowledge of nutrition for the health of the body can cause nutrition
problem in toddler. Mardiana (2006) showed that there was a significant relationship between
knowledge of mothers with nutritional status of toddlers.
Most of the people also do not understand the importance of nutrition during the first two
years and hygiene behavior. Riskesdas 2010 also showed that 45% of households in Indonesia
are still using water that is not clean. This behavior associated with diarrheal diseases, which
further contribute to malnutrition (UNICEF, 2012). Based on preliminary studies by the author on
one of the village in Karawang district showed that 7 of 10 of mothers said that they provide food to
their children in accordance with the food needs without regard to the diversity of food, hygiene
and increase of child weight. beside that, this study also showed that most mothers would rather
buy a ready meals compared with their own food processing. Hence, researchers want to know in
depth how the mother toddler's behavior in the management of nutritionally balanced food in
Karawang.
210
Public Health Department, Faculty of Sports Science, F1 Building, 2nd
Floor, Sekaran Campus Gunungpati, Semarang City, Central Java Province, Indonesia, 50229 Phone/ Fax. +6224 8508007
This study aims to determine in depth how the toddler's mother behavior in management
nutritious food balanced in Karawang.
Method
This study uses qualitative research methods with case study design (case study). This
research was conducted in the village of Tanjung Pura in Karawang district, because there is a
toddler with malnutrition in this village.
Data were collected by in-depth interviews and active observations partisipation of the
mother's behavior in the management nutritious food for toddler. In-depth interviews were
conducted to dig deeper into the mother's perceptions and knowledge about how behavior of
mother in management nutritious food for toddler. Informants in this study selected purposively,
there are 10 mothers consisting of 2 mothers from toddlers with wasting nutritional status, 2
mothers from toddler with nutritional status skinny, 2 mothers from toddler with normal nutritional
status and 2 mothers from toddler with fatty nutritional status. In addition, in this study the
researcher also uses key informant from provider, one is a midwives and the other one is
nutritionist. In-depth interviews conducted for 1-2 hours either with informants and key informants.
Active participant observation conducted with informants in accordance with the daily activities of
informants in the management of food for toddler.
Result of in-depth interviews and active observation participation, summarized in a format
that is made according to the researcher's perspective. Processing and analysis data in qualitative
research carried out simultaneously. Data is processing descriptively using contents analysis. The
results of the interview are grouped with the matrix, subsequently reported and presented
descriptively. The result of active observation participation was also presented descriptively related
with the activities performed by informants in the management of food. Triangulation data and
methods are performed to maintain the validity of research results.
Results and Discussion
Description of Research Place
Place of research is located in Karawang district, precisely in the village of Tanjung Pura.
Most of the inhabitants work as industrial workers and most areas of this village are rice fields,
yards and settlements. There is one case of malnutrition in this village and we also can found
toddlers with varying nutritional status in this village. The picture of children under five age with
various nutritional status can be seen in figure 1.

Public Health Department, Faculty of Sports Science, F1 Building, 2nd
Floor, Sekaran Campus Gunungpati, Semarang City, Central Java Province, Indonesia, 50229 Phone/ Fax. +6224 8508007
211
Figure 1. Children under five age with wasting, skinny and normal status
In-depth interviews conducted on 8 informants and 2 key informants. The average of the
informants age was 30.7 years, the youngest is 22 years old and the oldest is 39 years old. Half of
the informants had low education, which is junior high school and elementary school, another small
part uneducated and the other small part is high school educated. Average family income
informants also vary from 800 thousand rupiah to 2.6 million rupiah and all informants were
housewives. Almost all the informants did not give exclusive breastfeeding for the first six months,
only one informant who exclusively breastfeed their children. Information about sociodemographic
informants can be seen in Table 1 and 2. Key Informants consist of midwifes and nutritionist with
education high level.
Table 1. Sociodemographic informants
Number Informant Age Education Occupation Income Exclusive
breastfeeding
1 SS 22 Senior High School Housewife 1.200.000 No 2 AR 25 Uneducated Housewife 800.000 No 3 ST 31 Uneducated Housewife 1.400.000 No 4 AN 34 Elementary school Housewife 1.600.000 No 5 AL 39 Junior High School Housewife 2.600.000 No 6 FI 37 Junior High School Housewife 1.600.000 No 7 FA 24 Senior High School Housewife 2.000.000 No 8 AD 34 Junior High School Housewife 2.600.000 Yes
Table 2. Characteristic of key informants
Number Age (Years) Education Profesion Experiences
1 34 Bachelor Midwives 13 years
2 34 Diploma Nutritionist 13 years
Wasting Status Skinny Status Normal Status
36 Months, weight 7,3Kg/77cm 39 Months, weight 9,1Kg/83cm 46 Months, weight 14,5Kg/96cm
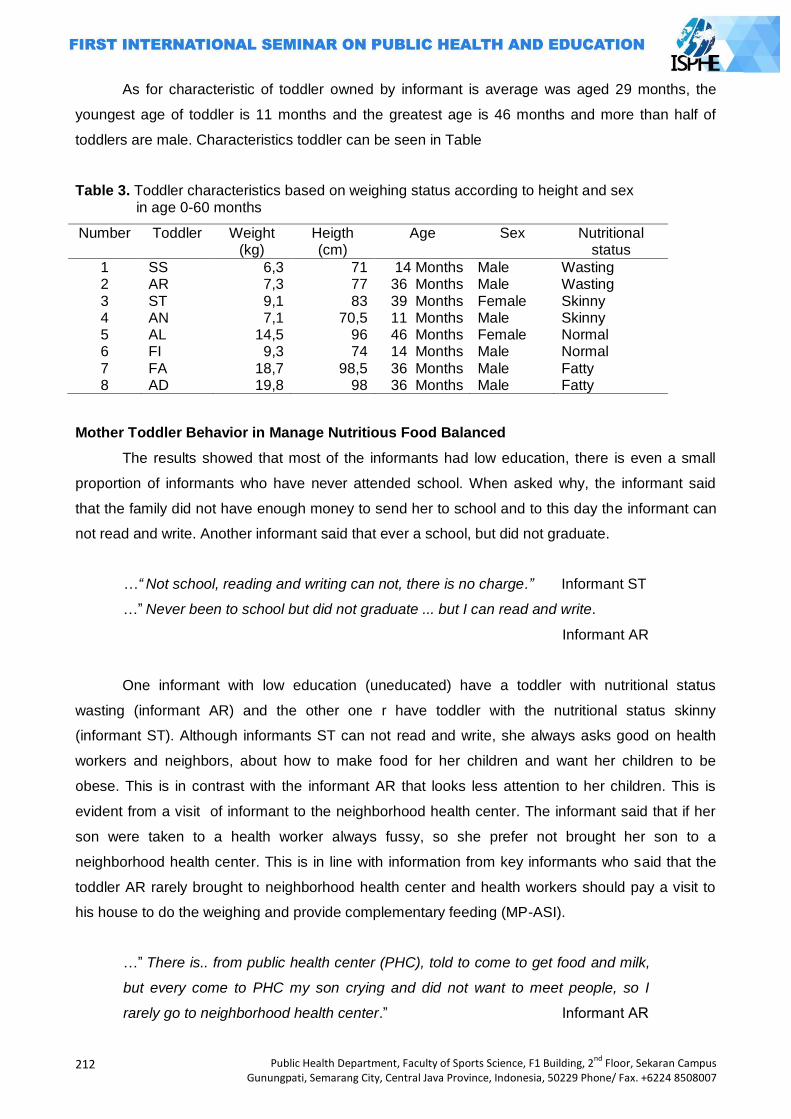
212
Public Health Department, Faculty of Sports Science, F1 Building, 2nd
Floor, Sekaran Campus Gunungpati, Semarang City, Central Java Province, Indonesia, 50229 Phone/ Fax. +6224 8508007
As for characteristic of toddler owned by informant is average was aged 29 months, the
youngest age of toddler is 11 months and the greatest age is 46 months and more than half of
toddlers are male. Characteristics toddler can be seen in Table
Table 3. Toddler characteristics based on weighing status according to height and sex in age 0-60 months
Mother Toddler Behavior in Manage Nutritious Food Balanced
The results showed that most of the informants had low education, there is even a small
proportion of informants who have never attended school. When asked why, the informant said
that the family did not have enough money to send her to school and to this day the informant can
not read and write. Another informant said that ever a school, but did not graduate.
…“ Not school, reading and writing can not, there is no charge.” Informant ST
…‖ Never been to school but did not graduate ... but I can read and write.
Informant AR
One informant with low education (uneducated) have a toddler with nutritional status
wasting (informant AR) and the other one r have toddler with the nutritional status skinny
(informant ST). Although informants ST can not read and write, she always asks good on health
workers and neighbors, about how to make food for her children and want her children to be
obese. This is in contrast with the informant AR that looks less attention to her children. This is
evident from a visit of informant to the neighborhood health center. The informant said that if her
son were taken to a health worker always fussy, so she prefer not brought her son to a
neighborhood health center. This is in line with information from key informants who said that the
toddler AR rarely brought to neighborhood health center and health workers should pay a visit to
his house to do the weighing and provide complementary feeding (MP-ASI).
…‖ There is.. from public health center (PHC), told to come to get food and milk,
but every come to PHC my son crying and did not want to meet people, so I
rarely go to neighborhood health center.‖ Informant AR
Number Toddler Weight (kg)
Heigth (cm)
Age Sex Nutritional status
1 SS 6,3 71 14 Months Male Wasting 2 AR 7,3 77 36 Months Male Wasting 3 ST 9,1 83 39 Months Female Skinny 4 AN 7,1 70,5 11 Months Male Skinny 5 AL 14,5 96 46 Months Female Normal 6 FI 9,3 74 14 Months Male Normal 7 FA 18,7 98,5 36 Months Male Fatty 8 AD 19,8 98 36 Months Male Fatty

Public Health Department, Faculty of Sports Science, F1 Building, 2nd
Floor, Sekaran Campus Gunungpati, Semarang City, Central Java Province, Indonesia, 50229 Phone/ Fax. +6224 8508007
213
…‖ Children with wasting nutritional status is reported to the PHC for weighing
and measure again every Wednesday and given MP ASI and given counseling
about nutrition, but toddlers AR seldom come, whereas nutritional status is
wasting. Health workers have 3 times to come to his house, but AR still not
brought to neighborhood health center . The reason her fussy, but may be
embarrassed, because her son is very skinny, what a pity. ― Key Informant
Most of the informants had family incomes below the regional minimum wage, and AR
informant is informant with the lowest incomes. Her husband only works if there is a contract
(construction worker), otherwise it does not work. So informant AR rarely prepare dishes for her
family. Nevertheless, most of the other informants with family incomes below the minimum wage
say that the family income sufficient for the needs of daily meals. This was confirmed by key
informants said that nutritious food need not be expensive.
…‖ Only my husband who work, if there was also work contract if no contract is
not working (construction worker). If there is a money we can buy porridge, but if
we dont have the money we rarely eat.‖ Informant AR
…‖ Thank God is enough to buy food, such as fried chicken, because my son
love the fried chicken.‖ Informant FA
…‖ Nutritious food does not have to be expensive, I like to give counseling to
people in neighborhood health center.‖ Key Informant
Half of the informants have poor knowledge about the management of a balanced nutritious
diet, but the other half of the informants have a good knowledge. It is seen from how informants
can mention it right about the meaning of a nutritious food according to the informants perception,
nutritious food types, processing methods and the benefits of nutritious foods. Half of the
informants had a wrong perception, they did not even know about nutritious food, nutritious food
types and processing methods and benefit from nutritious food. One informant said that the
benefits of nutritious foods so that children are not fussy.
…‖ Don’t know.‖ Informant AR
…‖ Nutritious food… ya food that diverse.‖ Informant SS
…‖ balanced nutrition such as carbohydrates, proteins, vitamins, namely rice,
side dishes, vegetables, fruits.‖ Informant FA
…‖ Benefits of food ya let children not fussy.” Informant ST
In giving food to children, only a small proportion of the informants who practiced correctly
how food processing is. This is usually done informant in preparing food for her family. While most

214
Public Health Department, Faculty of Sports Science, F1 Building, 2nd
Floor, Sekaran Campus Gunungpati, Semarang City, Central Java Province, Indonesia, 50229 Phone/ Fax. +6224 8508007
of the others practiced improperly, such as cutting the vegetables first and wash the vegetables in
containers with water is not flowing and even they also add a flavor into their cuisine. In addition,
the observation of active participation also shows that there is still informant who uses salt that
does not contain iodine or commonly known as salt koy. Half of the informants who have children
with nutritional status is wasting and skinny rarely make the dishes themselves, they prefer to buy
chicken porridge every morning and afternoon who is sell in front of their home.
…‖ Before the cooked vegetables… yes I wash first, I usually wash in a basin,
then new cut and inserted after the boiling water, then added spices and salt.‖
Informant AR
When investigators went to the residence of the informant to see how the management of a
nutritious food, half of the informants did not provide food, they only give milk and porridge which
was purchased in the morning and afternoon. Even informants tend to not pay attention to the
needs of their children eat. It is seen from one of the informants said that children prefer to eat at
home in place of its neighbors, so that informants rarely prepare food. Informant with a wasting
nutritional status even still breastfeeding, whereas the child is aged 3 years. more than half of the
informants say never make a varied food for children, there is even one children from informant
AD, who felt nausea and vomiting when eating and her son would rather drink milk than eat
…‖ My son rarely eat, so I rarely make dishes.” Informant AN
…‖ breakfast yet still given breast milk alone .. because still out.‖ Informant AR
…‖ I rarely cook, is better to buy porridge which is passing later.‖ Informant AR
…” I never used to give food such as fish, fried chicken but frequent vomiting and
now just want milk alone even get to spend 2-3 days in milk 800 gr.‖
Informant AD
Balanced nutrition for toddlers is the daily consumption of food containing the nutrients in
the type and amount (serving) that fit the needs of toddlers according to age and activity.
Consumption of these foods should pay attention to the principle of diversity of food, hygienic
behavior, physical activity and maintain a normal weight.
This study shows that the behavior of informants in the management of nutritious food
balanced for toddlers still lacking. The results showed that most mothers do not ever pay attention
to balanced nutrition for their toddler, this can be seen from the in-depth interview and active
participation observation which shows that most of informants does not pay attention to the type of
food, hygienic behavior, the child's activity even weight gain. Most of them prefer to buy ready
meals compared to prepare they own food
Public Health Department, Faculty of Sports Science, F1 Building, 2nd
Floor, Sekaran Campus Gunungpati, Semarang City, Central Java Province, Indonesia, 50229 Phone/ Fax. +6224 8508007
215
The behavior is essentially an activity or human activity is influenced by heredity and
environment (Notoatmodjo, 1997). Furthermore, Notoadmodjo (1997) suggest that health behavior
is a behavior associated with individual response to illness and disease. One of the individual
response-related illness and disease in order to improve and health care is the provision of
nutritious food. Prakoso (2012), Munthofiah (2008) and Mardiana (2006) indicates that there is a
significant relationship between maternal behavior with the nutritional status of children. Mothers
with poor behavior had the odds risk 3 times for having children under five with less nutitional
status than a mother who has a good behavior (Munthofiah, 2008).
According to Green (1980) in Notoatmodjo (1997), the health status of the person's
behavior is influenced by predisposing factor, enabling factor and reinforsing factor such as
knowledge, education, age, family income, the support of health professionals and others. The
result of this study shows that all informants who have children with wasting and skinny nutritional
status, have less knowledge. Informant with skinny nutritional status saying that the benefit of food
is make a children are not fussy. Rahcmawati and Panunggal (2013), shows that there is a
significant relationship between maternal knowledge with behavior of mother in feeding. The same
thing was saying by Munthofiah (2008) that showed a significant relationship between maternal
knowledge with child nutritional status.
In addition to knowledge, maternal education and family income also affects the nutritional
status of children. This study shows that almost all of toddlers with wasting and skinny nutritional
status had mothers with low education, even there is informant who did not school and there is
only a small proportion of informant with higher education (senior high school). The results also
showed that the informant who have children with nutritional status wasting have very low family
income. Sarah (2008) showed a significant association between maternal education and family
income with BB/TB in children under five. Further research of Setiati (2006) shows that there is a
significant relationship between parenting knowledge and adequacy of protein in children under
five from poor families acceptance of direct cash assistance. This shows that the income of the
poor families affect how the adequacy of protein in children under five.
Closing
Almost all of the toddlers with nutritional status wasting and skinny having a mother with low
education and lack of knowledge in the management of nutritious food balanced and not gain
exclusive breastfeeding in the first 6 months of his birth. Maternal behavior in the management of
nutritious food for children under five is still very poor. Only a small proportion of mother‘s who are
able to mention and to practice correctly, how to manage nutritious food balanced. Lack of
knowledge and behavior of mother‘s seen from the habit of mother in preparing food for toddler.
Moreover, the mother's habit of buying prepared foods such as chicken porridge (only porridge and
soy sauce) make nutritional adequacy in children are not being met.
216
Public Health Department, Faculty of Sports Science, F1 Building, 2nd
Floor, Sekaran Campus Gunungpati, Semarang City, Central Java Province, Indonesia, 50229 Phone/ Fax. +6224 8508007
Mothers have an important role in the management of nutritious food balanced for toddlers.
Therefore we need an effort to increase knowledge of mothers toddler and increase awareness of
the importance nutritious food for toddlers through health education with educational materials in a
way that can be understood by the mother, given that most of informants have low levels of
education.
In addition, this study also showed that a half of mothers have bad habits in prepare food
for toddlers. Therefore it is necessary needed not only give extension activities, but should also
include demonstration activities of nutritionally balanced food processing according to the needs of
the family.
Reference BAPPENAS, 2011. Rencana Aksi Nasional Pangan dan Gizi 2011-2016.
http://www.extranet.who.int Hidayati, Rina Nur. 2011. Hubungan Tugas Kesehatan Keluarga, Karakteristik Keluarga dan Anak
dengan Status Gizi Balita di Puskesmas Pancoran Mas Depok. Tesis. Fakultas ilmu keperawatan universitas indonesia. Depok http://www.lib.ui.ac,id
Hadisaputrai, Sugeng. 2009. Analisis Determinan Status Gizi Balita di Rsud Majalaya Kabupaten Bandung 2009. http://id.scribd.com/
Kementrian Kesehatan RI, 2010. Riset Kesehatan Dasar 2010. http://www.depkes.go.id _____________________, 2013. Riset Kesehatan Dasar 2013. http://www.depkes.go.id Notoadmodjo, Soekidjo (1997). Ilmu Kesehatan Masyarakat‘, Rineka Cipta, Jakarta Mardiana (2006). Hubungan Perilaku Gizi Ibu dengan Status Gizi Balita di Puskesmas Tanjung
Beringin Kecamatan Hinai Kabupaten Langkat Tahun 2005. Skripsi. Fakultas Kesehatan Masryarakat Universitas Sumatra Utara. http://www.repository.usu.ac.id
Munthofiah, Siti. 2008. Hubungan Antara Pengetahuan, Sikap, dan Perilaku Ibu Dengan Status Gizi Anak Balita. Thesis. Program Magister Kedokteran Keluarga. Program Pascasarjana, Universitas Sebelas Maret, Surakarta 2008. http://www.eprints.uns.ac.id
Prakoso, Indra Bakti. 2012. Hubungan Perilaku Ibu Dalam Memenuhi Kebutuhan Gizi Dan Tingkat Konsumsi Energi Dengan Status Gizi Balita Di Desa Cibeusi Kecamatan Jatinangor Kabupaten Sumedang. Student e-Journals volume 1 No.1 http://www.jurnal.unpad.ac.id
Rachmawati, Zuris Nuraida dan Panunggal, Binar. 2013. Hubungan Pengetahuan dan Sikap Ibu dengan Perilaku Ibu Dalam Pemberian Makanan Anak Usia 12-24 Bulan. Program Studi
Ilmu Gizi Fakultas Kedokteran Universitas Diponegoro Semarang. http://www.eprints.undip.ac.id
Rokhana, Ninik Asri. 2005. Hubungan antara Pendapatan Keluarga dan Pola Asuh Gizi dengan Status Gizi Anak Balita di Betokan Demak. http://www.lib.unnes.ac.id
Sarah, Mia. 2008. Hubungan Tingkat Sosial Ekonomi Dan Pola Asuh Dengan Status Gizi Anak Balita Di Wilayah Kerja Puskesmas Pantai Cermin Kecamatan Tanjung Pura Kabupaten Langkat Tahun 2008. Skripsi. Fakultas Kesehatam Masyarakat Universitas Sumatera Utara. 2008. http://www.repository.usu.ac.id
Setiati, Ruruh. 2006. Hubungan Pengetahuan Sikap Dan Praktek Pola Asuh Ibu Dengan Status Gizi Anak Balita Pada Keluarga Miskin Penerima Dblt Desa Kaligono Kecamatan Kaligesing Kabupaten Purworejo. Tesis. Fakultas Kesehatan Masyarakat. Universitas Diponogoro. http://www.eprints.undip.ac.id
Soenardi, Tuti. 2000. Variasi Makanan Balita, Kiat Atasi Masalah Makan Pada Anak. PT. Gramedia Pustaka Utama. Jakarta
UNICEF Indonesia, 2012. Ringkasan Kajian Gizi Ibu dan Anak. http://www.unicef.org
Public Health Department, Faculty of Sports Science, F1 Building, 2nd
Floor, Sekaran Campus Gunungpati, Semarang City, Central Java Province, Indonesia, 50229 Phone/ Fax. +6224 8508007
217
TRADITIONAL BIRTH ATTENDANT (TBA) ON MATERNAL CARE
Nurul Aeni
Research and Development Office, Distric of Pati, Indonesia
Corresponding Author: [email protected]
Abstract Introduction: Community in Pakem Village can‘t leave culture and tradition in maternal care. An example of traditional maternal care is utilization of Traditional Birth Attendant (TBA). Research objectives were: (1) to describe TBA‘s role on maternal care; (2) to reveal the reason of TBA utilization in Pakem village society. Methods: Research used qualitative and descriptive methods. Subjects were mother who had 3 month baby and used TBA during maternal period, village midwife, and TBA who help mother on maternal care. Traditional Birth Attendant had significant role on maternal care, started on pregnancy until postnatal. (1) The roles of TBA during pregnancy were: guiding Mitoni (traditional ceremony) and doing Ungkrak (massaging mother‘s womb in order to ensure baby on right position), and giving Sawan (protection from spirit interference). During delivery: helping delivery at home or accompanying mother to do delivery in health service. During postnatal: caring mother and baby for 25-35 days and doing circumcision to girl baby (2) The reason of TBA utilization were: It was ordered by parents and followed tradition which was applied by community, distance of maternal health service was far, fee of maternal care by TBA was cheaper than it by midwife or other maternal health services, and TBA gave prominent and complete care. Key Words: Maternal care, role, traditional birth attendant
Introduction
Decreasing Maternal Mortality Rate (MMR) up to 2/3 period 1990 until 2015 is one of
commitments of almost all countries in this world which is mentioned as Millennium Development
Goals (MDGs) (Abouzhar and Wardlaw, 2001). That is bigger challenge to Indonesia because it‘s
MMR tend to increase by year. Based on Health and Demography Survey in 2007, Indonesia‘s
MMR was 228 per 100.000 live births. However, Health and Demography Survey in 2012
estimated that Indonesia‘s MMR increased becoming 359 per 100.000 live births.
The increasing of MMR indicates that health improvement programs, which initiates by
government run less effectively. Tumanggor (2010) noted that the biggest problem on arranging
health improvement programs was it was likely focused on bio-medic aspect. In facts, many health
issues could not be finished by medical science using bio-medic approach only. It needed
collaboration among different approaches, especially that was related to social and culture
Culture is assumed having significant influence to community‘s way of life on doing health
behavior. However, it also assumed abstract concept, so that it understand difficultly (Bowden dan
Manning, 2008). Culture is defined as normative patrons include the way of thinking, sense, and
behavior that can be learned by member of society (Soekanto, 1995). Culture goes along way from
a generation to the next one by socialization and internalization of value that happens in family and
other social environments. Therefore, culture becomes one of elements of individual personality
and determines interaction between human and its environment (Koentjoroningrat, 1990)
218
Public Health Department, Faculty of Sports Science, F1 Building, 2nd
Floor, Sekaran Campus Gunungpati, Semarang City, Central Java Province, Indonesia, 50229 Phone/ Fax. +6224 8508007
Culture determination on human life is character of rural society. Soekanto (1995) described
that culture and tradition that was experienced by some society tended to stable and change
difficultly because of conformity and familiarity interaction among their member. Rural society was
likely difficult to distinguish between rational and irrational behavior, so that health practices rooted
from mystical and religious belief (Tumanggor, 2010).
Those health practices was influenced by culture figures called soothsayer (dukun). Suparlan
(cited by Anggorodi, 2009) mentioned the characters of soothsayer were: (1) common person; (2)
having lower education, commonly illiterate, (3) main purpose of being soothsayer was the calling
or being dreaming; (4) having another side job (farmer or farming labor); (5) being paid relatively
based on family prosperity;(5) being honored in that society / community
There are some kinds of soothsayers with different abilities. Soothsayer with ability in helping
delivery called traditional birth attendant (dukun bayi). Based on Health department (cited by
Mratihatini, 2008), Traditional Birth Attendant (TBA) was community members, commonly was a
women who was believed by this community and had skill to help delivery traditionally. She got that
skill generatively, learned by practice or other ways through following course was held by health
services. TBAs are a common in many societies. They are called using different names, but they
have similar roles.
Utilization of TBAs is common in rural society in Pati Regency. It can be find in Health
community center (Puskesmas) of Sukolilo II. That was proved by data from health profile of Pati
Regency (2012) showed that coverage of delivery was helped by skilled birth attendants was 90
percent. That percentage was lower than that of Pati Regency (93,40 percent). Interviewing with
midwife coordinator concluded that community‘s belief toward TBAs was high, especially in a
village, named Pakem. It was supported by interview with village midwife who mentioned that
pregnant mothers in Pakem had high awareness to check their pregnancy regularly in health
services. However, the tradition to using TBA in maternal care, even helping pregnancy was still
run.
That situation interfere local government effort to improve women health quality by providing
proper delivery service. In addition it also potentially increases the risks of maternal mortality.
Based on those arguments, The purpose of this research are: (1) To describe role of TBAs on
maternal care; and (2) to reveal the reasons of TBAs utilization in Pakem Village, Pati Regency
Methods
This Research used qualitative approach. The essence of qualitative research is observing
people in their environment, interacting with them, and trying to understand language and their
perceptions of environment (Nasution, 1996). It was conducted in Pakem Village, part of Sukolilo
Sibdistrict, Pati Regency. The chosen of Pakem based on interviewing to midwife coordinator of
community health center mentioned that the utilization of TBAs in Pakem was stronger than that in
others. Pakem have 5 hamlets, which one of them is furthest, namely Ngandong. There are two
Public Health Department, Faculty of Sports Science, F1 Building, 2nd
Floor, Sekaran Campus Gunungpati, Semarang City, Central Java Province, Indonesia, 50229 Phone/ Fax. +6224 8508007
219
TBAs in Ngandong, Mbah Bin (65 years olds) and Mbah Darsi (60 years old). Both of them service
society in that hamlet, even out from there.
This research used primary and secondary data. Primary data were collected by observation
and in dept interview. Dept interviews were conducted to mother who had 0-3 month baby, village
midwife, and TBAs. Secondary data were obtained from village midwife and relevant data. Data
were analyzed using descriptive method
Results and Discussion
Interview to both Traditional Birth Attendants (TBAs) told that they have been running that
traditional service for more than 20 years. The skill in helping delivery was obtained generatively
from their mother or grandmother. They had followed and observed previous TBAs working before
helping delivery by themselves. First, they had to run special ritual.
“I learned helping delivery from my grandmother. My mom was died when I was a child. I used to follow my grandmother helping delivery and see her way to do that. After my grandmother was not be able to help delivery, I ordered to do that job. Before that, I did fast twice a week every Monday and Thursday during 40 weeks. Then, in the last week, I cooked rice with mixed vegetables as the expression of gratitude to God.” ‖(interview with Mbah Darsi, 25/05/2014)
Both of TBAs said that they have been followed TBAs course, which was held by local health
service. During that course they got knowledge on caring infant, beginning signs of delivery,
alerting the complication sign, so they had to bring pregnant mother to health service. They also
suggested to cooperate to village midwife.
“I had been followed TBA’s course in Prawoto, At that time, I was acquainted with Ms Titik (midwife).She was the one who told me about first until end signs of delivery. She also told me to bring pregnant mother to pregnancy service if the signs were complete”. (interview with Mbah Bin, 13/05/2014)
That statement indicated cooperation between TBAs and midwife. However, that was
neglected by midwife. She said that one of TBAs refused the existence of midwife and announced
to community that she was still able to help delivery, so that they didn‘t need to do delivery in
midwife or delivery service. That conflict caused ineffective communication between both of them.
It was supported to midwife condition, which didn‘t stay permanently in Pakem.
That result was supported by previous research (Budiyono, et al, 2012). They conducted
research in Health Community Center of Mranggen and found that TBAs still helped delivery. the
TBAs also couldn‘t cooperate with midwife because they only had that job to earn money. They
were afraid that the existence of midwife could be threatened their job. Anggorodi (2009)
mentioned that cooperation between midwife and TBAs was the best solution to decrease maternal
mortality, especially in the society, which had lack of health access. In addition, community also
220
Public Health Department, Faculty of Sports Science, F1 Building, 2nd
Floor, Sekaran Campus Gunungpati, Semarang City, Central Java Province, Indonesia, 50229 Phone/ Fax. +6224 8508007
developed high belief that TBAs were able to help delivery as well as midwife. cooperation
between both delivery attendants would increase TBA‘s responsibility to keep maternal health in
that area.
The role of tbas on maternal care
For Pakem society, TBAs were public figures who had significant role in maternal care.
Based on interview to village midwife and mother informants concluded during pregnancy to
postnatal periods, mothers trusted their maternal care to TBAs. That supported previous research
by Aeni (2013) proved that society in Giling and Soneyan villages believed that utilization of TBAs
during maternal period was a must, besides maternal care by health professional.
Pakem society started maternal care by TBAs on pregnancy until postnatal period. In detail,
the role of TBAs were:
Pregnacy period
During pregnancy period, there were not all pregnant mothers using TBA‘s. in common, they
used TBAs after seven month pregnancy. The first role of TBAs was guiding Mitoni. Mitoni was
ritual was done when pregnancy was seven months. This ritual was part of Javanese culture, so
that it could be find in other part of Java Island. This ritual ran only for first child in family. It aimed
to wish to God if mother and infant were blessed with safety until delivery process (Safira, 2013)
Mitoni consisted of several processions, which were guided by culture figure. Pakem society
trusted that duty to TBAs, whom was wanted to help delivery. The main role of TBAs was doing
bathing ceremony to pregnant mother and her spouse.
“I usually contact by family whom will run mitoni. They said: Mbah, next day, we will run mitoni”. People in here used to knowing the preparation for conducting mitoni, so that I just remember them the missing things and then I will lead bathing ceremony”. (interview with Mbah Darsi, 25/5/2014)
After entering seven month pregnancy, maternal care by TBAs continued to massaging
called Ungkrak.Ungkrak was massage was done by TBAs in order to make sure that fetus was on
ready born position, so that delivery could ran safely.
“Pregnant mother used to feeling uncomfortable and sensing pain around their womb. If they were massaged, they would feel comfortable. This massage was similar to common massage, in addition, we only touched their womb, and if baby were on wrong position, we would corrected that position”. (interview with Mbah Bin 13/5/2014)
Commonly, pregnant mother had Ungkrak when their pregnancy was seven months until
delivery period. Interview with mother informants founded that all of them had Ungkrak during
pregnancy. Some of them believed that Ungkrak was a must during pregnancy in order to have
safe delivery.
Public Health Department, Faculty of Sports Science, F1 Building, 2nd
Floor, Sekaran Campus Gunungpati, Semarang City, Central Java Province, Indonesia, 50229 Phone/ Fax. +6224 8508007
221
“I felt uncomfortable if didn’t do ungkrak. After having ungkrak, I felt better. I cant do this in midwife. only TBA can do this” (interview dengan Ibu Dian (25 tahun), 22/05/2014)
Beside guiding Mitoni and doing Ungkrak, TBAs in Pakem also was able to help pregnant
mother from spirit interference, called Sawanan. Sawanan could be recognized if pregnant mother
severed pain especially in her womb and it could be healed by common medicine. Sawanan
happened when pregnant mother disobeyed taboo or consumed particular foods, which were
assumed harmful for baby. Sometime, pregnant mother or her family made an amulet by
themselves. But some of them asked TBAs making it.
“I have ever eaten mangos and suddenly I got stomachache. I swept my stomach with cajuput oil, but it didn’t work well. Then, my husband came to Mbah Darsi asking for sawanan, After sweeping sawanan to my stomach and chest. I didn’t get pain anymore. (interview with Ibu Kun, 18/05/2014)
Delivery period
TBA informant said that they had sense to know that a delivery would be happened. It was
revealed by interviewing with one of TBAs.
“if there would be a delivery around here, my palm of hand become warm or twitched softly. I just whispered’ maybe that mother would have delivery’. as soon as, a man came and said that his wife would get delivery”. (interview with Mbah Darsi, 20/05/2014)
The common habits of Pakem society was they asked TBA‘s help before going to midwife or
delivery service. Pakem midwife said that sometimes didn‘t know that a delivery had already
happened. She would be told several days after pregnancy. Interview with mother informants
concluded that they didn‘t want spent much time in midwife place or delivery service, so that they
asked TBAs to check their womb and gave prediction about time of delivery. During that time, her
husband would look for vehicles (car) to bring pregnant mother to delivery service. In delivery
service, commonly was community health center, TBAs always been beside pregnant mother and
gave assistance if mother needed it, while sweeping mother‘s womb and massaging her legs to
give comfortable feeling.
Mbah dukun went with me to Community Health Center. She also were in a same room with me. She waited me and swept my womb. Midwifes sometime checked my condition for some minutes, if I had been ready for delivery, they wouldn’t have come. If mbah dukun were there, I felt comfortable). (interview dengan Ibu Asrofah, 10/05/2014)
This research found two mother informants who had delivery at home. Both of them said that
they didn‘t have much time to go to delivery service. Both deliveries were helped by TBAs. There
were more significant roles if TBAs helped delivery at home. Before helping delivery, TBAs asked
222
Public Health Department, Faculty of Sports Science, F1 Building, 2nd
Floor, Sekaran Campus Gunungpati, Semarang City, Central Java Province, Indonesia, 50229 Phone/ Fax. +6224 8508007
to other family members especially women to prepare everything needed to help delivery, such as
clean water and room for delivery place. Pakem society believed that when a delivery happened at
home, they had to open all covered things. It aimed mother could deliver soon. Sometimes, if
mother couldn‘t deliver soon, one of her family would ask culture figure prayed water, then it was
drunk to pregnant mother. TBAs helped delivery at home using traditional and simple equipments.
For examples, they used razor blade to cut placenta and applied turmeric to stop bleeding.
Postnatal period
The most significant roles of TBAs were in postnatal period. All of mother informants said the
utilized TBA during postnatal period. The role of TBAs in postnatal period was started several
hours after delivery. TBA cleaned placenta and prepared it for being buried. After that procession,
TBA lead Krayan, thank to God ceremony.
The next responsibility was caring mother and baby for next 40 days. First phase was tenth-
twelfth day. During those days, maternal care did intensively every morning and evening. One of
TBAs, Mbah Darsi slept in mother‘s house in the first until second day after delivery.
“I used to sleeping in mother’s house for two days. I sleep in same bed with mother and her baby, below them. I do that voluntary. In the middle of night, when mother asks help, I do that. If the baby pees, I will change his/her diaper”. (interview with Mbah Darsi) On fifth day (Sepasar), TBA did Walik Sengko, it was massage for mother in order to recover
her muscle after having delivery. Intensive care ended in thirteenth day. From that day maternal
care would be done twice a week, on Monday and Thursday. During postnatal period, TBA
massaged baby and mother. She would applied bobok (rice powder) and massaged all part of
mother‘s body except womb, especially for mother had Caesar surgery, because she afraid mother
would bleed. On twenty fifth or thirty fifth day, TBA would do special massage, named Walik
Dadah. This massage aimed to place womb in right position and after this, mother allowed to sleep
in sideway.
Other maternal care was bathing mother and baby. Bathing mother was done before bathing
baby. After bathing mother, TBA would helped mother twining long shawl in her lower body. There
was a difference between one parity mothers and more than one parity mothers. More than one
parity mothers preferred doing bathing and wearing shawl by themselves. They said they had done
those before, so that they didn‘t need help to do those. During maternal care, TBAs would give
mother uyup-uyup, That was traditional herbal drink was made from seven kind of plants. TBAs
said that drink could be able to recover mother‘s power.
Observation toward baby caring showed that TBAs prepared all things by herself. Baby
caring include bathing and healing wound on baby‘s navel. During baby caring, TBA would check
baby‘s condition and gave advice to mother if she found improper condition. For example, if TBA
found that baby‘s skin was getting and getting wrinkle, she proposed mother to add a piece of
roasted banana‘s flow to bath water and asked mother to consume the rest of it. It was believed
Public Health Department, Faculty of Sports Science, F1 Building, 2nd
Floor, Sekaran Campus Gunungpati, Semarang City, Central Java Province, Indonesia, 50229 Phone/ Fax. +6224 8508007
223
be able to recover baby‘s skin. After baby bathing, TBA would put Jarak cina leaf on baby‘s
stomach in order to protect it from illness. Sometime, TBA asked to wash baby‘s clothes and
diapers. Another protection was giving bracelet, was made from black yarn at baby‘s leg. It was
believed protect baby from spirit interference.
“It made from usual yarn. I told by my grand mother to give baby those bracelet. I don’t know the exact reason. Maybe it makes baby hardly get spirit interference. Those bracelet won’t be released. It will release by itself” (Mbah Darsi, 25/5/2014)
The last responsibility of TBAs in postnatal care was doing circumcision for girl baby. It aimed
to reduce sexual desire when she was adult (Mayasaroh, 2013). Pakem society believed that
circumcision had to be done in twenty fifth day after delivery. it was done by giving a slight slice on
her clitoris
The reason of TBAs utilization
TBAs hold significant role in maternal care in Pakem Village. That role will never be replaced
by health professionals. There were some reason of TBAs utilization
Ordered by parents
Mostly families in Pakem applied extended family pattern, which there were more than one
family lived together in a house. It caused parents or parents in law had bigger access to maternal
care. That role was more dominant in one parity mothers. Interview with some of them concluded
that extended family, especially mother or mother in law gave advice even also decided kinds of
maternal care should be applied, like who TBA would help maternal care was. This process was
kind of socialization of culture value in family. Hufad (2005) said that educating and learning
process in family was the first phase influenced personality. Each person would receive regulation
such as value and culture by learning activity at home. This process resulted internalization of
value, norm, and custom and then became individual‘s reference during her/his life
Following the tradition
Experience of use TBA in the first pregnancy influenced mother perception in her second
pregnancy. More than one parity mothers said that their decision to use TBA on maternal care
came from their experience before. If in the first experience, they got good impression, they tended
also to use TBA on their next pregnancy.
“in my first pregnancy, I was helped by Mbah Bin. Thanks to God, it was safe. In my second pregnancy, I also wanted to use Mbah Bin, so that when I was ready for having pregnancy, my husband called Mbah Bin again. I would bring to Community Health Center, but I was not strong enough, so Mbah Bin helped my delivery again. (interview with Ibu Kun, 18/05/2014)
In this research, more than one parity mother who didn‘t have positive experience on using
TBA still used TBA because they were afraid for getting social sanction from society.
224
Public Health Department, Faculty of Sports Science, F1 Building, 2nd
Floor, Sekaran Campus Gunungpati, Semarang City, Central Java Province, Indonesia, 50229 Phone/ Fax. +6224 8508007
“I come from other town. In my place, I don’t know kinds of massage like in here. In my first pregnancy, I got massage because of ordered by my parents in law. In my second pregnancy, I didn’t want massage, but when my pregnancy was 9months, I felt down from motorcycle. Almost neighbors forced my getting massage, I didn’t want to be gossip among them, so I did it” (interview with Ibu Nur, 20/05/2014)
Distance of nearest health facility
Based on Pakem village monograph, the distance of Pakem to Community Health service
was about 10 km. Observation on road condition founded that the shortest road connected them
was broken, so that people should take further distance. That condition was getting worse because
there was no public transportation. People spent about 100 thousand rupiahs to rent a car. Those
condition caused Pakem people chose having normal delivery at home. They would bring mother
to delivery service, if mother had risk of maternal complication.
That wouldn‘t be happened if the used TBA. Access to TBAs was relative easy because they
lived around village near to mother‘s house. During maternal care, TBAs would come by herself.
This result supported previous research by Amalia (2013) concluded that one of factors determined
preference of birth attendant was accessibility aspect. Based on that research, respondents tended
to choose having delivery in TBA because she lived nearer than midwife lived
The fee of TBA service was cheaper
Since early 2014, government erased Delivery Assurance program (Jampersal). Because of
that, people would bear pregnancy fee. Village midwife said the fee for having delivery in
community health service was 650 thousands rupiahs, while that on private midwife was 850
thousands rupiahs. That fee didn‘t include the fee for renting a car. That amount was expensive for
Pakem people. Mostly people in there works as farmer or farming labor and they only crops twice a
year with main commodity is corn. Interview with some mother informants showed that they just
saved little money for preparing delivery. One of informants said, they almost sold their only one
motorcycle, because mother had predicted having Caesar surgery.
The fee of using TBA was cheaper than that of using delivery service. If they used TBA, they
only spend 300-400 thousands rupiahs. It was almost a half as much as the using of delivery
service. Both of TBAs said that it was taboo asking particular amount of money for their service.
Moreover, they would back some money, if they though the fee was too much. This factor became
consideration of people to prefer TBA to other delivery services. This result supported previous
research by Amilda (2010) said that level of economy correlated significantly on TBA using for
helping delivery
TBA gave prominent and complete service
Mostly mother informants said that traditional maternal care by TBAs had as same meaning
as maternal care by midwife or other delivery service. Moreover, they added TBA gave more
prominent and complete service. Some of maternal cares, which only could given by TBAs, such
Public Health Department, Faculty of Sports Science, F1 Building, 2nd
Floor, Sekaran Campus Gunungpati, Semarang City, Central Java Province, Indonesia, 50229 Phone/ Fax. +6224 8508007
225
as Ungkrak, waiting mother during delivery process, caring mother and baby, healing sawan, and
washing baby‘s goods.
Besides, speed and attention during giving service also were other determining factors on
TBA utilization. Mother informants said that TBA came fast as soon as she was called and always
accompanied mother until end of delivery. Those services couldn‘t be given by other health
professionals.
Closing
Culture norm still became reference for Pakem people in their daily activities, includes
maternal care. One kind of culture based maternal care was applied by people there was the
utilization of Traditional Birth Attendants (TBAs). TBAs had significant roles on all part of maternal
cares. During pregnancy, they guided Mitoni ceremony, doing Ungkrak, and giving Sawan. During
Delivery, they accompanied mother to delivery services or helped delivery process at home, during
postnatal period, they care baby and mother for 25-30 days after delivery and doing circumcision to
girl baby. There were some reasons for utilizing TBAs. They were: ordered by parents, following
tradition, distance of nearest delivery service, the fee of TBA service was cheaper, and TBA gave
prominent and complete service
It needs to improve skill of TBAs by giving continual course, so that they give maternal care a
line to proper medicine knowledge. Government should eliminate delivery helped by TBAs by
developing cooperation between TBAs and skilled birth attendant (midwife), so that they have clear
responsibility on maternal care. Local government should improving access to adequate delivery
services especially for remote area by giving privilege that people in that area can have delivery in
there.
References
AbouZhar, C; Wardlaw, T. (2001). Maternal mortality at the end of a decade: sign of progress?. Buletin of the world Health Organization, 79(6). 561-573
Aeni, N. 2013. Faktor yang berhubungan dengan pemanfaatan pelayanan antenatal di puskesmas margoyoyoso II dan puskesmas gunungwungkal. Jurnal Litbang, 9(3).163-172.
Amalia, L. (2013). Faktor-faktor yang mempengaruhi ibu dalam pemilihan penolong persalinan. saintek. 7(2). http://ejurnal.ung.ac.id/index.php/ST/article/view/1128/914 (diunduh pada 24 juli 2014)
Amilda, N. L; Palarto, B. 2010. Faktor-faktor yang berhubungan dengan pemilihan pertolongan persalinan oleh dukun bayi. Skripsi. Program Pendidikan Sarjana Kedokteran, Fakultas Kedokteran. Semarang: UNDIP.
Anggorodi, R. (2009). Dukun bayi dalam persalinan oleh masyarakat Indonesia. Makara, Kesehatan, 13(1),9-14.
Bowden, J; Manning, V. 2002. Promosi kesehatan dalam kebidanan, prinsip dan praktik. (edisi ke-2). Editor: Esti Wahyuningsih. Jakarta: EGC.
Mratihatani, R. 2008. Pengobatan tradisional dukun beranak: Regulasi dan kebutuhan masyarakat dikaitkan dengan kematian ibu di Kabupaten Grobogan. Tesis. Magister Hukum Kesehatan. Semarang Universitas Katolik Soegijapranata
Hufad, A. (2005). Sosialisasi dan akulturasi nilai-nilai budaya lokal (Kasus pada keluarga inti orang menes di Banten). Mimbar Pendidikan,24(2),46-55.

226
Public Health Department, Faculty of Sports Science, F1 Building, 2nd
Floor, Sekaran Campus Gunungpati, Semarang City, Central Java Province, Indonesia, 50229 Phone/ Fax. +6224 8508007
Budiyono, Suparwati, A, Syamsulhuda, B.M, Nikita, A. (2012). Kemitraan bidan dan dukun dalam mendukung penurunan kematian ibu di Puskesmas Mranggen I Kabupaten Demak. Media Kesehatan Masyarakat Indonesia, 11(1).14-24
Koentjoroningrat. (1990). Pengantar Ilmu Antropologi. Jakarta: PT. Rineka Cipta Mayasaroh, R. (2013). Peran dukun Bayi dalam Penanganan Kesehatan Anak di Desa Bolo
Kecamatan Demak Kabupaten Demak. Solidarity, 2(1), 36-44 Rajab, B. (2009). Kematian ibu: suatu tinjauan sosial-budaya. Jurnal Masyarakat &
Budaya,11(2),237-251. Safira, A. S. M. D. 2013. Tradisi mapati dan mitoni masyarakat jawa islam. Prosiding The 5th
International Conference on Indonesia Studies: Ethnicity and Globalization. Yogyakarta. Soekanto, S. (1995). Sosiologi suatu pengantar. Jakarta: PT. RajaGrafindo Persada. Tumanggor, R. (2010). Masalah-masalah sosial budaya dalam pembangunan kesehatan di
Indonesia. Jurnal Masyarakat & Budaya,12(2),231- 254.
Public Health Department, Faculty of Sports Science, F1 Building, 2nd
Floor, Sekaran Campus Gunungpati, Semarang City, Central Java Province, Indonesia, 50229 Phone/ Fax. +6224 8508007
227
BREASTFEEDING SUPPORT GROUP: WOMEN EMPOWERMENT IN THE EFFORT TO BROADEN THE EXCLUSIVE BREASTFEEDING COVERAGE IN SAMARINDA,
EAST KALIMANTAN
Annisa Nurrachmawati1, Ratih Wirapuspita Wisnuwardhani1, Ike Anggraeni1
1Mulawarman University, Indonesia
Corresponding Author: [email protected]
Abstract
Introduction: Indonesian baseline health survey in 2013 showed that only 42% of infants under six
months were exclusively breastfed. Many factors affect a mother to breastfeed her infants. Peer support
for breastfeeding mothers has often been promoted as a way of increasing rates in communities where there are few breastfeeding role models. The study aims at providing an intervention in the form of breastfeeding support group with the concept of women empowerment to broaden exclusive breastfeeding coverage Methods: The intervention held in two years project. It began with the focus group discussion to
explore determinants which barrier and facilitating breastfeeding, modul development, and trained
one group consist of five mothers as breastfeeding support group, after trained their duties were home visit for nursing mother and held a regular discussion about breastfeeding with pregnant and
nursing mother in their neighbourhood. The second year activities are capacitation and refreshment of the breastfeeding support group in form of training using role playing method.
Results: The survey in the end of program showed that the coverage of exclusive breastfeeding was
62.1% and the presence of breastfeeding support group received positively by all respondents (100%).
Key Words : Breastfeeding, breastfeeding support group, exclusive breastfeeding
Introduction
The problem of malnutrition has its causal factors not only in the deficiency of intake but also
in the wrong habit in infants feeding , including the low prevalence of breastfeeding. There is often
misconception among people that there is not any significant difference between breastfeeding and
formula feed hence the breastfeeding is replaced by milk formula. Consequently, infants suffer
under diarrhea and various diseases because of their decreasing immune system. Their growth
and development are not optimal and there is an increase in the mortality and morbidity because of
the lack of the exclusive breastfeeding (Belfield, 2010).
The coverage of the exclusive breastfeeding in Indonesia was 42% and it reflects a non-ideal
condition as compared to the existing minimal service standard established by the Ministry of
Health, which was 80% (Riskesdas, 2013). It was also the case in Samarinda of East Kalimantan
in which the coverage of the exclusive breastfeeding was only 47.5%.
The potential to empower mothers in the effort to broaden the coverage of the exclusive
breastfeeding among all of the existing healthcare (Puskesmas) in Samarinda City was gained
from Puskesmas Juanda. The coverage of the exclusive breastfeeding in 2010 was only 2.98%
though it has reached 81.5% in 2008. It indicated that there was a problem to immediately solve in
228
Public Health Department, Faculty of Sports Science, F1 Building, 2nd
Floor, Sekaran Campus Gunungpati, Semarang City, Central Java Province, Indonesia, 50229 Phone/ Fax. +6224 8508007
addition to the potential to empower the people considering that they used to be successful in
implementing the breastfeeding program.
The main problem in the breastfeeding has social and cultural causal factors in addition to
the non-optimal support of the existing health officers of PP-ASI and the relentless promotion of the
milk formula and the problem of working mothers (Depkes, 2001).
The health promotion messages for mothers has been organized but did not manage to
broaden the coverage of the exclusive breastfeeding. It indicated that there were impeding factors
related to the breastfeeding practice and the impeding factors could not be overcome only by
improving the knowledge of the mothers. Lawrence Green in his theory of behavioral change
suggested that behavior was not only influenced by knowledge and attitude (i.e., predisposition
factors), but also by the presence of the support of influencing figures (i.e., reinforcing factor).
Lactation counseling in health facilities and breastfeeding support group (KP-Ibu) has
proven to be effective in prolonging the duration of the exclusive breastfeeding (Cochrane Review
2008). The concept has been tried in 2010 in Bantul district, exactly in Banguntapan subdistrict and
managed to broaden the coverage of the exclusive breastfeeding from 30% to 50%.
Considering the proven concept and the existing potential resources it was necessary to
introduce the concept breastfeeding support group in the urban setting of Samarinda City.
Objectives: the objectives of the first year research are to explore exclusive breastfeeding
impeding factors in the community and develop breastfeeding support group.
The objectives of the second year research are to evaluate the success of breastfeeding support
group in increasing the coverage of exclusive breastfeeding and and to keep the sustaining activities
through : monitoring the continuity of breastfeeding support group routines to lactating mothers
through regular meeting, evaluating the success of exclusive breastfeeding in the group of lactating
mothers who has been accompanied by breastfeeding support group during the first year of
program implementation, strengthening the capacity of communication skills and technical skills for
breastfeeding support group
Methods
Based on the objectives and the expected results the study began with detailed and
comprehensive study and analysis of the problem of the low coverage of the exclusive
breastfeeding and the identification of the successful determinants of exclusive breastfeeding.
In brief, the method of the study may be observed in the following chart:
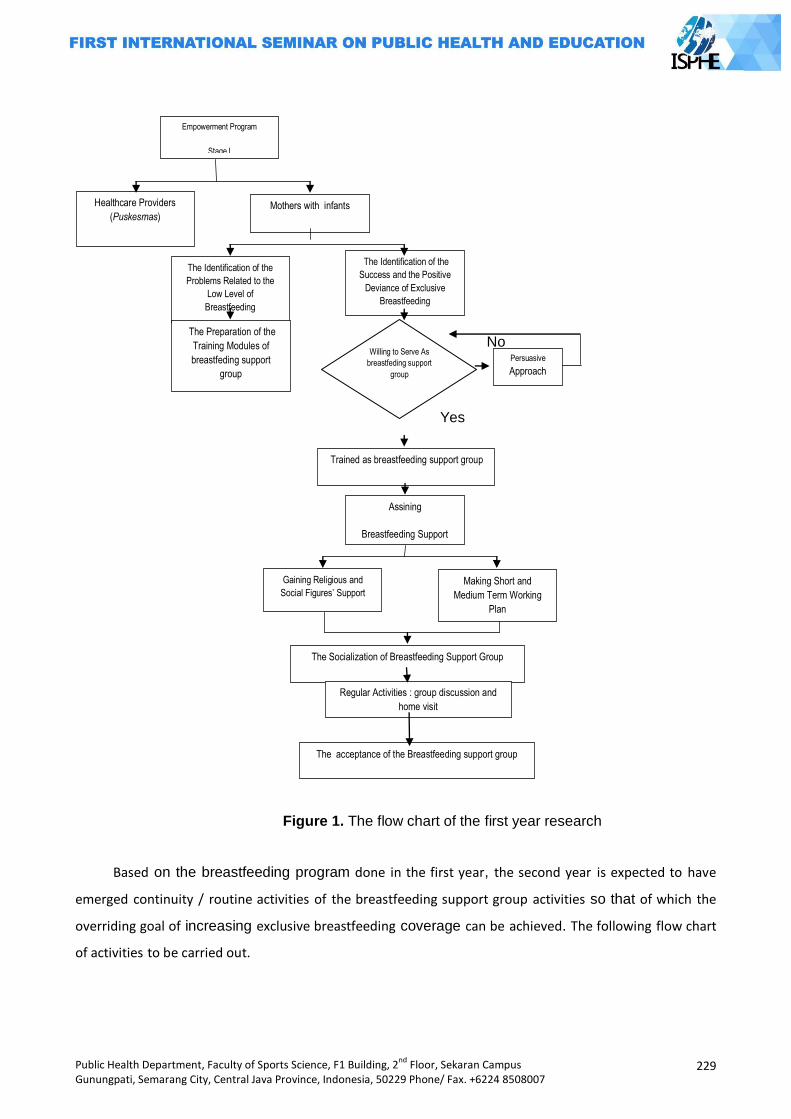
Public Health Department, Faculty of Sports Science, F1 Building, 2nd
Floor, Sekaran Campus Gunungpati, Semarang City, Central Java Province, Indonesia, 50229 Phone/ Fax. +6224 8508007
229
No
Yes
Figure 1. The flow chart of the first year research
Based on the breastfeeding program done in the first year, the second year is expected to have
emerged continuity / routine activities of the breastfeeding support group activities so that of which the
overriding goal of increasing exclusive breastfeeding coverage can be achieved. The following flow chart
of activities to be carried out.
Healthcare Providers
(Puskesmas)
Mothers with infants
The Identification of the
Problems Related to the
Low Level of
Breastfeeding
The Identification of the
Success and the Positive
Deviance of Exclusive
Breastfeeding
The Preparation of the
Training Modules of
breastfeding support
group
Persuasive
Approach
Willing to Serve As
breastfeding support
group
Trained as breastfeeding support group
Assining
Breastfeeding Support
Group
Gaining Religious and
Social Figures’ Support
Making Short and
Medium Term Working
Plan
The Socialization of Breastfeeding Support Group
Regular Activities : group discussion and
home visit
The acceptance of the Breastfeeding support group
Empowerment Program
Stage I
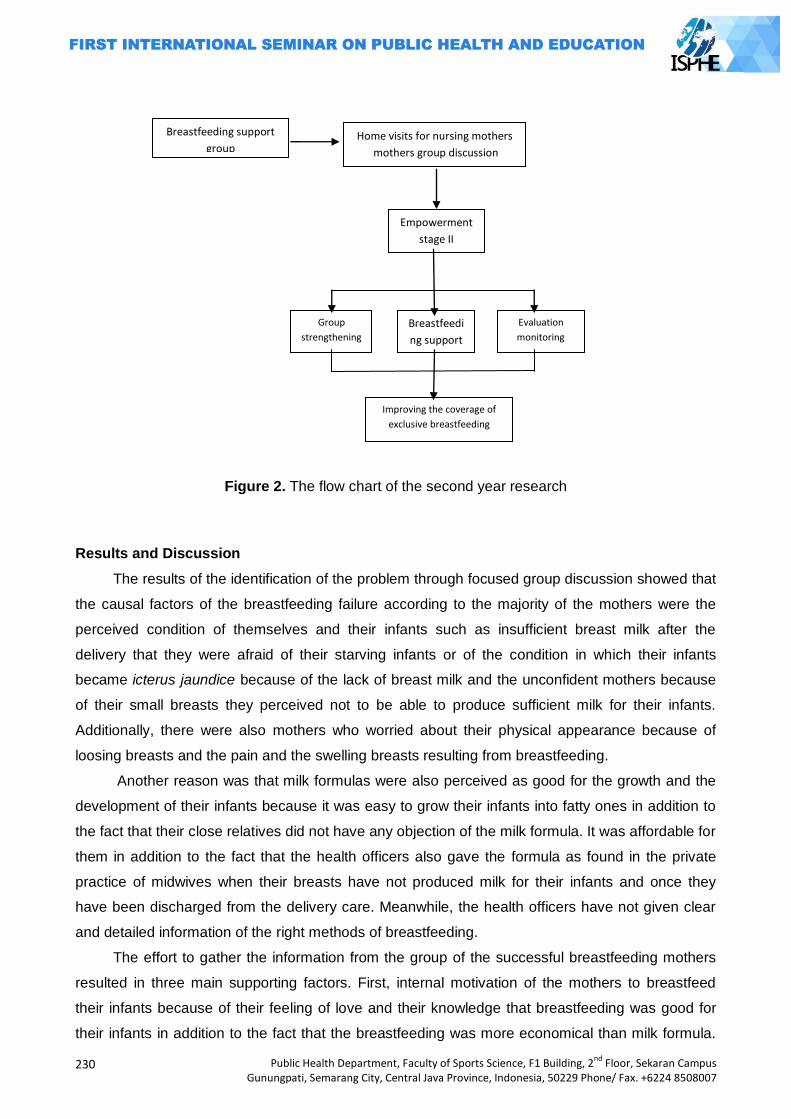
230
Public Health Department, Faculty of Sports Science, F1 Building, 2nd
Floor, Sekaran Campus Gunungpati, Semarang City, Central Java Province, Indonesia, 50229 Phone/ Fax. +6224 8508007
Figure 2. The flow chart of the second year research
Results and Discussion
The results of the identification of the problem through focused group discussion showed that
the causal factors of the breastfeeding failure according to the majority of the mothers were the
perceived condition of themselves and their infants such as insufficient breast milk after the
delivery that they were afraid of their starving infants or of the condition in which their infants
became icterus jaundice because of the lack of breast milk and the unconfident mothers because
of their small breasts they perceived not to be able to produce sufficient milk for their infants.
Additionally, there were also mothers who worried about their physical appearance because of
loosing breasts and the pain and the swelling breasts resulting from breastfeeding.
Another reason was that milk formulas were also perceived as good for the growth and the
development of their infants because it was easy to grow their infants into fatty ones in addition to
the fact that their close relatives did not have any objection of the milk formula. It was affordable for
them in addition to the fact that the health officers also gave the formula as found in the private
practice of midwives when their breasts have not produced milk for their infants and once they
have been discharged from the delivery care. Meanwhile, the health officers have not given clear
and detailed information of the right methods of breastfeeding.
The effort to gather the information from the group of the successful breastfeeding mothers
resulted in three main supporting factors. First, internal motivation of the mothers to breastfeed
their infants because of their feeling of love and their knowledge that breastfeeding was good for
their infants in addition to the fact that the breastfeeding was more economical than milk formula.
Empowerment
stage II
Group
strengthening
Breastfeedi
ng support
group
mentoring
Evaluation
monitoring
Improving the coverage of
exclusive breastfeeding
Breastfeeding support
group
Home visits for nursing mothers
mothers group discussion
Public Health Department, Faculty of Sports Science, F1 Building, 2nd
Floor, Sekaran Campus Gunungpati, Semarang City, Central Java Province, Indonesia, 50229 Phone/ Fax. +6224 8508007
231
Second, external motivation of the mothers included husband‘s support, closes relatives as
parents, mother and father in law and also neighbors. And the third was that the mothers have
known that the breastfeeding was good for the health of their infants and that the breastfed infants
rarely got sick and got fatty body though they did not clearly detail the advantages of the
breastfeeding.
Information about the difficulties facing them while they were doing their job was also
gathered from health officers, especially midwives as the healthcare service providers from
pregnancy to the delivery. The result was that there has not been any breastfeeding counseling
program especially for the pregnant mothers in their trimester III of their pregnancy and also the
breastfeeding mothers. It was also the case of the availability of the counseling rooms and the
counselors. The existing counseling mechanism in the local government clinics was passive in
nature. It meant that the clinics waited for the mothers who were aware of their need for
breastfeeding counseling service. It was also the case of integrated service posts (Posyandu) that
only reminded the mothers to breastfeed their infants. The midwives also complained that it was
hard for the people to change their behavior though they have provided them with their
professional support. According to the midwives it was because of the low education level of the
people, especially the mothers.
Subsequently, the results of the problem identification and the causal factors of the failure of
the breastfeed program was used as one of the materials in preparing the training module for the
breastfeeding peer supporters, which was combined with WHO/UNICEF modules. There were 9
modules that have been successfully prepared in simple language with many pictorial illustrations
for easy understanding. The modules can be used by the breastfeeding support group as the
materials in their communications with the targeted mothers about the early initiation of
breastfeeding, the dangers and the disadvantages of fabricated milk formula, breastfeeding
technique, the nutrition of breastfeeding mothers, the growth of breastfed infants, squeezing breast
milk and storing it and finally supporting the breastfeeding mothers through communication and
education.
Four breastfeeding mothers were selected from a number of the successful breastfeeding
mothers to serve as breastfeeding support group. They were Warima, Wa Aliana, Wa Alpi and
Watiri. The four mothers represented those who have been successful in exclusively breastfeeding
their infants and highly committed to helping pregnant and breastfeeding mothers by providing
them with guidance and instruction. The main role of the breastfeeding support group was serving
as the facilitator and the guide in the regular meeting of the breastfeeding mother group in their
environment. They also visited the newly delivering mothers to provide them with supporting
service for breastfeeding.
The breastfeeding peer supporters were trained to be able to educate the mothers in their
surrounding areas. The training lasted for 2 weeks and 2 days in each week. The expected
outcome was that they were knowledgeable and skillful in guiding the newly delivering mothers to
232
Public Health Department, Faculty of Sports Science, F1 Building, 2nd
Floor, Sekaran Campus Gunungpati, Semarang City, Central Java Province, Indonesia, 50229 Phone/ Fax. +6224 8508007
breastfeed their infants. It was more effective to organize such training in short duration but the
training was repeated in a quite long training period than the once in long duration.
The knowledge of the breastfeeding and the breastfeeding process was significantly
improved after than before the training. Before the training they did not have any knowledge about
the early breastfeeding initiation, the dangers and the disadvantages of the milk formula, and they
perceived that the mothers with nipples problem would not be able to breastfeed their infants. The
positive side of the breastfeeding peer supporters was that they have understood that it was
necessary for the close relatives to support the breastfeeding mothers.
Once they have been trained as breastfeeding motivators, they formed breastfeeding
supports group. The breastfeeding supports group organized activities to optimally support the
mothers willing to be successful in breastfeeding, which include 6 months exclusive breastfeeding
and continuing the breastfeeding up to 2 years or more with nutritious complementary feeding.
The next step was to provide the breastfeeding mothers with advocating service in obtaining
the permission and the acceptance from social figures. The permission and the acceptance were
necessary that they were willing to get involved in the social program. The support that has been
obtained was written commitment containing the statements of the figures to support the presence
and the activities of the breastfeeding support group.
Subsequently, a socialization program was implemented in the form of health dissemination
by the resource persons from Puskesmas Djuanda. It was in the socialization program that the
presence of the breastfeeding supports group was introduced.
The next activity of the mother supports group was regular meeting once in a week or two
weeks. The meeting was attended by research team, 4 breastfeeding support group, and the wife
of social figures, 3 mothers with young infants, and 5 pregnant mothers living in the surrounding
areas of Djuanda. First meeting went on in a little bit awkward atmosphere, but it did not last long
and it went smoothly an in warm, casual and friendly atmosphere after the ice-breaking session
and after the increasingly skilful of the breastfeeding support group in guiding the meeting.
The breastfeeding support group also provide the breastfeeding mothers with advocating
service for the newly delivering mothers by visiting their homes. Two weeks after the delivery were
the period in which the mothers were in need for moral, emotional and technical support to
successfully breastfeed their infants. They visited the mothers at least 2 times in the first 2 weeks
in their homes.
The final step was the evaluation in the form of a survey of the perceived acceptance of the
presence of the breastfeeding supports group and the monitoring of the regular meeting of the
mother supports group for all of the mothers with young infants in the covering area of Puskesmas
Djuanda. The results of the survey of 58 mothers showed that the majority (65.51%) of them were
aware of and supported the presence of the breastfeeding support group though there was only a
part of them felt the need for the advocating service. Meanwhile, there were 46.5% of the mothers
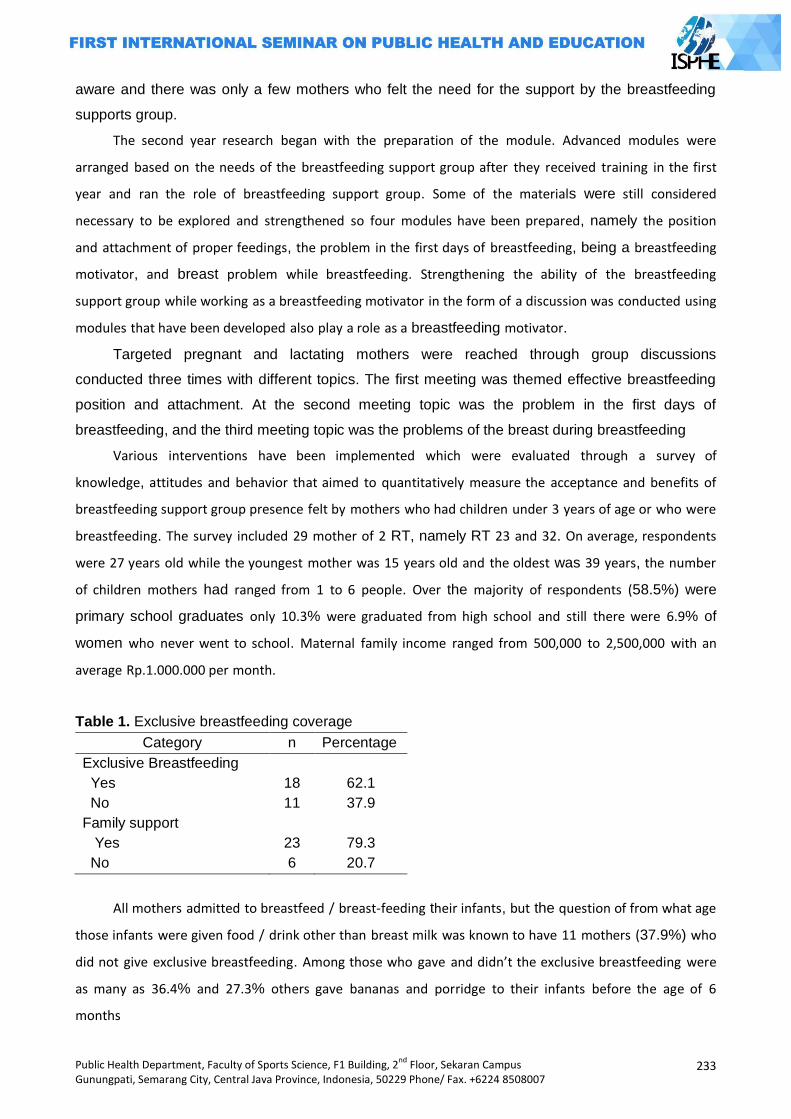
Public Health Department, Faculty of Sports Science, F1 Building, 2nd
Floor, Sekaran Campus Gunungpati, Semarang City, Central Java Province, Indonesia, 50229 Phone/ Fax. +6224 8508007
233
aware and there was only a few mothers who felt the need for the support by the breastfeeding
supports group.
The second year research began with the preparation of the module. Advanced modules were
arranged based on the needs of the breastfeeding support group after they received training in the first
year and ran the role of breastfeeding support group. Some of the materials were still considered
necessary to be explored and strengthened so four modules have been prepared, namely the position
and attachment of proper feedings, the problem in the first days of breastfeeding, being a breastfeeding
motivator, and breast problem while breastfeeding. Strengthening the ability of the breastfeeding
support group while working as a breastfeeding motivator in the form of a discussion was conducted using
modules that have been developed also play a role as a breastfeeding motivator.
Targeted pregnant and lactating mothers were reached through group discussions
conducted three times with different topics. The first meeting was themed effective breastfeeding
position and attachment. At the second meeting topic was the problem in the first days of
breastfeeding, and the third meeting topic was the problems of the breast during breastfeeding
Various interventions have been implemented which were evaluated through a survey of
knowledge, attitudes and behavior that aimed to quantitatively measure the acceptance and benefits of
breastfeeding support group presence felt by mothers who had children under 3 years of age or who were
breastfeeding. The survey included 29 mother of 2 RT, namely RT 23 and 32. On average, respondents
were 27 years old while the youngest mother was 15 years old and the oldest was 39 years, the number
of children mothers had ranged from 1 to 6 people. Over the majority of respondents (58.5%) were
primary school graduates only 10.3% were graduated from high school and still there were 6.9% of
women who never went to school. Maternal family income ranged from 500,000 to 2,500,000 with an
average Rp.1.000.000 per month.
Table 1. Exclusive breastfeeding coverage
Category n Percentage
Exclusive Breastfeeding
Yes 18 62.1
No 11 37.9
Family support
Yes 23 79.3
No 6 20.7
All mothers admitted to breastfeed / breast-feeding their infants, but the question of from what age
those infants were given food / drink other than breast milk was known to have 11 mothers (37.9%) who
did not give exclusive breastfeeding. Among those who gave and didn’t the exclusive breastfeeding were
as many as 36.4% and 27.3% others gave bananas and porridge to their infants before the age of 6
months
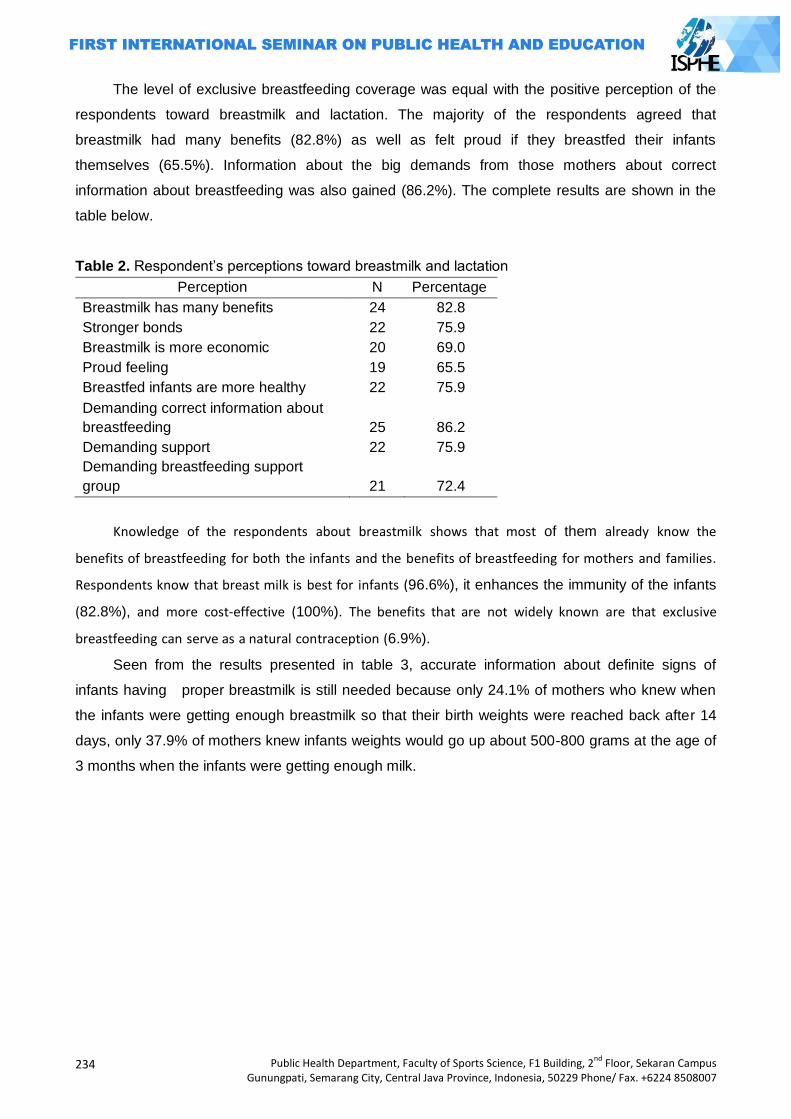
234
Public Health Department, Faculty of Sports Science, F1 Building, 2nd
Floor, Sekaran Campus Gunungpati, Semarang City, Central Java Province, Indonesia, 50229 Phone/ Fax. +6224 8508007
The level of exclusive breastfeeding coverage was equal with the positive perception of the
respondents toward breastmilk and lactation. The majority of the respondents agreed that
breastmilk had many benefits (82.8%) as well as felt proud if they breastfed their infants
themselves (65.5%). Information about the big demands from those mothers about correct
information about breastfeeding was also gained (86.2%). The complete results are shown in the
table below.
Table 2. Respondent‘s perceptions toward breastmilk and lactation
Perception N Percentage
Breastmilk has many benefits 24 82.8
Stronger bonds 22 75.9
Breastmilk is more economic 20 69.0
Proud feeling 19 65.5
Breastfed infants are more healthy 22 75.9
Demanding correct information about
breastfeeding 25 86.2
Demanding support 22 75.9
Demanding breastfeeding support
group 21 72.4
Knowledge of the respondents about breastmilk shows that most of them already know the
benefits of breastfeeding for both the infants and the benefits of breastfeeding for mothers and families.
Respondents know that breast milk is best for infants (96.6%), it enhances the immunity of the infants
(82.8%), and more cost-effective (100%). The benefits that are not widely known are that exclusive
breastfeeding can serve as a natural contraception (6.9%).
Seen from the results presented in table 3, accurate information about definite signs of
infants having proper breastmilk is still needed because only 24.1% of mothers who knew when
the infants were getting enough breastmilk so that their birth weights were reached back after 14
days, only 37.9% of mothers knew infants weights would go up about 500-800 grams at the age of
3 months when the infants were getting enough milk.
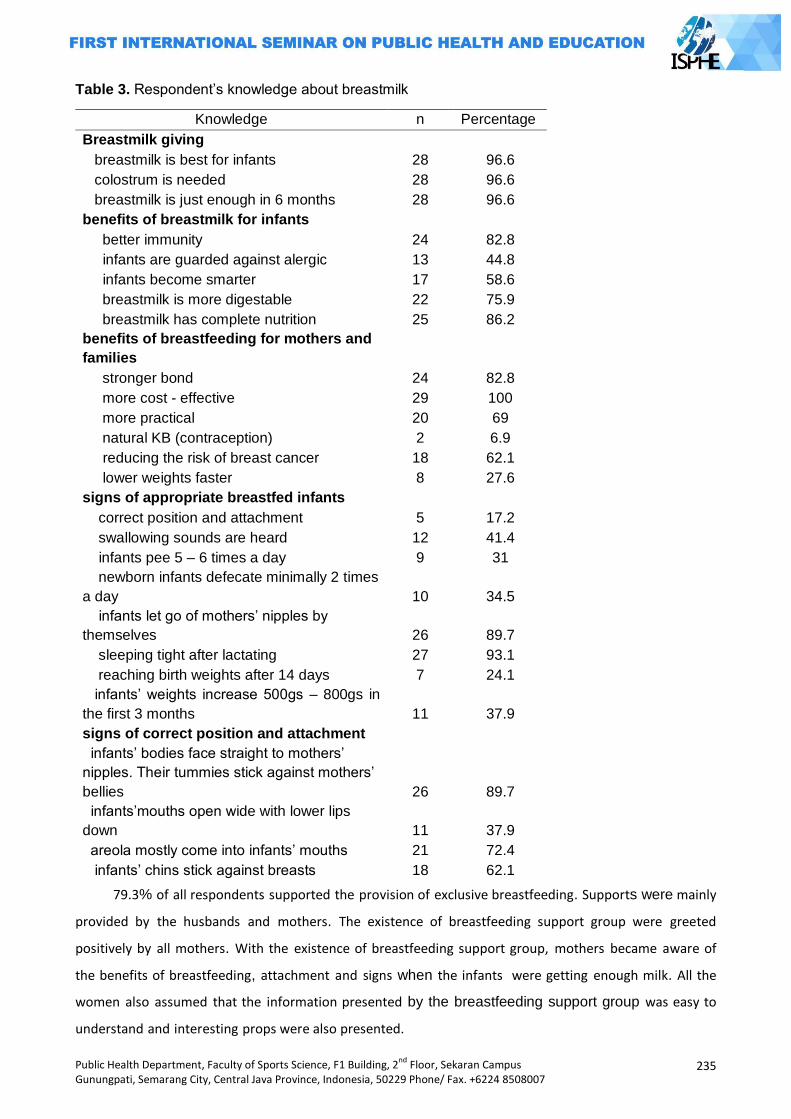
Public Health Department, Faculty of Sports Science, F1 Building, 2nd
Floor, Sekaran Campus Gunungpati, Semarang City, Central Java Province, Indonesia, 50229 Phone/ Fax. +6224 8508007
235
Table 3. Respondent‘s knowledge about breastmilk
79.3% of all respondents supported the provision of exclusive breastfeeding. Supports were mainly
provided by the husbands and mothers. The existence of breastfeeding support group were greeted
positively by all mothers. With the existence of breastfeeding support group, mothers became aware of
the benefits of breastfeeding, attachment and signs when the infants were getting enough milk. All the
women also assumed that the information presented by the breastfeeding support group was easy to
understand and interesting props were also presented.
Knowledge n Percentage
Breastmilk giving
breastmilk is best for infants 28 96.6
colostrum is needed 28 96.6
breastmilk is just enough in 6 months 28 96.6
benefits of breastmilk for infants
better immunity 24 82.8
infants are guarded against alergic 13 44.8
infants become smarter 17 58.6
breastmilk is more digestable 22 75.9
breastmilk has complete nutrition 25 86.2
benefits of breastfeeding for mothers and
families
stronger bond 24 82.8
more cost - effective 29 100
more practical 20 69
natural KB (contraception) 2 6.9
reducing the risk of breast cancer 18 62.1
lower weights faster 8 27.6
signs of appropriate breastfed infants
correct position and attachment 5 17.2
swallowing sounds are heard 12 41.4
infants pee 5 – 6 times a day 9 31
newborn infants defecate minimally 2 times
a day 10 34.5
infants let go of mothers‘ nipples by
themselves 26 89.7
sleeping tight after lactating 27 93.1
reaching birth weights after 14 days 7 24.1
infants‘ weights increase 500gs – 800gs in
the first 3 months 11 37.9
signs of correct position and attachment
infants‘ bodies face straight to mothers‘
nipples. Their tummies stick against mothers‘
bellies 26 89.7
infants‘mouths open wide with lower lips
down 11 37.9
areola mostly come into infants‘ mouths 21 72.4
infants‘ chins stick against breasts 18 62.1
236
Public Health Department, Faculty of Sports Science, F1 Building, 2nd
Floor, Sekaran Campus Gunungpati, Semarang City, Central Java Province, Indonesia, 50229 Phone/ Fax. +6224 8508007
The coverage of exclusive breastfeeding in infants 0-6 months in Indonesia shows a decreasing
number of 61.5% in 2010 to 42% in 2013. Exclusive breastfeeding practices are influenced by many
factors, including socio-cultural factors, knowledge of the importance of breastfeeding, support froms
health personnels, agencies and families, congestion of breastmilk, health reasons, limited time because
the time is taken over by work and the use of formula feeding.
The attitude and the ability of mothers in the implementation of the early breastfeeding and
the exclusive breastfeeding were influenced by various misguiding perception of the conditions of
breastfeeding and infants behavior. The less balanced information of the aggressive promotion by
the producers of the milk formula also confirmed the misperception of the breastfeeding.
It was also because all of the mothers have not been knowledgeable of the exclusive
breastfeeding in addition to the lack of the support from their close relatives. If they were
sufficiently knowledgeable of the exclusive breastfeeding, they knew that the exclusive
breastfeeding represented the best food for infants and they did not want to feed their infants with
milk formula.
Thus, it could be concluded that the knowledge of the mothers had significant impact on the
success in the exclusive breastfeeding for infants. This is consistent with the statement Roesli (2004),
which states that the knowledge of mothers about breastfeeding can affect the mothers exclusive
breastfeeding so that health professionals, particularly local health authorities are expected to further
enhance the knowledge of mothers on exclusive breastfeeding through information media and other
counseling media such as nutrition counseling.
It was also consistent with the results of the study by Kurlintan (2009) in Tangkil Village of
Sragen subdistrict of Sragen district suggesting that there was significant correlation between the
knowledge and the exclusive breastfeeding. It was also consistent with Roesli (2004) suggesting
that mothers‘ knowledge of exclusive breastfeeding may have significant impact on the mothers in
exclusively breastfeeding their young infants.
Based on respondents' answers about what age the infants food / drink other than breast milk are
given it was found that there were 11 mothers (37.9%) who did not give exclusive breastfeeding. Among
those who didn’t give exclusive breastfeeding as many as 36.4% gave bananas and 27.3% gave bananas
and porridge to her infants before the age of 6 months
This shows the importance of breastfeeding and information about breastfeeding before the birth of
the infants not waiting after the infants is born, because research conducted by Ludvigsson (2003) states
that fewer mothers give food or drink other than breast milk and have a longer duration of exclusive
breastfeeding when they have been given the information about breastfeeding and lactation before the
infants's birth. Foods and drinks other than breast milk given before the infants is 6 months old are often
only for the reason to follow the tradition not due to the reason related to the fulfillment of nutrients
(Yotebieng, 2013). Important result of this survey is that the majority of mothers who have infants stated
Public Health Department, Faculty of Sports Science, F1 Building, 2nd
Floor, Sekaran Campus Gunungpati, Semarang City, Central Java Province, Indonesia, 50229 Phone/ Fax. +6224 8508007
237
that breastfeeding was important for infants' health, along with a good knowledge about the benefits of
breastfeeding and breast milk than formula milk.
Perception is the expression of someone about something according to his way of thinking and
motivation is something that makes people act or behave in certain ways. Mothers’ perceptions are
influenced by knowledge about the benefits of breastfeeding for mothers, infants and families. Breastmilk
plays an important role in maintaining the health and survival of infants because breast milk is the best
food for infants, the right food choices for infants, infants suffer less disease and avoid malnutrition
(Fortune, 2008). In addition to knowledge and positive perception exclusive breastfeeding success is also
influenced by the presence or absence of supports from the social environment breastfeeding mothers.
Based on the aforementioned discussion the health officers, especially local health officers
were expected to improve their knowledge of the mothers with young infants of the exclusive
breastfeeding through information media and counseling media and other media such as nutrition
dissemination.
It was habitual for the majority of the health officers to provide the mothers with sincere
support and it had significant impact on the success in the breastfeeding. Essentially, they played a
role in protecting, improving and supporting the effort to breastfeed their infants as observed in
their involvement in a broad range of social aspects.
As the ones responsible for the nutrient and the healthcare of the infants and their mothers,
the health officers had unique position that might influence the organization and the function of the
healthcare for mothers before, during and after the pregnancy and the delivery.
All of the subjects of the study, both those delivering in their house and in hospital have ever
visited midwives to for the examination of their pregnancy. However, the lack of the information
about the breastfeeding has resulted in the less knowledgeable of the mothers of the
breastfeeding. Generally, the midwives assumed that breastfeeding was not a problem and it was
not necessary to provide mothers with the special instruction of the breastfeeding. Therefore, if the
mothers did not ask questions appertaining to the breastfeeding, they did not give any explanation
about it and hence the attitude of the midwives was also important in the effort to successfully
implement the exclusive breastfeeding program (Perinasia, 2004).
The results of the study of 421 respondents in Depok by Wibowo et. al. (2008) showed that
87.9% of infants got prelactal food intake, 76% of them got baby milk formula and 69.8% of those
giving the prelactal feeding were health officers. They confirmed the results of the present study in
which the prelactal feeding had significant impact on the failure in the exclusive breastfeeding.
It was worthy to note that the first one who gave the prelactal feeding was health officers in
the form of free formula. It was necessary to improve the awareness of the fact that they are
prohibited to give formula instead but to help the mothers facing the difficulties in exclusively
breastfeed their infants. Also, it was necessary to give the health officers who gave the prelactal
feeding such milk formula explicit sanction as stipulated in the Decree of the Minister of Health
238
Public Health Department, Faculty of Sports Science, F1 Building, 2nd
Floor, Sekaran Campus Gunungpati, Semarang City, Central Java Province, Indonesia, 50229 Phone/ Fax. +6224 8508007
Number 237 of 1997 on the Marketing of the formula that may be monitored by Ditjen POM and the
Department of Health supported by local health offices in their effort to successfully implement the
exclusive breastfeeding program.
The conditions indicated that mothers were in need for more intensive support from their
environment in addition to the knowledge of the breastfeeding to successfully practice the
exclusive and optimal breastfeeding, especially in early initiating breastfeeding and 6 months
exclusive breastfeeding. The support of others, especially the closest ones played an important
role in the successful exclusive breastfeeding. The bigger was the support of the closest ones for
the breastfeeding, the more successful the exclusive breastfeeding would be. Generally, husbands
gave their wives their biggest support for the exclusive breastfeeding.
If family support, especially from the point of view of positive motivation for the breastfeeding
was not enough, there should be technical support and education of the breastfeeding because it
was not only the responsibility of women. The relentless and interesting promotion of the milk
formula in all of the media has resulted in ―the difficulties‖ in breastfeeding. Therefore, it was
necessary to assign breastfeeding peer supporters. The activity of the breastfeeding peer
supporters in motivating and educating the mothers with young infants was essentially similar to
the concept of the activity of breastfeeding counseling.
The key to success of breastfeeding practice is through continuous supports and sustainable to
breastfeeding mothers both at home and the surrounding community. Counseling by peers is an effective
effort to reach more mothers more intensively. Peer counselors are generally someone from the
community around the mother who has been trained to help mothers breastfeed.
The presence of the lactation counseling in health facilities and the mother supports group in
a society has proven to be effective in prolonging the duration of the exclusive breastfeeding based
on the joint analysis of the results of 34 scientific experiments in 14 countries involving 29,385
infants-mother pairs (Cochrane Review 2008). The model was breastfeeding peer supporters and
mother supports group in which volunteering involvement of the people was the key for the
success of the exclusive breastfeeding program.
Systematic review conducted by De Oliveria (2001) showing the combination of intervention among
group sessions, home visits, and individual counseling, which begin when prenatal monitoring until after
the infants is born is the most effective strategy to increase the duration of breastfeeding. Britton (2007)
in his review writes that mothers who have supports of any kind are less likely to stop exclusive
breastfeeding before 5 months. Results of this review are also supported by the results of the review De
Oliveria (2001) who reports if pregnant women given counseling and support from the people around
them will prolong breastfeeding.
The objective of the breastfeeding counseling in the study was in general to support the
success of the exclusive breastfeeding program. In the counseling process, the mothers as the
respondents of the study gave positive feedback and they voluntarily spent time for the counseling.
Public Health Department, Faculty of Sports Science, F1 Building, 2nd
Floor, Sekaran Campus Gunungpati, Semarang City, Central Java Province, Indonesia, 50229 Phone/ Fax. +6224 8508007
239
The target mothers actively asked questions and expressed their complaints and problems and
they were willing to accept the solution recommended by the counselors in that they had to
determine themselves what they had to do.
This concept’s focus attention of breastfeeding support group is helping people to recognize the
ability within themselves to solve their own health problems. The concept is a participatory approach, in
which the participatory approach or method can cultivate self-confidence and responsibility for decisions
made by a group of lactating mothers dan mothers Support Groups. Research process that involves a lot of
interaction between the researcher and community as well as midwives is a good container for bridging
the stakeholders in the field of maternal and child health. Interaction that exists also becomes an
accelerator for the realization of community empowerment.
It was consistent with Mortensen‘s theory (1964) suggesting that counseling was an
interpersonal process in which an individual was helped by other in improving his or her
understanding and skills in problem solving. Also, it was consistent with the statement of the
Department of Health (2003) that counseling was a working method with targeted client in which
counselor tried to understand what was the feeling of the targeted client and helped him or her
determine what to do.
Closing
The results of the study might be concluded as follows: the main impeding factor of the
exclusive breastfeeding program was the lack of the knowledge of the mothers of the
breastfeeding and the low technical support by the health officers and the surrounding
environment, the supporting factors of the success of the exclusive breastfeeding were internal
motivation (i.e., the feeling of love), external motivation (husband‘s and family‘s support) and the
knowledge of the mothers that the breastfeeding was good for their young infants, evaluation of the
success of exclusive breastfeeding carried out through a survey of lactating mothers groups that have
been accompanied by a breastfeeding support group during implementation of the program shows the
coverage of exclusive breastfeeding was as much as 62.1% and the presence of breastfeeding support
group was received positively by all respondents (100%).
References
Britton C, McCormick FM, Renfrew, M., Wade, A., & King, S. (2007). Support
for breastfeeding mothers Cochrane Library, 1-61.
Depkes RI, (2001), Manajemen Laktasi, Direktorat Jenderal Bina Kesehatan Masyarakat, Jakarta.
________, (2002a), Strategi Nasional: Peningkatan Pemberian Air Susu Ibu Sampai Tahun 2005,
Jakarta.
De Oliveria, M., Camache, L., & Tedston, A. (2001). Extending breastfeeding duration through
primary care: a Systematic review of prenatal and postnatal interventions. Journal of Human
Lactation, 7(4), 326-343.
240
Public Health Department, Faculty of Sports Science, F1 Building, 2nd
Floor, Sekaran Campus Gunungpati, Semarang City, Central Java Province, Indonesia, 50229 Phone/ Fax. +6224 8508007
Green, L. W. and Kreuter, M. W. (2000), Health Promotion Planning An Educational, Mayfield
Publishing Company, Mountain View, United States.
Hector D, King L, Webb K. 2004.State Of Food and Nutrition in NSW Series: Overview of Recent
Review of Interventions to Promote and Support Breastfedding. Sydney: NSW Departement
of Health.
http://www.gos.gov.uk/497468/images/349392/NW_Breastfeeding_Framework_1.pdf,
Tanggal akses: 11 Juni 2013.
Kasnodihardjo, dkk, 1996. Faktor Determinan Pemberian Air Susu Ibu Tidak Eksklusif. Buletin
Penelitian Kesehatan UI (2 dan 3).
Muchtadi, Deddy.2002. Gizi Untuk Bayi: ASI, Susu Formula dan Makanan Tambahan. Pustaka
Sinar Harapan. Jakarta
Notoatmodjo, Soekidjo.2005. Promosi Kesehatan Teori dan Aplikasi. PT. Rineka Cipta.Jakarta
Prasetyono, Dwi Sunar.2009. Buku Pintar ASI Eksklusif. Yogyakarta: Diva Press (Anggota IKAPI)
Roesli, U, 2004. Mengenal ASI Eksklusif. Pustaka Pembangunan Swadaya Nusantara. Jakarta.
Soetjiningsih R, 1997. ASI Petunjuk Untuk Tenaga Kesehatan. EGC. Jakarta.
Wahyuningrum, Novi. 2007. ―Survey Pengetahuan Ibu tentang ASI Eksklusif Dengan Pemberian
ASI Eksklusif Pada Bayi di Desa Sadang Kecamatan Jekulo Kabupaten Kudus‖. Skripsi tidak
diterbitkan. Semarang: Fakultas Ilmu Keolahragaan Jurusan IKM FT Universitas Negeri
Semarang.
Public Health Department, Faculty of Sports Science, F1 Building, 2nd
Floor, Sekaran Campus Gunungpati, Semarang City, Central Java Province, Indonesia, 50229 Phone/ Fax. +6224 8508007
241
DEVELOPING STANDARD OPERATING PROCEDURE (SOP) IN MATERNITY CENTER FOR SUCCESS OF EXCLUSIVE BREASTFEEDING
Chatila Maharani1, Galuh Nita Prameswari1
1Semarang State University, Indonesia
Corresponding Author: [email protected]
Abstract
Introduction: The one of the cause of increasing of Infant Morbidity and Mortality Rate are the lack of mother ‗s knowledge and support from maternal health workers about the importance of exclusive breastfeeding. Based on Government regulation (PP No. 33 Year 2012), Maternity Center (RB) must support for Succes of Exclusive Breastfeeding. They can get punishment if they do not support exclusive breastfeeding. The research was to develop the Standard Operating Procedure (SOP) of exclusive breastfeeding management in RB. Methods: This was a development research which used Focus Group Discussion (FGD) method with an Obstetrician and Gynaecologist, paediatricians, midwives, lactation counsellors, and a head of family health, Health Department of Semarang. The stages of creating the SOP namely identification and classification (FGD I), Literature Review and SOP development (FGD IIA and IIB), Consultation, and Finalize (FGD III). Results: Identification and classification of the SOP were based on Ten Steps of Baby-Friendly Hospital Initiative (BFHI), Seven Contacts Plus for Sustaining Breastfeeding and Standar Pelayanan Minimal/Minimum Service Standard (SPM) of Health Sector in District. As a result, there were developed ten procedures of exclusive breastfeeding management which classified into Antenatal (2 procedure), Maternity (1 procedure) and postnatal until 6 months SOP (7 procedures) Key Words: Exclusive breastfeeding, maternity center, standard operating procedure Introduction
Based on a research, the increasing of infant morbidity and mortality in Singapore are
directly caused by the increasing giving formula milk to infant which are not appropriate instead of
giving breastmilk and the declining the number of mothers who breastfeed their babies (Esterik,
1990). Although, The Infant Mortality Rate (IMR),which is the fourth goal of Millennium
Development Goals (MDGs), decreased from 68 to 35 per 1,000 live births, in 1991 and 2003
respectively. Moreover, the number of IMR decline to 34 per 1,000 live births in 2007, but it is still
relatively slow decline. Because of that, there is a policy to increase the coverage of exclusive
breastfeeding for achieving the target of fourth goal of MDGs (Indonesia, 2010).
Definition of Exclusive breastfeeding is the infant receives only breast milk since the birth of
baby until 6 (six) months, without adding and / or replacing with other food or drink (Government
Regulation-PP No. 33 Year 2012). Exclusive breastfeeding is strongly recommended because
breast milk has many benefits namely decreasing the risk of infectious diseases (diarrhoea,
respiratory tract infections, ear infections, pneumonia, urinary tract infection) and the other
diseases such as obesity, diabetes, allergies, gastrointestinal inflammatory diseases and cancer
(Hegar, 2010: 3). Meanwhile, according to the World Health Organization (WHO) and United
Nations Children's Fund (UNICEF), improving of feeding practices to infants and children can save
242
Public Health Department, Faculty of Sports Science, F1 Building, 2nd
Floor, Sekaran Campus Gunungpati, Semarang City, Central Java Province, Indonesia, 50229 Phone/ Fax. +6224 8508007
the babies and children‘s life. Evidences showed that the growth and development of infants and
children would be optimal if implementing the Early Initiation of Breastfeeding during the first 1 hour
of birth, exclusive breastfeeding up to 6 months, complementary feeding safely and appropriately
(soft food, semi-solid, solid) starting from the age of 6 months.
Exclusive breastfeeding also become one of 8 performance indicators which measured in
Rencana Aksi Pembinaan Gizi Masyarakat to achieve Rencana Pembangunan Jangka Menengah
Nasional (RPJMN) bidang Kesehatan (Kementerian Kesehatan Republik Indonesia [Kemenkes
RI], 2012a: 2 ). Based on data from Survei Demografi dan Kesehatan Indonesia (SDKI) 2002,
coverage of exclusive breastfeeding in Indonesia in infants aged 0-5 months was 40 percent and in
2007 was 32% (Badan Pusat Statistik [BPS] and Marco International, 2007 and spm.depkes.go.id
2007 cited by Widodo, 2011: 103). As a result, in a report of the Millennium Development Goals in
Indonesia 2010, Improving the practice of exclusive breastfeeding by socialization and advocacy is
one of the policies to be able to achieve the first Goal of Millennium Development Goals (1C)
namely Decreasing up to half of the proportion of people who suffer from hunger during 1990 until
2015 (Indonesia, 2010).
Data from Indonesia Health Profile, exclusive breastfeeding coverage rose to 61.5% in 2010
(Kementerian Kesehatan Republik Indonesia, 2012b). Level of the covarege was below the target
of the Ministry of Health in 2010 by 65%. While the national target in 2012 was expected that 75%
of infants in Indonesia got exclusive breastfeeding (Kemenkes RI, 2012a: 23). Another data from
Riset Kesehatan Dasar (Riskesdas) in 2010, the percentage of infant who breast-fed exclusively
up to 5 months was 15.3 percent (Riskesdas, 2010: 171). In Central Java, coverage of exclusive
breastfeeding in 2010 was 57.8%. This figure was still below the rate of exclusive breastfeeding
coverage of Indonesia and some other provinces such as DKI Jakarta, West Java and Yogyakarta
(Kemenkes, 2012b).
In order to increase coverage of exclusive breastfeeding, a mother needs support from all
parties, starting from the family (husband, parents, parents in-laws, etc.), health workers (by giving
information and implementation of Early Initiation of Breastfeeding and exclusive breastfeeding
during pregnancy, birthing and post-natal) and mother‘s working environment (office). Based on
the condition, the Government of Indonesia has issued Government Regulation of the Republic of
Indonesia (RI PP) No. 33 Year 2012 (Article 9,10 and 13) which governs the obligations of health
workers and health care providers to support the success of exclusive breastfeeding by Early
Initiation of Breastfeeding, to carry out rooming in and to provide information and education for
mothers and/or family members since the pregnancy until the period of exclusive breastfeeding is
completed. Furthermore, in pasal 18, states that health care providers is prohibited for providing
infant formula or other products which can inhibit Exclusive breastfeeding program.
In addition, based on research by Afifah (2007), from 12 mothers who gave birth at home
helped by traditional birth attendants (dukun), midwives, Maternity center and Hospital, only one
mother who providing exclusive breastfeeding. The mother was delivered her baby at the hospital
Public Health Department, Faculty of Sports Science, F1 Building, 2nd
Floor, Sekaran Campus Gunungpati, Semarang City, Central Java Province, Indonesia, 50229 Phone/ Fax. +6224 8508007
243
with helped of by midwives. In that research stated the reinforcing factors for success of exclusive
breastfeeding, such as the role of health workers, traditional birth attendants and family was
negative. Based on research by Luzia, et. al (2003) showes that there was a significant increase in
the rate of exclusive breastfeeding after implement Baby Friendly Hospital Initiative (BFHI).
Hospitals in Italy that provided management training and promotion of breastfeeding by UNICEF
for 18 hours for health care workers could improve the involvement of health care workers with the
"10 steps towards successful breastfeeding/ Ten Steps of Baby-Friendly Hospital Initiative"
(Cattaneo, 2001).
Therefore, health care facilities need to know the content of the Government Regulation (PP
No.33 Year 2012) and govern the way of Exclusive breastfeeding implementation in health care
facilities such as hospitals, Maternity center, Maternity Hospital and Private Practice by Midwives
because a hospital health care facility has a role in the success of mothers to breastfeed the baby
with provided by the presence of breastfeeding management (Partiwi, 2010).
Maternity center / Rumah Bersalin (RB) is the one of the health care facility that provides
care before birth (prenatal), birth and after birth (postnatal), both carried out by a specialist of
obstetrics and gynecology (SpOG) or Private Practice Midwives. Based on a preliminary survey at
Maternity center in Semarang which was held on 26 February until 4 March 2013, data showed
that 10 of 15 respondents (5 respondents were patients who were pregnant their first child) did not
give exclusive breastfeeding to their infants. Ten women were giving additional drinks at the first
time of birth, infants aged 2 months, 3 months and 4 months. Moreover, the mother also providing
additional food to baby newborn or babies aged 3-5 months. Five mothers felt difficult to breastfeed
because breast milk did not come out, flat nipples shape, working mother and did not have breast
milk storage equipment (refrigerator). Most mothers need support from husband for success give
exclusive breastfeeding to their babies. Mother also need support from the health care facilities for
example by asking approval from the mothers for giving food or additional drink for the newborn.
The condition showed that health care facilities also have an important role to increase exclusive
breastfeeding coverage. In addition, Maternity center has not had Standard Operating Procedure
(SOP) that can serve as guidelines of exclusive breastfeeding management. Availability of SOP of
Exclusive breastfeeding management is important because it is a way for health care facilities
including maternity center to improve exclusive breastfeeding coverage in Indonesia. Futhermore,
based on PP 33 In 2012, there are sanctions for health care facilities such as an oral reprimand,
written reprimand; and / or revocation of a license for health care facilities that do not support
exclusive breastfeeding implementation. As a result, health care facilities such as maternity center
should also provide support by creating a system which encourages exclusive breastfeeding
succes in the maternity center.
Based on the conditions, this research was carried out for developing Standard Operating
Procedure (SOP) of exclusive breastfeeding management which is needed by Maternity Center for
success of exclusive breastfeeding to the baby.
244
Public Health Department, Faculty of Sports Science, F1 Building, 2nd
Floor, Sekaran Campus Gunungpati, Semarang City, Central Java Province, Indonesia, 50229 Phone/ Fax. +6224 8508007
Methods
Design of this research was development research because this research was developed
SOP of exclusive breastfeeding management. The SOP was developed for emplementing
exclusive breastfeeding in maternity center. Focus Group Discussion (FGD) was conducted for
creating the SOP. The FGD consisted of six to eight participants (Creswell, 2010). FGD
participants were medical personnel who have or practiced in maternity center namely a Specialist
of Obstetrics Gynecology (SpOG), two pediatricians (Spesialis Anak / SpA) and 3 midwives. In
addition, there were two breastfeeding counselors from Asosiasi Ibu Menyusui Indonesia (AIMI-
Indonesian Breastfeeding Mothers Association) Branch of Central Java and a representative of
Bidang Kesehatan Keluarga (Kesga-Health Family) Dinas Kesehatan Kota Semarang.
This research conducted by five steps. The first step called FGD I. In this step, the
participants identified SOP which required for exclusive breastfeeding management in maternity
center. Output on this step was a list of procedure in exclusive breastfeeding management SOP in
maternity center. The second phase of this study was literature study for looked for the sources of
literature. The literature study was to guide the development of SOP. The output at the second
step was a number of resources to support the development of SOP. The third stage were two
activity, namely FGD IIA and FGD IIB. The FGD IIA was a development of antenatal SOP. While
FGD IIB was a developing SOP during labor. The third step was separated into two FGD for the
discussions became more focus.
In the third stage, the SOP was based on literature (books and regulations) and input and
suggestions from the participants of the FGD. In addition, the contents of the SOP was also
adapted to the conditions in the maternity center. The output at this stage was a draft of SOP about
Exclusive Breastfeeding Management. The fourth stage was consultation SOP about Postpartum
Period until Babies Aged 6 Months to the FGD participants. Each FGD participant corrected one or
two procedures and after that the researcher made a revision based on the correction. The fifth
stage was finalizing the SOP Phase I (FGD III). FGD III conducted to examine again SOP that has
been made before. The output of this activity was an Exclusive Breastfeeding Management SOP.
Results and Discussion
Based on the results of the FGD, the SOP was classified into 3 parts antenatal, During Labor
SOP and the Postpartum Period Until Babies Aged 6 Months SOP. Postpartum Period Until Babies
Aged 6 Months SOP adjusted with the definition of exclusive breastfeeding namely breast milk
given to the baby until the baby is 6 months old without being offered food and drink (Depkes,
2004: 15). This classification was for facilitate health care workers for choosing the SOPs required
easily.
Classification and identification of the SOP was based on Ten Steps of Baby-Friendly
Hospital Initiative (BFHI) (WHO & UNICEF), Seven Contacts Plus for Sustaining Breastfeeding by
WHO & UNICEF (2011) and adapted to Standar Pelayanan Minimal/Minimum Service Standard
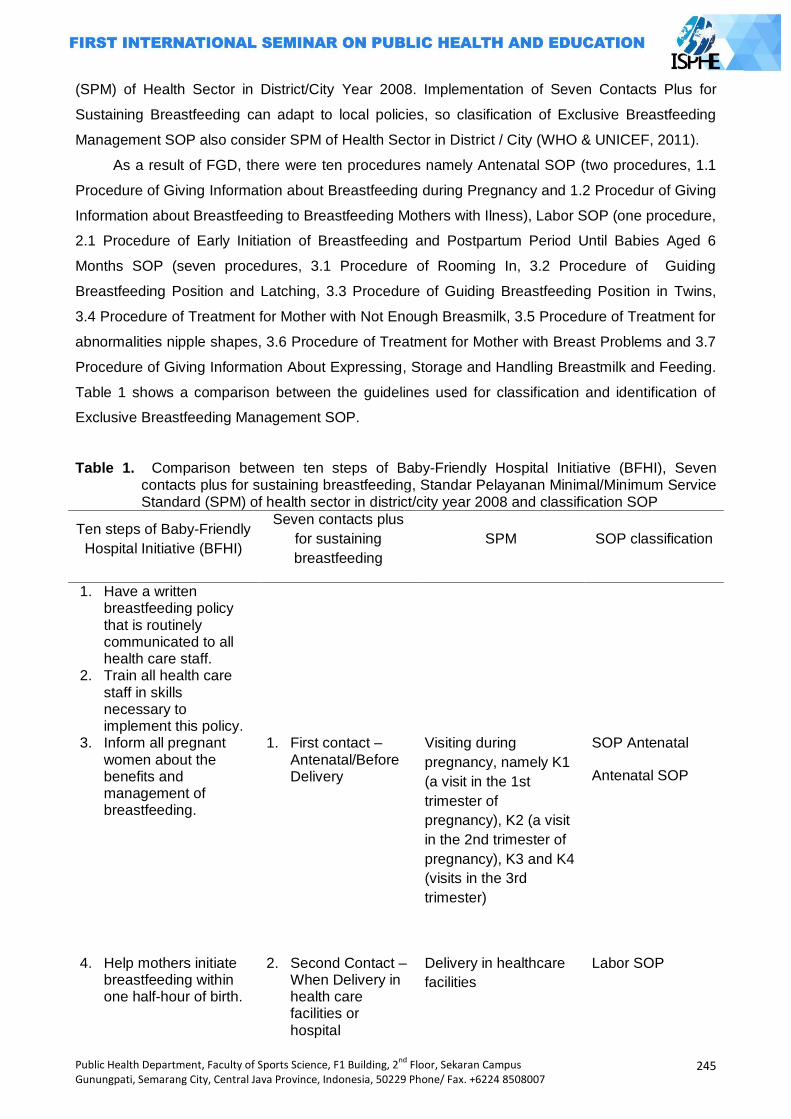
Public Health Department, Faculty of Sports Science, F1 Building, 2nd
Floor, Sekaran Campus Gunungpati, Semarang City, Central Java Province, Indonesia, 50229 Phone/ Fax. +6224 8508007
245
(SPM) of Health Sector in District/City Year 2008. Implementation of Seven Contacts Plus for
Sustaining Breastfeeding can adapt to local policies, so clasification of Exclusive Breastfeeding
Management SOP also consider SPM of Health Sector in District / City (WHO & UNICEF, 2011).
As a result of FGD, there were ten procedures namely Antenatal SOP (two procedures, 1.1
Procedure of Giving Information about Breastfeeding during Pregnancy and 1.2 Procedur of Giving
Information about Breastfeeding to Breastfeeding Mothers with Ilness), Labor SOP (one procedure,
2.1 Procedure of Early Initiation of Breastfeeding and Postpartum Period Until Babies Aged 6
Months SOP (seven procedures, 3.1 Procedure of Rooming In, 3.2 Procedure of Guiding
Breastfeeding Position and Latching, 3.3 Procedure of Guiding Breastfeeding Position in Twins,
3.4 Procedure of Treatment for Mother with Not Enough Breasmilk, 3.5 Procedure of Treatment for
abnormalities nipple shapes, 3.6 Procedure of Treatment for Mother with Breast Problems and 3.7
Procedure of Giving Information About Expressing, Storage and Handling Breastmilk and Feeding.
Table 1 shows a comparison between the guidelines used for classification and identification of
Exclusive Breastfeeding Management SOP.
Table 1. Comparison between ten steps of Baby-Friendly Hospital Initiative (BFHI), Seven contacts plus for sustaining breastfeeding, Standar Pelayanan Minimal/Minimum Service Standard (SPM) of health sector in district/city year 2008 and classification SOP
Ten steps of Baby-Friendly
Hospital Initiative (BFHI)
Seven contacts plus
for sustaining
breastfeeding
SPM SOP classification
1. Have a written breastfeeding policy that is routinely communicated to all health care staff.
2. Train all health care staff in skills necessary to implement this policy.
3. Inform all pregnant women about the benefits and management of breastfeeding.
1. First contact – Antenatal/Before Delivery
Visiting during
pregnancy, namely K1
(a visit in the 1st
trimester of
pregnancy), K2 (a visit
in the 2nd trimester of
pregnancy), K3 and K4
(visits in the 3rd
trimester)
SOP Antenatal
Antenatal SOP
4. Help mothers initiate breastfeeding within one half-hour of birth.
2. Second Contact – When Delivery in health care facilities or hospital
Delivery in healthcare
facilities
Labor SOP
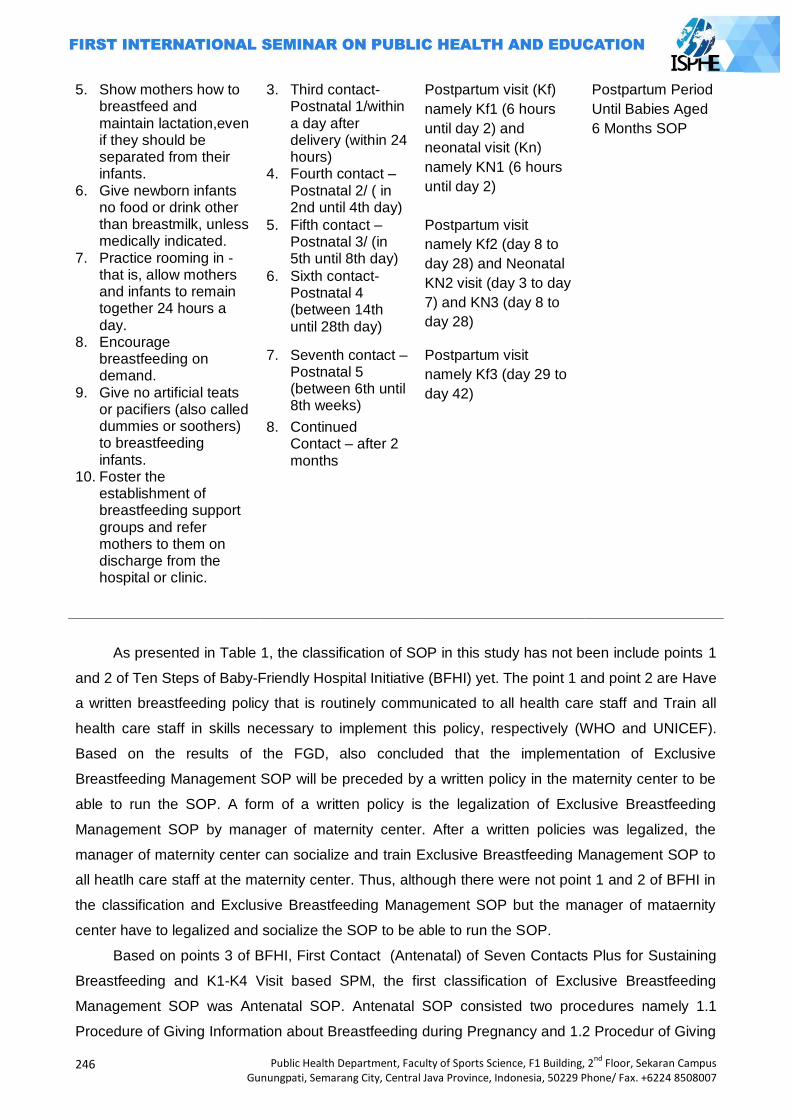
246
Public Health Department, Faculty of Sports Science, F1 Building, 2nd
Floor, Sekaran Campus Gunungpati, Semarang City, Central Java Province, Indonesia, 50229 Phone/ Fax. +6224 8508007
5. Show mothers how to breastfeed and maintain lactation,even if they should be separated from their infants.
6. Give newborn infants no food or drink other than breastmilk, unless medically indicated.
7. Practice rooming in - that is, allow mothers and infants to remain together 24 hours a day.
8. Encourage breastfeeding on demand.
9. Give no artificial teats or pacifiers (also called dummies or soothers) to breastfeeding infants.
10. Foster the establishment of breastfeeding support groups and refer mothers to them on discharge from the hospital or clinic.
3. Third contact- Postnatal 1/within a day after delivery (within 24 hours)
4. Fourth contact – Postnatal 2/ ( in 2nd until 4th day)
Postpartum visit (Kf)
namely Kf1 (6 hours
until day 2) and
neonatal visit (Kn)
namely KN1 (6 hours
until day 2)
Postpartum Period
Until Babies Aged
6 Months SOP
5. Fifth contact – Postnatal 3/ (in 5th until 8th day)
Postpartum visit
namely Kf2 (day 8 to
day 28) and Neonatal
KN2 visit (day 3 to day
7) and KN3 (day 8 to
day 28)
6. Sixth contact- Postnatal 4 (between 14th until 28th day)
7. Seventh contact – Postnatal 5 (between 6th until 8th weeks)
Postpartum visit
namely Kf3 (day 29 to
day 42)
8. Continued Contact – after 2 months
As presented in Table 1, the classification of SOP in this study has not been include points 1
and 2 of Ten Steps of Baby-Friendly Hospital Initiative (BFHI) yet. The point 1 and point 2 are Have
a written breastfeeding policy that is routinely communicated to all health care staff and Train all
health care staff in skills necessary to implement this policy, respectively (WHO and UNICEF).
Based on the results of the FGD, also concluded that the implementation of Exclusive
Breastfeeding Management SOP will be preceded by a written policy in the maternity center to be
able to run the SOP. A form of a written policy is the legalization of Exclusive Breastfeeding
Management SOP by manager of maternity center. After a written policies was legalized, the
manager of maternity center can socialize and train Exclusive Breastfeeding Management SOP to
all heatlh care staff at the maternity center. Thus, although there were not point 1 and 2 of BFHI in
the classification and Exclusive Breastfeeding Management SOP but the manager of mataernity
center have to legalized and socialize the SOP to be able to run the SOP.
Based on points 3 of BFHI, First Contact (Antenatal) of Seven Contacts Plus for Sustaining
Breastfeeding and K1-K4 Visit based SPM, the first classification of Exclusive Breastfeeding
Management SOP was Antenatal SOP. Antenatal SOP consisted two procedures namely 1.1
Procedure of Giving Information about Breastfeeding during Pregnancy and 1.2 Procedur of Giving
Public Health Department, Faculty of Sports Science, F1 Building, 2nd
Floor, Sekaran Campus Gunungpati, Semarang City, Central Java Province, Indonesia, 50229 Phone/ Fax. +6224 8508007
247
Information about Breastfeeding to Breastfeeding Mothers with Ilness. Basically, Antenatal SOP
contained about how to giving information for pregnant women about breastfeeding. Especially for
Procedure 1.2, the procedure was a guiding to give information to pregnant women who suffer
from certain diseases. The information needs to be delivered to pregnant women earlier (during
pregnancy). As a result, the pregnant women can prepare herself and take the best decision for
herself and her baby, for example information for mothers with HIV / AIDS (WHO & UNICEF, 2011)
Procedure 1.1 was divided into 3 parts, namely first and second visit (K1 and K2), third visit (K3)
and fourth visit (K4).
Point 4 of BFHI and Second Contact (when delivery in health care facilities) on Seven
Contacts Plus for Sustaining Breastfeeding could be done by Procedure of Early Initiation of
Breastfeeding. Based on Government Regulation, PP RI Number 33 Year 2012, Article 9 states
that health workers in health care facilities are required to do Early Initiation of Breastfeeding.
Although the SPM does not mention the obligation to implement Early Initiation of Breastfeeding,
health worker have to implemented Early Initiation of Breasfeeding based on the Government
Regulation. Because of that, Procedure of Early Initiation of Breastfeeding is important to be part of
Exclusive Breastfeeding Management SOP.
While, Point 5 of BFHI, third contact 3 to continued contact on Seven Contacts Plus For
Sustaining Breastfeeding can be implemented in postpartum visits and neonatal visits in
accordance with SPM. Because of that, the classification SOP of Exclusive Breastfeeding
Management SOP, there was Postpartum Period Until Babies Aged 6 Months SOP. In the SOP,
there were 7 Procedures, namely 3.1 Procedure of Rooming In, 3.2 Procedure of Guiding
Breastfeeding Position and Latching, 3.3 Procedure of Guiding Breastfeeding Position in Twins,
3.4 Procedure of Treatment for Mother with Not Enough Breasmilk, 3.5 Procedure of Treatment for
abnormalities nipple shapes, 3.6 Procedure of Treatment for Mother with Breast Problems and 3.7
Procedure of Giving Information About Expressing, Storage and Handling Breastmilk and Feeding.
A drawback of postpartum and neonatal visits in SPM is the postpartum visits (Kf3) only until 42
day and neonatal visit (KN3) is up to the 28 day. The others visit which allows contact between
health workers with the mother and baby after KN3 during exclusive breastfeeding is the five basic
immunization (Lima Imunisasi Dasar Lengkap-LIL) schedule. The LIL schedule is obligated by the
Government of Indonesia. The immunization namely DPT/HB 1 and Polio 2 when the baby is 2
months old, DPT/HB 2 and Polio when the baby is 3 months and DPT/HB3 and Polio 4 when the
baby is 4 months old. After the 4th month, the possibility of contact between health workers and
mothers also babies is smaller. It is because of the next schedule of immunization is at the age of 9
months old (measles immunization) (Kemenkes 2011). While the Exclusive Breastfeeding
Management SOP is not using the LIL schedule although some procedures can be performed
when the baby is immunized.
Contain of procedures was made by references such as American Academy of Pediatrics,
Clinical Protocol from Aademy Breastfeeding Medicine, Modul for Lactation Counseling Training
248
Public Health Department, Faculty of Sports Science, F1 Building, 2nd
Floor, Sekaran Campus Gunungpati, Semarang City, Central Java Province, Indonesia, 50229 Phone/ Fax. +6224 8508007
from WHO and UNICEF, Modul for Lactation Science and Breastfeeding Management Training
from Indonesian IBCLC Assosiacion, Indonesia Menyusui and www.ncbi.ca.
Closing
Conclusion of this research were ten procedures namely Antenatal SOP (two procedures,
1.1 Procedure of Giving Information about Breastfeeding during Pregnancy and 1.2 Procedur of
Giving Information about Breastfeeding to Breastfeeding Mothers with Ilness), Labor SOP (one
procedure, 2.1 Procedure of Early Initiation of Breastfeeding and Postpartum Period Until Babies
Aged 6 Months SOP (seven procedures, 3.1 Procedure of Rooming In, 3.2 Procedure of Guiding
Breastfeeding Position and Latching, 3.3 Procedure of Guiding Breastfeeding Position in Twins,
3.4 Procedure of Treatment for Mother with Not Enough Breasmilk, 3.5 Procedure of Treatment for
abnormalities nipple shapes, 3.6 Procedure of Treatment for Mother with Breast Problems and 3.7
Procedure of Giving Information About Expressing, Storage and Handling Breastmilk and Feeding.
Recommendation of this research is before the implementation of the SOP, validation,
revison, sosialization, trial, evaluation and revision after evaluation is needed.
References
Afifah, DN. 2007. Faktor Yang Berperan Dalam Kegagalan Praktik Pemberian ASI Eksklusif (Studi Kualitatif di Kecamatan Tembalang, Kota Semarang Tahun 2007). Tesis. Program Pascasarjana Universitas Diponegoro.
BPS dan Marco International. 2007. Survei Demografi dan Kesehatan Indonesia 2007. Calverton. Maryland, USA: BPS dan Marco International, disitasi oleh Widodo, Yekti. 2011. Cakupan Pemberian ASI Eksklusif : Akurasi dan Interpretasi Data Survey dan Laporan Program. Gizi Indonesia 2011, 34(2) pages 101-108
Cattaneo, A., Buzzetti, R. 2001. Effect on Rates of Breast Feeding of Training For The Baby
Friendly Hospital Initiative. BMJ Vol 23, pages 1358-1361 Creswell, JW. 2010. Research Design, Pendekatan Kualitatif, Kuantitatif dan Mixed. Yogyakarta :
Pustaka Pelajar Depkes RI. 2004. Petunjuk Teknis Standar Pelayanan Minimal (SPM) Penyelenggaraan Perbaikan
Gizi Masyarakat. Jakarta Esterik, P. 1990. Dibalik Kontroversi ASI-Susu Formula. Jakarta: Yasayan Obor Indonesia. Hegar, B. 2010. Nilai Menyusui Dalam Suradi, R et al, eds. IDAI. Indonesia Menyusui. Jakarta:
Badan Penerbit IDAI, pages 1-12 Indonesia, R. 2010. Laporan Pencapaian Tujuan Pembangunan Milenium Indonesia 2010.
Kementerian Perencanaan Pembangunan Nasional /Badan Perencanaan Pembangunan Nasional (BAPPENAS). Jakarta
Kemenkes RI. 2011. Buku Kesehatan Ibu dan Anak. http://www.depkes.go.id/downloads/jica/kia.pdf diunduh tanggal 12 November 2013
Kemenkes RI. 2012a. Petunjuk Pelaksanaan Surveilans Gizi. Jakarta Kemenkes RI. 2012b. Profil Data Kesehatan Indonesia 2011. Jakarta
Keputusan Menteri Kesehatan RI Nomor 828/Menkes/SK/IX/2008 Tentang Petunjuk Teknis Standar Pelayanan Minimal Bidang Kesehatan Di Kabupaten/Kota
Luzia, M. G. B., Elsa R. J. G., Maria E. M. S.,et al. 2003. Evaluation of the Impact of the Baby-Friendly Hospital Initiative on Rates of Breasfeeding. American Journal of Public Health.
August 2003, Vol 93, No. 8, pages1277-1279. Partiwi, IGAN. 2010. Revitalisasi Rumah Sakit Sayang Bayi Dalam Suradi, R et al, eds. IDAI.
Indonesia Menyusui. Jakarta : Badan Penerbit IDAI pages 25-37.
Public Health Department, Faculty of Sports Science, F1 Building, 2nd
Floor, Sekaran Campus Gunungpati, Semarang City, Central Java Province, Indonesia, 50229 Phone/ Fax. +6224 8508007
249
Peraturan Pemerintah Republik Indonesia (PP RI) Nomor 33 Tahun 2012 Tentang Pemberian Air Susu Ibu Eksklusif
Riskesdas. 2010. Riset Kesehatan Dasar 2010. Badan Penelitian Dan Pengembangan Kesehatan Kementerian Kesehatan RI. Jakarta
WHO & UNICEF. 2011. Pelatihan Konseling Menyusui Modul 40 Jam WHO/UNICEF WHO & UNICEF. Melindungi, Meningkatkan dan Mendukung Menyusui, Peran Khusus Terhadap
Pelayanan Kesehatan Ibu Hamil dan Menyusui (Pernyataan Bersama WHO/UNICEF).. Tangerang: Binarupa Aksara Publisher
250
Public Health Department, Faculty of Sports Science, F1 Building, 2nd
Floor, Sekaran Campus Gunungpati, Semarang City, Central Java Province, Indonesia, 50229 Phone/ Fax. +6224 8508007
ORAL CONTRACEPTIVE IN HPV INFECTED WOMEN AND THE RISK OF CERVICAL NEOPLASIA
Vitri Widyaningsih
Sebelas Maret University, Indonesia
Corresponding Author: [email protected]
Abstract
Introduction: Cervical Intraepithelial Neoplasia grade III (CIN-3) is a potential pre-malignant lesion of cervical cancer. Human Papilloma Virus (HPV) infection had been reported as necessary but not sufficient cause of cervical neoplasia. This review aim to systematically evaluate the evidence on the use of oral contraceptive (OC) in HPV infected women and the development of CIN-3 and the possible biological mechanism involved. Methods: Using PUBMED, 28 relevant articles were identified. Twenty one studies were excluded and seven studies were included in the systematic review. Results: All analytic studies showed no significant association between OC use and cervical neoplasia on HPV positive women with inconsistent finding of Odds Ratio (OR) ranging from 0.61 through1.5. When stratified by duration, OC use of more than 10 years showed to significantly increase risk of cervical neoplasia on two case control studies (OR 2.06-4.03) but showed no significant association on cohort study (OR 0.97). There is no conclusive evidence on the effect of OC use on the progression of cervical neoplasia in HIV infected women. Further studies are needed to better evaluate the association. Key Words: Oral contraceptive, HPV, Cervical Neoplasia
Introduction
Cancer is the leading cause of death in developed country and second cause of leading
death in developing countries(Ferlay et al., 2010). Furthermore, cancer also caused significant
age-adjusted disability-adjusted life-years (DALYs). In 2008 It was estimated that cancer caused
169.3 million years loss of healthy life (Soerjomataram et al., 2012). Developing countries have
increasing burden of cancer due to the aging population, and adoption of cancer associated
lifestyle choices including smoking, physical inactivity, and westernized diet. Cervical cancer is the
third most commonly diagnosed cancer and the fourth leading cause of cancer death in females
worldwide, especially in developing regions of Asia and Africa (Jemal et al., 2011). In Indonesia,
cancer is the fifth leading cause of death, with a total prevalence of 0.4% (Depkes RI, 2007) and
cervical cancer is the second most commonly found cancer in women after breast cancer(IARC,
2010). There are two types of cervical cancer, the most commonly found squamous cell carcinoma
(80-90%), and adenocarcinoma.
One important etiologic factor of cervical cancer is Human Papilloma Virus (HPV) infection,
and has been considered as necessary but not sufficient cause of squamous cell carcinoma of the
cervix(Muñoz et al., 2006; Petry, 2014). HPV infection is common in women. Previous study
conducted in 157.879 women with normal cervical cytology estimated a world prevalence of 10·4%
(95% CI 10·2–10·7) of HPV infection, and women younger than 35 years are at higher risk of
Public Health Department, Faculty of Sports Science, F1 Building, 2nd
Floor, Sekaran Campus Gunungpati, Semarang City, Central Java Province, Indonesia, 50229 Phone/ Fax. +6224 8508007
251
infection compared to other age groups(de Sanjosé et al., 2007). Although most HPV infection
conversed into negative after 2 years, but approximately 10-20% of women remained infected and
have higher probability to progress Cervical intraepithelial Neoplasia (CIN) which is a pre-
malignant lesion of cervical cancer (Castellsagué, 2008; Stanley, 2010).
Around 30-40% of CIN can developed into Invasive Cancer of the Cervix (ICC) through
stages from CIN-1 to CIN-3 (Stanley, 2010). Several factors such as HPV types, parity, marital
status, and age have been identified as factors influencing the progression of HPV infection into
cervical neoplasia. Approximately 70% of cervical cancer were related HPV 16 or HPV 18 ( 55%
and 15% respectively), while additional 18% of cervical cancer cases were associated with HPV31,
33, 35, 45, 52 and 58(Smith et al., 2007). Other factors have also been studied, including oral
contraceptive use. Oral contraceptive contain sex steroid hormone, either progesterone only or
combined oral contraceptive which contain both estrogen and progesterone. In 2010, 63.2%
(95%CI 60.4 through 66.0) of reproductive age women use various methods of contraception. This
is higher than in 1990s where only 54.8% (95%CI 52.3 through 57.1) of women of reproductive age
use contraception (Alkema et al., 2013) with 14% of them use oral contraception (Biddlecom and
Kantorova, 2013). Several studies have looked into the effect of oral contraception on the
progression of cervical neoplasia, either the low grade Squamous Intra-epithelial Lesion (LSIL) or
CIN-1 or the High Grade Intra Epithelial Lesion (HSIL) which consist of CIN-2 (mild dysplasia) or
CIN-3 (severe dysplasia and Carcinoma In Situ) before developing into Invasive Cervical Cancer or
ICC. This systematic review will focus on oral contraceptive use as a modifying factor in the
development of HPV infection to CIN-3 as a pre-cancerous lesion of cervical cancer.
Methods
This is a systematic literature review on the effect of oral contraceptive use in the
progression from HPV infection to Cervical Intra-epithelial Neoplasia which is the pre-malignant
lesion of cervical cancer. A literature search was conducted in March 2013 in PUBMED, and
additional search on web of science, EBSCO, and google scholar in English and Indonesian. The
terms ―cervical cancer‖, ―cervical neoplasia‖, ―cervical neoplasia grade III‖, ―CIN-3‖, ―CIN-III‖, and
―HSIL‖ or ―High Grade Intra Epithelial Lesion‖was combined with ―oral contraceptive‖, ―oral
contraception‖, ―Human Papilloma Virus‖ and ―HPV‖, as well as ―HPV infection‖, HPV infected
women‖, ―HPV positive‖. Search terms include MeSH. Further search were conducted by reviewing
relevant articles in the bibliographic of the articles that have been identified.
Inclusion criteria for the studies are 1) analytical study with cohort or case control design, 2)
conducted in HPV positive women, 3) measures Cervical Intra-epithelial Neoplasia (CIN-3) as
outcome of interest. Only studies with prospective cohort, population based case control and
hospital based case control design were included because the longitudinal nature of this review,
which elaborating the modifying effect of oral contraceptive use in the development of cervical
intra-epithelial neoplasia in HPV infected women. Only studies which determine HPV infection
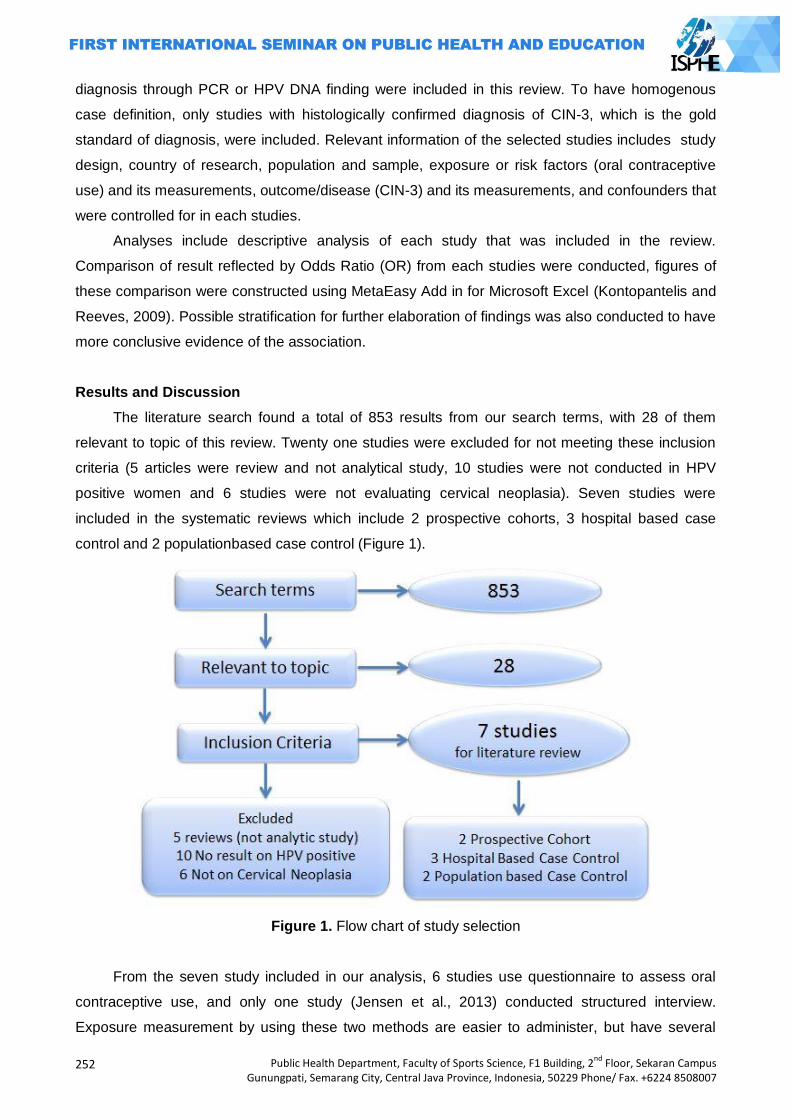
252
Public Health Department, Faculty of Sports Science, F1 Building, 2nd
Floor, Sekaran Campus Gunungpati, Semarang City, Central Java Province, Indonesia, 50229 Phone/ Fax. +6224 8508007
diagnosis through PCR or HPV DNA finding were included in this review. To have homogenous
case definition, only studies with histologically confirmed diagnosis of CIN-3, which is the gold
standard of diagnosis, were included. Relevant information of the selected studies includes study
design, country of research, population and sample, exposure or risk factors (oral contraceptive
use) and its measurements, outcome/disease (CIN-3) and its measurements, and confounders that
were controlled for in each studies.
Analyses include descriptive analysis of each study that was included in the review.
Comparison of result reflected by Odds Ratio (OR) from each studies were conducted, figures of
these comparison were constructed using MetaEasy Add in for Microsoft Excel (Kontopantelis and
Reeves, 2009). Possible stratification for further elaboration of findings was also conducted to have
more conclusive evidence of the association.
Results and Discussion
The literature search found a total of 853 results from our search terms, with 28 of them
relevant to topic of this review. Twenty one studies were excluded for not meeting these inclusion
criteria (5 articles were review and not analytical study, 10 studies were not conducted in HPV
positive women and 6 studies were not evaluating cervical neoplasia). Seven studies were
included in the systematic reviews which include 2 prospective cohorts, 3 hospital based case
control and 2 populationbased case control (Figure 1).
Figure 1. Flow chart of study selection
From the seven study included in our analysis, 6 studies use questionnaire to assess oral
contraceptive use, and only one study (Jensen et al., 2013) conducted structured interview.
Exposure measurement by using these two methods are easier to administer, but have several
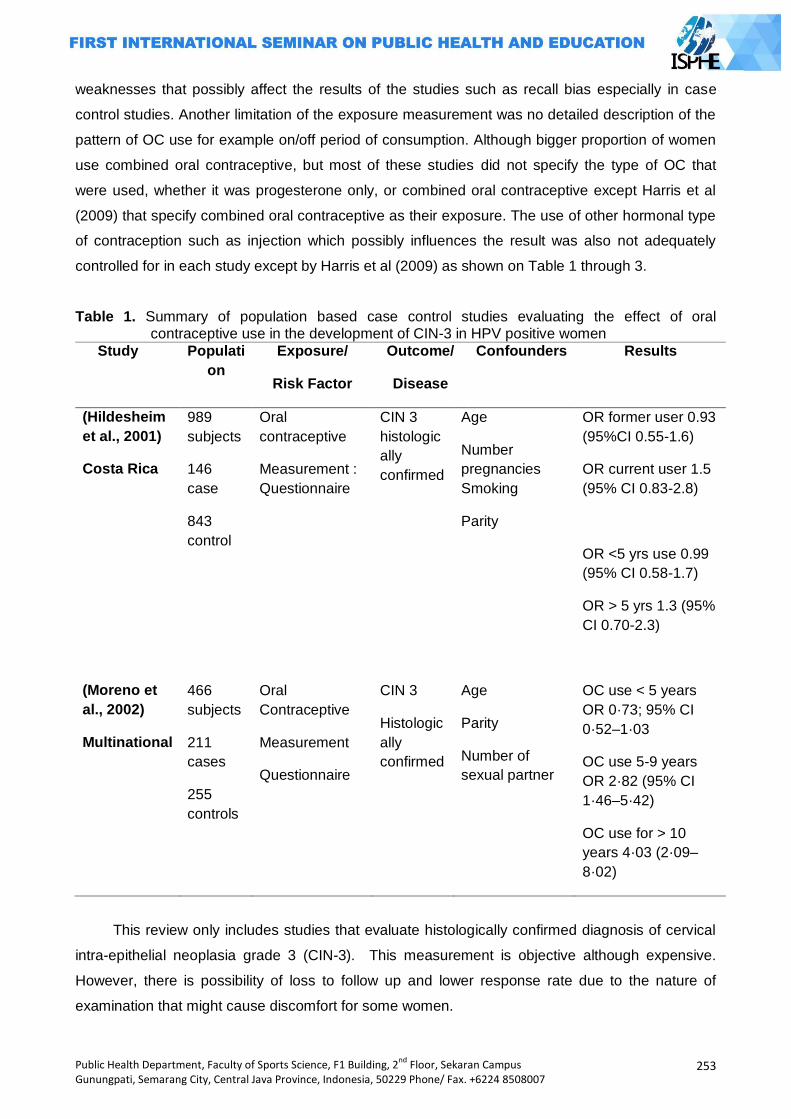
Public Health Department, Faculty of Sports Science, F1 Building, 2nd
Floor, Sekaran Campus Gunungpati, Semarang City, Central Java Province, Indonesia, 50229 Phone/ Fax. +6224 8508007
253
weaknesses that possibly affect the results of the studies such as recall bias especially in case
control studies. Another limitation of the exposure measurement was no detailed description of the
pattern of OC use for example on/off period of consumption. Although bigger proportion of women
use combined oral contraceptive, but most of these studies did not specify the type of OC that
were used, whether it was progesterone only, or combined oral contraceptive except Harris et al
(2009) that specify combined oral contraceptive as their exposure. The use of other hormonal type
of contraception such as injection which possibly influences the result was also not adequately
controlled for in each study except by Harris et al (2009) as shown on Table 1 through 3.
Table 1. Summary of population based case control studies evaluating the effect of oral contraceptive use in the development of CIN-3 in HPV positive women
Study Populati
on
Exposure/
Risk Factor
Outcome/
Disease
Confounders Results
(Hildesheim
et al., 2001)
Costa Rica
989
subjects
146
case
843
control
Oral
contraceptive
Measurement :
Questionnaire
CIN 3
histologic
ally
confirmed
Age
Number
pregnancies
Smoking
Parity
OR former user 0.93
(95%CI 0.55-1.6)
OR current user 1.5
(95% CI 0.83-2.8)
OR <5 yrs use 0.99
(95% CI 0.58-1.7)
OR > 5 yrs 1.3 (95%
CI 0.70-2.3)
(Moreno et
al., 2002)
Multinational
466
subjects
211
cases
255
controls
Oral
Contraceptive
Measurement
Questionnaire
CIN 3
Histologic
ally
confirmed
Age
Parity
Number of
sexual partner
OC use < 5 years
OR 0·73; 95% CI
0·52–1·03
OC use 5-9 years
OR 2·82 (95% CI
1·46–5·42)
OC use for > 10
years 4·03 (2·09–
8·02)
This review only includes studies that evaluate histologically confirmed diagnosis of cervical
intra-epithelial neoplasia grade 3 (CIN-3). This measurement is objective although expensive.
However, there is possibility of loss to follow up and lower response rate due to the nature of
examination that might cause discomfort for some women.
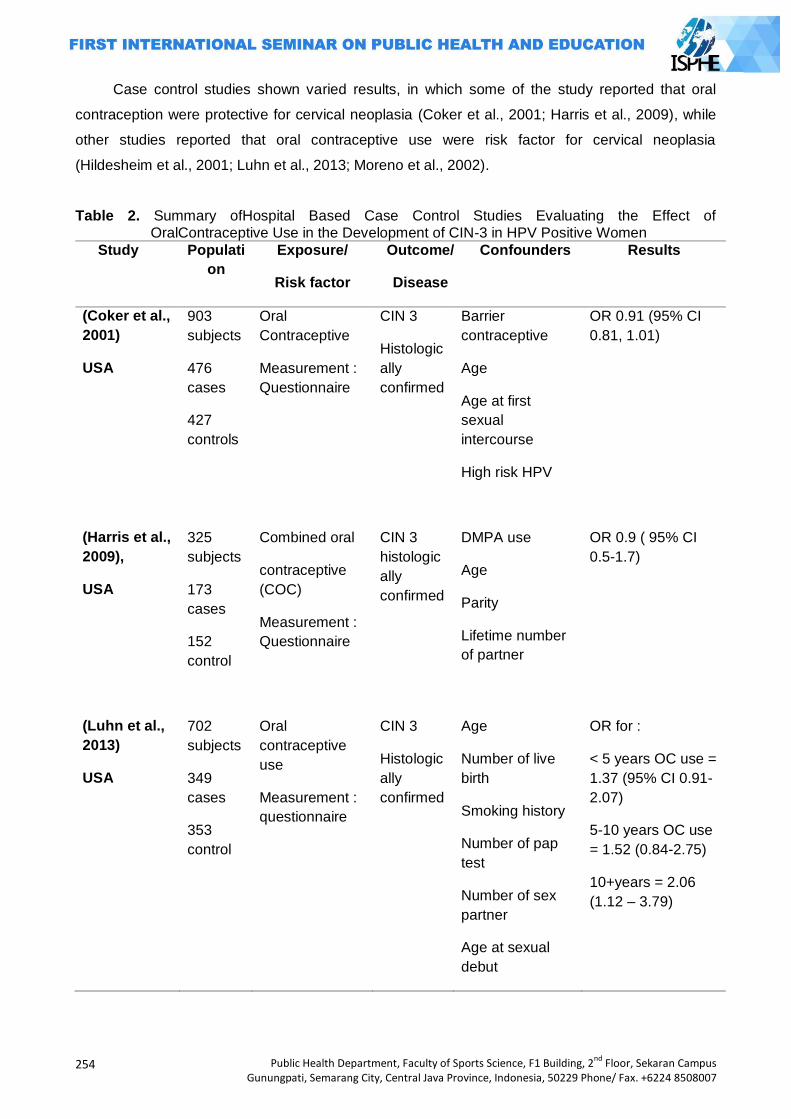
254
Public Health Department, Faculty of Sports Science, F1 Building, 2nd
Floor, Sekaran Campus Gunungpati, Semarang City, Central Java Province, Indonesia, 50229 Phone/ Fax. +6224 8508007
Case control studies shown varied results, in which some of the study reported that oral
contraception were protective for cervical neoplasia (Coker et al., 2001; Harris et al., 2009), while
other studies reported that oral contraceptive use were risk factor for cervical neoplasia
(Hildesheim et al., 2001; Luhn et al., 2013; Moreno et al., 2002).
Table 2. Summary ofHospital Based Case Control Studies Evaluating the Effect of OralContraceptive Use in the Development of CIN-3 in HPV Positive Women
Study Populati
on
Exposure/
Risk factor
Outcome/
Disease
Confounders Results
(Coker et al.,
2001)
USA
903
subjects
476
cases
427
controls
Oral
Contraceptive
Measurement :
Questionnaire
CIN 3
Histologic
ally
confirmed
Barrier
contraceptive
Age
Age at first
sexual
intercourse
High risk HPV
OR 0.91 (95% CI
0.81, 1.01)
(Harris et al.,
2009),
USA
325
subjects
173
cases
152
control
Combined oral
contraceptive
(COC)
Measurement :
Questionnaire
CIN 3
histologic
ally
confirmed
DMPA use
Age
Parity
Lifetime number
of partner
OR 0.9 ( 95% CI
0.5-1.7)
(Luhn et al.,
2013)
USA
702
subjects
349
cases
353
control
Oral
contraceptive
use
Measurement :
questionnaire
CIN 3
Histologic
ally
confirmed
Age
Number of live
birth
Smoking history
Number of pap
test
Number of sex
partner
Age at sexual
debut
OR for :
< 5 years OC use =
1.37 (95% CI 0.91-
2.07)
5-10 years OC use
= 1.52 (0.84-2.75)
10+years = 2.06
(1.12 – 3.79)
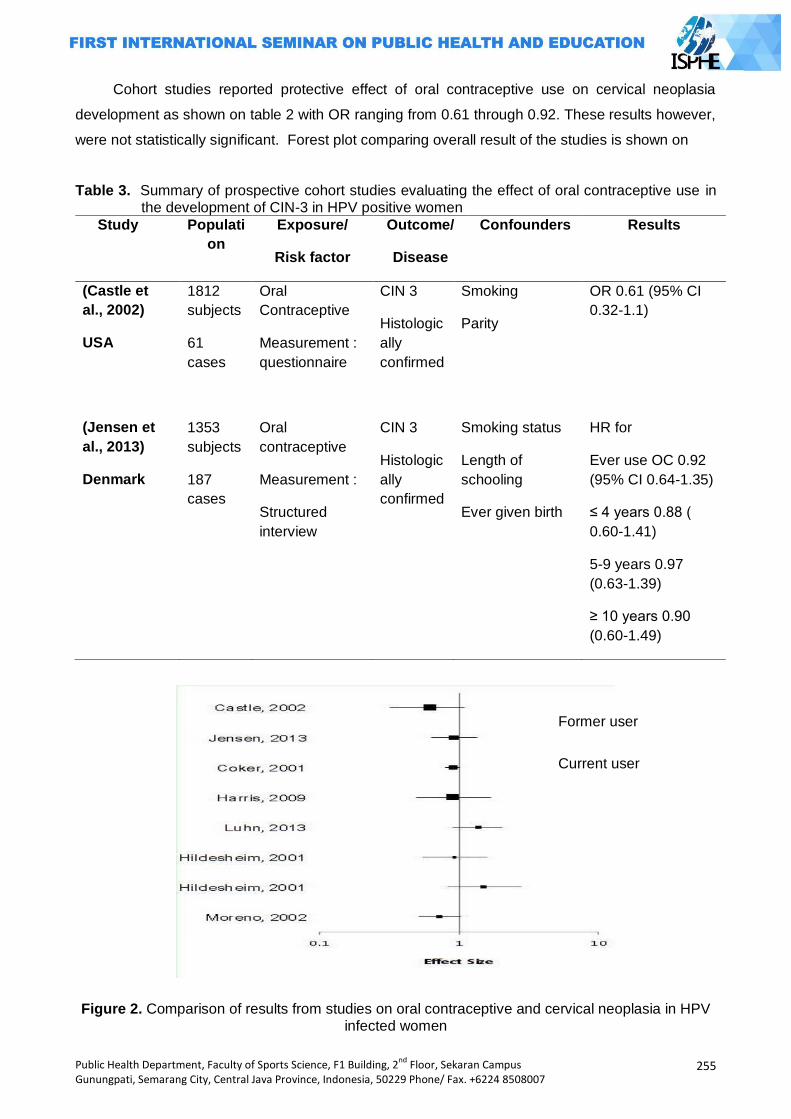
Public Health Department, Faculty of Sports Science, F1 Building, 2nd
Floor, Sekaran Campus Gunungpati, Semarang City, Central Java Province, Indonesia, 50229 Phone/ Fax. +6224 8508007
255
Cohort studies reported protective effect of oral contraceptive use on cervical neoplasia
development as shown on table 2 with OR ranging from 0.61 through 0.92. These results however,
were not statistically significant. Forest plot comparing overall result of the studies is shown on
Table 3. Summary of prospective cohort studies evaluating the effect of oral contraceptive use in the development of CIN-3 in HPV positive women
Study Populati
on
Exposure/
Risk factor
Outcome/
Disease
Confounders Results
(Castle et
al., 2002)
USA
1812
subjects
61
cases
Oral
Contraceptive
Measurement :
questionnaire
CIN 3
Histologic
ally
confirmed
Smoking
Parity
OR 0.61 (95% CI
0.32-1.1)
(Jensen et
al., 2013)
Denmark
1353
subjects
187
cases
Oral
contraceptive
Measurement :
Structured
interview
CIN 3
Histologic
ally
confirmed
Smoking status
Length of
schooling
Ever given birth
HR for
Ever use OC 0.92
(95% CI 0.64-1.35)
≤ 4 years 0.88 (
0.60-1.41)
5-9 years 0.97
(0.63-1.39)
≥ 10 years 0.90
(0.60-1.49)
Figure 2. Comparison of results from studies on oral contraceptive and cervical neoplasia in HPV infected women
Former user
Current user
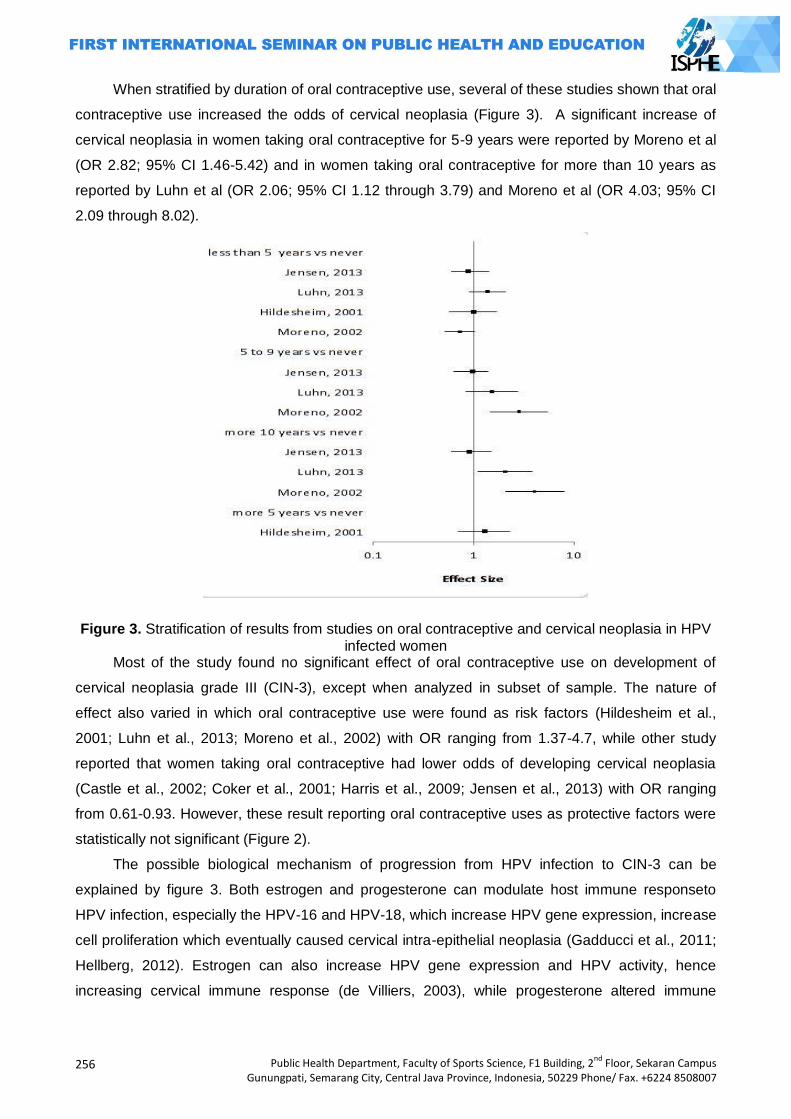
256
Public Health Department, Faculty of Sports Science, F1 Building, 2nd
Floor, Sekaran Campus Gunungpati, Semarang City, Central Java Province, Indonesia, 50229 Phone/ Fax. +6224 8508007
When stratified by duration of oral contraceptive use, several of these studies shown that oral
contraceptive use increased the odds of cervical neoplasia (Figure 3). A significant increase of
cervical neoplasia in women taking oral contraceptive for 5-9 years were reported by Moreno et al
(OR 2.82; 95% CI 1.46-5.42) and in women taking oral contraceptive for more than 10 years as
reported by Luhn et al (OR 2.06; 95% CI 1.12 through 3.79) and Moreno et al (OR 4.03; 95% CI
2.09 through 8.02).
Figure 3. Stratification of results from studies on oral contraceptive and cervical neoplasia in HPV infected women
Most of the study found no significant effect of oral contraceptive use on development of
cervical neoplasia grade III (CIN-3), except when analyzed in subset of sample. The nature of
effect also varied in which oral contraceptive use were found as risk factors (Hildesheim et al.,
2001; Luhn et al., 2013; Moreno et al., 2002) with OR ranging from 1.37-4.7, while other study
reported that women taking oral contraceptive had lower odds of developing cervical neoplasia
(Castle et al., 2002; Coker et al., 2001; Harris et al., 2009; Jensen et al., 2013) with OR ranging
from 0.61-0.93. However, these result reporting oral contraceptive uses as protective factors were
statistically not significant (Figure 2).
The possible biological mechanism of progression from HPV infection to CIN-3 can be
explained by figure 3. Both estrogen and progesterone can modulate host immune responseto
HPV infection, especially the HPV-16 and HPV-18, which increase HPV gene expression, increase
cell proliferation which eventually caused cervical intra-epithelial neoplasia (Gadducci et al., 2011;
Hellberg, 2012). Estrogen can also increase HPV gene expression and HPV activity, hence
increasing cervical immune response (de Villiers, 2003), while progesterone altered immune
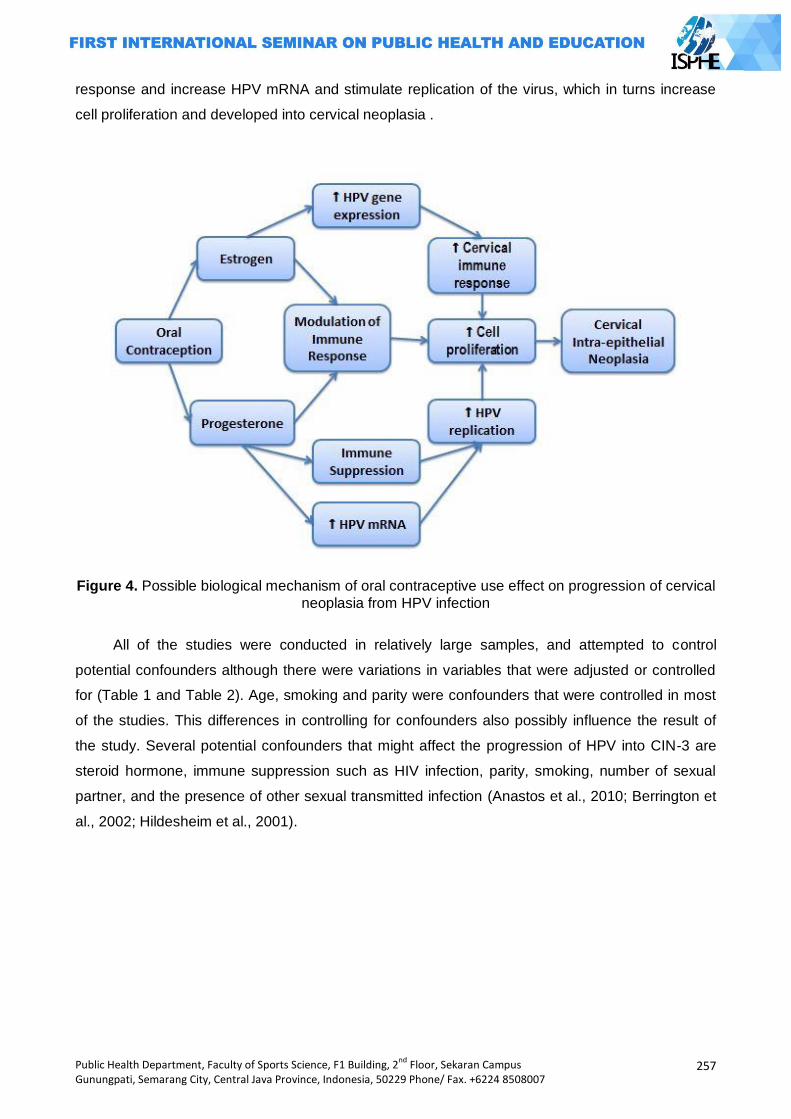
Public Health Department, Faculty of Sports Science, F1 Building, 2nd
Floor, Sekaran Campus Gunungpati, Semarang City, Central Java Province, Indonesia, 50229 Phone/ Fax. +6224 8508007
257
response and increase HPV mRNA and stimulate replication of the virus, which in turns increase
cell proliferation and developed into cervical neoplasia .
Figure 4. Possible biological mechanism of oral contraceptive use effect on progression of cervical
neoplasia from HPV infection
All of the studies were conducted in relatively large samples, and attempted to control
potential confounders although there were variations in variables that were adjusted or controlled
for (Table 1 and Table 2). Age, smoking and parity were confounders that were controlled in most
of the studies. This differences in controlling for confounders also possibly influence the result of
the study. Several potential confounders that might affect the progression of HPV into CIN-3 are
steroid hormone, immune suppression such as HIV infection, parity, smoking, number of sexual
partner, and the presence of other sexual transmitted infection (Anastos et al., 2010; Berrington et
al., 2002; Hildesheim et al., 2001).
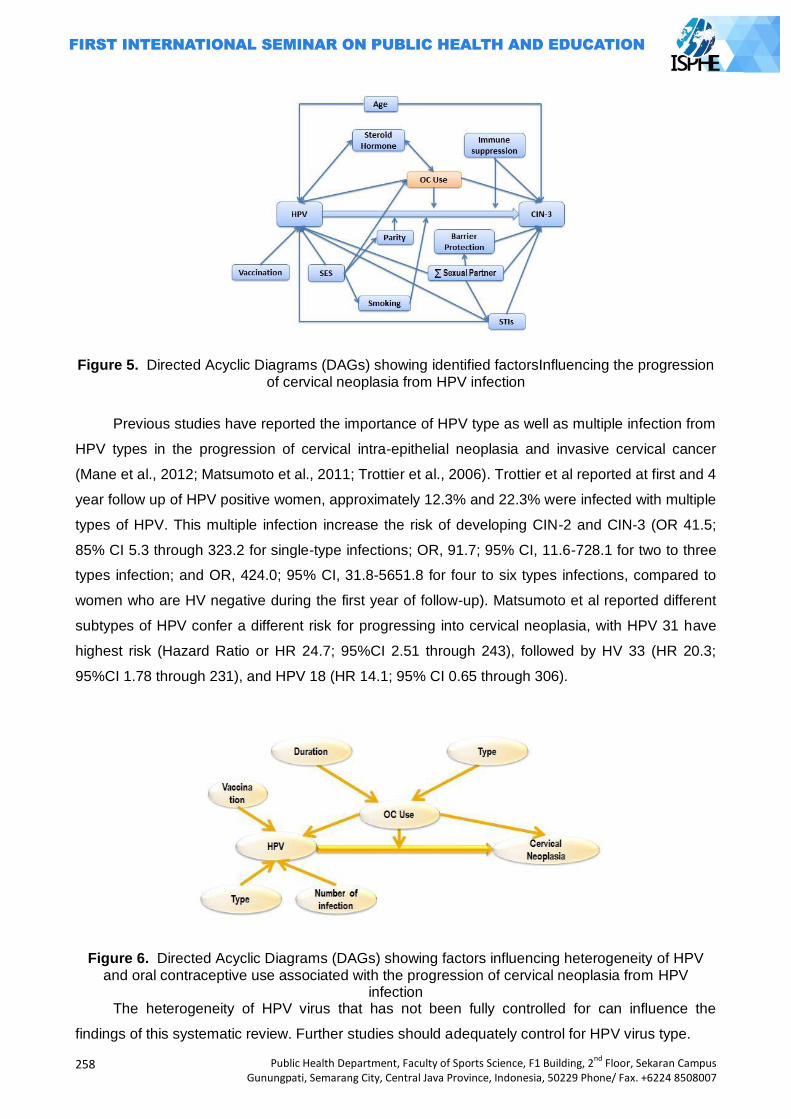
258
Public Health Department, Faculty of Sports Science, F1 Building, 2nd
Floor, Sekaran Campus Gunungpati, Semarang City, Central Java Province, Indonesia, 50229 Phone/ Fax. +6224 8508007
Figure 5. Directed Acyclic Diagrams (DAGs) showing identified factorsInfluencing the progression of cervical neoplasia from HPV infection
Previous studies have reported the importance of HPV type as well as multiple infection from
HPV types in the progression of cervical intra-epithelial neoplasia and invasive cervical cancer
(Mane et al., 2012; Matsumoto et al., 2011; Trottier et al., 2006). Trottier et al reported at first and 4
year follow up of HPV positive women, approximately 12.3% and 22.3% were infected with multiple
types of HPV. This multiple infection increase the risk of developing CIN-2 and CIN-3 (OR 41.5;
85% CI 5.3 through 323.2 for single-type infections; OR, 91.7; 95% CI, 11.6-728.1 for two to three
types infection; and OR, 424.0; 95% CI, 31.8-5651.8 for four to six types infections, compared to
women who are HV negative during the first year of follow-up). Matsumoto et al reported different
subtypes of HPV confer a different risk for progressing into cervical neoplasia, with HPV 31 have
highest risk (Hazard Ratio or HR 24.7; 95%CI 2.51 through 243), followed by HV 33 (HR 20.3;
95%CI 1.78 through 231), and HPV 18 (HR 14.1; 95% CI 0.65 through 306).
Figure 6. Directed Acyclic Diagrams (DAGs) showing factors influencing heterogeneity of HPV and oral contraceptive use associated with the progression of cervical neoplasia from HPV
infection The heterogeneity of HPV virus that has not been fully controlled for can influence the
findings of this systematic review. Further studies should adequately control for HPV virus type.
Public Health Department, Faculty of Sports Science, F1 Building, 2nd
Floor, Sekaran Campus Gunungpati, Semarang City, Central Java Province, Indonesia, 50229 Phone/ Fax. +6224 8508007
259
Closing
There is no conclusive evidence on the effect of oral contraceptive use on the progression of
CIN-3 as pre-malignant lesion of cervical cancer in HPV infected women. However stratified
analysis of two case control studies showed that in women who had taken oral contraception for
more than 10 years, there is significant increase of risk for developing CIN-3, although this result
was not shown on prospective cohort study. Further study is needed. Future study must have
better ascertainment of oral contraceptive use for example using medical records, insurance data
and include detailed description or the type and duration of OC use as well as detailed HPV type to
control for the differences of cervical carcinogenesis in different HPV subtypes. Adequate control of
confounding and studies conducted in different countries which shares more burden of cervical
cancer is also still necessary. Although the evidence is still tentative, women who use oral
contraceptive for more than 10 years should be screened for cervical intra-epithelial neoplasia.
Acknowledgements
I wish to acknowledge Ellen Velie, Ph.D., M.P.H and Zhenzhen Zhang, MPH, PhD for their
advice and assistance in the development of this systematic review.
References
Alkema, L., Kantorova, V., Menozzi, C., Biddlecom, A., 2013. National, regional, and global rates and trends in contraceptive prevalence and unmet need for family planning between 1990 and 2015: a systematic and comprehensive analysis. Lancet 381, 1642–1652. doi:10.1016/S0140-6736(12)62204-1
Anastos, K., Hoover, D.R., Burk, R.D., Cajigas, A., Shi, Q., Singh, D.K., Cohen, M.H., Mutimura, E., Sturgis, C., Banzhaf, W.C., Castle, P.E., 2010. Risk factors for cervical precancer and cancer in HIV-infected, HPV-positive Rwandan women.PloS One 5, e13525. doi:10.1371/journal.pone.0013525
Berrington, A., Jha, P., Peto, J., Green, J., 2002. Oral contraceptives and cervical cancer.The Lancet 360, 410.doi:10.1016/S0140-6736(02)09578-8
Biddlecom, A., Kantorova, V., 2013. Global Trends in Contraceptive Method Mix and Implications for Meeting the Demand for Family Planning [WWW Document]. URL http://www.iussp.org/en/event/17/programme/paper/2885 (accessed 8.10.14).
Castellsagué, X., 2008.Natural history and epidemiology of HPV infection and cervical cancer. Gynecol. Oncol., I International Symposium on Cervical Cancer: Challenging Cervical Cancer 110, S4–S7. doi:10.1016/j.ygyno.2008.07.045
Castle, P.E., Wacholder, S., Lorincz, A.T., Scott, D.R., Sherman, M.E., Glass, A.G., Rush, B.B., Schussler, J.E., Schiffman, M., 2002. A prospective study of high-grade cervical neoplasia risk among human papillomavirus-infected women. J. Natl. Cancer Inst. 94, 1406–1414.
Coker, A.L., Sanders, L.C., Bond, S.M., Gerasimova, T., Pirisi, L., 2001.Hormonal and barrier methods of contraception, oncogenic human papillomaviruses, and cervical squamous intraepithelial lesion development.J. Womens Health Gend.Based Med. 10, 441–449.doi:10.1089/152460901300233911
De Sanjosé, S., Diaz, M., Castellsagué, X., Clifford, G., Bruni, L., Muñoz, N., Bosch, F.X., 2007. Worldwide prevalence and genotype distribution of cervical human papillomavirus DNA in women with normal cytology: a meta-analysis. Lancet Infect. Dis. 7, 453–459. doi:10.1016/S1473-3099(07)70158-5
De Villiers, E.-M., 2003.Relationship between steroid hormone contraceptives and HPV, cervical intraepithelial neoplasia and cervical carcinoma. Int. J. Cancer 103, 705–708. doi:10.1002/ijc.10868
260
Public Health Department, Faculty of Sports Science, F1 Building, 2nd
Floor, Sekaran Campus Gunungpati, Semarang City, Central Java Province, Indonesia, 50229 Phone/ Fax. +6224 8508007
Depkes RI, 2007. LaporanNasionalRiskesdas 2007 [WWW Document]. URL http://www.litbang.depkes.go.id/bl_riskesdas2007 (accessed 6.20.14).
Ferlay, J., Shin, H.-R., Bray, F., Forman, D., Mathers, C., Parkin, D.M., 2010. Estimates of worldwide burden of cancer in 2008: GLOBOCAN 2008. Int. J. Cancer J. Int. Cancer 127, 2893–2917. doi:10.1002/ijc.25516
Gadducci, A., Barsotti, C., Cosio, S., Domenici, L., Riccardo Genazzani, A., 2011. Smoking habit, immune suppression, oral contraceptive use, and hormone replacement therapy use and cervical carcinogenesis: a review of the literature. Gynecol. Endocrinol. 27, 597–604. doi:10.3109/09513590.2011.558953
Harris, T.G., Miller, L., Kulasingam, S.L., Feng, Q., Kiviat, N.B., Schwartz, S.M., Koutsky, L.A., 2009. Depot-medroxyprogesterone acetate and combined oral contraceptive use and cervical neoplasia among women with oncogenic human papillomavirus infection. Am. J. Obstet. Gynecol. 200, 489.e1–489.e8. doi:10.1016/j.ajog.2009.01.030
Hellberg, D., 2012. Sex Steroids and Cervical Cancer.Anticancer Res. 32, 3045–3054. Hildesheim, A., Herrero, R., Castle, P.E., Wacholder, S., Bratti, M.C., Sherman, M.E., Lorincz,
A.T., Burk, R.D., Morales, J., Rodriguez, A.C., Helgesen, K., Alfaro, M., Hutchinson, M., Balmaceda, I., Greenberg, M., Schiffman, M., 2001. HPV co-factors related to the development of cervical cancer: results from a population-based study in Costa Rica. Br. J. Cancer 84, 1219–1226. doi:10.1054/bjoc.2001.1779
IARC, 2010.Fact Sheets by Population - Indonesia [WWW Document]. URL http://globocan.iarc.fr/Pages/fact_sheets_population.aspx
Jemal, A., Bray, F., Center, M.M., Ferlay, J., Ward, E., Forman, D., 2011. Global cancer statistics.CA. Cancer J. Clin. 61, 69–90. doi:10.3322/caac.20107
Jensen, K.E., Schmiedel, S., Norrild, B., Frederiksen, K., Iftner, T., Kjaer, S.K., 2013. Parity as a cofactor for high-grade cervical disease among women with persistent human papillomavirus infection: a 13-year follow-up. Br. J. Cancer 108, 234–239. doi:10.1038/bjc.2012.513
Kontopantelis, E., Reeves, D., 2009. MetaEasy: A meta-analysis add-in for Microsoft Excel. J Stat Softw. 30.
Luhn, P., Walker, J., Schiffman, M., Zuna, R.E., Dunn, S.T., Gold, M.A., Smith, K., Mathews, C., Allen, R.A., Zhang, R., Wang, S., Wentzensen, N., 2013.The role of co-factors in the progression from human papillomavirus infection to cervical cancer. Gynecol. Oncol. 128, 265–270. doi:10.1016/j.ygyno.2012.11.003
Mane, A., Nirmalkar, A., Risbud, A.R., Vermund, S.H., Mehendale, S.M., Sahasrabuddhe, V.V., 2012.HPV genotype distribution in cervical intraepithelial neoplasia among HIV-infected women in Pune, India.PloS One 7, e38731. doi:10.1371/journal.pone.0038731
Matsumoto, K., Oki, A., Furuta, R., Maeda, H., Yasugi, T., Takatsuka, N., Mitsuhashi, A., Fujii, T., Hirai, Y., Iwasaka, T., Yaegashi, N., Watanabe, Y., Nagai, Y., Kitagawa, T., Yoshikawa, H., for Japan HPV And Cervical Cancer (JHACC) Study Group, 2011. Predicting the progression of cervical precursor lesions by human papillomavirus genotyping: A prospective cohort study.Int. J. Cancer 128, 2898–2910. doi:10.1002/ijc.25630
Moreno, V., Bosch, F.X., Muñoz, N., Meijer, C.J., Shah, K.V., Walboomers, J.M., Herrero, R., Franceschi, S., 2002. Effect of oral contraceptives on risk of cervical cancer in women with human papillomavirus infection: the IARC multicentric case-control study. The Lancet 359, 1085–1092. doi:10.1016/S0140-6736(02)08150-3
Muñoz, N., Castellsagué, X., de González, A.B., Gissmann, L., 2006. Chapter 1: HPV in the etiology of human cancer. Vaccine, HPV Vaccines and Screening in the Prevention of Cervical Cancer 24, Supplement 3, S1–S10. doi:10.1016/j.vaccine.2006.05.115
Petry, K.U., 2014. HPV and cervical cancer. Scand. J. Clin. Lab. Investig. Suppl. 74, 59–62. doi:10.3109/00365513.2014.936683
Smith, J.S., Lindsay, L., Hoots, B., Keys, J., Franceschi, S., Winer, R., Clifford, G.M., 2007. Human papillomavirus type distribution in invasive cervical cancer and high-grade cervical lesions: A meta-analysis update. Int. J. Cancer 121, 621–632. doi:10.1002/ijc.22527
Soerjomataram, I., Lortet-Tieulent, J., Parkin, D.M., Ferlay, J., Mathers, C., Forman, D., Bray, F., 2012. Global burden of cancer in 2008: a systematic analysis of disability-adjusted life-years in 12 world regions. Lancet 380, 1840–1850. doi:10.1016/S0140-6736(12)60919-2

Public Health Department, Faculty of Sports Science, F1 Building, 2nd
Floor, Sekaran Campus Gunungpati, Semarang City, Central Java Province, Indonesia, 50229 Phone/ Fax. +6224 8508007
261
Stanley, M., 2010.Pathology and epidemiology of HPV infection in females. Gynecol. Oncol., HPV and HPV related diseases affecting males and females The latest update for primary care practitioners 117, S5–S10. doi:10.1016/j.ygyno.2010.01.024
Trottier, H., Mahmud, S., Costa, M.C., Sobrinho, J.P., Duarte-Franco, E., Rohan, T.E., Ferenczy, A., Villa, L.L., Franco, E.L., 2006. Human Papillomavirus Infections with Multiple Types and Risk of Cervical Neoplasia.Cancer Epidemiol. Biomarkers Prev. 15, 1274–1280. doi:10.1158/1055-9965.EPI-06-0129
262
Public Health Department, Faculty of Sports Science, F1 Building, 2nd
Floor, Sekaran Campus Gunungpati, Semarang City, Central Java Province, Indonesia, 50229 Phone/ Fax. +6224 8508007
MOTHERS’ MINDSET, FOOD PATTERN, AND HEALTH
Eunike R. Rustiana1, Fitri Indrawati1
1 Semarang State University, Indonesia
Corresponding Author: [email protected]
Abstract
Most of low educated Indonesian women are suffering from iron deficiency anemia. This anemia occurs because of lack of iron intake from food or low capacity of iron absorption. Among the Indonesian society, especially Javanese, Maduranese, and Balinese, there is still a mindset that husband is in the foremost side and wife is in the lower position, or put at the back side. In the Javanese language it can be told that wife is her husband‘s ―konco wingking‖. Wife‘s needs, including need of food, can be sufficed after husband‘s need and kids‘ need were sufficed. So, the wife gets only a small portion of food in the family. The current study was conducted to know how the family food pattern of low educated Indonesian women is. This descriptive study was conducted on 60 women who work as daily servant in Candirejo, Ungaran, Central Java. The conclusion was, there were still women who believe that husbands were in the foremost side and wifes were just persons on the back side and just need a small portion of food. If they were suffering from anemia, it was due to their mindset. It was suggested that to decrease mothers‘ mortality rate, some medically treatment in enhancing their physical health must be delivered accompanied with guidances about well nutrition and gender equality. Key words: Mothers‘ mindset, food pattern, iron deficiency anemia.
Human Development Index (HDI) is an index of human resource development acquisition. In the
year of 2004 Indonesian HDI attained the 111th order from 177 countries in the world (The Global
Source for Summaries and Reviews, 2011)1. This low HDI is much influenced by the nutrition
status and population health status. It can be seen from the height of infant mortality rate, that
were 35 per 1000 infant live birth, and under five years children mortality rate, that were 58 per
1000 live birth, mothers mortality rate, 307 per 100.000 live birth (the highest rate in Asia)
(Azwar,)2. More than half of the infant and under five years children mortality rate was due to their
bad nutrition status (Azwar, 2004)2. Public nutrition status is very important to increase human
resources quality, because the nutrition status is very influential to health status.
Fact in field showed that efforts of perfection, improvement, and increment on public
nutrition is more focused on under five years children nutrition.(Juliati, 1995)3, but actually mothers
are also included in social group which is very fragile of nutrition problem (Margawati, Hari,
Doeljahman, 1997)4, particularly pregnant women and especially lactation mothers (Juliati, 19953;
Sapril,20115). An investigation result fact that pregnant women food intake in developing countries
is less than that recommended. For instance, ammount of energy only 1500 – 2000 Cal/ day
whereas in more develop countries 2400 – 2700 Cal/day. The protein intake is also low, that is 8 –
10% from total energy, even if in more develop countries 12% from total energy per day (Sapril,
Public Health Department, Faculty of Sports Science, F1 Building, 2nd
Floor, Sekaran Campus Gunungpati, Semarang City, Central Java Province, Indonesia, 50229 Phone/ Fax. +6224 8508007
263
2011)5. Lactation women need more nutrition than pregnant women. If they do not get an addition
of nutrition, lactation women will be skinny and easy to be tired because food element needed for
breast milk is taken from mother‘s body tissue (Sapril, 2011)5. Research result shown that there is
a relation between women‘s health and daily food pattern (Sapril, 2011).
Food pattern is someone‘s eating habit, included kinds of food that he or she often eats
everyday. In this study, kinds of food consumed as the object included food and beverage as
protein, fat, vitamin, fiber, mineral, and carbohydrate resources. According to Yayuk Farida
(2004)3/6 food pattern or food consumption pattern is a composition of kinds and amount of food
consumed by someone or a group of persons at a certain time. Then Santoso & Rani (2004)4/7
said that food pattern is a various information which bring a description about kinds and amount of
food stuff that consumed everyday by someone as a characteristic of a certain social group. The
definition of food pattern according to Santoso & Rani (2004)7, in this research can be also
interpreted included meaning about proportion of food allotment for the family members, in
accordance with the idea of each social group. The social group‘s idea according to Kartini Kartono
(Rustiana, 2007)8 for examples, in Java, Madura, Bali, there is a difference in food allocation
among the members of family, among father, mother, son and daughter. Males get bigger share,
and the rest is for females.
One of the health problems faced by many developing countries in the world is iron
deficiency anemia. It was estimated that this disease is suffered by 700 million persons all over the
world. (6/9) Indonesian women, particularly in low income community, most of them are suffering
from iron deficiency anemia (60-80% are lactation women). Several literatures, for instance which
published by UNICEF showed that in the year of 1999 in West Java, Central Java, and Lombok,
half of six month babies are suffering from iron deficiency anemia.. . From this report, it can be
estimated that the mothers of those babies are also suffering from iron deficiency anemia
(Tanusaputra, Tjokrosonto, Kushadiwijaya, 2004) 9
Iron deficiency anemia is anemia due to iron deficiency in the blood. This means that the
concentration of hemoglobin in the blood is reduced by disruption of the formation of red blood
cells due to lack of iron levels in the blood.
The occurrence of iron deficiency anemia is partly due to lack of iron intake from the food or poor
absorption of iron present in the diet. Less varied diet such as rice menu and beans just cause lack
of iron intake for the body, because the absorption of iron from plant foods is lower than animal
food. (Haslina, 2005) 10
Anemia is a risk factor for maternal death and often occurs in pregnancy. The prevalence of iron
deficiency anemia in pregnant women according to the 2006 Household Health Survey is between
57.1 to 80% (Household Health Survey, 2006) 11. At maternal iron deficiency anemia resulting
vulnerability during childbirth, bleeding, low birth weight, it can even lead to death for both mother
and child. In women who are breastfeeding, anemia causes low quality and quantity of breast milk
264
Public Health Department, Faculty of Sports Science, F1 Building, 2nd
Floor, Sekaran Campus Gunungpati, Semarang City, Central Java Province, Indonesia, 50229 Phone/ Fax. +6224 8508007
decreases. For workers, especially women, iron deficiency anemia cause lethargy, fatigue,
decreased energy, thus it decreases work productivity.
Until the early years of Indonesia's independence, according to the Rustiana Kartini Kartono
(2007) 8 community structures in Java, Madura and Bali are very paternalistic. Women held a third-
class and do not have a lot of noise and power in society and the family. If men and women walk
together, the women walk behind the men. Because of that, female are called kanca wingking, that
is the friend who is at behind. If they are eating together, women should put her husband first. Now
freedom is longstanding, but the ideology remains, particularly in the community an average
educated and low-income. Many women in these groups experienced a situation like that but they
do not perceive it as a problem or pressure. They still willingly put the interests of her husband and
children. Assumption that men scored higher than women, according Joyomartono (2007) 1 2
affect the distribution of food within the family. For food at home, the mother put the fathers and
children first, and the last is for her. When a simple family consumes only vegetable food, the
mother consume less than other family members. If the family rarely consumes animal food
because it is expensive, then the mother is not willing to consume. In such circumstances the
mother still had to do house chores or do work outside the home for earning extra income.
Occupations such as laborers wash the pads, tailor, power of pocokan that is the housekeeper
who comes home early afternoon, also itinerant food vendors. Lack of nutrition is rooted in
ideology sidekick, and the amount of energy that must be removed will make it difficult to maintain
the health of the mother.
In addition to the cultural approach kanca wingking, female mindset can also be viewed from
the approach to the nature of motherhood. Maternal traits that lead held by women who are
feminine. Narcissistic desire of women to be loved by a lover or husband undergoes a process of
change in shape, the shape of the urge to love her. In this case the desire narcissistic turned into a
form of a mother's love for her child. Mother's love is often accompanied by a feeling of dedication
(dedicate themselves) for her children and sacrifice as much as possible. If it exceeds the normal
sense of the sacrifice it would endanger the mother. Mothers often feel a headache or stomach
ache, but she ignores it. Mother regard, it is plain sick woman. In order to keep enough working
mothers taking medication headache or heartburn medication (Julianti & Kristanti, 2000) 1 3 It turns
out not only nutrients discrimination occurs in women as mothers, but also in girls. The results of
research in rural area show that women earn 16% less calories than boys. Among teenage girls,
14% of them are suffering from severe malnutrition, while the boy is only 1% (Anwar, A, 2004).
This fact illustrates that in a certain group of people is still encountered discrimination for women.
(Juliati, 1995) 3
These thought patterns have different emphasis. Kanca wingking mindset put the husband first,
and maternal mindset put the children first, then the father, and the last is mother. Discrimination
mindset prioritizes all men. However, all of them adverse mother‘s health because the mother just
get a little food, while she has to spend a lot of energy. This can be attributed to the results of
Public Health Department, Faculty of Sports Science, F1 Building, 2nd
Floor, Sekaran Campus Gunungpati, Semarang City, Central Java Province, Indonesia, 50229 Phone/ Fax. +6224 8508007
265
research and Kristanti Julianti (2000) 1 3 which shows that Indonesian women workers is still very
less attention to the condition of their food in relation to the weight of the job at hand.
According Soekidjo Notoadmodjo (2003) 1 5, parents especially the mother is a very important
factor in the health status bequeath to their children. Parental education is one of the important
factors in the development of the child. With low formal education, and the state were forced to
work as well, women are not being informed of example of how good child care, education, how to
maintain the health status of their children, and so on.
From this background, the research will be conducted to determine how the family diet, especially
mothers in families with low levels of education.
Method
This study is descriptive, that is describing the facts to express the symptoms fully investigated in
the aspect that clearly state or condition. Therefore, at this stage no more than a descriptive
method of research is the discovery of crude facts (fact finding). The discovery of these symptoms
does not mean merely shows the distribution, however, including the proposed business
relationship with one another in the aspects investigated the (Sastroasmoro, S., 200 2) 1 6.
The methods of collecting data are interviews with the respondents with a list of guideline
questions (questionnaire). The population of this research is the mother mum who has a maximum
junior high school level of education in Candirejo, West Ungaran District, and the samples are
taken purposively. Samples from this research that a mother who worked as a handyman, a total of
60 respondents. Research was conducted from May 27 to 10 October 2010.
Result
The experiment was conducted in the Village Candirejo, West Ungaran District, Semarang regency
with respondents of 60 people, this research data collection using interviews and questionnaires.
Here are the results of research that has been done.
1. Age distribution of respondents
Distribution of respondents by age category shows, respondents aged 21-30 years were 6 people
(10%), age 31-40 h un ta many as 18 people (30%), most respondents in the age range 41-50
years were 22 people (37%), aged 51-60 years 9 people (15%), and more than 60 years there
were 5 people (8%). Hasi l shows that most respondents are in the age range of 31-50 years.
2. Distribution of education of respondents
Distribution of respondents by level of education indicates that respondents who are not school by
8 people (13%), respondents who had elementary education as many as 43 people (72%), and the
fish berpendid SMP 9 people (15%), whereas no educated SLA .
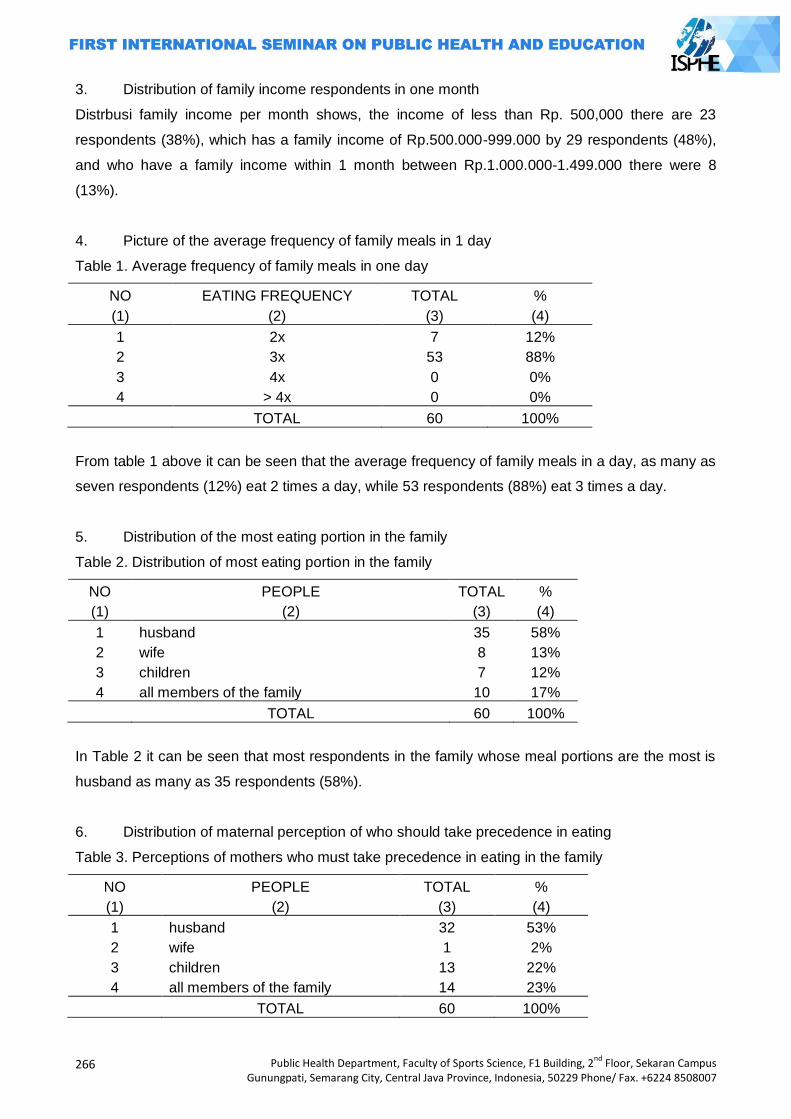
266
Public Health Department, Faculty of Sports Science, F1 Building, 2nd
Floor, Sekaran Campus Gunungpati, Semarang City, Central Java Province, Indonesia, 50229 Phone/ Fax. +6224 8508007
3. Distribution of family income respondents in one month
Distrbusi family income per month shows, the income of less than Rp. 500,000 there are 23
respondents (38%), which has a family income of Rp.500.000-999.000 by 29 respondents (48%),
and who have a family income within 1 month between Rp.1.000.000-1.499.000 there were 8
(13%).
4. Picture of the average frequency of family meals in 1 day
Table 1. Average frequency of family meals in one day
NO EATING FREQUENCY TOTAL %
(1) (2) (3) (4)
1 2x 7 12%
2 3x 53 88%
3 4x 0 0%
4 > 4x 0 0%
TOTAL 60 100%
From table 1 above it can be seen that the average frequency of family meals in a day, as many as
seven respondents (12%) eat 2 times a day, while 53 respondents (88%) eat 3 times a day.
5. Distribution of the most eating portion in the family
Table 2. Distribution of most eating portion in the family
NO PEOPLE TOTAL %
(1) (2) (3) (4)
1 husband 35 58%
2 wife 8 13%
3 children 7 12%
4 all members of the family 10 17%
TOTAL 60 100%
In Table 2 it can be seen that most respondents in the family whose meal portions are the most is
husband as many as 35 respondents (58%).
6. Distribution of maternal perception of who should take precedence in eating
Table 3. Perceptions of mothers who must take precedence in eating in the family
NO PEOPLE TOTAL %
(1) (2) (3) (4)
1 husband 32 53%
2 wife 1 2%
3 children 13 22%
4 all members of the family 14 23%
TOTAL 60 100%
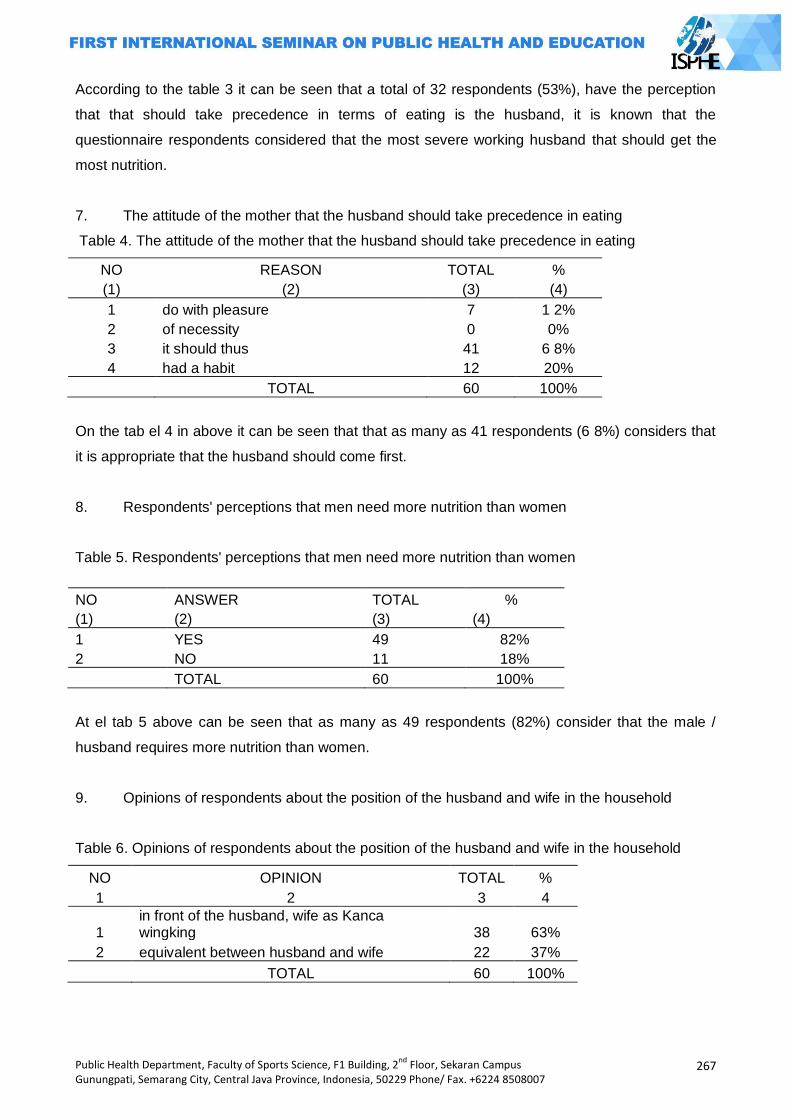
Public Health Department, Faculty of Sports Science, F1 Building, 2nd
Floor, Sekaran Campus Gunungpati, Semarang City, Central Java Province, Indonesia, 50229 Phone/ Fax. +6224 8508007
267
According to the table 3 it can be seen that a total of 32 respondents (53%), have the perception
that that should take precedence in terms of eating is the husband, it is known that the
questionnaire respondents considered that the most severe working husband that should get the
most nutrition.
7. The attitude of the mother that the husband should take precedence in eating
Table 4. The attitude of the mother that the husband should take precedence in eating
NO REASON TOTAL %
(1) (2) (3) (4)
1 do with pleasure 7 1 2%
2 of necessity 0 0%
3 it should thus 41 6 8%
4 had a habit 12 20%
TOTAL 60 100%
On the tab el 4 in above it can be seen that that as many as 41 respondents (6 8%) considers that
it is appropriate that the husband should come first.
8. Respondents' perceptions that men need more nutrition than women
Table 5. Respondents' perceptions that men need more nutrition than women
NO ANSWER TOTAL %
(1) (2) (3) (4)
1 YES 49 82%
2 NO 11 18%
TOTAL 60 100%
At el tab 5 above can be seen that as many as 49 respondents (82%) consider that the male /
husband requires more nutrition than women.
9. Opinions of respondents about the position of the husband and wife in the household
Table 6. Opinions of respondents about the position of the husband and wife in the household
NO OPINION TOTAL %
1 2 3 4
1 in front of the husband, wife as Kanca wingking 38 63%
2 equivalent between husband and wife 22 37%
TOTAL 60 100%
268
Public Health Department, Faculty of Sports Science, F1 Building, 2nd
Floor, Sekaran Campus Gunungpati, Semarang City, Central Java Province, Indonesia, 50229 Phone/ Fax. +6224 8508007
According to the table 6 it can be seen that 38 respondents (63%), found in front of the husband
and wife as Kanca sidekick, while 22 respondents (37%) found the husband and wife equal in
status.
Discussion
Gender is related to the role difference. Survey results revealed that there are still women (63%)
who think that a husband and wife were in front as kanca wingking and just take care of domestic
affairs in the household. Inequality between men and women has a role in the occurrence of the
gap (disparities) in the nutritional status of women and men. This is evident from the results of
studies showing that many women (69% of respondents) stated more concerned with her husband
in food intake than herself. This phenomenon is one of the originators factor is the lack of
education, especially formal education. Formal education was low (72% of respondents had
elementary education) made women less likely to get information, such as information on gender
equality, women's health information, how to create and provide nutritious food for the family also
how to educate children, who should not discriminate between boys and girls. With knowledge, a
person can develop his potency, so that quality of life improved. In women, education has a large
and positive impact. Because with education, women will be more efficient both for the benefit of
themselves and families, so that will give birth to generations of quality as well. Yet to overcome
the lack of formal education of women would not be able to send the subject to further formal
education. Thing to do is to motivate women to be diligent in meeting Dasa Wisma present in their
home environment, in order to exchange ideas with friends in attendance.
This research also showed that many of the women (82% of respondents) considered that men
more than women need nutrients. These results support the fact that found to WHO (2011), that in
developing countries, including Indonesia, an estimated 450 million women grow not perfect due to
malnutrition in childhood, as a result of poverty. If any affluent, culture determines that the husband
and the boys got a portion of the lot and the best, and last the mother eat the rest are there. Adahal
p P menstruating women worked since it would require more nutrition than men to replace blood
the exit. Substance that is needed is the iron that is 3 times greater than the needs of men.
Besides, women also need more iodine than men. Lacking of iodine will cause goiter harmful fetal
development both physically and mentally (The Global Source for Summaries and Review, 2011) 1.
Women, especially those whose nutrition status are bad are also very susceptible to several
diseases, including sexually transmitted diseases, because their work or their bodies which are
different from men. Kindness in providing materials about nutrition and foods that contain nutrients,
health workers should also convey the concept of positive interaction of nutrients, that is, in order
to improve the absorption of iron in the body, preferably foo n source of iron consumed with foods
high in vitamin C. The research result of Juliati (1995) 3 shows that the heart which is consumed
with fruits with high content of vitamin C, increased absorption of iron + 20%
Public Health Department, Faculty of Sports Science, F1 Building, 2nd
Floor, Sekaran Campus Gunungpati, Semarang City, Central Java Province, Indonesia, 50229 Phone/ Fax. +6224 8508007
269
Conclusion
Based on the results of research and discussion it can be concluded that in the Candirejo, West
Ungaran District, mostly mothers with low education still assume that the male / husband should
get precedence in terms of eating. Among these mothers there's still an assumption that husband
should be in front of the wife, and the wife as kanca wingking, her position is at behind, so that she
gets meals less than the husband, even from the children.
Suggestion
Based on these results, suggestions can be given as follows:
For the Health Center Ungaran District
Provide health education to mothers through health volunteers about the importance of nutrition for
women, especially in women who are pregnant. In education it is also submitted that the mindset
which has been owned by the mothers, that mothers receive enough food rations less than the
father and the children, is not true, because of adverse maternal health. Besides this, it also needs
to be informed about the interactive concept nutrients.
For mothers in the Candirejo Village
Raising awareness of the nutritional that is equivalent for each family member. Mothers should get
their share of food which is comparable with the energy that must be removed to work. When a
pregnant mother should be taken into account also needs the necessary food fetuses. If the
mother is having a baby, the baby must be taken into account also needs to be breastfed. Thus
women's health can be better.
Bibliography
Azwar, Azrul. 2004. Kecenderungan Masalah Gizidan Tantangan di Masa Datang. Makalah disampaikan pada Pertemuan Advokasi Program Perbaikan Gizi Menuju Keluarga Sadar Gizi. Di Holel Sahid Jaya, Jakarta, 27 Sept.
Farida Yayuk. Pengantar pangan dan Gizi. Jakarta: Penebar Swadaya; 2004.
Haslina. Hubungan Anemia Gizi Besi dengan Kecerdasan, Produktivitas, dan Kualitas Hidup Kesehatan Pekerja. Jurnal Dinamika SOSBUD. 2005: 7 (2); 103-108.
Joyomartono,M. 2007. Pengantar Antropologi Kesehatan. Cetakan ke-4. Semarang: Julianty Pradono, & Kristanti, Ch.M. 2000. Faktor Penentu Produktivitas Tenaga jahit Perempuan
pada Satu Perusahaan Handuk di Jakarta Tahun 1994. Jurnal Epidemiologi Indonesia.2000; 4 (3); 1-a8.
Juliati, 1995. Gizi dan Wanita Pedesaan: Perannya dalam Mencapai Cita-cita Pendidikan untuk Semua. Cakrawala Pendidikan Edisi Khusus Des-Mei
Margawati Ani, Kusnanto Hari, dan Doeljachman Mh. Persepsi wanita berusia 20-35 tahun terhadap gangguan akibat kekurangan iodium (GAKI). Jurnal Epidemiologi Indonesia. 1997;
1; 5-8
Notoatmodjo S. Promosi kesehatan dan ilmu perilaku. Jakarta: Rineka Cipta; 2007.
270
Public Health Department, Faculty of Sports Science, F1 Building, 2nd
Floor, Sekaran Campus Gunungpati, Semarang City, Central Java Province, Indonesia, 50229 Phone/ Fax. +6224 8508007
Notoatmodjo, S. 2003. Pendidikan dan Perilaku Kesehatan. Jakarta: Rineka Cipta.
Rustiana E.R. Pola pikir yang merugikan kesehatan ibu. Makalah dalam Konggres Nasional
Jaringan Epidemiologi Nasional XII 2007. Semarang.
Santosa S, & Rani A. Kesehatan dan Gizi. Jakarta: Rineka Cipta; 2004.
Sapril, DoctorSite. Gizi pada Pekerja Wanita. Diakses dari http://www.klik pdf.info/pdf/GIZI-PADA-PEKERJA-WANITA.html/ pada 9 Juli 2011.
Sastroasmoro S. Metodologi penelitian klinis. Jakarta: CV Sagung Seto; 2002.
SKRT 2006
Tanusaputra Agustina,Tjokrosonto Soesanto, Kushadiwijaya Haripurnomo. Anemia pada ibu hamil dengan profilaksis klorokium. Berita Kedokteran Masyarakat. 2004; 3 (Juli-Agst-September);
105-110
The Global Source for Summaries & Reviews‘ diterbitkan pada 29 Mei 2011, diakses dari http://id.shvoong.com/social-sciences/education/ 11Okt 2011.
Unnes Press.
Public Health Department, Faculty of Sports Science, F1 Building, 2nd
Floor, Sekaran Campus Gunungpati, Semarang City, Central Java Province, Indonesia, 50229 Phone/ Fax. +6224 8508007
271
ELIMINATING HIV AIDS, MALARIA, AND
OTHER DIESEASE
PAPERS

272
Public Health Department, Faculty of Sports Science, F1 Building, 2nd
Floor, Sekaran Campus Gunungpati, Semarang City, Central Java Province, Indonesia, 50229 Phone/ Fax. +6224 8508007
Public Health Department, Faculty of Sports Science, F1 Building, 2nd
Floor, Sekaran Campus Gunungpati, Semarang City, Central Java Province, Indonesia, 50229 Phone/ Fax. +6224 8508007
273
FOODPOISONING OUTBREAK FOLLOWING A CIRCUMCISION CELEBRATION: AN EPIDEMIOLOGICAL INVESTIGATION IN SLEMAN, INDONESIA
Lukman Fauzi1, C. Heriana2, Berty Murtiningsih3, Alexander Prasudi3
1Public Health Department, Semarang State University, Indonesia
2Public Health Department, Stikes Kuningan, Indonesia 3Provincial Health Office of Special Region of Yogyakarta, Indonesia
Corresponding Author: [email protected]
Abstract Background: On January 4, 2013, a suspect foodpoisoning outbreak associated with a
circumcision event in Sleman was reported. A rapid team was sent to conduct an investigation to confirm the outbreak, identify the source, and recommend control measures. Methods: We did a retrospective cohort study among those who attended the event. Exposed subject was defined as people who consumed at least 1 type of food from the event, such as rice, ―Bacem‖ fried chicken, chili sauce and/or raw vegetable (cabbage and/or basil leaves). Data were analyzed using Stata software. Left-over food items were sent to the lab for testing. Results: There were 231 who consumed food after the event, 133 of whom got sick (attack rate 57.6%). Majority (76%) of the cases had diarrhea. Incubation periods ranged from 3 to 10 hours (median 5 hours). Those who ate ―Bacem‖ fried chicken were more likely to get sick than those who did not eat this dish (RR 3.9; 95% CI 1.37-11.03). Staphylococcus aureus was detected in the ―Bacem‖ sample. The chicken were cooked 28 hours prior to serving and kept at room temperature without reheating. This outbreak was probably caused by consumption of contaminated ―Bacem‖ fried chicken.
Key Words: Foodpoisoning, food handling, cohort studies, indonesia
Introduction
The incidence of foodpoisoning is one of the public health problem that needs serious
attention by all competent authorities, such as policy makers. World Health Organization (WHO)
explained that an outbreak of food poisoning is a serious public health threat in the world of the
21st century, except communicable and non-communicable diseases. This threat makes WHO
invites the countries in the world to implement the International Health Regulations (IHR), global
cooperation in surveillance and early warning of outbreaks, and the exchange of knowledge and
technology between countries (WHO, 2002).
WHO defined foodpoisoning outbreak as an event that there are two or more people who
suffer from pain after consuming a dish which is epidemiologically proved to be a source of
contagion (Bress, 1995). Food poisoning can be caused by a number of causes, both living and
inanimate objects. According Arisman (2009) and Nuraida (2001), bacteria, mold/fungi, viruses,
rickettsiae, prions, protozoa and parasites, certain animals and plants, as well as chemicals are the
cause of food poisoning. Generally, signs and symptoms of food poisoning can invade the blood
circulatory system, central nervous system, digestive system, disrupting electrolyte balance, and
may be allergic (facial flushing and itching) (WHO, 2011).
Sleman District is one of districts in the province of Special Region of Yogyakarta where
more often suffered from foodpoisoning outbreak than disease outbreak. In 2012, an outbreak
occurred 12 times in Sleman, and 8 of them are food poisoning. In other words, foodpoisoning
outbreal dominate outbreak incident in Sleman District.
Foodpoisoning outbreak had occurred in Sleman District on January 2013, 4 and 5 in Klelen,
Sleman District. Initial information obtained from the National Agency of Drugs and Foods Control
(NADFC), Yogyakarta on January 9, 2013. Following up the information from the NADFC
274
Public Health Department, Faculty of Sports Science, F1 Building, 2nd
Floor, Sekaran Campus Gunungpati, Semarang City, Central Java Province, Indonesia, 50229 Phone/ Fax. +6224 8508007
Yogyakarta, then the rapid team from Sleman District Health Office confirm the incident to the head
of Klelen on the same day. Preliminary information obtained that foodpoisoning came from food
that is shared at the time of circumcision of the son of Mr. X in Klelen, Sleman District.
Circumcision celebration event was held on January 4, 2013 at 6.30 pm. People invited in
the event were 74 people from RT 04 and RT 05. The event was only praying to the son of Mr. X
after circumcision. At the event, the host did not provide snacks and only provided food box that
would be taken to home by invited guests. Food box contained ―Bacem‖ fried chicken, chili sauce,
and raw vegetable (cabbage and basil leaves). Bacem is a chicken that is boiled and marinated
with palm sugar spices, then fried until cooked.
People who after eating event‘s food box experienced some symptoms, such as diarrhea,
nausea, vomiting, fever, abdominal pain, and headache. According to the results of the initial
investigation by government staff of Klelen, obtained information that the people who had these
symptoms conveyed to the host after day 3, on January 7, 2013. It was caused by people feel
uncomfortable to deliver it because had invited and given food by host.
On January 9, 2013, the rapid team consisted of surveillance officer of Sleman District
Health Office and Sleman Public Health Center, and Field Epidemiology Students directly took left-
over food items, bacem and raw vegetables, to be stored in the freezer of Sleman District Health
Office. Food which could be taken only bacem and raw vegetables (cabbage and basil leaves)
while other foods, such as rice and chili sauce was not there. Bacem and vegetables were kept by
one of the residents in his personal freezer on January 4, 2013. He keep these after one of his
family members had symptoms of diarrhea and abdominal pain on January 4, 2013 at 10.00 pm.
Epidemiological investigations performed along with treatment by doctors clinic which took
place at the home of Mr. X. Previously, people who attended the celebration event on January 4,
2013 had notified by the village chief to attend treatment. Before receiving treatment services,
people were interviewed to provide information about the incident of food poisoning by answering
the questions in the questionnaire that asked by the rapid team. This method was more efficient in
attracting people than door to door method. Epidemiological investigation of phase I interviewed 71
people who attended the celebration, either healthy or illness people after consuming or not
consuming. People exposed, either sick or not, were certainly not limited to those that were 71
people, so that epidemiological investigation of phase II conducted on January 11 and 12, 2013.
Based on the results from both phases, obtained 231 people who were experiencing and not
experiencing symptoms after consuming at least one food (rice, bacem, cabbage, basil leave, or
chili sauce).
Based on explanation above, the research objective of epidemiological investigation were
to confirm the outbreak, identify the source, and recommend control measures
Methods
The study was analytical study with retrospective cohort in area of RT 04 and RT 05,
Klelen. The investigation subjects were people who consumed food from the event and food
producer. Subjects were interviewed regarding food consumed after the celebration and how to
process the food with questionnaire and direct observation. When epidemiological investigation, ill
persons were asked about their signs and symptoms and onset of illness, then left-over food items
were sent to the National Agency of Drugs and Foods Control (NADFC), Yogyakarta laboratorium
for testing.
Diagnosis ascertainment of this outbreak was suspected case, based on the presence of
clinical signs and symptoms of food poisoning, such as diarrhea, abdominal pain, nausea,
vomiting, and headaches for those who consumed one or more types of food from the event.
Exposed subjects were defined as people who consumed at least 1 type of food from the event,
such as rice, bacem fried chicken, chili sauce and/or raw vegetable (cabbage and/or basil leves).
Public Health Department, Faculty of Sports Science, F1 Building, 2nd
Floor, Sekaran Campus Gunungpati, Semarang City, Central Java Province, Indonesia, 50229 Phone/ Fax. +6224 8508007
275
Unexposed subject were defined as people who did not consume food from the event, such as
rice, bacem, chili sauce, and raw vegetable. Data collected were analyzed using Stata software
with bivariate (chi-square test) and multivariate (logistic-regression) analysis.
Results and Discussions
Based on the results of epidemiological investigations, the number of cases of food
poisoning identified were 133 people, from 231 people interviewed (1 person was Murangan
hospital outpatient, 1 person was hospitalized in Murangan hospitals, and 131 people were not
treated in health centers and hospitals). Distribution of clinical signs and symptoms experienced by
133 people as the following.
Table 1. Distribution of clinical signs and symptoms of foodpoisoning outbreak in Sleman District,
Indonesia, 2013
No Clinical signs and symptoms Illness subject Percentage (%)
1 Diarrhea 101 75.94
2 Stomachache 60 45.11
3 Nausea 50 37.59
4 Vomiting 47 35.34
5 Headache 29 21.80
6 Muscle weakness 24 18.05
7 Cold sweat 23 17.29
8 Pallor 23 17.29
9 Fever 5 3.76
10 Shiver 4 3.01
11 Fainting 3 2.26
Based on the table above, the most predominant symptoms experienced by cases were
diarrhea (75.94%), abdominal pain (45.11%), nausea (37.59%), and vomiting (35.34%). These
symptoms indicate the outbreak was probably caused by bacterial toxins. Some types of bacteria
that cause clinical symptoms similar to clinical symptoms above are Bacillus cereus,
Staphylococcus aureus, and Clostridium pefringens (Imari, 2011; WHO, 2012).
Based on the explanation of Article 25, Paragraph 3 of Government Regulation No. 28 of
2004 (Peraturan Pemerintah No. 28 Tahun 2004), an outbreak of food poisoning is an event where
there are two or more people were sick with the same symptoms or nearly the same after
consuming food and based on epidemiological analysis, the food proved to be a source of
infection. In that sense, it can be concluded that there has been food poisoning outbreak after
eating food from circumcision celebration event (rice, bacem, raw vegetables, or chili sauce) with
symptoms such as diarrhea, abdominal pain, nausea, vomiting, and headache in RT 04 RW 24,
Klelen, Sleman District on December 4 and January 5, 2013 with the number of 133 people.
An epidemiological investigation report has to explain the description of cases based on
variable of person, place, and time. Of 133 cases, 71 cases of which were female and the others
are male. The data showed that the majority of food poisoning cases are female, but the difference
between the number of cases of sex men and women were not too far away. Attack Rate (AR)
value by sex as the following.
Table 2. Attack Rate by sex of foodpoisoning outbreak in Sleman District, Indonesia, 2013
No Sex Population at risk Illness subject AR (%)
1 Male 119 62 52.10 2 Female 112 71 63.39
Total 231 133 57.58
276
Public Health Department, Faculty of Sports Science, F1 Building, 2nd
Floor, Sekaran Campus Gunungpati, Semarang City, Central Java Province, Indonesia, 50229 Phone/ Fax. +6224 8508007
Based on the table above, AR of male was higher than male. In other words, female were
more vulnerable to get signs and symptomps of food poisoning in this case. Meanwhile, when
viewed by age group, the highest value of AR in the age group of 45-59 years (66.67%) followed
by the age group of 15-44 years (61.79%), while the lowest value of AR was in the age group > 60
years (27.27%). Value of AR at age group can be seen in the following table.
Table 3. Attack rate by age group of foodpoisoning outbreak in Sleman District, Indonesia, 2013
No Age group (years old) Population at risk Illness subject AR (%)
1 1 – 4 tahun 8 3 37.50 2 5 – 14 tahun 36 20 55.56 3 15 – 44 tahun 123 76 61.79 4 45 – 59 tahun 42 28 66.67 5 > 60 tahun 22 6 27.27
Total 231 133 57,58
According to place variable, all the invited guests at the circumcision celebration event
derived from RT 04 and 05, Klelen, Sleman, while only 2 persons derived from RT 06 and RT 07.
From RT 06 was the brother of the host, while guests from RT 07 was religious leader (lead the
prayer at the event).
Cases description regarding to the time variable describes incubation period/duration of
outbreaks took place. The description is illustrated in the epidemic curve that shows the frequency
of cases based on the start of illness (onset of illness). By desgining an epidemic curve, it can
identified type of disease transmission that occurs in a community.
Intervals in the epidemic curve used was 1 hour. The curve below showed that 52 cases
(the most) were poisoned after 3-4 hours of consuming food.
Figure 1. Epidemic curve of foodpoisoning outbreak in Sleman District, Indonesia, 2013
Epidemic curve above illustrated a type of ―common source‖ which mean exposure or
occurrence of a disease in a group of people comes from a single source, in the form of food so
everyone has an opportunity to experience poisoning (Timmreck, 2005). The increase and
decrease in the epidemic curve occurred because the difference of meal time. The shortest
incubation period was 3 hours and the longest was 10 hours, then duration of exposure was less
than 24 hours.
Meal Time
The Longest Incubation Per
The Shortest Incubation Per
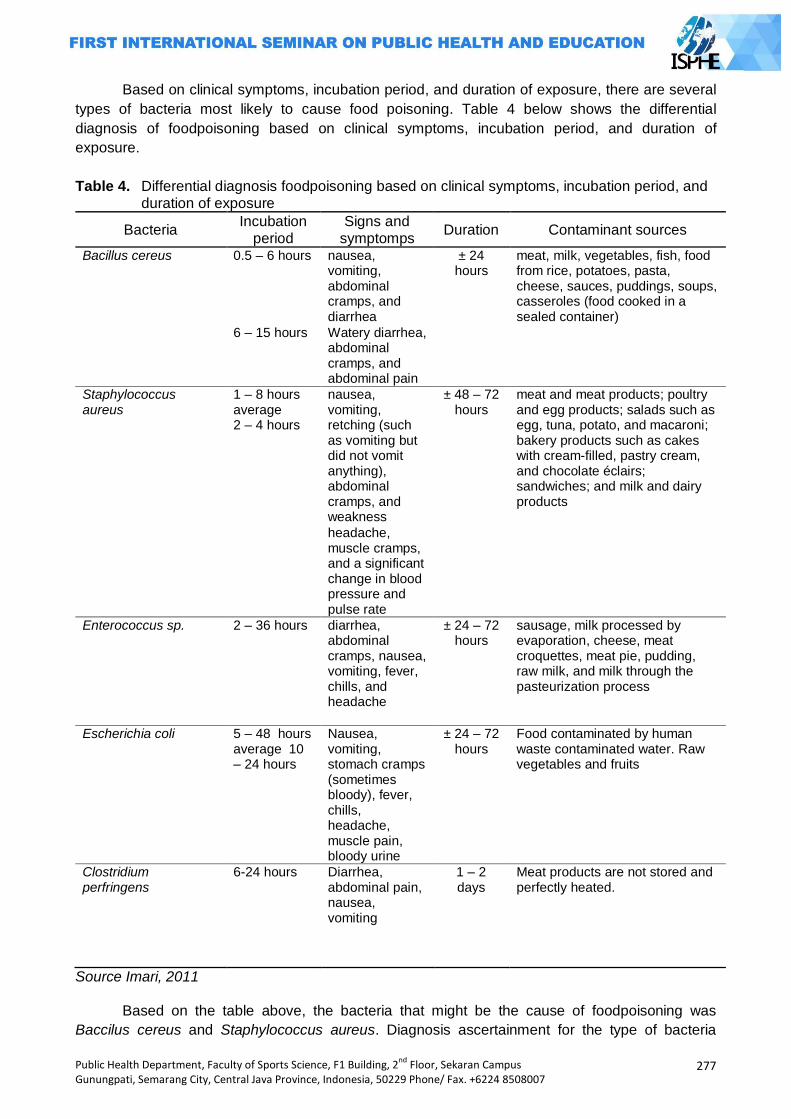
Public Health Department, Faculty of Sports Science, F1 Building, 2nd
Floor, Sekaran Campus Gunungpati, Semarang City, Central Java Province, Indonesia, 50229 Phone/ Fax. +6224 8508007
277
Based on clinical symptoms, incubation period, and duration of exposure, there are several
types of bacteria most likely to cause food poisoning. Table 4 below shows the differential
diagnosis of foodpoisoning based on clinical symptoms, incubation period, and duration of
exposure.
Table 4. Differential diagnosis foodpoisoning based on clinical symptoms, incubation period, and duration of exposure
Bacteria Incubation
period Signs and
symptomps Duration Contaminant sources
Bacillus cereus 0.5 – 6 hours nausea, vomiting, abdominal cramps, and diarrhea
± 24 hours
meat, milk, vegetables, fish, food from rice, potatoes, pasta, cheese, sauces, puddings, soups, casseroles (food cooked in a sealed container)
6 – 15 hours Watery diarrhea, abdominal cramps, and abdominal pain
Staphylococcus aureus
1 – 8 hours average 2 – 4 hours
nausea, vomiting, retching (such as vomiting but did not vomit anything), abdominal cramps, and weakness
± 48 – 72 hours
meat and meat products; poultry and egg products; salads such as egg, tuna, potato, and macaroni; bakery products such as cakes with cream-filled, pastry cream, and chocolate éclairs; sandwiches; and milk and dairy products
headache, muscle cramps, and a significant change in blood pressure and pulse rate
Enterococcus sp. 2 – 36 hours diarrhea, abdominal cramps, nausea, vomiting, fever, chills, and headache
± 24 – 72 hours
sausage, milk processed by evaporation, cheese, meat croquettes, meat pie, pudding, raw milk, and milk through the pasteurization process
Escherichia coli 5 – 48 hours average 10 – 24 hours
Nausea, vomiting, stomach cramps (sometimes bloody), fever, chills, headache, muscle pain, bloody urine
± 24 – 72 hours
Food contaminated by human waste contaminated water. Raw vegetables and fruits
Clostridium perfringens
6-24 hours Diarrhea, abdominal pain, nausea, vomiting
1 – 2 days
Meat products are not stored and perfectly heated.
Source Imari, 2011
Based on the table above, the bacteria that might be the cause of foodpoisoning was
Baccilus cereus and Staphylococcus aureus. Diagnosis ascertainment for the type of bacteria
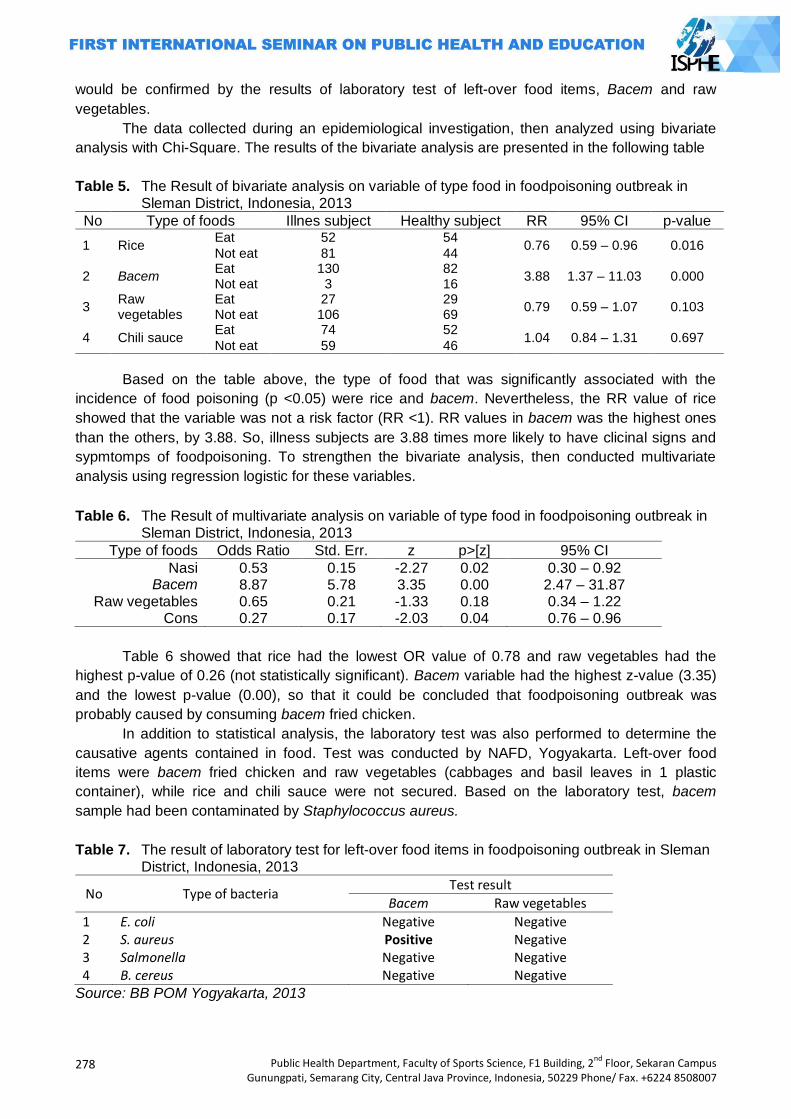
278
Public Health Department, Faculty of Sports Science, F1 Building, 2nd
Floor, Sekaran Campus Gunungpati, Semarang City, Central Java Province, Indonesia, 50229 Phone/ Fax. +6224 8508007
would be confirmed by the results of laboratory test of left-over food items, Bacem and raw
vegetables.
The data collected during an epidemiological investigation, then analyzed using bivariate
analysis with Chi-Square. The results of the bivariate analysis are presented in the following table
Table 5. The Result of bivariate analysis on variable of type food in foodpoisoning outbreak in Sleman District, Indonesia, 2013
No Type of foods Illnes subject Healthy subject RR 95% CI p-value
1 Rice Eat 52 54
0.76 0.59 – 0.96 0.016 Not eat 81 44
2 Bacem Eat 130 82
3.88 1.37 – 11.03 0.000 Not eat 3 16
3 Raw vegetables
Eat 27 29 0.79 0.59 – 1.07 0.103
Not eat 106 69
4 Chili sauce Eat 74 52
1.04 0.84 – 1.31 0.697 Not eat 59 46
Based on the table above, the type of food that was significantly associated with the
incidence of food poisoning (p <0.05) were rice and bacem. Nevertheless, the RR value of rice
showed that the variable was not a risk factor (RR <1). RR values in bacem was the highest ones
than the others, by 3.88. So, illness subjects are 3.88 times more likely to have clicinal signs and
sypmtomps of foodpoisoning. To strengthen the bivariate analysis, then conducted multivariate
analysis using regression logistic for these variables.
Table 6. The Result of multivariate analysis on variable of type food in foodpoisoning outbreak in Sleman District, Indonesia, 2013
Type of foods Odds Ratio Std. Err. z p>[z] 95% CI
Nasi 0.53 0.15 -2.27 0.02 0.30 – 0.92 Bacem 8.87 5.78 3.35 0.00 2.47 – 31.87
Raw vegetables 0.65 0.21 -1.33 0.18 0.34 – 1.22 Cons 0.27 0.17 -2.03 0.04 0.76 – 0.96
Table 6 showed that rice had the lowest OR value of 0.78 and raw vegetables had the
highest p-value of 0.26 (not statistically significant). Bacem variable had the highest z-value (3.35)
and the lowest p-value (0.00), so that it could be concluded that foodpoisoning outbreak was
probably caused by consuming bacem fried chicken.
In addition to statistical analysis, the laboratory test was also performed to determine the
causative agents contained in food. Test was conducted by NAFD, Yogyakarta. Left-over food
items were bacem fried chicken and raw vegetables (cabbages and basil leaves in 1 plastic
container), while rice and chili sauce were not secured. Based on the laboratory test, bacem
sample had been contaminated by Staphylococcus aureus.
Table 7. The result of laboratory test for left-over food items in foodpoisoning outbreak in Sleman District, Indonesia, 2013
No Type of bacteria Test result
Bacem Raw vegetables
1 E. coli Negative Negative 2 S. aureus Positive Negative 3 Salmonella Negative Negative 4 B. cereus Negative Negative
Source: BB POM Yogyakarta, 2013
Public Health Department, Faculty of Sports Science, F1 Building, 2nd
Floor, Sekaran Campus Gunungpati, Semarang City, Central Java Province, Indonesia, 50229 Phone/ Fax. +6224 8508007
279
Bacterial contamination on food can occur during preparation, processing, up to
presentation. Based on interview with rice producer, it was obtained information that after cooked,
rice was cooled before being put into a food box. This way can prevent the growth of bacteria
during in room temparature. The conditions of place and equipment were clean and no fly vector.
Cooked rice on January 4, 2013 at 11.00 am. Packaging process into food box carried by the host
with the help of 3 neighbors. They were healthy and not suffering from respiratory and skin
diseases.
Meanwhile, the investigation was also carried out to bacem producer in Klaten District.
Based on interview, it was obtained information that the processing of raw chicken had been
started on January 3, 2013 at 3.00 am (1 day before the event) processed by 4 people. They were
healthy and not suffering from respiratory and skin diseases. Making of bacem consisted of several
stages, cleaning the chicken, boiling the chicken with palm sugar spices, and frying.
Based on interview with the host, the family had consumed bacem without rice, raw
vegetables, and chili sauce on January 4, 2013 at 2.00 am, after bacem was sent from Klaten.
However, they who ate bacem did not experience signs and symptomps of food poisoning. This
was presumably caused by the lag time between the processing with consuming was less than 24
hours. In addition, based on the results of the investigation that obtained from epidemiological
investigation, of 133 cases of food poisoning, 94 of whom (70.7%) had consumed bacem with
crumbly and bad smell conditions. This showed that the decay had occurred on bacem.
Staphylococcus aureus is a bar-shaped organism, are gram-positive, aerobic and
anaerobic at optimum temperature of 37°C, and died when the temperature increased to exceed
50oC. Common form of food poisoning caused by staphylococcal multiplication-forming toxins in
food before it is eaten (Badan POM RI, 2005). Contamination by this microorganisms is often,
because these bacteria can grow in the hands of 50%. Rapid growth can take place in the cracks
and small wounds on the skin that looks are not infected (Arisman, 2009).
According to Imari (2011), food that can be contaminated by Staphylococcus aureus is a
meat and poultry products. In other words, bacem is a product of poultry that is suitable for the
growth of this microorganism. According Arisman (2009), the necessary nutrients for it to survive
and multiply are carbohydrates, from simple sugars (glucose) and complex carbohydrates and fats.
Especially for Staphylococcus aureus, this bacteria is highly dependent on the amino acid,
thiamine, and nicotinic acid in order to grow. Amino acids are the simplest form of the protein that
is widely available on bacem.
Staphylococcus aureus bacteria can produce toxins that can not be destroyed by heat
(heat-resistant). According Arisman (2009), cited Doyle, et al (2001), staphylococcus can grow at
very low temperatures, in 7oC, and maximum temperature, in 48oC, and the optimum temperature
for forming toxin, at 40 – 45oC . Therefore, this bacteria is very easy to grow on bacem in which
most chickens were packed into a cardboard in warm conditions and the lag time between
processing with consumption took a long time. According Arisman (2009), one of the factors
causing foodpoisoning outbreak is a condition that is suitable for warm storage for more than 2
hours.
Based on explanation above, it can be concluded that bacterial contamination occured due
to several factors : 1) the condition of bacem was sweet, high in amino acids, and poultry products
that were suitable medium for the growth of Staphylococcus aureus, 2) some bacem that was
already fried placed on a winnowing tray to drain the oil, then some of the winnowing tray placed
on the floor and not closed, so it was a suitable condition for flies, dust, and exposure of skin and
breath from food producer (Staphylococuus aureus lives in the nose and skin of human), 3)
distribution process took a long time and some bacem was stored in warm conditions (incubation
temperature of bacteria), and 4) the lag time between processing with consumption took a long
time, up to 28 hours.
280
Public Health Department, Faculty of Sports Science, F1 Building, 2nd
Floor, Sekaran Campus Gunungpati, Semarang City, Central Java Province, Indonesia, 50229 Phone/ Fax. +6224 8508007
Closing
Foodpoisoning outbreak had occurred in Sleman District after circumcision celebration
event. This outbreak was caused by consumption of contaminated bacem fried chicken. The agent
that contaminated the food was Staphylococcus aureus.
Recommendation given to informal food producers and host is to serve the food as soon as
possible after cooking or stored in clean covered containers, refrigerated, and re-heated prior to
serving. To community, refrain sick persons from food handling. To district health office, train
informal food producers on safe food-handling practices and educate community periodically about
foodpoisoning outbreak.
References Adiwisastra, A. 1985. Keracunan: Sumber, Bahaya, serta Penanggulangannya. Bandung:
Angkasa. Arisman. 2009. Buku Ajar Ilmu Gizi Keracunan Makanan. Jakarta: Penerbir Buku Kedokteran
EGC. Badan POM RI. 2005. Kejadian Luar Biasa Keracunan Pangan. Jakarta : Badan POM RI. BB POM Yogyakarta. 2012. Laporan Akhir Kasus Keracunan. Yogyakarta: BB POM Yogyakarta. Bress, P. 1995. Tindakan Darurat Kesehatan Masyarakat pada Kejadian Luar Biasa: Petunjuk
Praktis. Terjemahan: Hari Kusnanto. Yogyakarta: Gadjah Mada University Press. Imari, S. 2011. Investigasi KLB Keracunan Pangan. Jakarta: Kementerian Kesehatan RI-WHO.
Nuraida, L. 2001. Mikroba Patogen pada Makanan dan Sumber Pencemarannya. In: Hardinsyah & Rimbawan. eds. Analisis Bahaya dan Pencegahan Keracunan Pangan. Jakarta: Pergizi Pangan.
Peraturan Pemerintah Republik Indonesia Nomor 28 Tahun 2004. Timmreck, TC. 2005 Epidemiologi (Suatu Pengantar). Terjemahan: Fauziah Munaya. Jakarta:
Penerbit Buku Kedokteran EGC. WHO. 2002. Terrorist Threats to Food: Guidance for Establishing and Strengthening Prevention
and Response Systems. Geneva : WHO. ______. 2011. Prevention of Foodborne Disease: Five Keys to Safer Food. Geneva : WHO.
Public Health Department, Faculty of Sports Science, F1 Building, 2nd
Floor, Sekaran Campus Gunungpati, Semarang City, Central Java Province, Indonesia, 50229 Phone/ Fax. +6224 8508007
281
POTENTIAL PREDATION OF LARVIVOROUS FISH AS A BIOLOGICAL CONTROL AGENT
OF DENGUE FEVER VECTOR : DUE TO ITS DIGESTIVE ORGAN
Dyah Mahendrasari Sukendra
Semarang State University, Indonesia
Corresponding Author: [email protected]
Abstracts Introduction: Dengue fever caused by dengue virus and transmitted by Aedes aegypti. To control Aedes aegypti population is to stop its life cycle. One of the method to control Aedes aegypti
population was using larvivorous fish. Larvivorous fish has been applied in water reservoirs's society. But the society did not know how to use this larvivorous fish comprehensively. Implementation larvirous fish can causing a problem. So that, it was important to hoose properly fish due its digestive organ. This research was to investigate the differences of potential predation larvivorous fish related with its digestive tract anatomy and its measurement. Methods: A total of 10.000 3rd larvae of Aedes aegypti, and Tilapia (Oreochromis niloticus), Common Carper (Cyprinus carpio), and Guppy (Poecillia reticulata) were analyzed using observational analysis with post test only design. There was significant different (p <0.05) in the daily optimum intake of amongs the subject. Tilapia shows as a higher consumer of 3 rd larvae Ae. aegypti. Results: The higher ratio of body length and body weight is a Common Carper, Tilapia as a 2nd, and the lowest is Guppy. The higher ratio of intestine length is a Common Carper, Tilapia and Guppy have a same ratio. Key Words: Third larvae of Aedes aegypti, tilapia, commom carper, guppy, predation, and
digestive tract organs
Introduction
Dengue Haemorraghic Fever (DHF) was caused by Dengue viruses and transmitted by
Aedes aegypti. Nowadays Dengue Haemorraghic Fever still an important problem disease in
public health areas. Dengue Haemorraghic Fever caused higher immortality. In the tropical
cauntries, include Indonesia. Dengue Haemorraghic Fever was one of the disease that is causing
an out break (Anhar et al., 1996; Depkes RI, 2010). Dengue Haemorraghic Fever was a dangerous
disease, it caused by virus. Until this day vaccine has not faund yet. To overcome and eliminate
Dengue Haemorraghic Fever, also to prevent with specifically ways. Preventing the Aedes aegypti
population is the most efficient and efective program to elliminate and to reduce the potential out
break of DHF. The alternative to prevent and to eliminate also to reduce Dengue Haemorraghic
Fever is to control the vector disease. To control vector disease can be done with controlling the
population of mature and larvae stadium of Aedes aegypti as a vectors Dengue Haemorraghic
Fever (Mardihusodo, 1990).
Public Health Ministry of Indonesia give a suggestion a program to overcome the Dengue
Haemorraghic fever and its called 3M Pluss. A 3M Pluss were abbreviation from ―Menguras,
282
Public Health Department, Faculty of Sports Science, F1 Building, 2nd
Floor, Sekaran Campus Gunungpati, Semarang City, Central Java Province, Indonesia, 50229 Phone/ Fax. +6224 8508007
Menutup, and Mengubur‖ and Pluss with add a larvacides program. ―Menguras‖ means to drain the
water reservoirs routinelly, ―Menutup‖ means to close any kinds of thrift that is can collect water or
rain water, ―Mengubur‖ means to burry all kinds of thrift that is can collect water or rain water.
Controlling the population of Aedes aegypti using physical program, such as 3M sometimes didt
not working well. A physical program to reduce and to controll Dengue vector needed lot of
society's participation with a long term also persistence, patients, understandings, and lot of
motivations. A chemical program to control and to reduce a Dengue vector control were using
chemical synthetic insecticides product causing a negative effects, such as causing an insect
resistance and harmfull to population nontarget (Milam et al., 2000). A residue of chemical
synthetic insecticides product is difficult to degrade so it is harmfull and distrub the ecosystem. A
natural insecticides more save to use than the chemical synthetic product. A natural insecticedes is
easy to degrade, but the effect of its insecticides to insect has a short term, so that it need to
repeated (Mardihusodo, 1992 cit Agnes, 2008). One of the alternative ways to reduce and
eliminate Dengue vector disease were used a biology vector control program, that is a larvivorous
fish (Homski et al., 1994; Damayanti and Munif, 2006).
Afrida (2008) reported Tilapia (Oreochromis niloticus) could eat 172 a larvae for 24 hours,
Common carper (Cyprinus carpio) could eat 128 a larvae for 24 hours. Nababan (2006) reported
that Guppy (Poecilla reticullata) shows has a good potential predation, Guppy could eat 30 larvae
fo 24 hours. So that, Tilapia (Oreochromis niloticus), Common carper (Cyprinus carpio), dan
Guppy (Poecilla reticullata) has an advantages to control a vector disease. It can choosen as a
biology vector control to control Dengue vector at permanent aquatic habitats and semipermanent
aquatic habitats. A 60% respondent said that the larvivorous fish has been applied in water
reservoirs's society causing a problem, the water became dirty. A normal water standar was
change. It can be causing a new problem, that was society will not recieve the biology vector
control program using larvivorous fish to reduce and to eliminate the dengue vector disease. A
water problem caused by applying larvivorous fish, can be minimizes with a selection to choose the
Proper and effetive also efficient of larvivorous fish.
Research about differencies potential predation due to its digestive tract organ is important to
understand comprehensively. The right ways to choose a properly an efective and efficient vector
control agent to reduce also eliminate DHF vector it must. To choose an agent of biology vector
control has the best potential predation due to its digestive tract organ. Understanding and
knowledge about potential predation of larvivorous fish and digestive tract organs, used as a basic
to choose a proper fish that can be an agent of biology vector control of DHF. So that the society
will receive larvivorous fish as the biological vector control program to reduce and to control the
population of vectors, so that the program to eliminate DHF will succeed.
Public Health Department, Faculty of Sports Science, F1 Building, 2nd
Floor, Sekaran Campus Gunungpati, Semarang City, Central Java Province, Indonesia, 50229 Phone/ Fax. +6224 8508007
283
Methods
The study of this research is analytical observational and design of this research is post test
only design. Subject of the research are 3rd larvae of Aedes aegypti, Tilapia (Oreochromis
niloticus), Common Carper (Cyprinus carpio), and Guppy (Poecillia reticulata).
The objective this research was to investigate the differences of potential predation among
the subject as a biological vector control, to know the influence of the digestive tract anatomy
related its potential predation, to know the differences of digestive tract measurement related its
potential predation.
A total 10.000 3rd alive and healthy larvae Aedes aegypti were analysed as a subject of this
research. A Tilapia (Oreochromis niloticus), a Common carper (Cyprinus carpio), and Guppy
(Poecillia reticulata) was from traditional pets market.
The body length of Tilapia (Oreochromis niloticus), a Common carper (Cyprinus carpio), and
Guppy (Poecillia reticulata) were measured from its mouth – end of body (exclude caudal fin).
Body length average of Tilapia (Oreochromis niloticus), a Common carper (Cyprinus carpio), and
Guppy (Poecillia reticulata) were 2-3 cm.
This research was carried ot at laboratory. Tilapia (Oreochromis niloticus), a Common carper
(Cyprinus carpio), and Guppy (Poecillia reticulata) were quarantine for one week before the
research started. Qurantine were aimed to matching process. Matching to get a same stomach
contents and fishes condition. Everyday in the early morning, Tilapia (Oreochromis niloticus), a
Common carper (Cyprinus carpio), and Guppy (Poecillia reticulata) feeds add libitum once time for
24 hours, each day. Feeding stop at 24 hours before research started, aimed to empty the fishes's
stomach.
Subjects divided into three groups: (1) Groups 1: A Tilapia (Oreochromis niloticus) and a total
200 3rd larvae Aedes aegypti, (2) Groups 2: A Common carper (Cyprinus carpio) and a total 200 3rd
larvae Aedes aegypti, Groups 3 : A Guppy (Poecillia reticulatta) and a total 200 3rd larvae Aedes
aegypti.
Group 1 divided into five subgroups. Each subgroup contains of 1 mini container, 1 L of
water and a 10 cm water level, a total 200 3rd larvae Aedes aegypti, and 1 Tilapia (Oreochromis
niloticus). Each subgroups observed the reduction of accumulation 3rd larvae Aedes aegypti in the
mini containers. Observing mini containers every 1 hour, 6 hours, 12 hours, 18 hours, and 24
hours. Each group was held on three replications. During the research, an environmental
temperature and humidity, also a water temperature was observed and counted. Measurement and
identification of digestive tract organ of fish was held counting a total body lenght, body weight,
opening mouth length. Fixation the specimen and dissection the stomach to measurement the
intestine length.
Potential predation was analyzed using anova and LSD. Analyzing of potential predation
aimed to compare the consumption of 3rd larvae Aedes aegypti each of a Tilapia (Oreochromis
niloticus), a Common carper (Cyprinus carpio), and a Guppy (Poecillia reticulata) with the density
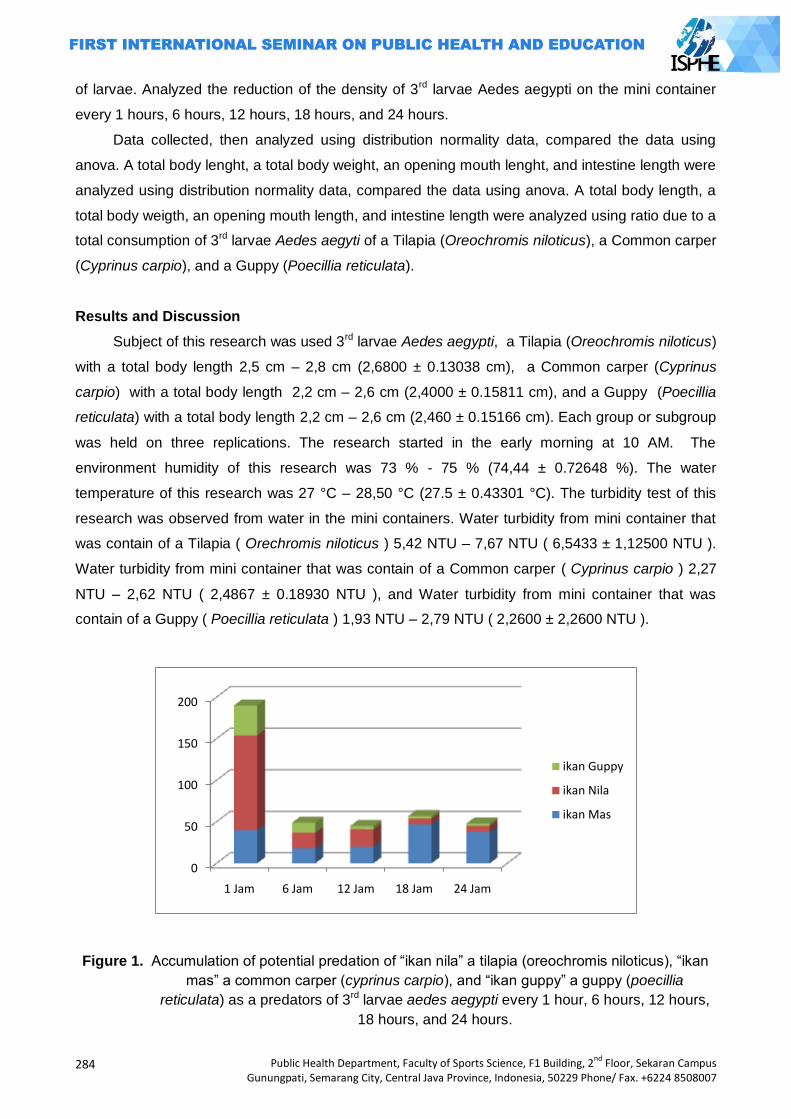
284
Public Health Department, Faculty of Sports Science, F1 Building, 2nd
Floor, Sekaran Campus Gunungpati, Semarang City, Central Java Province, Indonesia, 50229 Phone/ Fax. +6224 8508007
of larvae. Analyzed the reduction of the density of 3rd larvae Aedes aegypti on the mini container
every 1 hours, 6 hours, 12 hours, 18 hours, and 24 hours.
Data collected, then analyzed using distribution normality data, compared the data using
anova. A total body lenght, a total body weight, an opening mouth lenght, and intestine length were
analyzed using distribution normality data, compared the data using anova. A total body length, a
total body weigth, an opening mouth length, and intestine length were analyzed using ratio due to a
total consumption of 3rd larvae Aedes aegyti of a Tilapia (Oreochromis niloticus), a Common carper
(Cyprinus carpio), and a Guppy (Poecillia reticulata).
Results and Discussion
Subject of this research was used 3rd larvae Aedes aegypti, a Tilapia (Oreochromis niloticus)
with a total body length 2,5 cm – 2,8 cm (2,6800 ± 0.13038 cm), a Common carper (Cyprinus
carpio) with a total body length 2,2 cm – 2,6 cm (2,4000 ± 0.15811 cm), and a Guppy (Poecillia
reticulata) with a total body length 2,2 cm – 2,6 cm (2,460 ± 0.15166 cm). Each group or subgroup
was held on three replications. The research started in the early morning at 10 AM. The
environment humidity of this research was 73 % - 75 % (74,44 ± 0.72648 %). The water
temperature of this research was 27 °C – 28,50 °C (27.5 ± 0.43301 °C). The turbidity test of this
research was observed from water in the mini containers. Water turbidity from mini container that
was contain of a Tilapia ( Orechromis niloticus ) 5,42 NTU – 7,67 NTU ( 6,5433 ± 1,12500 NTU ).
Water turbidity from mini container that was contain of a Common carper ( Cyprinus carpio ) 2,27
NTU – 2,62 NTU ( 2,4867 ± 0.18930 NTU ), and Water turbidity from mini container that was
contain of a Guppy ( Poecillia reticulata ) 1,93 NTU – 2,79 NTU ( 2,2600 ± 2,2600 NTU ).
0
50
100
150
200
1 Jam 6 Jam 12 Jam 18 Jam 24 Jam
ikan Guppy
ikan Nila
ikan Mas
Figure 1. Accumulation of potential predation of ―ikan nila‖ a tilapia (oreochromis niloticus), ―ikan
mas‖ a common carper (cyprinus carpio), and ―ikan guppy‖ a guppy (poecillia
reticulata) as a predators of 3rd larvae aedes aegypti every 1 hour, 6 hours, 12 hours,
18 hours, and 24 hours.
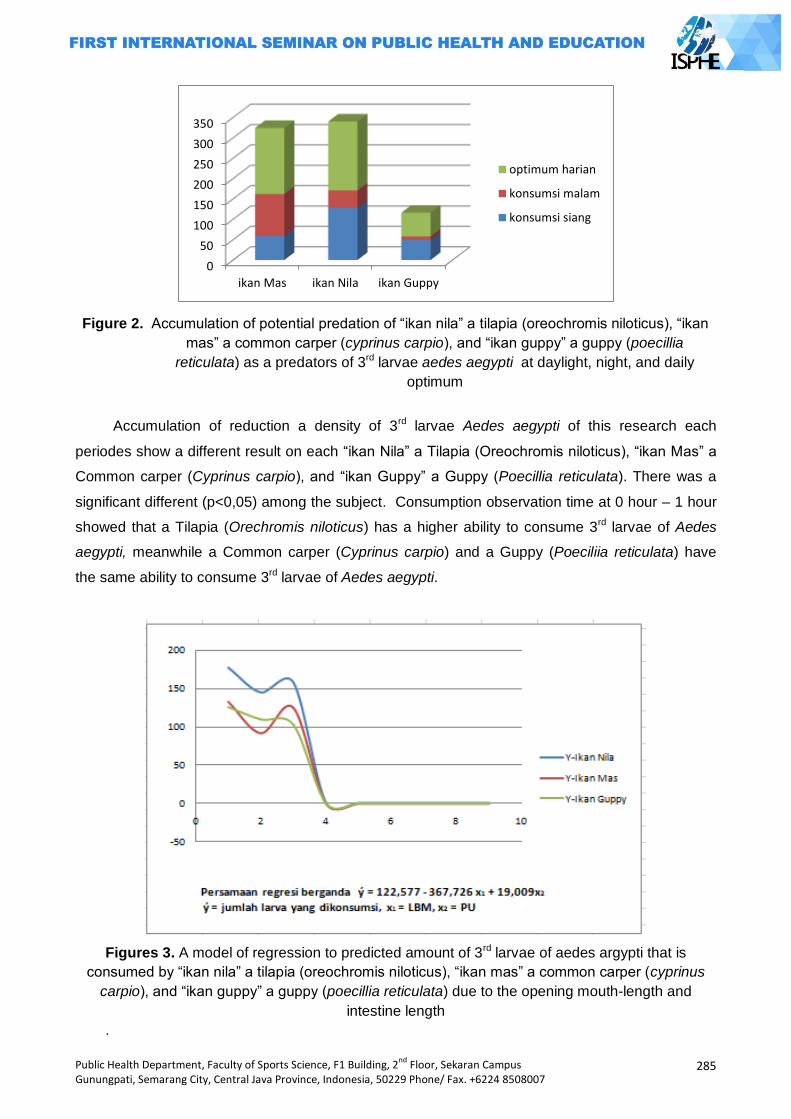
Public Health Department, Faculty of Sports Science, F1 Building, 2nd
Floor, Sekaran Campus Gunungpati, Semarang City, Central Java Province, Indonesia, 50229 Phone/ Fax. +6224 8508007
285
0
50
100
150
200
250
300
350
ikan Mas ikan Nila ikan Guppy
optimum harian
konsumsi malam
konsumsi siang
Figure 2. Accumulation of potential predation of ―ikan nila‖ a tilapia (oreochromis niloticus), ―ikan
mas‖ a common carper (cyprinus carpio), and ―ikan guppy‖ a guppy (poecillia
reticulata) as a predators of 3rd larvae aedes aegypti at daylight, night, and daily
optimum
Accumulation of reduction a density of 3rd larvae Aedes aegypti of this research each
periodes show a different result on each ―ikan Nila‖ a Tilapia (Oreochromis niloticus), ―ikan Mas‖ a
Common carper (Cyprinus carpio), and ―ikan Guppy‖ a Guppy (Poecillia reticulata). There was a
significant different (p<0,05) among the subject. Consumption observation time at 0 hour – 1 hour
showed that a Tilapia (Orechromis niloticus) has a higher ability to consume 3rd larvae of Aedes
aegypti, meanwhile a Common carper (Cyprinus carpio) and a Guppy (Poeciliia reticulata) have
the same ability to consume 3rd larvae of Aedes aegypti.
Figures 3. A model of regression to predicted amount of 3rd larvae of aedes argypti that is
consumed by ―ikan nila‖ a tilapia (oreochromis niloticus), ―ikan mas‖ a common carper (cyprinus
carpio), and ―ikan guppy‖ a guppy (poecillia reticulata) due to the opening mouth-length and
intestine length
.
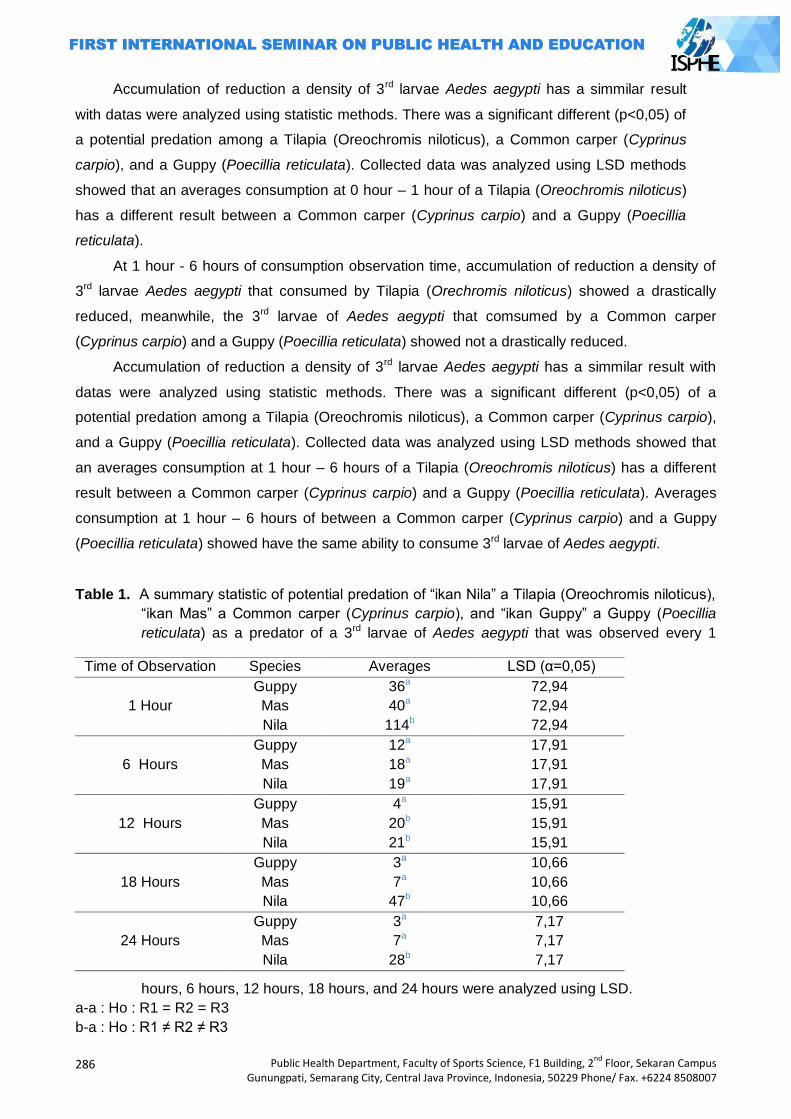
286
Public Health Department, Faculty of Sports Science, F1 Building, 2nd
Floor, Sekaran Campus Gunungpati, Semarang City, Central Java Province, Indonesia, 50229 Phone/ Fax. +6224 8508007
Accumulation of reduction a density of 3rd larvae Aedes aegypti has a simmilar result
with datas were analyzed using statistic methods. There was a significant different (p<0,05) of
a potential predation among a Tilapia (Oreochromis niloticus), a Common carper (Cyprinus
carpio), and a Guppy (Poecillia reticulata). Collected data was analyzed using LSD methods
showed that an averages consumption at 0 hour – 1 hour of a Tilapia (Oreochromis niloticus)
has a different result between a Common carper (Cyprinus carpio) and a Guppy (Poecillia
reticulata).
At 1 hour - 6 hours of consumption observation time, accumulation of reduction a density of
3rd larvae Aedes aegypti that consumed by Tilapia (Orechromis niloticus) showed a drastically
reduced, meanwhile, the 3rd larvae of Aedes aegypti that comsumed by a Common carper
(Cyprinus carpio) and a Guppy (Poecillia reticulata) showed not a drastically reduced.
Accumulation of reduction a density of 3rd larvae Aedes aegypti has a simmilar result with
datas were analyzed using statistic methods. There was a significant different (p<0,05) of a
potential predation among a Tilapia (Oreochromis niloticus), a Common carper (Cyprinus carpio),
and a Guppy (Poecillia reticulata). Collected data was analyzed using LSD methods showed that
an averages consumption at 1 hour – 6 hours of a Tilapia (Oreochromis niloticus) has a different
result between a Common carper (Cyprinus carpio) and a Guppy (Poecillia reticulata). Averages
consumption at 1 hour – 6 hours of between a Common carper (Cyprinus carpio) and a Guppy
(Poecillia reticulata) showed have the same ability to consume 3rd larvae of Aedes aegypti.
Table 1. A summary statistic of potential predation of ―ikan Nila‖ a Tilapia (Oreochromis niloticus),
―ikan Mas‖ a Common carper (Cyprinus carpio), and ―ikan Guppy‖ a Guppy (Poecillia
reticulata) as a predator of a 3rd larvae of Aedes aegypti that was observed every 1
hours, 6 hours, 12 hours, 18 hours, and 24 hours were analyzed using LSD.
a-a : Ho : R1 = R2 = R3
b-a : Ho : R1 ≠ R2 ≠ R3
Time of Observation Species Averages LSD (α=0,05)
1 Hour
Guppy 36a 72,94
Mas 40a 72,94
Nila 114b 72,94
6 Hours
Guppy 12a 17,91
Mas 18a 17,91
Nila 19a 17,91
12 Hours
Guppy 4a 15,91
Mas 20b 15,91
Nila 21b 15,91
18 Hours
Guppy 3a 10,66
Mas 7a 10,66
Nila 47b 10,66
24 Hours
Guppy 3a 7,17
Mas 7a 7,17
Nila 28b 7,17
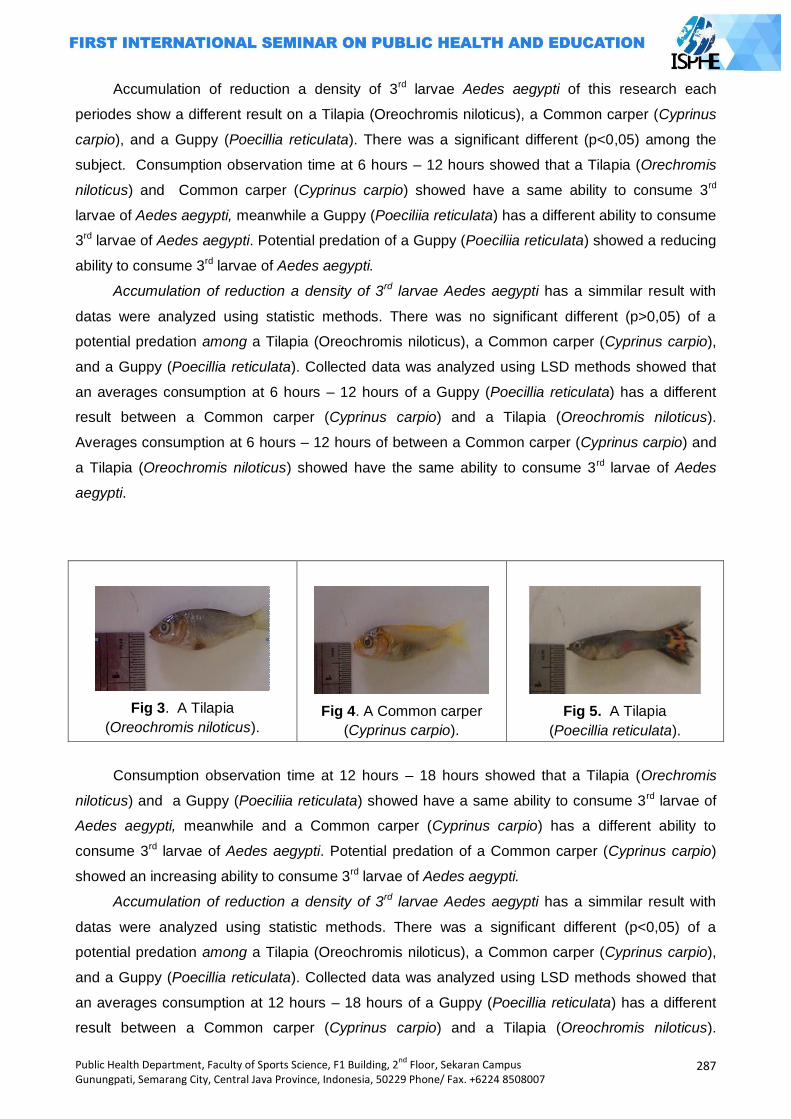
Public Health Department, Faculty of Sports Science, F1 Building, 2nd
Floor, Sekaran Campus Gunungpati, Semarang City, Central Java Province, Indonesia, 50229 Phone/ Fax. +6224 8508007
287
Accumulation of reduction a density of 3rd larvae Aedes aegypti of this research each
periodes show a different result on a Tilapia (Oreochromis niloticus), a Common carper (Cyprinus
carpio), and a Guppy (Poecillia reticulata). There was a significant different (p<0,05) among the
subject. Consumption observation time at 6 hours – 12 hours showed that a Tilapia (Orechromis
niloticus) and Common carper (Cyprinus carpio) showed have a same ability to consume 3rd
larvae of Aedes aegypti, meanwhile a Guppy (Poeciliia reticulata) has a different ability to consume
3rd larvae of Aedes aegypti. Potential predation of a Guppy (Poeciliia reticulata) showed a reducing
ability to consume 3rd larvae of Aedes aegypti.
Accumulation of reduction a density of 3rd larvae Aedes aegypti has a simmilar result with
datas were analyzed using statistic methods. There was no significant different (p>0,05) of a
potential predation among a Tilapia (Oreochromis niloticus), a Common carper (Cyprinus carpio),
and a Guppy (Poecillia reticulata). Collected data was analyzed using LSD methods showed that
an averages consumption at 6 hours – 12 hours of a Guppy (Poecillia reticulata) has a different
result between a Common carper (Cyprinus carpio) and a Tilapia (Oreochromis niloticus).
Averages consumption at 6 hours – 12 hours of between a Common carper (Cyprinus carpio) and
a Tilapia (Oreochromis niloticus) showed have the same ability to consume 3rd larvae of Aedes
aegypti.
Fig 3. A Tilapia
(Oreochromis niloticus).
Fig 4. A Common carper
(Cyprinus carpio).
Fig 5. A Tilapia
(Poecillia reticulata).
Consumption observation time at 12 hours – 18 hours showed that a Tilapia (Orechromis
niloticus) and a Guppy (Poeciliia reticulata) showed have a same ability to consume 3rd larvae of
Aedes aegypti, meanwhile and a Common carper (Cyprinus carpio) has a different ability to
consume 3rd larvae of Aedes aegypti. Potential predation of a Common carper (Cyprinus carpio)
showed an increasing ability to consume 3rd larvae of Aedes aegypti.
Accumulation of reduction a density of 3rd larvae Aedes aegypti has a simmilar result with
datas were analyzed using statistic methods. There was a significant different (p<0,05) of a
potential predation among a Tilapia (Oreochromis niloticus), a Common carper (Cyprinus carpio),
and a Guppy (Poecillia reticulata). Collected data was analyzed using LSD methods showed that
an averages consumption at 12 hours – 18 hours of a Guppy (Poecillia reticulata) has a different
result between a Common carper (Cyprinus carpio) and a Tilapia (Oreochromis niloticus).
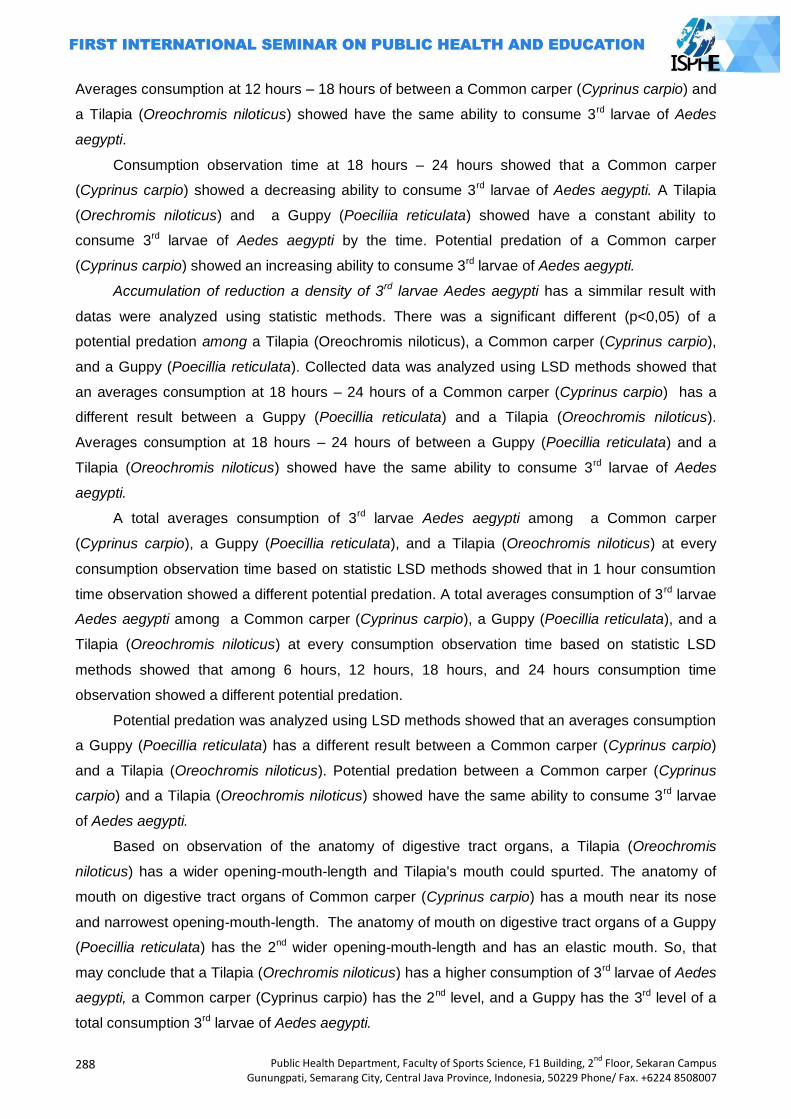
288
Public Health Department, Faculty of Sports Science, F1 Building, 2nd
Floor, Sekaran Campus Gunungpati, Semarang City, Central Java Province, Indonesia, 50229 Phone/ Fax. +6224 8508007
Averages consumption at 12 hours – 18 hours of between a Common carper (Cyprinus carpio) and
a Tilapia (Oreochromis niloticus) showed have the same ability to consume 3rd larvae of Aedes
aegypti.
Consumption observation time at 18 hours – 24 hours showed that a Common carper
(Cyprinus carpio) showed a decreasing ability to consume 3rd larvae of Aedes aegypti. A Tilapia
(Orechromis niloticus) and a Guppy (Poeciliia reticulata) showed have a constant ability to
consume 3rd larvae of Aedes aegypti by the time. Potential predation of a Common carper
(Cyprinus carpio) showed an increasing ability to consume 3rd larvae of Aedes aegypti.
Accumulation of reduction a density of 3rd larvae Aedes aegypti has a simmilar result with
datas were analyzed using statistic methods. There was a significant different (p<0,05) of a
potential predation among a Tilapia (Oreochromis niloticus), a Common carper (Cyprinus carpio),
and a Guppy (Poecillia reticulata). Collected data was analyzed using LSD methods showed that
an averages consumption at 18 hours – 24 hours of a Common carper (Cyprinus carpio) has a
different result between a Guppy (Poecillia reticulata) and a Tilapia (Oreochromis niloticus).
Averages consumption at 18 hours – 24 hours of between a Guppy (Poecillia reticulata) and a
Tilapia (Oreochromis niloticus) showed have the same ability to consume 3rd larvae of Aedes
aegypti.
A total averages consumption of 3rd larvae Aedes aegypti among a Common carper
(Cyprinus carpio), a Guppy (Poecillia reticulata), and a Tilapia (Oreochromis niloticus) at every
consumption observation time based on statistic LSD methods showed that in 1 hour consumtion
time observation showed a different potential predation. A total averages consumption of 3 rd larvae
Aedes aegypti among a Common carper (Cyprinus carpio), a Guppy (Poecillia reticulata), and a
Tilapia (Oreochromis niloticus) at every consumption observation time based on statistic LSD
methods showed that among 6 hours, 12 hours, 18 hours, and 24 hours consumption time
observation showed a different potential predation.
Potential predation was analyzed using LSD methods showed that an averages consumption
a Guppy (Poecillia reticulata) has a different result between a Common carper (Cyprinus carpio)
and a Tilapia (Oreochromis niloticus). Potential predation between a Common carper (Cyprinus
carpio) and a Tilapia (Oreochromis niloticus) showed have the same ability to consume 3rd larvae
of Aedes aegypti.
Based on observation of the anatomy of digestive tract organs, a Tilapia (Oreochromis
niloticus) has a wider opening-mouth-length and Tilapia's mouth could spurted. The anatomy of
mouth on digestive tract organs of Common carper (Cyprinus carpio) has a mouth near its nose
and narrowest opening-mouth-length. The anatomy of mouth on digestive tract organs of a Guppy
(Poecillia reticulata) has the 2nd wider opening-mouth-length and has an elastic mouth. So, that
may conclude that a Tilapia (Orechromis niloticus) has a higher consumption of 3rd larvae of Aedes
aegypti, a Common carper (Cyprinus carpio) has the 2nd level, and a Guppy has the 3rd level of a
total consumption 3rd larvae of Aedes aegypti.
Public Health Department, Faculty of Sports Science, F1 Building, 2nd
Floor, Sekaran Campus Gunungpati, Semarang City, Central Java Province, Indonesia, 50229 Phone/ Fax. +6224 8508007
289
A total consumption of 3rd larvae Aedes aegypti / (cm) opening-mouth-length was analyzed
using ratio, and showed that a Common carper (Cyprinus carpio) has the highest potential
predation to consume 3rd larvae of Aedes aegypti than a Tilapia (Oreochrmonis niloticus) and a
Guppy (Poecillia reticulata). A Tilapia (Orechromis niloticus) has a higher potential predation than a
Guppy (Poecillia reticulata), it means a Guppy has a lowest potential predation.
Based on observation of the intestine anatomy of digestive tract organs of a Common carper
(Cyprinus carpio), Tilapia (Oreochrmonis niloticus) and a Guppy (Poecillia reticulata). There were a
different intestine length amongs the subjects due to potential predation of 3rd larvae of Aedes
aegypti.
Potential predation a Tilapia (Orechromis niloticus) to consume 3rd larvae of Aedes aegypti
due to intestine-length showed has a longest intestine-lenght, a Guppy (Poecillia reticullata)
showed has the 2nd intestine-length, and a Common carper (Cyprinus carpio) has the shortest
intestine-lenght. A total consumption 3rd larvae of Aedes aegypti / cm intestine-length was analyzed
using ratio. Ratio of a total consumption 3rd larvae of Aedes aegypti / cm intestine-length a
Common carper (Cyprinus carpio) showed has a highest ratio, a Guppy (Poecillia reticulata) on the
second ratio, and a Tilapia (Oreochromis niloticus) on the third ratio. So, it means that a Common
carper (Cyprinus carpio) has a higher ability to consume 3rd larvae of Aedes aegypti than a Tilapia
(Orechromis niloticus) and a Guppy (Poecillia reticulata).
Potential predation a Tilapia (Orechromis niloticus) to consume 3rd larvae of Aedes aegypti
due to body-length showed has a longest body-lenght, a Guppy (Poecillia reticullata) showed has
the 2nd body-length, and a Common carper (Cyprinus carpio) has the shortest body-lenght. A total
consumption 3rd larvae of Aedes aegypti / cm body-length was analyzed using ratio. Ratio of a total
consumption 3rd larvae of Aedes aegypti / cm body-length a Common carper (Cyprinus carpio)
showed has a highest ratio, a Guppy (Poecillia reticulata) on the second ratio, and a Tilapia
(Oreochromis niloticus) on the third ratio. So, it means that a Common carper (Cyprinus carpio)
has a higher ability to consume 3rd larvae of Aedes aegypti than a Tilapia (Orechromis niloticus)
and a Guppy (Poecillia reticulata).
Environment obsevation during the research was observed about the environment humidity,
a environment temperatures, and water temperatures of the mini containers. Humidity and
temperatures related with the water dissolved oxygen. Dissolved oxygen has a contribution to fish
habitat and its life. The main contribution of oxygen is related with the activity and the metabolism
of fish. Fishes need a dissolved oxygen to repiration, burning food processing, swimming activity,
growth, reproduction, and others. A 35% source of a dissolved oxygen is from diffusion oxygen at
the atmosphere.
Larvae of Aedes aegypti has a different shape and anatomy depend on the stadium of
growth. A 3rd larvae of Aedes aegypti has a tiny body and shape without a legs, has a simple
symmetric billateral of bristle, transparrant colour, unclear spinal pines on the thorax, and a siphon.
Larvae of of Aedes aegypti always move and active, move routinelly up to water surface level and

290
Public Health Department, Faculty of Sports Science, F1 Building, 2nd
Floor, Sekaran Campus Gunungpati, Semarang City, Central Java Province, Indonesia, 50229 Phone/ Fax. +6224 8508007
down to bottom water level. Larvae moves to the ground to take a feed (bottom feeder). Larvae
moves up to water surface to take an oxygen. The body of larvae will make an angle perpendicular
to the water surface when larvae take a rest time.
Potential predation relates with a sex (male-female) of a Tilapia (Orechromis niloticus), a
Common carper (Cyprinus carpio), and a Guppy (Poecillia reticulata) was not observed.
Connection between potential predation and sex of fishes are ignored, because it is impossible to
distinguish a sex based on the morphology when the fishes are young. Resbensburg (2010) said,
a sex of fishes did not influence fish behaviour, because the main characteristic of fish behaviour
relates with stimulation sensory to the suite object of food.
A mature Guppy (Poecillia reticulata) was used as object in this research. Meanwhile, a
young Tilapia (Oreochromis niloticus) and a Common carper (Cyprinus carpio) as a subject. An
age of fishes being ignored because the aim of this research is to understanding relation a
potential predation influenced a total body length. FAO (2014) explains that a Tilapia (Oreochromis
niloticus) and a Common carper (Cyprinus carpio) have 2-3 cm a total body length will have a
different age. A Common carper (Cyprinus carpio) has an average age 3-4 weeks, and a Tilapia
(Orechromis niloticus) has an average age 2-3 weeks.
Potential predation of fish is an capability of fish to kill and to consume a preys, such as 3 rd
larvae of Aedes aegypti. In this research 3rd larvae of Aedes aegypti as a natural preys for
Common carper (Cyprinus carpio), Tilapia (Orechromis niloticus), and Guppy (Poecillia reticulata).
Daily food intake of fishes to get a food is depend on their aggressiveness. A tiny fishes
somestimes more aggresive than the big ones, to get a feed. Mini containers perhaps to small,
only contain 1 L water with 10 cm water level, so that, make a fish easier to kill and to eat the preys
than the big ones. Nature character of fish to kill and eat their preys is so important to uses
Common carper (Cyprinus carpio), Tilapia (Orechromis niloticus), and Guppy (Poecillia reticulata)
as a biological control agent to control the population of Dengue Haemorraghic Fever vector
(Nababan, 2006).
A size of larvae influence an amount of larvae that consumeb by fishes. Mature larvae will
have a big size than the younger ones, and more longer. Otherwise the stomach size of fish is
stagnant (Novalian, 1995). Visual stimulatory can influence a feed behaviour of fish. A shape an
object will stimulate a feed behavior of fish.
Stomach represents a segment of digestive tract, that is has a wider diameter than others
digestive organs of fish. A size of stomach relates with its function as a receptacle of feed. Feeding
intake will digest process on the digestive organ. The nutrition will absorb by intestine to change to
be an energy. The energy is needed to biology metabolism of fish. An average consumption of fish
due to the reducing of body weight and according to the size of fish.
Fish is not eat every time and eat any food they meet in natural habitats. Fishes shows a
rythms of feeding intake and sellect their food. Fishes will adapt to their rythms of feeding intake,
altough some of fishes need few weeks to make their own ryhtm of feeding intake. Physiology of
Public Health Department, Faculty of Sports Science, F1 Building, 2nd
Floor, Sekaran Campus Gunungpati, Semarang City, Central Java Province, Indonesia, 50229 Phone/ Fax. +6224 8508007
291
fish is a respon for environment factors, such as water condition, amount of preys, temperatures,
dissolved oxygen, and other combinations (Liew et al., 2012).
Noves (2012) said that a younger fish has a lower capability of feeding intake than the big
ones. Fishes that are always feed a tiny food, usually have a litlle stomach (Riche, 2004). Size
stomach of Tilapia (Orechromis niloticus) has a wider stomach and can expands. A Tilapia
(Oreochromis niloticus) stomach can expand to keep the food inside the stomach, so that, a Tilapia
(Orechromis niloticus) can consume lot of their prey (Fish, 1951 cit. Riche, 2004). Increasing
frequency of feeding intake will reduce an aggressivity behaviour of fish( Grayton and Beamish,
1977; Holm et al. 1990). Feeding intake of a younger fishes are more frequent than the mature
ones (Riche, 2004).
Variation of group behaviour such as different on size, time, and due to with natural preys in
its habitats. Food digestion has a fast process, trough the small intestines, and then end of
intestines (Tawwab, 1995). Fishes not feed every times. Fish will feed according to their rythms.
Consuming feed on certain times, sometimes on daylight or nite. Circadians rythm is tend to
flexible compared to other higher vertebrates. Fishes show an inter-specific and intra-specific in
each phase of their live (Madrid et al., 2001; Silva 2010).
Closing
There are a differences potential predation between Tilapia (Oreochromis niloticus), a
Common carper (Cyprinus carpio), and a Guppy (Poecillia reticullata). The potential predation of
Tilapia, Common Carper, and Guppy as a biological control agent to consume 3rd larvae Ae.
aegypti linked with its digestive tract organ. Digestive tract anatomy and its measurement are
differences between Tilapia, Common Carper, and Guppy as its potential predation for biological
control.
A proper selection and implementation of larvivorous fish as biological vector control of
Dengue Haemorraghic Fever can reduce and eliminates the populations of Aedes aegypti as a
vector of DHF. Larvivorous fish has been applied in water reservoirs's society. Causing a problem,
that is the water became dirty. To overcome this problem, it is important to choose properly fish
due its digestive organ. Based on this research, a Common carper (Cyprinus carpio)
recommended as an agent of biological vector control program. Hope that the society will receive
larvivorous fish as the biological vector control program to reduce and to control the population of
vectors, so that the program to eliminate DHF will succees.
References
Anhar, Muhammad; Henry Kasmanhadi S.; Aradhita, Darayani; Sari, Silviana Novita; Hazrina,
Afifah. 2008. Cara Makan dan Kebiasaan Makan Ikan Nila (Oreochromis niloticus) dan Ikan
Nilem (Osteochilus hasselti). IPB. http://repository.ipb.ac.id/handle/123456789/32698.
Diunduh pada tanggal 30 September 2013.
292
Public Health Department, Faculty of Sports Science, F1 Building, 2nd
Floor, Sekaran Campus Gunungpati, Semarang City, Central Java Province, Indonesia, 50229 Phone/ Fax. +6224 8508007
Bambang, S., 1995. Kajian Komparatif Kemampuan Sebagai Predator Larva Dan Pupa Aedes
aegypti Antara Ikan Mujahir (Tilapia mosammbicus) Dengan Ikan Lele (Clarias bathracus)
[Skripsi]. Fakultas kedokteran UGM. Yogyakarta.
Damayanti, E dan Munif A., 2006. Respon Fungsional Ikan Sepat Biru (Trichogaster trichopterus)
Terhadap Larva Aedes aegypti Di Laboratorium. Media Litbang Kesehatan XVI No. 2 (2006).
Depkes RI. 2010. Pencegahan dan Pemberantasan Demam Berdarah di Indonesia, Jakarta: Ditjen
P2M Depkes R.I.: 2-6. Fish. G. R. 1951. Digestion in Tilapia esculenta. Nature 167:900
Grayton B.D. dan F.W. H. Beamish, 1977. Effects of fedding frequency on food intake, growth and
body composition of rainbow trout (salmo gairdneri). Aquaculture, 11:159-172.
Grima, L., Quillet, E., Boujard., Robert Graine, C., Chatain, B., Mambrini, M. 2008. Genetic
variability in residual feed intake in rainbow trout clones and testing of indirect selection
criteria. Genet. Sel. Evol. 40. 607-624.
Holm, J.C., Refstie, T., Bo, S., 1990. The effect of fish density and feeding regimens on individual
growth rate and mortality in rainbow trout (oncorhynchus mykiss).
Liew, Hon J., Amit Kumar Sinha, Nathalie Mauro, Marjan Diricx, Ronny Blust, Gudrun de Boeck.
2012. Fasting Goldfish (Carassius auratus) and Common Carp (Cyprinus carpio) Use
Different Metabolic Strategies When Swimming. Comparative Biochemistry and Physiology,
Part A. Elsevier. 163 (2012) 327-335.
Madrid, J.A., Boujard, T., Sanchez-vazques, F.J., 2001. Feeding-rhythms. In:houlihan. D., Jobling
M., Boujard. T. (eds.) Food intake in fish. Blackwell Science. Ltd. Oxford.pp.189-215.
Mardihusodo SJ. 1990. Mengembangkan dan meningkatkan Peran Serta Masyarakat dalam
Upaya pemberantasan Vektor Dengue Hemorraghic Fever. BIK. Cermin Dunia Kedokteran.
Pusat Penelitian Pengembangan PT. Kalbe Farma. Jakarta.
Moriarty, d. j. w. and c.m moriarty. 1973. the assimilation of carbon from phytoplanton by two
herbivorous of the tilapia oreochromis niloticus, feeding on two species of blue green algae.
Environ. Biol. Fishes, 31: 75-85.
Mundayana Y dan SR Suyanto. 2003. Ikan Hias Air Tawar Guppy. Penebar Swadaya. Jakarta.
Nababan, Y. A., 2006. Potensi ikan gapi (Poecillia reticulate) Sebagai Agen Pengendali Hayati
Larva Aedes aegypti di Laboratorium. Skripsi FKH IPB.
Novalian, Roni. 1995. Kemampuan Predator Ikan Betta (Betta splenderes regan) terhadap larva
culex sp.
Novaes JLC and Carvalho ED, 2012. Reproduction, food dynamics and exploitation level of
oreochromis niloticus (perciformis : cichlidae) from artisanal fisheries in barra bonita reservoir
brazil. Rev.biol trop (int. trop. Biol) ISSn-0034-7744) vol. 60 (2):721-734.
Resbensburg, P., 2010. Assessment and Evaluation of Temperament Traits in Carp (Cyprinus
carpio L.) With Contrasts Between Mirror and Scaled Morphological Phenotypes. Diploma
[Thesis]. University of Berlin.
Riche, M., Oetker M., Haley D., Smith, T., Garling D. L., 2004. Effect of feeding frequeny on
compsumtion, growth, and efficiency in juvenile tilapia (oreochromis niloticus). The Israeli
Journal of Aquaculture – Bamidgeh 56 (4), 2004, 247-225.
Silva F.R, Martinez F.J., Villaroel M. Vasques S.FJ. Daily Rhythms of locomotor activity, feeding,
feeding behavior and dietary selection in nile tilapia (oreochromis niloticus). Comparative
biochemistry an dphysiologypart A. 156 (2010) 445-450. elsevier.
Tawwab MA, Marakby HI. Length-weight relationship, natural food and feeding selectivity of nile
tilapia, oreochrmonis niloticus L. in fertilized earthen ponds. Fish Ecology Department,
Central Laboratory For Aquaculture Research, Abbasa, Abo Hammad Sharqia, Egypt.
Wang, J., Flickinger, S. A., Be, K., Liu, Y., Xu, H., 1989. Daily food compsumtion and feeding
rhythm of silver carp, hypophthalmichthys molitrix, during fry to fingerling period.
Aquaculture, 83:73-79.
Public Health Department, Faculty of Sports Science, F1 Building, 2nd
Floor, Sekaran Campus Gunungpati, Semarang City, Central Java Province, Indonesia, 50229 Phone/ Fax. +6224 8508007
293
EFFECTIVENESS COMPARATIVE OF PLASTIC AND CANS OVITRAP AS AEDES AEGYPTI LARVAE TRAP
Widya Hary Cahyati
Semarang State University, Indonesia
Corresponding Author: [email protected]
Abstract Introduction: Ae.aegypti resistance to pyrethroid class insecticides, wehereas this insecticides commonly use for vector control in Indonesia. This is the reason why we need to develop a safer vector control, for example by ovitrap. Research problem was whether cans ovitrap more effective than plastic ovitrap. Research purpose to determine cans ovitrap more effective than plastic ovitrap. Methods: Method research was experimental research. Ovitrap models that will be tested in this study are plastic ovitrap without a cap and cans ovitrap without a lid. Both types of ovitrap filled hay immersion attractant half of their body, left in a closed mosquitoes cage, containing 80 female mosquitoes which ready to spawn. The independent variable is ovitrap material, the dependent variable is the number of larvae trapped. Results: The result of this study showed that number of Ae. Aegypti larvae which trapped by can
ovitrap for 30 days were 951 tails and the number of Ae. Aegypti larva which trapped by plastic ovitrap for 30 days were 321 tails. Conclusion, can ovitrap more effective than plastic ovotrap. Key Words: Ovitrap, larvae, mosquitoes, aedes aegypti
Introduction
In public health, the role of insect has a very important meaning, because the insects could
be vectors of communicable diseases and as cause some disadvantages. Many diseases can be
transmitted by insect vectors, such as dengue fever, malaria, filariasis, and so on. Such diseases
can be transmitted from one person to another person through mosquitoes bite. Some mosquitoes
live in human settlements as a habit, thus increase the risk to be able to transmit the disease from
one person to another person. Mosquitoes often breed in water reservoirs such as bathtub, jars,
drums, used goods, potted water plants, and another water reservoir, whereas those objects are
located very close to the human environment, and some even in the house (Nurmaini, 2003).
To anticipate the impact of mosquitoes, all public needs to know about the life habits of
mosquitoes for prevent bad effects caused by mosquitoes. Mosquito larvae monitoring activities
carried out in order to determine the density of larvae. It is one of the basis to take action in effort
to reduce the mosquito population. If all people have high knowledge of the impacts and risks that
can be caused by mosquitoes transmitted disease, it is expected that the public can independently
make efforts to control mosquito populations (F Fahmy, 2009)
There are some density of mosquito larvae indicators. These indicators include House index
(HI), container index (CI), and Breteau index (BI). One of simple tool that can trap mosquito larvae
is ovitrap (F Fahmy, 2009).
294
Public Health Department, Faculty of Sports Science, F1 Building, 2nd
Floor, Sekaran Campus Gunungpati, Semarang City, Central Java Province, Indonesia, 50229 Phone/ Fax. +6224 8508007
Ovitrap is a tool to trap the mosquito‘s eggs. Mosquitoes will lay their eggs on the surface or
in the water. The eggs are already in the water, in a few days will develop into larvae, pupae, and
adult mosquitoes. Ovitrap is a container filled with water or attractants. If ovitrap covered by
netting, when the eggs laid by mosquitoes on the surface of the water when they hatch and
become adult mosquitoes are not able to get out of the container and not able to feed so eventually
die (Rozendaal, 1997).
Ovitrap installation in the neighborhood, especially in endemic areas is expected to reduce
the rate of mosquito population. Reduced the mosquito population will have an impact on the
decline in infection rates of communicable diseases that can be transmitted by mosquitoes, such
as malaria and dengue. Making ovitrap can be done by using used materials that are easily found
in the environment, either a plastic or cans (Rozendaal, 1997).
Aedes mosquito, both of Aedes aegypti and Aedes albopictus are vectors of arbovirus
diseases such as yellow fever (Yellow Fever), dengue fever (Dengue Fever), dengue hemorrhagic
fever (Dengue Hemorrhagic Fever), and Chikungunya (Foster et al, 2002). Such diseases often
lead to outbreak (KLB), especially in tropical and subtropical countries, including in Indonesia.
Specially in Indonesia, yellow fever does not occur.
Prevention of disease that can be transmitted by mosquitoes, such as dengue hemorrhagic
fever (DHF) and other arboviruses more emphasis on vector control problems. Control of mosquito
vectors, especially Ae aegypti propulasi aims to reduce mosquito density. Indonesian Health
Ministry official data showed that Aedes mosquito density is high enough, ie the house index 20%,
with a transmission threshold is 5% (Soeroso et al, 2002). Density data in various cities in
Indonesia is quite fluctuating, including House Index (HI) reached 44.7% in Palembang and 27.3%
in North Jakarta (Hasyimi M, et al., 2004).
The size of the population density illustrates the percentage of positive mosquito larvae were
in observed houses. Other measurement that can be used to know the density of mosquitoes is
ovitrap index (OI), the proportion between the number of larvae positive ovitrap and ovitrap
installed. OI in Semarang City reached 36.6%, in which species dominated is Ae aegypti (72.78%)
(Wahyuningsih et al, 2007).
Efforts to reduce the population density of Aedes mosquitoes, especially Ae. aegypti, has a
very important and strategic in preventing the transmission of diseases that can be transmitted by
mosquitoes, especially Ae. Aegypti. Sources of larvae removal can succeed by involving
community participation. Singapore success to reduce dengue vector by using egg trap (ovitrap).
This tool can be used to reduce the 45-100 percent by installing ovistrip insecticide-treated
mosquito. Field application of this modification is useful to suppress significantly the population
density of Ae aegypti, based on the container index. Similar models were made by placing the
insect screen on the surface of the water, so when the imago in ovitrap become pupa will detained
in ovitrap and dead because drowned in the water. This tool is called autolarval trap. Auto-larval
Public Health Department, Faculty of Sports Science, F1 Building, 2nd
Floor, Sekaran Campus Gunungpati, Semarang City, Central Java Province, Indonesia, 50229 Phone/ Fax. +6224 8508007
295
traps replication were installed around the water reservoir can suppress 61.49% for HI, 50.91% for
CI, and 53.62% for BI (Polson et.al, 2002).
Effort to increase the number of eggs trapped in ovitrap can also be done using hay
immersion water attractant 10%. The mean of egg Ae. aegypti were trapped could eight times
more (KA Polson, et.al, 2002). Another form of attractant is shells carpet immersion water (Paphia
undulata) and windu shrimp. This attractant increase the attractiveness of Ae. aegypti gravid
females to lay eggs in it. It has been proven both in the laboratory and in the field of research.
Fermentation of Maximum P leaves for 15-20 days also can be an effective attractant. Various
types of attractants produce CO2, ammonia and octenol. These compounds attractive mosquito
olfaction (Thavara et.al, 2004).
Methods
This study was an experimental study. Ovitrap which will be tested in this study using a big
carbonated beverage plastic bottle and cans. This study will be conducted in the parasites
laboratories of Medical Faculty, Gadjah Mada Uiversity of Yogyakarta for 30 days. The subjects in
this study were 80 Aedes aegypti mosquitoes placed in a sealed cage. The independent variable in
this study is ovitrap material, while the dependent variable is the number of larvae trapped. Ovitrap
materials will studied are plastic and cans. Plastic bottles that will be used as ovitrap is a big bottle
of carbonated beverage. This bottle will cut limited to the neck of the bottle. The second model is a
cans. Both types of ovitrap will be filled half of hay immersion attractant. The number is the number
of trapped larvae of Aedes aegypti larvae were caught at each ovitrap, calculated every five days,
with a ratio scale.
Instrument in this study consisted of a ovitrap and counting form of mosquitoes larvae
trapped. Ovitrap is divided into two types, ovitrap from plastic bottles, and ovitrap from cans. To
make ovitrap, the materials needed are big carbonated beverage bottles, tin cans with similar size
with plastic bottle, hay immersion as attractants, mosquitoes cages, Aedes aegypti adults who are
full of blood.
Ovitrap making procedures are cut the big plastic carbonated beverages plastic bottle with
dark-colored, former. After the plastic bottles are cleaned, cut limited to the neck of the bottle.
Plastic bottles that have been truncated and filled with hay immersion attractant 10% as much as
half of the bottle. Plastic bottle that has been filled hay immersion attractant inserted into the
sealed mosquito cage, and allowed to stand for 30 days, and observed every 5 days.
Ovitrap manufacturing procedures are made from tin cans which have similar size with
plastic bottles to make ovitrap. After the cans are cleaned and then filled with hay immersion
attractant 10% as much as half of the cans. Cans that have filled the hay immersion attractants
inserted into the sealed mosquito cage, and allowed to stand for 30 days, and observed every 5
days.
296
Public Health Department, Faculty of Sports Science, F1 Building, 2nd
Floor, Sekaran Campus Gunungpati, Semarang City, Central Java Province, Indonesia, 50229 Phone/ Fax. +6224 8508007
Attractant-making procedures is choose a good hay, and then dried. After the hay is
completely dry, then take as much as 1 kg. 1 kg dry hay cut into small pieces and soaked in 1 liter
of water for 7 days, and then filtered. The hay immersion water and diluted to achieve a
concentration of 10%.
Processing data using the number of trapped larvae, which is calculated every 5 days for 30
days, then for the final data processing is done by editing and tabulating processing. After collected
data, we will correct of the data by examining the completeness, legibility, eliminating doubts data
observation. Data tabulating is present the data observed in research by tables for ease in reading
research data (Budiarto, 2003).
The implementation procedure of this study is the researcher made two ovitrap of different
materials, the researcher apply two kinds of ovitrap in the cage of Aedes aegypti mosquito in
parasites laboratory of the medical Faculty for 30 days, and counted the number of larvae of
mosquitoes trapped every 5 days, and then researcher process and analyzing research data and
report the results of research.
Results and Discussion
The study was conducted in the laboratory. Plastic ovitrap and cans ovitrap included insert in
the sealed mosquito cage and filled with 80 female Aedes aegypti mosquitoes fed blood. The study
was conducted over 30 days, with observations every 5 days. The results showed that the
fluctuation in the number of larvae trapped in both ovitrap.
Table 1. The number of Aedes aegypti larvae trapped in ovitrap
Observation The number of larvae trapped
Cans ovitrap Plastic ovitrap
Day-5 0 0 Day-10 0 0 Day-15 574 98 Day-20 102 73 Day-25 110 128 Day-30 163 22
Jumlah 951 321
From the table above it can be seen that the first and second observation (day 5 and day 10)
was not found larvae. On day 15, in the cans ovitrap found 574 larvae, whereas the plastic ovitrap
only found 98 larvae. On day 20, in the cans ovitrap found 102 larvae, whereas the plastic ovitrap
only found 73 larvae. On day 25, in the cans ovitrap found 110 larvae, whereas the plastic ovitrap
more abundant, are 128 larvae. At last observation (day 30), the cans ovitrap found 163 larvae,
whereas the plastic ovitrap only found 22 larvae. Overall, the number of larvae trapped in ovitrap
cans as much as 951 larvae, whereas the plastic ovitrap many as 321 larvae.
Management of the physical environment or to control the mosquito population that has been
widely known by the public. In Indonesia, the physical activity for mosquito vector control known as
Public Health Department, Faculty of Sports Science, F1 Building, 2nd
Floor, Sekaran Campus Gunungpati, Semarang City, Central Java Province, Indonesia, 50229 Phone/ Fax. +6224 8508007
297
the mosquito nest eradication (PSN), by 3M (drain, close, and hoard) a breeding ground for the
mosquito Aedes aegypti. PSN has been implemented by the community, but until now has not
shown the expected results. This is evident by the increasing incidence of dengue in Indonesia, so
there needs to be other efforts that need to be done to reduce the incidence of dengue.
Ovitrap (abbreviation of Oviposition trap) is a tool to detect the presence of mosquitoes. If the
density is low and mosquito larvae survey which showed that non-productive (eg B1 less than 5),
as in normal conditions. In particular, ovitrap used to detect mosquito infestations to new areas that
had previously been eradicated.
The purpose of the trap egg survey was to determine the presence / absence of mosquitoes
in very low density situation, which is the method of single larvae and can not find any positive
containers. The survey was conducted by using a tool called ovitrap. Ovitrap like vessel (cans,
plastics, or pieces of bamboo) that the inside walls are painted black and given sufficient water.
Inserted into the vessel padel which is a piece of bamboo or gauze and dark colour as a place to
store eggs. Ovitrap will be placed either inside or outside the house which dark and damp place
because mosquitoes like this places to spawn. After one week, we observe the presence / absence
of mosquito eggs.
Mosquitoes including the types of insects that enter the Hexapoda class and Diptera ordo. In
general, the mosquitoes had 4 stages in its life cycle (metamorphosis), namely egg, larva, pupa,
and adult. Aedes aegypti having complete metamorphosis, ie egg - larva - pupa - adult. Stadium
eggs, larvae, and pupae live in water, whereas the adult stage of life outside the water. In general,
the eggs will hatch in 1-2 days after being submerged in water. Larva stage usually lasts between
5-15 days, normally lasts 9-10 days. The next stage is the pupal stage lasts 2 days, then into adult
mosquitoes and the cycle will take place again. Under optimal conditions, the development from
egg stage to become adult mosquitoes require at least 9 days (Azaludi, 2009).
Aedes female mosquito adult mosquitoes usually lay eggs in watery places and not flowing.
In the dry, mosquito eggs will be damaged and die. Egg laying habits of mosquitoes very
depending on the species. Anopheles mosquitoes will lay their eggs on the surface of the water
one by one or in groups but disjoint. Eggs Anopeles have flotation devices. Culex mosquitoes will
lay eggs on the water surface swarming and united so as to form a raft to float. Aedes mosquitoes
lay eggs which stick to the walls of the container and float on the water surface (Azaludi. 2009).
Another alternative in an effort DHF prevention activities related to environmental
management is by installing a device that can be used to trap the mosquito eggs, called
Oviposision trap (ovitrap). This tool was first developed by Fay and Eliason in 1966. This tool is
used by the Central for Disease Control and Prevention (CDC) in the Ae. aegypti surveillance
activities. Ovitrap standard tube made of plastic cups (350 milliliters), 91 millimeters high and 75
millimeters in diameter, painted black on the outside, filled with water three-quarters and given a
layer of paper, wood slats, or bamboo as a nesting site. By installing 2,000 ovitrap in endemic
areas, this method proved successful in reducing the vector density in Singapore (TB Teng., 2001).
298
Public Health Department, Faculty of Sports Science, F1 Building, 2nd
Floor, Sekaran Campus Gunungpati, Semarang City, Central Java Province, Indonesia, 50229 Phone/ Fax. +6224 8508007
Several studies that the related ovitrap prove that ovitrap quite effective in dengue vector
control. Research conducted Zeichner & Perich (1999) is to create a lethal / autocidal ovitrap
(deadly mosquito trap) on ovistrip given insecticide, the results can significantly control the
populations of Ae. aegypti (Zeichner BC, et al 1999). This modification also done by Tokan (2008)
using the concentrations of insecticide Cypermethrin 5% using the method of lethal ovitrap can kill
mosquitoes and reduce the hatchability of eggs by 70% Ae.aegypti (Tokan PK, 2008). In addition,
modifications ovitrap autocidal ovitrap also be done by Sithiprasasna et al (2003) in Thailand with
nylon gauze put on the surface of the water in ovitrap, the results are able to reduce the population
of Aedes aegypti (Sithiprasasna et al, 2003). The same is done by Sayono (2008) in the Semarang
city with made modifications ovitrap can caught more mosquitoes with attractants that contain
water shrimp immersion (Sayono., 2008). Similarly, conducted by Umniyati (2004) in Bantul,
autocidal ovitrap also success to reduce the number of HI, CI, and improve the ABJ (Umniyati et al,
2004).
One modification is to add substances ovitrap specific attractant, it is shown to increase the
number of eggs trapped. The use of attractants from several studies show good prospects in
monitoring and lowering the density of dengue vectors. Attractant can be derived from the content
of the plant that are easily found around the community or other materials that have a scent that
attracts mosquitoes to lay eggs. One of the attractants that can attract mosquitoes to lay eggs are
hay immersion attractants. Polson et al (2002) using the hay immersion attractant water and prove
the number of eggs caught eight times higher than standard ovitrap (Polson KA, Curtis C., et al,
2002). The same is done by Santos et al (2003) using 10% hay immersion water and combined
with Bacillus thuringiensis var israelensis (Bti) proved to be the number of eggs that are trapped
more (SRA Santos et al, 2003). Research autocidal ovitrap in Gunungkidul also shows the same
thing, the average mosquito trapped in autocidal ovitrap with hay immersion attractant greater than
double the average autocidal ovitrap with plain water (Dwinata, 2012).
Ovitrap autocidal use is not yet popular among the society at large and have not been widely
used as a tool to control populations of Ae. Aegypti. Autocidal use ovitrap and hay immersion as
attractants in agricultural areas in Indonesia can be a local solution vector control based on DBD
endemic areas. Beside as vector control, autocidal ovitrap also serves to collect monitoring data
density and the vector potential vertical transovarial transmission in an area (Norzahira et al,
2011). Research Gama et al (2007) in Brazil, shows that ovitrap more sensitif than surveys in
detecting the presence Aedes larvae sp (Gama et al, 2007), so that the integrated vector control
programs and early detection transmission can be done faster. Overcoming problems with local
resources is a characteristics of Public Health.
The concept of integrated control is integrating control measures are potentially effective,
economical, and ecological to suppress the insect vector populations at levels that can be
tolerated. The concept of control can be applied to a type of insect vector diseases other than Ae.
aegyipti and Ae. abopictus associated with vector borne diseases in humans. Vector control
Public Health Department, Faculty of Sports Science, F1 Building, 2nd
Floor, Sekaran Campus Gunungpati, Semarang City, Central Java Province, Indonesia, 50229 Phone/ Fax. +6224 8508007
299
integrated concept commonly used to control insects vectors and pest vectors of plant diseases
worldwide implementation associate thought pattern and true methods in the prevention of pests
and diseases in the appropriate time. The principle involves the search for and develop alternative
ways compatible and effective to control target pests and diseases. In Indonesia, that ways
described into regulation cultivation as a basic foundation for preparation of crop protection policy
in Indonesia. The concept was born as a way out of the trap of the use of synthetic pesticides are
increasingly expensive and high risk to threats to human health and the environment (Supartha,
2003).
In America, integrated vector control is conceptualized not only to vector of dengue which
transmitted by Ae. aegypti but also to control vector populations other diseases such as rats,
mosquitoes, and other flies with careful consideration through physical, chemical, and biological
(Lloyd, 2003). Currently, the only right way to control DB and DBD disease is reduce vector
population to lowered contact between humans and vector and controlling larval habitats of variety
locations.
This method requires sufficient knowledge to identify the type and character, habitat and
behavior of living or their bioecologi and significance of the vector mosquito as a deadly infectious
disease transmission. It required the development of technology and community-based strategies
to ensure the sustainability of control effort
Vector control is recognized that prevention DHF is still based on vector management and
termination of its life cycle. For that many technologies developed for both the vector control
nature-based, physical-mechanical, chemical and society. Rui et al. (2003 in Kardinan, 2007) that
developed a technology that can avoid mosquitoes by anti-mosquito lotion or cream. Repellents
that have been circulating in Indonesia with active ingredient DEET (Diethyl toluamide) with
synthetic chemicals toxic in concentrations of 10-15% (Gunandini, 2006). There was also
dikhlorvos in spray aerosol form which has been banned by the Government Indonesia because of
harm to human health. While propoxur is still allowed, although has caused thousands of deaths in
Bophal-India. The space spraying vector control is the fogging (thermal fogging) and Ultra Low
Volume (cold fogging) with malathion insecticide from organophosphate class has been used since
1972 in Indonesia (Sudyono, 1983 in Suwasono & Soekirno, 2004). Bendiocarb insecticides from
carbamate class has also been tested with ULV formulation (Hadi et al, 1993). This way is
commonly done at the outbreaks times, especially in the critical months dengue attack. Although
the active ingredient it is not always used effectively for vector control because in some places,
Aedes already showed resistrensi against some insecticide used. Jirakanjanakit (2007b) reported
that nearly all the populations of Ae. aegypti showed resistance to pyrethroid insecticide,
permethrin, and deltamethrin common used in Thailand. If fumigation is used the result can only be
banish or kill imago but excluding larvae. fumigation with Malathion 4 % with diesel solvent, which
is still considered effective only able to kill imago at 100-200 meter radius of effectiveness only one
until two days (Judarwanto, 2007). In such conditions, the use of insekstisda besides ineffective
300
Public Health Department, Faculty of Sports Science, F1 Building, 2nd
Floor, Sekaran Campus Gunungpati, Semarang City, Central Java Province, Indonesia, 50229 Phone/ Fax. +6224 8508007
and expensive, also harmful to health and the environment. In anticipation of these events many
pesticides researchers do exploration of insecticide with active ingredients from plants and
microbes. Kardinan (2007) tried several types of basil plant extracts as mosquito repellent.
researchers attempt to pick basil eugenol-containing active ingredients, tymol, cyneol or estragole
as an ingredient - repellent active ingredient (repellent) insects. Basil potentially as repellent Ae.
aegypti, although still under the power of DEET protection. Highest protection power was achieved
by 79.7% for one hour (Kardinan, 2007).
Now, Malaysia develops engineered sterile male mosquitoes that released in the fishing
villages, in Ketam island , Malaysia. The release of Ae. egypti males have undergone genetic
engineering was then expected to marry Ae. egypti female in nature. Thus the female mosquitoes
in nature will incubate the sterile eggs and can not produce offspring. This method is still in the
phase testing that the effectiveness is unknown. In addition, methods need high technologically
with expensive fees. While waiting for the results, this way needs intensity of use technology
available. The use of Bacillus thuringiensis israeliensis (Bti) bacteria as compound also reported to
be effective in control larvae (Lutz, 2000). The active ingredients that have been sold commercially
under the trade name Bactimos, Teknar, and Vectobac in form varies the liquid, granular, and
briquette. The active ingredients are eaten by the larvae, release toxins that cause death in larvae
in one day. The microbe insecticides is very selective, not harm for other fish or organisms that live
in water, plants, wild life, pests or human. The larvicidal effectiveness about 2 days depending on
the way of the application. To briquettes formulations can survive and effective until one month
since release the toxin slowly.
Physical-mechanical control in a classical way as the installation of netting especially in
children have been conducted. Although the effective way to prevent contact between the vector
with the host, but not much done because the way for instalation of netting is very complicated.
Ways that are commonly performed is the eradication of habitat (nest) mosquitoes through the
simultaneous movement of 3 M (drain the water bath. closes the potential becomes breeding nest,
burying used items that can hold water). Water reservoirs such as bathtub, pool, flower pot
watering already done abatisasi movement. Conceptually motion mosquito larvae eradication
(PSN) with 3M once a week is adequate to cut the mosquito life cycle. Nevertheless factual
disease cases still follow the old pattern that is the beginning of each rainy season and increased
vector population explosion attack cases of dengue were sticking. This phenomenon occurs
because the effort with 3M PSN plus it has not been done systematically, simultaneously, and
sustainable. The simultaneous movement throughout the country of Cuba PSN ever initiated 100
years ago by General WC Gorgas to eradicate Aedes aegypti (Judarwanto, 2007). Efforts were
made to eradicate yellow fever (yellow fever disease). Movement is done massive it worked
brilliantly. The movement, later emulated by Malaysia and Singapore to impose financial penalties
on head of the family whose house caught mosquito larvae. Many modern technology has to offer
to dengue mosquito control, how to control the physical-mechanical with PSN still very relevant,
Public Health Department, Faculty of Sports Science, F1 Building, 2nd
Floor, Sekaran Campus Gunungpati, Semarang City, Central Java Province, Indonesia, 50229 Phone/ Fax. +6224 8508007
301
inexpensive, and environmentally friendly. It requires effort regulation, coordination, socialization,
and ammunition (funding) to change the mindset build community commitment and apparatus.
Nevertheless, there is no single way effective vector control. Therefore we need a integration and
compatible way for the implementation and needs coordinated with related parties.
Closing
The conclusions of this study are cans ovitrap more effective to trap mosquito larvae than
plastic ovitrap. The advice given to the public is more to participate in the control of Aedes aegypti
mosquito populations by installing ovitrap cans.
References
Azaludi. 2009. Demam Berdarah Dengue. http://azaluddinepid.blogspot.com/2009/12/demam-berdarah-dengue-dbd.html. Sitasi tanggal 2 Maret 2012
Budiarto, E. (2003) Statistika untuk Kedokteran dan Kesehatan Masyarakat, Jakarta:EGC. Dwinata I. 2012. Kajian lapangan penggunaan autocidal ovitrap terhadap penurunan angka
populasi nyamuk aedes di Kabupaten Gunungkidul. Yogyakarta: Gadjah Mada University. Hadi, S., Barodji & S. Nalim. 1993. Uji coba penyemprotan ULV (ULV spraying) insektisida
Bendiocarb 20% (Ficam ULV) terhadap vektor demam berdarah dengue Ae. aegypti. Bull. Pen Kes. 21(3) : 45 . 51.
Fahmi, F. 2009. Pemeriksaan Jentik Berkala. http://www.docstoc.com/docs/20753000/ Pemeriksaan-Jentik-Berkala. Sitasi tanggal 2 Maret 2012
Foster WA, Walker ED. 2002. Medical and Veterinary Entomology. Edited by Gary Mullen dan Lance Durden. London: Academic Press.
Gama RA, Silva EM, Silva IM, Resende MC, Eiras ÁE. 2007. Evaluation of the sticky MosquiTRAP™ for detecting Aedes (Stegomyia) aegypti (L.) (Diptera: Culicidae) during the dry season in Belo Horizonte, Minas Gerais, Brazil. Neotropical Entomology.36(2):294-302.
Gunandini, D.J. 2006. Bioekologi dan pengendalian nyamuk sebagai vektor penyakit. Pros. Sem. Nas. Pestisida Nabati III, Balittro. p.43-48
Hasyimi M, Soekirno M. 2004. Pengamatan Tempat Perindukan Aedes aegypti pada Tempat Penampungan Air Rumah Tanggga pada Masyarakat Pengguna Air Olahan. Jurnal Ekologi Kesehatan. Vol 3 No.1 April 2004: 37
Jirakanjanakit, N., P. Rongnoparut , S. Saengtharatip, T. Chareonviriyaphap, S. Duchon, C. Bellec & S. Yoksan. 2007b. Insecticide Susceptible/Resistance Status in Aedes (Stegomyia) aegypti and Aedes (Stegomyia) albopictus (Diptera: Culicidae) in Thailand During 2003–2005. J. Econ. Entomol. 100(2): 545-550
Judarwanto, W. 2007. Profil Nyamuk Aedes dan Pembasmiannya. http://www.indonesiaindonesia.com/f/13744-profil-nyamuk-aedes-pembasmiannya/
Kardinan, A. 2007. Potensi selasih sebagai repellent terhadap nyamuk Aedes aegypti. Jurnallitri. 13 (2): 39 – 42
Lloyd, LS. 2003. Strategic Report 7. Best Practices for Dengue Prevention and Control in the Americas. Environmental Health Project Contract HRN-I-00-99-00011-00. Office of Health, Infectious Diseases and Nutrition Bureau for Global Health U.S. Agency for International Development Washington, DC 20523.
Lutz, N. 2000. A North Carolina Summer Pest The Asian Tiger Mosquito Aedes albopictus. Eco Access. http//:www.ibiblio.org/ecoacces/info/wildlife/pubs/ asiantigermosquitoes.
Nurmaini. 2003. Mengidentifikasi Vektor dan Pengendalian Nyamuk Anopheles aconitus secara Sederhana. http://repository.usu.ac.id/bitstream/123456789/3705/1/fkm-nurmaini1.pdf
Norzahira R, Hidayatulfathi O, Wong HM, Cheryl A, Firdaus R, Chew HS. 2011. Ovitrap surveillance of the dengue vectors, Aedes (Stegomyia) aegypti (L.) and Aedes (Stegomyia) albopictus Skuse in selected areas in Bentong, Pahang, Malaysia. Trop Biomed. 28(1):48-54.
302
Public Health Department, Faculty of Sports Science, F1 Building, 2nd
Floor, Sekaran Campus Gunungpati, Semarang City, Central Java Province, Indonesia, 50229 Phone/ Fax. +6224 8508007
Polson KA, Curtis C, Seng CM, Olson JG, Chanta N, Rawlins SC. 2002. The Use of Ovitrap Baited with Hay Infusion as a Surveillance Tool for Aedes aegypti Mosquitoes in Cambodia. Dengue Bulletin Vol 26: 178-184.
Rozendaal JA. 1997. Vector Control. Methods for Use by Individual and Communities. Geneva: World Health Organization.
Santos SRA, Santos MMAV, Regis L, Albuquerque CMR. 2003. Field Evaluation of Ovitrap with Grass Infusion and Bacillus thuringiensis var israelensis to Determine Oviposition Rate of Aedes aegypti. Dengue Bulletin WHO. 27:156-62.
Sayono. 2008. Pengaruh modifikasi ovitrap terhadap jumlah nyamuk Aedes yang tertangkap. Semarang: Universitas Diponegoro.
Service MW. 1996. Entomology for Students. Chapman & Hall. Sithiprasasna R, Mahapibul P, Noigamol C, Perich MJ, Zeichner BC, Burge B. 2003. Field
evaluation of a lethal ovitrap for the control of Aedes aegypti (Diptera: Culicidae) in Thailand. Journal of Medical Entomology. 40(4):455-62.
Soeroso T, Umar I. A. 2002. Epidemiologi dan Penanggulangan Penyakit Demam Berdarah Dengue (DBD) di Indonesia Saat Ini. Dikutip dari Demam Berdarah Dengue. Naskah Lengkap Pelatihan bagi Dokter Spesialis Anak dan Dokter Spesialis Penyakit Dalam, dalam Tatalaksana Kasus DBD. Penyunting: Sri Rejeki H Hadinegoro dan Hindra Irawan Satari. Jakarta: Balai Penerbit FKUI.
Supartha, I W. 2003. Orasi Ilmiah. Peranan Pengendalian Hama Terpadu dalam Meningkatkan Pendapatan Petani dan Pelestarian Lingkungan di Era Pasar Global. Pidato Pengukuhan Guru Besar Tetap dalam Bidang Ilmu Hama dan Penyakit Tumbuhan pada fakultas Pertanian Universitas Udayana, Tanggal 6 Desember 2003.
Suwasono, H & M. Soekirno. 2004. Uji Coba Beberapa Insektisida Golongan Pyrethroid Sintetik Terhadap Vektor Demam Berdarah Dengue Aedes Aegypti Di Wilayah Jakarta Utara. Jurnal Ekologi Kesehatan. 3 (1): 43-47 WHO. 1980. Everinmental control for vector control.
Thavara U, Tawatsin A, dan Chompoosri J. 2004. Evaluation of Attractants and Egg-lying Substrate Preference for Oviposition by Aedes albopictus (Diptera: Culicidae). Journal of Vector Ecology 29 (1): 66-72.
Teng TB. 2001. New Inisiatives in Dengue Control in Singapore. Dengue Bulletin WHO. 25:1-6. Tokan PK. 2008. Efikasi Cypermethrin dengan Metode Lethal Ovitrap terhadap kematian serta
pengaruhnya pada daya tetas telur dan fekunditas nyamuk Aedes aegypti L (Diptera:Culicidae) di Laboratorium. Yogyakarta: Gadjah Mada.
Umniyati SR, Sutomo AH, Laksana B. 2004. Penggunaan otosidal ovitrap untuk pengendalian nyamuk vektor penyakit demam berdarah dengue. Jurnal Lembaga Pengabdian Masyarakat UGM. 2004/06/18/:37-41.
Wahyuningsih NE, Dharmana E, Kusnawati E, Sulistiawan A, Purwanto E. 2007. Survei Aedes Spp. di Tiga Kota: Semarang, Purwokerto dan Yogyakarta. Makalah disampaikan pada Konggres XII Jaringan Epidemiologi Nasional (JEN). Semarang: 19-20 Juli 2007.
Zeichner BC, Perich MJ. 1999. Laboratory testing of a lethal ovitrap for Aedes aegypti. Medical and Veterinary Entomology. 1999/09/01/;13(3):234-8.
Public Health Department, Faculty of Sports Science, F1 Building, 2nd
Floor, Sekaran Campus Gunungpati, Semarang City, Central Java Province, Indonesia, 50229 Phone/ Fax. +6224 8508007
303
FACTORS ASSOCIATED WITH BLOOD SUGAR CONTROL OF TYPE 2 DIABETES MELLITUS PATIENTS IN THE AREA OF PUBLIC HEALTH SERVICE
KEDUNGMUNDU SEMARANG
Irawan Prasetyo1, Mardiana1
1 Semarang State University, Indonesia
Corresponding Author: [email protected]
Abstract Introduction: Based on type 2 diabetes mellitus (DM) data case from Public Health Service Kedung Mundu Semarang in the year 2013 from January until October there were 1458 cases. This research was done to know whether there are factors or not related to Blood Glucose Control of tipe 2 DM patients in Kedungmundu area Public Health Center Semarang. Methods: This research used Case Control Study. This instrument was structured interview.Case sample in this research were 30 people and control sampel were 30 people. Results: The results of the research shows that there were relation between dietary adherence (p value=0,004, OR=5,500), physical activity, (p value=0,010, OR=4,667), consumption of Oral Hipoglicemic medicine (p value<0,0001, OR=15,545), knowledge about Diabetes Mellitus (p value=0,065, OR=3,143), following dietary education (p value=0,020, OR=4,000), family support (p value=0,016, OR=4,571) with blood glucose controled. Type 2 DM patients are obey the DM dietary treatment, doing the routine physical activities, consuming the Oral Hipoglicemic medicine and family motivation to Type 2 DM is also important, in order to keep the blood glucose controlled. Key Words: Blood glucose control, type 2 diabetes mellitus, public health service Kedungmundu
Introduction
Diabetes mellitus is a medical problem that occurred in several countries in the world
including Indonesia. Diabetes is a group of symptoms that occur in a person who have elevated
levels of sugar (glucose) blood insulin hormone deficiency in absolute or relative (Sunita Almaitser,
2008). Increased blood sugar levels will cause the diabetes complications that can occur in the
heart, eyes, kidneys, and other organs (Hartini, 2009).
In 2008, the World Health Organization (WHO) declared the 1.3 million deaths of 57 million
global deaths caused by the diabetes. Data from the agency said that Indonesia ranks 4th world
after the United States, China, and India in the prevalence of diabetes.
The prevalence of DM in Indonesia in 2000 was 1.9% (2.5 million people) (Directorate of
Communicable Disease Control, 2008). The results of health research (Riskesdas) in 2007, found
that the proportion of deaths due to diabetes in the age group 45-54 years in urban areas ranks
2nd is 14.7%. And in rural areas, diabetes is ranked 6th, namely 5.8%. While the national
prevalence of diabetes (based on measurements of blood sugar in people aged> 15 years residing
in urban areas) is 5.7%. Central Java was ranked 6th national prevalence of diabetes mellitus.
Depending on the prevalence of Diabetes Mellitus Insulin in Central Java province in 2009
amounted to 0.19%, an increase when compared to the prevalence in 2008 of 0.16%. Moderate
304
Public Health Department, Faculty of Sports Science, F1 Building, 2nd
Floor, Sekaran Campus Gunungpati, Semarang City, Central Java Province, Indonesia, 50229 Phone/ Fax. +6224 8508007
prevalence of insulin dependent diabetes known as type 2 diabetes, decreased from 1.25% to
0.62% in 2009 (Dinas Kesehatan Propinsi Jawa Tengah, 2009). While the prevalence of type 2 DM
in Central Java province in 2010 has decreased by 0.08% when compared to the prevalence in
2009 of 0.19%. The highest prevalence was in the city of Semarang by 0.58%. While the
prevalence of insulin dependent diabetes known as type II diabetes, has increased from 0.62% to
0.70% in 2010 (Dinas Kesehatan Propinsi Jawa Tengah, 2009).
DM disease in Semarang in 2010 amounted to 19.7% (Dinas Kesehatan Kota Semarang,
2011). The incidence of type 2 diabetes age (15-44 years) in 2010 amounted to 5915 cases, aged
45-64 years amounted to 24.420 cases and age ≥ 65 years amounted to 7392 cases. The death
rate from type 2 DM in 2009 as many as 56 people, while in 2010 as many as 25 people. The
death rate from type 2 DM in Semarang in 2011 by 37 people. The death rate from year 2005-2010
DM in Semarang city as a whole amounted to 483 people and 325 of them as Type 2 diabetes.
Kedungmundu Semarang City Health Center was ranked first in the number of patients with DM
Semarang. Number of patients with type 2 diabetes in 2012 at the Puskesmas Kedungmundu
amounting to 460 patients. The prevalence of type 2 DM in Kedungmundu Health Service in 2011
and the 5.8% increase in 2012 is 17.5%. Cases of type 2 diabetes in Semarang Kedungmundu
health centers in 2012 is equal to 2147, while the case of type 2 diabetes cases from January to
October 2013 amounted to 1458 cases (Dinas Kesehatan Kota Semarang, 2013).
Total number of patient visits DM 1459 visit. The number of people with diabetes in 2013
were examined Fasting Blood Sugar levels in Puskesmas Kedungmundu total 121 patients. Of the
121 patients there were 67% of the diabetic patients with unstable blood sugar levels or as many
as 82 patients. While the DM patients with unstable blood sugar levels by 33% or by 39 patients. In
the short-term management of DM aims to eliminate complaints / symptoms of DM. While the long-
term goal is to prevent complications. The purpose is implemented in a way to normalize glucose,
lipid, and insulin. Criteria for the control of both fasting blood glucose (80-109mg / dl), moderate
(110-139mg / dl), poor (> 140mg / dl). For patients 60 years and over, the target blood glukos
higher than normal (fasting <150 mg / dl and after meals <200 mg / dl) (Mansjoer, 2001; 583).
Pemeiksaan fasting blood sugar level is done by the patient should be fasting 10-12 hours in
advance before examination. Specimens may be serum, plasma, or blood capillaries. Fasting
blood glucose checks performed to determine the screening and diagnosis of diabetes, diabetes
therapy monitoring, as well as support in the control of diabetes, diagnosis and treatment of
several disorders such as metabolic acidosis, ketosis, dehydration, and diabetic coma.
Control of blood sugar in people with diabetes will be associated with dietary factors or meal
planning. This is because the disease diabetes is a chronic disorder of metabolism macro nutrients
are carbohydrates, proteins, and fats with the characteristics of the high concentration of sugar in
the blood even in empty stomach, as well as a very high risk of arterosclerosis or thickening of the
artery wall. In addition, lifestyle including physical activity such as regular physical exercise, playing
a role being impotant to control blood sugar levels. The benefits of regular physical exercise,
Public Health Department, Faculty of Sports Science, F1 Building, 2nd
Floor, Sekaran Campus Gunungpati, Semarang City, Central Java Province, Indonesia, 50229 Phone/ Fax. +6224 8508007
305
among others, normalize blood sugar and blood lipids, improving insulin action, reduce disease
and reduce the risk of cardiovascular disease.
In an attempt to control blood sugar levels, it is necessary also to increase knowledge of
patient counseling DM. The purpose of extension of diabetes mellitus is basically in order to
increase knowledge of the disease to the patient so that the patient can control the disease and
control blood sugar close to normal in the circumstances and may prevent complications. Basically
the goal is education on diabetes self-care so that the patient seemed to be his own doctor and
also know when to go to the doctor to get further guidance (Hiswani, 2001).
Psychosocial factors such as family support has an important effect on glycemic control in
adults with NIDDM and also an important influence on self-management in patients with DM. From
the research that has been done shows that family support was the strongest predictor in negative
affect patient health outcomes, especially with chronic diseases (Ellard & Smith, 1990).
The general objective of this study was to determine the factors related to the control of
blood sugar levels in patients with Type 2 Diabetes Mellitus in Public Health Service Kedungmundu
Semarang. While the particular purpose to describe the control of blood sugar levels, diabetes diet
adherence, physical activity, consumption of antidiabetic medication (OHO), knowledge about the
disease diabetes, the presence and participation of DM diet counseling, family support.
Methods
This research includes observational research was to observe and analyze the relationship
between the independent and the dependent variable by testing the hypothesis formulated, with a
case-control study design. The population in this study was covering the case group and the
control group, the case group populations were all Type 2 diabetes with unstable blood sugar
levels in Public Health Service Kedungmundu based medical record data Kedungmundu January
until October of 2013, amounting to 121 patients. Sample size of this research was 30 people.The
sampling technique used was the Simple Random Sampling. The research instrument using a
structured interview. Data analysis was performed using the technique of univariate, bivariate
analysis and stratified analysis.
Bivariate analysis was conducted to determine the presence or relationships between factors
related with control blood sugar levels. The scale of this research data was nominal and ordinal
scale, the statistical tests used were Chi Square.
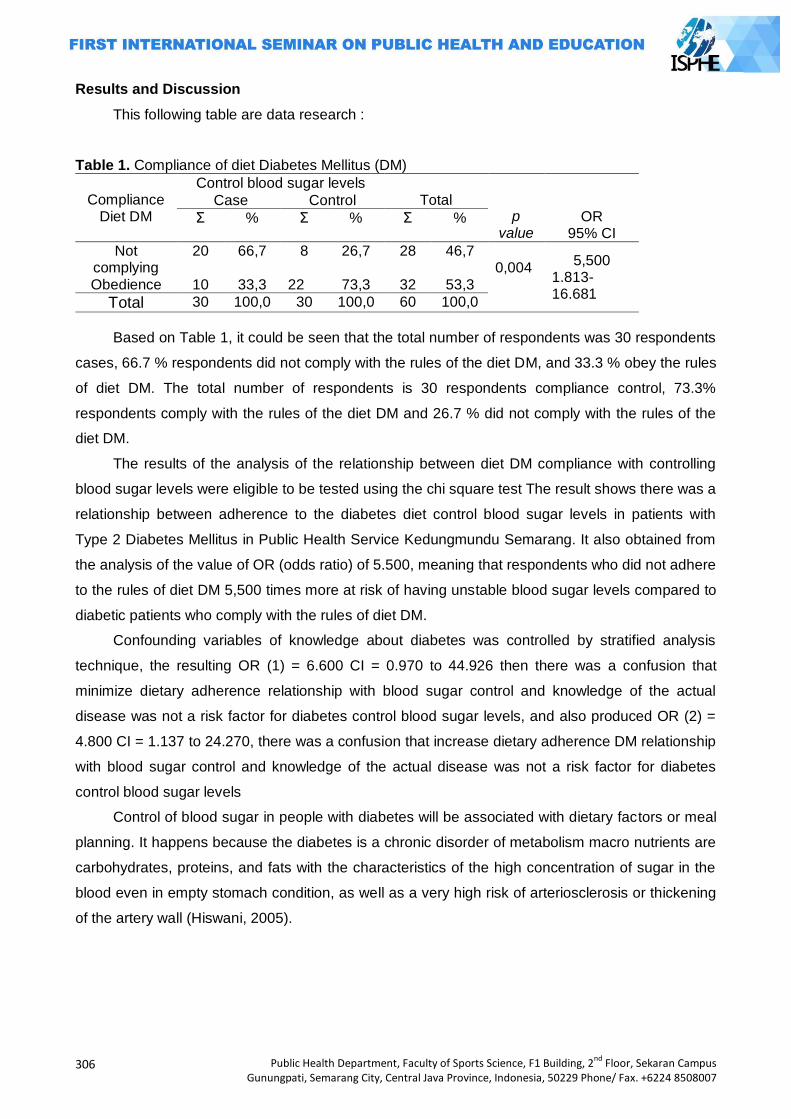
306
Public Health Department, Faculty of Sports Science, F1 Building, 2nd
Floor, Sekaran Campus Gunungpati, Semarang City, Central Java Province, Indonesia, 50229 Phone/ Fax. +6224 8508007
Results and Discussion
This following table are data research :
Table 1. Compliance of diet Diabetes Mellitus (DM)
Compliance Diet DM
Control blood sugar levels Total
p value
OR 95% CI
Case Control
Σ % Σ % Σ %
Not complying
20 66,7 8 26,7 28 46,7 0,004
5,500 1.813-16.681
Obedience 10 33,3 22 73,3 32 53,3
Total 30 100,0 30 100,0 60 100,0
Based on Table 1, it could be seen that the total number of respondents was 30 respondents
cases, 66.7 % respondents did not comply with the rules of the diet DM, and 33.3 % obey the rules
of diet DM. The total number of respondents is 30 respondents compliance control, 73.3%
respondents comply with the rules of the diet DM and 26.7 % did not comply with the rules of the
diet DM.
The results of the analysis of the relationship between diet DM compliance with controlling
blood sugar levels were eligible to be tested using the chi square test The result shows there was a
relationship between adherence to the diabetes diet control blood sugar levels in patients with
Type 2 Diabetes Mellitus in Public Health Service Kedungmundu Semarang. It also obtained from
the analysis of the value of OR (odds ratio) of 5.500, meaning that respondents who did not adhere
to the rules of diet DM 5,500 times more at risk of having unstable blood sugar levels compared to
diabetic patients who comply with the rules of diet DM.
Confounding variables of knowledge about diabetes was controlled by stratified analysis
technique, the resulting OR (1) = 6.600 CI = 0.970 to 44.926 then there was a confusion that
minimize dietary adherence relationship with blood sugar control and knowledge of the actual
disease was not a risk factor for diabetes control blood sugar levels, and also produced OR (2) =
4.800 CI = 1.137 to 24.270, there was a confusion that increase dietary adherence DM relationship
with blood sugar control and knowledge of the actual disease was not a risk factor for diabetes
control blood sugar levels
Control of blood sugar in people with diabetes will be associated with dietary factors or meal
planning. It happens because the diabetes is a chronic disorder of metabolism macro nutrients are
carbohydrates, proteins, and fats with the characteristics of the high concentration of sugar in the
blood even in empty stomach condition, as well as a very high risk of arteriosclerosis or thickening
of the artery wall (Hiswani, 2005).
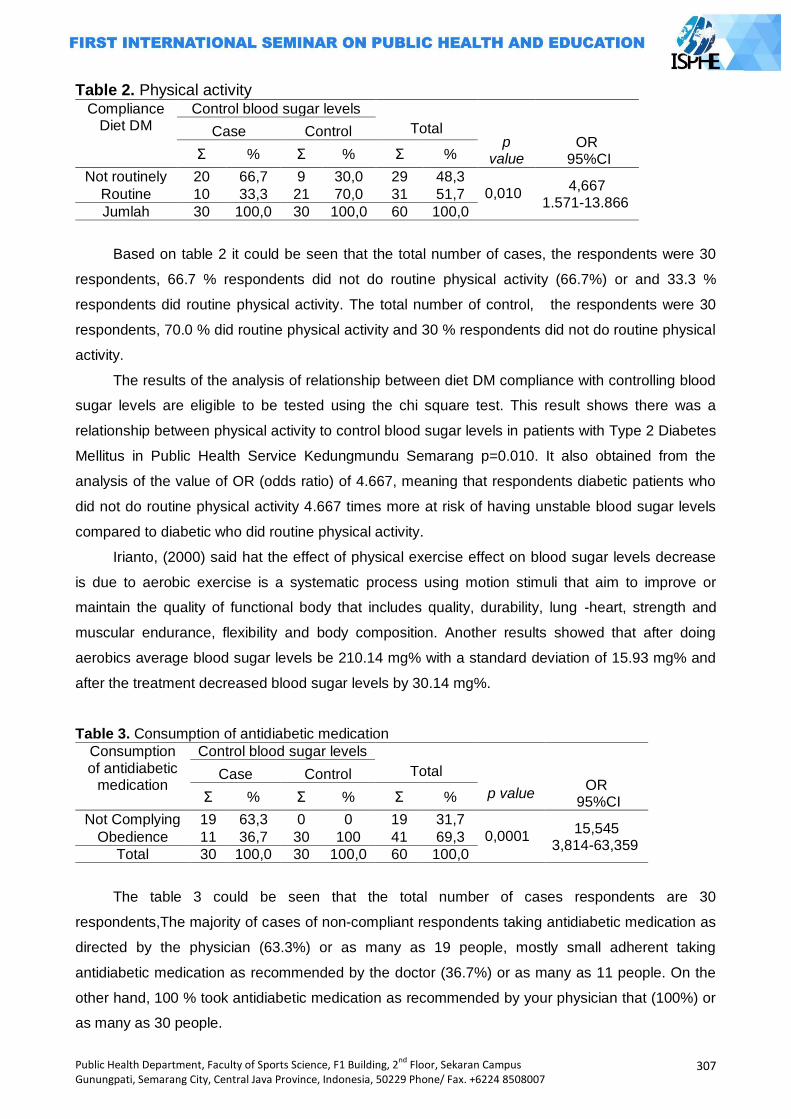
Public Health Department, Faculty of Sports Science, F1 Building, 2nd
Floor, Sekaran Campus Gunungpati, Semarang City, Central Java Province, Indonesia, 50229 Phone/ Fax. +6224 8508007
307
Table 2. Physical activity Compliance
Diet DM Control blood sugar levels
Total
p
value
OR 95%CI
Case Control
Σ % Σ % Σ %
Not routinely 20 66,7 9 30,0 29 48,3 0,010
4,667 1.571-13.866
Routine 10 33,3 21 70,0 31 51,7
Jumlah 30 100,0 30 100,0 60 100,0
Based on table 2 it could be seen that the total number of cases, the respondents were 30
respondents, 66.7 % respondents did not do routine physical activity (66.7%) or and 33.3 %
respondents did routine physical activity. The total number of control, the respondents were 30
respondents, 70.0 % did routine physical activity and 30 % respondents did not do routine physical
activity.
The results of the analysis of relationship between diet DM compliance with controlling blood
sugar levels are eligible to be tested using the chi square test. This result shows there was a
relationship between physical activity to control blood sugar levels in patients with Type 2 Diabetes
Mellitus in Public Health Service Kedungmundu Semarang p=0.010. It also obtained from the
analysis of the value of OR (odds ratio) of 4.667, meaning that respondents diabetic patients who
did not do routine physical activity 4.667 times more at risk of having unstable blood sugar levels
compared to diabetic who did routine physical activity.
Irianto, (2000) said hat the effect of physical exercise effect on blood sugar levels decrease
is due to aerobic exercise is a systematic process using motion stimuli that aim to improve or
maintain the quality of functional body that includes quality, durability, lung -heart, strength and
muscular endurance, flexibility and body composition. Another results showed that after doing
aerobics average blood sugar levels be 210.14 mg% with a standard deviation of 15.93 mg% and
after the treatment decreased blood sugar levels by 30.14 mg%.
Table 3. Consumption of antidiabetic medication
Consumption of antidiabetic
medication
Control blood sugar levels Total
p value
OR 95%CI
Case Control
Σ % Σ % Σ %
Not Complying 19 63,3 0 0 19 31,7 0,0001
15,545 3,814-63,359
Obedience 11 36,7 30 100 41 69,3
Total 30 100,0 30 100,0 60 100,0
The table 3 could be seen that the total number of cases respondents are 30
respondents,The majority of cases of non-compliant respondents taking antidiabetic medication as
directed by the physician (63.3%) or as many as 19 people, mostly small adherent taking
antidiabetic medication as recommended by the doctor (36.7%) or as many as 11 people. On the
other hand, 100 % took antidiabetic medication as recommended by your physician that (100%) or
as many as 30 people.
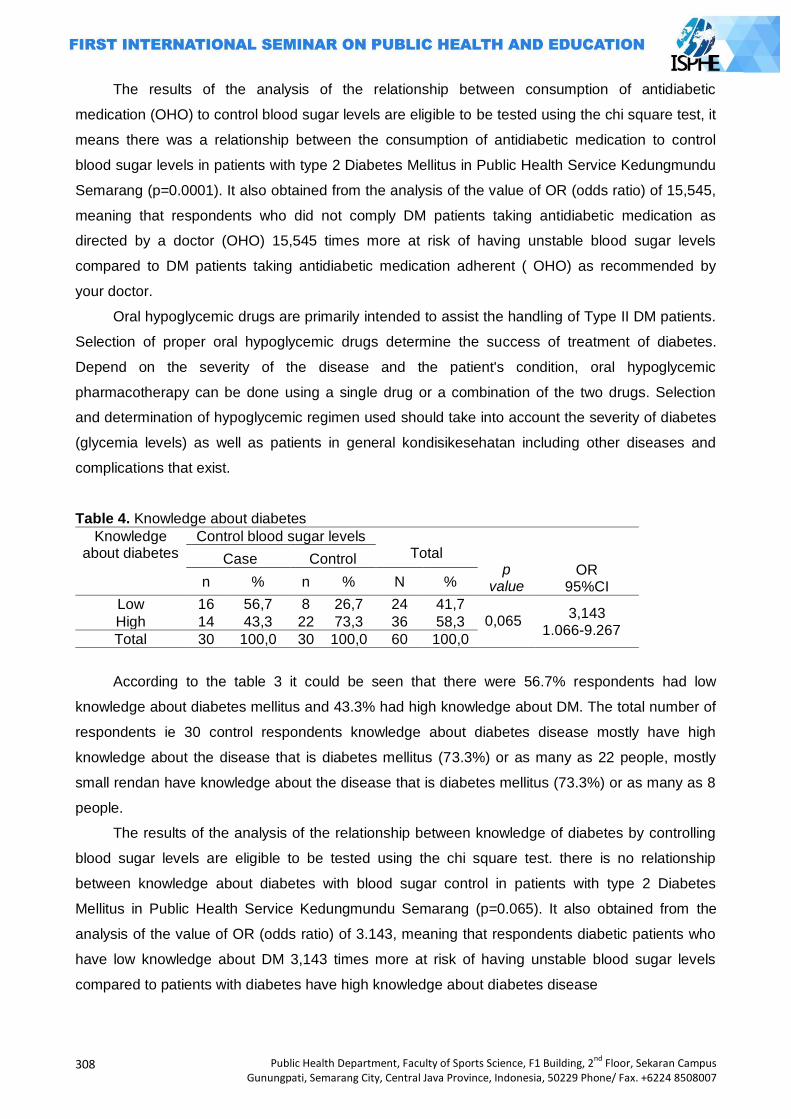
308
Public Health Department, Faculty of Sports Science, F1 Building, 2nd
Floor, Sekaran Campus Gunungpati, Semarang City, Central Java Province, Indonesia, 50229 Phone/ Fax. +6224 8508007
The results of the analysis of the relationship between consumption of antidiabetic
medication (OHO) to control blood sugar levels are eligible to be tested using the chi square test, it
means there was a relationship between the consumption of antidiabetic medication to control
blood sugar levels in patients with type 2 Diabetes Mellitus in Public Health Service Kedungmundu
Semarang (p=0.0001). It also obtained from the analysis of the value of OR (odds ratio) of 15,545,
meaning that respondents who did not comply DM patients taking antidiabetic medication as
directed by a doctor (OHO) 15,545 times more at risk of having unstable blood sugar levels
compared to DM patients taking antidiabetic medication adherent ( OHO) as recommended by
your doctor.
Oral hypoglycemic drugs are primarily intended to assist the handling of Type II DM patients.
Selection of proper oral hypoglycemic drugs determine the success of treatment of diabetes.
Depend on the severity of the disease and the patient's condition, oral hypoglycemic
pharmacotherapy can be done using a single drug or a combination of the two drugs. Selection
and determination of hypoglycemic regimen used should take into account the severity of diabetes
(glycemia levels) as well as patients in general kondisikesehatan including other diseases and
complications that exist.
Table 4. Knowledge about diabetes
Knowledge about diabetes
Control blood sugar levels Total
p value
OR 95%CI
Case Control
n % n % N %
Low 16 56,7 8 26,7 24 41,7 0,065
3,143 1.066-9.267
High 14 43,3 22 73,3 36 58,3
Total 30 100,0 30 100,0 60 100,0
According to the table 3 it could be seen that there were 56.7% respondents had low
knowledge about diabetes mellitus and 43.3% had high knowledge about DM. The total number of
respondents ie 30 control respondents knowledge about diabetes disease mostly have high
knowledge about the disease that is diabetes mellitus (73.3%) or as many as 22 people, mostly
small rendan have knowledge about the disease that is diabetes mellitus (73.3%) or as many as 8
people.
The results of the analysis of the relationship between knowledge of diabetes by controlling
blood sugar levels are eligible to be tested using the chi square test. there is no relationship
between knowledge about diabetes with blood sugar control in patients with type 2 Diabetes
Mellitus in Public Health Service Kedungmundu Semarang (p=0.065). It also obtained from the
analysis of the value of OR (odds ratio) of 3.143, meaning that respondents diabetic patients who
have low knowledge about DM 3,143 times more at risk of having unstable blood sugar levels
compared to patients with diabetes have high knowledge about diabetes disease
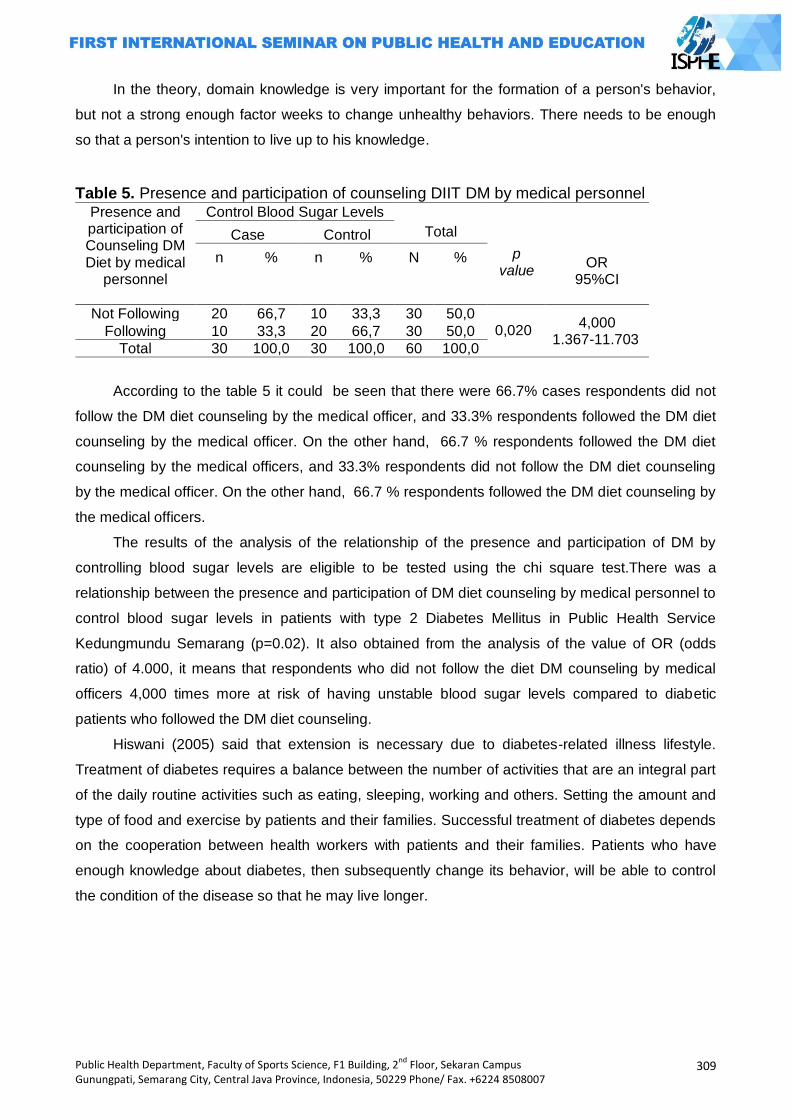
Public Health Department, Faculty of Sports Science, F1 Building, 2nd
Floor, Sekaran Campus Gunungpati, Semarang City, Central Java Province, Indonesia, 50229 Phone/ Fax. +6224 8508007
309
In the theory, domain knowledge is very important for the formation of a person's behavior,
but not a strong enough factor weeks to change unhealthy behaviors. There needs to be enough
so that a person's intention to live up to his knowledge.
Table 5. Presence and participation of counseling DIIT DM by medical personnel Presence and participation of Counseling DM Diet by medical
personnel
Control Blood Sugar Levels Total
p value
OR 95%CI
Case Control
n % n % N %
Not Following 20 66,7 10 33,3 30 50,0 0,020
4,000 1.367-11.703
Following 10 33,3 20 66,7 30 50,0
Total 30 100,0 30 100,0 60 100,0
According to the table 5 it could be seen that there were 66.7% cases respondents did not
follow the DM diet counseling by the medical officer, and 33.3% respondents followed the DM diet
counseling by the medical officer. On the other hand, 66.7 % respondents followed the DM diet
counseling by the medical officers, and 33.3% respondents did not follow the DM diet counseling
by the medical officer. On the other hand, 66.7 % respondents followed the DM diet counseling by
the medical officers.
The results of the analysis of the relationship of the presence and participation of DM by
controlling blood sugar levels are eligible to be tested using the chi square test.There was a
relationship between the presence and participation of DM diet counseling by medical personnel to
control blood sugar levels in patients with type 2 Diabetes Mellitus in Public Health Service
Kedungmundu Semarang (p=0.02). It also obtained from the analysis of the value of OR (odds
ratio) of 4.000, it means that respondents who did not follow the diet DM counseling by medical
officers 4,000 times more at risk of having unstable blood sugar levels compared to diabetic
patients who followed the DM diet counseling.
Hiswani (2005) said that extension is necessary due to diabetes-related illness lifestyle.
Treatment of diabetes requires a balance between the number of activities that are an integral part
of the daily routine activities such as eating, sleeping, working and others. Setting the amount and
type of food and exercise by patients and their families. Successful treatment of diabetes depends
on the cooperation between health workers with patients and their families. Patients who have
enough knowledge about diabetes, then subsequently change its behavior, will be able to control
the condition of the disease so that he may live longer.
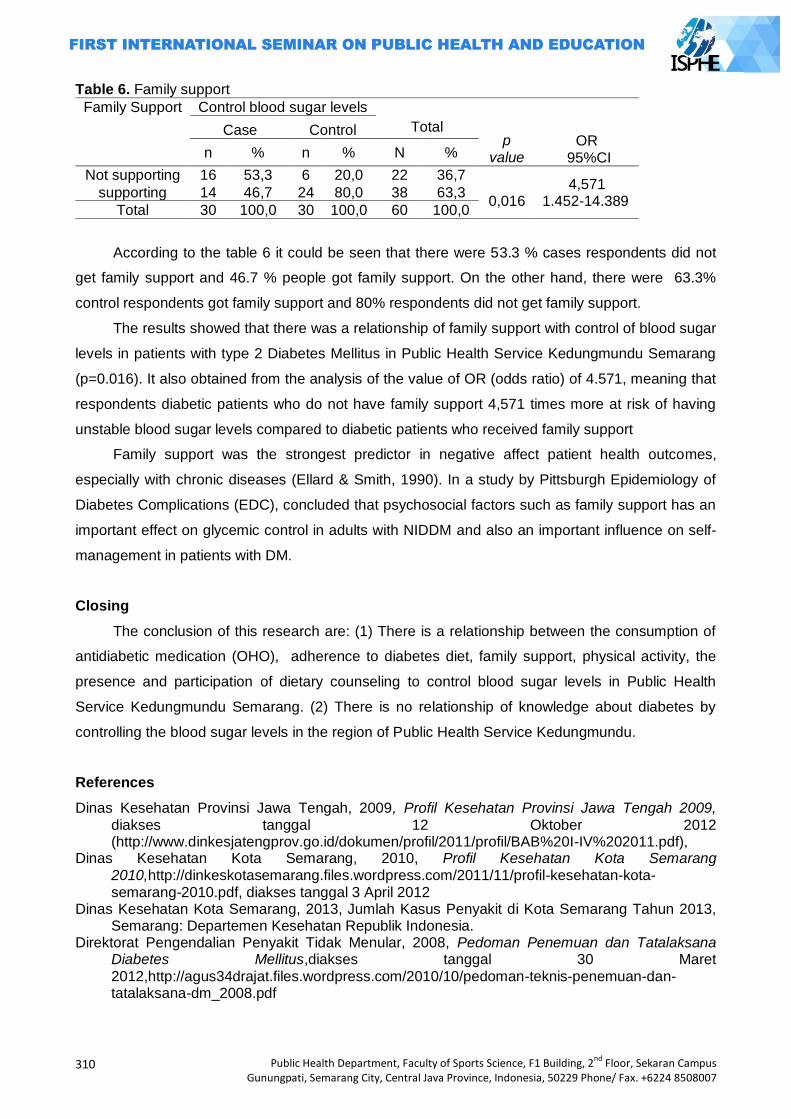
310
Public Health Department, Faculty of Sports Science, F1 Building, 2nd
Floor, Sekaran Campus Gunungpati, Semarang City, Central Java Province, Indonesia, 50229 Phone/ Fax. +6224 8508007
Table 6. Family support
Family Support Control blood sugar levels Total
p value
OR 95%CI
Case Control
n % n % N %
Not supporting 16 53,3 6 20,0 22 36,7
0,016 4,571
1.452-14.389 supporting 14 46,7 24 80,0 38 63,3
Total 30 100,0 30 100,0 60 100,0
According to the table 6 it could be seen that there were 53.3 % cases respondents did not
get family support and 46.7 % people got family support. On the other hand, there were 63.3%
control respondents got family support and 80% respondents did not get family support.
The results showed that there was a relationship of family support with control of blood sugar
levels in patients with type 2 Diabetes Mellitus in Public Health Service Kedungmundu Semarang
(p=0.016). It also obtained from the analysis of the value of OR (odds ratio) of 4.571, meaning that
respondents diabetic patients who do not have family support 4,571 times more at risk of having
unstable blood sugar levels compared to diabetic patients who received family support
Family support was the strongest predictor in negative affect patient health outcomes,
especially with chronic diseases (Ellard & Smith, 1990). In a study by Pittsburgh Epidemiology of
Diabetes Complications (EDC), concluded that psychosocial factors such as family support has an
important effect on glycemic control in adults with NIDDM and also an important influence on self-
management in patients with DM.
Closing
The conclusion of this research are: (1) There is a relationship between the consumption of
antidiabetic medication (OHO), adherence to diabetes diet, family support, physical activity, the
presence and participation of dietary counseling to control blood sugar levels in Public Health
Service Kedungmundu Semarang. (2) There is no relationship of knowledge about diabetes by
controlling the blood sugar levels in the region of Public Health Service Kedungmundu.
References
Dinas Kesehatan Provinsi Jawa Tengah, 2009, Profil Kesehatan Provinsi Jawa Tengah 2009, diakses tanggal 12 Oktober 2012 (http://www.dinkesjatengprov.go.id/dokumen/profil/2011/profil/BAB%20I-IV%202011.pdf),
Dinas Kesehatan Kota Semarang, 2010, Profil Kesehatan Kota Semarang 2010,http://dinkeskotasemarang.files.wordpress.com/2011/11/profil-kesehatan-kota-semarang-2010.pdf, diakses tanggal 3 April 2012
Dinas Kesehatan Kota Semarang, 2013, Jumlah Kasus Penyakit di Kota Semarang Tahun 2013, Semarang: Departemen Kesehatan Republik Indonesia.
Direktorat Pengendalian Penyakit Tidak Menular, 2008, Pedoman Penemuan dan Tatalaksana Diabetes Mellitus,diakses tanggal 30 Maret 2012,http://agus34drajat.files.wordpress.com/2010/10/pedoman-teknis-penemuan-dan-tatalaksana-dm_2008.pdf
Public Health Department, Faculty of Sports Science, F1 Building, 2nd
Floor, Sekaran Campus Gunungpati, Semarang City, Central Java Province, Indonesia, 50229 Phone/ Fax. +6224 8508007
311
Depkes, 2005, Direktorat Bina Farmasi Komunitas dan Klinik Direktorat Bina Kefarmasian dan Alat kesehatan, Pharmaceutical Care untuk Diabetes Melitus, diakses tanggal 20 Maret 2014,(http://binfar.kemkes.go.id/v2/wpcontent/uploads/2014/02/PC_DM.pdf)
Egede, L.E., Zheng, D., & Simpson, K. 2002.Comorbid depression is associated with increased health care use and expenditures in individuals with diabetes. DiabetesCare, 25 (3). (http://www.care.diabetesjournal)
Hartini, S, 2009, Dabetes? Siapa takut!!, Mizan Pustaka, Bandung Hiswani, 2001, Penyuluhan Kesehatan Pada Penderita Diabetes Mellitus (Online) diakses tanggal
12 Juni 2012 ( http://repository.usu.ac.id/bitstream/123456789/3695/3/D0100739.pdf.txt) Hiswani dan Saiful Bahri, 2005, Penyuluhan Kesehatan pada Penderita Diabetes Melitus (209-
2015) (Online) diakses 11 November 2013 (http://repository.usu.ac.id/bitstream/123456789/15325/1/ikm-des2005-%20(13).pdf)
Irianto,D.P. 2000. Panduan latihan kebugaran fisik ( yang efektif dan aman). Yogyakarta: Lukman Offset.
Riset Kesehatan Dasar (RISKESDAS), 2007, Laporan Nasional 2007, Badan Penelitian dan Pengembangan Kesehatan, diakses tanggal 25 Maret 2012, fisio-poltekesolo.ac.id/fisioterapi/images/stories/laporanNasional.pdf
Sunita Almaitser, 2004, Penuntun Diet edisi baru,Gramedia Pustaka Utama, Jakarta. WHO, 2012, NCD Mortality and Morbidity,
http://www.who.int/gho/ncd/mortality_morbidity/en/index.html, diakses tanggal 30 Maret 2012.
312
Public Health Department, Faculty of Sports Science, F1 Building, 2nd
Floor, Sekaran Campus Gunungpati, Semarang City, Central Java Province, Indonesia, 50229 Phone/ Fax. +6224 8508007
HIV/AIDS RELATED STIGMA AND VCT UTILIZATION AMONG FEMALE SEX WORKERS IN BANDUNGAN SEMARANG DISTRICT
Fitri Indrawati
Semarang State University, Indonesia
Corresponding Author: [email protected]
Abstract Introduction: The spread of HIV in Indonesia is still concentrated in key populations, one of which are female sex worker. In Indonesia, commercial sex is a major cause of the spread of HIV after injecting drug use. One service that fuctions in preventing the spread of HIV is VCT clinic. VCT clinics are ongoing HIV care facilities, where service is based on the client‘s needs and performed voluntarily without any coercion. Methods: The study used cross sectional design. The population was all female sex workers that work in Bandungan. The samples were female sex workers that met the criteria for inclusion and exclusion. Data analysis used univariable analysis, bivariable analysis with chi-square statistical tests p <0,05 and CI 95% significance level, and multivariable analysis with logistic regression. Result: HIV/AIDS-related stigma dimensions ―blame & judgment‖ was significantly associated with utilization of VCT clinics with OR 5,2 (95% CI 1,08-25,38). HIV/AIDS-related stigma dimensions ―interaction‖ was significantly associated with utilization of VCT clinics with OR 4,2 (CI 95% 1,31-13,75). The result of bivariable analysis showed significant association between knowledge of HIV/AIDS with p value 0,000 and PR 1,9 (CI 95% 1,37-2,64) and utilization of VCT clinic. The result of logistic regression analysis showed lower HIV/AIDS-related stigma had the probability of increasing utilization of VCT clinic as much as 30% after being controlled by variables knowlegde of HIV/AIDS. Key Words: Stigma, HIV/AIDS, VCT clinic
Introduction
HIV-AIDS problem is a public health problem that requires serious attention. This is because
the number of AIDS cases reported each year increased significantly. Cases of HIV and AIDS is an
iceberg phenomenon, where the number of people who reported far fewer than the actual number
(KPA, 2010). The number of people living with HIV in 2009 is estimated at 333,200 and the
proportion of female patients increased to 25%. The HIV epidemic in Indonesia is concentrated in
key populations, namely sex workers, clients of sex workers, men who have sex with men,
transgenders and injecting drug users. Estimates of female sex workers (FSWs) in Indonesia in
2006 is estimated at about 0.3% of the female adult population (15-49 years). FSWs group very
vulnerable to contracting HIV through sexual intercourse and unsafe sexual behavior. Sexual
transmission due to unsafe sexual behavior is a major cause of HIV infection in Indonesia after
injecting drug use interchangeably. Integrated bio-behavioral surveillance based on high-risk
groups in Indonesia in 2007 between 6-16% of female sex workers directly and 2-9% of indirect
sex workers were infected with HIV. Most of the FSWs infected during the first six months of
trading sex work (Depkes RI, 2007).
Public Health Department, Faculty of Sports Science, F1 Building, 2nd
Floor, Sekaran Campus Gunungpati, Semarang City, Central Java Province, Indonesia, 50229 Phone/ Fax. +6224 8508007
313
Rate of transmission of HIV / AIDS in Semarang district also continued to increase from year
to year. In January 2011 there were 41 people who tested positive for HIV / AIDS. While in 2010
the number of people living with HIV / AIDS as many as 33 people. The number of visits FSWs in
existing STI clinic in Semarang district and number as many as 2795 patients were referred to the
clinic FSWs VCT as 908, but only about 38% are utilizing VCT clinics (Dinkes Kabupaten
Semarang, 2011).
One of the dangers is that the stigmatization of HIV-related concerns can motivate denial and
secrecy, and continued risky behavior. In order individual fears of stigmatization can be a barrier to
seeking treatment and care. Stigmatization must be understood in order to improve the utilization
of health services. Given the important implications of HIV status on treatment-seeking behavior,
reduce the stigmatization associated with HIV and STIs are urgent public health priorities (Lieber et
al, 2006).
The first health care in the prevention of HIV transmission is VCT (Voluntary Counseling and
Testing) (KPA, 2010). VCT clinics is ongoing HIV care facilities, where the service is performed
based on the needs of the client and is voluntary. Therefore, researchers interested in conducting
research with the title Relations HIV/AIDS related stigma with the VCT Clinic Utilization in Female
Sex Workers in Bandungan Semarang Regency.
Methods
This study used a cross sectional design. The study was conducted in September-November
2012, the female sex workers who work in the area of Semarang District Bandungan. Inclusion
criteria were female sex workers in place at the time of the study and have not been diagnosed
with HIV. The number of subjects was 89 respondents. Selection of subjects done by proportional
random sampling.
The variables of the study include the independent variable namely HIV/AIDS related stigma,
the dependent variable the utilization of VCT clinics, and external variables of the respondents:
education, knowledge about HIV/AIDS, and exposure information. Assessment HIV/AIDS related
stigma is using a structured questionnaire. The questionnaire in this study was a questionnaire
enclosed with the form of selecting an answer. The questionnaire was adopted from Tanzania
Stigma endline Individual and Community Indicator Questionnaire (2006) (Nyblade et al, 2008) and
the Indonesian Demographic and Health Survey (IDHS) 2007 (BPS, 2008) which has been
modified and has been validated and assessed reliability. Questions about the HIV/AIDS related
stigma is reduced to 3 dimensions by factor analysis, namely the dimension of "shame and blame",
the dimensions of "labels" and the dimension "interaction". Utilization of VCT clinic was measured
through the question of whether the respondent has used the VCT clinic or not.
The collected data analyzed using STATA program 11. analysis of experimental data carried
out by the following stages: univariable analysis, bivariate, and multivariable. Chi-square statistical
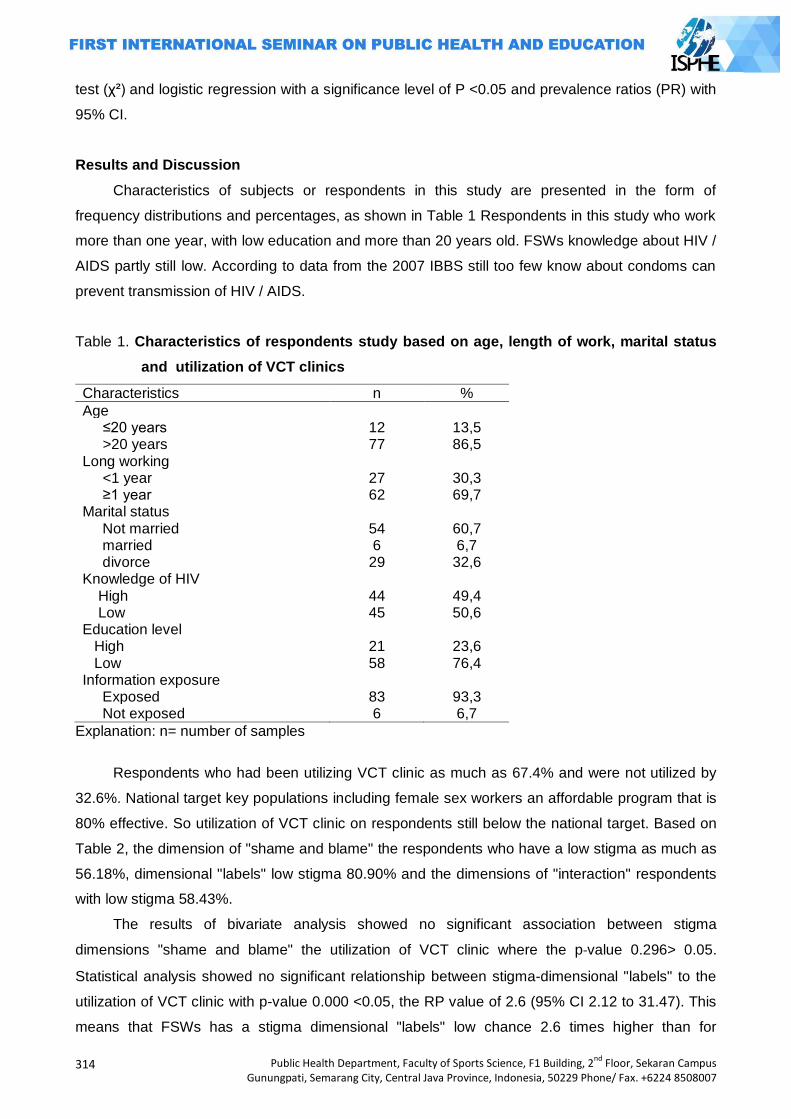
314
Public Health Department, Faculty of Sports Science, F1 Building, 2nd
Floor, Sekaran Campus Gunungpati, Semarang City, Central Java Province, Indonesia, 50229 Phone/ Fax. +6224 8508007
test (χ²) and logistic regression with a significance level of P <0.05 and prevalence ratios (PR) with
95% CI.
Results and Discussion
Characteristics of subjects or respondents in this study are presented in the form of
frequency distributions and percentages, as shown in Table 1 Respondents in this study who work
more than one year, with low education and more than 20 years old. FSWs knowledge about HIV /
AIDS partly still low. According to data from the 2007 IBBS still too few know about condoms can
prevent transmission of HIV / AIDS.
Table 1. Characteristics of respondents study based on age, length of work, marital status
and utilization of VCT clinics
Characteristics n %
Age ≤20 years 12 13,5 >20 years 77 86,5 Long working <1 year 27 30,3 ≥1 year 62 69,7 Marital status Not married 54 60,7 married 6 6,7 divorce 29 32,6 Knowledge of HIV
High 44 49,4 Low 45 50,6
Education level High 21 23,6 Low 58 76,4
Information exposure Exposed 83 93,3 Not exposed 6 6,7
Explanation: n= number of samples
Respondents who had been utilizing VCT clinic as much as 67.4% and were not utilized by
32.6%. National target key populations including female sex workers an affordable program that is
80% effective. So utilization of VCT clinic on respondents still below the national target. Based on
Table 2, the dimension of "shame and blame" the respondents who have a low stigma as much as
56.18%, dimensional "labels" low stigma 80.90% and the dimensions of "interaction" respondents
with low stigma 58.43%.
The results of bivariate analysis showed no significant association between stigma
dimensions "shame and blame" the utilization of VCT clinic where the p-value 0.296> 0.05.
Statistical analysis showed no significant relationship between stigma-dimensional "labels" to the
utilization of VCT clinic with p-value 0.000 <0.05, the RP value of 2.6 (95% CI 2.12 to 31.47). This
means that FSWs has a stigma dimensional "labels" low chance 2.6 times higher than for
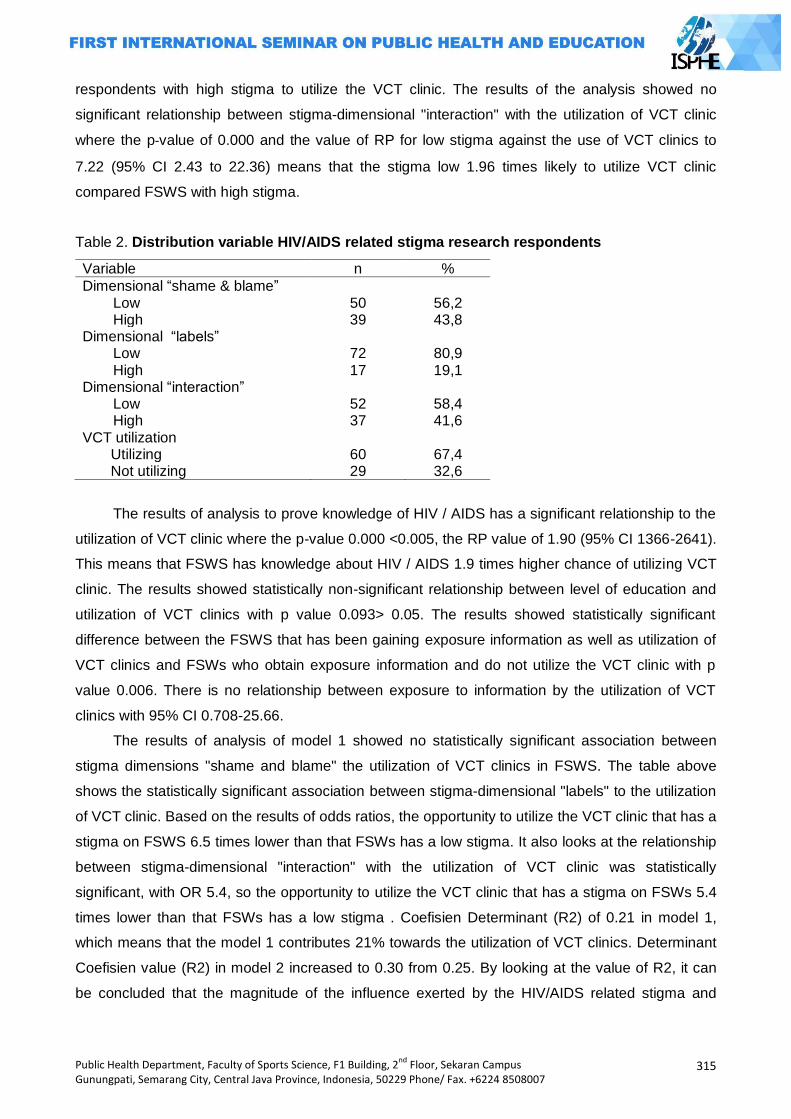
Public Health Department, Faculty of Sports Science, F1 Building, 2nd
Floor, Sekaran Campus Gunungpati, Semarang City, Central Java Province, Indonesia, 50229 Phone/ Fax. +6224 8508007
315
respondents with high stigma to utilize the VCT clinic. The results of the analysis showed no
significant relationship between stigma-dimensional "interaction" with the utilization of VCT clinic
where the p-value of 0.000 and the value of RP for low stigma against the use of VCT clinics to
7.22 (95% CI 2.43 to 22.36) means that the stigma low 1.96 times likely to utilize VCT clinic
compared FSWS with high stigma.
Table 2. Distribution variable HIV/AIDS related stigma research respondents
Variable n %
Dimensional ―shame & blame‖ Low 50 56,2 High 39 43,8
Dimensional ―labels‖ Low 72 80,9 High 17 19,1
Dimensional ―interaction‖ Low 52 58,4 High 37 41,6
VCT utilization Utilizing 60 67,4 Not utilizing 29 32,6
The results of analysis to prove knowledge of HIV / AIDS has a significant relationship to the
utilization of VCT clinic where the p-value 0.000 <0.005, the RP value of 1.90 (95% CI 1366-2641).
This means that FSWS has knowledge about HIV / AIDS 1.9 times higher chance of utilizing VCT
clinic. The results showed statistically non-significant relationship between level of education and
utilization of VCT clinics with p value 0.093> 0.05. The results showed statistically significant
difference between the FSWS that has been gaining exposure information as well as utilization of
VCT clinics and FSWs who obtain exposure information and do not utilize the VCT clinic with p
value 0.006. There is no relationship between exposure to information by the utilization of VCT
clinics with 95% CI 0.708-25.66.
The results of analysis of model 1 showed no statistically significant association between
stigma dimensions "shame and blame" the utilization of VCT clinics in FSWS. The table above
shows the statistically significant association between stigma-dimensional "labels" to the utilization
of VCT clinic. Based on the results of odds ratios, the opportunity to utilize the VCT clinic that has a
stigma on FSWS 6.5 times lower than that FSWs has a low stigma. It also looks at the relationship
between stigma-dimensional "interaction" with the utilization of VCT clinic was statistically
significant, with OR 5.4, so the opportunity to utilize the VCT clinic that has a stigma on FSWs 5.4
times lower than that FSWs has a low stigma . Coefisien Determinant (R2) of 0.21 in model 1,
which means that the model 1 contributes 21% towards the utilization of VCT clinics. Determinant
Coefisien value (R2) in model 2 increased to 0.30 from 0.25. By looking at the value of R2, it can
be concluded that the magnitude of the influence exerted by the HIV/AIDS related stigma and
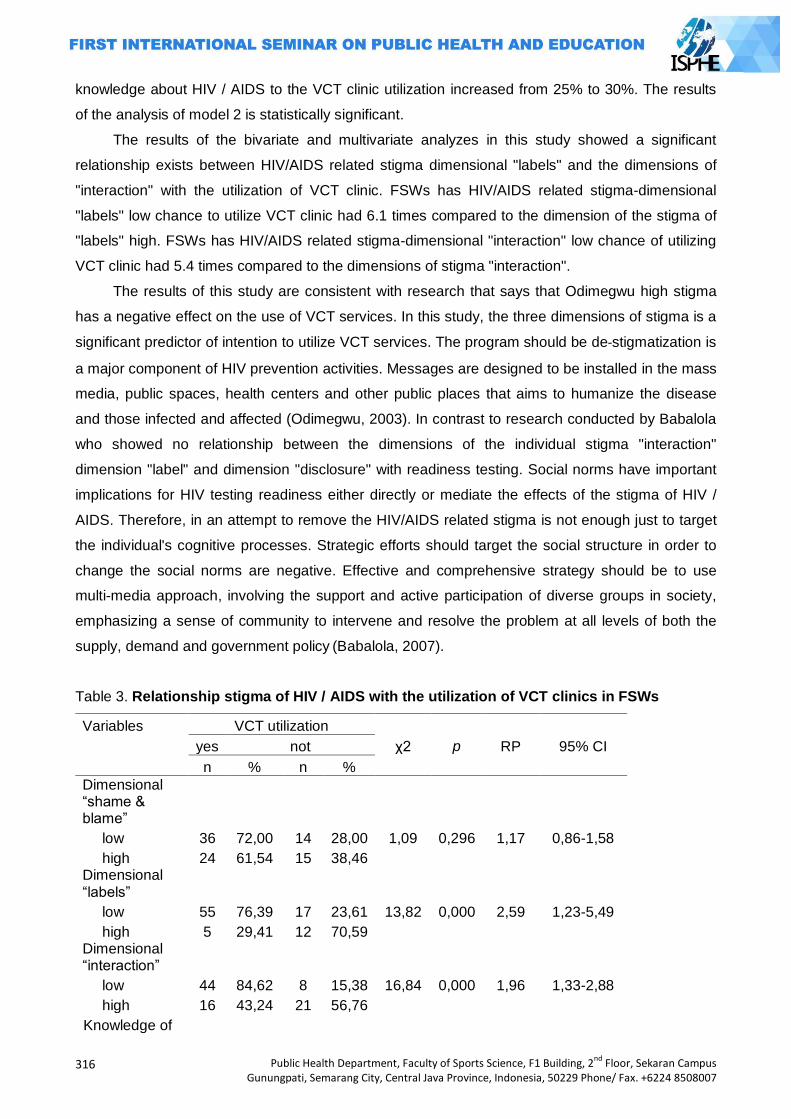
316
Public Health Department, Faculty of Sports Science, F1 Building, 2nd
Floor, Sekaran Campus Gunungpati, Semarang City, Central Java Province, Indonesia, 50229 Phone/ Fax. +6224 8508007
knowledge about HIV / AIDS to the VCT clinic utilization increased from 25% to 30%. The results
of the analysis of model 2 is statistically significant.
The results of the bivariate and multivariate analyzes in this study showed a significant
relationship exists between HIV/AIDS related stigma dimensional "labels" and the dimensions of
"interaction" with the utilization of VCT clinic. FSWs has HIV/AIDS related stigma-dimensional
"labels" low chance to utilize VCT clinic had 6.1 times compared to the dimension of the stigma of
"labels" high. FSWs has HIV/AIDS related stigma-dimensional "interaction" low chance of utilizing
VCT clinic had 5.4 times compared to the dimensions of stigma "interaction".
The results of this study are consistent with research that says that Odimegwu high stigma
has a negative effect on the use of VCT services. In this study, the three dimensions of stigma is a
significant predictor of intention to utilize VCT services. The program should be de-stigmatization is
a major component of HIV prevention activities. Messages are designed to be installed in the mass
media, public spaces, health centers and other public places that aims to humanize the disease
and those infected and affected (Odimegwu, 2003). In contrast to research conducted by Babalola
who showed no relationship between the dimensions of the individual stigma "interaction"
dimension "label" and dimension "disclosure" with readiness testing. Social norms have important
implications for HIV testing readiness either directly or mediate the effects of the stigma of HIV /
AIDS. Therefore, in an attempt to remove the HIV/AIDS related stigma is not enough just to target
the individual's cognitive processes. Strategic efforts should target the social structure in order to
change the social norms are negative. Effective and comprehensive strategy should be to use
multi-media approach, involving the support and active participation of diverse groups in society,
emphasizing a sense of community to intervene and resolve the problem at all levels of both the
supply, demand and government policy (Babalola, 2007).
Table 3. Relationship stigma of HIV / AIDS with the utilization of VCT clinics in FSWs
Variables VCT utilization
yes
not
χ2 p RP 95% CI
n % n %
Dimensional ―shame & blame‖
low 36 72,00 14 28,00 1,09 0,296 1,17 0,86-1,58
high 24 61,54 15 38,46 Dimensional
―labels‖ low 55 76,39 17 23,61 13,82 0,000 2,59 1,23-5,49
high 5 29,41 12 70,59 Dimensional
―interaction‖ low 44 84,62 8 15,38 16,84 0,000 1,96 1,33-2,88
high 16 43,24 21 56,76 Knowledge of
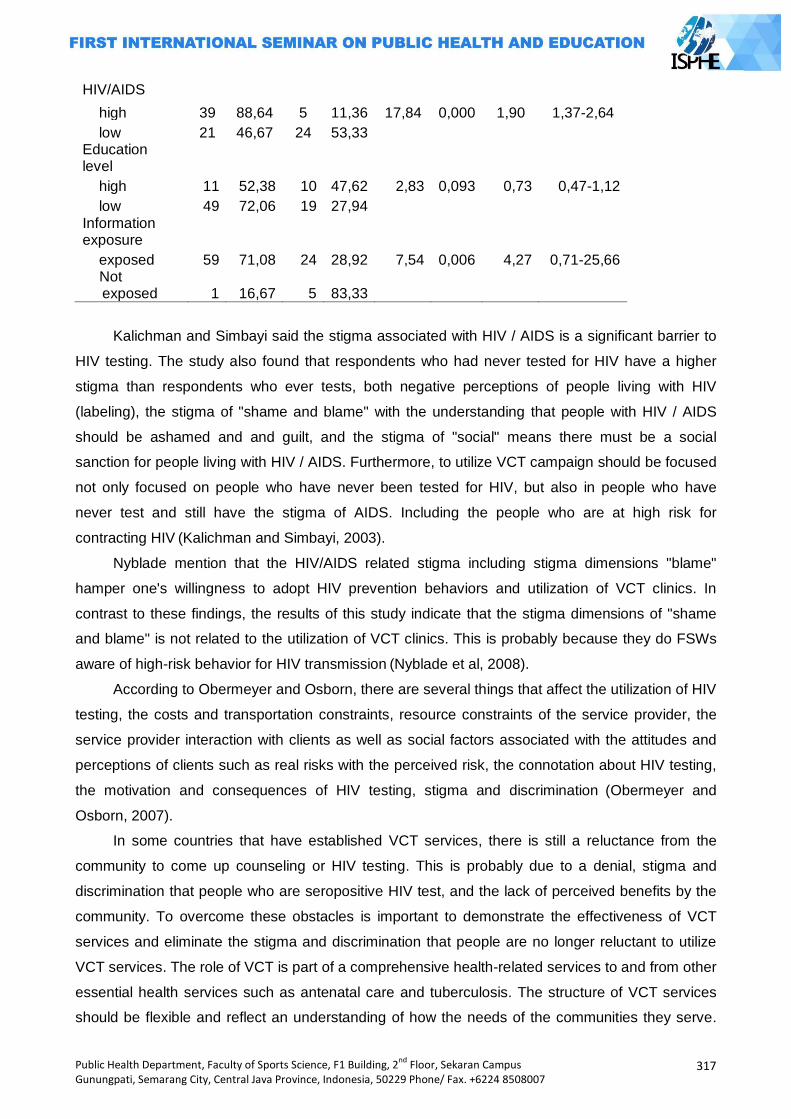
Public Health Department, Faculty of Sports Science, F1 Building, 2nd
Floor, Sekaran Campus Gunungpati, Semarang City, Central Java Province, Indonesia, 50229 Phone/ Fax. +6224 8508007
317
HIV/AIDS
high 39 88,64 5 11,36 17,84 0,000 1,90 1,37-2,64
low 21 46,67 24 53,33 Education level
high 11 52,38 10 47,62 2,83 0,093 0,73 0,47-1,12
low 49 72,06 19 27,94 Information exposure
exposed 59 71,08 24 28,92 7,54 0,006 4,27 0,71-25,66 Not
exposed 1 16,67 5 83,33
Kalichman and Simbayi said the stigma associated with HIV / AIDS is a significant barrier to
HIV testing. The study also found that respondents who had never tested for HIV have a higher
stigma than respondents who ever tests, both negative perceptions of people living with HIV
(labeling), the stigma of "shame and blame" with the understanding that people with HIV / AIDS
should be ashamed and and guilt, and the stigma of "social" means there must be a social
sanction for people living with HIV / AIDS. Furthermore, to utilize VCT campaign should be focused
not only focused on people who have never been tested for HIV, but also in people who have
never test and still have the stigma of AIDS. Including the people who are at high risk for
contracting HIV (Kalichman and Simbayi, 2003).
Nyblade mention that the HIV/AIDS related stigma including stigma dimensions "blame"
hamper one's willingness to adopt HIV prevention behaviors and utilization of VCT clinics. In
contrast to these findings, the results of this study indicate that the stigma dimensions of "shame
and blame" is not related to the utilization of VCT clinics. This is probably because they do FSWs
aware of high-risk behavior for HIV transmission (Nyblade et al, 2008).
According to Obermeyer and Osborn, there are several things that affect the utilization of HIV
testing, the costs and transportation constraints, resource constraints of the service provider, the
service provider interaction with clients as well as social factors associated with the attitudes and
perceptions of clients such as real risks with the perceived risk, the connotation about HIV testing,
the motivation and consequences of HIV testing, stigma and discrimination (Obermeyer and
Osborn, 2007).
In some countries that have established VCT services, there is still a reluctance from the
community to come up counseling or HIV testing. This is probably due to a denial, stigma and
discrimination that people who are seropositive HIV test, and the lack of perceived benefits by the
community. To overcome these obstacles is important to demonstrate the effectiveness of VCT
services and eliminate the stigma and discrimination that people are no longer reluctant to utilize
VCT services. The role of VCT is part of a comprehensive health-related services to and from other
essential health services such as antenatal care and tuberculosis. The structure of VCT services
should be flexible and reflect an understanding of how the needs of the communities they serve.
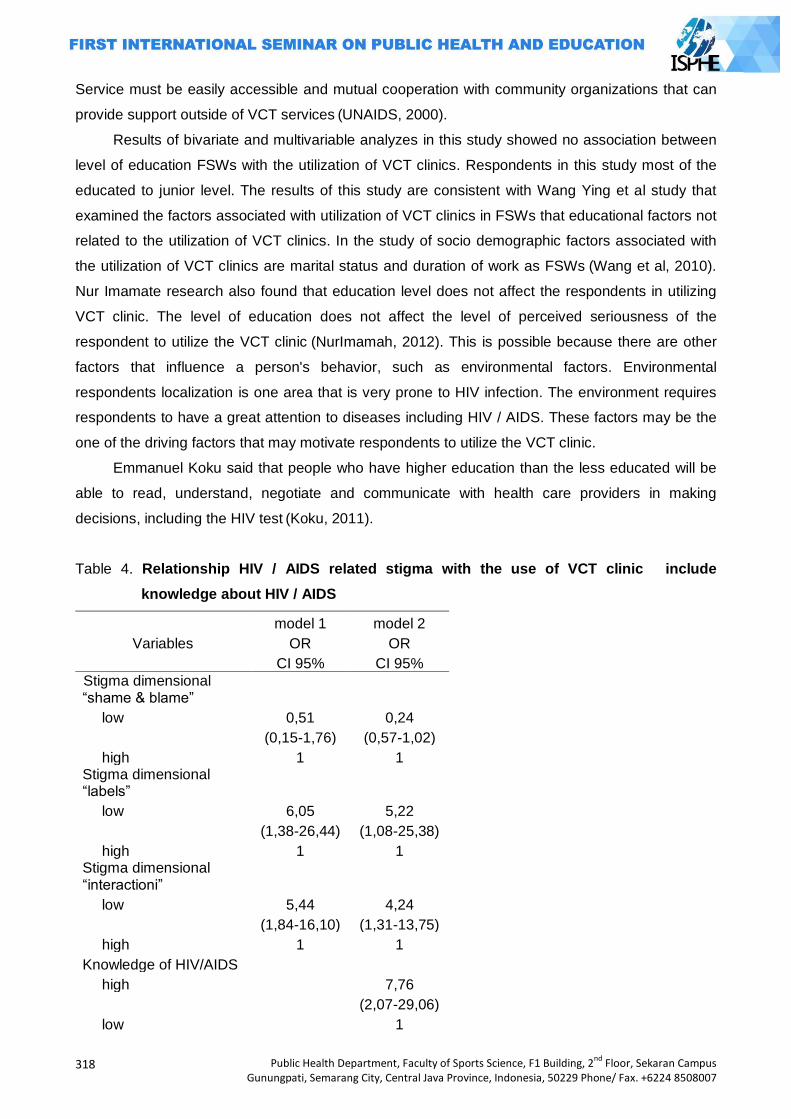
318
Public Health Department, Faculty of Sports Science, F1 Building, 2nd
Floor, Sekaran Campus Gunungpati, Semarang City, Central Java Province, Indonesia, 50229 Phone/ Fax. +6224 8508007
Service must be easily accessible and mutual cooperation with community organizations that can
provide support outside of VCT services (UNAIDS, 2000).
Results of bivariate and multivariable analyzes in this study showed no association between
level of education FSWs with the utilization of VCT clinics. Respondents in this study most of the
educated to junior level. The results of this study are consistent with Wang Ying et al study that
examined the factors associated with utilization of VCT clinics in FSWs that educational factors not
related to the utilization of VCT clinics. In the study of socio demographic factors associated with
the utilization of VCT clinics are marital status and duration of work as FSWs (Wang et al, 2010).
Nur Imamate research also found that education level does not affect the respondents in utilizing
VCT clinic. The level of education does not affect the level of perceived seriousness of the
respondent to utilize the VCT clinic (NurImamah, 2012). This is possible because there are other
factors that influence a person's behavior, such as environmental factors. Environmental
respondents localization is one area that is very prone to HIV infection. The environment requires
respondents to have a great attention to diseases including HIV / AIDS. These factors may be the
one of the driving factors that may motivate respondents to utilize the VCT clinic.
Emmanuel Koku said that people who have higher education than the less educated will be
able to read, understand, negotiate and communicate with health care providers in making
decisions, including the HIV test (Koku, 2011).
Table 4. Relationship HIV / AIDS related stigma with the use of VCT clinic include
knowledge about HIV / AIDS
model 1 model 2
Variables OR OR
CI 95% CI 95%
Stigma dimensional ―shame & blame‖
low 0,51 0,24
(0,15-1,76) (0,57-1,02)
high 1 1 Stigma dimensional ―labels‖
low 6,05 5,22
(1,38-26,44) (1,08-25,38)
high 1 1 Stigma dimensional ―interactioni‖
low 5,44 4,24
(1,84-16,10) (1,31-13,75)
high 1 1
Knowledge of HIV/AIDS
high
7,76
(2,07-29,06)
low
1
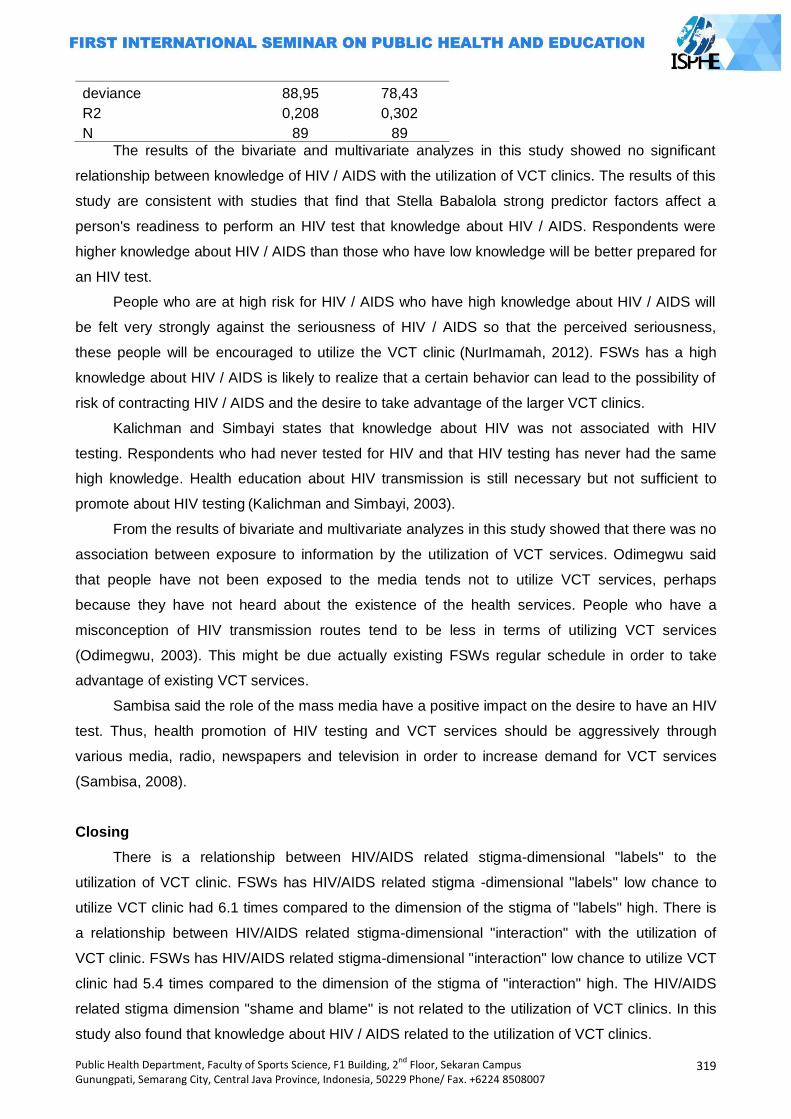
Public Health Department, Faculty of Sports Science, F1 Building, 2nd
Floor, Sekaran Campus Gunungpati, Semarang City, Central Java Province, Indonesia, 50229 Phone/ Fax. +6224 8508007
319
deviance 88,95 78,43
R2 0,208 0,302
N 89 89
The results of the bivariate and multivariate analyzes in this study showed no significant
relationship between knowledge of HIV / AIDS with the utilization of VCT clinics. The results of this
study are consistent with studies that find that Stella Babalola strong predictor factors affect a
person's readiness to perform an HIV test that knowledge about HIV / AIDS. Respondents were
higher knowledge about HIV / AIDS than those who have low knowledge will be better prepared for
an HIV test.
People who are at high risk for HIV / AIDS who have high knowledge about HIV / AIDS will
be felt very strongly against the seriousness of HIV / AIDS so that the perceived seriousness,
these people will be encouraged to utilize the VCT clinic (NurImamah, 2012). FSWs has a high
knowledge about HIV / AIDS is likely to realize that a certain behavior can lead to the possibility of
risk of contracting HIV / AIDS and the desire to take advantage of the larger VCT clinics.
Kalichman and Simbayi states that knowledge about HIV was not associated with HIV
testing. Respondents who had never tested for HIV and that HIV testing has never had the same
high knowledge. Health education about HIV transmission is still necessary but not sufficient to
promote about HIV testing (Kalichman and Simbayi, 2003).
From the results of bivariate and multivariate analyzes in this study showed that there was no
association between exposure to information by the utilization of VCT services. Odimegwu said
that people have not been exposed to the media tends not to utilize VCT services, perhaps
because they have not heard about the existence of the health services. People who have a
misconception of HIV transmission routes tend to be less in terms of utilizing VCT services
(Odimegwu, 2003). This might be due actually existing FSWs regular schedule in order to take
advantage of existing VCT services.
Sambisa said the role of the mass media have a positive impact on the desire to have an HIV
test. Thus, health promotion of HIV testing and VCT services should be aggressively through
various media, radio, newspapers and television in order to increase demand for VCT services
(Sambisa, 2008).
Closing
There is a relationship between HIV/AIDS related stigma-dimensional "labels" to the
utilization of VCT clinic. FSWs has HIV/AIDS related stigma -dimensional "labels" low chance to
utilize VCT clinic had 6.1 times compared to the dimension of the stigma of "labels" high. There is
a relationship between HIV/AIDS related stigma-dimensional "interaction" with the utilization of
VCT clinic. FSWs has HIV/AIDS related stigma-dimensional "interaction" low chance to utilize VCT
clinic had 5.4 times compared to the dimension of the stigma of "interaction" high. The HIV/AIDS
related stigma dimension "shame and blame" is not related to the utilization of VCT clinics. In this
study also found that knowledge about HIV / AIDS related to the utilization of VCT clinics.
320
Public Health Department, Faculty of Sports Science, F1 Building, 2nd
Floor, Sekaran Campus Gunungpati, Semarang City, Central Java Province, Indonesia, 50229 Phone/ Fax. +6224 8508007
References
Babalola S. Readiness for HIV testing among Young People in Northern Nigeria: The Roles of Social Norm and Perceived Stigma. AIDS Behav. 2007;11(5):759-69.
BPS, International M. Indonesia Demographic and Health Survey 2007. Calverton Maryland USA: Macro International; 2008.
Depkes RI. Surveilans Terpadu Biologis Perilaku pada Kelompok Beresiko Tinggi 2007. 2007 [cited 2012 9 Maret]; Available from: www.depkes.go.id.
Dinkes Kabupaten Semarang. Profil Kesehatan Kabupaten Semarang Tahun 2011. Kabupaten Semarang: Dinas Kesehatan Kabupaten Semarang; 2011.
Kalichman SC, Simbayi LC. HIV testing attitudes, AIDS stigma, and voluntary HIV counselling and testing in a black township in Cape Town, South Africa. Sexually transmitted infections. 2003;79(6):442-7.
Koku EF. Desire for, and uptake of HIV tests by Ghanaian women: The relevance of community level stigma. Journal of community health. 2011;36(2):289-99.
KPA. Situasi HIV dan AIDS di Indonesia. 2010 [cited 2012 19 Januari]; Available from: www.aidsina.or.id.
____. Strategi dan Rencana Aksi Nasional Penanggulangan HIV dan AIDS Tahun 2010-2014. Jakarta: KPA; 2010.
Lieber E, Li L, Wu Z, Rotheram-Borus MJ, Guan J. HIV/STD stigmatization fears as health-seeking barriers in China. AIDS and Behavior. 2006;10(5):463-71.
NurImamah S. Analisis Faktor Pemanfaatan VCT pada Orang Risiko Tinggi HIV/AIDS (Analysis Factor Related to VCTUtilization For The HighRisk Person of HIV/AIDS). JURNAL NERS. 2012;6(1).
Nyblade L, MacQuarrie K, Kwesigabo G, Jain A, Kajula L, Philip F, et al. Moving forward: tackling stigma in a Tanzanian community: Population Council, Horizons; 2008.
Obermeyer CM, Osborn M. The utilization of testing and counseling for HIV: a review of the social and behavioral evidence. Journal Information. 2007;97(10).
Odimegwu CO. Prevalence and Predictors of HIV-Related Stigma and Knowledge IN Nigeria: Implications for HIV/AIDS Prevention Initiatives. Boston, Massachusetts: Takemi Program in International Health. 2003.
Sambisa W. AIDS Stigma and Uptake of HIV Testing in Zimbabwe. The DHS Working Papers No 49. 2008.
UNAIDS. Voluntary Counseling and Testing (VCT). New York: UNAIDS; 2000. Wang Y, Pan J, Wang X, Li B, Henderson G, Emrick CB, et al. Reported wiilingness and
associated factors related to utilization of voluntary counselling and testing services by female sex workers in Shandong Province, China. Biomedical and Environmental Sciences. 2010;23(6):466-72.
Public Health Department, Faculty of Sports Science, F1 Building, 2nd
Floor, Sekaran Campus Gunungpati, Semarang City, Central Java Province, Indonesia, 50229 Phone/ Fax. +6224 8508007
321
FACTORS RELATED INCIDENT OF TB SUSPECT CASES IN PARUNGPONTEN PRIMARY HEALTH CARE TASIKMALAYA
Siti Nurjanah1, Suharyo1
1 Dian Nuswantoro University, Indonesia
Corresponding Author: [email protected]
Abstract Introduction: Tuberculosis (TB) remains a global health threat, including in Indonesia. Based on initial survey of Parungponten primary health care, District of Tasikmalaya in 2012 found that the number of tuberculosis cases reached 49 people. The aim of this study was to determine factors related to incident of TB suspect cases. Factors that analyzed were age, education level, monthly income, nutritional status, habit of smoking, ventilation, and transmission sources. Methods: This study was case control design, with population of study were 30 patients of TB suspect cases in Parungponten primary health care. Samples of this study were total population which 30 patients of TB suspect cases and 30 people non TB cases as control. Chi square test had used to analyze of relation between dependent and independent variables. Results: Result showed that no significant relation between age (p:1.00; OR:0.679; CI95%:0.185-3.198), education level (p: 0.195; OR: 0.172; CI 95%= 0.019-1.576), monthly income (p:0.417; OR:1.556; CI95%: 0.534-4.532), nutritional status (p:0.612; OR:3.22; CI95%:0.316-32.889), habit of smoking (p:0.584; OR:1.351; CI95%: 0.460-3.968), ventilation (p: 0.592; OR:1.33; CI95%:0.465-3.823) with incident of TB suspect cases. There was significantly relation between transmission sources with incident of TB suspect cases (p: 0.005; OR:2.364; CI95%:1.721-3.247). It concluded
that primary health care need to do investigation of household contact and neighbor of TB patients to find a new TB cases that not found yet. Key Words: TB suspect, determinant factors
Introduction
Based on World Health Organization (WHO) in 2010 Indonesia occupied the 5 th biggest of
tuberculosis incidence in the world. Estimation number of tuberculosis prevalence was 660.000
cases and estimation number of tuberculosis incidence was 430.000 cases per year. While, in
2012 Indonesia occupied the 4th biggest country of tuberculosis cases. (Health Department of
Tasikmalaya District.2012)
Suspect finding in Indonesia raised 8.46% from 744 suspects in 2010 became 807 per
100.000 population in 2011. 21 provinces had number of TB suspect prevalence higher than
national prevalence number, and 10 provinces got the number of TB prevalence under the national
prevalence number. The 5 provinces had highest number of TB prevalence were Gorontalo 6.992
per 100.000 population, West Papua 6.722 per 100.000 population, East Nusa Tenggara 6511 per
100.000 population, Central Sulawesi 5.367 per 100.000 population, and Jambi 5.337 per 100.000
population (Wulandari.2010)
Health Ministry have been decide indicator of process, that is number of suspect finding.
Number of suspect finding is amount of suspect that exanimate of their sputum among 100.000
population of region in one year. The number used to know the access of services and effort of
322
Public Health Department, Faculty of Sports Science, F1 Building, 2nd
Floor, Sekaran Campus Gunungpati, Semarang City, Central Java Province, Indonesia, 50229 Phone/ Fax. +6224 8508007
finding cases in the region, with noticed tendency every time.2 TB suspect is a people with
symptoms of TB. General symptoms of TB are productive cough more than two weeks with
respiratory symptoms (hard breathing, pain of chest, hemoptysis) and or additional symptoms (no
appetite, loss weight, night sweats and easy to get fatigue). (Naga.2012)
Based on Health Department of Tasikmalaya district, scope of TB cases finding in 2012 until
third quarter reached 819 (43.37%), with the amount of TB suspect were 6.752 people.8 TB
suspect until now days still become a problem in Parungponten primary health care along year of
2012, that was reached 49 cases. This showed that scope of TB cases Parungponten primary
health care passed the target. (Keman.2005)
Researcher interested to do research in work area of Parungponten primary health care
Tasikmalaya, because based on Parungponten primary healthcare data in 2012, the number of
suspect pass the target around 5-15%. This number was pass the target (>15%) that can be
caused of loose the crawl or there indicated problem on laboratory (false positive).18 This was
never take on research especially about factors that related with incidence of TB suspect cases in
work area of Parungponten primary health care Tasikmalaya district.
Methods
This study was case control design. Cases group were patients of TB suspect that record by
Parungponten primary health care in January to December 2012 were 49 patients. While, control
group are society that free from Tb suspect with age more than 15 years old, and lived in research
area. Samples used were 30 patients for each group. Sampling technique used in this research
was simple random sampling. Data collection used interview and questionnaire as guidance to
collect the data, whereas data analysis used Chi Square test to indicate relation between
dependent variable and independent variables, with p value 0.05. independent variables were age,
education, income, nutritional status, habit of smoke, ventilation, and transmission sources.
Age was record by identity card of respondents and separated by reproductive age (15-55
years old) and elderly (more than 55 years old). Education was classified become high education
(High school or college) ad low education (primary school-Secondary school). Income was tale
income of respondents based on amount income of family that used to covered family cost in a
month and separated by less than standard income (Rp. 1.035.000) and more than standard
income. Nutritional status measured by count the body mass index, separated by tiny (BMI <17.0)
and normal. Habit of smoke was history of smoking in a year separated by smoking and non
smoking. Ventilation was condition of place or hole that function as circulation, classified by good
ventilation (10%-20% from total of floor) and bad ventilation (less than 10%-20% from total of
floor). Transmission sources is house member was new TB patients based on health provider
diagnostic.

Public Health Department, Faculty of Sports Science, F1 Building, 2nd
Floor, Sekaran Campus Gunungpati, Semarang City, Central Java Province, Indonesia, 50229 Phone/ Fax. +6224 8508007
323
Results and Discussion
Research area was Parungponten primary health care working area with the geographic as
hills, mountains area, and mainland that 30 km southern area of capital town Tasikmalaya district
West Java. Parungponten PHC is the satellite PHC, which means that do not have own laboratory
and just provide wipe of sputum and deification, than delivered to Cibalong PHC to read the result.
After have the result, Parungponten PHC will decide the treatment. Suspect TB cases finding was
make cooperation with multi program and multi sector. Suspect TB cases finding was done by
passive method, which collecting the suspect by diagnosis people that came to PHC. Whereas
after they came to the health service, will do the active education. Promotion was done by health
provider to raising covered of suspect finding. This way is called passive promotion case finding.
Table 1. Age distribution based on case and control group
Age Cases Control
F % F %
Productive age 25 83.3 26 86.7 Elderly 5 16.7 4 13.3
Total 30 100 30 100
P value: 1.00 Ho: Accepted
Table showed that percentage of productive age category reached 83.3% in case group, less
than group control which reached 86.7%. Chi Square test result showed that there was no
significant relation between age and incidence of suspect TB cases (P = 1.00). And odd ratio was
0.769, which means age is the protective factor of TB.
Table 2. Education level distribution based on case and control group
Education Cases Control
F % F %
Low education 25 83.3 29 96.7 High education 5 16.7 1 3.3
Total 30 100 30 100
P value: 0.195 Ho: Accepted
Based on the table we can see that percentage of education level respondents in case group
reached 83.3% in low education, less than control group (96.7%). Chi Square test result showed
that there was no significant relation between education and incidence of Suspect TB cases. (P =
0.195), OR = 0.172 which means education is the protective factor of TB, with 95% CI = 0.019-
1.567.
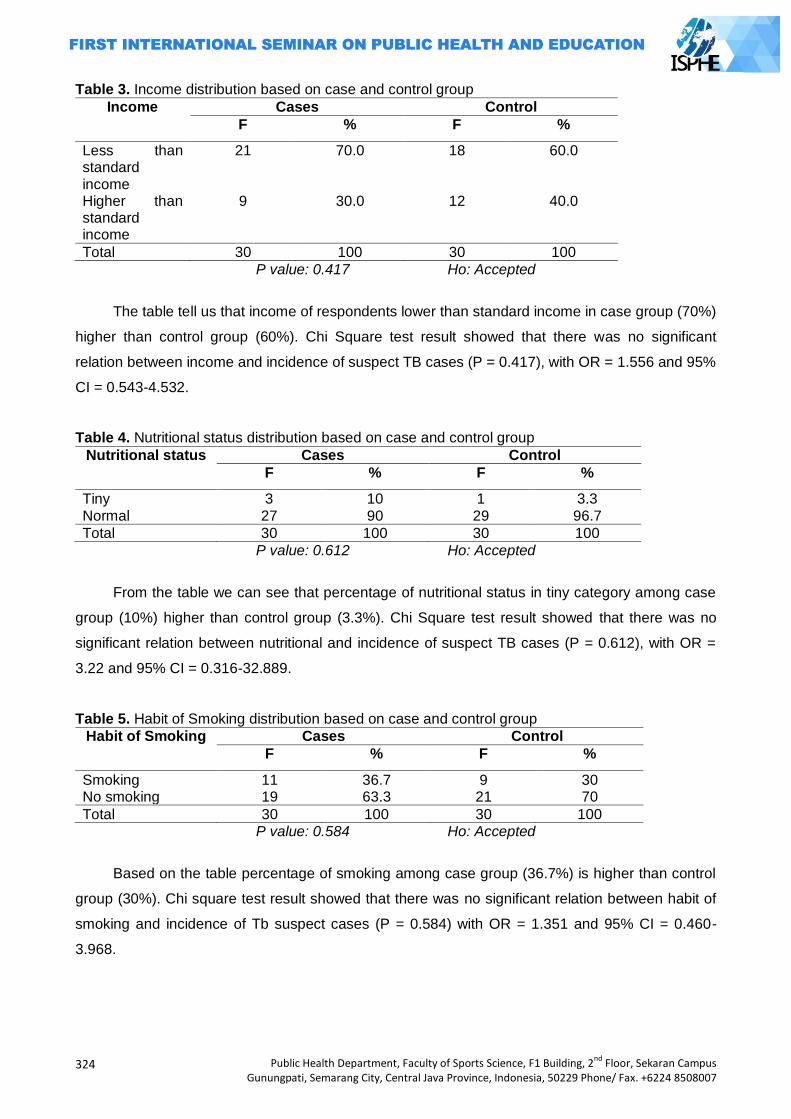
324
Public Health Department, Faculty of Sports Science, F1 Building, 2nd
Floor, Sekaran Campus Gunungpati, Semarang City, Central Java Province, Indonesia, 50229 Phone/ Fax. +6224 8508007
Table 3. Income distribution based on case and control group
Income Cases Control
F % F %
Less than standard income
21 70.0 18 60.0
Higher than standard income
9 30.0 12 40.0
Total 30 100 30 100
P value: 0.417 Ho: Accepted
The table tell us that income of respondents lower than standard income in case group (70%)
higher than control group (60%). Chi Square test result showed that there was no significant
relation between income and incidence of suspect TB cases (P = 0.417), with OR = 1.556 and 95%
CI = 0.543-4.532.
Table 4. Nutritional status distribution based on case and control group
Nutritional status Cases Control
F % F %
Tiny 3 10 1 3.3 Normal 27 90 29 96.7
Total 30 100 30 100
P value: 0.612 Ho: Accepted
From the table we can see that percentage of nutritional status in tiny category among case
group (10%) higher than control group (3.3%). Chi Square test result showed that there was no
significant relation between nutritional and incidence of suspect TB cases (P = 0.612), with OR =
3.22 and 95% CI = 0.316-32.889.
Table 5. Habit of Smoking distribution based on case and control group
Habit of Smoking Cases Control
F % F %
Smoking 11 36.7 9 30 No smoking 19 63.3 21 70
Total 30 100 30 100 P value: 0.584 Ho: Accepted
Based on the table percentage of smoking among case group (36.7%) is higher than control
group (30%). Chi square test result showed that there was no significant relation between habit of
smoking and incidence of Tb suspect cases (P = 0.584) with OR = 1.351 and 95% CI = 0.460-
3.968.
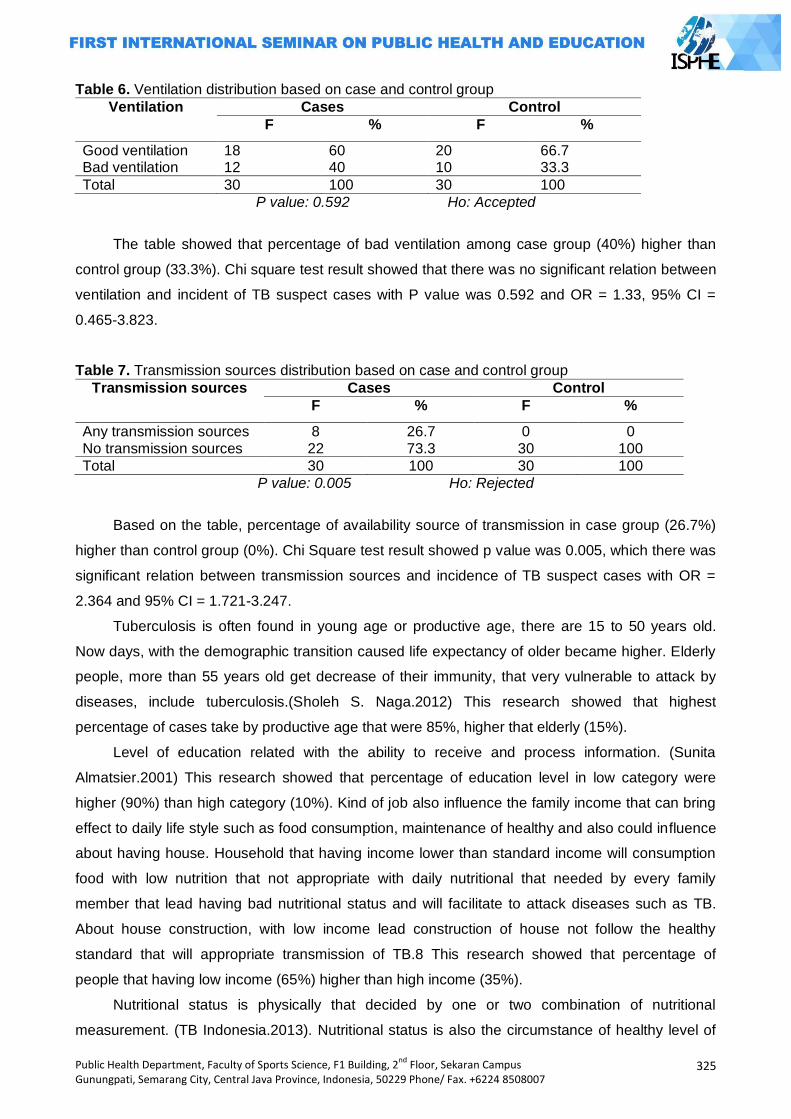
Public Health Department, Faculty of Sports Science, F1 Building, 2nd
Floor, Sekaran Campus Gunungpati, Semarang City, Central Java Province, Indonesia, 50229 Phone/ Fax. +6224 8508007
325
Table 6. Ventilation distribution based on case and control group
Ventilation Cases Control
F % F %
Good ventilation 18 60 20 66.7 Bad ventilation 12 40 10 33.3
Total 30 100 30 100
P value: 0.592 Ho: Accepted
The table showed that percentage of bad ventilation among case group (40%) higher than
control group (33.3%). Chi square test result showed that there was no significant relation between
ventilation and incident of TB suspect cases with P value was 0.592 and OR = 1.33, 95% CI =
0.465-3.823.
Table 7. Transmission sources distribution based on case and control group
Transmission sources Cases Control
F % F %
Any transmission sources 8 26.7 0 0 No transmission sources 22 73.3 30 100
Total 30 100 30 100
P value: 0.005 Ho: Rejected
Based on the table, percentage of availability source of transmission in case group (26.7%)
higher than control group (0%). Chi Square test result showed p value was 0.005, which there was
significant relation between transmission sources and incidence of TB suspect cases with OR =
2.364 and 95% CI = 1.721-3.247.
Tuberculosis is often found in young age or productive age, there are 15 to 50 years old.
Now days, with the demographic transition caused life expectancy of older became higher. Elderly
people, more than 55 years old get decrease of their immunity, that very vulnerable to attack by
diseases, include tuberculosis.(Sholeh S. Naga.2012) This research showed that highest
percentage of cases take by productive age that were 85%, higher that elderly (15%).
Level of education related with the ability to receive and process information. (Sunita
Almatsier.2001) This research showed that percentage of education level in low category were
higher (90%) than high category (10%). Kind of job also influence the family income that can bring
effect to daily life style such as food consumption, maintenance of healthy and also could influence
about having house. Household that having income lower than standard income will consumption
food with low nutrition that not appropriate with daily nutritional that needed by every family
member that lead having bad nutritional status and will facilitate to attack diseases such as TB.
About house construction, with low income lead construction of house not follow the healthy
standard that will appropriate transmission of TB.8 This research showed that percentage of
people that having low income (65%) higher than high income (35%).
Nutritional status is physically that decided by one or two combination of nutritional
measurement. (TB Indonesia.2013). Nutritional status is also the circumstance of healthy level of
326
Public Health Department, Faculty of Sports Science, F1 Building, 2nd
Floor, Sekaran Campus Gunungpati, Semarang City, Central Java Province, Indonesia, 50229 Phone/ Fax. +6224 8508007
people caused by food that consume before. Which means that quality and quantity of nutrition
than consume will influence the immunology, while body will resistant to TB infection. But, if the
nutritional status is bad, it will reduce the immunology to diseases that can raise risk to infected by
TB.9 This research showed that percentage of nutritional status with normal category reached
higher (93.3%) than tiny category (6.7%).
Smoking has been known having a relation with raising risk of lung cancer, heart coronary,
chronic bronchitis, and urinary cancer. Smoking raised risk of attack by TB 2.2 higher than no
smoking. Prevalence of smoking in almost every developing country more than 50% do by man,
whereas woman that smoke less than 5%. With the habit of smoking will vulnerable to infected by
TB. 10 This research showed percentage habit of smoking less (33.3%) than no smoking category
(66.7%).
Ventilation is a changing process of air. Ventilation has much function. First function is to
keep the airflow in the house remain fresh. This which balancing of oxygen that need by occupants
of house remain intact. Less of ventilation will cause the humidity raising. The humidity is a good
media to growth of bacteria such as TB. Second function of ventilation is to release of room air
from bacteria, especially pathogen. The other function is to keep the room remain having optimum
humidity.(Anonim.2013) This research showed that percentage of ventilation, good ventilation
(63.3%) higher than bad ventilation (36.7%).
TB can be a rise faster in individual that having profile delivered. More often and longer
contact, will make the chance to get transmission become higher. Parents, housemate, or guest is
a source of transmission for baby and toddler that called close contact. (Suparyanto.2013) This
research showed that percentage of availability of source transmission (26.7%) higher than no
source transmission (0%).
Closing
From the research conclude that source of transmission is a risk factor and have significant
relation with incidence of TB suspect cases. Most of the TB suspects patients were in productive
age. Majority of the TB suspects patients were in low education level, had income lower than
standard income. Only few of the TB suspect patients were in nutritional status as tiny. Most of the
TB suspects patients were in category bad ventilation and few of the TB suspects cases were in
any source transmission.
For TB patients should minimalist transmission with prevention, such as close the mouth
when have cough and not spitting. Need to investigation by primary health care provider to
household contact and neighbor of TB patients to find new active cases.
References
Anonim. Available at http://www.google.com/url?sa=t&rct=j&q=&esrc=s&source=web&cd=2
&ved=0CDEQFjAB&url=http%3A%2F%2Fejournal.litbang.depkes.go.id%2Findex.php%2FM
Public Health Department, Faculty of Sports Science, F1 Building, 2nd
Floor, Sekaran Campus Gunungpati, Semarang City, Central Java Province, Indonesia, 50229 Phone/ Fax. +6224 8508007
327
PK%2Farticle%2Fdownload%2F979%2F791&ei=CMceUofjLM7nrAf2iIFQ&usg=AFQjCNGyY
K9jYPMxQhY3A85163Fqq8BLQ&sig2=6US8DJUesT4zBpEQq0rpZQ&bvm=bv.51495398,
d.bmk&cad=rja. Access on 28 April 2013.
____. Risk Factor. Available at www.faktorrisiko.com. Access on 20 February 2013.
Health Department of Tasikmalaya District. TB cases data and Tb suspect. Tasikmalaya. 2012
Health Ministry. Diseases control program. Available at
http://depkes.go.id/index.php/component/content/article/43-newsslider/2242-program
pengendalian-penyakit-capai-target.html. Access on 04 February 2013
Leny Wulandari. The role of knowledge to treatment seeking behavior of TB suspects cases in
Indonesia. Thesis. 2010
Parungponten Primary Health Care. TB cases data and Tb suspect. Tasikmalaya. 2012
Sholeh S. Naga. Guideline Book of Pathology. DIVA Press. Yogyakarta. 2012
Soedjadji Keman. Housing and Environmental Health Settlements. P2M. Jakarta.2005
Sunita Almatsier. Basic Principles of Nutrition. Gramedia Pustaka Utama. Jakarta. 2001
Suparyanto. Basic Epidemiology. Available at http://dr-suparyanto.blogspot.com/2010/03/konsep-
dasar-epidemiologi-penyakit.html . .access on 05 March 2013
TB Indonesia. Data TB 2010. Available at http://tbindonesia.or.id/pdf/Data_tb_1_2010.pdf . Access
on 02 March 2013.
Tuberculosis Working Team. Guidelines for Diagnosis and Management in Indonesia. Lung
Indonesian Doctors Association. New York. 2011
328
Public Health Department, Faculty of Sports Science, F1 Building, 2nd
Floor, Sekaran Campus Gunungpati, Semarang City, Central Java Province, Indonesia, 50229 Phone/ Fax. +6224 8508007
FACTORS INFLUENCING THE USE OF CONDOM AMONG FEMALE SEX WORKERS IN
LOCALIZATION
Mahalul Azam1, Arulita Ika Fibriana1, Muhammad Azinar1
1Semarang State University, Indonesia
Corresponding Author: [email protected]
Muhammad
Abstract
Introduction: HIV/AIDS is getting worse both quantitatively and qualitatively. Commercial Sex
Workers (CSW) is a group of people who has a high risk of being infected by Sexually Transmitted
Infections (STIs) and HIV/AIDS. In Indonesia, it is predicted that more than 50% Commercial Sex
Workers are infected by STIs. The use of condom is a strategy to prevent the transmission of STIs
and HIV in high risky groups including female sex workers and their customers. In Banyuputih
Localization Batang, 100% condom use program is still hard to reach.
Methods: This research is an explanatory research with cross-sectional approach. It takes a total
sampling of 71 Female Sex Workers (FSW) in Banyuputih Localization.
Results: The results show that 80% FSW and their customers do not always use condom while
having a sexual intercourse. Some factors influencinging this are perception of susceptibility of
being infected by HIV/AIDS, perception about severity of STIs and HIV/AIDS, perception towards
the benefits of condom use, and supports from their pimps.
Key Words: Female sex worker, condom use
Introduction
In Indonesia, commercial sex has already existed since pre-colonial era (Jones et al., 1995).
According to the Ministry of Health Indonesia, in 2007 there are about 221.000 female sex workers
and more than three millions of their customers in Indonesia (KPAN, 2007). Although it is admitted
that the commercialization of sex is impossible to be eliminated, there is only a few regions in
Indonesia that are willing to legalize the commercialization of sex due to many reasons. Such
ambiguity makes the commercial sex industry difficult to identify and control.
The number of sex workers both female and male increases from time to time. Direct sex
workers are located in a location, localization and public places. Indirect sex workers are generally
located in entertainment business surroundings such as karaoke places, bars, beauty salons,
massage houses, and so on. Sex workers are high risky sub-populations along with transgenders
and gays.
The Ministry of Health Indonesia estimates that in 2006 the number of female sex workers
is about 177.200 until 265.000, transgender sex workers is about 21.000 until 35.000 and gays is
about 384.000 until 1.148.000. The number or their customers are bigger; that is about 2.435.000
until 3.813.000 for female sex workers and 62.000 until 104.000 for transgenders. The number of
male sex workers in big cities also increases. Economic growth in urban areas and economic
Public Health Department, Faculty of Sports Science, F1 Building, 2nd
Floor, Sekaran Campus Gunungpati, Semarang City, Central Java Province, Indonesia, 50229 Phone/ Fax. +6224 8508007
329
weakening in rural areas may increase the number of female sex workers more rapidly. If the
efforts of safety sex for them and their customers do not run well, the transmission of HIV through
this way will be ongoing (KPAN, 2007).
Statistically, HIV/AIDS prevalence among sex workers and their customers are clearly
higher than general population. Therefore, HIV prevention efforts need to understand the
characteristics of the commercial sex industry. Those efforts can be started from preventing people
to enter the commercial sex industry. For those who have already entered it, protection efforts and
supports to leave the industry are needed.
Sex workers are susceptible towards HIV transmission considering the number of people
who have a sexual intercourse with and usually they also have a high possibility to transmit the
STIs (KPAN, 2011). In some countries, HIV prevalence among female sex workers is very high.
This high HIV prevalence among female sex workers then becomes such an irony. It is because
sex workers feel powerless to negotiate about safety sex since it relates to the income they earn.
In some cases, sex workers receive higher income when they have a sexual intercourse with men
without condom (Farida Aprilianingrum, 2002).
HIV/AIDS is getting worse both quantitatively and qualitatively. A cumulative result shows
that there are 92.251 cases of HIV, 39.434 cases of AIDS and 7.293 cases of death caused by
HIV/AIDS ranging from April 1st 1987 until September 30th 2012. These AIDS cases increase
very drastically from last year because in 2011 the cumulative number of AIDS cases is 29.879.
This happens because in a full last year, 9.555 new cases of AIDS raises significantly. (Ditjen PP &
PL Kemenkes RI, 2011 and 2012).
Batang Regency is a regency in Central Java that has HIV/AIDS cases quite large. Based
on the data from KPA Batang, from 2007 until 2011, there are 170 cases of HIV/AIDS in Batang
Regency. 50 of them are positive of suffering AIDS and 26 patients have died (KPA Batang, 2011).
In 2012, Batang Regency was in the 7th rank due to the number of AIDS cases in Central Java
and the majority was in teenagers age (KPA Batang, 2012).
Commercial Sex Workers (CSW) is a group of people who has a high risk of being infected
by Sexually Transmitted Infections (STIs) and HIV/AIDS. In Indonesia, it is predicted that more
than 50% Commercial Sex Workers are infected by STIs. This thing is getting worse because of
the behavior of female sex workers who pay less attention to their own reproduction health. Most of
them are reluctant to do medical check-up for economic reasons and the presence of negative
stigma on them. They prefer to buy some medicines including antibiotics without consulting with
health professionals first (Amri, 2009).
The use of condom while having a risky sexual intercourse is a strategy to prevent the
transmission of STIs and HIV in risky groups including female sex workers and their customers.
Increasing awareness of condom use is proved to be able to reduce the transmission of STIs and
HIV (KPAN, 2010; UNAIDS, 2004).
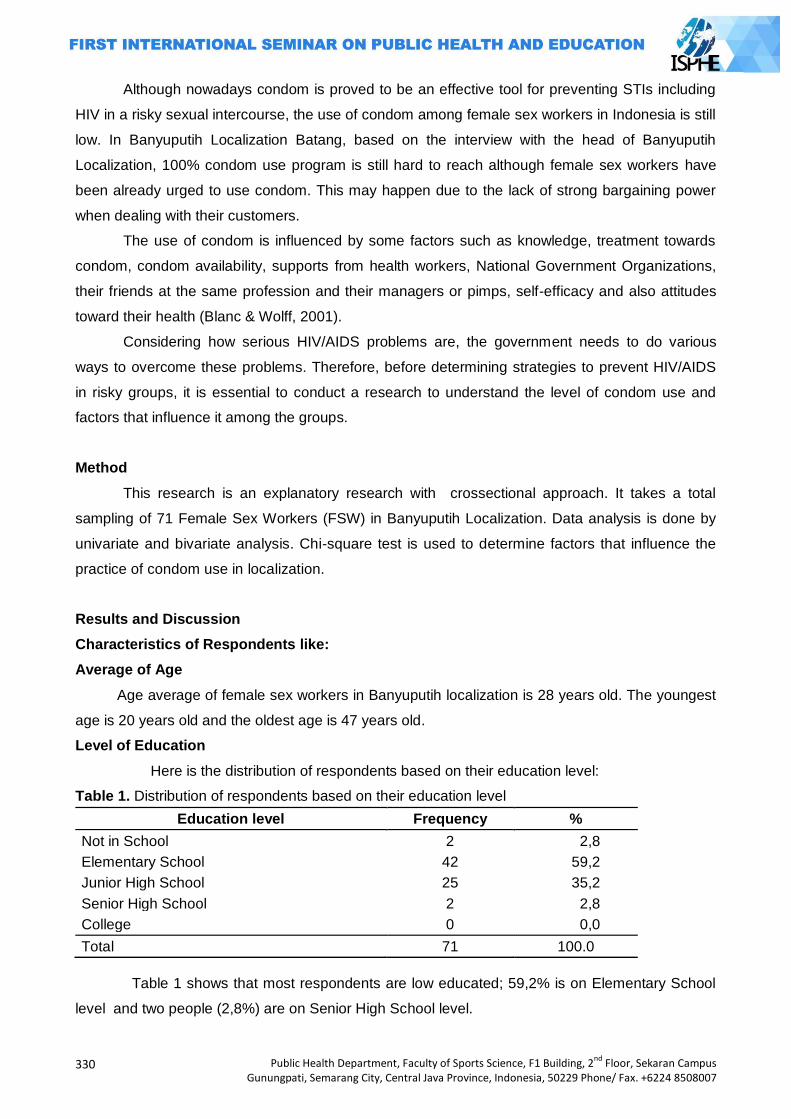
330
Public Health Department, Faculty of Sports Science, F1 Building, 2nd
Floor, Sekaran Campus Gunungpati, Semarang City, Central Java Province, Indonesia, 50229 Phone/ Fax. +6224 8508007
Although nowadays condom is proved to be an effective tool for preventing STIs including
HIV in a risky sexual intercourse, the use of condom among female sex workers in Indonesia is still
low. In Banyuputih Localization Batang, based on the interview with the head of Banyuputih
Localization, 100% condom use program is still hard to reach although female sex workers have
been already urged to use condom. This may happen due to the lack of strong bargaining power
when dealing with their customers.
The use of condom is influenced by some factors such as knowledge, treatment towards
condom, condom availability, supports from health workers, National Government Organizations,
their friends at the same profession and their managers or pimps, self-efficacy and also attitudes
toward their health (Blanc & Wolff, 2001).
Considering how serious HIV/AIDS problems are, the government needs to do various
ways to overcome these problems. Therefore, before determining strategies to prevent HIV/AIDS
in risky groups, it is essential to conduct a research to understand the level of condom use and
factors that influence it among the groups.
Method
This research is an explanatory research with crossectional approach. It takes a total
sampling of 71 Female Sex Workers (FSW) in Banyuputih Localization. Data analysis is done by
univariate and bivariate analysis. Chi-square test is used to determine factors that influence the
practice of condom use in localization.
Results and Discussion
Characteristics of Respondents like:
Average of Age
Age average of female sex workers in Banyuputih localization is 28 years old. The youngest
age is 20 years old and the oldest age is 47 years old.
Level of Education
Here is the distribution of respondents based on their education level:
Table 1. Distribution of respondents based on their education level
Education level Frequency %
Not in School 2 2,8
Elementary School 42 59,2
Junior High School 25 35,2
Senior High School 2 2,8
College 0 0,0
Total 71 100.0
Table 1 shows that most respondents are low educated; 59,2% is on Elementary School
level and two people (2,8%) are on Senior High School level.
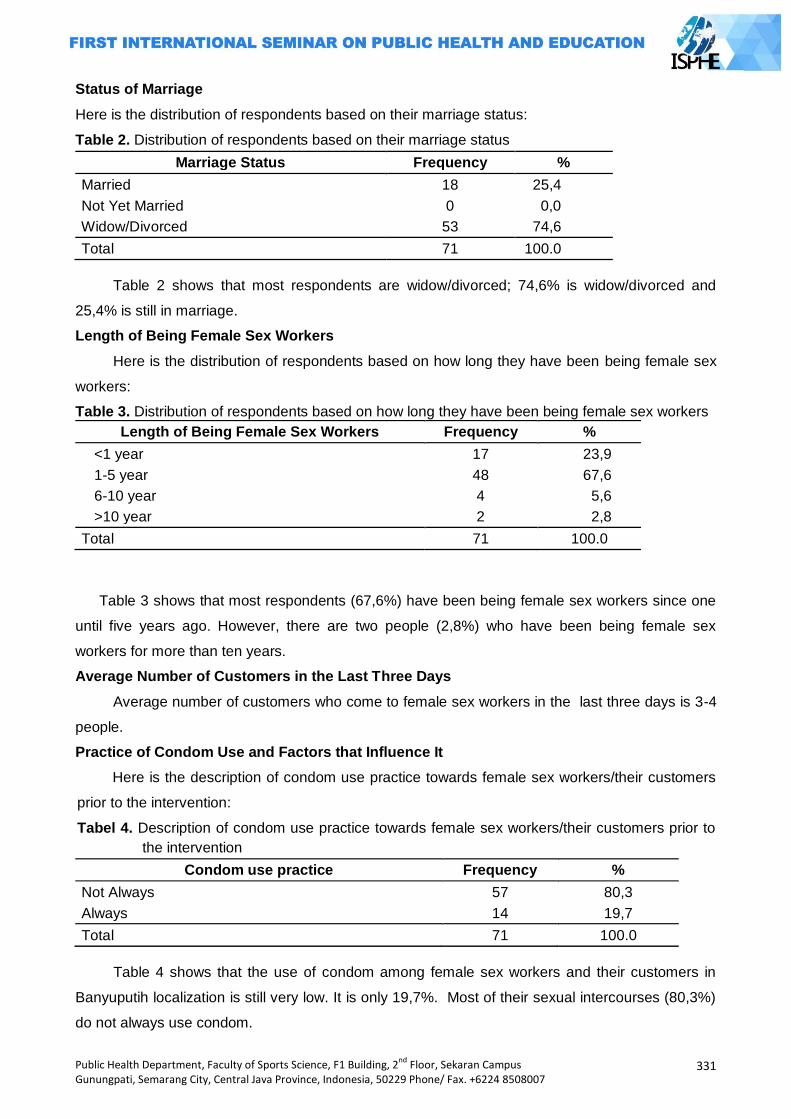
Public Health Department, Faculty of Sports Science, F1 Building, 2nd
Floor, Sekaran Campus Gunungpati, Semarang City, Central Java Province, Indonesia, 50229 Phone/ Fax. +6224 8508007
331
Status of Marriage
Here is the distribution of respondents based on their marriage status:
Table 2. Distribution of respondents based on their marriage status
Marriage Status Frequency %
Married 18 25,4
Not Yet Married 0 0,0
Widow/Divorced 53 74,6
Total 71 100.0
Table 2 shows that most respondents are widow/divorced; 74,6% is widow/divorced and
25,4% is still in marriage.
Length of Being Female Sex Workers
Here is the distribution of respondents based on how long they have been being female sex
workers:
Table 3. Distribution of respondents based on how long they have been being female sex workers
Length of Being Female Sex Workers Frequency %
<1 year 17 23,9
1-5 year 48 67,6
6-10 year 4 5,6
>10 year 2 2,8
Total 71 100.0
Table 3 shows that most respondents (67,6%) have been being female sex workers since one
until five years ago. However, there are two people (2,8%) who have been being female sex
workers for more than ten years.
Average Number of Customers in the Last Three Days
Average number of customers who come to female sex workers in the last three days is 3-4
people.
Practice of Condom Use and Factors that Influence It
Here is the description of condom use practice towards female sex workers/their customers
prior to the intervention:
Tabel 4. Description of condom use practice towards female sex workers/their customers prior to
the intervention
Condom use practice Frequency %
Not Always 57 80,3
Always 14 19,7
Total 71 100.0
Table 4 shows that the use of condom among female sex workers and their customers in
Banyuputih localization is still very low. It is only 19,7%. Most of their sexual intercourses (80,3%)
do not always use condom.
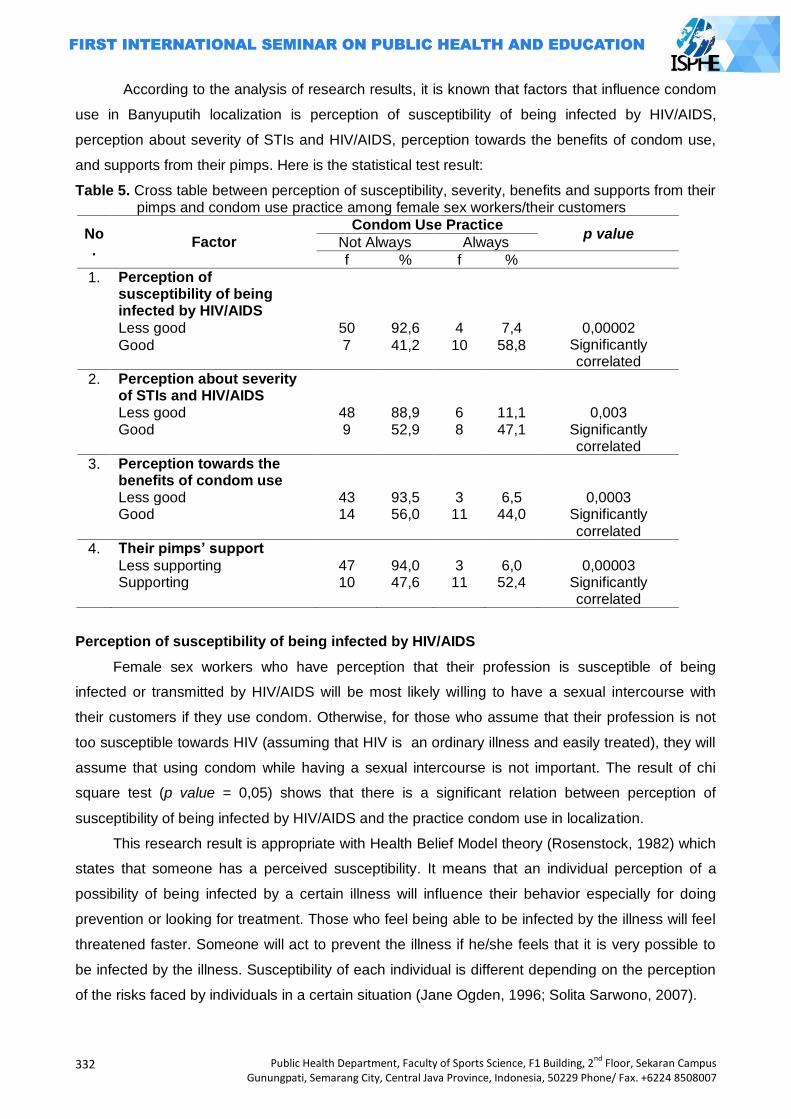
332
Public Health Department, Faculty of Sports Science, F1 Building, 2nd
Floor, Sekaran Campus Gunungpati, Semarang City, Central Java Province, Indonesia, 50229 Phone/ Fax. +6224 8508007
According to the analysis of research results, it is known that factors that influence condom
use in Banyuputih localization is perception of susceptibility of being infected by HIV/AIDS,
perception about severity of STIs and HIV/AIDS, perception towards the benefits of condom use,
and supports from their pimps. Here is the statistical test result:
Table 5. Cross table between perception of susceptibility, severity, benefits and supports from their pimps and condom use practice among female sex workers/their customers
No.
Factor
Condom Use Practice p value
Not Always Always
f % f %
1. Perception of susceptibility of being infected by HIV/AIDS
Less good 50 92,6 4 7,4 0,00002 Significantly correlated
Good 7 41,2 10 58,8
2. Perception about severity of STIs and HIV/AIDS
Less good 48 88,9 6 11,1 0,003 Good 9 52,9 8 47,1 Significantly
correlated
3. Perception towards the benefits of condom use
Less good 43 93,5 3 6,5 0,0003 Good 14 56,0 11 44,0 Significantly
correlated
4. Their pimps’ support Less supporting 47 94,0 3 6,0 0,00003 Supporting 10 47,6 11 52,4 Significantly
correlated
Perception of susceptibility of being infected by HIV/AIDS
Female sex workers who have perception that their profession is susceptible of being
infected or transmitted by HIV/AIDS will be most likely willing to have a sexual intercourse with
their customers if they use condom. Otherwise, for those who assume that their profession is not
too susceptible towards HIV (assuming that HIV is an ordinary illness and easily treated), they will
assume that using condom while having a sexual intercourse is not important. The result of chi
square test (p value = 0,05) shows that there is a significant relation between perception of
susceptibility of being infected by HIV/AIDS and the practice condom use in localization.
This research result is appropriate with Health Belief Model theory (Rosenstock, 1982) which
states that someone has a perceived susceptibility. It means that an individual perception of a
possibility of being infected by a certain illness will influence their behavior especially for doing
prevention or looking for treatment. Those who feel being able to be infected by the illness will feel
threatened faster. Someone will act to prevent the illness if he/she feels that it is very possible to
be infected by the illness. Susceptibility of each individual is different depending on the perception
of the risks faced by individuals in a certain situation (Jane Ogden, 1996; Solita Sarwono, 2007).
Public Health Department, Faculty of Sports Science, F1 Building, 2nd
Floor, Sekaran Campus Gunungpati, Semarang City, Central Java Province, Indonesia, 50229 Phone/ Fax. +6224 8508007
333
Female sex workers and their customers are high risky groups of transmitting and being
transmitted by HIV/AIDS. When they feel that their selves are susceptible towards HIV associated
with their behaviors of having a sexual intercourse very often with sex workers, they will try to
protect themselves doing such a preventive way by using condom. They know that HIV/AIDS can
be transmitted through sexual intercourse with different partners without using a safety tool
(condom).
Perception about severity of STIs and HIV/AIDS
Female sex workers who have perception that being infected/transmitted HIV will endanger
their health including cause of death as well as social punishments in the society, will have a
bigger proportion of willing to have a sexual intercourse with their customers if they use condom
and will refuse to have a sexual intercourse without using condom. Otherwise, for those who
consider STIs and HIV are ordinary illness and easily treated will tend to have a sexual intercourse
although without using condom. The result of chi square test (p value = 0,05) shows that there is a
significant relation between perception about severity of HIV/AIDS and condom use practice in
localization.
This research result is appropriate with Health Belief Model theory (Rosenstock, 1982). This
theory states that the act of preventing a certain illness and looking for the treatment are influenced
by perceived severity; that is a perception of severity that may be perceived when suffering a
certain illness. This perception is an individual view about severity of the illness. This view
encourages someone to look for the treatment on his/her illness. This is increased because of
some effects of a certain illness such as mortality, reduction of physical and mental function,
disability and its impacts towards social life (Jane Ogden, 1996).
Female sex workers and their customers will be willing to use condom while having a sexual
intercourse if they have perception assuming that being infected by HIV will bring to serious
consequences that can cause death due to the decrease of immunity so that they will be infected
easily. In addition, there are social impacts which are caused by HIV such as being expelled by
their family and the society, having bad stigma and discrimination.
Perception towards the Benefits of Condom Use
Female sex workers who have perception that condom has a great benefit in preventing the
transmission of HIV, will have a bigger proportion of willing to use condom while having a sexual
intercourse. Otherwise, those who have unfavorable perception of the benefits of condom, have a
bigger proportion to refuse using condom while having a sexual intercourse. The result of chi
square test (p value = 0,05) shows that there is a significant relation between perception towards
the benefits of condom use and the practice of condom use.
This research result shows that someone will consider whether this alternative way is really
helpful to reduce illness threats or not. This perception is also related to the availability of
resources so that this action may be implemented. It is influenced by norms and pressures from
334
Public Health Department, Faculty of Sports Science, F1 Building, 2nd
Floor, Sekaran Campus Gunungpati, Semarang City, Central Java Province, Indonesia, 50229 Phone/ Fax. +6224 8508007
their groups. It is appropriate with Health Belief Model theory (Rosenstock, 1982) which states that
in doing preventive actions or treatments of illness will be influenced by the perceived benefit.
A truck driver as one of the female sex workers‘ customers who believes that VCT program
is very helpful in the prevention and treatment of HIV/AIDS are willing to do VCT because he
believes that it can detect HIV earlier (through HIV test). VCT is able to provide the treatment
access and supports for HIV/AIDS patients.
Supports from Their Pimps
Female sex workers whose pimps less support the practice of condom use have a bigger
proportion not to always use condom while having a sexual intercourse. Otherwise, those whose
pimps support the practice of condom use have a bigger proportion to always use condom
comparing with respondents whose pimps do not support it.
The result of chi square test shows that there is a significant relation between their pimps‘
supports and the practice of condom use among female sex workers/their customers. This is
indicated by p value <0,05. This research result is appropriate with Lawrence Green theory which
states that one of reinforcing factors for someone to do a certain behavior is when the person gets
positive supports from influential people. From this research, it is known that a pimp has a very
important role in supporting the achievemennt of the practice of 100% condom use program. An
example of realizations of the pimp‘s role is the availability of condoms so that female sex workers
are easy to access it. If possible, condoms are provided freely by the pimps of each house.
Closing
Based on the analysis of research results above, it can be concluded that: (1) The practice of
condom use among female sex workers or their costumers in Banyuputih localization is still low;
that is 19,7% (it means that 19,7% of female sex workers in Banyuputih localization always use
condom in all sexual activities with their customers); (2) Factors that influence the practice of
condom use in Banyuputih localization are perception of susceptibility of being infected by
HIV/AIDS, perception of seriousness when having been already infected by STIs and HIV/AIDS,
perception towards the benefits of condom use and supports from their pimps.
Based on these research results, suggestion that can be presented is that it is important to
conduct a research as a follow up to this previous research as well as to examine the
effectiveness of applied models especially in changing domain factors of the behavior of the use of
condom especially in the group of female sex workers in localization.
References
Amri, A.B. 70% terinfeksi penyakit kelamin dan 3 orang HIV. http://dunia.vivanews.com/, diakses
tanggal 19 Desember 2011.
Bertens, MGB, Wolfers, MEG; van den Borne B, & Schaalma H.P. 2008. Negotiating safe sex
among women of Afro-Surinamese and Dutch Antillean descent in the Netherlands. AIDS
Care, Nov; 20 (10): 1211-16
Public Health Department, Faculty of Sports Science, F1 Building, 2nd
Floor, Sekaran Campus Gunungpati, Semarang City, Central Java Province, Indonesia, 50229 Phone/ Fax. +6224 8508007
335
Ditjen PP & PL Kemenkes RI. 2011. Statistik Kasus HIV/AIDS di Indonesia Tahun 2011. Jakarta :
Kemenkes RI.
Ditjen PP & PL Kemenkes RI. 2012. Statistik Kasus HIV/AIDS di Indonesia Tahun 2012. Jakarta :
Kemenkes RI.
Fiona E Greig, Cheryl Koopman. 2003. Multilevel analysis of women's empowerment and HIV
prevention: quantitative survey Results from a preliminary study in Botswana. Journal of
AIDS Behaviour. 2003. 7: 195–208.
Green, Lawrence, Mercer, Shawna L. Precede-Proceed Model. The Gale Group Inc., Macmillan
Reference USA, New York. Gale Encyclopedia of Public Health. 2002. available on:
http://www.healthline.com/ galecontent/ precede-proceed-model.
Green, Lawrence, Kreuter, Marshal W. Health Promotion Planning, an Educational and
Environmental Approac. Mountain View. Mayfield Publishing Company, 2nd Edition. 1991.
Greig, F., & Koopman, C. 2003. Multilevel analysis of women’s empowerment and HIV prevention:
Quantitative survey results from a preliminary study in Botswana. AIDS Behaviour, 7, 195–
208.
Jones, Gavin. W, Sulistyaningsih, Endang and Hull, Terence. D. 1995. Prostitution in Indonesia,
Working Papers in Demography 1995. Canberra. The Australian National University.
Kate Shannon; Joanne Csete. 2010. Violence, Condom Negotiation, and HIV/STI Risk Among Sex
Workers. JAMA: The Journal of American Medical Asotiation, 2010;304(5): 573-574).
KPA Batang. Kondisi HIV/AIDS di Kabupaten Batang tahun 2012. Batang : KPA Kabupaten
Batang.
KPA Jateng. 2010. Kondisi HIV/AIDS di Jawa Tengah 1993 s.d 31 Desember 2010. Semarang:
KPA Jateng.
KPAN. 2007. Rencana Aksi Nasional Penanggulangan HIV/AIDS di Indonesia 2007 – 2010.
Jakarta. KPAN.
KPAN. 2010. Rencana Aksi Nasional Penanggulangan HIV/AIDS di Indonesia 2010 – 2014.
Jakarta. KPAN.
KPAN. 2011. Survei Terpadu Biologis dan Perilaku Tahun 2011. Jakarta. KPAN.
Lianne A. Urada; Donald E. Morisky; Nymia Pimentel Simbulan; Jay G. Silverman; Steffanie A.S.
2012. Condom Negotiations among Female Sex Workers in the Philippines: Environmental
Influences. PloS ONE, www.plosone.org March 2012,Volume 7,Issue 3.
Popoola, B.I. 2009. Sex-negotiation strategies and safer-sex practices ammarried women in
South-Western Nigeria. Nigeria, Educatio Foundations & Counselling, Faculty of Education,
Obafemi Awol University, Vol. 24, Nos. 3–4, August–November 2009, 261–270
Prasetyo, F.A. 2006. Proses negosiasi antara pekerja seks komersial den pelanggan dalam
pemakaian kondom untuk mencegah penularan HIV/AIDS: Studi kasus di lokalisasi Boker
Ciracas Jakarta. Tesis. Tidak dipublikasikan.
Rosenstock. 1982. Historical Origins of the Health Belief Model. In : Becker, Marshall H. Eds. The
Health Belief Model and Personal Health Behavior. Charles B. Slack Inc, Thorofare, New
Jersey.
Tran Thi Tuyet Mai, Le Cu Linh and Nguyen Thanh L. 2008. Factors Associated With Inconsistent
Condom Use Among Female Sex Workers in Nha Trang, Vietnam. Asia Pac J Public Health,
October 2008 vol. 20 no. 4: 370-378
UNAIDS. 2004. Making condoms work for HIV prevention. UNAIDS/04.32E (English original, June
2004)

336
Public Health Department, Faculty of Sports Science, F1 Building, 2nd
Floor, Sekaran Campus Gunungpati, Semarang City, Central Java Province, Indonesia, 50229 Phone/ Fax. +6224 8508007
Public Health Department, Faculty of Sports Science, F1 Building, 2nd
Floor, Sekaran Campus Gunungpati, Semarang City, Central Java Province, Indonesia, 50229 Phone/ Fax. +6224 8508007
337
ENSURE ENVIRONMENTAL SUSTAINABILITY AND HEALTH IN PUBLIC DEVELOPMENT
PAPERS

338
Public Health Department, Faculty of Sports Science, F1 Building, 2nd
Floor, Sekaran Campus Gunungpati, Semarang City, Central Java Province, Indonesia, 50229 Phone/ Fax. +6224 8508007
Public Health Department, Faculty of Sports Science, F1 Building, 2nd
Floor, Sekaran Campus Gunungpati, Semarang City, Central Java Province, Indonesia, 50229 Phone/ Fax. +6224 8508007
339
CHOLINESTRASE LEVEL AND LIVER DYSFUNCTION ON CHILDBEARING-AGE WOMEN IN FARMING AREA
Arum Siwiendrayanti
Semarang State University, Indonesia
Corresponding Author: [email protected]
Abstract Intriduction: Women in Kersana Sub-district, Brebes Regency, were involved in farming activities using pesticides. Long term of pesticides exposure was able to cause many kinds of health disorder, including liver disfunction. Liver disfunction on women in childbearing-age could make bad impacts to their health, including their reproductive health. Former research indicated that liver disfunction came as a result of pesticides exposure. Health Profiles of Brebes Regency in 2007 and 2008 recorded increasing rate of liver disfunction. Methods: This study aimed to analyze the assossiation between pesticides poisoning (which was
determined with cholinesterase level) and liver disfunction on women in childbearing-age at Kersana Sub-district, Brebes Regency. This was an explanatory research with cross sectional approach. This research took sample of 86 childbearing-age women from four villages which were chosen purposively. Questionare, blood sampling tool and laboratory testing tool were used as instruments. Data were collected with laboratory testing to blood samples and interviewing childbearing-age women. Results: All childbearing-age women had normal cholinesterase enzyme level, but 50% of them had cholinesterase enzyme below mean level. Occurence of childbearing-age women to have liver disfunction was 23,3%. There was no assossiation between cholinestrase enzyme level and liver disfunction on women in childbearing-age (p=0.799). Key Words: Women in childbearing-age, pesticides exposure, cholinestrase enzyme level, liver
disfunction Introduction
Kersana Sub-district has a high level of pesticides use as a result of its extent of agricultural
area and its high agriculture productivity, especially onions (Brebes Regional Profile 2002-2006).
The use of pesticides in this area was generally applied by mixing 3-5 kinds of organophosphate
and carbamate pesticides, with the frequency of spraying almost every day, especially during the
rainy season.
Farming activities using pesticides in Kersana Sub-district were done not only by men.
Women in Kersana Sub-district also get involved in such activities, generally as farm labors or only
for helping their husband. It allowed them to be exposed to pesticides.
Mostly pesticides used in Kersana Sub-district were organophosphate and carbamate which
would lead to inactivity of the cholinesterase enzyme, a needed enzyme in the neurotransmitter
systems in humans, vertebrates and insects (Ganong, 2008). Pesticides could be absorbed into
the body through the digestive tract, respiratory tract, and skin. Pesticides exposure in long period
would cause damage to body organs such as liver, kidneys, lungs, etc. (Lu, 1995)
Liver is one of the target organs of pesticides. Some liver function were the central of
metabolism, producing bile, producing heparin, producing plasma proteins, clearing bilirubin from
340
Public Health Department, Faculty of Sports Science, F1 Building, 2nd
Floor, Sekaran Campus Gunungpati, Semarang City, Central Java Province, Indonesia, 50229 Phone/ Fax. +6224 8508007
the blood, detoxification centers, forming erythrocytes during fetal period, and others. Liver
disorders could disrupt vital functions of the liver in metabolism and detoxification. Liver disfunction
on women in childbearing-age could make bad impacts to their health, including their reproductive
health. It would make bad impacts not only to themselves but also to their fetus when they were
pregnant. Liver dysfunction would lead to disruption of food metabolism and detoxification in the
mother's body that would influence the amount of food substances that enter the fetal circulatory
system. (Irianto, 2004)
Aspartate aminotransferase (AST) or serum glutamic oxsaloasetic transaminase (SGOT),
Alanine aminotransferase (ALT) or serum glutamic pyruvic transaminase (SGPT), and alkaline
phosphatase (alkaline phosphatase / ALP) are several of liver enzymes. Their levels in the blood
were used as liver dysfunction markers. These enzymes are normally located in the liver cells.
Liver damage would cause the liver enzymes released into the bloodstream so that the level in the
blood increased and indicated liver dysfunction (Kosasih, 2008). The study of pesticide exposure
conducted in Pakistan showed levels of AST (SGOT), ALT (SGPT), and ALP were higher in the
group of exposed workers to pesticides than the non-exposed group, whereas cholinesterase
levels in the group of exposed workers to pesticides showed a lower rate than the non-exposed
group (Bhalli, 2006).
Based on The Health Profile of Brebes Regency, at the hospital level, recorded 218 cases of
liver dysfunction in Brebes Regency in 2007, and increased to 358 cases in 2008. Exposure to
toxic materials such as pesticides in long period or chronic liver dysfunction may increase the risk
of liver cirrhosis (Litin, 2009; Chauhan, 2006). There were 16 inpatient cases of liver cirrhosis in the
age group of 45-64 year in hospitals located in the Brebes Regency in 2007 (Brebes Health Profile,
2008). This rate increased to 44 cases in 2008 for the same age group (Brebes Health Profile,
2009). Exposure to toxic materials such as pesticides in long period also can increase the risk of
cancer, including liver cancer (Litin, 2009; Budiawan, 2000). In hospitals located in Brebes
Regency, there were 19 cases of liver cancer in in 2007 and it increased to 46 cases in 2008
(Brebes Health Profile, 2008; Brebes Health Profile, 2009).
Considering disorders and advanced diseases that could occur, the incidence of liver
dysfunction could be used as an indication to start controling before becoming the other more fatal
biological effects, either acute or chronic. This study aimed to analyze the association between
pesticides poisoning (which was determined with cholinesterase enzyme level) and liver
disfunction on women in childbearing-age at Kersana Sub-district, Brebes Regency.
Methods
This was a cross sectional analytic research (Notoatmodjo, 2005). The population in this
study was all childbearing-age women aged 17-35 years old residing in Kersana Sub District. 86
childbearing-age women from 4 villages were taken as the sample in this study. The villages were
chosen based on their level of farm productivity. The villages were Kupangpari Village, Sutamaja
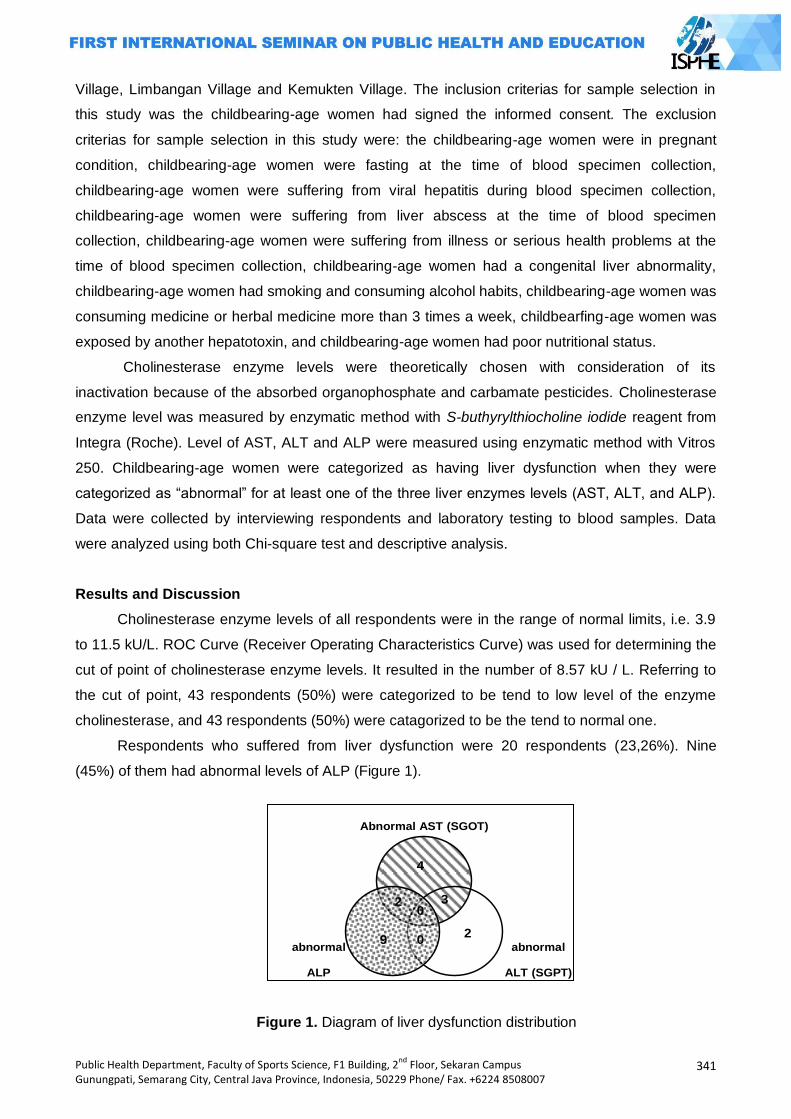
Public Health Department, Faculty of Sports Science, F1 Building, 2nd
Floor, Sekaran Campus Gunungpati, Semarang City, Central Java Province, Indonesia, 50229 Phone/ Fax. +6224 8508007
341
Village, Limbangan Village and Kemukten Village. The inclusion criterias for sample selection in
this study was the childbearing-age women had signed the informed consent. The exclusion
criterias for sample selection in this study were: the childbearing-age women were in pregnant
condition, childbearing-age women were fasting at the time of blood specimen collection,
childbearing-age women were suffering from viral hepatitis during blood specimen collection,
childbearing-age women were suffering from liver abscess at the time of blood specimen
collection, childbearing-age women were suffering from illness or serious health problems at the
time of blood specimen collection, childbearing-age women had a congenital liver abnormality,
childbearing-age women had smoking and consuming alcohol habits, childbearing-age women was
consuming medicine or herbal medicine more than 3 times a week, childbearfing-age women was
exposed by another hepatotoxin, and childbearing-age women had poor nutritional status.
Cholinesterase enzyme levels were theoretically chosen with consideration of its
inactivation because of the absorbed organophosphate and carbamate pesticides. Cholinesterase
enzyme level was measured by enzymatic method with S-buthyrylthiocholine iodide reagent from
Integra (Roche). Level of AST, ALT and ALP were measured using enzymatic method with Vitros
250. Childbearing-age women were categorized as having liver dysfunction when they were
categorized as ―abnormal‖ for at least one of the three liver enzymes levels (AST, ALT, and ALP).
Data were collected by interviewing respondents and laboratory testing to blood samples. Data
were analyzed using both Chi-square test and descriptive analysis.
Results and Discussion
Cholinesterase enzyme levels of all respondents were in the range of normal limits, i.e. 3.9
to 11.5 kU/L. ROC Curve (Receiver Operating Characteristics Curve) was used for determining the
cut of point of cholinesterase enzyme levels. It resulted in the number of 8.57 kU / L. Referring to
the cut of point, 43 respondents (50%) were categorized to be tend to low level of the enzyme
cholinesterase, and 43 respondents (50%) were catagorized to be the tend to normal one.
Respondents who suffered from liver dysfunction were 20 respondents (23,26%). Nine
(45%) of them had abnormal levels of ALP (Figure 1).
abnormal
ALP
Abnormal AST (SGOT)
4
0
0
3
2
2
9 abnormal
ALT (SGPT)
Figure 1. Diagram of liver dysfunction distribution
342
Public Health Department, Faculty of Sports Science, F1 Building, 2nd
Floor, Sekaran Campus Gunungpati, Semarang City, Central Java Province, Indonesia, 50229 Phone/ Fax. +6224 8508007
There was no association between cholinesterase level with liver dysfunction on
childbearing-age women in Kersana Sub-district, Brebes Regency (p=0.799) with Chi-square test
(Table 1).
Table 1. Association between cholinesterase level with liver dysfunction
Cholinesterase level
Liver dysfunction
p RP CI 95% Yes
(n=20) No
(n=66)
N % n %
Tend to low (n = 43)
9 20.9 34 79.1 0.799*) 0.818 0.378-1.772
Tend to normal (n = 43)
11
25.6 32 74.4
Bivariate analysis showed that no significant relationship between cholinesterase level
(pesticide poisoning) with liver dysfunction on childbearing-age women in Kersana Brebes (p =
0.799). Assumptions that can be made is that pesticide exposure experienced by the childbearing-
age women had not reached a dose that may lead to the occurrence of pesticide poisoning and
liver dysfunction. While the liver has a remarkable ability to regenerate than other organs (Price, et
al, 2006). The exact dose of pesticides exposure in humans which might result in liver dysfunction
was difficult to determine. The former experimental studies about the dose of pesticides exposure
were only done to animals and usually with a sub lethal dose.
The mean of AST (SGOT) level on respondents both in tend to low and tend to normal
cholinesterase goups, were still within the normal levels. The mean of AST (SGOT) level on tent to
low cholinesterase group was actually slightly lower than the mean of AST (SGOT) level on tend to
normal cholinesterase group. However, when these were done without decimals, would result in a
same number that is 26 U / L. Suleiman Ambali (2007) in his study conducted experiment of oral
exposure to chlorpyrifos 21.33 mg / kg (equivalent to 1/5 LD50) 3 times a week in both male and
female mice for 10 weeks, but what actually happened was that AST (SGOT) level become lower
than the control group. Ambali also cited research of Benard Lloyd (1990) regarding oral exposure
to chlorpyrifos in rats for 10 weeks that the result was similar to his research result. Ambali
suggested that the explanation of why it could happen was unknown because of the lack of
toxicological data on this (Ambali, et al, 2007). Research on pesticide dose that significantly raise
the level of AST (SGOT) include: (1) Research of El-Banna (2009) by performing oral chlorpyrifos
exposure of 5.4 mg / kg in male rats for 15 days (El Banna, et al, 2009), (2) Research of Krishna
(2009) by oral exposure to chlorpyrifos 50 mg / kg in rats for 14 days (Krishna, et al, 2006), (3)
Research of Eissa (2009) by performing oral exposure Abamectin 1.81 mg / kg in male albino rats
for 24 hours (Eissa, et al, 2009), (4) Research of Sakr (2007) by oral exposure to Mancozeb 313.6
mg / kg in male albino rats for 28 days (Sakr, 2007) , and (5) Research of Dahamna and his team
(2010) Cypermethrin exposure by 1/10 LD50 in rabbits Oryctolagus cuniculus, blood samples were
examined 72 hours after treatment (Dahamna, et al, 2010).
Public Health Department, Faculty of Sports Science, F1 Building, 2nd
Floor, Sekaran Campus Gunungpati, Semarang City, Central Java Province, Indonesia, 50229 Phone/ Fax. +6224 8508007
343
The mean of alanine aminotransferase (ALT) level on both tend to low and tend to normal
cholinesterase groups, were still within the normal level. The mean of alanine aminotransferase
(ALT) level on tend to low cholinesterase group was higher than the tend to normal one. Sakr
(2007) conducted a study to perform oral exposure Mancozeb 313.6 mg / kg in male albino rats for
14 days showed that the increasing of alanine aminotransferase (ALT) level was not significant
when compared to the control group. Although the increasing levels of ALT (SGPT) was not
significant but histological examinations showed abnormalities on the structure of the liver lobules
and cell structure. Central venous and portal venous obstruction seemed to experience. A
significant increasing ALT (SGPT) level recent started on 28th day and histological examination
showed the presence of more severe damage (Sakr, 2007). Other studies on pesticide dose that
significantly raise the level of alanine aminotransferase (ALT) were (1) Research of El-Banna
(2009) by performing oral chlorpyrifos exposure of 5.4 mg / kg in male rats for 15 days, (2)
Research of Krishna (2009) by oral exposure to chlorpyrifos 50 mg / kg in rats for 14 days, and (3)
Research of Dahamna and his team (2010) Cypermethrin exposure by 1/10 LD50 in rabbits
Oryctolagus cuniculus, blood samples were examined 72 hours after treatment.
The mean of ALP levels of respondents both in tend to low cholinesterase group and tend
to normal cholinesterase group, were still within the normal levels. The tend to low cholinesterase
group had lower ALP levels than the tend to normal cholinesterase group. Eissa (2009) conducted
a study to perform oral exposure Abamectin 1.81 mg / kg in male albino rats for 24 hours and the
results showed that there was no significant difference in ALP levels between the experimental
groups and the control group, but the histological examination of liver tissue with a
photomicrograph of cells showed that abnormal condition has occurred (Eissa, 2009). Ojezele
research (2007) by performing oral chlorpyrifos exposure to 3.5 mg / kg in chicks (4-6 weeks of
age) for 15 days indicated that there was a significant decrease in ALP levels that could be due to
the emphasis on liver ALP production phase indicates initial damage before it is forwarded to the
occurrence of cell death and leakage of this enzyme in the blood stream (Ojezele, et al, 2007).
Other studies on pesticide dose that significantly increase ALP levels were (1) the study of El-
Banna (2009) by performing oral chlorpyrifos exposure of 5.4 mg / kg in male rats for 15 days, (2)
research of Ambali (2007) by oral chlorpyrifos exposure experiments 21.33 mg / kg (equivalent to
1/5 LD50) 3 times a week in both male and female mice for 10 weeks, (3) the study of Krishna
(2009) by oral exposure to chlorpyrifos 50 mg / kg in rats for 14 days, and (4) Research of
Dahamna and his team (2010) Cypermethrin exposure by 1/10 LD50 in rabbits Oryctolagus
cuniculus, blood samples were examined 72 hours after treatment (Dahamna, 2010).
Table 1 showed that 11 of 20 respondents with liver dysfunction (55%) were belonged to
tend to normal cholinesterase group. There were some assumptions to explain this.
The first assumption, the liver dysfunction maight not caused by pesticide exposure. It was
concluded by the result of the bivariate analysis that showed no association between
344
Public Health Department, Faculty of Sports Science, F1 Building, 2nd
Floor, Sekaran Campus Gunungpati, Semarang City, Central Java Province, Indonesia, 50229 Phone/ Fax. +6224 8508007
cholinesterase level and liver dysfunction (p = 0.799). Liver dysfunction on the repondents maight
be caused by the other factors.
The second assumption, the chemical interaction between pesticides with protective
chemicals. Research on herbal ingredients that had protective effect against liver cell damage
caused by pesticides were: (1) research of Sakr (2007) by giving extract of ginger (Zingiber
officinale) of 120 mg / kg in albino rat liver cells to help repair damage caused by exposure to oral
Mancozeb, (2) the study of El-Banna (2009) to provide 90 mg of garlic extract / kg in male rats to
help repair increasing levels of liver enzymes in the blood as a result of oral chlorpyrifos exposure,
and (3) research of Ambali (2007) to provide 100 mg of vitamin C / kg in mice to help repair the
ALP levels which were increased as a result of oral exposure to chlorpyrifos. Ginger, garlic and
vitamin C are materials that can be easily consumed by the public. Ginger is commonly used to
keep body warm, garlic is used for seasoning in cooking, and vitamin C is contained in many fruits
and vegetables.
The third assumption, there had been tissue abnormalities in liver cells but not detected by
measuring the levels of AST (SGOT), ALT (SGPT), and ALT. This assumption is based on
research results of Sakr (2007) and Eissa (2009) which had not been an increase in the levels of
liver enzymes in the blood but histological examination has shown the occurrence of damage /
abnormality in liver cell tissue. Sulaiman (2007) stated that in mild liver damage would be found
elevating liver enzymes levels, but in necrosis level which the synthesis of the liver enzyme had
been disturbed, would not be found elevating liver enzymes levels. While Ojezele (2009) stated
that no increasing of liver enzymes levels in blood could be due to suppression of their production
in the liver which marked the initial phase of the damage before proceeding with the occurrence of
cell death and leakage.
This study had some limitations. Determination of liver dysfunction was based only on the
levels of AST (SGOT), ALT (SGPT), and ALP. Measurement of the three levels of liver enzymes
was only done once cross-sectionally, while the condition of liver function before exposure to
pesticides was unknown. This made the causal relationship was less strongly enforced
(Sastroasmoro, 2008).
Closing
All childbearing-age women had normal cholinesterase enzyme level, but 50% of them
had cholinesterase enzyme below mean level. Occurence of childbearing-age women to have liver
disfunction was 23,3%. There was no assossiation between cholinestrase enzyme level and liver
disfunction on women in childbearing-age.
Childbearing age women in Kersana Sub District belong to at risk group of pesticide
exposure. Thus recommended to equip themselves with PPE and periodically take a break from
farming activities so that the liver will have a chance to detoxify pesticides in the body. Preventive
efforts is needed to be done to protect both women involved in farming activities and not.
Public Health Department, Faculty of Sports Science, F1 Building, 2nd
Floor, Sekaran Campus Gunungpati, Semarang City, Central Java Province, Indonesia, 50229 Phone/ Fax. +6224 8508007
345
Counseling about the danger of pesticides, safe pesticide use practices, the importance of cleaning
themselves after doing farming activities to remove pesticide residues, the importance of using
PPE, and tips to avoid exposure to pesticides should be a concern. Monitoring of environmental
components quality associated with pesticides residues should also be a concern. These are
recomendation for Health Centers, Local Government, Environmental Impact Assessment
Regional Institution, and Regional Health Department. Further researcher could study the same
problem by using different research designs. Association between intensity of pesticides exposure
and liver dysfunction could be done, either through observational and experimental studies.
Method of determining the incidence of liver dysfunction could be done with a more complete
examination.
References
Achmadi, Umar Fahmi, et al (editors). 1991. Upaya Kesehatan Kerja Sektor Informal di Indonesia. Jakarta: Health Ministry of Indonesia
Ambali, Suleiman; Dayo Akanbi; Noble Igbokwe; Muftau Shittu; M. Kawu; dan Joseph Ayo. 2007. ―Evaluation of subchronic chlorpyrifos poisoning on hematological and serum biochemical changes in mice and protective effect of vitamin C‖ dalam The Journal of Toxicological Sciences, Vol. 32, No.2, 111-120, 2007
Bhalli, Javed A.; Q.M.Khan; M.A.Haq; A.M.Khalid; dan A.Nasim. 2006. ―Cytogenetic analysis of Pakistani individuals occupationally exposed to pesticides in a pesticide production industry‖ in Mutagenesis vol. 21 no. 2 pp. 143–148, 2006. Advance Access Publication 15 March 2006
Brebes Health Profile 2007 Brebes Health Profile 2008 Brebes Regional Profile 2002-2006 Budiawan. 2000. ‖Pengembangan Teknik 32P-Postlabelling untuk Mendeteksi Dini Risiko Kanker‖
in Risalah Pertemuan Ilmiah Penelitian dan Pengembangan Teknologi Isotop dan Radiasi, 2000
Chauhan, R. S. dan Lokesh Singhal. 2006. ”Harmful Effect of Pesticides and Their Control through Cowpathy” in International Journal of Cow Science, 2(1): 61-70
Dahamna, S.; D. Harzallah, S. Boussahel, A. Belgat dan H. Bouriche. 2010. ―Biochemical, hematological and histological parameters induced by cypermethrin toxicity in domestic rabbits‖ in Abstracts 62nd International Symposium on Crop Protection, Gent, Belgium, May 18, 2010
Dahlan, M. Sopiyudin. 2009. Seri Evidence Based Medicine 5, Penelitian Diagnostik, Dasar-Dasar Teoritis dan Aplikasi dengan Program SPSS dan Strata. Jakarta: Salemba Medika
Eissa, F.I. dan N.A. Zidan. 2009. ―Haematological, biochemical and histopathological alterations induced by Abamectin and Bacillus thuringiensis in male albino rats‖ in Autralian Journal of Basic and Applied Sciences, 3(3): 2497-2505, 2009
El-Banna, Sabah G.; Ahmed M. Attia; Afaf M. Hafez; Sara M. El-Kazaz. 2009. ―Effect of garlic consumption on blood lipid and oxidant/antioxidant parameters in rat males exposed to chlorpyrifos‖ in Slovak Journal Animal Sciences, 42, 2009 (3), 111-117
Ganong, William F. 2008. Buku Ajar Fisiologi Kedokteran, 22nd edition. Translator: Brahm U Pendit. Jakarta: EGC
Health Ministry of Indonesia. 2005. Bahan-Bahan Berbahaya dan Dampaknya terhadap Kesehatan Manusia (2nd book). Jakarta: Depkes RI
Irianto, Kus. 2004. Struktur dan Fungsi Tubuh Manusia untuk Paramedis. Bandung: CV. Yrama Widya
Kosasih, E.N. dan A.S. Kosasih. 2008. Tafsiran Hasil Pemeriksaan Laboratorium Klinik. Second
edition. Jakarta: KARISMA Publishing Group
346
Public Health Department, Faculty of Sports Science, F1 Building, 2nd
Floor, Sekaran Campus Gunungpati, Semarang City, Central Java Province, Indonesia, 50229 Phone/ Fax. +6224 8508007
Krishna, H. Dan AV Ramachandran. 2009. ―Biochemical alterations induced by the acute exposure to combination of chlorpyrifos and lead in Wistar rats‖ in Toxeminar-1, Biology and
Medicine, Vol. 1 (2): 1-6, Februari 2009 LaDou, Joseph (editor). 2004. Current Occupational & Environmental Medicine. San Francisco:
McGraw-Hill Companies, Inc. Litin, Scott C. 2009. Mayo Clinic Family Health Book-Panduan Kesehatan Keluarga, 5th edition.
Jakarta: PT Intisari Mediatama Lu, Frank C. 1995. Toksikologi Dasar. Translator: Edi Nugroho. Jakarta: Indonesia University
Press Notoatmodjo, Soekidjo. 2005. Metodologi Penelitian Kesehatan. Jakarta: Rineka Cipta Ojezele, Matthew Obaineh dan Oluwole Matthew Abatan. 2009. ―Toxicological effect of
chlorphyrifos and methidathion in young chickens‖ in African Journal of Biochemistry Research Vol.3 (3), pp.048-051, Maret 2009
Price, Sylvia A. dan Lorraine M. Wilson. 2006. Translator: Brahm U. Pendit, Huriawati Hartanto, Pita Wulansari, Dewi Asih Maharani. Patofisiologi, Konsep Klinis Proses-Proses Penyakit. 6th edition, Volume 2. Jakarta: EGC
Sakr, Saber A.. 2007. ―Ameliorative effect of ginger (Zingiber officinale) on mancozeb fungicide induced liver injury in albino rats‖ in Australian Journal of Basic and Applied Science, 1(4):
650-656, 2007 Sastroasmoro, Sudigdo and Sofyan Ismael. 2008. Dasar-dasar Metodologi Penelitian Klinis, Third
edition. Jakarta: CV. Sagung Seto Sharma, BR and Sarmadi Bano. 2009. ―Human acetyl cholinesterase inhibition by pesticide
exposure‖ in Journal of Chinese Clinical Medicine Volume 4, Number 1, January 2009 Slamet, Juli Soemirat (editor). 2003. Toksikologi Lingkungan. Yogyakarta: Gadjahmada University
Press Sulaiman, Ali.; Nurul Akbar; Laurentius A. Lesmana; M. Sjaifoellah Noer (editor). 2007. Buku Ajar
Ilmu Penyakit Hati, First edition. Jakarta: Jayabadi
Public Health Department, Faculty of Sports Science, F1 Building, 2nd
Floor, Sekaran Campus Gunungpati, Semarang City, Central Java Province, Indonesia, 50229 Phone/ Fax. +6224 8508007
347
SUFFICIENCY ANALYSIS OF EVACUATION FACILITIES IN H BUILDING SEMARANG STATE
UNIVERSITY
Evi Widowati
Semarang State University, Indonesia
Corresponding Author: [email protected]
Abstract
Introduction: In the Law No. 1 of 1970 Chapter III Article 3 has been set on safety requirements,
such as reduce and extinguish fires, prevent and reduce the danger of explosions, as well as
provide an opportunity or a way to save themselves during of fire or other dangerous incidents.
The research focuses on sufficiency comparative analysis between the evacuation aspects such
as: evacuation procedures, evacuation routes, evacuation maps, assembling points, exit directions,
emergency stairs, emergency doors, emergency lighting and emergency communication
equipment, evacuation drill, and evacuation team with the existing standards.
Methods: This type of research is descriptive qualitative research, techniques of data collection
through direct observation and interviews.
Results: The results of this research note that the H building is a four-storey building and has the
risk of life-saving during an emergency event, but has not yet had a evacuation procedures,
evacuation teams, and has not yet conducted evacuation drills, and have minimum evacuation
facilities. Advice given in this study is the building H should meet all aspects of Occupational
Health and Safety (OHS) that exist, especially in the evacuation aspects in accordance with the
rules and standards, especially: establish evacuation procedures, evacuation routes, evacuation
maps and evacuation team. Moreover determine assembling points and exit directions, provide the
emergency stairs, emergency doors, emergency lighting and emergency communication
equipment, furthermore conduct evacuation drill regularly.
Key Words : Evacuation, facilities, sufficiency
Introduction
In Law No. 1 Year 1970 Chapter III Section 3 has been set on safety requirements that
prevent, reduce and extinguish fire, prevent and reduce the danger of explosion, as well as
providing the opportunity or the time to escape the fire or other events are dangerous. The
selection of the background of this research because there are many workers in the H building,
visitors, and the work place of leaders or decision-makers at the Semarang State University,
moreover that building is often used as a meeting room, and have a high risk of accidents, and
workers in that building has a fixed working hours at 07.00 am to 16.00 pm, and based on initial
observations H building has minimal evacuation facilities.
The H building is a four-storey building and has the risk of life-saving during an emergency
event. For storey building the evacuation process is very important to life-saving when the disaser
occur like: fire, earthquake, hurricane, etc. For the example evacuation has been identified as a
key concern when a supertall building is under fire. Stairs alone are inadequate at any significant
348
Public Health Department, Faculty of Sports Science, F1 Building, 2nd
Floor, Sekaran Campus Gunungpati, Semarang City, Central Java Province, Indonesia, 50229 Phone/ Fax. +6224 8508007
height. Lifts are not yet designed to be used by most of the occupants in fire. Evacuation has been
identified as a key concern when a supertall building is under fire. It takes a long time for all
occupants to leave the building due to whatever reasons. Selective evacuation in high-rise
buildings has become an accepted practice. A phased-evacuation or the ―stay-inplace‖ approach
appears in the fire safety management plan of many supertall buildings.
Based on his background the researcher intends to take H building as a research object
because if an emergency occurs all the residents and visitors in the building can be saved well.
Based on this background, the problem can be formulated in this study is: "How is the sufficiency
of existing evacuation facilities in the H building on Semarang State University so they can be
improved so as to save people when the disaster occur?"
Theoretical basis
The definition of work place is room or field, closed or open, fixed or mobile workforce
which works, or who often entered the workforce for the purposes of a business and where there is
a potential sources of danger. The definition of evacuation is the process of as part of the First Aid
at a disaster in the work place, is expected to minimize the losses for workers as well as for
humans. Evacuation is the rescue of the human soul from one room or building to another safer
during an emergency. Evacuation facilities include: gathering place, bells, telephones, alarms, fire
doors, emergency exits, emergency stairs, pointing towards the exit, and exit roads.
Research Objectives
Do comparative sufficiency analysis of evacuation facilities in H building on Semarang
State University in existing current condition with the standards.
Make recommendations to create a comprehensive evacuation system in H building at Semarang
State University.
Benefits of Research
Provide the recommendations in the H building evacuation system, besides that it also can
enrich science of Occupational Health and Safety (OHS) especially at Semarang State University.
Methods
The study design used in this research is descriptive qualitative research. Data collection
techniques include primary data collection is direct and visible observation checklists, and
interviews. Method of data analysis in this study is by comparing the existing evacuation facilities
with standards. Evacuation facilities referred to in this research include: evacuation procedures,
evacuation routes, evacuation assembly points, pointing toward the exit, emergency stairs,
emergency exits, emergency lighting, emergency communications equipment, evacuation drills,
and evacuation team. And the standards used are: UU No. 1 tahun 1970, Kepmenaker No. KEP.
186/MEN/1999, Permenaker No. PER. 04/MEN/1980, Ins Menaker 11/M/BW/1997, Guidelines for
training fire-fighting material from labor offices, Kepmenaker No. 187/MEN/1999.
Public Health Department, Faculty of Sports Science, F1 Building, 2nd
Floor, Sekaran Campus Gunungpati, Semarang City, Central Java Province, Indonesia, 50229 Phone/ Fax. +6224 8508007
349
Results and Discussion
The results of this research is:
General state of the building
Ideal criteria for a building, among others; means a way out of a building must be free of all
obstacles, the space is not used as a warehouse stairs and corridors are not used as a place to
store goods (minimum corridor width is 1.2 meters net), and the floor was not perforated. However,
the condition of the building H there is a perforated floor stairs due to partial loss of the ceramic
floor, exit area is not wide and clean enough beside that the space are used to store many goods.
This condition is very risky to the life-saving efforts of occupants when a disaster occurs in that
building.
Evacuation procedures
H building has had not evacuation procedures yet, this building should not only required to
have a plan or evacuation maps and evacuation procedures which provide with the right, clear,
concise, and simple language so as to can be implemented and does not cause doubts in the act.
Evacuation prosedures is one aspect of emergency response planning. Emergency response
planning must include effective management of transportation resources, including public transit
services. Failure to do this often leads to significant problems and risks, resulting in huge costs to
society. So managers must recognize that emergency response falls within their mandate and
must work closely with emergency management planners.
Evacuation facilities
In H building has had not the evacuation facilities yet which meet the standards, such as:
evacuation routes, evacuation assembly points, pointing toward the exit, emergency exits,
emergency lighting and emergency communication tools. But in H building has already provided
the assembling point which can be used as a gathering place adequately even though it has not
been determined to be place for the fix assembling point yet. The recommendation for assembling
points is determine the clearly assembling points more than one location (ideal 2 point) as
gathering place so it can use the safest alternative options in the event of a disaster and provide
the route clearly to reach there.
Evacuation drills
Evacuation drills have not been conducted yet in the H building. The standard said that the
building has four floors like H building should conduct the evacuation drills as much as 6 to 8 times
per year.
Evacuation team
In H building has not established the evacuation team yeat, should the four-storey building
as H building is required to establish the evacuation team and get the evacuation training
adequately, at least around the security team must be given the additional task as evacuation team
350
Public Health Department, Faculty of Sports Science, F1 Building, 2nd
Floor, Sekaran Campus Gunungpati, Semarang City, Central Java Province, Indonesia, 50229 Phone/ Fax. +6224 8508007
with a clear organizational structure, duties and functions. According to the research of Gwynne
and Galea to perfectly assess the potential evacuation efficiency of a building or an enclosure, it is
necessary to consider four aspects, which are configuration, environment, behavior and
procedures. Configuration consideration involves building layout, number of exits, exit width, travel
distance etc. Environmental aspect needs to consider the debilitating effects on the occupants of
heat, toxic and irritant gases and the influence of smoke density on person‘s travel speeds and
way finding abilities. Procedural aspect includes level of occupant evacuation training, staff action
in an emergency, occupant‘s familiarity of the building. Behavioral aspect covers occupant‘s initial
responses in an emergency and their movement in the building.
Beside that risk area and action by public officials are the most important variables affecting public
response. When public officials are aggressive in issuing evacuation notices and disseminate the
messages effectively, over 90 percent of the residens of higgh-risk barrier evacuate. Because of
that evacuation procedures, evacuation facilities, evacuation drill and evacuation team must be
established and implemented on H building in order to save all the residences especially when the
disaster occur.
Closing
H building has not had evacuation procedures yet, moreover it has had not the evacuation
facilities yet which meet the standards, such as: evacuation routes, emergency stairs, evacuation
maps, emergency doors, pointing toward the exit, emergency exits, emergency lighting and
emergency communication tools, eventhough in H building has already provided the assembling
point as minimal evacuation facilities. For personal capacity aspect, in H building has had not
established the sufficient evacuation team and they have never gotten the evacuation training and
drilling adequately yet. From this condition it can be concluded that H building is a very risky area
in the process of life-saving when the disaster occur, such as fires, earthquakes, and other
disasters.
To optimize the life-saving on the disaster, it is highly recommended to provide all the
evacuation facilities which are needed as the standard, such as: sets a clear assembling point,
complete the evacuation route, evacuation sign that is easily seen by users of the building as
pointing toward to exit, emergency exits, emergency lighting, emergency doors and emergency
communication tools. Moreover establish all aspects which are associated with the evacuation
process, among other things: make evacuation procedures, evacuation maps, formed a team
evacuation, do evacuation training and drilling regularly as standard.
References
Departemen Tenaga Kerja. 2003. Training Material K3 bidang Penanggulangan Kebakaran.
Malang.
Dinas Kebakaran Kota Semarang. 2004. Pengendalian terhadap bahaya kebakaran pada
bangunan gedung dan lingkungan, Penerbit Dinas Kebakaran Kota Semarang.
Public Health Department, Faculty of Sports Science, F1 Building, 2nd
Floor, Sekaran Campus Gunungpati, Semarang City, Central Java Province, Indonesia, 50229 Phone/ Fax. +6224 8508007
351
Earl J. Baker. 1991. Hurricane evacuation behavior. International journal of mass emergencies and
disasters. Vol. 9, No. 2, pp. 287-310.
Instruksi Menteri Tenaga Kerja 11/M/BW/1997, Guidelines for training fire-fighting material from
labor offices.
Istiarti VG. Tinuk. 2005. Materi Pelatihan Metodologi Penelitian Bidang Kesehatan (Teori dan
Praktek). Semarang: Bidang Penelitian Fakultas Kesehatan Masyarakat, Universitas
Diponegoro, Angkatan I.
Jusuf R.M.S. 2001. Evakuasi Medis. Majalah Hiperkes dan Keselamatan Kerja, edisi 34.
Keputusan Menteri Tenaga Kerja No. 187/MEN/1999.
Keputusan Menteri Tenaga Kerja No. KEP. 186/MEN/1999.
Michael a. schwartz and todd a. litman. January 2008. Evacuation station: the use of public
transportation in emergency management planning. Issues in ITE journal on the web.
Murti Bhisma. 2003. Prinsip dan Metode Riset Epidemiologi. Gadjah Mada University Press, Edisi
Kedua Jilid Pertama.
N. Cai and w.k. chow. 2011. Fire aspects on lift shafts used for evacuation in supertall buildings.
International journal on engineering performance-based fire codes, volume 10, number 3,
p.48-57.
Peraturan Menaker No. PER. 02/MEN/1983. Instalasi Alarm Kebakaran Otomatis.
Peraturan Menteri Tenaga Kerja No. PER. 04/MEN/1980.
Tzu-sheng shen and shen-wen chien. 2005. An Evacuation Simulation Model (ESM) for building
evaluation. International journal on architectural science, volume 6, number 1, p.15-30.
UU No. 1 tahun 1970.
352
Public Health Department, Faculty of Sports Science, F1 Building, 2nd
Floor, Sekaran Campus Gunungpati, Semarang City, Central Java Province, Indonesia, 50229 Phone/ Fax. +6224 8508007
WORKPLACE PRODUCTIVITY DIFFERENCES WITH DIFFERENT INTENSITY LIGHTING
Herry Koesyanto1, Yeni Pamela1, Martha Hertiningrum1
1Semarang State University, Indonesia
Corresponding Author: [email protected]
Abstract
Introduction: A job is typically done in environments or situations resulting workload.Factors that may affect the workload among others, the physical factors pencahayaan.Tujuan this study was to determine the result of productivity in the workplace with different illumination intensities. Methods: The subject of research workers in thesewingsection CV.Nabila Garment town of Pekalongan as many as 24 workers.Pretest-posttestdesign studycontrol group design and to determine the differences between experimental and control groups ttestTest. Results: Research results there are differences in labor productivity gains with an increase in the intensity of illumination on thesewingworkers with the result 0.001 <0.05.The level of productivity in
the experimental group with an average of 1.04 and the control group with an average productivity of 0.98.The conclusions of this research work is no difference in productivity with increasing intensity of illumination on workersewingthe CV.Nabila Garment Pekalongan.Suggestions for this research to corporate leaders are expected to always pay attention to the lighting of adequate intensity. Key Words: Intensity, lighting and workproductivity Introduction
Along with the increasing development of the industry and global changes in the field of
general development in the industry dunia.Revolusi not be separated from the social and cultural
revolution. The presence of the plant as one of the industry can not be denied anymore, because
the world population is increasing proportional to the increase in human needs.An increasing
number of these needs can no longer be met by traditional ways of production systems, therefore it
is necessary industrial system (Santoso, 2006).
According to the Central Bureau of Statistics Indonesia gament number of large-scale
industry and menengahpada in 2012 for a total of 2,545 companies with a total workforce totaled
478 205 workers.Locationgarmentindustry in Indonesia is concentrated in West Java by 57%, 14%
in Central Java, Jakarta, 17%, and 2% spread in East Java, Bali, Sumatra and
Yogyakarta. Concentrated number garment industry in Central Java in the amount of 388
companies in large and medium scale with the number of workers 66 948 workers.
Large and medium industries sector Pekalongan in the garment industry in 2012 for a total of
142 companies, concentrated in four districts with a percentage, 28% in the West Pekalongan,
Pekalongan 31% in the East, 33% in South PekalonganPekalongan and 8% in the
North. 44 garment company located in the district of East Pekalongan with 832 workers workforce
(BPS, Indicators of Large Medium Pekalongan, 2012).
Progress of a country or a nation can be measured from the level of productivity. The higher
productivity of the country, the higher the economic growth (AM SugengBudiono, 2003). A job is
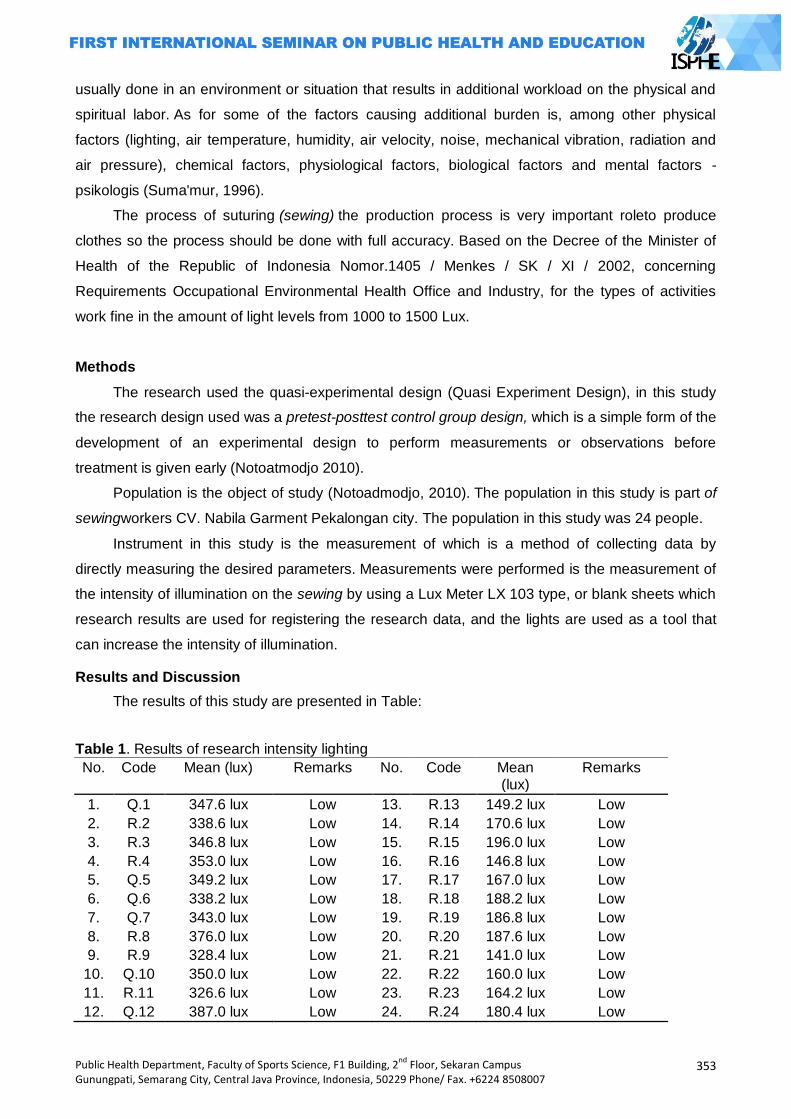
Public Health Department, Faculty of Sports Science, F1 Building, 2nd
Floor, Sekaran Campus Gunungpati, Semarang City, Central Java Province, Indonesia, 50229 Phone/ Fax. +6224 8508007
353
usually done in an environment or situation that results in additional workload on the physical and
spiritual labor. As for some of the factors causing additional burden is, among other physical
factors (lighting, air temperature, humidity, air velocity, noise, mechanical vibration, radiation and
air pressure), chemical factors, physiological factors, biological factors and mental factors -
psikologis (Suma'mur, 1996).
The process of suturing (sewing) the production process is very important roleto produce
clothes so the process should be done with full accuracy. Based on the Decree of the Minister of
Health of the Republic of Indonesia Nomor.1405 / Menkes / SK / XI / 2002, concerning
Requirements Occupational Environmental Health Office and Industry, for the types of activities
work fine in the amount of light levels from 1000 to 1500 Lux.
Methods
The research used the quasi-experimental design (Quasi Experiment Design), in this study
the research design used was a pretest-posttest control group design, which is a simple form of the
development of an experimental design to perform measurements or observations before
treatment is given early (Notoatmodjo 2010).
Population is the object of study (Notoadmodjo, 2010). The population in this study is part of
sewingworkers CV. Nabila Garment Pekalongan city. The population in this study was 24 people.
Instrument in this study is the measurement of which is a method of collecting data by
directly measuring the desired parameters. Measurements were performed is the measurement of
the intensity of illumination on the sewing by using a Lux Meter LX 103 type, or blank sheets which
research results are used for registering the research data, and the lights are used as a tool that
can increase the intensity of illumination.
Results and Discussion
The results of this study are presented in Table:
Table 1. Results of research intensity lighting
No. Code Mean (lux) Remarks No. Code Mean (lux)
Remarks
1. Q.1 347.6 lux Low 13. R.13 149.2 lux Low
2. R.2 338.6 lux Low 14. R.14 170.6 lux Low
3. R.3 346.8 lux Low 15. R.15 196.0 lux Low
4. R.4 353.0 lux Low 16. R.16 146.8 lux Low
5. Q.5 349.2 lux Low 17. R.17 167.0 lux Low
6. Q.6 338.2 lux Low 18. R.18 188.2 lux Low
7. Q.7 343.0 lux Low 19. R.19 186.8 lux Low
8. R.8 376.0 lux Low 20. R.20 187.6 lux Low
9. R.9 328.4 lux Low 21. R.21 141.0 lux Low
10. Q.10 350.0 lux Low 22. R.22 160.0 lux Low
11. R.11 326.6 lux Low 23. R.23 164.2 lux Low
12. Q.12 387.0 lux Low 24. R.24 180.4 lux Low
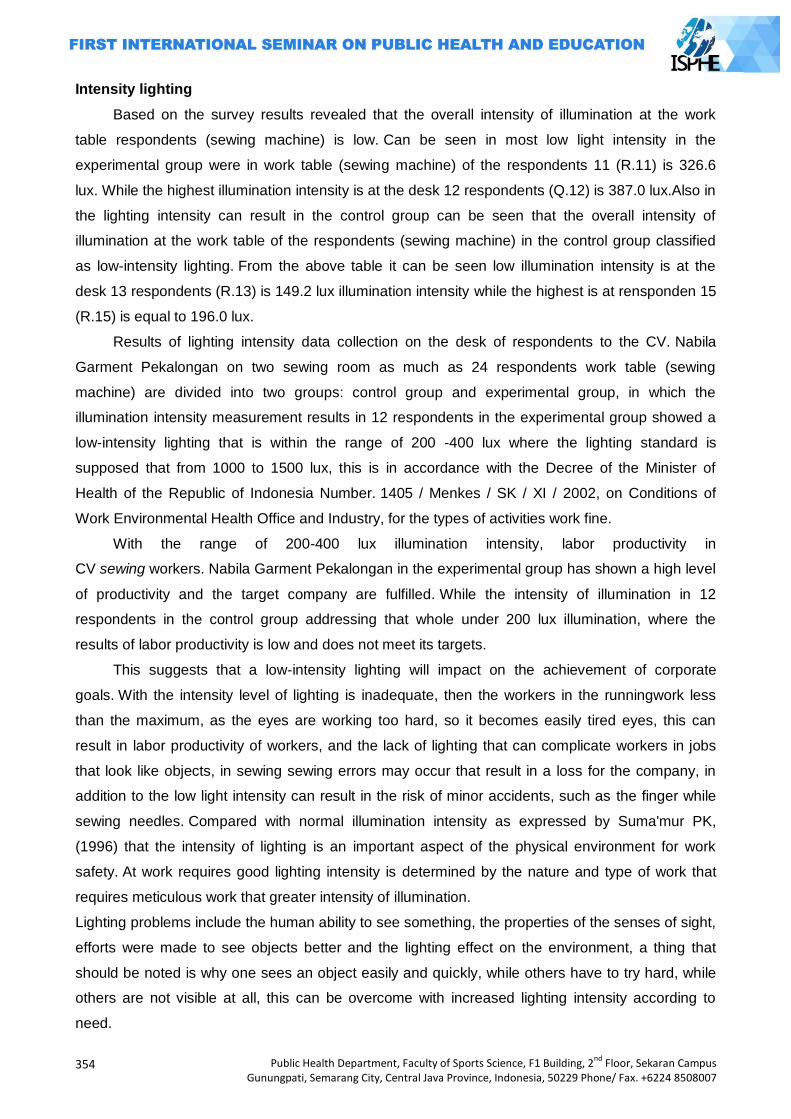
354
Public Health Department, Faculty of Sports Science, F1 Building, 2nd
Floor, Sekaran Campus Gunungpati, Semarang City, Central Java Province, Indonesia, 50229 Phone/ Fax. +6224 8508007
Intensity lighting
Based on the survey results revealed that the overall intensity of illumination at the work
table respondents (sewing machine) is low. Can be seen in most low light intensity in the
experimental group were in work table (sewing machine) of the respondents 11 (R.11) is 326.6
lux. While the highest illumination intensity is at the desk 12 respondents (Q.12) is 387.0 lux.Also in
the lighting intensity can result in the control group can be seen that the overall intensity of
illumination at the work table of the respondents (sewing machine) in the control group classified
as low-intensity lighting. From the above table it can be seen low illumination intensity is at the
desk 13 respondents (R.13) is 149.2 lux illumination intensity while the highest is at rensponden 15
(R.15) is equal to 196.0 lux.
Results of lighting intensity data collection on the desk of respondents to the CV. Nabila
Garment Pekalongan on two sewing room as much as 24 respondents work table (sewing
machine) are divided into two groups: control group and experimental group, in which the
illumination intensity measurement results in 12 respondents in the experimental group showed a
low-intensity lighting that is within the range of 200 -400 lux where the lighting standard is
supposed that from 1000 to 1500 lux, this is in accordance with the Decree of the Minister of
Health of the Republic of Indonesia Number. 1405 / Menkes / SK / XI / 2002, on Conditions of
Work Environmental Health Office and Industry, for the types of activities work fine.
With the range of 200-400 lux illumination intensity, labor productivity in
CV sewing workers. Nabila Garment Pekalongan in the experimental group has shown a high level
of productivity and the target company are fulfilled. While the intensity of illumination in 12
respondents in the control group addressing that whole under 200 lux illumination, where the
results of labor productivity is low and does not meet its targets.
This suggests that a low-intensity lighting will impact on the achievement of corporate
goals. With the intensity level of lighting is inadequate, then the workers in the runningwork less
than the maximum, as the eyes are working too hard, so it becomes easily tired eyes, this can
result in labor productivity of workers, and the lack of lighting that can complicate workers in jobs
that look like objects, in sewing sewing errors may occur that result in a loss for the company, in
addition to the low light intensity can result in the risk of minor accidents, such as the finger while
sewing needles. Compared with normal illumination intensity as expressed by Suma'mur PK,
(1996) that the intensity of lighting is an important aspect of the physical environment for work
safety. At work requires good lighting intensity is determined by the nature and type of work that
requires meticulous work that greater intensity of illumination.
Lighting problems include the human ability to see something, the properties of the senses of sight,
efforts were made to see objects better and the lighting effect on the environment, a thing that
should be noted is why one sees an object easily and quickly, while others have to try hard, while
others are not visible at all, this can be overcome with increased lighting intensity according to
need.
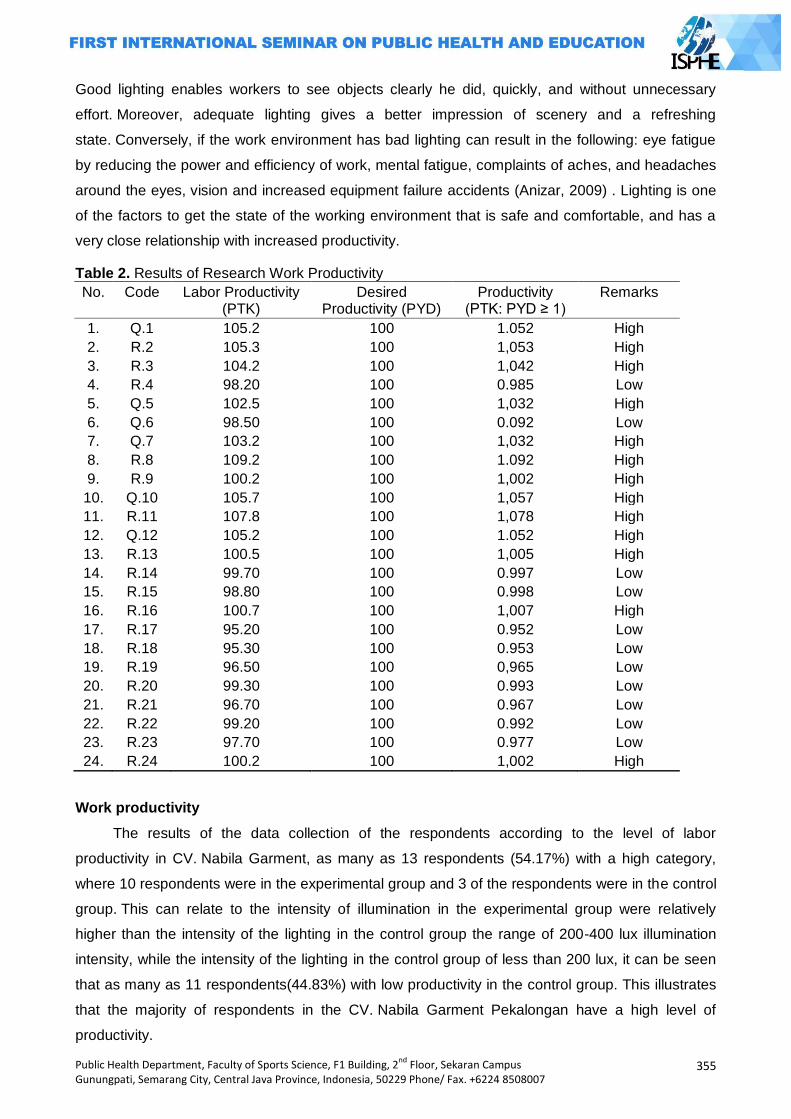
Public Health Department, Faculty of Sports Science, F1 Building, 2nd
Floor, Sekaran Campus Gunungpati, Semarang City, Central Java Province, Indonesia, 50229 Phone/ Fax. +6224 8508007
355
Good lighting enables workers to see objects clearly he did, quickly, and without unnecessary
effort. Moreover, adequate lighting gives a better impression of scenery and a refreshing
state. Conversely, if the work environment has bad lighting can result in the following: eye fatigue
by reducing the power and efficiency of work, mental fatigue, complaints of aches, and headaches
around the eyes, vision and increased equipment failure accidents (Anizar, 2009) . Lighting is one
of the factors to get the state of the working environment that is safe and comfortable, and has a
very close relationship with increased productivity.
Table 2. Results of Research Work Productivity
No. Code Labor Productivity (PTK)
Desired Productivity (PYD)
Productivity (PTK: PYD ≥ 1)
Remarks
1. Q.1 105.2 100 1.052 High
2. R.2 105.3 100 1,053 High
3. R.3 104.2 100 1,042 High
4. R.4 98.20 100 0.985 Low
5. Q.5 102.5 100 1,032 High
6. Q.6 98.50 100 0.092 Low
7. Q.7 103.2 100 1,032 High
8. R.8 109.2 100 1.092 High
9. R.9 100.2 100 1,002 High
10. Q.10 105.7 100 1,057 High
11. R.11 107.8 100 1,078 High
12. Q.12 105.2 100 1.052 High
13. R.13 100.5 100 1,005 High
14. R.14 99.70 100 0.997 Low
15. R.15 98.80 100 0.998 Low
16. R.16 100.7 100 1,007 High
17. R.17 95.20 100 0.952 Low
18. R.18 95.30 100 0.953 Low
19. R.19 96.50 100 0,965 Low
20. R.20 99.30 100 0.993 Low
21. R.21 96.70 100 0.967 Low
22. R.22 99.20 100 0.992 Low
23. R.23 97.70 100 0.977 Low
24. R.24 100.2 100 1,002 High
Work productivity
The results of the data collection of the respondents according to the level of labor
productivity in CV. Nabila Garment, as many as 13 respondents (54.17%) with a high category,
where 10 respondents were in the experimental group and 3 of the respondents were in the control
group. This can relate to the intensity of illumination in the experimental group were relatively
higher than the intensity of the lighting in the control group the range of 200-400 lux illumination
intensity, while the intensity of the lighting in the control group of less than 200 lux, it can be seen
that as many as 11 respondents(44.83%) with low productivity in the control group. This illustrates
that the majority of respondents in the CV. Nabila Garment Pekalongan have a high level of
productivity.
356
Public Health Department, Faculty of Sports Science, F1 Building, 2nd
Floor, Sekaran Campus Gunungpati, Semarang City, Central Java Province, Indonesia, 50229 Phone/ Fax. +6224 8508007
With a high level of productivity will impact on the achievement of the target company in
order to meet-penasannya.The level of productivity of a person can be affected by several things
including work load, work capacity, physical fitness, sex, age, load tambahand work environment
and lighting. The composition of people aged less than 30 years, the 22 respondents in the age
category 25-49 years, and most of the male sex, and supported with sufficient lighting levels, it will
contribute to the performance of employees. With the high level of labor productivity will have an
impact on work efficiency achieved by the company. Productivity can be used as a measure of the
level of efficiency, effectiveness and quality of each resource that is used during the production
process (Suma'mur PK, 1996).
Table 3. Results normalitytest
Group Results p value
Experiments Labor productivity 0566
Controls Labor productivity 0.195
The results of the analysis of data normality test performed on the data rate of labor productivity of
both the experimental group and the control group in mind that the value of p> 0.05, meaning that
all the data overall level of labor productivity is normally distributed. Once known normally
distributed data, then the results of work productivity scores of both the experimental group and the
control group performed the test unpaired t test or independent sample test, to determine the
difference in the level of labor productivitybetween the experimental group and the control
group. Statistical test results of t-test scores of labor productivity level experimental and control
groups showed that the p value = 0.001 (p <0.05). Can be seen that there are differences in the
level of labor productivity in the experimental and control groups.
As for knowing the level of labor productivity is higher than the experimental group and the control
group can be seen from the mean value in each group. The mean value of labor productivity in the
experimental group gained an average value of 1.04 in the high category. While the results
obtained in the control group work productivity with an average value of 0.98 is included in the low
category. This suggests that the level of labor productivity is higher in the experimental group
compared with the level of labor productivity in the control group.
There are differences in labor productivity with an increase in the intensity of illumination on
worker sewing the control group and the experimental group. In the control group with local
illumination intensity <200 lux, productivity generated the majority of respondents did not meet the
company's target of 100 pieces of underwear per day, the control group of 12 respondents are only
3 workers (25%) which can meet its targets. While the experimental group, the lighting intensity of
200-400 lux improved, has been shown to increase the productivity of labor, in which the
experimental group of 12 respondents, there were 10 respondents (83%) with high productivity
levels that reach the target company 100 pieces of underwear per day.
Public Health Department, Faculty of Sports Science, F1 Building, 2nd
Floor, Sekaran Campus Gunungpati, Semarang City, Central Java Province, Indonesia, 50229 Phone/ Fax. +6224 8508007
357
Based on the description above it can be concluded that the addition of 200-400 lux illumination
intensity in the experiment group 58% can increase work productivity.
This is in line with research conducted by Padmanaba (2006), the influence of illumination in the
space of the interior design student work productivity, that increase the intensity of local lighting on
the drawing board of 407.85 lux be 1416 lux can increase work productivity by 40%.
The results of labor productivity in the experimental group with levels higher illumination intensity,
making the results of high productivity in comparison with the results of the control group
productivity is low. This is due to the increased intensity and lighting is sufficient, the employee will
be able to work with higher. As diuangkapkan by Hariyono (2009), that lighting is one of the factors
to get the state of the working environment that is safe and comfortable, and has a very close
relationship with increased productivity.
The intensity of lighting is an important aspect of the physical environment for work
safety. Workplace requires adequate lighting intensity to be able to see well and good lighting
teliti.Intensitas determined by the nature and type of work that requires meticulous work that
greater intensity of illumination (Suma'mur PK, 1996).
Closing
Based on the results of research on the differences in labor productivity in places with
different illumination intensities on the sewing workers CV. Nabila Garment Pekalongan be
concluded as follows: (1) Most of the relatively low level of intensity lighting is 100-400 lux
illumination intensity range as much (100%), this is because the intensity of the lighting should
meet the standards of the 1000 to 1500 lux; (2) There are 13 respondents with a high level of labor
productivity (54.17%), of which 10 respondents were in the experimental group and 3 respondents
in the control group; (3) There were 11 respondents (44.83%) of respondents with low productivity
levels found in the control group; (4) The intensity lighting ditingkankan can increase work
productivity; (5) there are differences in the level of labor productivity, in terms of labor productivity
level scores the experimental group and the control group showed p value = 0.001 (p <0.05); (6)
labor productivity experimental group is higher than in the control group work productivity, in terms
of the mean value of the average in the experimental group was 1.04 in the high category, whereas
in the control group average of 0.98 is low; (7) Addition of 200-400 lux illumination intensity in the
experiment group 58% can increase work productivity.
References
Anizar. 2009, health and safety techniques in the industry, Yogyakarta: Graha Science. BPS, 2012, the Company Number of Large Medium By subsector, 2000-
2012, http://www.bps.go.id/tab_sub/view.php?kat=2&tabel=1&daftar=1&id_subyek=09¬ab=2 , accessed February 28, 2014 .
358
Public Health Department, Faculty of Sports Science, F1 Building, 2nd
Floor, Sekaran Campus Gunungpati, Semarang City, Central Java Province, Indonesia, 50229 Phone/ Fax. +6224 8508007
____, 2012, Total Workers of Large and Medium Manufacturing by Subsector, 2000-2012,http://www.bps.go.id/tab_sub/view.php?kat=2&tabel=1&daftar=1&id_subyek=09¬ab
=11 , accessed 28 February 2014. ____, 2012, the number of Company Industry Classification According
Pekalongan,http://pekalongankota.bps.go.id/index.php?hal=tabel&id=39 , accessed February 28, 2014.
Attack Santoso, 2004, the Management of Health and Safety at Work, London: Performance Library.
Kepmenkes RI, 2002, the Decree of the Minister of Health of the Republic of Indonesia Number 1405 / Menkes / SK / XI / 2002 on Conditions of Work Environmental Health Office and Industry, London: Kepmenkes.
Sugeng Budiono.AM 2003, Flowers Potpourri Hiperkes and Occupational Health. Semarang: BPUNDIP.
Suma'mur, 1996, the Company Hygiene and Occupational Health, Jakarta: PT GunungAgung. ________, 2009, the Company Hygiene and Occupational Health, Jakarta: PT GunungAgung. SoekidjoNotoatmodjo, 2010, Health Research Methodology, New York: RinekaCipta.
Public Health Department, Faculty of Sports Science, F1 Building, 2nd
Floor, Sekaran Campus Gunungpati, Semarang City, Central Java Province, Indonesia, 50229 Phone/ Fax. +6224 8508007
359
NITRIFICATION AND DENITRIFICATION ALTERNATIVE METHOD BY AN ALGAL-BACTERIAL CONSORTIUM
Rudatin Windraswara1, Peter Van der Steen2, Carlos Lopez Vazquez2
1Semarang State University, Indonesia 2UNESCO-IHE Institute for Water Education, Netherlands
Corresponding Author: [email protected]
Abstract Introduction: In this study, the effect of operational conditions in a photo-SBR (sequencing batch reactor) and ammonium loading rate were investigated. The SBR was operated with some different length and sequence phase. The initial mixed culture of algae species consisted of Scenedesmus quadricauda, Anabaena variabilis, Chlorella sp., Chlorococcus sp., Spirulina sp., and unidentified algae species from canal water. Nitrifying bacteria were cultured from Harnaschpolder WWTP activated sludge. The ammonium influent was increased step wise; 23, 50 and 70 and then back to 23 mg N-NH4 +/l.day on three different periods. Methods: During the experiment; the highest performance was obtained during period two. The nitrification and denitrification process was successfully supported by photo-SBR setting: fill 1: 0.13h, aerobic 1: 7.3h, fill 2: 0.03h, anoxic: 1.22h, aerobic 2: 1h, settles: 1.9h, and withdraw: 0.1h in two cycles per day with the maximum nitrification rate achieved was 38 mgN-NH4+/l.d and maximum denitrification rates was 2404 mgCOD/l.d at 23.2 mgN-NH4+/l.d influent loading rate. Results:This study showed that microalgae could provide oxygen needed by nitrifying bacteria and sustain in the reactor. On the other hand, nitrifiers could utilize oxygen produced by algae without using external aeration to perform nitrification and heterotrophic bacteria could continue denitrify N-NO3-. Furthermore, it could be inferred that controlling operational conditions is an important factor to successfully perform nitrogen removal in photo-SBR system. Apart from light intensity, light duration and influent load (ALR) also have significant influence to the nitrogen removal performance by a microalgal-bacterial photo-SBR system.
Keyword: photo-SBR, operational condition, ammonium loading rate (ALR) Introduction
Microalgal-bacterial photobioreactors are considered one of the sustainable wastewater
treatment alternatives. An algal-bacterial culture is a complex system that occurs in natural or
engineered systems such as waste stabilization ponds (WSPs) and high rate algae pond (HRAPs).
This relationship helps nature and humans to treat wastewater through photosynthetic oxygenation
of microalgae and contaminant degradation by bacteria. Therefore, there are needs to comprehend
the influence of key environmental factors and operational conditions to be able to design an
effective system for N-removal.
Methods
The research and experiments were carried out at IHE-UNESCO Delft, the Netherlands.
Environmental conditions that required for this algae-bacteria system were set up thoroughly to
achieve the optimum results and explained further.
The experiment was carried out in a 1.5 liter transparent water jacket cylindrical reactor. The
reactor was filled with specific amount of biomass (as explained further on section 4.3) and filled up
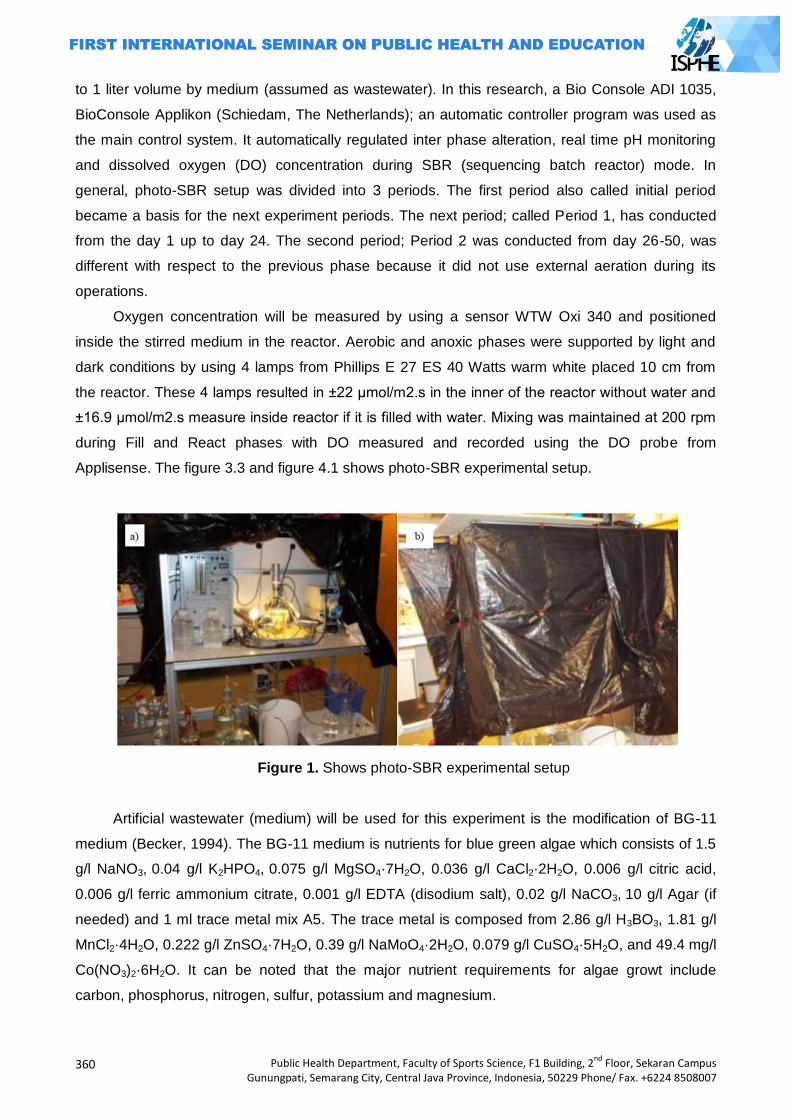
360
Public Health Department, Faculty of Sports Science, F1 Building, 2nd
Floor, Sekaran Campus Gunungpati, Semarang City, Central Java Province, Indonesia, 50229 Phone/ Fax. +6224 8508007
to 1 liter volume by medium (assumed as wastewater). In this research, a Bio Console ADI 1035,
BioConsole Applikon (Schiedam, The Netherlands); an automatic controller program was used as
the main control system. It automatically regulated inter phase alteration, real time pH monitoring
and dissolved oxygen (DO) concentration during SBR (sequencing batch reactor) mode. In
general, photo-SBR setup was divided into 3 periods. The first period also called initial period
became a basis for the next experiment periods. The next period; called Period 1, has conducted
from the day 1 up to day 24. The second period; Period 2 was conducted from day 26-50, was
different with respect to the previous phase because it did not use external aeration during its
operations.
Oxygen concentration will be measured by using a sensor WTW Oxi 340 and positioned
inside the stirred medium in the reactor. Aerobic and anoxic phases were supported by light and
dark conditions by using 4 lamps from Phillips E 27 ES 40 Watts warm white placed 10 cm from
the reactor. These 4 lamps resulted in ±22 μmol/m2.s in the inner of the reactor without water and
±16.9 μmol/m2.s measure inside reactor if it is filled with water. Mixing was maintained at 200 rpm
during Fill and React phases with DO measured and recorded using the DO probe from
Applisense. The figure 3.3 and figure 4.1 shows photo-SBR experimental setup.
Figure 1. Shows photo-SBR experimental setup
Artificial wastewater (medium) will be used for this experiment is the modification of BG-11
medium (Becker, 1994). The BG-11 medium is nutrients for blue green algae which consists of 1.5
g/l NaNO3, 0.04 g/l K2HPO4, 0.075 g/l MgSO4·7H2O, 0.036 g/l CaCl2·2H2O, 0.006 g/l citric acid,
0.006 g/l ferric ammonium citrate, 0.001 g/l EDTA (disodium salt), 0.02 g/l NaCO3, 10 g/l Agar (if
needed) and 1 ml trace metal mix A5. The trace metal is composed from 2.86 g/l H3BO3, 1.81 g/l
MnCl2·4H2O, 0.222 g/l ZnSO4·7H2O, 0.39 g/l NaMoO4·2H2O, 0.079 g/l CuSO4·5H2O, and 49.4 mg/l
Co(NO3)2·6H2O. It can be noted that the major nutrient requirements for algae growt include
carbon, phosphorus, nitrogen, sulfur, potassium and magnesium.
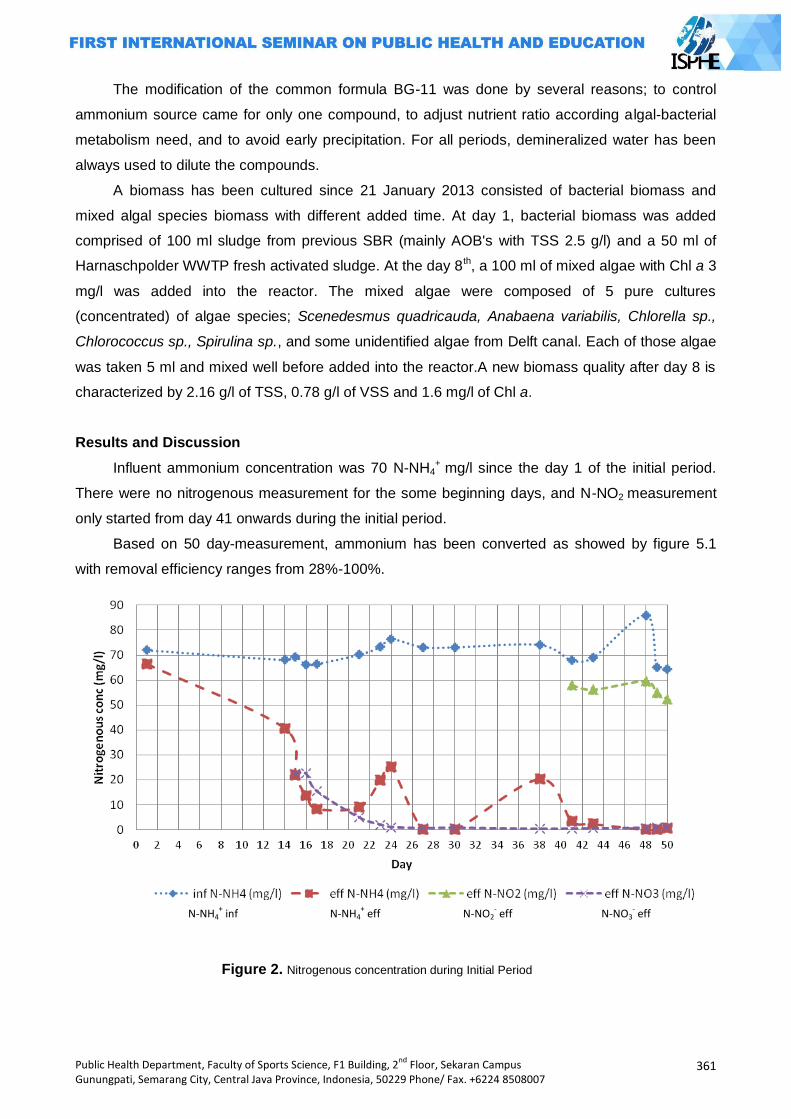
Public Health Department, Faculty of Sports Science, F1 Building, 2nd
Floor, Sekaran Campus Gunungpati, Semarang City, Central Java Province, Indonesia, 50229 Phone/ Fax. +6224 8508007
361
The modification of the common formula BG-11 was done by several reasons; to control
ammonium source came for only one compound, to adjust nutrient ratio according algal-bacterial
metabolism need, and to avoid early precipitation. For all periods, demineralized water has been
always used to dilute the compounds.
A biomass has been cultured since 21 January 2013 consisted of bacterial biomass and
mixed algal species biomass with different added time. At day 1, bacterial biomass was added
comprised of 100 ml sludge from previous SBR (mainly AOB's with TSS 2.5 g/l) and a 50 ml of
Harnaschpolder WWTP fresh activated sludge. At the day 8th, a 100 ml of mixed algae with Chl a 3
mg/l was added into the reactor. The mixed algae were composed of 5 pure cultures
(concentrated) of algae species; Scenedesmus quadricauda, Anabaena variabilis, Chlorella sp.,
Chlorococcus sp., Spirulina sp., and some unidentified algae from Delft canal. Each of those algae
was taken 5 ml and mixed well before added into the reactor.A new biomass quality after day 8 is
characterized by 2.16 g/l of TSS, 0.78 g/l of VSS and 1.6 mg/l of Chl a.
Results and Discussion
Influent ammonium concentration was 70 N-NH4+
mg/l since the day 1 of the initial period.
There were no nitrogenous measurement for the some beginning days, and N-NO2 measurement
only started from day 41 onwards during the initial period.
Based on 50 day-measurement, ammonium has been converted as showed by figure 5.1
with removal efficiency ranges from 28%-100%.
Figure 2. Nitrogenous concentration during Initial Period
N-NH4+ inf N-NH4
+ eff N-NO2
- eff N-NO3
- eff
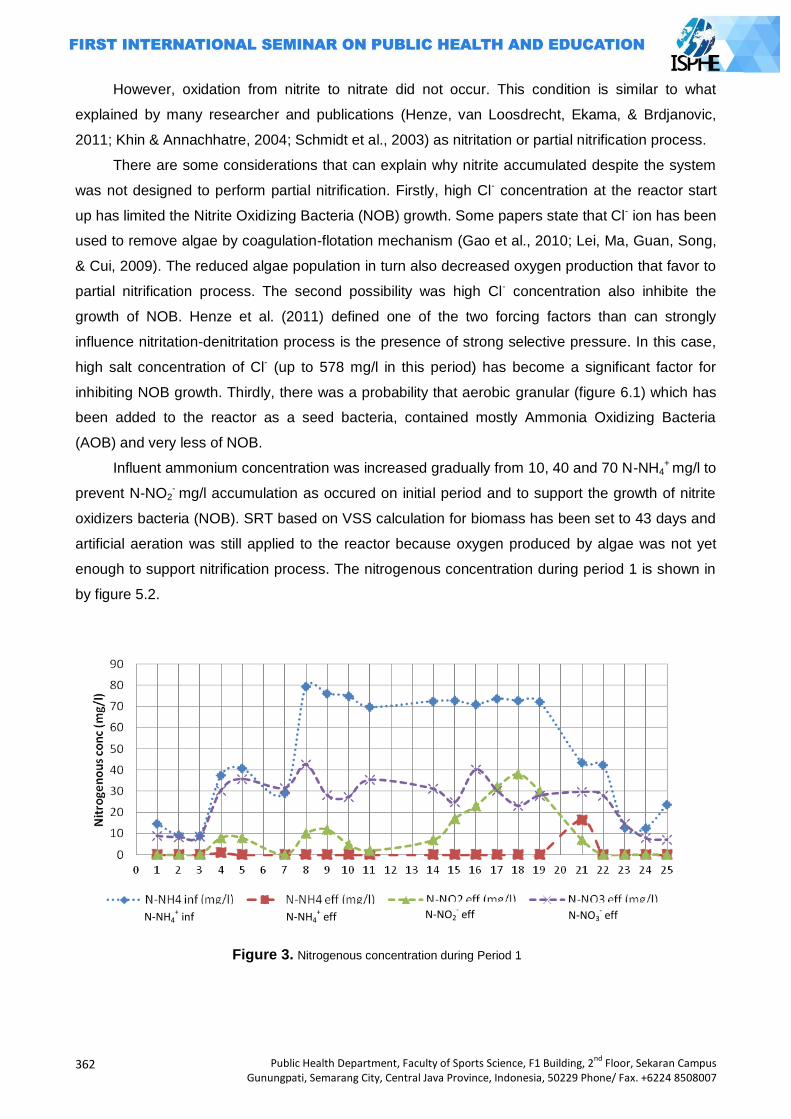
362
Public Health Department, Faculty of Sports Science, F1 Building, 2nd
Floor, Sekaran Campus Gunungpati, Semarang City, Central Java Province, Indonesia, 50229 Phone/ Fax. +6224 8508007
However, oxidation from nitrite to nitrate did not occur. This condition is similar to what
explained by many researcher and publications (Henze, van Loosdrecht, Ekama, & Brdjanovic,
2011; Khin & Annachhatre, 2004; Schmidt et al., 2003) as nitritation or partial nitrification process.
There are some considerations that can explain why nitrite accumulated despite the system
was not designed to perform partial nitrification. Firstly, high Cl- concentration at the reactor start
up has limited the Nitrite Oxidizing Bacteria (NOB) growth. Some papers state that Cl- ion has been
used to remove algae by coagulation-flotation mechanism (Gao et al., 2010; Lei, Ma, Guan, Song,
& Cui, 2009). The reduced algae population in turn also decreased oxygen production that favor to
partial nitrification process. The second possibility was high Cl- concentration also inhibite the
growth of NOB. Henze et al. (2011) defined one of the two forcing factors than can strongly
influence nitritation-denitritation process is the presence of strong selective pressure. In this case,
high salt concentration of Cl- (up to 578 mg/l in this period) has become a significant factor for
inhibiting NOB growth. Thirdly, there was a probability that aerobic granular (figure 6.1) which has
been added to the reactor as a seed bacteria, contained mostly Ammonia Oxidizing Bacteria
(AOB) and very less of NOB.
Influent ammonium concentration was increased gradually from 10, 40 and 70 N-NH4+
mg/l to
prevent N-NO2- mg/l accumulation as occured on initial period and to support the growth of nitrite
oxidizers bacteria (NOB). SRT based on VSS calculation for biomass has been set to 43 days and
artificial aeration was still applied to the reactor because oxygen produced by algae was not yet
enough to support nitrification process. The nitrogenous concentration during period 1 is shown in
by figure 5.2.
Figure 3. Nitrogenous concentration during Period 1
N-NH4+ inf N-NH4
+ eff N-NO2
- eff N-NO3
- eff
Public Health Department, Faculty of Sports Science, F1 Building, 2nd
Floor, Sekaran Campus Gunungpati, Semarang City, Central Java Province, Indonesia, 50229 Phone/ Fax. +6224 8508007
363
Based on fig 3; an ammonium conversion occured during period 1 although the objective of
photo-SBR system of becoming fully autonomos system was not achieved because there was still
support from external aeration.
However, ammonium conversion did not always lead to nitrate formation, but it also observed
a moderate nitrite accumulation. Figure 5.2 shows there is a constant increase of N-NO2 since day
12 and reach peak at day 18. At the same time, although the algae concentration raised a bit from
2.8 to 4.1 mg/l of Chl a, seemed it couldnot supply O2 to support both AOB (ammonia oxidizers
bacteria) and NOB (nitrite oxidizers bacteria) growths. As a aggravating effect, the insufficient
oxygen (below 2 mgO2/l) also support partial nitrification process that lead to nitrite accumulation
as explained by many research papers (Khin & Annachhatre, 2004; Ruiz, Jeison, Rubilar, Ciudad,
& Chamy, 2006; Sinha & Annachhatre, 2006)
Some SBR operation strategies have been applied in this period. Simultaneous ND has been
tried at day 23. However, maintain DO at low level 0.4 - 0.6 mg/l as a requirement of simultaneous
ND (Chiu, Lee, Chang, & Chao, 2007) could not be achieved (see the annex of pH and DO
profiles). The other SBR strategy, steep feeding method has been applied also although it could
not achieve the research objective; to support nitrification and denitrification process. The effect of
intermittent light by alternating aerobic-anoxic phase several times might be not supported
photosynthesis process by algae and impacted of low oxygen production.
Chlo a concentration was the most important factor for oxygen production. From the
experiment, the maximum of chl a measurement was 16.4 mg/l. The significance of chl a is that it
directly affect photosynthetic activity therefore it determines the oxygen production in the system.
Comparing to open photobioreactor, the chl a concentration achieved from this experiment is
significantly higher. For instance, a facultative pond has chl a concentration 1.5 mg/L (Mara, 2004);
other example, HRAPs chl a concentration during summer time is between 3.0 - 4.0 mg/L (Garcia
et al., 2000).
From the microscopic observation it could be seen that all of the algae species added from
the beginning managed to survive and the most abundant algae presences was Chlorella sp.
Chlorella sp is categorized as rapidly growing and Chlorella species are also considered as highly
resistant microalgae, thus it will naturally dominate in most continuous microalgal-based treatment
systems (Muñoz & Guieysse, 2006).
The algae growth was calculated based on simple growth rate calculation as a mixed algae
culture; therefore it might be contained considerably high error. However, the calculation still can
be used to indicate the mixed algae culture growth. Similarly, Kayombo et al. (2003) has also
observed a mixed algae culture growth in the WSP and reported for µmax 2.7/day and Ks 110
mgCOD/l of growth model calculation based on suspended solid concentration. The WSP
maximum algae growth rate calculated by Kayombo et al. (2003) is considerable higher than
specific growth rate from this experiment; 0.03/day. However, Lee (2001) reported Chlorella sp.
hardly can grow at rates higher than 4.8/day. Other experiment by Janssen et al. (1999) used
364
Public Health Department, Faculty of Sports Science, F1 Building, 2nd
Floor, Sekaran Campus Gunungpati, Semarang City, Central Java Province, Indonesia, 50229 Phone/ Fax. +6224 8508007
Chlamydomonas reinhardtii and Chlorella sorokiniana in continuous illumination turbidostats
resulted in µ 0.16/d. The comparisons imply the low growth rate of mixed alga culture in this photo-
SBR system.
The less algae growth on this experiment is probably caused by limitation of two factors; light
intensity and low N availability. Compare to similiar previos work by Karya (2012), light intensity on
this photo-SBR experiment was only ±22 μmol/m2.s measured in the inner of the reactor without
water and ±16.9 μmol/m2.s measure inside reactor if it is filled with water; while Karya's (2012) was
±63 μmol/m2.s measured in the inner of the reactor, also other photo-SBR work by Van den Hende
et al. (2011) used 100 μmol/m2.s. Meanwhile, an open photobioreactor greatly varies during the
day and during the season year and it reported can up to 200-400 μmol/m2.s. Light energy is
readily absorbed and therefore its intensity is significantly decreased by mutual shading (Suh &
Lee, 2003; Valigore, Gostomski, Wareham, & O‘Sullivan, 2012). Although the light intensity
throughout experiment was low; but it still could grow up to 16.4 mg/l of chl a. This grows
occurence probaly because the mixing was good enough to let algae suspension to be exposed to
the light.
Nitrogen was rated the only limiting nutrient factor on the system during period 2. Nitrogen is
one of the main macro nutrients needed by algae growth because it composes ±9% of its dry
weight ( Park and Craggs 2011a). Because of 78% of nitrogen influent was fastly utilised by
nitrification and denitrification process, then nitrogen uptake by algae for growth might not be
sufficient enough. However compared to Karya's (2012) research; this experiment resulted in
similar nitrogen uptake per amount of algae VSS, which Karya (2012) was 2.36 mgN-NH4+/gVSS
and this experiment was 2.22 mgN-NH4+/gVSS. One possibility to verify whether algae are in
condition of nitrogen limited or not, is via lipid measurement. Nitrogen limitation of the algal culture
is widely recognised to increase algal lipid content to 50% of dry weight (Park et al. 2011; Valigore
et al. 2012).
The accumulation of nitrite (up to 60 mg N-NO2-/l) at Initial Period inhibited algae growth until
the level of extinguished the algae presence entirely since day 25 onwards (figure 5.4). This Cl-
inhibition to algae has also explained by Wodzinski, et al. (1978); that photosynthesis can be
inhibited by 1 mM or 14 mg N-NO2-/l at pH 6.0. It also explained that toxicity of nitrite decreased as
pH increased.
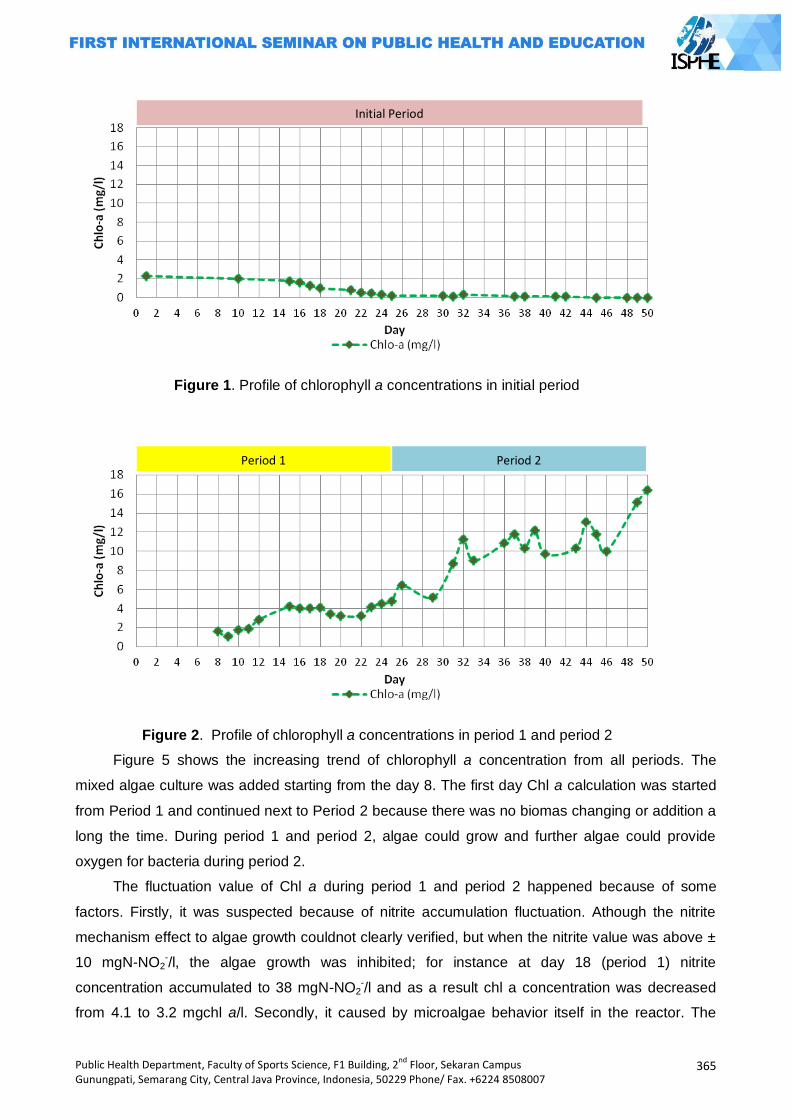
Public Health Department, Faculty of Sports Science, F1 Building, 2nd
Floor, Sekaran Campus Gunungpati, Semarang City, Central Java Province, Indonesia, 50229 Phone/ Fax. +6224 8508007
365
Figure 1. Profile of chlorophyll a concentrations in initial period
Figure 2. Profile of chlorophyll a concentrations in period 1 and period 2
Figure 5 shows the increasing trend of chlorophyll a concentration from all periods. The
mixed algae culture was added starting from the day 8. The first day Chl a calculation was started
from Period 1 and continued next to Period 2 because there was no biomas changing or addition a
long the time. During period 1 and period 2, algae could grow and further algae could provide
oxygen for bacteria during period 2.
The fluctuation value of Chl a during period 1 and period 2 happened because of some
factors. Firstly, it was suspected because of nitrite accumulation fluctuation. Athough the nitrite
mechanism effect to algae growth couldnot clearly verified, but when the nitrite value was above ±
10 mgN-NO2-/l, the algae growth was inhibited; for instance at day 18 (period 1) nitrite
concentration accumulated to 38 mgN-NO2-/l and as a result chl a concentration was decreased
from 4.1 to 3.2 mgchl a/l. Secondly, it caused by microalgae behavior itself in the reactor. The
Initial Period
Period 1 Period 2
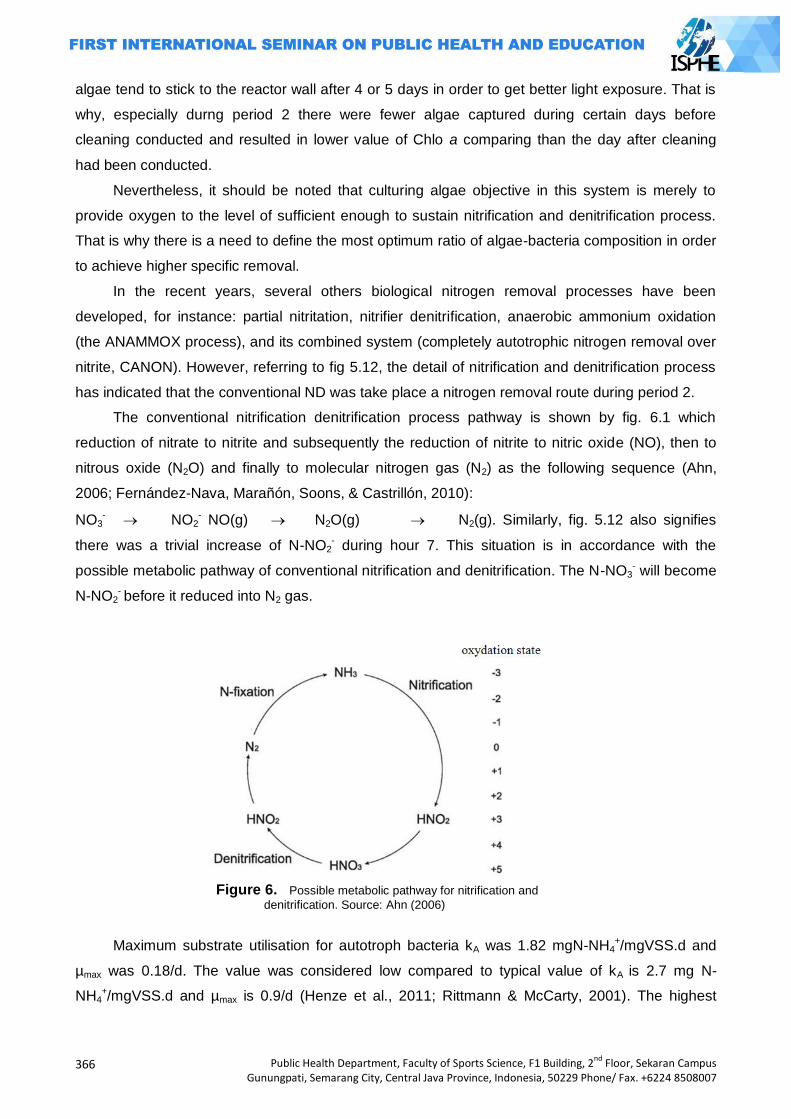
366
Public Health Department, Faculty of Sports Science, F1 Building, 2nd
Floor, Sekaran Campus Gunungpati, Semarang City, Central Java Province, Indonesia, 50229 Phone/ Fax. +6224 8508007
algae tend to stick to the reactor wall after 4 or 5 days in order to get better light exposure. That is
why, especially durng period 2 there were fewer algae captured during certain days before
cleaning conducted and resulted in lower value of Chlo a comparing than the day after cleaning
had been conducted.
Nevertheless, it should be noted that culturing algae objective in this system is merely to
provide oxygen to the level of sufficient enough to sustain nitrification and denitrification process.
That is why there is a need to define the most optimum ratio of algae-bacteria composition in order
to achieve higher specific removal.
In the recent years, several others biological nitrogen removal processes have been
developed, for instance: partial nitritation, nitrifier denitrification, anaerobic ammonium oxidation
(the ANAMMOX process), and its combined system (completely autotrophic nitrogen removal over
nitrite, CANON). However, referring to fig 5.12, the detail of nitrification and denitrification process
has indicated that the conventional ND was take place a nitrogen removal route during period 2.
The conventional nitrification denitrification process pathway is shown by fig. 6.1 which
reduction of nitrate to nitrite and subsequently the reduction of nitrite to nitric oxide (NO), then to
nitrous oxide (N2O) and finally to molecular nitrogen gas (N2) as the following sequence (Ahn,
2006; Fernández-Nava, Marañón, Soons, & Castrillón, 2010):
NO3-
NO2
- NO(g) N2O(g) N2(g). Similarly, fig. 5.12 also signifies
there was a trivial increase of N-NO2- during hour 7. This situation is in accordance with the
possible metabolic pathway of conventional nitrification and denitrification. The N-NO3- will become
N-NO2- before it reduced into N2 gas.
Figure 6. Possible metabolic pathway for nitrification and
denitrification. Source: Ahn (2006)
Maximum substrate utilisation for autotroph bacteria kA was 1.82 mgN-NH4+/mgVSS.d and
µmax was 0.18/d. The value was considered low compared to typical value of kA is 2.7 mg N-
NH4+/mgVSS.d and µmax is 0.9/d (Henze et al., 2011; Rittmann & McCarty, 2001). The highest
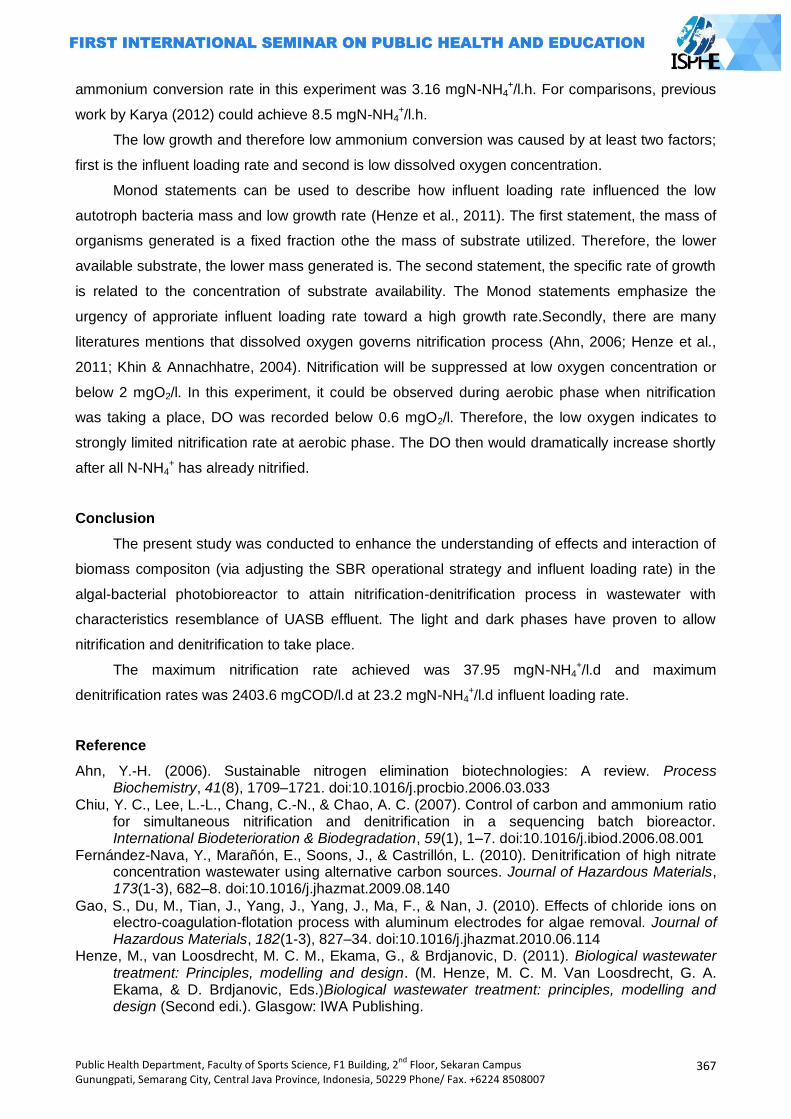
Public Health Department, Faculty of Sports Science, F1 Building, 2nd
Floor, Sekaran Campus Gunungpati, Semarang City, Central Java Province, Indonesia, 50229 Phone/ Fax. +6224 8508007
367
ammonium conversion rate in this experiment was 3.16 mgN-NH4+/l.h. For comparisons, previous
work by Karya (2012) could achieve 8.5 mgN-NH4+/l.h.
The low growth and therefore low ammonium conversion was caused by at least two factors;
first is the influent loading rate and second is low dissolved oxygen concentration.
Monod statements can be used to describe how influent loading rate influenced the low
autotroph bacteria mass and low growth rate (Henze et al., 2011). The first statement, the mass of
organisms generated is a fixed fraction othe the mass of substrate utilized. Therefore, the lower
available substrate, the lower mass generated is. The second statement, the specific rate of growth
is related to the concentration of substrate availability. The Monod statements emphasize the
urgency of approriate influent loading rate toward a high growth rate.Secondly, there are many
literatures mentions that dissolved oxygen governs nitrification process (Ahn, 2006; Henze et al.,
2011; Khin & Annachhatre, 2004). Nitrification will be suppressed at low oxygen concentration or
below 2 mgO2/l. In this experiment, it could be observed during aerobic phase when nitrification
was taking a place, DO was recorded below 0.6 mgO2/l. Therefore, the low oxygen indicates to
strongly limited nitrification rate at aerobic phase. The DO then would dramatically increase shortly
after all N-NH4+ has already nitrified.
Conclusion
The present study was conducted to enhance the understanding of effects and interaction of
biomass compositon (via adjusting the SBR operational strategy and influent loading rate) in the
algal-bacterial photobioreactor to attain nitrification-denitrification process in wastewater with
characteristics resemblance of UASB effluent. The light and dark phases have proven to allow
nitrification and denitrification to take place.
The maximum nitrification rate achieved was 37.95 mgN-NH4+/l.d and maximum
denitrification rates was 2403.6 mgCOD/l.d at 23.2 mgN-NH4+/l.d influent loading rate.
Reference
Ahn, Y.-H. (2006). Sustainable nitrogen elimination biotechnologies: A review. Process Biochemistry, 41(8), 1709–1721. doi:10.1016/j.procbio.2006.03.033
Chiu, Y. C., Lee, L.-L., Chang, C.-N., & Chao, A. C. (2007). Control of carbon and ammonium ratio for simultaneous nitrification and denitrification in a sequencing batch bioreactor. International Biodeterioration & Biodegradation, 59(1), 1–7. doi:10.1016/j.ibiod.2006.08.001
Fernández-Nava, Y., Marañón, E., Soons, J., & Castrillón, L. (2010). Denitrification of high nitrate concentration wastewater using alternative carbon sources. Journal of Hazardous Materials, 173(1-3), 682–8. doi:10.1016/j.jhazmat.2009.08.140
Gao, S., Du, M., Tian, J., Yang, J., Yang, J., Ma, F., & Nan, J. (2010). Effects of chloride ions on electro-coagulation-flotation process with aluminum electrodes for algae removal. Journal of Hazardous Materials, 182(1-3), 827–34. doi:10.1016/j.jhazmat.2010.06.114
Henze, M., van Loosdrecht, M. C. M., Ekama, G., & Brdjanovic, D. (2011). Biological wastewater treatment: Principles, modelling and design. (M. Henze, M. C. M. Van Loosdrecht, G. A. Ekama, & D. Brdjanovic, Eds.)Biological wastewater treatment: principles, modelling and design (Second edi.). Glasgow: IWA Publishing.
368
Public Health Department, Faculty of Sports Science, F1 Building, 2nd
Floor, Sekaran Campus Gunungpati, Semarang City, Central Java Province, Indonesia, 50229 Phone/ Fax. +6224 8508007
Janssen, M., Kuijpers, T. C., Veldhoen, B., Ternbach, M. B., Tramper, J., Mur, L. R., & Wijffels, R. H. (1999). Specific growth rate of Chlamydomonas reinhardtii and Chlorella sorokiniana under medium duration light/dark cycles: 13–87 s. Journal of Biotechnology, 70(1-3), 323–333. doi:10.1016/S0168-1656(99)00084-X
Khin, T., & Annachhatre, A. P. (2004). Novel microbial nitrogen removal processes. Biotechnology Advances, 22(7), 519–32. doi:10.1016/j.biotechadv.2004.04.003
Lei, G., Ma, J., Guan, X., Song, A., & Cui, Y. (2009). Effect of basicity on coagulation performance of polyferric chloride applied in eutrophicated raw water. Desalination, 247(1-3), 518–529. doi:10.1016/j.desal.2008.06.026
Muñoz, R., & Guieysse, B. (2006). Algal-bacterial processes for the treatment of hazardous contaminants: a review. Water Research, 40(15), 2799–815. doi:10.1016/j.watres.2006.06.011
Park, J. B. K., & Craggs, R. J. (2011). Nutrient removal in wastewater treatment high rate algal ponds with carbon dioxide addition. Water Science & Technology, 63(8), 1758.
doi:10.2166/wst.2011.114 Rittmann, B. E., & McCarty, P. L. (2001). Environmental biotechnology: Principles and application.
New York: McGraw Hill Publishing Co. Ruiz, G., Jeison, D., Rubilar, O., Ciudad, G., & Chamy, R. (2006). Nitrification-denitrification via
nitrite accumulation for nitrogen removal from wastewaters. Bioresource Technology, 97(2), 330–5. doi:10.1016/j.biortech.2005.02.018
Schmidt, I., Sliekers, O., Schmid, M., Bock, E., Fuerst, J., Kuenen, J. G., … Strous, M. (2003). New concepts of microbial treatment processes for the nitrogen removal in wastewater. FEMS Microbiology Reviews, 27(4), 481–492. doi:10.1016/S0168-6445(03)00039-1
Sinha, B., & Annachhatre, A. P. (2006). Partial nitrification—operational parameters and microorganisms involved. Reviews in Environmental Science and Bio/Technology, 6(4), 285–313. doi:10.1007/s11157-006-9116-x
Suh, I. soo, & Lee, C.-G. (2003). Photobioreactor engineering: design and performance. Biotechnology and Bioprocess Engineering, 8, 313–321.
Valigore, J. M., Gostomski, P. a, Wareham, D. G., & O‘Sullivan, A. D. (2012). Effects of hydraulic and solids retention times on productivity and settleability of microbial (microalgal-bacterial) biomass grown on primary treated wastewater as a biofuel feedstock. Water Research, 46(9), 2957–64. doi:10.1016/j.watres.2012.03.023

Public Health Department, Faculty of Sports Science, F1 Building, 2nd
Floor, Sekaran Campus Gunungpati, Semarang City, Central Java Province, Indonesia, 50229 Phone/ Fax. +6224 8508007
369
POSTER PRESENTATIONS

370
Public Health Department, Faculty of Sports Science, F1 Building, 2nd
Floor, Sekaran Campus Gunungpati, Semarang City, Central Java Province, Indonesia, 50229 Phone/ Fax. +6224 8508007
Public Health Department, Faculty of Sports Science, F1 Building, 2nd
Floor, Sekaran Campus Gunungpati, Semarang City, Central Java Province, Indonesia, 50229 Phone/ Fax. +6224 8508007
371
HEALTH EDUCATION AND PROMOTION
STUDENTS, COMMUNITY, AND SOCIETY
PAPERS

372
Public Health Department, Faculty of Sports Science, F1 Building, 2nd
Floor, Sekaran Campus Gunungpati, Semarang City, Central Java Province, Indonesia, 50229 Phone/ Fax. +6224 8508007
Public Health Department, Faculty of Sports Science, F1 Building, 2nd
Floor, Sekaran Campus Gunungpati, Semarang City, Central Java Province, Indonesia, 50229 Phone/ Fax. +6224 8508007
373
EFFECT OF SUPPLEMENTS OF SPINACH (AMARANTHUS) TO HEMOGLOBIN CONTENT OF CHANGES
(STUDIES LABORATORY OF MICE)
Ika Esti Anggraeni, Supriyana2, Sri Rahayu2
1STIKes Bhakti Mandala Husada Slawi, Indonesia 2Polytechnic Semarang, Indonesia
Corresponding Author: [email protected]
Abstract Introduction: Postpartum maternal anemia is a medical condition in which the number of red
blood cells or hemoglobin less than 10gr%. Physiologically anemia occurs when there is a shortage of hemoglobin to carry oxygen to body tissues. The decrease in hemoglobin concentration due to disruption of the formation of red blood cells due to iron levels in the blood is reduced. Health Organization (WHO) reported that the prevalence of postpartum maternal anemia
around 56%. Indonesian Health of Demographic Survey in 2012, reported that prevalence of postpartum maternal anemia prevalence as much as 30%. Methods: This study aims to determine the effect of supplementation on changes in hemoglobin levels spinach in anemic of mice. This type of research is an experimental laboratory with a pretest-posttest control group design. The samples in this study were anemic female of mice were 24 mice were divided into 3 groups. The group was given a supplement of green spinach (8 mice), the group was given a supplement thorn spinach (8 mice), control group (8 mice). Results: Results found no differences in hemoglobin levels control group to the treatment group
with p value 0,000 < 0,01. Large differences in the three groups using ANOVA satistic test, it was found that most affect the spinach spines increase in hemoglobin level. Key Words : Spinach, hemoglobin, postpartum maternal, mice.
Introduction
Postpartum maternal anemia is a medical condition in which the number of red blood cells or
hemoglobin is less than 10gr% (Myles, 2009). Physiologically anemia occurs when there is a
shortage of hemoglobin to carry oxygen to body tissues. Decrease in hemoglobin concentration
due to disruption of the formation of red blood cells caused by iron levels in the blood is reduced
(Purwanto, 2013).
Susceptible to postpartum maternal anemia, due to the amount of blood loss during
childbirth. Fatigue, physical disability, postpartum blues and cognitive decline is a factor affecting
maternal anemia postpartum (Swati, 2013).
The prevalence of anemia in developed countries reached 14%, and 51% in state
berkembang. According to WHO postpartum maternal anemia was 56% (Swati, 2013). In India,
maternal mortality due to anemia was 19%, of the cases of anemia in mothers postpartum 65% -
75%. In Indonesia, on maternal mortality due to postpartum anemia to 30% (SDKI, 2012).
Spinach is one of the alternative crops in meeting the needs of iron in postpartum mothers.
According to the results of research conducted by Kumar (2012) states that the spinach greens
treating anemia, because the greens have a source of vitamins, minerals and iron at most.
In 100 grams of green vegetables such as cinnamon leaves contained 8.7 mg of iron, 8.3 mg iron
374
Public Health Department, Faculty of Sports Science, F1 Building, 2nd
Floor, Sekaran Campus Gunungpati, Semarang City, Central Java Province, Indonesia, 50229 Phone/ Fax. +6224 8508007
kale, collards 6.8 mg of iron, spinach spines (amaranthus spinosus) contained 100 mg of iron,
green amaranth (amaranthus blitum) contained 8.3 mg of substance of iron (Morris, R. 2008;
Almatsier, 2009).
Spinach is composed of two types of wild spinach and spinach cultivation. Spinach spines
(spinous amaratus) is one type of wild spinach. Spinach spines (spinous amarathus), has the
highest iron content of spinach among other types. Iron is an indispensable precursor in the
formation of hemoglobin and blood red cells (Morris, 2008). The high iron content in spinach role in
the formation of hemoglobin, thereby increasing the levels of hemoglobin (Almatsier, 2009).
To determine the effects of a substance that is used and exploited by humans, research
needs to be done in the laboratory. Mice used in this study because these animals are small, easy
to maintain, adaptable and available in large quantities. Breeding, maintenance and use is easy
and relatively cheap. In addition, mice also have resistance to disease is better than the other test
animals. Changes in anatomy and behavior, is more easily observed in mice, so if there are
defects easily recognized and observed. Structure and function of the gene in mice is similar to
humans, so the research on mice could provide an overview and understanding of the disease on
human (Kusumawati, 2004).
Methods
This research is an experimental research laboratory with a pretest-posttest control group
design. Object study using female mice of experimental animals as research subjects, and the
treatment is administration of thorns spinach juice (Amaranthus spinosus) and green spinach juice
(Amaranthus Blitum) with the final result of changes in blood hemoglobin levels in anemic female
mice, the results were compared with a control group that was not subjected to treatment. This
research was conducted at the State University of Semarang (Unnes) in December 2013, sampling
technique in this study were made at random according to the inclusion and exclusion criteria,
sample size of each 8 data taken in this study is primary data that measured levels anemia
hemoglobin female mice, the data were analyzed using Parametric test Dependent t-test and
ANOVA because the data are normally distributed.
Results and Discussion
The average value of changes in female mice anemia hemoglobin levels before and after
treatment Based on the results of the study there were no significant differences in mean
hemoglobin levels before treatment between the three groups: green spinach, spinach spines and
controls with p value> 0.01. It shows the condition of hemoglobin levels between the three groups
of green spinach, spinach thorns and control under the same conditions. While hemoglobin levels
after treatment are given in three groups: green spinach, spinach thorns and get control at p value
<0.01 so that there is a significant difference in the mean hemoglobin levels between the three
groups: green spinach, spinach spines and controls. It shows the condition after a given treatment
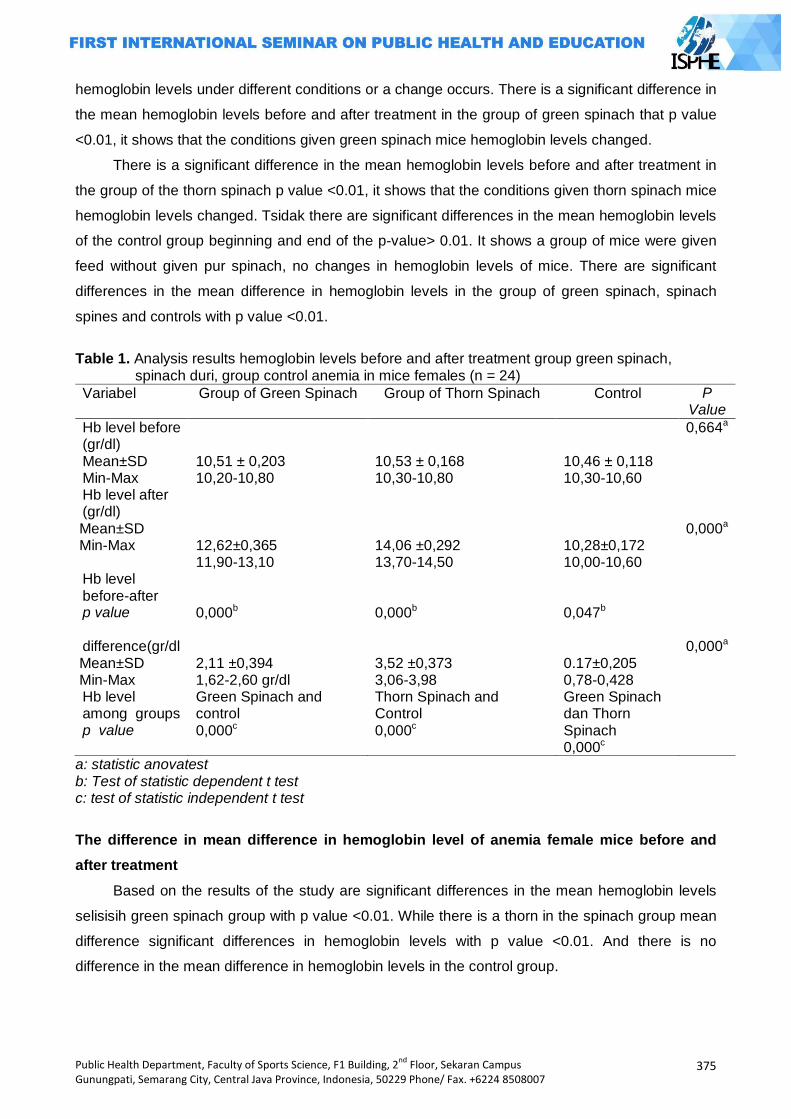
Public Health Department, Faculty of Sports Science, F1 Building, 2nd
Floor, Sekaran Campus Gunungpati, Semarang City, Central Java Province, Indonesia, 50229 Phone/ Fax. +6224 8508007
375
hemoglobin levels under different conditions or a change occurs. There is a significant difference in
the mean hemoglobin levels before and after treatment in the group of green spinach that p value
<0.01, it shows that the conditions given green spinach mice hemoglobin levels changed.
There is a significant difference in the mean hemoglobin levels before and after treatment in
the group of the thorn spinach p value <0.01, it shows that the conditions given thorn spinach mice
hemoglobin levels changed. Tsidak there are significant differences in the mean hemoglobin levels
of the control group beginning and end of the p-value> 0.01. It shows a group of mice were given
feed without given pur spinach, no changes in hemoglobin levels of mice. There are significant
differences in the mean difference in hemoglobin levels in the group of green spinach, spinach
spines and controls with p value <0.01.
Table 1. Analysis results hemoglobin levels before and after treatment group green spinach,
spinach duri, group control anemia in mice females (n = 24)
Variabel Group of Green Spinach Group of Thorn Spinach Control P Value
Hb level before (gr/dl) Mean±SD Min-Max
10,51 ± 0,203 10,20-10,80
10,53 ± 0,168 10,30-10,80
10,46 ± 0,118 10,30-10,60
0,664a
Hb level after (gr/dl) Mean±SD Min-Max
12,62±0,365 11,90-13,10
14,06 ±0,292 13,70-14,50
10,28±0,172 10,00-10,60
0,000a
Hb level before-after p value
0,000b
0,000b
0,047b
difference(gr/dl Mean±SD Min-Max
2,11 ±0,394 1,62-2,60 gr/dl
3,52 ±0,373 3,06-3,98
0.17±0,205 0,78-0,428
0,000a
Hb level among groups p value
Green Spinach and control 0,000c
Thorn Spinach and Control 0,000c
Green Spinach dan Thorn Spinach 0,000c
a: statistic anovatest b: Test of statistic dependent t test c: test of statistic independent t test
The difference in mean difference in hemoglobin level of anemia female mice before and
after treatment
Based on the results of the study are significant differences in the mean hemoglobin levels
selisisih green spinach group with p value <0.01. While there is a thorn in the spinach group mean
difference significant differences in hemoglobin levels with p value <0.01. And there is no
difference in the mean difference in hemoglobin levels in the control group.
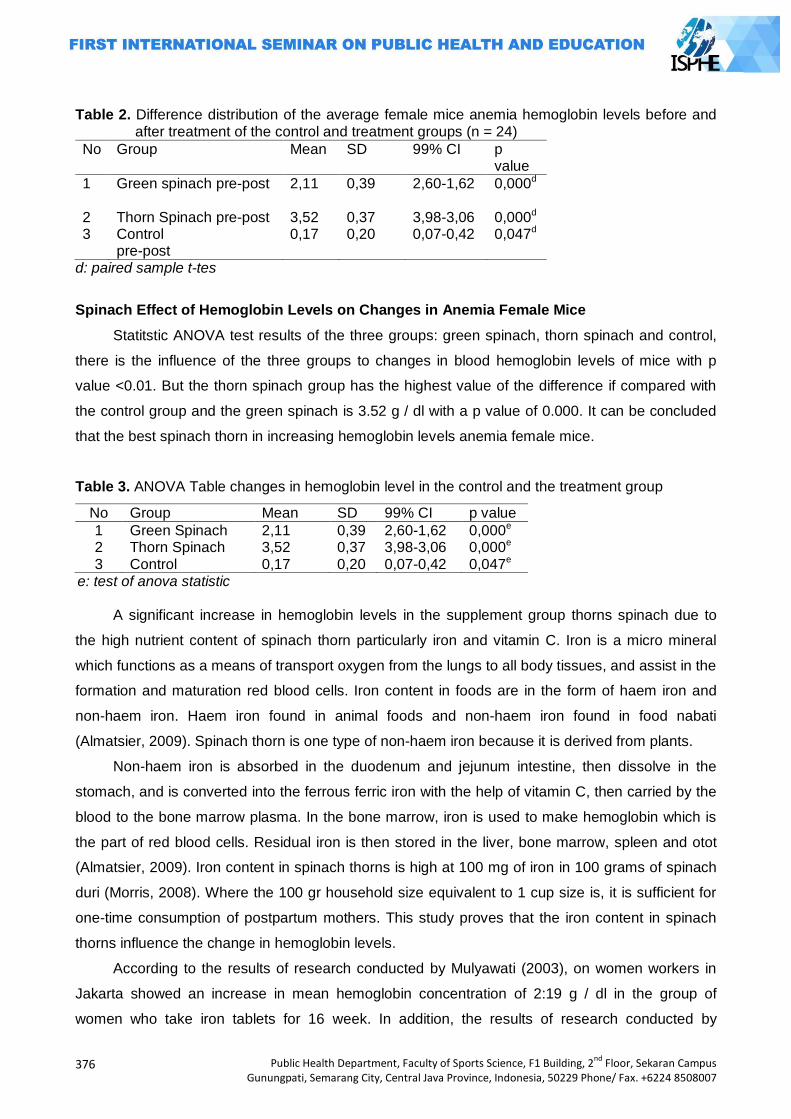
376
Public Health Department, Faculty of Sports Science, F1 Building, 2nd
Floor, Sekaran Campus Gunungpati, Semarang City, Central Java Province, Indonesia, 50229 Phone/ Fax. +6224 8508007
Table 2. Difference distribution of the average female mice anemia hemoglobin levels before and after treatment of the control and treatment groups (n = 24)
No Group Mean SD 99% CI p value
1 Green spinach pre-post
2,11 0,39 2,60-1,62 0,000d
2 Thorn Spinach pre-post 3,52 0,37 3,98-3,06 0,000d 3 Control
pre-post 0,17 0,20 0,07-0,42 0,047d
d: paired sample t-tes
Spinach Effect of Hemoglobin Levels on Changes in Anemia Female Mice
Statitstic ANOVA test results of the three groups: green spinach, thorn spinach and control,
there is the influence of the three groups to changes in blood hemoglobin levels of mice with p
value <0.01. But the thorn spinach group has the highest value of the difference if compared with
the control group and the green spinach is 3.52 g / dl with a p value of 0.000. It can be concluded
that the best spinach thorn in increasing hemoglobin levels anemia female mice.
Table 3. ANOVA Table changes in hemoglobin level in the control and the treatment group
No Group Mean SD 99% CI p value
1 Green Spinach 2,11 0,39 2,60-1,62 0,000e 2 Thorn Spinach 3,52 0,37 3,98-3,06 0,000e 3 Control 0,17 0,20 0,07-0,42 0,047e
e: test of anova statistic
A significant increase in hemoglobin levels in the supplement group thorns spinach due to
the high nutrient content of spinach thorn particularly iron and vitamin C. Iron is a micro mineral
which functions as a means of transport oxygen from the lungs to all body tissues, and assist in the
formation and maturation red blood cells. Iron content in foods are in the form of haem iron and
non-haem iron. Haem iron found in animal foods and non-haem iron found in food nabati
(Almatsier, 2009). Spinach thorn is one type of non-haem iron because it is derived from plants.
Non-haem iron is absorbed in the duodenum and jejunum intestine, then dissolve in the
stomach, and is converted into the ferrous ferric iron with the help of vitamin C, then carried by the
blood to the bone marrow plasma. In the bone marrow, iron is used to make hemoglobin which is
the part of red blood cells. Residual iron is then stored in the liver, bone marrow, spleen and otot
(Almatsier, 2009). Iron content in spinach thorns is high at 100 mg of iron in 100 grams of spinach
duri (Morris, 2008). Where the 100 gr household size equivalent to 1 cup size is, it is sufficient for
one-time consumption of postpartum mothers. This study proves that the iron content in spinach
thorns influence the change in hemoglobin levels.
According to the results of research conducted by Mulyawati (2003), on women workers in
Jakarta showed an increase in mean hemoglobin concentration of 2:19 g / dl in the group of
women who take iron tablets for 16 week. In addition, the results of research conducted by
Public Health Department, Faculty of Sports Science, F1 Building, 2nd
Floor, Sekaran Campus Gunungpati, Semarang City, Central Java Province, Indonesia, 50229 Phone/ Fax. +6224 8508007
377
Fatimah (2009), that the iron content of spinach spines (amaranthus spinosus) is 144.628 mg
higher than green spinach (amaranthus blitum) 136,683mg. Another study conducted by Obge
(2009) that the spinach plant thorn is one alternative in overcoming anemia.
In the process of the formation of hemoglobin, the role of iron can not be separated from the
role of vitamin C. Vitamin C is a type of water-soluble vitamins, is actively absorbed in the upper
small intestine, then into the blood circulation through the veins to be brought to all networks.
Vitamin C serves as a trigger that converts iron into ferrous iron ferry in the stomach, as well as
help optimize absorption besi (Almatsier, 2009). Research conducted by Argana, G, in 2004,
showed that taking vitamin C 1 a day will increase hemoglobin levels by 0:06 g/dl. In addition,
research conducted by Nelma (2008), that the mice who consumed vitamin C for 1 week an
increase in hemoglobin level of 0,03gr /dl. The content of vitamin C in spinach thorns is high at
500.6 mg of vitamin C in 100 grams of spinach duri (Morris, 2008). In addition, other content in
spinach thorns is potassium nitrate, phosphate salts, vitamin A, vitamin K, vitamin B6, thiamine,
riboflavin, protein. Chemical content in spinach spines have an important role in the body,
especially in the formation of hemoglobin (Arif, 2013).
Potassium nitrate is a micro mineral that helps balance electrolytes in the body. Phosphate
salt serves to maintain the balance of acids and bases. Thiamine, riboflavin that function in the
formation and maturation of red blood cells. Other compounds contained in spinach thorns is
protein. Proteins in the body acts as a shaper eritrosit (Winarno, 2004). In accordance with the
above research findings, the vitamin content in spinach thorns role in the formation of erythrocytes
in the blood, especially in the formation of hemoglobin.
Iron deficiency, vitamin B6, vitamin C, vitamin E, and protein can cause anemia. Iron, protein,
pyridoxine (B6) acts as a catalyst in the synthesis of haem in the hemoglobin molecule. Vitamin C
affects the absorption and release of iron from transferrin to the body tissues. While vitamin E is to
maintain stability of cell membranes merah (Almatsier, 2009). Nutrients contained in spinach
thorns, play a role in the formation of red blood cells.
In the process of the formation of red blood cells, red blood cells formed in the bone marrow
in flat bones. The process begins with the formation of erythrocytes eritoblas basophils (young
erythrocytes) which synthesize hemoglobin. Functioning hemoglobin binds oxygen and donor red
blood. Eritoblas basophils later became eritoblas polikromatofilik because it contains a mixture of
basophils and hemoglobin. Then the cell nucleus shrink, grow old and damaged, while hemoglobin
regardless of the cell nucleus. Hemoglobin released from erythrocytes will be taken to the liver to
be reformed into bile dye. Irrespective of iron to be used in forming new erythrocytes. Old and
damaged erythrocytes will be overhauled in the hearts and limfa (Guyton, 1996). The formation of
erythrocytes is influenced by vitamin B12, folic acid, iron, protein, glycoprotein hormones
(hormone-forming erythrocytes), and oksigen (Guyton, 1996). The content of spinach spines
including iron, vitamin A, vitamin C, vitamin K, vitamin B6, thiamine, riboflavin, protein, was
instrumental in the formation of red blood cells so as to increase hemoglobin levels in blood (Arif,
378
Public Health Department, Faculty of Sports Science, F1 Building, 2nd
Floor, Sekaran Campus Gunungpati, Semarang City, Central Java Province, Indonesia, 50229 Phone/ Fax. +6224 8508007
2013). Hemoglobin is a complex compound containing iron with four heme groups, as well as
ferrous iron and contains four globin chains. The process begins with the formation of hemoglobin
iron availability in the body as an essential micronutrient in producing hemoglobin in the blood
plasma. Then towards the bone marrow, and tissues throughout the body. Hemoglobin contains
iron within which work in delivering oxygen from the lungs to the body tissues, and plays a role in
the synthesis of hemoglobin and myoglobin in the cell muscle (Sholehudin, 2006). Effect of spinach
thorns role in increasing hemoglobin levels according to research conducted Fajria (2011). The
results of these studies indicate that spinach can increase the number of erythrocytes and
hemoglobin levels. The influence due to the role of iron and chlorophyll content contained in the
leaf of spinach.
Anemia is a clinical symptom in which the level of hemoglobin in the red blood cells is less
than normal. Decrease in hemoglobin concentration due to disruption of the formation of red blood
cells caused by iron levels in the blood is reduced, so that the blood can not menganggkut
amounts of oxygen needed by the body, thus causing anemia (Purwanto, 2013). Iron deficiency
anemia is anemia that occurs due to lack of iron (Fe) are required by the body in the formation of
red blood cells. In addition, the iron in hemoglobin formation process plays a role in the storage
and transport of oxygen. Lack of iron in the body indicates a deficiency of hemoglobin and oxygen
will inhibit the formation of red blood cells. Iron deficiency anemia is largely determined by the
ability of iron absorption, iron-containing diet, iron requirements increase, the amount of iron that is
lost in the body, blood loss during childbirth, menstruation, chronic diseases such as tuberculosis,
intestinal worms and malaria (Aris, 2009).
In the postpartum mother, the amount of blood lost during delivery can of cause of anemia.
Amount of blood loss during childbirth approximately 200 ml, the first week postpartum around 150
ml and during the remaining period of the puerperium around 100 ml. With the large number of
blood that comes out during the postpartum period, if not offset by the consumption of a balanced
diet, the risk of postpartum maternal anemia. Besides fatigue, physical disability, postpartum blues
and cognitive decline are factors affecting anemia, so the impact on the mother in caring for her
baby and affect the emotional connection between mother and the baby (Swati, 2013; Midelton,
2007).
Causes of postpartum maternal anemia is hemolysis (breakdown of red blood cells
disorders), the amount of blood ejected at the time of delivery, nutrient deficiency include iron
deficiency, folic acid, pyridoxine, vitamin C. Signs and symptoms of anemia that is weak, tired,
lethargic, tired , frequent headaches, dizzy eyes, eyelids, lips, tongue, pale skin and palms. Based
on the results of research conducted by Kumar (2012) that the thorn spinach useful as an anti-
oxidant, anti-inflammatory, anti-malarial, keeping the immune system and anti anemia.
The role of midwives in the management of anemia in postpartum mothers, by providing iron
supplementation for 40 days, provide counseling on proper nutrition on postpartum mothers to
prevent anemia by eating foods that are high in iron, vitamin C, such as spinach, ways good food
Public Health Department, Faculty of Sports Science, F1 Building, 2nd
Floor, Sekaran Campus Gunungpati, Semarang City, Central Java Province, Indonesia, 50229 Phone/ Fax. +6224 8508007
379
processing, namely when cooking vegetables not overcooked because it will reduce the iron
content in the food, wash your vegetables before deductions because vitamin C is water soluble,
and does not consume beverages containing polyphenols such as tea or coffee with meals
because can inhibit iron absorption. As well as home visits six days after the birth to make sure
there are no danger signs in natural post partum (Almatsier, 2009; Suherni, 2009).
Based on the research that spinach thorns is kind of green vegetables high in iron content
and vitamin C, and can increase hemoglobin levels, so it is good for anemia. However, the lack of
proper food processing can reduce the vitamin content especially vitamin C and iron in spinach
thorns. So the need for midwives in promoting good way of processing food to reduce the risk of
postpartum maternal anemia.
Mice are vertebrates (animals segmented spine) and mammals or breastfeeding. Body mice
have in common with humans. The similarity is because mice are warm-blooded animals and have
organs similar to humans. Mouse DNA and human DNA is almost the same. Mice had higher
levels of hemoglobin is similar to humans, which is 12 g / dl-14 g / DL (Sholehudin, 2006). The
similarity between mice and humans, one of the reasons researchers as providing an animal
before it is applied to humans, especially in women with postpartum anemia.
Thorn Spinach has an important role in overcoming anemia. The high content of iron
contained in spinach spines can increase hemoglobin levels. So spinach spines can be one
alternative crop in overcoming anemia. However, the conditions in the community more green
spinach in spinach consumption when compared with spines. Because spinach green more readily
available and does not contain spines making it easier on eating.
Closing
Based on the conclusion, namely First, there are differences in hemoglobin levels in the
treatment group pre and post green spinach actions, it is because the green spinach supplements.
During this green spinach commonly consumed by humans, where the vitamin content in spinach
greens, especially vitamin C and iron needed by the body plays a role in the formation of
hemoglobin in the blood, thus increasing blood hemoglobin levels of mice. Secondly, there are
differences in hemoglobin levels in the treatment group before and after the spinach thorns action,
it is because the thorn spinach supplements. But spinach spines rarely consumed by the public.
The content of vitamins in spinach spines especially vitamin C and iron needed by the body plays a
role in the formation of hemoglobin in the blood, thus increasing blood hemoglobin levels of mice.
Third, there is no difference between the control group pre and post actions, because the control
group was given food pur, which comes from grain that contains no nutritional value. Fourth, there
is the difference in the average change in hemoglobin levels anemia female mice before and after
treatment. Where thorn spinach supplement group had the largest average difference when
compared with the other groups, the amount of 3,52gr / dl. Fifth, there are differences in
hemoglobin levels in the treatment group with a control group in which the group of the most
380
Public Health Department, Faculty of Sports Science, F1 Building, 2nd
Floor, Sekaran Campus Gunungpati, Semarang City, Central Java Province, Indonesia, 50229 Phone/ Fax. +6224 8508007
influential thorn spinach supplements to increase hemoglobin levels of anemic female mice,
because the iron content in spinach highest thorns that can increase blood hemoglobin levels of
mice on a thorn spinach groups.
References
Arif. 2013. 262 Tumbuhan Obat Dan Khasiatnya. Jakarta: Penebar Suadaya Aris. 2009. Fisiologi Tubuh Manusia. Jakarta: KDT Argana, 2004. Vitamin C Sebagai Faktor Dominan Untuk Kadar Hemoglobin Pada Wanita Usia 20-
35 Tahun. Jurnal Kedokteran Trisakti Jakarta Almatsier. 2009. Prinsip Dasar Ilmu Gizi. Jakarta: Gramedia Fajria. 2011. Pengukuran Zat Besi Dalam Bayam Merah Dan Suplemen Penambah Darah Serta
Pengaruhnya Terhadap Peningkatan Hemoglobin Dan Zat Besi Dalam Darah. Universitas Indonesia Jakarta.
Fatimah.2009. Studi Kadar Klorofil dan Zat Besi pada Beberapa Jenis Bayam Terhadap Jumlah Eritrosit Tikus Putih Anemia. Universitas Negeri Malang
Guyton, Artur.C. 1996. Fisiologi Manusia dan Mekanisme Penyakit. Jakarta: EGC Kumar. 2012. A Review On Edible Herbs As Haematinics. International Journal of Pharmacy Kusumawati. 2004. Bersahabat dengan hewan coba. Yogyakarta: Gama Pres Midelton. 2007. Treatment for woman with postpartum iron deficiency anemia the Cochrane library
wiley Morris, R. 2008. Amaranthus hybridus, Amaranthus gangeticus, Amaranthus spinosus, and
Amaranthus blitum. England: Plant for a Future Mulyawati. 2003. Perbandingan Efek Suplementasi Tablet Tambah Darah Dengan Dan Tanpa
Vitamin C Terhadap Kadar Hemoglobin Pada Pekerja Wanita di Perusahaan Plywood Jakarta. Tesis. Universitas Indonesia. Jakarta
Myles. 2009. ―Buku Ajar Bidan. Jakarta: EGC
Nelma. 2008. Pengaruh Pemberian Vitamin C terhadap Aktivitas Enzim Delta Aminolevulinic Acid Dehydratase, Kadar Hemoglobin Basophilik Stippling Pada Mencit Yang Dipapar Plubum. Universitas Sumatra Utara Medan
Obge. 2009. Plants used for female reproductive health care in Nigeria oredo lecal government area. Nigeria. ISS.Journals
Pengaruhnya Terhadap Peningkatan Hemoglobin Dan Zat Besi Dalam Darah. Universitas Indonesia Jakarta.
Purwanto. 2013. ―Herbal dan Keperawatan Komplementer”. Yogyakarta: Nuha Medika SDKI. 2012. ―Badan Pusat Statistik Kependudukan dan Keluarga Berencana Nasional Kementrian
Kesehatan‖. MEASURE DHS. ICF. International Sholehudin. 2006. Pengenalan Hewan Coba. http:// www.multipy.com. Diaksses tanggal 26
Januari 2014 Suherni. Dkk. 2009. Perawatan Masa Nifas. Yogyakarta : Fitramaya. Swati. 2013. Evaluation of iron sucrose for post partum anemia Winarno. 2004. Kimia Pangan dan Gizi. Jakarta: Gramedia Pustaka Utama
Public Health Department, Faculty of Sports Science, F1 Building, 2nd
Floor, Sekaran Campus Gunungpati, Semarang City, Central Java Province, Indonesia, 50229 Phone/ Fax. +6224 8508007
381
BULLYING IN GENDER PERSPECTIVE
Susi Muryani1, Dr.Sunanta Thongpat2, Dr.PrangthipThasanoah Elter3
1STIKES Bhakti Mandala Husada Slawi, Indonesia 2Faculty of NopparatVajira College of Nursing, Thailand 3Faculty of NakhonRatchasima College of Nusing
Corresponding Author: [email protected]
Abstract
Introduction: Behavioural problems affect physical, social, emotional development and health
(American Psychological Associations (APA), 2009). According to study by Sejiwa, bullying at
schools is one of the leading reasons for child suicides in Indonesia, there were 30 cases of
suicide where children aged six to 15 either committed or attempted suicide in 2001 to 2005
(Sejiwa, 2006). Bullying is related to race, nationality, gender, academic ability, age, physical
appearance and mannerisms (Khiat, 2010).
Methods: The purpose of this study was to identify bullying and bullying on gender since there
assumption that bullying mostly occured in boys. There were about 152 adolescent as the sample
of this study and the instrument was used Peer relationship Questionnaire (PRQ) to measure
bullying.
Results: The result indicates that bully does not have significant difference in terms of gender (t =
-.235, p = .841) and victims of bullying (t = -1.838, p = .068). This study concludes that we should
prevent bullying in boys and girls and promote the anti bullying to both boys and girls. We also
need to consider that bullying does not only relate to physical matters, but also verbal and
relational ones, which mostly happen to girls. We need to give appropriate approach to prevent
bullying, since any form of bullying can disturb the psychology of adolescents.
Key Words: Adolescent, bullying, gender
Introduction
Problems over the behaviours of adolescents have dramatically increased worldwide.
Behavioural problems affect physical, social, emotional development and health (American
Psychological Associations (APA), 2009).The bullying behaviour in adolescents significantly
influences their psychological health and scholastic achievement. Studies show that the victims of
bullying were more likely to have negative psychological health issues compared with those who
have never committed it (Owusu et al., 2011).
Bullying can be divided into direct bullying and indirect bullying. Direct bullying is related to
open attacks on victims (Boulton et al., 2002), face to face (Lee, 2004). The indirect bullying on
the contrary is less-direct as a behaviour which includes social isolation and exclusion from peer
groups (Lee, 2004). There are some categories related to the types of bullying which includes
physical, verbal, social and cyber bullying.
As a result of bullying, victims may feel sad, unhappy, and hurt. They often become
temperamental, frustrated, irritable, tired and withdrawn (Oyaziwo, 2006). They have difficulty in
382
Public Health Department, Faculty of Sports Science, F1 Building, 2nd
Floor, Sekaran Campus Gunungpati, Semarang City, Central Java Province, Indonesia, 50229 Phone/ Fax. +6224 8508007
relationships and tend to have less success in life (Sullivan, 2004). Dulmus and Sowers (2004)
add that bullying victims can experience loneliness, low self-esteem, psychiatric issues, eating
disorders, absenteeism and poor academic performance. De wet (2007) confirms that victims of
bullying often suffer from psychological complications,such as insomnia, psychosomatic
complaints, and irritability. Bullying also increases illness related to stress and regression, or
immature behaviours, such as enuresis and nail biting. In school, they concentrate less, perform
lower academically, and are often absent from school.
Similar to bullying victims, the bullies are also at risk for social and emotional problems. The
bullies are more likely to fight, steal, damage, smoke, and receive poor grades (Olweus, 2008).
They may fail to cope and manage their emotions, causing stunted emotional growth and a failure
to develop empathetically. They often externalize and blame others for their problems, never taking
responsibility nor learning to care for others (Kuther, 2006).
Bullying behaviour of adolescents may vary in some kinds according to norms and cultures.
Bullying National Survey in Wales (2010) showed that bullying was one of the top five school
problems faced by more than half of the middle school principals, 32 % of elementary school
principals and 36 % of the high school principals. This survey also revealed that 30% of high
school principals reported that students had attempted or committed suicide as a result of bullying
(Bowen and Holton, 2010). Study in Australian found that 16 % of student was bullied at least once
a week (Cross, 2009). The study of Indonesian Child Protection Commission in 2012 showed that
87.6 % of children suffered from violence at school of many kinds (AEST, 2012). According to
study by Sejiwa an anti-bullying non-governmental organization, bullying at schools is one of the
leading reasons for child suicides in Indonesia, there were 30 cases of suicide where children aged
six to 15 either committed or attempted suicide in 2001 to 2005 (Sejiwa, 2006).
The study by Frisen et al. (2007) showed that the common reason for adolescents suffering
from bullying behaviour was due to having certain physical appearance (being thin, fat, or ugly),
unique and strange language dialects and some kinds of personality traits such as shyness,
innocence, etc. Bullying is related to race, nationality, gender, academic ability, age, physical
appearance and mannerisms (Khiat, 2010). The purpose of this study was to identify bullying
based on gender.
Methods
Research design of this study was descriptive study with cross-sectional design. The
participants were selected based on inclusion and exclusion criteria. To determine the appropriate
sample size for this study, Cohen‘s approach (1988) regarding power analysis was used. In this
study the total sample was 152 adolescents.The purposive sampling method was adopted for
selecting school and participant.
Data were collected by the researchers and assistants as co-researchers who were trained
how to collect the data in particular and understand ethical consideration of research involving
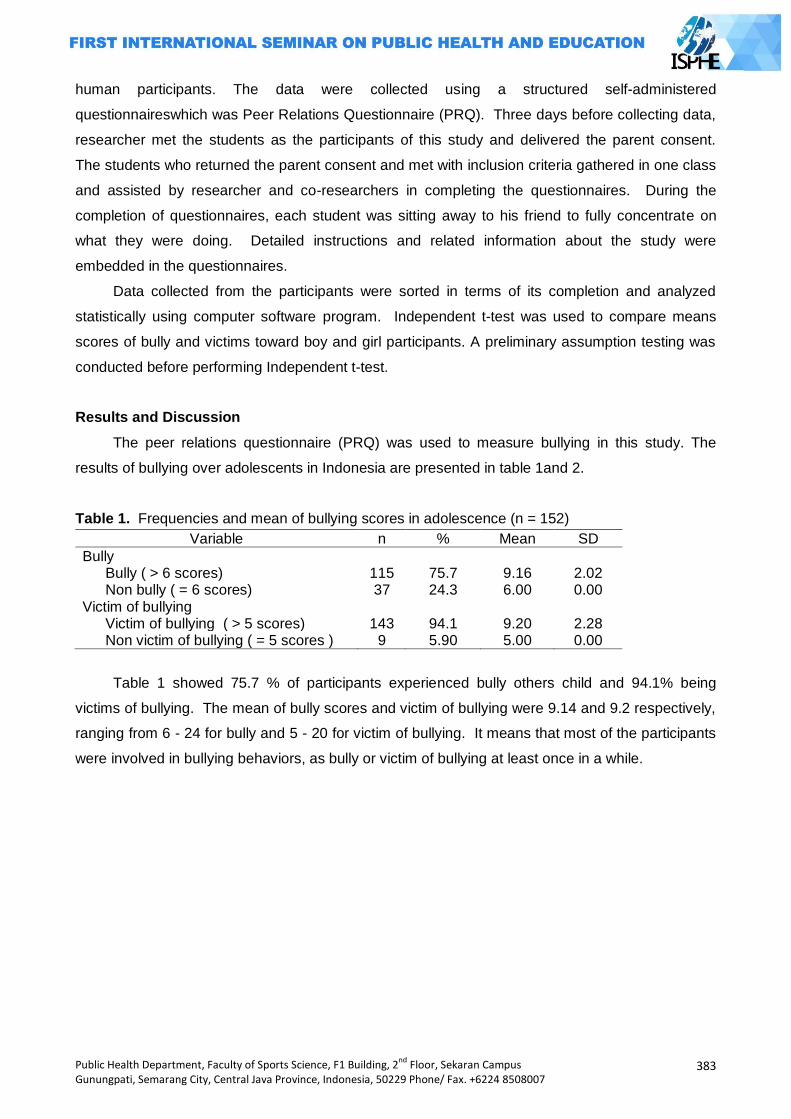
Public Health Department, Faculty of Sports Science, F1 Building, 2nd
Floor, Sekaran Campus Gunungpati, Semarang City, Central Java Province, Indonesia, 50229 Phone/ Fax. +6224 8508007
383
human participants. The data were collected using a structured self-administered
questionnaireswhich was Peer Relations Questionnaire (PRQ). Three days before collecting data,
researcher met the students as the participants of this study and delivered the parent consent.
The students who returned the parent consent and met with inclusion criteria gathered in one class
and assisted by researcher and co-researchers in completing the questionnaires. During the
completion of questionnaires, each student was sitting away to his friend to fully concentrate on
what they were doing. Detailed instructions and related information about the study were
embedded in the questionnaires.
Data collected from the participants were sorted in terms of its completion and analyzed
statistically using computer software program. Independent t-test was used to compare means
scores of bully and victims toward boy and girl participants. A preliminary assumption testing was
conducted before performing Independent t-test.
Results and Discussion
The peer relations questionnaire (PRQ) was used to measure bullying in this study. The
results of bullying over adolescents in Indonesia are presented in table 1and 2.
Table 1. Frequencies and mean of bullying scores in adolescence (n = 152)
Variable n % Mean SD
Bully Bully ( > 6 scores) 115 75.7 9.16 2.02 Non bully ( = 6 scores) 37 24.3 6.00 0.00
Victim of bullying Victim of bullying ( > 5 scores) 143 94.1 9.20 2.28 Non victim of bullying ( = 5 scores ) 9 5.90 5.00 0.00
Table 1 showed 75.7 % of participants experienced bully others child and 94.1% being
victims of bullying. The mean of bully scores and victim of bullying were 9.14 and 9.2 respectively,
ranging from 6 - 24 for bully and 5 - 20 for victim of bullying. It means that most of the participants
were involved in bullying behaviors, as bully or victim of bullying at least once in a while.
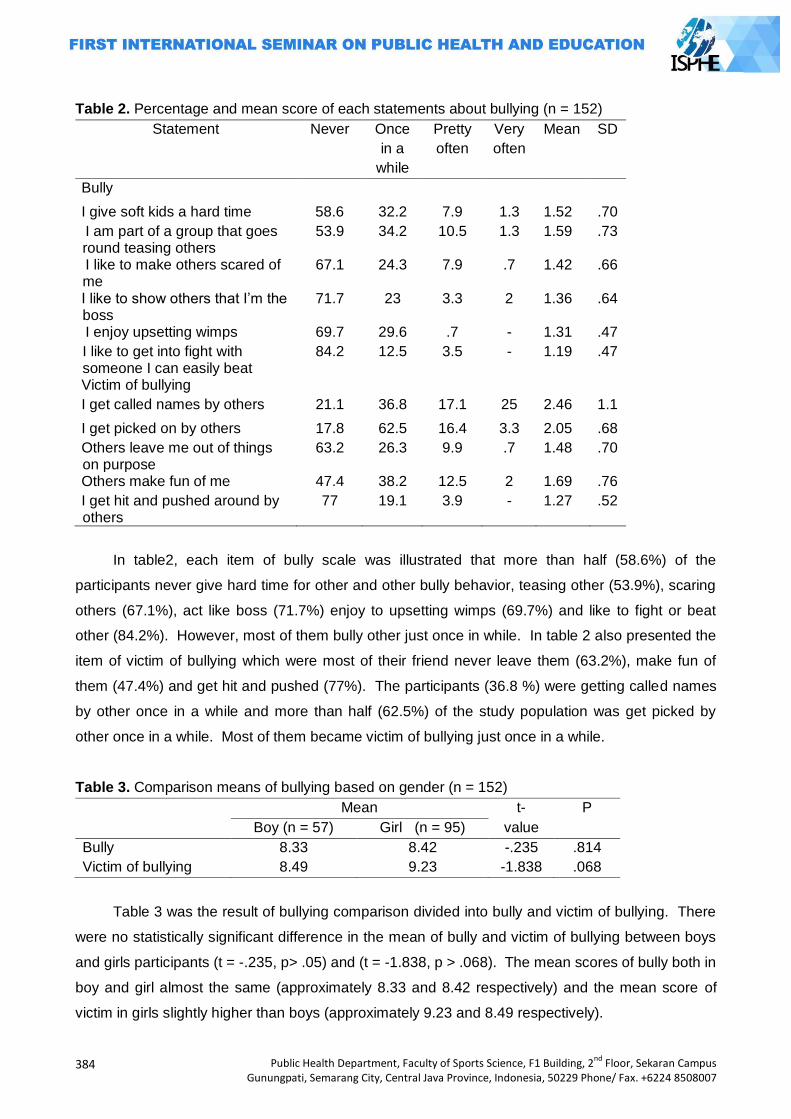
384
Public Health Department, Faculty of Sports Science, F1 Building, 2nd
Floor, Sekaran Campus Gunungpati, Semarang City, Central Java Province, Indonesia, 50229 Phone/ Fax. +6224 8508007
Table 2. Percentage and mean score of each statements about bullying (n = 152)
Statement Never Once
in a
while
Pretty
often
Very
often
Mean SD
Bully
I give soft kids a hard time 58.6 32.2 7.9 1.3 1.52 .70
I am part of a group that goes round teasing others
53.9 34.2 10.5 1.3 1.59 .73
I like to make others scared of me
67.1 24.3 7.9 .7 1.42 .66
I like to show others that I‘m the boss
71.7 23 3.3 2 1.36 .64
I enjoy upsetting wimps 69.7 29.6 .7 - 1.31 .47
I like to get into fight with someone I can easily beat
84.2 12.5 3.5 - 1.19 .47
Victim of bullying
I get called names by others 21.1 36.8 17.1 25 2.46 1.1
I get picked on by others 17.8 62.5 16.4 3.3 2.05 .68
Others leave me out of things on purpose
63.2 26.3 9.9 .7 1.48 .70
Others make fun of me 47.4 38.2 12.5 2 1.69 .76
I get hit and pushed around by others
77 19.1 3.9 - 1.27 .52
In table2, each item of bully scale was illustrated that more than half (58.6%) of the
participants never give hard time for other and other bully behavior, teasing other (53.9%), scaring
others (67.1%), act like boss (71.7%) enjoy to upsetting wimps (69.7%) and like to fight or beat
other (84.2%). However, most of them bully other just once in while. In table 2 also presented the
item of victim of bullying which were most of their friend never leave them (63.2%), make fun of
them (47.4%) and get hit and pushed (77%). The participants (36.8 %) were getting called names
by other once in a while and more than half (62.5%) of the study population was get picked by
other once in a while. Most of them became victim of bullying just once in a while.
Table 3. Comparison means of bullying based on gender (n = 152)
Mean t- P
Boy (n = 57) Girl (n = 95) value
Bully 8.33 8.42 -.235 .814
Victim of bullying 8.49 9.23 -1.838 .068
Table 3 was the result of bullying comparison divided into bully and victim of bullying. There
were no statistically significant difference in the mean of bully and victim of bullying between boys
and girls participants (t = -.235, p> .05) and (t = -1.838, p > .068). The mean scores of bully both in
boy and girl almost the same (approximately 8.33 and 8.42 respectively) and the mean score of
victim in girls slightly higher than boys (approximately 9.23 and 8.49 respectively).
Public Health Department, Faculty of Sports Science, F1 Building, 2nd
Floor, Sekaran Campus Gunungpati, Semarang City, Central Java Province, Indonesia, 50229 Phone/ Fax. +6224 8508007
385
The gender can be used as a variable to understand the phenomenon of bullying (Carrera et
al., 2011) and it can be used as a cultural and hierarchical social construct that serves to
differentiate boys and girls. The study by Carrera et al. (2011) found that gender can give distinct
and complementary definitions of men and women. Men are aggressive, powerful, social-
dominant and more violent to show their masculine identity. On the other hand, women are more
passive, weak, and submissive to men.
The results of bullying in gender in this study showed there was no statistically significant
difference of boys and girls to become bully and victim. This finding is consistent with the study by
Walden and Beran (2010) who found there was no different bullying both in boys and girls. Other
studies found less clear differences between girls and boys in terms of relational or social bullying
(Card et al., 2008; Kuppens et al., 2008; Swearer, 2008). On the contrary, the findings were
inconsistent with the studies which found a significant difference of bullying in genders, which most
adolescents commit bully tend to be boys (Abel and Hankin, 2008; Abada et al., 2008; Yakub et al.,
2008; Adlina et al., 2007). These results may be more accepting and tolerating by the society if
boys are more involved with the bullying than girls. This may also due to the fact that many studies
of bullying have focused only on physical forms of bullying and verbal threat which girls are less
likely to take part. Since girls are more often engaged in social or relational bullying such as
spreading rumor and excluding the victim (Aluede et al., 2008).
In the present study, physical, verbal and relational forms of bullying were included and this
may explain why bullying has no difference between boys and girls. In this study the sample size in
gender was unequal with 62.5 % of participants were girls and 37.5% of them were boys. The
unequal sample size may lead to this finding. The researcher is difficult to get equal sample size in
terms of gender because the sampling method in this study was purposive and the other reason
was the limited time to approach the participant. Some of the participants rejected to join because
they were afraid their secret will be revealed and some of them who experience bullying may fear
that their information might affect their study.
The forms of bullying could be explained in terms of gender. Boys are more likely to involve
with physical bullying and on the other hand, girls are more likely to involve with relational or social
bullying. In this regard, girls strive for affiliation with others, while boys see bullying as a way to
participate in the classroom (Postigo et al., 2009; Vaillancourt et al., 2010). Gender can also be
explained in terms of bully and victim. Girls are more likely to identify themselves as victims of
relational or social bullying (Underwood and Rosen‘s, 2011). They were more sensitive of others‘
distress which can inhibit their participation as bully (Espelage et al., 2010). On the other hand,
boys were more likely to participate as bullies or bully/victims (Rodkin and Berger, 2008). Bullying
behavior is a sensitive issue in Indonesia both in boy and girl, if bullying occur in a girl, she will
judged as bad girls by social whether she is a bully or a victim of bullying. However, the judgment
of the social was different if boy involved in bullying, they was accused as the exploratory behavior
to find their identity (Magfiro and Rahmawati, 2009).
386
Public Health Department, Faculty of Sports Science, F1 Building, 2nd
Floor, Sekaran Campus Gunungpati, Semarang City, Central Java Province, Indonesia, 50229 Phone/ Fax. +6224 8508007
Closing
The result of the study There were no statistically significant differences in the mean of bully
and victim of bullying scores both in boy and girl participants (t = -.235, p > .05) and (t = -1.838, p >
.068). Based on the findings of this study, the prevalence of participants involved in bullying was
high 75.7 % experienced bully and 94.1% being victims of bullying. Therefore, the policy maker
should ensure to provide and protect the adolescents in their home and their school from bullying
by promoting bullying screening program in public and private setting. The policy maker should
ensure the schools to be active to surveillance bullying as monitoring bullying prevalence.
References
Abela, J.R.Z. and B.L. Hankin. 2008. Handbook of Depression in Children and
Adolescents.Guilford Press, New York.
Abada,T., F. Hou and B. Ram. 2008. The effects of harassment and victimization on self-rated
health and mental health among Canadian adolescents. Social Science & Medicine. 67:
557–567.
AEST. 2012. Increased school violence, urging child-friendly school policies. Publicated by
http://www.radioaustralia.net.au/ on 20 June 2013.
Adlina, S., A. Suthahar, M. Ramli, A.B. Edariah. 2007. Pilot study on Depression among
Secondary School Students in Selangor. From http:
//www.ncbi.nlm.nih.gov/pubmed/18246911. April 28, 2013.
American Psychological Association. 2009. Bullying. APA Government Relations: Public Interest
Policy. Available source: http://www.apa.org/ppo/issues/bullying.html. April 12, 2012.
Aluede, O., F. Adeleke, D. Omoike and J. Afen-Akpaida. 2008. A review of the extent, nature,
characteristics and effects of bullying in schools. Journal of Instructional Psychology. 35: 151
– 158.
Boulton, M. J., M. Trueman, and I. Flemington. 2002. Associations between secondary school
pupils‘ definitions of bullying, attitudes toward bullying, and tendencies to engage in bullying:
age and sex differences. Education Study. 28:353–70.
Bowen, R. and D. Holtom. 2010.A Survey into the Prevalence and Incidence of School Bullying in
Wales.Ymchwilgymdeithasol Social research.No.1/2010.
Card, N. A., B. D. Stucky, G. M. Sawalani and T. D. Little. 2008. Direct and indirect aggression
during childhood and adolescence: A meta-analytic review of gender differences,
intercorrelations, and relations to maladjustment. Child Development. 79: 1185-1229.
Carrera, M. V., R. D. Palma and M. Lameiras. 2011. Toward a more comprehensive understanding
of bullying in school settings. Educational Psychology Review. 23(4): 479-499.
Cohen, J. 1988. Statistical power analysis for the behavioural sciences (2nd edition).Hillsdale, NJ:
Lawrence Erlbaum Associates.
Cross, D. 2009. Australian Covert Bullying Prevalence Study (ACBPS). Child Health Promotion
Research Centre, Edith Cowan University, Perth.
De Wet, C. 2007. Education‘s Perception on bullying prevention Strategies. South African Journal
of Education. 27(2): 191-208.
Dulmus, C.N. and K.N. Sowers. 2004. Kids and Violence: The invisible School Experience.
Howorth Social Work Practice Press, New York.
Espelage, D. L. and S. M. Swearer. 2010. A social-ecological model for bullying prevention and
intervention: Understanding the impact of adults in the social ecology of youngsters. In S. R.

Public Health Department, Faculty of Sports Science, F1 Building, 2nd
Floor, Sekaran Campus Gunungpati, Semarang City, Central Java Province, Indonesia, 50229 Phone/ Fax. +6224 8508007
387
Jimerson, S. M. Swearer, & D. L. Espelage (Eds). Handbook of bullying in schools: An
international perspective. 61-72. Routledge, New York.
Frisen, A., A. Jonsson and C. Persson. 2007. Adolescents Perception of Bullying: Who Is The
Victim? Who Is the Bully? What Can Be Done to Stop Bullying. Journal of Adolescence. 42
(168): 749-61.
Khiat, H. 2010. Unveiling the Intricacies of Bullying: Students‘ Perspectives in a Polytechnic in
Singapore.Asian Criminology. 7: 1–22.
Kuppens, S., H. Grietens, P. Onghena, D. Michielsnand S.V. Subramanian. 2008. Individual and
classroom variables associated with relational aggression in elementary school-aged
children: A multilevel analysis. Journal of School Psychology.
Kuther, T. L. 2006. Understanding Bullying.American Academy of Expert.Cited Traumatic Stress.
Source: http://www.aaets.org/article175.htm. June 16, 2013.
Lee, C. 2004. Preventing bullying in Schools.A guide for teachers and other professionals. Paul
Chapman Publishing, London.
Maghfiro, U. and M.A. Rahmawati. 2009. The relationship between climate school and bullying.
Yogyakarta :FakultasPsikologidanIlmuSosialBudayaUniversitas Islam Indonesia.
Olweus, D. 2008. Bullying at school: Prevalence estimation, a useful evaluation design, and a new
national initiative in Norway.Association for Child Psychology and Psychiatry Occasional
Papers. 23: 5-17.
Owusu, A., P. Hart, B. Oliver and M. Kang.2011. The Association between Bullying and
Psychological Health Among Senior High School Students In Ghana, West Africa. Journal of
School Health.81: 5.
Oyaziwo, A. 2006.Bullying in Schools: A form of child abuse in schools.Educational
ResearchQuarterly. 30 (1): 37 - 49.
Postigo, S., R. González, C. Mateu, J. Ferrero and C. Martorell. 2009. Behavioral differences by
gender in school life. Psicothem.,21(3):453 – 458.
Rodkin, P. C. and C. Berger. 2008. Who bullies whom? Social status asymmetries by victim
gender. International Journal of Behavioral Development. 32 :473-485.
Rodkin, P. C. and C. Berger. 2008. Who bullies whom? Social status asymmetries by victim
gender. International Journal of Behavioral Development. 32 : 473-485.
Sejiwa. 2006. Bullying :Mengatasikekerasan di sekolahdanlingkungansekitaranak. PT Grasindo,
Jakarta.
Sullivan, K., M. Cleary and G. Sullivan. 2004. Bullying in secondary schools. Paul Chapman
Publishing, London. Quarterly. 30 (1): 37 - 49.
Swearer. S. M. 2008. Relational aggression: Not just a female issue. Journal of School Psycholog.
46: 611 – 616.
Underwood, M. K. and L. H. Rosen. 2011. Gender and bullying: Moving beyond mean differences
to consider conceptions of bullying, processes by which bullying unfolds, and cyber bullying.
In Espelage, D. L. and S. M. Swearer.Bullying in North American schools.(2ndEd.).Routledge,
New York.
Vaillancourt, T., P. M. Dougall, S. Hymel and S. Sunderani. 2010. Respect or fear? The
relationship between power and bullying behavior. In Jimerson, S. R., S. M. Swearer and D.
L. Espelage. Handbook of bullying in schools: An international perspective.Routledge, New
York.
Walden, L. M. and T. N. Beran. 2010. Attachment quality and bullying behavior in school-aged
youth. Canadian Journal of School Psychology. 25(1): 5 - 18.
Yaakub, N. F., R. Nagappan and A. J. Jusoh. 2008. Bullying among Malaysian Elementary School
Children.Source http: //mahdzan.com/papers/bully/bully.asp. April 28, 2013.
388
Public Health Department, Faculty of Sports Science, F1 Building, 2nd
Floor, Sekaran Campus Gunungpati, Semarang City, Central Java Province, Indonesia, 50229 Phone/ Fax. +6224 8508007
ATTITUDE AND SATISFACTION LEVEL AMONG USERS OF FACEBOOK AS A LEARNING MEDIUM IN FACULTY OF HEALTH SCIENCES UKM MALAYSIA
Ismarulyusda Ishak, Syarif Husin Lubis, Yanti Rosli
University Kebangsaan Malaysia, Malaysia
Corresponding Author: [email protected]
Abstract
Introduction: Facebook as a learning tool is explored as an extension of online classroom
environment. This study determines the attitude and satisfaction level of using Facebook as a
learning medium among students of the Faculty of Health Sciences, UKM.
Methods: A cross sectional study was conducted. Respondents recruited were all undergraduate
students enrolling Anatomy (NB1074) and Biostatistics (NB3073) courses during the 2011/2012
academic session. Lecturers teaching these courses created Facebook accounts group accessible
by students for learning purposes.
Results: The results showed that all students (n=162) have Facebook accounts. A total of 71.4%
and 62.7% of students enrolling in Anatomy and Biostatistics respectively used Facebook account
to communicate with their lecturers for at least once a week. 89% the students used Facebook as
a learning medium to get information regarding lectures and conducting assignments. Attitude and
satisfaction levels were similar for both male and female students. However, the level were
significantly higher (p<0.05) among Malay students.
Key Words: Facebook, learning medium, student, biostatistics, anatomy
Introduction
Facebook is a social networking website launched in February 2004. Facebook is one of
media which has become a significant part of our lives. Even though Facebook has a wide range of
users, majority of the active users are still the university students (Ellison et al. 2007). Ellison et al.
(2007) also reported that 94% of undergraduate students were active Facebook users, spending
10 to 30 minutes online each day communicating with their Friends List of 150 to 200 people.
Similarly, Wiley and Sisson (2006), conducted a large survey on college students from universities
in the Midwest United States, which indicated that 91% of students used Facebook. As a result,
Facebook encompasses a rich site for researchers‘ interest due to its heavy usage patterns and
technological capacities among university students.
The main usage of Facebook initially was to allow university students to create and maintain
social network between college and university students in different residence halls. Because of its
popularity among college students, the impact of Facebook usage on academic performance has
been debateable. Studies have shown that active engagement in Facebook was related to
student‘s involvement and academic success (Steinfield et al. 2008; Yu et al. 2010). It has been
reported that social networking with peers, lecturers and professors can be an ideal way to foster
positive relationships and for sharing knowledge (Yu et al. 2010). With better social acceptance
Public Health Department, Faculty of Sports Science, F1 Building, 2nd
Floor, Sekaran Campus Gunungpati, Semarang City, Central Java Province, Indonesia, 50229 Phone/ Fax. +6224 8508007
389
and support, a person will develop a higher level of self-esteem, satisfaction with university life and
consequently better performance academically.
Online learning through Facebook can help facilitate communication between lecturers and
university students. As a result usage of Facebook as a learning tool can create an online
classroom environment which could inspire many of the students to be more proactive in learning.
It is believed that proper usage of Facebook can aid to positive impact on students in learning and
development.
Interest in the integration of information and communication technologies (ICT) in education
has been growing since the advent of affordable personal computers and the invention of World
Wide Web in the 1980s. A great deal of studies relating to online learning, which had been
primarily focused on distance learners showed that online learning can be as effective as
traditional classroom learning for students (Johnson et al. 2000; Lin & Laffey 2006; Oravec 2003;
Russell 1999).
Study done by Rosaffri and Shabariah (2011) found that the learning method used in
networking site Facebook increased student motivation and understanding. Another study showed
that students supported the potential use of social networking for the purpose of teaching and
learning (Zaidatun et al. 2011). The objective of this study is to explore the usage of Facebook as a
learning medium and its relationship in assessed with achievement level, attitude and satisfaction
scores of students in the Faculty of Health Sciences, UKM Kuala Lumpur. This study will explore
the importance of using Facebook as a mediator communication for new learning purposes in
Universiti Kebangsaan Malaysia. Its usage will highlight the feasibility of current online technology
to support future learning purposes.
Methods
This cross-sectional study was conducted in the Faculty Health Science, University
Kebangsaan Malaysia. By using universal sampling, all undergraduate students enrolling for the
course of Biostatistics NB3073 and Anatomy NB1074 during second semester for the academic
session 2011/2012 were taken as respondents. Lecturers for these courses have created a Group
in the Facebook account which are accessible for students learning purposes. Dependent variable
in this research is attitude and satisfaction scores on the Facebook usage as learning medium
among students in Biostatistics NB3073 and Anatomy NB1074 courses. Independent variables in
this research are academic performance (Grade for these subjects for the last semester) and
gender. A structured questionnaire which contained two sections was used. Section A consisted of
respondent‘s demographic information which included gender, age and program. Section B
contained questions on attitude and satisfaction. The Cronbach alpha for attitude and satisfaction
were 0.754 and 0.872 which showed a good internal consistency. Data from the questionnaire
were analysed using SPSS 20.0. The statistic tests employed for relationship and correlation were
390
Public Health Department, Faculty of Sports Science, F1 Building, 2nd
Floor, Sekaran Campus Gunungpati, Semarang City, Central Java Province, Indonesia, 50229 Phone/ Fax. +6224 8508007
Spearman correlation and Chi Square. Whilst comparison of scores between gender and race
were tested by Independent t-test and Mann Whitney U test.
Results and Discussion
A total of 134 students and 28 students enrolling in Biostatistics and Anatomy were involved.
The study found that the female student were 88% (n=143). The mean age of subjects was 22
years. A total of 63 % of subjects were Malays. About 51% of the recruited subjects were from
Biomedical Sciences Programme, followed by Nutrition (20%), Dietetic (12%), Audiology and
Speech (6%) and Environmental Health (4%). The data revealed that most of the students
obtained grade B for Biostatistics (49%) followed by grade A (48%) and grade C (2%). Contrast for
anatomy course, most of the students obtained grade C (48%) followed by grade B (38%) and
grade A (3%).
All subjects had Facebook accounts and 69% (n=20) of Anatomy students used Facebook
account to communicate with their lecturer for at least once a week and only 27.6% (n=8) more
than twice a week. As much as 62% (n=84) Biostatistics students communicated at least once a
week and 37% (n=50) communicated more than twice a week.
Most of the students used Facebook as learning medium to get information regarding
lectures and assignment (n=144) and discussed with friends on the subjects (n=134) and they
frequently used Facebook as learning medium when they carry out their assignments (n=139) and
when they had difficulty in understanding what they had learned in classes (n=74). Applications
that were frequently used in Facebook were Groups (n=150), Picture, link and document sharing
(n=93), Chatting (n=85) and Wall Post (n=74). Besides using Facebook, they were also used
Wikispaces (26 %), e-spin (27 %), Google (3%) and email (11%). About 33 % of them stated that
Facebook was the easiest tool to use as a learning medium.
Attitude score was higher among male students compared to female, however Mann-
Whitney U test indicated that there was no significant different in attitude level between gender U =
1124, p=0.22 (Figure 1). When the attitude score compared between race, the result showed
Malay students have higher attitude score (median rank=87) compared to Non Malays (median
rank=71) U=2407, p=0.027 (p<0.05).
Satisfaction level was compared between gender and races. An independent t test showed
there was no significant different in satisfaction level between gender t(160)= -0.895, p>0.05.
However there was significant different in satisfaction level between Malay and Non Malay t(160)=
2.296, p<0.05 as shown in Table 1. The Malay students showed higher satisfaction level (32.8 +
6.24 (n=103)) compared to Non Malay (30.5 + 6.0 (n=59)).
Public Health Department, Faculty of Sports Science, F1 Building, 2nd
Floor, Sekaran Campus Gunungpati, Semarang City, Central Java Province, Indonesia, 50229 Phone/ Fax. +6224 8508007
391
Table 1. Distribution of satisfaction level by gender and races
The study found no association between frequency of using Facebook as learning medium
and student‘s grade in both Anatomy course( 2= 2.131, p>0.05) and Biostatistics course(2=3.129,
p>0.05). This study also found weak correlation (p>0.05) between satisfaction and attitude level
with student‘ grade for both Anatomy and Biostatistics course (Table 2).
Table 2. Spearman Correlation between student‘s grade and attitude and satisfaction level
Internet usage is no longer merely for obtaining information but is for reaching and affects
various aspects of daily work. The way we communicate has changed tremendously compared to
a decade ago, where we use the Internet to communicate by using e-mail, Skype, yahoo
messenger and Facebook. This indirectly enhances the communication process in a variety of
transactions in the education, business sector, entertainment, broadcasting and administration
(Mohd Hajiman Mat Jusak 2002). All students registered for both Anatomy and Biostatistics
courses at FSK, UKM had a Facebook account. Almost all of the subjects used Facebook for
learning purposes at least once a week. This study showed that frequency of using Facebook as a
learning medium has weak relationship with the student‘s grade. Similar findings were reported by
Kolek &Sunder (2008) and Pasek et al. (2009). In their study, the differences in grades between
Facebook profile users and non-Facebook profile users were not significant. However, both studies
did not explore the activities or tasks that the students were participating while logging on
Facebook. In our study, we evaluated the types of application frequently used by the students on
Facebook. The most frequent application used was ‗group‘ follow by ‗share document/link/picture‘.
We also examined the frequency and reasons for using Facebook as a learning medium.
Junco (2011) reported that there was positive correlation between grade and Facebook
usage when students use the social network for information collection and sharing. However, in our
study, there was no significant relationship with the student‘s grade possibly because most of the
students (88.9%) used Facebook to obtain information about lectures and assignment instead of
discussing about the lessons that were taught. A study by Junco et al. (2011) also supported the
idea that online activities through Twitter resulted in better academic outcomes. Even though the
Satisfaction score Mean + standard deviation (n)
Gender Female
Male
32.1 + 6.3(n=143)
30.7 + 5.9 (n=19)
Races Malay
Non Malay
32.8 + 6.24 (n=103)
30.5 + 6.0 (n=59)
Student‘s grade Attitude level Satisfaction level
Biostatistics
r = -0.123
p>0.05
r=0.03
p>0.05
Anatomy
r= -0.34
p>0.05
r=0.203
p>0.05
392
Public Health Department, Faculty of Sports Science, F1 Building, 2nd
Floor, Sekaran Campus Gunungpati, Semarang City, Central Java Province, Indonesia, 50229 Phone/ Fax. +6224 8508007
medium of learning was not Facebook, it was acceptable to relate that certain types of Facebook
activities if used wisely by students can led to increase in student engagement hence improving
the grade.
However, in a different study by Krischner & Karpinski (2010), it was reported that there was
a negative correlation between time spent on Facebook and students grade. The study did not
specify the actual time spent on using Facebook as a learning tool. Instead, the usage of Facebook
was more for personal and social interaction like uploading photographs, chatting and updating
status. A study done by Syarif et al. (2012) also found that there was no correlation between time
spent on Facebook and student‘s cumulative grade point average (CGPA).
Student‘s achievement and satisfaction contributing to course outcomes were investigated.
In our study, there were no significant different in attitude level between genders. Gender
differences exist in many disciplines including technology. Male students were previously
perceived to have better knowledge in computer technology and higher computer self-efficacy,
hence it would increase the attitude towards online learning. However, a recent study done by
Mohd Anuar & Erda Yumiza (2010) found that female and male students had equal ability in e-
learning usage. This could be possibly explained that gender inequality in technology has improved
with time.
In our study, there was a significant difference between attitude between Malays and non-
Malays. The Malay students have a higher satisfaction level when compared to the non Malays.
Research by Janarthini et al. (2007) also revealed that Malay students were more interested to use
e-learning compared with Chinese students.
Closing
As a conclusion, all students who participate in this study used Facebook as learning
medium. Female and male students have equal attitude and satisfaction level on using Facebook
as learning tool. Malay students have high attitude and satisfaction level as compared to Non-
Malay students. Frequency on using Facebook as learning tool does not influence student‘s
achievement in Biostatics and Anatomy courses. Finally, attitude and satisfaction level of using
Facebook as learning tool do not influenced student‘s grade in Biostatistics and Anatomy courses.
We would like to thank Universiti Kebangsaan Malaysia for providing the research grant
UKM-PTS-2013-142 and Biostatistics and Anatomy student‘s session 2011/2012, Faculty of Health
Science (FSK), Universiti Kebangsaan Malaysia (UKM) who participated in this study as subjects.
Finally special thanks to Siti ‗Aishah Ismail, Siti Suhana Ismail, Norfasihah Raob, Roshila Bujang
and Melanie Yeoh from NNPD6014 for the data collection and analysis for this manuscript.
References
Acquisti, A. & Gross, R. 2006. Imagined Communities: Awareness, Information Sharing and
Privacy on The Facebook. Proceedings of the 6th Workshop on Privacy Enhancing
Technologies 2006.
Public Health Department, Faculty of Sports Science, F1 Building, 2nd
Floor, Sekaran Campus Gunungpati, Semarang City, Central Java Province, Indonesia, 50229 Phone/ Fax. +6224 8508007
393
Boyd, B.M. & Ellison, N.B. 2007. Social Network Sites: Definition, History, and Scholarship. Journal
of Computer-Mediated Communication. 13(1).
Dwyer, C., Hiltz, S.R. & Passerini, K. 2007. Trust and privacy concern within social networking
sites: A comparison of Facebook and MySpace. Proceedings of the Thirteenth Americas
Conference on Information Systems, 2007.
Ellison, N.B., Steinfeld, C. & Lampe, C.2007. the benefits of Facebook ―friends‖: Social capital and
college students‘ use of online social network sites. Journal of Computer Mediated
Communication. 12: 1143-1168.
Janarthini a/p Krishnan, Mohd Haruzuan Mohamad Said, Noor Azean Atan & Johari Hassan. 2007.
Faktor-faktor yang mempengaruhi pengguaan e-pembelajaran di kalangan pelajar tahun
akhir Fakulti Pendidikan, Universiti Teknologi Malaysia. 1st International Malaysian
Educational technology convention. 2007: 1150-1155.
Johnson, S.D., Aragon, S.R., Shaik, N. & Palma-Rivas, N. 2000. Comparative analysis of learner
satisfaction and learning outcomes in online and face-to -face learning environments. Journal
of Interactive Learning Research. 11(1): 29-49.
Junco, R. 2011. The relationship between frequency of Facebook use, participation in Facebook
activities and student engagement. Computers and Education.
Junco, R. Heiberger, G. & Loken, E. 2011The effect of Twitter on college student engagement and
grades. Journal of Computer Assisted Learning. 27(2): 119- 132.
Kolek, E.A. & Saunders, D. 2008. Online disclosure: An empirical examination of undergraduate
Facebook profile. NAPSA Journal. 45(1): 1-25.
Krischner PA. & Karpinski. 2010. Facebook and academic performance. Computer in Human
Behaviour. 26: 1237-1245.
Lampe, C., Ellison, N. & Steinfield, C. 2007. A Face(book) in the crowd: Social searching versus
social browsing. Proceedings of the 20th Anniversary Conference on Computer Supported
Cooperative Work 2007, pg. 167-170.
Lin, Y. & Laffey, J. 2006. Exploring the relationship between mediating tools and student
perception of interdependence in a CSCL environment. Journal of Interactive Learning
Research. 17(4): 385-400.
Mohd Anuar Abdul Rahman & Erda Yumiza Ibrahim. 2010. Penggunaan E-Pembelajaran Dan
Hubungannya Dengan Pencapaian Akademik Pelajar di Fakulti Pendidikan, Universiti
Teknologi Malaysia, Skudai, Johor. Tesis Universiti Teknologi Malaysia.
Mohd Hajiman Mat Jusak. 2002. Penggunaan Internet dan Faktor-faktor yang Mempengaruhi
Pengguna/pelanggan Internet di kalangan Guru Pelatih Kursus Diploma Perguruan Malaysia
(KDPM) Maktab Perguruan Batu Lintang (MPBL) ambilan Januari 2002. Proceedings of the
Seminar on Information and Communication Technology in Education, 2002.
Ong, C.H. & Lai, J.2006. Gender differences in perceptions and relationships among dominants of
e-learning acceptance. Computers in Human Behavior. 22(5): 816-829.
Oravec, J. A. 2003. Blending by blogging: Weblogs in blended learning initiatives. Journal of
Educational Media. 28(2-3): 225-233.
Pasek, J., More, E. & Hargittai, E. 2009. Facebook and academic performance: Reconciling a
media sensation with data. First Monday 14 (5).
QuantCast. 2012. ―Profile for Facebook.com,‖ Quantcast, http://www.quantcast.com/facebook.com,
(accessed on Mac 28, 2012).
Rossafri M. & Shabariah M.S. 2011. Kesan Penggunaan Laman Sosial ke atas Kaedah
Perbincangan di dalam Pengajaran dan Pembelajaran Mata Pelajaran Sejarah. Jurnal
Teknologi Pendidikan Malaysia. 1(1): 75-80.
Russell, T. L. 1999. No significant difference phenomenon. Raleigh, NC: North Carolina State
University.
394
Public Health Department, Faculty of Sports Science, F1 Building, 2nd
Floor, Sekaran Campus Gunungpati, Semarang City, Central Java Province, Indonesia, 50229 Phone/ Fax. +6224 8508007
Syarif Husin Lubis, Saiful Ridzuan, Ismarulyusda Ishak, Hidayatul Fathi Othman, Nihayah
Mohammed, Zariyantey Abdul Hamid, Nor Najwatul Akmal, Norazizah, Nurul Farahana,
Shahida, Shanti, Nor Zafirah, Leong, L.H. & Mohd Izham. 2012. The relationship between
time spent on facebook and cumulativegrade point average(CGPA) among 3rd year
biomedical science students in faculty health sciences, UKM. Procedia-Social and Behavioral
Sciences.60:590-595
Steinfield, C., Ellison, N.B. & Lampe, C. 2008. Social capital, self-esteem and use of online social
network sites: A longitudinal analysis. Journal of Applied Developmental Psychology. 29:
434-445.
Stutzman, F. 2006. Student Life on the Facebook http://chimprawk.blogspot.com/2006/01/student-
life-on-facebook.html (accessed on March 28, 2012).
Wiley, C. & Sisson, M. 2006. Ethics, accuracy and assumption: the use of facebook by students
and employers. Dayton, OH: The Southwestern Ohio Council for Higher Education Special
Topics Forum.
Yu, A.Y., Tian, S.W., Vogel, D. & Chi-Wai Kwok, R. 2010. Can learning be virtually boosted? An
investigation of online social networking impacts. Computers & Education. 55: 1494-1500.
Zaidatun, T., Linggu, J.S. & Jamalludin, H. 2011. Penggunaan Alat Rangkaian Sosial di kalangan
Pelajar di sebuah IPTS di Kota Kinabalu, Malaysia. Jurnal Teknologi Pendidikan Malaysia.
1(1):31-47.
Public Health Department, Faculty of Sports Science, F1 Building, 2nd
Floor, Sekaran Campus Gunungpati, Semarang City, Central Java Province, Indonesia, 50229 Phone/ Fax. +6224 8508007
395
ANDROID APPS FOR INDONESIAN ADOLESCENTS NUTRITION
Ratri Ciptaningtyas
UIN Syarif Hidayatullah, Indonesia
Corresponding Author: [email protected]
Abstract
Introduction: The period of adolescence is the peak of the fastest growing after a toddler, besides physical development occurs secondary for reproduction. Often the adolescent body image is negative, it means always looking at her fat so they limit the amount of food consumed. Though teen requires energy and the amount of food with sufficient nutrients to meet its needs for growth and development. Methods: Android Application Adolescent Nutritional Status Checks were made for the Android operating system platform and can run for Android version 2.2 and above. The Android operating system generally uses the Java programming language. Applications are then uploaded to the portal's official Android app, Google Play Store. Results: This android application user's response is still low due to limited marketing but the authors are optimistic that these applications can be one of the interactive media health promotion for adolescents. Key Words: Application, android, education, nutrition, adolescents, smartphone Introduction
The period of adolescence is the peak of the fastest growing after a toddler, besides physical
development occurs secondary for reproduction. Often the adolescent body image is negative, it
means always looking at her fat so they limit the amount of food consumed.The perception of body
image was a significant risk factor for food consumption and it was found that 41.1% young
adolescence felt themselves havier than their weight (Kusumaja et al, 2008).
The eating behaviour of young people become increasingly under the spotlight in recent
years. Variation in young people‘s dietary intake is likely to reflect foods available and the values
and circumstances of their neighoborhood at home and school, as much as the adolescents‘own
motivations. Some adolescents will be involved in the purchase and preparation of food at home,
and many will choose their own meals at school, they can also refuse food offered to them.
Looking at patterns of eating behaviour in situations in which young people are likely to be able to
make personal choices may provide a useful complement to assessing dietary intake (Johnson et
al, 2002). National and International health promotion programmes are needed to improve
adolescents'food habits (Veerecken, 2005).In the case of Indonesia, prevalence of obesity is
emerging as a public health problem (Usfar et. Al., 2010). Current data showed 11.7% of
adolescents were obese (Riskesdas, 2010).
The development of smartphones has led to a proliferation of smartphone software
applications (―apps‖). From a public health perspective, smartphone apps can potentially
396
Public Health Department, Faculty of Sports Science, F1 Building, 2nd
Floor, Sekaran Campus Gunungpati, Semarang City, Central Java Province, Indonesia, 50229 Phone/ Fax. +6224 8508007
enhance the delivery of health behavior change interventions to individuals en masse and result
in favorable cost-utility (Hebden et al, 2012).
Mobile phone applications allow software to get in the hands of billions of people. As of
November 2011, there are currently 5.3 billion mobile subscribers. (Mobithinking, 2011). Mobile
phone has special characteristics among others are portable, unlike most computers, and easy to
take with users to the gym. As we know, there are three major markets for distributing mobile
phone applications: the iPhone App Store, the Android Market, and the Windows Mobile
Marketplace.
Android is open source and this open source code and permissive licensing allows the
software to be freely modified and distributed by device manufacturers and enthusiast developers
(Lemos, 2012).The development of android had 28% of the market in August 2011 (Hebden et al,
2012). The Windows Mobile Marketplace has been going steadily downhill and, as of May 2011,
only had 6% of the mobile market share (Wilhelm, 2011). According to research from Pohl (2011)
in Hebden et al (2012), the Android Market predicted to have as many users as Apple's App Store
by the end of 2011; the developing market for Android is a smart choice for a developer to make.
The number of smartphone selling in Indonesia is rapidly increasing by 40% in 2012 (Sutriyanto,
2012).
According to the Academy of Nutrition and Dietetics (Academy 2012) there are several
applications for diet and to control their nutritional goals according to the user ideal weight. For
example, Calorie Counter, Calorie Counter & Diet Tracker, Diet Point and Daily Burn are
applications that allow counting calories and contain food databases and allow monitoring of
weight loss. There are limited app on nutrition knowledge for Indonesian, therefore this app is the
first app for Indonesian adolescents to know their nutritional status, eating habits and body image.
Methods
The applications development process consisted of five stages: (1) requirement; (2) selecting
patform; (3) design and development; (4) integration; and (5) testing, designed by
budidanbadu.com.
Stage 1 requirement: The first stage of this process involved defining the purpose of each
app. The application were made for Adolescent Nutritional Status Checks.This required specifying
the relevant public health guidelines to inform the goals for nutritional status, eating habits and
body image, the visuals or graphic design, and the potential data to be collected. With this stage,
the application developer can define the solution, flow and features that exist in the application.
Stage 2 selecting patform: Android application for Adolescent Nutritional Status Checks were
made for the Android operating system platform and can run for Android version 2.2 and above.
The Android operating system generally uses the Java programming language. Applications are
then uploaded to the portal's official Android app, Google Play Store.
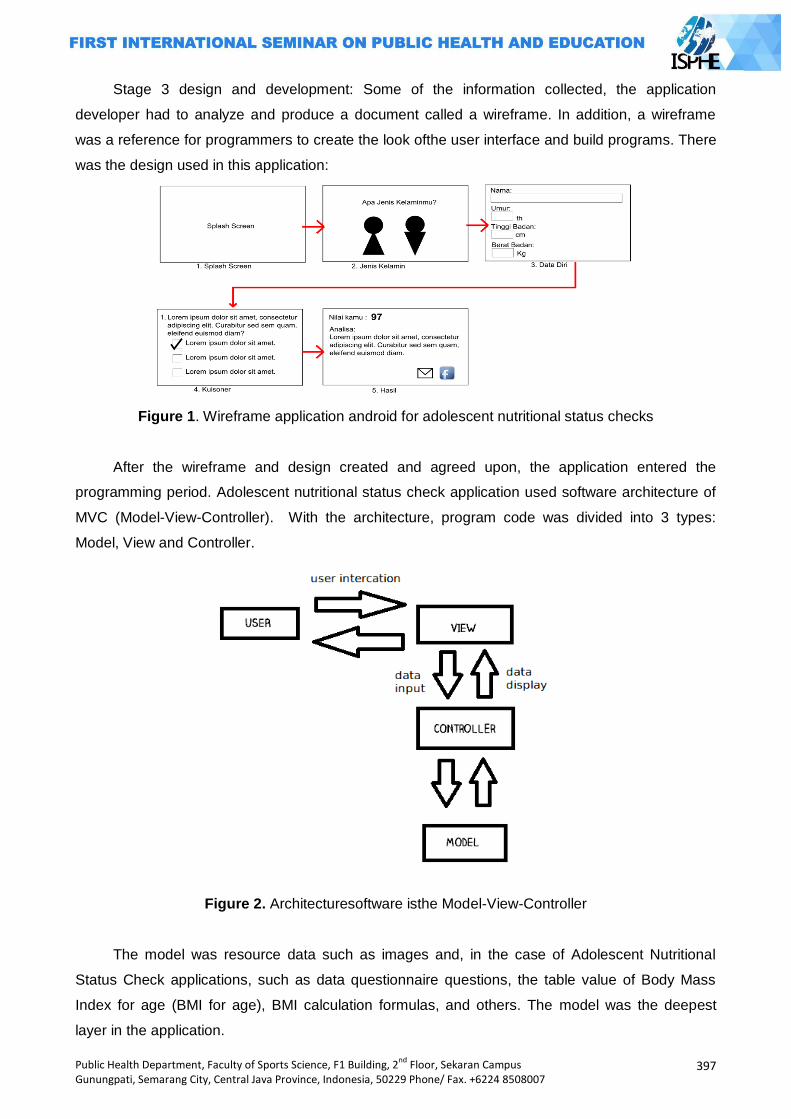
Public Health Department, Faculty of Sports Science, F1 Building, 2nd
Floor, Sekaran Campus Gunungpati, Semarang City, Central Java Province, Indonesia, 50229 Phone/ Fax. +6224 8508007
397
Stage 3 design and development: Some of the information collected, the application
developer had to analyze and produce a document called a wireframe. In addition, a wireframe
was a reference for programmers to create the look ofthe user interface and build programs. There
was the design used in this application:
Figure 1. Wireframe application android for adolescent nutritional status checks
After the wireframe and design created and agreed upon, the application entered the
programming period. Adolescent nutritional status check application used software architecture of
MVC (Model-View-Controller). With the architecture, program code was divided into 3 types:
Model, View and Controller.
Figure 2. Architecturesoftware isthe Model-View-Controller
The model was resource data such as images and, in the case of Adolescent Nutritional
Status Check applications, such as data questionnaire questions, the table value of Body Mass
Index for age (BMI for age), BMI calculation formulas, and others. The model was the deepest
layer in the application.
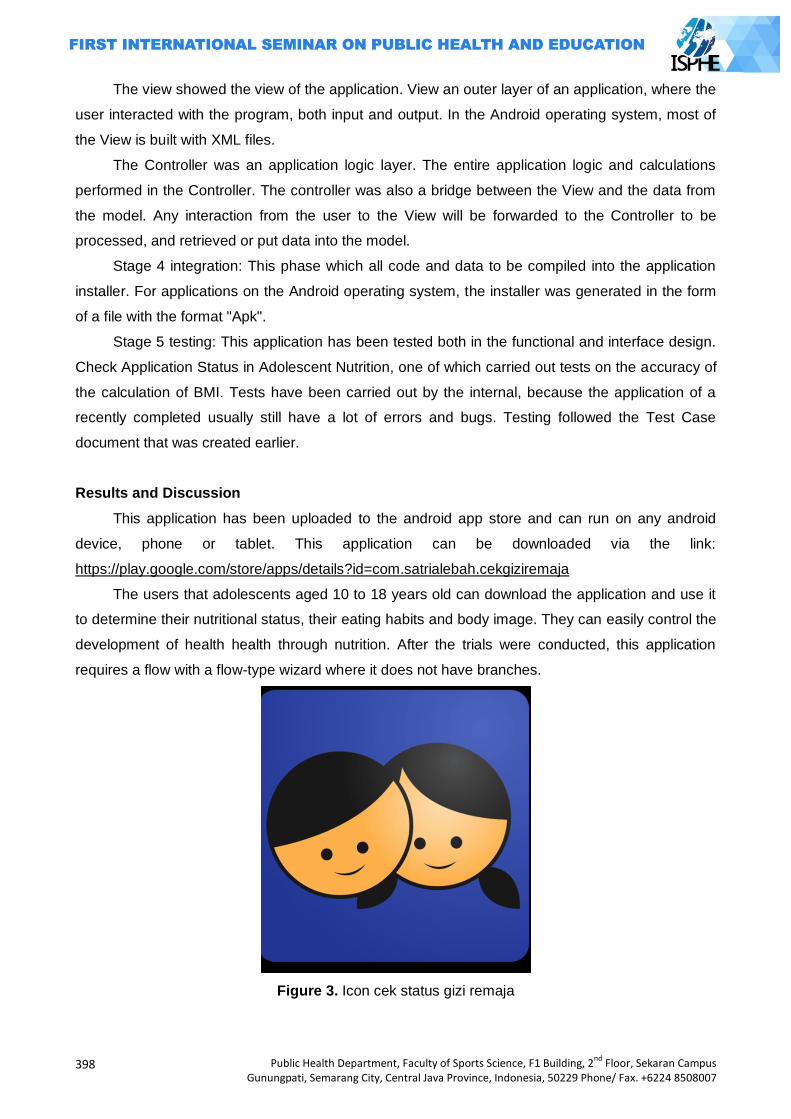
398
Public Health Department, Faculty of Sports Science, F1 Building, 2nd
Floor, Sekaran Campus Gunungpati, Semarang City, Central Java Province, Indonesia, 50229 Phone/ Fax. +6224 8508007
The view showed the view of the application. View an outer layer of an application, where the
user interacted with the program, both input and output. In the Android operating system, most of
the View is built with XML files.
The Controller was an application logic layer. The entire application logic and calculations
performed in the Controller. The controller was also a bridge between the View and the data from
the model. Any interaction from the user to the View will be forwarded to the Controller to be
processed, and retrieved or put data into the model.
Stage 4 integration: This phase which all code and data to be compiled into the application
installer. For applications on the Android operating system, the installer was generated in the form
of a file with the format "Apk".
Stage 5 testing: This application has been tested both in the functional and interface design.
Check Application Status in Adolescent Nutrition, one of which carried out tests on the accuracy of
the calculation of BMI. Tests have been carried out by the internal, because the application of a
recently completed usually still have a lot of errors and bugs. Testing followed the Test Case
document that was created earlier.
Results and Discussion
This application has been uploaded to the android app store and can run on any android
device, phone or tablet. This application can be downloaded via the link:
https://play.google.com/store/apps/details?id=com.satrialebah.cekgiziremaja
The users that adolescents aged 10 to 18 years old can download the application and use it
to determine their nutritional status, their eating habits and body image. They can easily control the
development of health health through nutrition. After the trials were conducted, this application
requires a flow with a flow-type wizard where it does not have branches.
Figure 3. Icon cek status gizi remaja
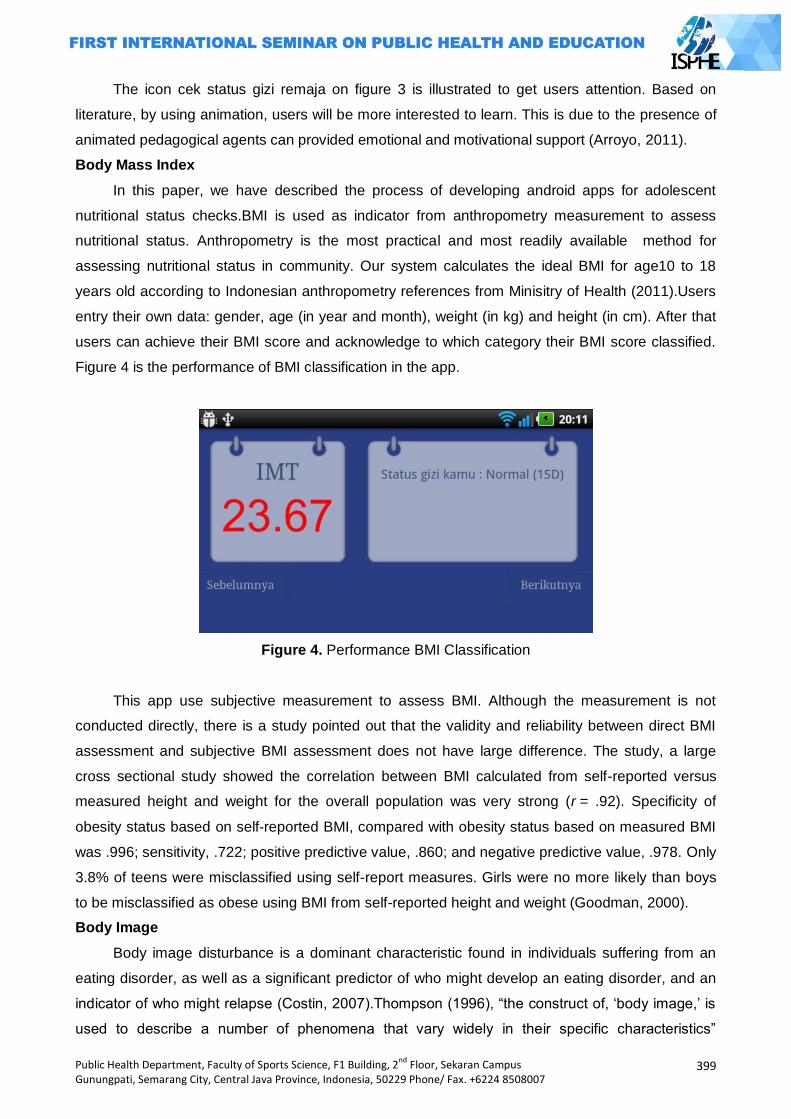
Public Health Department, Faculty of Sports Science, F1 Building, 2nd
Floor, Sekaran Campus Gunungpati, Semarang City, Central Java Province, Indonesia, 50229 Phone/ Fax. +6224 8508007
399
The icon cek status gizi remaja on figure 3 is illustrated to get users attention. Based on
literature, by using animation, users will be more interested to learn. This is due to the presence of
animated pedagogical agents can provided emotional and motivational support (Arroyo, 2011).
Body Mass Index
In this paper, we have described the process of developing android apps for adolescent
nutritional status checks.BMI is used as indicator from anthropometry measurement to assess
nutritional status. Anthropometry is the most practical and most readily available method for
assessing nutritional status in community. Our system calculates the ideal BMI for age10 to 18
years old according to Indonesian anthropometry references from Minisitry of Health (2011).Users
entry their own data: gender, age (in year and month), weight (in kg) and height (in cm). After that
users can achieve their BMI score and acknowledge to which category their BMI score classified.
Figure 4 is the performance of BMI classification in the app.
Figure 4. Performance BMI Classification
This app use subjective measurement to assess BMI. Although the measurement is not
conducted directly, there is a study pointed out that the validity and reliability between direct BMI
assessment and subjective BMI assessment does not have large difference. The study, a large
cross sectional study showed the correlation between BMI calculated from self-reported versus
measured height and weight for the overall population was very strong (r = .92). Specificity of
obesity status based on self-reported BMI, compared with obesity status based on measured BMI
was .996; sensitivity, .722; positive predictive value, .860; and negative predictive value, .978. Only
3.8% of teens were misclassified using self-report measures. Girls were no more likely than boys
to be misclassified as obese using BMI from self-reported height and weight (Goodman, 2000).
Body Image
Body image disturbance is a dominant characteristic found in individuals suffering from an
eating disorder, as well as a significant predictor of who might develop an eating disorder, and an
indicator of who might relapse (Costin, 2007).Thompson (1996), ―the construct of, ‗body image,‘ is
used to describe a number of phenomena that vary widely in their specific characteristics‖
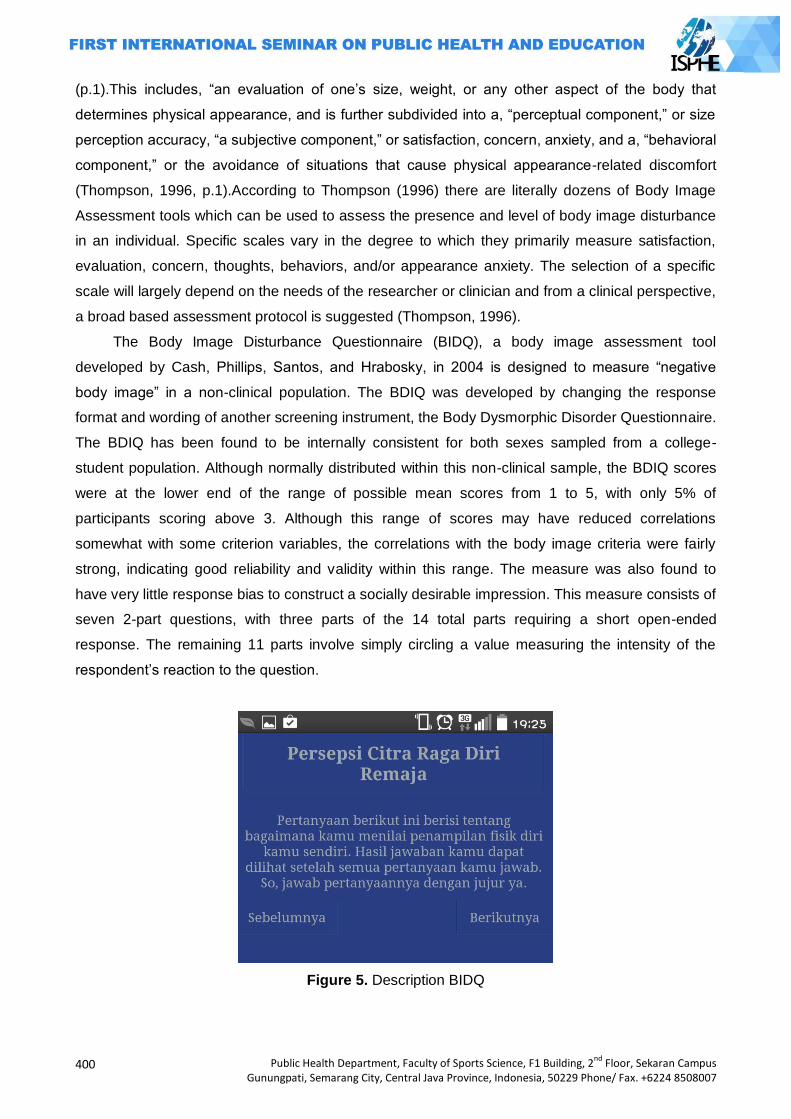
400
Public Health Department, Faculty of Sports Science, F1 Building, 2nd
Floor, Sekaran Campus Gunungpati, Semarang City, Central Java Province, Indonesia, 50229 Phone/ Fax. +6224 8508007
(p.1).This includes, ―an evaluation of one‘s size, weight, or any other aspect of the body that
determines physical appearance, and is further subdivided into a, ―perceptual component,‖ or size
perception accuracy, ―a subjective component,‖ or satisfaction, concern, anxiety, and a, ―behavioral
component,‖ or the avoidance of situations that cause physical appearance-related discomfort
(Thompson, 1996, p.1).According to Thompson (1996) there are literally dozens of Body Image
Assessment tools which can be used to assess the presence and level of body image disturbance
in an individual. Specific scales vary in the degree to which they primarily measure satisfaction,
evaluation, concern, thoughts, behaviors, and/or appearance anxiety. The selection of a specific
scale will largely depend on the needs of the researcher or clinician and from a clinical perspective,
a broad based assessment protocol is suggested (Thompson, 1996).
The Body Image Disturbance Questionnaire (BIDQ), a body image assessment tool
developed by Cash, Phillips, Santos, and Hrabosky, in 2004 is designed to measure ―negative
body image‖ in a non-clinical population. The BDIQ was developed by changing the response
format and wording of another screening instrument, the Body Dysmorphic Disorder Questionnaire.
The BDIQ has been found to be internally consistent for both sexes sampled from a college-
student population. Although normally distributed within this non-clinical sample, the BDIQ scores
were at the lower end of the range of possible mean scores from 1 to 5, with only 5% of
participants scoring above 3. Although this range of scores may have reduced correlations
somewhat with some criterion variables, the correlations with the body image criteria were fairly
strong, indicating good reliability and validity within this range. The measure was also found to
have very little response bias to construct a socially desirable impression. This measure consists of
seven 2-part questions, with three parts of the 14 total parts requiring a short open-ended
response. The remaining 11 parts involve simply circling a value measuring the intensity of the
respondent‘s reaction to the question.
Figure 5. Description BIDQ
Public Health Department, Faculty of Sports Science, F1 Building, 2nd
Floor, Sekaran Campus Gunungpati, Semarang City, Central Java Province, Indonesia, 50229 Phone/ Fax. +6224 8508007
401
As shown in figure 5, next to BMI score is the brief description about BDIQ and the
instruction for users to answer questions. Score will be obtained after all questions are answered.
Users can get information to which classification of body image from the result and motivation
words to boost their mood if they include in negative body image classification.
Adolescent Food Habits Checklist (AFHC)
Variation in young people‘s dietary intake is likely toreflect foods available and the values
and circumstances ofparents, school and peers, as much as the adolescents‘ ownmotivations.
Nonetheless, there are many opportunities for youngpeople to make personal food choices, which
makes itimportant to examine the more voluntary aspects of healthyeating. Most adolescents are
economically active, at least tothe extent of having the resources to buy snacks, and theyconsume
snack foods more frequently than adults (Johnson 2002).
Most instruments focus on nutrient intake, which has been measured using various methods
of dietary recall, dietary records and food frequency questionnaires, but Kristal et al (1990)
developed a more comprehensive, novel fat-related healthy habits, which was later expanded to
incorporate fibre-related items . This scale asks questions about modification of foods so as to
lower their fat content, avoidance of high-fat foods, substitution of low-fat alternative foods, and
selection of fruit, vegetables and other high-fibre foods.
The Adolescent Food Habits Checklist (AFHC), aims to provide a measure of adolescent
healthy eating behaviour with reference to those situations in which young people are likely to have
a degree of personal control. It addresses areas in which adolescents may be able to affect how
closely their diets conform to guidelines on healthy eating, with reference to the avoidance of
specific energy-dense foods, selection of low-fat alternatives, consumption of fruit and vegetables
and snacking behaviour.Many of the items of the AFHC refer to low-fat eating behaviours.
Johnson (2002) found out correlations between measures indicate a good level of
convergent validity, and the checklist is also shown to have high internal and test-retest reliability.
This means the focus on choices available to adolescents means that the checklist will provide a
useful addition to food frequency-type approaches to the measurement of adolescent eating
behaviour.
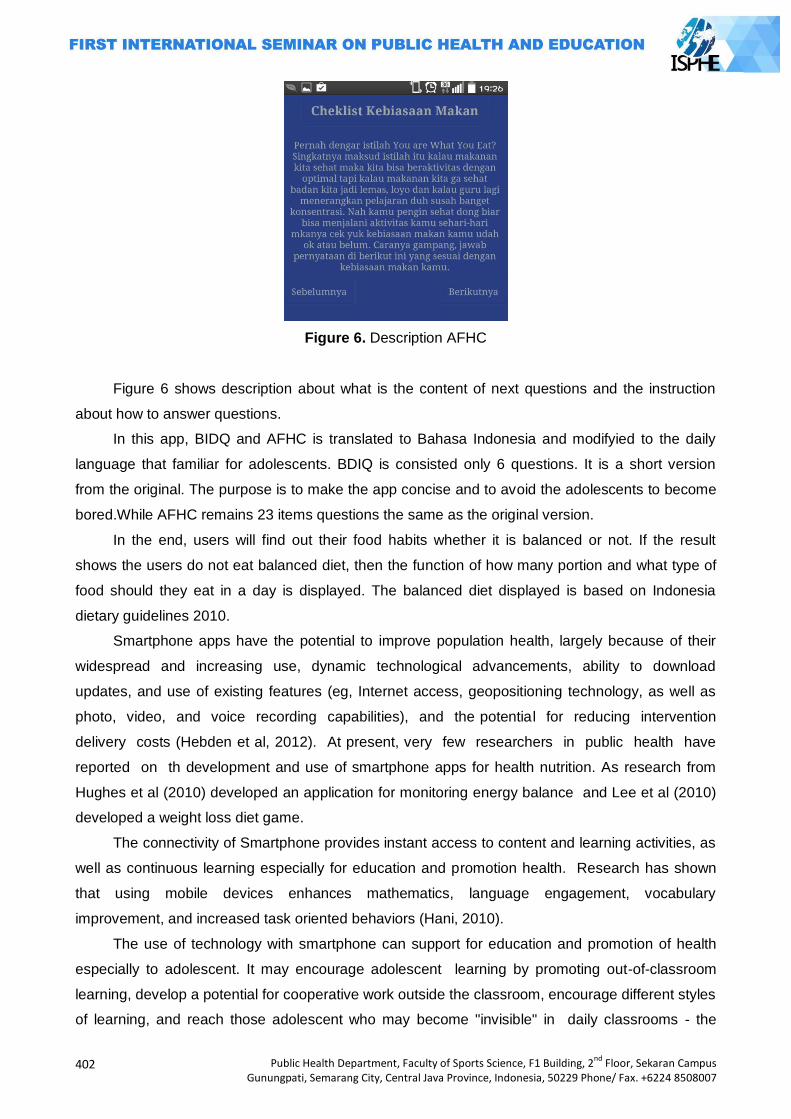
402
Public Health Department, Faculty of Sports Science, F1 Building, 2nd
Floor, Sekaran Campus Gunungpati, Semarang City, Central Java Province, Indonesia, 50229 Phone/ Fax. +6224 8508007
Figure 6. Description AFHC
Figure 6 shows description about what is the content of next questions and the instruction
about how to answer questions.
In this app, BIDQ and AFHC is translated to Bahasa Indonesia and modifyied to the daily
language that familiar for adolescents. BDIQ is consisted only 6 questions. It is a short version
from the original. The purpose is to make the app concise and to avoid the adolescents to become
bored.While AFHC remains 23 items questions the same as the original version.
In the end, users will find out their food habits whether it is balanced or not. If the result
shows the users do not eat balanced diet, then the function of how many portion and what type of
food should they eat in a day is displayed. The balanced diet displayed is based on Indonesia
dietary guidelines 2010.
Smartphone apps have the potential to improve population health, largely because of their
widespread and increasing use, dynamic technological advancements, ability to download
updates, and use of existing features (eg, Internet access, geopositioning technology, as well as
photo, video, and voice recording capabilities), and the potential for reducing intervention
delivery costs (Hebden et al, 2012). At present, very few researchers in public health have
reported on th development and use of smartphone apps for health nutrition. As research from
Hughes et al (2010) developed an application for monitoring energy balance and Lee et al (2010)
developed a weight loss diet game.
The connectivity of Smartphone provides instant access to content and learning activities, as
well as continuous learning especially for education and promotion health. Research has shown
that using mobile devices enhances mathematics, language engagement, vocabulary
improvement, and increased task oriented behaviors (Hani, 2010).
The use of technology with smartphone can support for education and promotion of health
especially to adolescent. It may encourage adolescent learning by promoting out-of-classroom
learning, develop a potential for cooperative work outside the classroom, encourage different styles
of learning, and reach those adolescent who may become "invisible" in daily classrooms - the
Public Health Department, Faculty of Sports Science, F1 Building, 2nd
Floor, Sekaran Campus Gunungpati, Semarang City, Central Java Province, Indonesia, 50229 Phone/ Fax. +6224 8508007
403
quiet and under-served. Learning about health nutrition can be supported everywhere by
adolescents with their Smartphone.
Smartphone apps may be an innovative medium for delivering individual health behavior
change intervention en masse .Researchers or health professionals considering developing an
app in their area must give careful consideration to the target population in terms of their access,
ability to adopt this form of intervention, and preferences regarding the design, the current
technologies available for app development, existing commercial apps, and the possibility that
their use will be irregular and short-lived (Hebden et al, 2012).
Users can share their score result to email or facebook. This is built for socializing the app as
well as to encounter adolescents peer group socialization need. However, developer can not
access their email nor facebook because there is no function to do so.
This application has been downloaded by more than 5,000 users so far and received 4.1 star
rank based on 1 to 5 star rank. Only 1 user vote 1 star and the rests mostly vote 4 star. Based on
the achievement, the app is well functioned and users found no difficulties on using the app.
Closings
This android application user's response is still low due to limited marketing and perhaps due
to limited coverage of internet in rural areas but authors are optimistic that these applications can
be one of the interactive media health promotion for adolescents. The limitations of this app are the
questions are not validated through back to back translation, the BIDQ is not original and the
balanced diet recommendation is not uptodate. Future research should be done to update the app,
to revise and to validate questionnaires and to observe the characteristic of users and the benefit
of this app quantitatively and qualitatively.
Reference
Academy of Nutrution and Dietetics, Media Press Room Read. 2012. Recuperado el 20 de 07 de 2012, de Academia de Nutricion y Dietetica: http://www.eatright.org/Media/content.aspx?id=6442467041.
Arroyo, I., Woolf, B. P., Cooper, D. G., Burleson, W., & Muldner, K. 2011. The impact of animated pedagogical agents on girls' and boys' emotions, attitudes, behaviors and learning. In Advanced Learning Technologies (ICALT), 2011 11th IEEE International Conference on (pp. 506-510). IEEE.
Costin, C. (2007). The Eating Disorder Sourcebook. New York: McGraw Hill. Goodman, E., Hinden, B. R., & Khandelwal, S. 2000. Accuracy of teen and parental reports of
obesity and body mass index. Pediatrics, 106(1), 52-58.
Hani M. 2010. Using handheld wireless technologies in school: Advantageous or disadvantageous? Childhood Education. Retrieved from http://www.freepatentsonline.com/article/Childhood-Education/245884637.html.
Hebden. Lana, A.Cook, H.P. van der Ploeg, M.Allman. 2012. Development of Smartphone Applications for Nutrition and Physical Activity Behavior Change. JMIR Research Protocol, 1 (2): 1-12.
Hughes DC, Andrew A, Denning T, Hurvitz P, Lester J, Beresford S, et al. 2010. BALANCE (Bioengineering Approaches for Lifestyle Activity and Nutrition Continuous Engagement): developing new technology for monitoring energy balance in real time. Journal Diabetes Sci Technol, 4(2):429-434.
404
Public Health Department, Faculty of Sports Science, F1 Building, 2nd
Floor, Sekaran Campus Gunungpati, Semarang City, Central Java Province, Indonesia, 50229 Phone/ Fax. +6224 8508007
Johnson. F, J. Wardle, and J. Griffith. 2002. The Adolescent Food Habits Checklist: Reliability and Validity of a Measure of Healthy Eating Behaviour in Adolescents. European Journal of Clinical Nutrition, 56: 644–649.
Kristal AR, Shattuck AL, Henry HJ. 1990. Patterns of dietary behavior associated with selecting diets low in fat: reliability and validity of a behavioural approach to dietary assessment. J. Am. Diet. Assoc., 90: 214-220.
Kusumaja. Ngrah, N. K. Wiardami.,and I. W. Juniarsama. 2008. Persepsi Remaja terhadap Body Image (Citra Tubuh) Kaitannya dengan Pola Konsumsi Makan dan Status Gizi. Jurnal Skala Husada, 5(2): 114-125.
Lee W, Chae YM, Kim S, Ho SH, Choi I. 2010. Evaluation of a mobile phone-based diet game for weight control. J Telemed Telecare,16(5):270-275.
Lemos, Robert. 2012. Open source vulnerabilities paint a target on Android March 25, 2011, accessed on July 2014.
Ministry of Health. 2011. Buku Saku Antropometri 2010. http://gizi.depkes.go.id/wp-
content/uploads/2011/11/buku-sk-antropometri-2010.pdf accessed on January 2012.
Mobithiking. 2011. Global mobile statistics 2011: All Quality Mobile Marketing Research, Mobile Web Stats, Subscribers, Ad Revenue, Usage, Trends. mobiThiking Mobile marketing tools
Stats corner. Retrieved from http://mobithinking.com/mobile-marketing-tools/latest-mobile-stats.
Riskesdas 2010. Kementrian Kesehatan Republik Indonesia Sutriyanto,E. 2012. Number of Android Users Up 40 Percent per
Year.http://www.tribunnews.com/bisnis/2012/11/16/jumlah-pengguna-android-naik-40-per-tahun accessed on July 2014.
Thompson, K. (1996). Body Image, Eating Disorders, and Obesity. Washington, DC: American Psychological Association.
Usfar, E. 2010.Lebenthal, Atmarita, E. Achadi, Soekirman and H. Hadi. Obesity as a poverty-related emerging nutrition problems: the case of Indonesia. Obesity reviews 11, 924–928
Vereecken. Carin. A, S.D. Henauw and L. Maes. 2005. Adolescents' food habits: results of the Health Behaviour in School-aged Children survey. British Journal of Nutrition, 94: 423-431.
Wilhelm, Alex. 2011. Microsoft's mobile market share continues to erode. Microsoft: Part of the Next Web Family. Retrieved from http://thenextweb.com/microsoft/2011/07/05/microsofts-mobile-market-share-continues-to-erode/.

Public Health Department, Faculty of Sports Science, F1 Building, 2nd
Floor, Sekaran Campus Gunungpati, Semarang City, Central Java Province, Indonesia, 50229 Phone/ Fax. +6224 8508007
405
HEALTH AND PHYSICAL EDUCATION
AT SCHOOL
PAPERS

406
Public Health Department, Faculty of Sports Science, F1 Building, 2nd
Floor, Sekaran Campus Gunungpati, Semarang City, Central Java Province, Indonesia, 50229 Phone/ Fax. +6224 8508007
Public Health Department, Faculty of Sports Science, F1 Building, 2nd
Floor, Sekaran Campus Gunungpati, Semarang City, Central Java Province, Indonesia, 50229 Phone/ Fax. +6224 8508007
407
CONSOLIDATION OF PROFESSIONAL COMPETENCE IN SCHOOL PHYSICAL EDUCATION
TEACHER
Nurhadi santoso
Yogyakarta State University, Indonesia
Corresponding Author: [email protected]
Abstract
Physical education teacher educators as a human being should always make changes in the
organizing process of learning, so that learning is done always the latest, inovatife, following the
development of learners, as well as the development of science and technology. There are still
many physical education teachers are always satisfied with the learning outcomes that have been
done, without any changes from time to time so monotonous in organizing the learning process.
Physical education teachers should be able to develop the ability of competence for want you
want to progress in the implementation of the learning process is done. Good physical education
teacher and successful in improving the quality of learning, if the physical education teachers are
always willing to upgrade their competencies which include: pedagogical, professional
competence, personal competence and social competence.
Fourth competence should be an integral and physical education teachers should possess in
order to run the classroom learning to work well. Professional competence closely with the physical
education teacher's ability to develop knowledge in the field of physical education as a whole.
Key Words: Consolidation, professional competence
Introduction
In connection with the role of education, civilized people who at least have the common
sence that education has a very important role for human life. Education is obtained from basic
education to higher education may affect human development in all aspects of the personality and
life. Education has the power dynamic in order to prepare human life in the future. Education
should be able to develop the potential of a variety of learners optimally, the development potential
of individual students as high as in the physical, intellectual, emotional, social, and spiritual
according to the stage of development as well as physical characteristics and socio-cultural
environments that exist. This means that education is a conscious effort undertaken, it means
educating the action is not a reflex action or spontaneous without a clear purpose and a plan, but
rather an act of rational, deliberate, prepared, planned to achieve a particular goal (Taufiq Agus,
Puji Lestari Prianto Hera Lestari Mikarsa, 2012)
Physical education as a subject in schools both elementary school through high school has a
very important role to help the harmonious development of the learners. Subjects of physical
education as an integral part of the educational process as a whole. Therefore, physical education
should be carried out either at each level of education in order to improve skills, physical fitness,
and health students. Improving the quality of the learning process of physical education is required

408
Public Health Department, Faculty of Sports Science, F1 Building, 2nd
Floor, Sekaran Campus Gunungpati, Semarang City, Central Java Province, Indonesia, 50229 Phone/ Fax. +6224 8508007
in order to develop the potential of learners optimally. Physical education teachers must have four
competencies unanimously to be applied in any learning process of physical education. Thus,
physical education teacher has a daunting task to improve the quality of the learning process.
By supporting a good learning process, a physical education teacher must master the
theories associated with learning materials, learning theory, master the skills of practice in the field.
One of the factors supporting the successful implementation of their lessons physical education
teachers, physical education teacher must always increase their professional competence. Mastery
of professional competence is very important in relation to the physical education teacher tenure:
1) control of the education foundation; 2) control of the teaching materials; 3) develop teaching
programs; 4) implement teaching programs; 5) assessing the learning outcomes and processes
that have been implemented. during this time, both physical education teachers in primary and
secondary education always feel satisfied with what they have learned. Though the science and
technology is always changing mengukuti the times, as well as teaching physical education will be
a little much always changes leading to better things.
Conversation about how to improve the quality of teaching, during the last few years is lifted
into national focus. This issue is recognized as a fundamental problem that must be solved,
although among physical education teachers in the field, almost always argued that improved
quality is difficult due to lack of facilities and infrastructure. According Rusli Lutan, et al. (2002: 76)
"The process of teaching physical education has several factors. At the micro level, there are four
main elements, namely the purpose, substance (teaching task), methods and strategies, and
assessment and evaluation ". These four elements can not be separated from each other. All
knowledge related to all four of the above is the professional competence of a physical education
teacher in implementing the learning process in each day. Therefore, strengthening the
professional competence of teachers of physical education should be improved so that the learning
and innovation always learning interesting and fun.
Results and Discussion
Definition of stabilization
Physical education teacher part of the overall teachers in schools is a factor that is very
dominant and important in formal education in general as for students of physical education
teachers often used as a role model, even making self-identification figure. Therefore, physical
education teachers have adequate behavior and competence to develop learners as a whole.
Thus, all the behavior and performance during the execution of the learning process that has been
done will imprint physical education teacher and a lot of coloring the lives of learners present and
future. There is a teacher who is applauded for having good competence in implementing the
learning, and there are teachers who scorned and reviled because of lack of competence.
It is appropriate that physical education teachers should continuously strengthen its
competence. Competencies required of teachers of physical education include: professional
Public Health Department, Faculty of Sports Science, F1 Building, 2nd
Floor, Sekaran Campus Gunungpati, Semarang City, Central Java Province, Indonesia, 50229 Phone/ Fax. +6224 8508007
409
competence, pedagogical competence, social competence, and personal competence.
Stabilization is derived from the root word which relay of solid steady, remain (unchanged).
Stabilization comes from the word that gets steady prefix and suffix which implies a process, a
way, the act established. In this case, the stabilization of this term implies a process and a way to
steady the ability of competence. The process of strengthening the competence of teachers of
physical education can be acquired education, training, experience, and always trying to improve
the knowledge of the field of duty.
Definition of competence
In everyday life the term competence and competent same interpreted, but in certain cases
this term differ in the extent to its meaning. Competent is a skill that takes a person who is shown
by its ability to consistently provide adequate performance level or higher in a specific job function.
While the competence implies possession of knowledge, skills, and abilities required by the
particular position. Thus, clearly different between the competent level of quality and competence.
If the required skills are competent, while the competencies required knowledge, keterampailan
and ability in completing a job.
Competence is derived from the English proficiency connote competency, capability, and
authority. According to Nana Syaodih Djam'an cited Satori, et al. (2011) stated competencies that
lead to the achievement of the performance goals completely to the desired condition. While
Mulyasa E. (2004) stated competence is a combination of knowledge, skills, values and attitudes
are reflected in the habit of thinking and acting.
According to Law 14 of 2005 on Teachers and Lecturers, "Competence is a set of
knowledge, skills and behaviors that must be owned, lived and ruled teacher and lecturer
professionalism in performing the task". While the Indonesian dictionary states the sense of
competence is the power to determine or decide a case.
Based on some opinions on the above can be summarized as follows: competence is a set
of knowledge, skills, abilities and attitudes that must be owned, lived, and dominated by a physical
education teacher who comes from the process of education, training, and experience in order to
perform tasks in a professional teaching.
Professional competence
Professional competence is one of the basic capabilities that a teacher should possess.
According Coopeer cited by Djam'an Satori, et al. (2011) there are 4 components of professional
competence, namely: (1) has knowledge about learning and human behavior; (2) have mastered
the knowledge and cultivated fields of study; (3) have the right attitude about yourself, school,
peers and cultivated fields of study; (4) have the skills in teaching techniques.
According to the Department of Education, there are 10 basic abilities of teachers, namely:
(1) mastery learning materials as well as basic scientific concepts; (2) management of teaching
and learning program; (3) classroom management; (4) the use of media and learning resources;
(5) mastery of the foundations of education; (6) management of teaching and learning interactions,

410
Public Health Department, Faculty of Sports Science, F1 Building, 2nd
Floor, Sekaran Campus Gunungpati, Semarang City, Central Java Province, Indonesia, 50229 Phone/ Fax. +6224 8508007
(7) assessment of student achievement; (8) the introduction and guidance and counseling
programs, i) the introduction and administration of school; (10) understanding of the principles and
utilization of research results for the benefit of improving the quality of education pengajatan. Thus,
it is clear that the task of the professional physical education teacher is very heavy. Physical
education teachers should always enriching knowledge related to the field of study that is taught,
the curriculum is applicable. With the current curriculum, physical education teachers have to learn
again what the content of the curriculum in 2013 and how the implementation process.
Field of study material mastery
Physical education teachers should really mastering the science and motor skills in the main
task of teaching. This is the first competency that must be owned by a physical education teacher
in implementing the learning process. Mastery of knowledge and skills for teachers of physical
education movement becoming a focus for teaching skills. What is meant by the ability to master
the material field of study (according Wijaya quoted by Djam'an Satori, et al., 2011) is the ability to
know, understand, apply, analyze, synthesize, and evaluate a number of knowledge skills taught.
There are two main things in the material master fields of study: namely 1) charge of the field
of study materials and school curriculum. Physical education teachers must master and
understand the applicable curriculum, then implemented into the learning process. The new
curriculum is current curriculum 2013, the physical education teacher should examine in depth the
contents of the 2013 curriculum in depth and comprehensive. To that end, a physical education
teacher should review the field of study curriculum materials, reviewing the content of textbooks
field of study into basic tasks, carrying out the activities suggested in the curriculum areas of study
that their main duty; 2) control of the deepening material / application field of study. This can be
done by means of physical education teachers: learn the relevant science, studying the application
of science into other disciplines, to learn how to assess studies curriculum.
Teaching and learning program management
Physical education teachers must master and practice in the field with good management of
the teaching program. It is important for teachers of physical education because the learning
process is mostly done outside the classroom. Thus, the management of teaching and learning
program is much more difficult than teaching in the classroom. The ability to manage a program of
teaching and learning to do physical education teachers include formulating instructional
objectives, the ability to know and use methods of teaching, the ability to select and develop
appropriate instructional procedures, the ability to recognize the potential of learners, and the
ability to plan and carry out remedial teaching.
The method of teaching is one of the components that should be present in the learning
activities. Basically a way of teaching method or technique used by teachers in interaction with
learners during the learning process is ongoing. There are a few principles to consider the physical
education teacher in the use of this teaching method, the principle factor is mainly related to the
development of the ability of learners, including: (Udin S. Winataputra, 2004) a) teaching method

Public Health Department, Faculty of Sports Science, F1 Building, 2nd
Floor, Sekaran Campus Gunungpati, Semarang City, Central Java Province, Indonesia, 50229 Phone/ Fax. +6224 8508007
411
should allow can arouse curiosity more students to the subject matter, b) teaching method should
allow dapatmemberikan opportunities for creative expression in the art aspect, c) teaching method
should allow students to learn through problem solving, d) method of teaching should allow
students to always want to test the truth of something, e) teaching method should allow the student
to do something against the topic discovery issues, f) teaching method allows the student to be
able to listen, g) teaching method should allow students to learn independently, h) method teaching
should allow students to learn together, and i) teaching method should allow students to be more
motivated in learning.
Classroom management
Traffic is a portrait of physical education teachers' skills in designing, managing and
arranging learning resources, in order to create an atmosphere of learning that is effective and
efficient. This is done by regulating the formation of a lineup that allows teachers to control the
students' physical education, prevent the occurrence of commotion in the classroom, students
create gerknya easy task. The main purpose of making physical education program is to provide
and deliver a variety of movement experiences to form a solid foundation of motion, which in turn is
expected to affect an active lifestyle and healthy (Adang Suherman and Agus Mahendra. 2001).
Classroom management includes all actions taken physical education teachers to apply their
learning to take place smoothly from one activity to another, from the beginning of lessons until
after the lesson. Classroom management skills are very important in good teaching. Good
classroom management practices, implemented by physical education teachers in any learning
process will result in the development of self-management skills to good students as well.
According to Weber, quoted olehUdin S. Winataputra (2004) suggests three terms of
classroom management. These three classes according to Weber's understanding of management
as follows: 1) classroom management is a series of activities that teachers do to encourage
behavior that is expected of students and eliminate unwanted behavior, 2) classroom management
is a series of activities that teachers do to develop interpersonal relationships both climate and
socio-emotional positive class, 3) classroom management is a series of activities that teachers do
to create and maintain an effective classroom organization.
Classroom management techniques must be pursued by the physical education teachers in
order not to interfere with the learning aspect. Factors to consider in the selection of physical
education teachers the proper management strategy is (Depdiknas, 2003). (1) level of maturity of
the students and their relationship with others; (2) number of devices, number of students, space,
time constraints, learning objectives; (3) teacher's personality.
Effective classroom management will be realized by implementing the following steps:
(Depdiknas, 2003) such as: (1) set class rules; (2) commenced on time; (3) arrange lessons; (4)
classify students; (5) utilize the space and equipment; (6) end the lesson.
When the management of this class can be applied and implemented will result in the
learning process goes smoothly, orderly, safe, and achievement of learning objectives will be
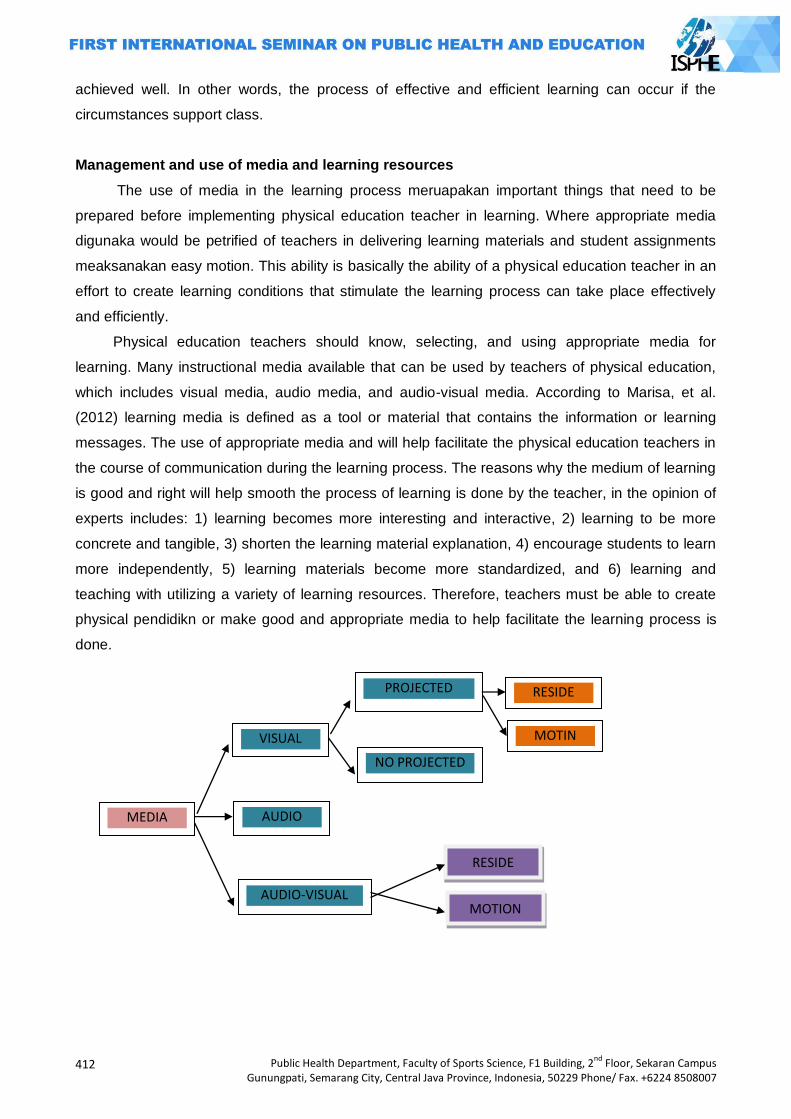
412
Public Health Department, Faculty of Sports Science, F1 Building, 2nd
Floor, Sekaran Campus Gunungpati, Semarang City, Central Java Province, Indonesia, 50229 Phone/ Fax. +6224 8508007
achieved well. In other words, the process of effective and efficient learning can occur if the
circumstances support class.
Management and use of media and learning resources
The use of media in the learning process meruapakan important things that need to be
prepared before implementing physical education teacher in learning. Where appropriate media
digunaka would be petrified of teachers in delivering learning materials and student assignments
meaksanakan easy motion. This ability is basically the ability of a physical education teacher in an
effort to create learning conditions that stimulate the learning process can take place effectively
and efficiently.
Physical education teachers should know, selecting, and using appropriate media for
learning. Many instructional media available that can be used by teachers of physical education,
which includes visual media, audio media, and audio-visual media. According to Marisa, et al.
(2012) learning media is defined as a tool or material that contains the information or learning
messages. The use of appropriate media and will help facilitate the physical education teachers in
the course of communication during the learning process. The reasons why the medium of learning
is good and right will help smooth the process of learning is done by the teacher, in the opinion of
experts includes: 1) learning becomes more interesting and interactive, 2) learning to be more
concrete and tangible, 3) shorten the learning material explanation, 4) encourage students to learn
more independently, 5) learning materials become more standardized, and 6) learning and
teaching with utilizing a variety of learning resources. Therefore, teachers must be able to create
physical pendidikn or make good and appropriate media to help facilitate the learning process is
done.
MEDIA
VISUAL
AUDIO
NO PROJECTED
MOTIN
AUDIO-VISUAL
RESIDE
MOTION
PROJECTED RESIDE

Public Health Department, Faculty of Sports Science, F1 Building, 2nd
Floor, Sekaran Campus Gunungpati, Semarang City, Central Java Province, Indonesia, 50229 Phone/ Fax. +6224 8508007
413
Base of Education Mastery Platform
A physical education teacher must understand the foundations of education. It is very
important to improve the quality and process of education in general. The ability to master the
foundations of education related to the following activities: (Djam'an Satori, et al., 2011) a) learn
the concepts and issues of education and teaching at an angle a review sociological, philosophical,
historical, and psychological. b) know the function of the school as a social institution that can
advance any potential community in the broadest sense and mutual influence between the school
and community, c) recognizing the characteristics of learners physically and psychologically.
Physical education teachers who understand, understand and master the foundations of
education will be able to realize that education focused on national education goals. Thus, physical
education as an integral part of the overall education members will be able to contribute
significantly to the achievement of educational goals.
Ability to assess achievement and learning
The ability to assess learning achievement needs to be owned by the physical education
teacher. The ability to assess learning achievement in question is the ability to measure changes in
student behavior and the ability to measure proficiency in teaching himself and in making the
program. Thus, physical education teachers are expected not only able to assess learners'
behavior changes after following some learning process, but also to be able to assess its ability to
convey what is good learning material yet, easy to understand or difficult to be understood by
learners, it is interesting and fun yet in the delivery of learning materials.
In every work of assessing learning preatasi there are three objectives to be achieved,
namely: (Djam'an Satori, et al., 2011). (1) in the form of achievement in terms of numbers and
value behavior; (2) a statement of teaching accomplishments environment observed through
prestasiyang awards for achievement; (3) excellence program that made the teacher, because it is
relevant to the needs of learners and the environment.
So far, only a few physical education teachers who want to assess the performance itself
against what is done in the process of learning is good what is not, the program has been running
well made or not. Some of the activities that teachers can do in assessing learners achievement for
teaching interests are as follows: 1) study the function evaluator, 2) learn the various techniques
and procedures for assessment, 3) develop techniques and procedures for assessment, 4) learn
techniques and selection criteria assessment procedures, 5) using techniques and assessment
procedures, 6) using assessment results to improve teaching and learning, 7) assess the
techniques and assessment procedures, and 8) to assess the effectiveness of the teaching
program.
Understanding the principles and management institute in the school education program
In addition to implementing learning activities, physical education teachers should carry out
the task assigned learning process. Tasks outside the responsibilities of teaching, physical
education teachers, among others, managing the school health program, extracurricular, and

414
Public Health Department, Faculty of Sports Science, F1 Building, 2nd
Floor, Sekaran Campus Gunungpati, Semarang City, Central Java Province, Indonesia, 50229 Phone/ Fax. +6224 8508007
guidance and counseling, as well as other tasks that dibabankan school physical education
teacher to both at school and outside of school. According to Nawawi quoted by Djam'an Satori, et
al. (2011: 2.30) are expected to assist teachers in meeting the principals pendidikanlainya activities
outlined in the curriculum, teachers need to understand the basic principles of organization and
management of schools, guidance and counseling, including career guidance, and extracurricular
kokurikuler programs, school libraries as well as matters related matters.
Skilled provide assistance and guidance to students
Physical education teachers can be likened to a journey mentor for students in which the
teacher is assigned to teach in order to achieve competence. As a physical education teacher who
is closer to the student participants must have the ability to 1) identify the needs of students, 2) to
plan and manage the participation of students in the physical and mental learning, 3) plan and
provide meaningful learning for student life. Help and guidance of teachers to students is very
necessary so that learners can develop their ability through teaching and learning in the classroom.
Physical education teachers in delivering learning materials more associated with motor skills
in performing various physical activities, physical education teacher should be able to choose
appropriate teaching methods in facilitating learners master the skills given. Motion tasks
performed by current students to follow the learning process of physical education there are easy
and some are difficult, for the physical education teachers should have a technique to provide
assistance and help to the students easily perform tasks such motion.
Ability to understand the characteristics of students
Physical education teachers are required to have a deeper understanding of the
characteristics and development of learners where sekilah assigned to teach in both primary and
secondary schools. After physical education teachers to know and understand the characteristics
of learners of teaching, then adjust the material to be taught in accordance with the characteristics
of learners. According to Rochman Natawijaya cited by Djam'an Satori, et al. (2011: 2:32)
pemahanan encompasses the understanding of the student's personality and the factors that
influence the development, individual differences among learners, needs, motivation and mental
health of learners, developmental tasks that need to be understood at a certain age levels , as well
as the phases of development experienced by them.
By understanding the phases of development of the student participants, physical Education
teacher will not have difficulty in conveying motion task to be learned by the students. Physical
education teacher who understands the nature and enjoyment of children will strive to develop the
learning process to be enjoyable and fulfilling the desire to move learners. Physical education
teachers understand the characteristics of learners will attempt to memgembangkan motion tasks
in accordance with the stages of physiological development of learners.
Capable of conducting school administration
In addition to carrying out activities that are academic, physical education teachers must be
able to organize and assist the school administration. According to Ary Gunawan cited by Djam'an

Public Health Department, Faculty of Sports Science, F1 Building, 2nd
Floor, Sekaran Campus Gunungpati, Semarang City, Central Java Province, Indonesia, 50229 Phone/ Fax. +6224 8508007
415
Satori, et al. (2011: 2:32) teachers are expected to: 1) recognize the good administration of school
activities, 2) assist in carrying out administrative activities of the school, 3) overcoming the scarcity
of learning resources for themselves and for the school, and 4) guiding students pesrta caring and
learning tools learning resources appropriately.
In the administration of equipment for physical education learning activity is very important to
avoid the equipment is lost or broken. Procurement learning tool for physical education teachers
can do to meengtasi tudak lack or presence of equipment in schools by creating a mock model of
the tool itself or by modifying the tool. Schools in Indonesia largely deprived of tools and facilities
for physical education learning activities, for the physical education teachers must be able to create
and modify equipment and physical education learning facilities.
Understanding curriculum and development
One of the physical education teacher's job is to implement the curriculum as well as
possible. Therefore, the physical education teacher must understand the basic concepts and key
steps in the development of curriculum. Curriculum berkaku always changes at any time. The
curriculum is dynamic and always require change and renewal in order to answer the demands
and needs of both individuals and society. According Rusli Lutan (2002: 52) states the
development of physical education curriculum is made by taking into account several factors,
namely 1) the needs and demands raised by changes sosioal containing the needs and demands
of the importance of physical activity and sport in general in order to solve social problems
memjawab , 2) changes in the environment around also affects the development of the curriculum,
and 3) the scientific evidence became strong foundation for the development of the physical
education curriculum.
Strengthening physical education teachers' professional competence
Strengthening professional competence can be done by physical education teachers in
various ways. The first way strengthen the professional competence of teachers of physical
education can be done with a lot more knowledge related reading materials in physical education
and always follow the development of the sport in general. Knowledge related to teaching
methods, teaching styles, and understand the applicable curriculum in depth both the concept and
its application in learning physical education. Physical education teachers should also be in
possession of technology such as computers and other electronic equipment in order to develop
instructional tools in the field of physical education.
There needs to be supervision of physical education directed at improving the quality of
physical education. Supervision required in physical education supervisor who serves as director,
mentor and motivator of physical education teachers in improving the quality of the learning
process. The position of supervisor is more appropriate as a teacher partners in solving problems
and generating change from within schools, so that the understanding of the physical education
supervisors must be comprehensive. According Rusli Lutan, et al. (2002: 116) says there are five
key concepts contained in the definition of physical education supervision, namely: 1) supervision
416
Public Health Department, Faculty of Sports Science, F1 Building, 2nd
Floor, Sekaran Campus Gunungpati, Semarang City, Central Java Province, Indonesia, 50229 Phone/ Fax. +6224 8508007
of physical education should directly affect the behavior and develop a physical education teacher,
especially in the design, manage, assess, and develop the learning process of physical education
in school. 2) the behavior of the physical education supervisor in helping physical education
teachers to develop professional skills and moral should be designed so officially, so focused on
specific goals expected. 3) supervision of physical education is a shared responsibility between the
supervisor of physical education and physical education teachers themselves. 4) the ultimate goal
of supervision is to make physical education physical education teachers more professionally and
morally capable of facilitating and managing learning in physical education for their students. 5)
supervision of physical education as a profession should be supported by relevant scientific
background and supported by various theories are needed.
There are several principles that must be considered in the implementation of the supervision
of physical education, among others, as follows: (Rusli Lutan, et al., 2002: 117-118): (1)
Supervision of physical education should be democratic; (2) supervision of the physical education
program should be an integral part of the overall educational program; (3) Supervision of physical
education should be comprehensive, meaning supervision of physical education programs should
include all aspects of the development of physical education lessons; (4) Supervision of physical
education should be constructive, meaning untukmeningkatkan and supervision aimed at
improving the quality of teaching physical education in schools, which in turn can improve the
quality of their students' behavior; (5) Supervision of physical education should be objective,
meaning that the design of programs, implementing, and evaluating the success of physical
education programs in schools, the supervision of physical education must be objective; (6)
Supervision of physical education should be done on an ongoing basis; (7) Supervision of physical
education should be able to create a harmonious human relationships; (8) Supervision of physical
education today should be able to apply the assumptions supervision of human resources and
supervision is also gus all human relationships; (9) Supervision of physical education should be
based on the philosophy and science, using scientific methods and attitudes, as long as the
scientific method and attitude it can be used
Physical education teachers can establish professional competence by being active in every
meeting physical education teachers (MGMPs Physical Education) for junior high and high school /
vocational school, whereas teachers of physical education in the primary school level joined KKG.
Through this activity, physical education teachers exchanging ideas to problems in the
implementation of the learning process of physical education in schools. In addition, through this
activity, physical education teachers can deliver the latest developments related to sports.
Closing
Education has the power dynamic in order to prepare the learner's life in the future.
Education should be able to develop the potential of a variety of learners optimally, the
development potential of individual students as high as in the physical, intellectual, emotional,
Public Health Department, Faculty of Sports Science, F1 Building, 2nd
Floor, Sekaran Campus Gunungpati, Semarang City, Central Java Province, Indonesia, 50229 Phone/ Fax. +6224 8508007
417
social, and spiritual according to the stage of development as well as physical characteristics and
socio-cultural environments that exist. Physical education teacher educators as part of the learners
at the school must equip themselves capability competence. With the ability of competencies
possessed by physical education teachers will have an impact on improving the quality of teaching
physical education.
Stabilization of the ability of professional competence can be developed and improve the
physical education teacher with a lot to read and understand the field of physical education and
pedagogical sciences. Physical education teachers should be active in MGMPs to discuss the
development of physical education. Physical education teachers should also actively participates in
trainings organized by the Department of Education related to the changes in the curriculum and
how the implementation of the curriculum in schools
References
Adang Suherman & Agus Mahendra. (2001). Menuju perkembangan menyeluruh, menyiasati
kurikulum pendidikan jasmani di Sekolah MenengahUmum. Jakarta: Departemen Pendidikan
Nasional, Direktorat Pendidikan Dasar Menengah Bekerjasama Dengan Direktorat Jenderal
Olahraga.
Agus Taufiq, Puji Lestari Prianto, Hera Lestari Mikarsa. (2012). Perkembangan Anak di SD.
Jakarta: Universitas Terbuka
Depdiknas. (2003). Kurikulum 2004 SMA, Pedoman khusus pengembangan silabus dan penilaian,
mata pelajaran pendidikan jasmani. Jakarta: Direktur Jenderal Pendidikan Dasar dan
Menengah, Direktorat Pendidikan Menengah Umum.
Djam‘an Satori, dkk. (2011). Profesi Keguruan. Jakarta: Universitas Terbuka
E. Mulyasa. (2014). Pengembangan dan implementasi Kurikulum 2013. Bandung: PT Remaja
Rosdakarya
Rusli Lutan, dkk. (2002). Supervisi Pendidikan Jasmani: Konsep dan Prktik. Jakarta: Departemen
Pendidikan Nasional
Udin S. Winataputra, dkk. (2004). Strategi Belajar Mengajar. Jakarta: Universitas Terbuka
418
Public Health Department, Faculty of Sports Science, F1 Building, 2nd
Floor, Sekaran Campus Gunungpati, Semarang City, Central Java Province, Indonesia, 50229 Phone/ Fax. +6224 8508007
MAINTENANCE AND MARKETING, PROBLEM OR CHALLENGE FOR SPORTS FACILITIES MANAGER?
Sulistiyono
Yogyakarta State University, Indonesia
Corresponding Author: [email protected]
Abstract Achievement promising sports, recreational sports and healthy sports, or educational sport
that has been established as a sport that will be developed in Indonesia must require facilities or infrastructure. Condition of sports facilities in Indonesia are generally very poor, the comfort and security as one of the indicators for sports facilities management are neglected. The maintenance for some sports facilities was abandoned because of minimum funds, or funds allocated for maintenance of sports facilities were corrupted so it needs attention and searching for solutions. There is a principle in management that states to leave some work to the experts. Manager or leader manager is the person responsible for the condition of sports facilities management. Managers need managerial skills, strong personality in managing sports facilities. The managers‘ mindset and decision making ability should be changed; the previous managers were passive, just spending budget turned to perform such maintenance functions of the facility in order to survive by trying to optimize the financial inclusion through marketing efforts. Maintenance and marketing of sports facilities might be problems or challenges? Utilization of sports facilities for various sports such as educational sports, achievement promising sports, recreational sports and fun sports might be the solution that we need to try to implement. Keywords: sports facilities, maintenance, marketing, managers
Introduction
Development and sports coaching for some recreational sports or educational sports in an
area can be done because it is supported by a variety of factors. A sports facility is one of the
important factors in the dynamics of the ongoing sports activities. The game of tennis can be
implemented if the tennis courts are available, badminton game will be enjoyed by the audience if
the gyms are available with all supporting facilities. Society can do jogging or a leisurely stroll
comfortably if sufficient area for jogging. Availability, safety, comfort, quality standard sports
infrastructure is also taken into consideration for the implementation of a sport activity.
Control or management of sports facilities in Indonesia are generally facing the same
problems, Manahan Stadium in Surakarta is an example for it. There is no budgetary support from
the government according to the managers so that it faces some difficulties in maintenance. Agoes
Soedarman, Head of Unit business Manahan Stadium quoted Arif (Suara Merdeka, 2010) states
without budgets the smooth management of the stadium will be disturbed, for in 2010 the fund may
still be sufficient, but for 2011 managers did not know yet whether there were sufficient funds for
employees‘ salary or for the maintenance of the stadium. Jalak Harupat Stadium in Bandung
district, also reported a loss in its management. According to the members of Parliament
Commission D, Dada Rusdiana, the income and expenditure of public funds for this stadium

Public Health Department, Faculty of Sports Science, F1 Building, 2nd
Floor, Sekaran Campus Gunungpati, Semarang City, Central Java Province, Indonesia, 50229 Phone/ Fax. +6224 8508007
419
should be audited because it is still a loss. Do not let it down due to some kind of mismanagement,
so that the stadium is neglected and even losing money every year (Tribune, 2009: 8). Complaints
also arise about the management of Mandala Krida Stadium in Yogyakarta. It is about the use of
the stadium for concerts whereas the grass field in this stadium is meant for sports function
(Kompas, 2008). Management staff faces some difficulties in maintenance due to lack of funds.
Sports facility management issues of the description above can be concluded due to lack of
funding. The cost of maintenance of sports facilities cannot be covered well by the manager. The
question comes up is if each fiscal year the manager was asked to prepare a work plan and budget
and all submissions are approved, is there any guarantee that all of these sports facilities will
function optimally managed according to the standards set. Model management of sports facilities
in Indonesia are generally managed by the government. And according to the authors, it showed
that the existing sports facilities have not been well maintained.
Fried (2005) states management (manager) of sports facilities play an important role in the
implementation of the dynamics of sports activities, sports facilities management has a significant
effect on the value of a sports event. Game or sporting event goes into an attractive and safe thing
due to the factors that sports facilities should be managed by a professional. Mismanagement of
sports facilities could lead into disaster. Business is an organization which is responsible for all
functions of sports facilities, thus managing to blame in this case from the owner (government),
managers, employees, errors perhaps because of the skills, knowledge, ethical or moral factors
may managers.
The model management of sports facilities in Indonesia
Managing an organization in various fields of life has different characteristics. Managing
organizations or activities in the field of sports, especially in an organization that is in charge of
managing sports facilities must be different with the organization in charge of preparing a team to a
championship, different organizations engaged in the field of education. Sports facilities such as
stadiums, sports hall, swimming pool, athletics track, basketball court has the characteristics of
specific management procedures.
Indonesian sports facilities in large part were owned by the government, the Ministry of
Education and Culture has a range of facilities that are in the scope of the school, from elementary
school level to university. Sports facilities owned by ABRI (Indonesian Armed Forces) of water
sports facilities, building or lot owned a football pitch. Local government level II and level I own and
manage a wide range of sports facilities in the area. Sports facilities only a small privately owned
by individuals or private companies, such as futsal fields currently widely established, fitness
center, and swimming pool.
Ownership of sports facilities will result in how the sports facilities management model that
effectively and efficiently. The sports facilities are privately owned (private) managed for the benefit
of the bulk of the business or its owners are very happy with the sports and sports facilities owned
volunteered for the development of sporting achievement. Various sports facilities owned by

420
Public Health Department, Faculty of Sports Science, F1 Building, 2nd
Floor, Sekaran Campus Gunungpati, Semarang City, Central Java Province, Indonesia, 50229 Phone/ Fax. +6224 8508007
private parties or individuals are generally well maintained and functioning optimally. Sports
facilities owned by the government as many complaints, the conditions are not maintained and are
not functioning optimally. Problems often complained Mass toilets are less comfortable, lights or
lighting that does not meet the standard. Soil quality is very hard, or not grassy football field.
Skills of sports facilities manager
The main functions of management are planning, organizing, doing, and evaluating. In the
management of sports facilities, the management does not mean only a person who was in
charge, management or human is a group of people who work together to achieve certain goals.
A group of people working together to achieve a common goal requires leaders called the
manager. The number of managers in an organization depends on how large the organization is,
from the highest managers (top manager), mid-level managers (midle manager), and lower-level
managers (low manager). The manager is the person responsible for coordinating all employees
and the components involved, ensuring that helps short-term management goals or long-term is
reached (Fried, 2005). The higher the position the manager who has the duty and responsibility
of the weight, the better and worst related functions and systems management.
Sports facilities owned by private parties, private and government in its management
handed over to a group of people who have structural organizations of different, but in terms of
who is most responsible for whether the facility can be maintained function or not, lies in the high
or top manager. Leader or chief administrator (manager) generally unwarranted damage which
manages sports facilities because of a lack of maintenance costs. A classic reason from time to
time if a job fails, a person tends to look for performance reasons without going to correct itself.
The question that needs to be contemplated in the entire facility manager or prospective sport
manager is if they are given the trust and asked to draft a work plan and costs, and entirely filled
and approved by the facility owner does want to give assurance that all sports facilities it
manages to function optimally?
Maintenance of Sports Facilities
The skill of sports facilities manager in maintaining sports facilities is one factor that must
be controlled by managers of sports facilities. Stadium, fitness center, athletic fields, badminton
hall, gymnasium, swimming pool have different skills or require different treatment. Managerial
skills to manage the study does not mean able to resolve or address the damage caused to
sports facilities, but how as a manager is able to maintain (prevent) or minimize damage,
maintain (restore function) if there is damage, and control all maintenance performance to run as
should. Maintenance of sports facilities has the following steps: 1) the program and planning, 2)
prepare the budget, 3) preparation and guidance to employees, 4) supervision and evaluation
(Fried, 2005).
Planning that should be done is making an inventory of all parts of the sporting facilities or
equipment under their responsibility. Which equipment on inventory requires routine
maintenance? Which part of sports facilities that are in need of care should suddenly change?
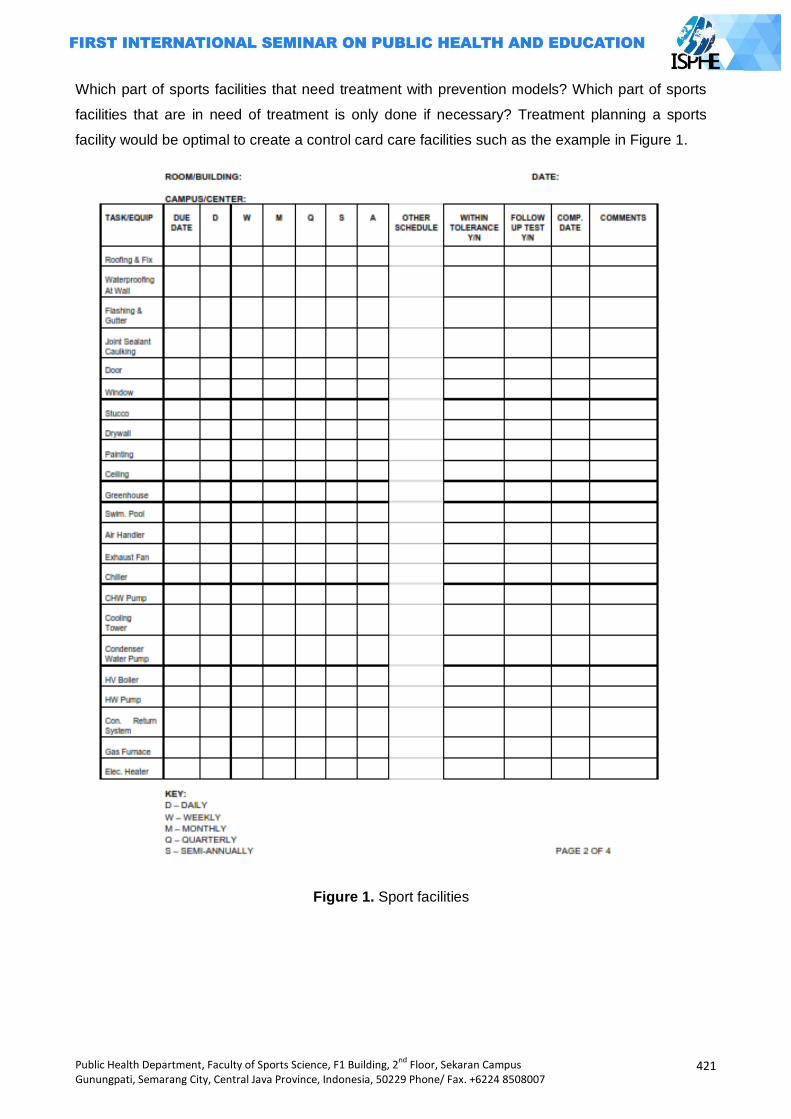
Public Health Department, Faculty of Sports Science, F1 Building, 2nd
Floor, Sekaran Campus Gunungpati, Semarang City, Central Java Province, Indonesia, 50229 Phone/ Fax. +6224 8508007
421
Which part of sports facilities that need treatment with prevention models? Which part of sports
facilities that are in need of treatment is only done if necessary? Treatment planning a sports
facility would be optimal to create a control card care facilities such as the example in Figure 1.
Figure 1. Sport facilities

422
Public Health Department, Faculty of Sports Science, F1 Building, 2nd
Floor, Sekaran Campus Gunungpati, Semarang City, Central Java Province, Indonesia, 50229 Phone/ Fax. +6224 8508007
Budgeting or provision of funds for the entire program and treatment planning of sports
facilities becomes something very important, because without any plan the budget will not be
implemented. The budget for the procurement of oil in the lawn mower equipment, if the
calculated nominal small amount such as Rp. 60,000, and takes 20 minutes, but if not budgeted
will result in damage to equipment valued at Rp. 15.000.000, -. Budgeting should be realistic, and
do the analysis, comparison of parts which need priority, what if in certain parts of the budget
cut? Some part of maintenance in several sports facilities is possible to use a contract system for
budget efficiency.
Sports facilities require human maintenance to perform various maintenance activities, man
must be managed for the purpose of maintenance can be achieved. The sections or departments
set up so that the work can be coordinated. Maintenance in facilities such as the football stadium
lawn care, maintenance and floor space, light treatments separated. Placement of employees
who have the competence and responsibility, the principle of the right man on the right job and
the right time. Employee training in the skills is necessary to improve. Employment status in the
management of facilities need attention related sports facilities manager with the ability to budget.
Model contract and permanent employees is a common employment status applied to the
management of sports facilities.
Sports facility maintenance program would be perfect if the function of monitoring and
evaluation is done well. Maintenance of sports facilities require very high maintenance costs. For
example, grass football stadium will be damaged quickly due to the use of unsupervised and
evaluated properly, even lawn care costs such as the manufacture or procurement of new grass.
Supervision focused on the two most important things that are: 1) the performance of human
resources, and 2) financial accountability. Control can be carried out regularly (scheduled), when
there is an event monitoring to ensure that all employees work in accordance with its duties
responsibility, functions can be used and the equipment safe from damage. Supervision needs to
be carried out on treatments done by a contract company, whether the work has been agreed
according to the standard agreement. Supervision in the financial sector is a job that requires an
honest nature. Supervision of the financial sector will prevent the occurrence of the financial crisis
in the management of sports facilities.
Sports Facilities Marketing
The question to concern a lot, is it good to market sports facilities in order to get such
optimal condition or maintain for sports facilities first then sell? Both treating and marketing
activities in the field of management or management are interrelated activities. Sports facilities
require maintenance budgets, marketing activities also require a budget, budget constraints
owned by the manager demanding sport facilities managers or leaders with a wide range of
considerations make a priority in management activities.
Marketing activities especially in the management of sports facilities are generally less
done by the management of sports facilities, especially in sports facilities managed or owned by

Public Health Department, Faculty of Sports Science, F1 Building, 2nd
Floor, Sekaran Campus Gunungpati, Semarang City, Central Java Province, Indonesia, 50229 Phone/ Fax. +6224 8508007
423
the government. Marketing activities is a very important activity performed by the manager
because through marketing activities undertaken optimal sports facility or organization that seeks
to build a managed image, and the image will affect the interest of consumers to use the products
or services offered thereby will be a boost in revenue the company or manager.
Marketing sports facilities is a process that should begin before the facility was built, why?
The concept of marketing has to be done before the facility was built because the place (place) is
a very important factor related to the process of marketing a sports facility. In the field of sports
marketing mix both products or services have the following factors: the quality of products or
services, price, place, promotion, sponsorship, and services (Smith, 2008: 153). Selection of the
establishment of sports facilities will be very influential on the marketing strategy manager.
Marketing jobs sports facilities will be lighter when the strategy where (place) has been
considering (1) the location, ease of access; (2) facility design; (3) infrastructure facilities.
Transportation might be a very important sport facilities aspect, public transportation to
ease the sports facilities is a major consideration before the construction of sports facilities
related marketing facilities. General means of transportation such as buses, trains, airplanes for
access to the facility is needed to hold some national and international events. Adequacy of
parking and easy in and out of sports facilities also need to be considered by the management of
sports facilities whether public or private. Thousands of people were present when a sporting
event held in dire need of ease it.
Policy owners will greatly affect the performance of the facility manager. Managers of sports
facilities in Indonesia, according to the authors, still have such passive mindset primarily on
government-owned sports facilities. The mindset of the manager or managers of sports facilities
did not bother to develop the function and the presence of sports facilities. Sports facilities which
have been fulfilled by the budget in its maintenance not even think about marketing activities.
Model management of privately owned sports facilities or private property will work harder to
market in order to optimally function and result in income earned. Sports facilities owned by
private parties as Arsenal's Emirates Stadium surely attempt to market with maximum facilities
under its management. The managers work and thought optimize marketing activities in addition
to factors where sport facilities have been set before.
Pricing strategy (price) rental of sports facilities need to be analyzed from time to time, who
rent, what to use, lease on rush hour or normal time, government agencies or private parties,
individuals or groups, to be distinguished. The rental rates need to be adjusted to the
circumstances. A job which look simple but it requires thinking at all times. The quality of service
of the employees of the facility tenants need to also get the attention of sports facilities manager,
how an employee can be communicative, working together, respecting the consumer.
Promotional activities in the management of sports facilities are an activity that should not
be abandoned by the managers of sports facilities. Various ways that manages the facility known
by consumers is not an easy task to do. Now is the era of globalization campaign using social

424
Public Health Department, Faculty of Sports Science, F1 Building, 2nd
Floor, Sekaran Campus Gunungpati, Semarang City, Central Java Province, Indonesia, 50229 Phone/ Fax. +6224 8508007
media and promotion using the internet is the alternative techniques that can be selected in
addition to promotion through print media, or electronic. Promotion is communicating activity
where, at what price, and everything excess of the services offered sports facilities.
Marketing job which is still the duty and responsibility of managers of sports facilities is
about how to obtain some sponsorship from some companies. It can be applied on some sports
facilities that are used to hold the event sponsorship of sporting achievement, the wall
surrounding the stadium for example can be used as the media to place some brands of product
from some sponsors. The process of naming the stadium or gym using some brands of the
sponsor can be the usual sponsorship action done in United States or in European countries. The
nominal for this sponsorship with this category is usually very large with a very long term
agreement.
Table 1. List of sponsorship for sports facilities
Name of Facility Location Sponsor Nominal for
Contract
Philips Arena
FedEx Field
Etihad
Emirates Stadium
Atlanta(USA)
WashingtonD
C (USA)
Melbourne
London
Royal Philips
Elektronik
Federal Express
Etihad Airways
Emirates Airways
$182 million for
20 years
$205 million for
27 years
-
-
Source:(Schwarz and Hunter,2008)
Marketing activities of sports facilities will be better if the manager wants to change the
paradigm for thinking that sports facilities do not only serve for sporting activities but also function
in other things such as sports facilities as a means of recreation, business, or for educational
facilities to optimize revenue. Santiago Bernabeu Stadium of Real Madrid, Spain, can be a good
example for this. In the stadium, it is created an area that is functioned to be a museum about the
journey of Real Madrid club since its establishment until today. Excursions on the Bernabeu
Stadium can be revenue rather than just functioned as the place for the game of football.
Manahan Stadium in Surakarta, Central Java, every Sunday held their region as a means
to the people's business. Various souvenirs, folk crafts, and a variety of food products, mixed with
healthy exercise activities, a leisurely stroll into mutually beneficial economic stretching for the
manager of the stadium, the community, and merchants. Decisions in the management of sports
Public Health Department, Faculty of Sports Science, F1 Building, 2nd
Floor, Sekaran Campus Gunungpati, Semarang City, Central Java Province, Indonesia, 50229 Phone/ Fax. +6224 8508007
425
facilities manager will inevitably lead to effects that need to be considered good and bad.
Business activities in the management of sports facilities must be made with regard to values and
ethics.
Sports facilities maintenance and marketing: problem or challenge?
Maintenance of sports facilities is a job that must be done so that all functions of the optimal
functioning of sports infrastructure. Maintenance work would be a problem if the budget provided
is not sufficient for its maintenance activities, and a challenge for a manager when the work
dealing with problems. Government-owned sports facilities in general, in terms of budget
management is assisted by the state finance manager workload might be lighter. Sports facilities
owned by private or for-profit companies will have more severe problems and challenges in the
context of maintenance and marketing of sports facilities.
The entire function of sports facilities will affect marketing activities. Consumers will be
satisfied because the seat is comfortable, clean toilets, lawn and average soil, adequate parking
space, ventilation and a comfortable room temperature, lighting meet the standards. The function
of the equipment that supports sports facilities will affect rents sports facilities, consumers will be
willing to pay more if the service provided is satisfactory. Situations where the condition of sports
facilities throughout the service function optimally because good care, supported throughout the
marketing performance manager will cause sports facilities will function properly and will age
long. The opposite will happen where due care toward less optimal sports facilities, and is
compounded by a lack of funding, the sports facilities will quickly be damaged. Huge losses for
the owners of sports facilities are experiencing these problems.
Closing
Sport facility is built with a huge cost, especially the sports facilities of the building has an
area or a large area like a stadium, gymnasium, and swimming pool. The sports facilities were
built with the enormous cost of the damaged disappears or does not function as general if the
management especially in the treatment cannot perform the duties and responsibilities. Manager
or leader of a health facility will be the one who takes the most responsibility for what happens in
sports facilities management. Various cases of particular sports facilities owned many
dysfunctional government, happen mostly in this case from the lower level managers, middle-and
upper-level managers.
Sports facility managers are expected to have managerial skills, especially in managing the
skills of sports facilities that have special characteristics. Managers often unwarranted lack of
sports facilities which resulted in damage to the cost of maintenance of sports infrastructure, why
managers do not think otherwise how to sporting facilities can generate income or revenue for the
state or the owner? Paradigm in the management of sports facilities needs to be changed to the
management of sports facilities to the sports industry era. Sports facilities should be managed
426
Public Health Department, Faculty of Sports Science, F1 Building, 2nd
Floor, Sekaran Campus Gunungpati, Semarang City, Central Java Province, Indonesia, 50229 Phone/ Fax. +6224 8508007
professionally, especially in terms of maintenance and marketing. Functioning sports facilities not
only for sporting activities but also for recreation, education, and business.
Optimization function of sports facilities gives such consequences that must be managed
with good managerial, the manager who has a good character (honest) and skilled in terms of
managerial of sports facility is absolutely necessary. Honest person is the main requirement for
infrastructure maintenance budget or sports facilities are very prone to corruption. Maintenance
and marketing skills into both the compulsory skills needed. Skills will make the planning,
organizing, directing, and supervising especially in its maintenance aspect are very important so
that it keeps the entire infrastructure of standard functions. Skills into the marketing concept with
the basic requirements for good marketing revenues ultimately will be optimal so as to maintain
the sports facilities continue to function optimally and long-lived.
References Fried,Gil.2005. Managing Sport Facility. United State Of America : Human Kinetic. Iqbal, M, Arif. 2010. Tanpa APBD, Kelangsungan Stadion Manahan Terancam.
http://suaramerdeka.com retrieved on 07 Maret 2011. Meyer and Brightbell. 1964. Community Recreation A Guide to Its Organization. New Jersey:
Prentice-Hall, inc. Englewood Cliff.
Pengelola Mandala Krida tak Profesional..Kompas. 16 February 2008. www.kompas.com retrieved
on 07 Maret 2011. Schwarz, C, Eric and Hunter, D, Jason. 2008. Sport Marketing. Hungary: Elsevier Inc. Smith, C.T. Aaron. Introduction to Sport Marketing. Hungary: Elsevier Inc. ------------. 2009. Stadion Jalak Harupat Merugi.www.tribunjabar.com retrieved on 17 Juli 2011
Public Health Department, Faculty of Sports Science, F1 Building, 2nd
Floor, Sekaran Campus Gunungpati, Semarang City, Central Java Province, Indonesia, 50229 Phone/ Fax. +6224 8508007
427
CYCLING AS AN ALTERNATIVE TO START EXERCISING
Fatkurahman Arjuna
Yogyakarta State University, Indonesia
Corresponding Author: [email protected]
Abstract Introduction: There are many reasons that make people lazy in doing the workout. For example, there is no time to exercise because a solid job, too tired after work, exercise takes a long time, and the costs for doing the exercise are expensive. People are much more inclined to laze around at home instead of exercising and it would be bad for the body, such as fatigue, susceptibility to diseases to non-ideal body proportions so as to interfere with the appearance. Methods: Sports give many benefits for our body such as protecting the body from various diseases. Many diseases may arise due to lack of exercise. They are the risk of suffering from heart disease, diabetes, high blood pressure, and obesity. Exercise is good for the bones joints and even exercise can reduce stress a result of painstaking work. Many people know the benefits of exercise, but they are reluctant to start exercising with a variety of reasons. Cycling is the best alternative to start exercising. Results: Cycling has the advantage as an option to start exercising, cycling is a sport that is not
boring at all, it can be done with ease as you wish, inexpensive, it can be done together with friends or alone, and more importantly, cycling is an aerobic exercise that is very good for the body. Key Words: start exercising, cycling
Introduction
In this modern era, human beings are now completely spoiled by modern technology and
practical things. Some changes in lifestyle might be the one that can cause the body's lack of
movement or often called hypokinetic. For example, the work of washing clothes which was
commonly done by hand began to be replaced by machines so that humans are just waiting to sit
and read the newspaper. Humans prefer to use equipment that is very practical and modern to
facilitate the use of remote job control, use the elevator to climb the ladder, if it is not matched with
adequate physical activity it can lead to various diseases due to lack of movement.
The condition of people who are less making any movement or in general called hypokinetic
can cause a variety of health problems. It is marked by the increasing number of people affected
by so-called non-infectious diseases or degenerative diseases. Examples of degenerative
diseases such as coronary heart disease, diabetes, high blood pressure, cholesterol and so on.
Even, it is getting worst since people just have some unhealthy lifestyle habits such as smoking,
excessive coffee consumption and fast-paced diet that worsens the situation. These health
problems if left unchecked will have an impact on society that decreased work productivity.
Sport is an alternative solution to overcome many health problems caused by lack of
movement or often called hypokinetic. Usually, they do some good sport which is more like the
aerobic exercise such as swimming, jogging, aerobics and now many people love doing cycling.
428
Public Health Department, Faculty of Sports Science, F1 Building, 2nd
Floor, Sekaran Campus Gunungpati, Semarang City, Central Java Province, Indonesia, 50229 Phone/ Fax. +6224 8508007
Many people have got the high awareness of the importance of health through exercise; it
can be seen by many people who exercise every day when they have holiday or weekend. It is
quite bad that the people do not continue exercise (routine) usually they only do it once a week or
even once a month when the holiday comes and this will not benefit much for the body. Sport
should be done continuously and systematically in order to obtain the desired benefits. Sports
ought to be performed regularly with the intention at least three times a week and continuously.
Don't take it once a week at the weekend. Sport must be done systematically that exercise should
be done in accordance with the existing rules which starts from warming up, conditioning and
closed with cooling.
To get the benefits of exercise, it needs to pay attention to the rules, people just cannot get
the benefit from the instant sport. Ignorance of the rules of good exercise will lead to nowhere and
it is true that some people get frustrated when they exercise for once again since they do not get
the desired benefit. Choosing the right gym can be used as a guideline to get the desired results,
because exercise cannot be done only once or twice only, but it must be done regularly.
Errors in choosing exercise can affect the subsequent exercise routine that will be
performed. Choose your preferred sport and it can be done anytime and anywhere, with affordable
cost and provide many benefits, one of the sports that can provide it all is the sport of cycling.
Cycling may provide a wide range of benefits.
Discussion
Many people are having such higher awareness of the benefits of exercise. It can be seen
from the number of people doing sports on holidays. On holidays, people like to exercise in the
open spaces such as in the park, at the football stadium, on the roadside, or in some tourism
spots. It is not just done outside but it is also done indoor since many people like to do sports in
some indoor places like in the gymnasium, a gym, fitness center, and at indoor stadium
(badminton, futsal, or indoor tennis). It is too bad that people are just doing exercise on a day off
just so to get the maximum benefits of exercise. It seems to be in vain.
Just do the exercise regularly and your body will get the desired benefits. Do not take it
instantly for only doing exercise once or two times. Usually people are very lazy to exercise
regularly with a variety of reasons, especially if they have quitted the sport long time ago because
of the tight schedule and they just begin exercising. Of course the body will need such adjustment,
firstly the body will ache and even muscle cramps might happen. Before exercising firstly identify
how good exercise that can determine the choice of what to do sports. This will greatly affect the
exercise routine that will be performed so that the desired results can be achieved well.
The definition of simple exercise is an activity that uses some rules of physical activity or
often called systematic physical activity. Ghazali (2013) "Sport" comes from the Old French
―desport‖ means enjoyment, and understanding of the English language's oldest discovered
Public Health Department, Faculty of Sports Science, F1 Building, 2nd
Floor, Sekaran Campus Gunungpati, Semarang City, Central Java Province, Indonesia, 50229 Phone/ Fax. +6224 8508007
429
around 1300 that "all things fun and entertaining for humans. In the statement it can be concluded
that the sport is a physical activity that is performed to obtain pleasure.
According to Erwin Sharif (2011), sports is a systematic process in the form of any activity or
business that can encourage, develop, and nurture the potential physical and spiritual of the
person as an individual or member of the society in the form of game race or match and intensive
physical activity for recreation gain, victory and crowning achievement in the context of the
formation of the whole person qualified. In the statement the sport has a broad sense not only for
pleasure alone, but the sport has had a systematic process with a variety of objectives to be
achieved.
Systematic in the sense sports is the lack of rules or training phases that must be followed in
the exercise. According to Djoko Pekik (2004), stage in sport is a series of exercises in each
training process that includes: warming up, conditioning, and cooling, this step must be done
sequentially.
Warming up
Warming up is done before starting the core of exercises. Warming up is carried out aimed at
preparing organ function to be able to receive the maximum loading during the actual exercise.
Characteristic feature of that body is ready to accept some loading exercises such as the increase
in heart rate has reached 60% of maximum heart rate, increased body temperature of 1-2 degrees
Celcius, and usually marked by the sweat on the body. Warming up when done correctly can also
reduce the risk of body injury. In cycling, warming up has typically begins with a slowly cycling or
land within approximately 5-10 minutes before berepeda continuously in accordance with the
exercise to be performed or skipped, or can be started by running first before cycling after that
proceed with strecing or stretching .
Conditioning.
After doing the warming up, it continues to the next stage of a series of conditioning by
performing various movements with the model of exercise in accordance with the purpose of the
exercise program, for example jogging to improve cardiorespiratory endurance or to burn body fat,
weight training to increase strength, or cycling to get physical fitness. Usually the purpose of the
exercise is to gain physical fitness. Cycling is very good for getting physical fitness for the body.
The easiest thing to consider in cycling is the time that will be used in practice for at least 30
minutes in cycling. Better yet, after cycling regularly for two weeks and getting improved little by
little, take the other route of cycling and make it over extended or improved. In order to stages of
conditioning running properly, you better take the route of challenging tracks and you will enjoy the
mountains view or the track.
Cooling Down
This stage of cooling down aims to restore the body that resembles before doing exercise.
This stage can be done in the form of stretching and light aerobic movement. In cycling can be
done with the intensity of reducing the speed or slow it down, or after reaching the finish cycling
430
Public Health Department, Faculty of Sports Science, F1 Building, 2nd
Floor, Sekaran Campus Gunungpati, Semarang City, Central Java Province, Indonesia, 50229 Phone/ Fax. +6224 8508007
perform stretching exercises. This cooling stage is characterized by a decline in heart rate, body
temperature and the decrease of the sweat secreted by the body.
Sports would be very helpful if it is done correctly and in accordance with the stages, and
otherwise exercise can be harmful to the body if it is done wrongly or not according to the
predetermined systematic stages.
Advantages of exercise
Sports have many benefits when done regularly and continuously. The benefits of exercise
cannot be obtained in such instant way but it must be done simultaneously. From here, many
people just get lazy to do some exercises because the benefits of exercise cannot be accepted
directly by the body. It is important to choose the right type of exercise for our bodies. As an
example, some people who have been aged 50 years and worked in the office, they chose futsal or
football and it will certainly be very risky against his own body from impact injuries or system of the
body that cannot meet its ability to exercise.
The benefits of exercise will be obtained when adjusted for age, ability and hobbies so that
actors can exercise maximal exercise. The benefits of exercise on the human body include:
Helps protecting the body from heart attack
Heart disease is the number one killer in the world and therefore the heart health must be
guarded well through healthy lifestyle such as by exercising regularly. Regular exercise can train
the heart to work so as not to get tired. Blood circulation will be smooth and of course the blood
flow will be faster and more. Good circulation can prevent blood clots that can create blockage of
blood vessels in the brain and heart. Exercise is also reducing fat levels in the body and it will also
be very beneficial for the heart since excessive fat in the body can lead to heart disease.
Helps protecting the body from diabetes mellitus
The benefit of exercise is to protect the body from the disease of diabetes mellitus as it can
increase the sensitivity of body cells to insulin so that the levels of fat and sugar levels in the blood
may drop. Bad cholesterol levels will go down while the good cholesterol levels will go up. In
addition, blood pressure becomes more stable, controlled body weight, strengthens the heart,
strengthens muscles, strengthens bones, minimizing the risk of illness due to complications with
diabetes and avoid stress. Some sports are good for diabetes as it prevents the increasing blood
sugar level by taking some mild exercise. This right sport to do is aerobic. Doing it for about 30
minutes of aerobic exercise 5 times a week can help people with diabetes to keep blood sugar
levels in the blood pressure becomes more stable, minimizing the occurrence of complications
from diabetes and improving blood circulation. Swimming, fast walking, cycling and aerobics can
follow selected for mild exercise (Health Bulletin, 2014).
Helps protecting the body from the disease of hypertension
Hypertension is a disease classified as very dangerous and deadly. The rapid development
of hypertension patients is one of the biggest factors due to the pile or thickening of cholesterol in
the blood vessel wall cavity so that blood vessels become narrowed and eventually cause blood
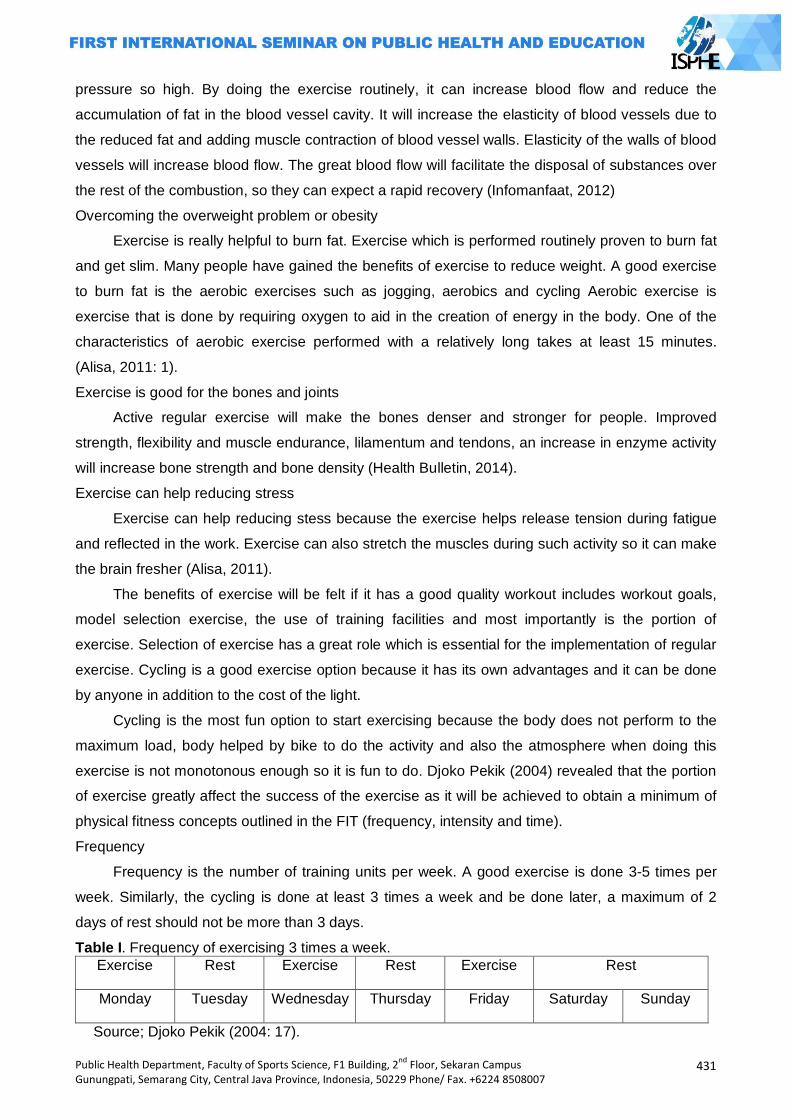
Public Health Department, Faculty of Sports Science, F1 Building, 2nd
Floor, Sekaran Campus Gunungpati, Semarang City, Central Java Province, Indonesia, 50229 Phone/ Fax. +6224 8508007
431
pressure so high. By doing the exercise routinely, it can increase blood flow and reduce the
accumulation of fat in the blood vessel cavity. It will increase the elasticity of blood vessels due to
the reduced fat and adding muscle contraction of blood vessel walls. Elasticity of the walls of blood
vessels will increase blood flow. The great blood flow will facilitate the disposal of substances over
the rest of the combustion, so they can expect a rapid recovery (Infomanfaat, 2012)
Overcoming the overweight problem or obesity
Exercise is really helpful to burn fat. Exercise which is performed routinely proven to burn fat
and get slim. Many people have gained the benefits of exercise to reduce weight. A good exercise
to burn fat is the aerobic exercises such as jogging, aerobics and cycling Aerobic exercise is
exercise that is done by requiring oxygen to aid in the creation of energy in the body. One of the
characteristics of aerobic exercise performed with a relatively long takes at least 15 minutes.
(Alisa, 2011: 1).
Exercise is good for the bones and joints
Active regular exercise will make the bones denser and stronger for people. Improved
strength, flexibility and muscle endurance, lilamentum and tendons, an increase in enzyme activity
will increase bone strength and bone density (Health Bulletin, 2014).
Exercise can help reducing stress
Exercise can help reducing stess because the exercise helps release tension during fatigue
and reflected in the work. Exercise can also stretch the muscles during such activity so it can make
the brain fresher (Alisa, 2011).
The benefits of exercise will be felt if it has a good quality workout includes workout goals,
model selection exercise, the use of training facilities and most importantly is the portion of
exercise. Selection of exercise has a great role which is essential for the implementation of regular
exercise. Cycling is a good exercise option because it has its own advantages and it can be done
by anyone in addition to the cost of the light.
Cycling is the most fun option to start exercising because the body does not perform to the
maximum load, body helped by bike to do the activity and also the atmosphere when doing this
exercise is not monotonous enough so it is fun to do. Djoko Pekik (2004) revealed that the portion
of exercise greatly affect the success of the exercise as it will be achieved to obtain a minimum of
physical fitness concepts outlined in the FIT (frequency, intensity and time).
Frequency
Frequency is the number of training units per week. A good exercise is done 3-5 times per
week. Similarly, the cycling is done at least 3 times a week and be done later, a maximum of 2
days of rest should not be more than 3 days.
Table I. Frequency of exercising 3 times a week.
Exercise Rest Exercise Rest Exercise Rest
Monday Tuesday Wednesday Thursday Friday Saturday Sunday
Source; Djoko Pekik (2004: 17).
432
Public Health Department, Faculty of Sports Science, F1 Building, 2nd
Floor, Sekaran Campus Gunungpati, Semarang City, Central Java Province, Indonesia, 50229 Phone/ Fax. +6224 8508007
In the table, minimum exercise is done three times a week. To exercise or rest period can be
adjusted with our schedule, cycling is usually done on Saturday and Sunday and it means
thatpeople do it mostly on holidays or they can take a break on Monday and Wednesday. The most
important break in cycling should not be more than 3 days in a row. The role of the sport of cycling
is very good on the side of gaining the physical fitness since cycling is an aerobic exercise, cycling
can also minimize the occurrence of saturation by planning some different route to take.
Intensity
Intensity is a quality that shows how heavy exercise is. The amount of intensity depending on
the purpose of the exercise and the type of exercise performed. In general, the intensity for fitness
training is 60% - 90% rate. Exercises for beginners <65% maximal heart rate. Cycling can be
marked well from its intensity. It is important to increase the distance to be traversed at least every
2 weeks.
Time
Time is the period or often referred to the duration of each exercise. For example, to improve
the physical fitness, practice takes between 20-60 minutes. Conceivably, if choosing the wrong
sports as chosen sport is football or basketball to start exercising for 30 minutes certainly untrained
people will experience excessive tiredness or fatigue so that the body will have no maximum
benefits from doing the exercise. Cycling is the right choice to start exercising with a long time
cycling as it can be done while listening to music, talking with friends and seeing the sights around
so it is not time-consuming and it is lighter to do.
Cycling
According to Wikipedia (2013), cycling is a recreational activity or sport, and it is one of the
ground transportation models that use bicycles. At first, the bike is a means of transportation that
was introduced in the 19th century known as the Cycling sports are most favored by the people
because it can be done by anyone even those who exceed weight or having obesity. Many people
cycling in a wide variety of terrain, such as hills, steep terrain and also just race alone or in groups
and rush to get to a certain area for recreation.
According to Frobose (2009), there are two benefits of cycling
Cycling is one way to exercise the least pressure on the knees and the best way to
strengthen cartilage. Cycling can be done by anyone who has a good weight more or less without
fear of such body injury.
Cycling can improve overall blood circulation, the most important is the heart will work more
eficiently because its pumping performance becomes more efficient so it reduces overall blood
pressure and reduces the chance of getting the heart disease. Cycling can improve the immune
system and allow the body to protect itself from viruses and bacteria. Cycling is a sport in which its
method might be most useful to strengthen the body's immune system.
Cycling has many benefits and therefore people should choose the bicycle in accordance
with the wishes and needs. Bicycles will also greatly affect the exercise, if this option is used the
Public Health Department, Faculty of Sports Science, F1 Building, 2nd
Floor, Sekaran Campus Gunungpati, Semarang City, Central Java Province, Indonesia, 50229 Phone/ Fax. +6224 8508007
433
right bike, the sport that will be done will be comfortable but when the bike option is not used in
accordance with the expectations of the sports that will be done will not be disturbed. Here are tips
for choosing a bike. Veloni Heningtyas (2013) Tips to choose a good bike:
Decide on a budget
The most important thing before buying a bike is to specify a budget that will be used. Do not
be influenced by the expensive price of the bike, the price of an expensive bicycle is used as a
reference only. Choosing a bike with the financial condition and adjusted to the needs is the best
suggestion because cycling is not for sporting achievements but only to start exercising and
exercising with regular schedule. Choose a bike that is cheap but not that cheap in accordance
with the comfort, seek information from friends or some cycling lovers.
Cycling Style
Before buying a bicycle, you have to specify the preferred style of cycling and the track to
pass. Track bike cross-country with ordinary model, fast or racing bikes, tracks like Gas Pipeline,
Park City, Cihuni or Jati Asih Track for example. Make sure the bike you're looking for is a bike that
meets the needs. Do not be swayed by sellers who sell the bike recklessly.
Full Suspension or HT - Comfort vs Efficiency
Choosing a full suspension bike or hard tail (HT) is always an interesting topic to talk about
the for the bike lovers. Full suspension bike type is often used as a mockery of the bike for the
elder persons because it has advantages in terms of comfort, but HT mountain bike without rear
suspension is lighter touted more efficient when people ride it across the field. Full suspension
bicycle is also considered to be more comfortable with better control. From this explanation, it is up
to you to determine which bike will be selected and it cannot be separated with the ability to
purchase the desired type of bike. Style and cycling routes (terrain to be traversed path) may also
be a consideration in choosing a bike.
Components, parts or grupset
It is not easy to compare the part or component which is best for the bike. All types of bikes
have their respective advantages. Not to mention to many combinations of inter-bike parts and its
many variations. The best way to do is chose a number of components or the most important part
for the bike to be purchased, always pay attention to the ability to buy the kind of bike that we want.
A number of cyclists usually start by selecting the moving components such as the rim, hub, or RD
(rear derailleur) and then fork. It is not necessarily to buy sophisticated and expensive groupset
when we want to become a great cyclist. The greatness of a bike that we have may not be
necessarily relevant to our ability in tough cycling.
Discount, bonus
What is meant here for the discount or bonus is that you choose a bike shop which can often
provide a bonus or discount. Recognize the bike shop that often provides the discounts or bonuses
at certain times or in certain events that will benefit the buyers of the bike.
Test ride, read some reviews

434
Public Health Department, Faculty of Sports Science, F1 Building, 2nd
Floor, Sekaran Campus Gunungpati, Semarang City, Central Java Province, Indonesia, 50229 Phone/ Fax. +6224 8508007
Before buying a bike and make sure the needs of their state of the body, do not rush to buy a
better bike. You should try several kinds of bicycles (test ride) by borrowing a bike of a friend. Note
also the size of the bike frame that fits with the posture of body weight. Identify the bike that you
want buy on a review or read something about bike product reviews which might be scattered on
the internet or magazines.
Reasons to Start Exercising Choosing Cycling
Cycling has advantages as an option to start exercising, cycling is a sport that is not boring,
as it can be done with ease as you wish, inexpensive, can be done together with friends or alone,
and more importantly, cycling is an aerobic exercise that is very good for the body.
Cycling is a sport that is not boring
Cycling is a sport that is interesting, because with cycling we can see a different scene every
day. Each route that is passed will give the feel of different sights so it is not monotonous. For
example when we're busy with work piling up at the office of the sport of cycling became one of the
best options to eliminate fatigue with these ways in passing rural or mountainous route so that the
mind will be refreshed. We can arrange in advance the sport of cycling before doing so it can be
adjusted with our desire.
Cycling can be done with ease as you wish
Cycling is a sport that is flexibly done with high intensity and low intensity tailored to the
capabilities. Cycling exercise tailored to each individual's ability not necessarily with high intensity.
For example, football sport that requires us to always be running after a ball, or badminton which
forces us to always pursue shuttlecook rather not fall in the field of players. Cycling does not have
to be done on the highway can also be done by tracing the mountains, countryside or even a
search can be done on the side of the beach in accordance with our wishes.
Cycling is a sport that is cheap
In contrast to other sports such as badminton which is always providing suttlecoock to be
able to exercise, or tennis which always provides a tennis ball to play, cycling only needs the bike
to be able to provide enough exercise. To buy a bike, it also only depends on the capability of each
bag. While there are some bikes with the expensive price, it does not need an expensive price as it
is tailored to the needs. Cycling sports can be said that cheap because it is adjusted well to the
capabilities of each person.
Cycling can be done together with friends or alone
Cycling is a sport that can be done flexibly together or alone. Performed together with family,
colleagues, friends, and even you can make some invitation for such cyclying communities so that
the sport of cycling can be fun. Cycling can be combined with exercise while recreation. As an
example, cycling can aim the process to release stress as you can go to some tourism places with
family, friends and co-workers. Cycling can also be done on your own with the route that we
specify. Cycling itself can be done while listening to music through the phone, iPad, or wallkman so
cycling itself was not boring at all.
Public Health Department, Faculty of Sports Science, F1 Building, 2nd
Floor, Sekaran Campus Gunungpati, Semarang City, Central Java Province, Indonesia, 50229 Phone/ Fax. +6224 8508007
435
Cycling is an aerobic exercise.
Aerobic exercise is basically a type of exercise that makes the heart pumping and increase
oxygen intake in the body. Another benefit of aerobic exercise is that it can burn the fat. To be
effective in burning fat, cycling exercise is done in a long duration. Aerobic physical activity is very
good for heart health and it gives the benefits to lose the weight as well. Reducing the overweight
can prevent us from the risk of heart disease, high blood pressure, stroke, diabetes, and some
cancers. Do exercise of cycling regularly with a relatively long duration (Kompas.com, 2010: 1).
References
Alisa. (2011). Manfaat Olahraga Yang Wajib Anda Ketahui. Retrieved on 10 Agustus 2011 from http://www.kesehatan123.com/2200/manfaat-olahraga/
Buletin Sehat. (2014). Olahraga Untuk Penderita Diabetis Millitus. Retrieved on 24 Mei 2014 from http://buletinsehat.com/diabetes-mellitus
Djoko Pekik. (2004). Berolahraga untuk Kebugaran dan Kesehaan. Yogyakarta: Andi Offset. Edwin Syarif. (2011). Pengertian Olahraga. Retrieved on 3 Mei 2011 from www.
Edwinsyarif.blogsport.com Infomanfaat. (2012). Manfaat Olahraga. Retrieved on 15 Juni 2013 from
http://infomanfaat.com/359/manfaat-olahraga/kesehatan Ghazali Kareem. (2013). Pengertian Olahraga Secara Umum. Retrieved on 18 Juli 2014 from
www.kutembak.com/2013/10/pengertian-olahraga-secara-umum.html.
Kompas.com. (2010). Manfaat Aerobik. Retrieved on 18 Juni 2010 from http://kesehatan.kompas.com/read/2010/06/18/1536583/Manfaat.Aerobik
Veloni Heningtyas. (2013). Pilih Sepeda: Antara Dengkul dan Dompet. Retrieved on 9 Oktober 2013 from www.pedalku.com/baca/2013/10/09/pilih-sepeda/
Wikipedia. (2013). Bersepeda. Retrieved on 10 Juni 2013 from http://id.wikipedia.org/wiki/ Bersepeda.
436
Public Health Department, Faculty of Sports Science, F1 Building, 2nd
Floor, Sekaran Campus Gunungpati, Semarang City, Central Java Province, Indonesia, 50229 Phone/ Fax. +6224 8508007
FOOD CONSUMPTION PATTERNS EFFECT ON SECONDARY SEXUAL DEVELOPMENT OF MIDDLE SCHOOL STUDENTS
Khotijah 1, Ipop Sjarifah 1
1Sebelas Maret University, Indonesia
Corresponding Author: [email protected]
Abstract Introduction: Puberty is an important period and it is the sexual maturation phase that marks the change to adulthood. The increased of sex steroid led to the development of secondary sexual characteristics. Secondary sexual development is also influenced by the pattern of food consumption. The objective is to determine food consumption patterns effect on secondary sexual development during puberty on middle school students in Surakarta. Methods: This study is obervational analytic cross sectional design. The population is middle school students who meet the inclusion criteria. Samples taken with a quota random sampling technique from 100 respondents. The reserach instrumen is an inventory. Data analysis using regression ordinal. Results: The average age of respondents ranges from 12-16 years. Teenage boys consuming instant noodles, processed meat and eggs two to for times a week shows a sign of seceondary sexual changes of the vocal cords, wet dreams, and Adam‘s apple appearance at the age of 11-12, teenage girls shows mentruation, enlarged breasts and acne at the age of 9. Regression ordinal test results showed the effect of food consumtion patterns on secondary sexual development during puberty for boys with p value of 0.024 and for teenage girls p value of 0,001. Key Words: Food consumption patterns, sexual development Introduction
Puberty is an important period during development. Puberty is a maturation phase into
adulthood. During puberty, the increase of sex steroid avaibility causes development of secondary
sexual characteristics (Peper et al, 2009). Physical and pubertal development resulted from
hipothalmic-pituitary-gonadal axis at the end of children phase. Before puberty, the amount of
pituitary and gonadal hormones are low. In female, Follicle Stimulating Hormon (FSH) accelarate
the maturation of ovarium, granulating cell function and estradiol secretion. The level of estradiol
increases progressively resulting maturation of female genitalia and breasts development. In male,
Luteinizing Hormon (LH) accelarate interstitial cell of testis to produce testosterone. During
puberty, the level of testosterone increases more the 20 times. Testosterone level is related with
physical phase of puberty and the level of bone maturation (Hay et al, 2009). During the
developmen process the avaibility of nutrition is crucial in achieving organ maturation, for example
during secondary secual development, nutrition such as carbohydrate, protein, fat, vitamins and
minerals. Previous studies showed that there is a relationship between nutrition and secondary
sexual development. Recent study from University of North Carolina in Chapel Hill published in
Medical Pediatrics Journal reported that on the age of 3, 3% of African-American girls and 1% of
Caucasian girls showed an influence of development of breasts and pubic hair up to 27.2% and
6.7% on the age of 7. On the age of 8, the development of breasts and pubic hair increases to
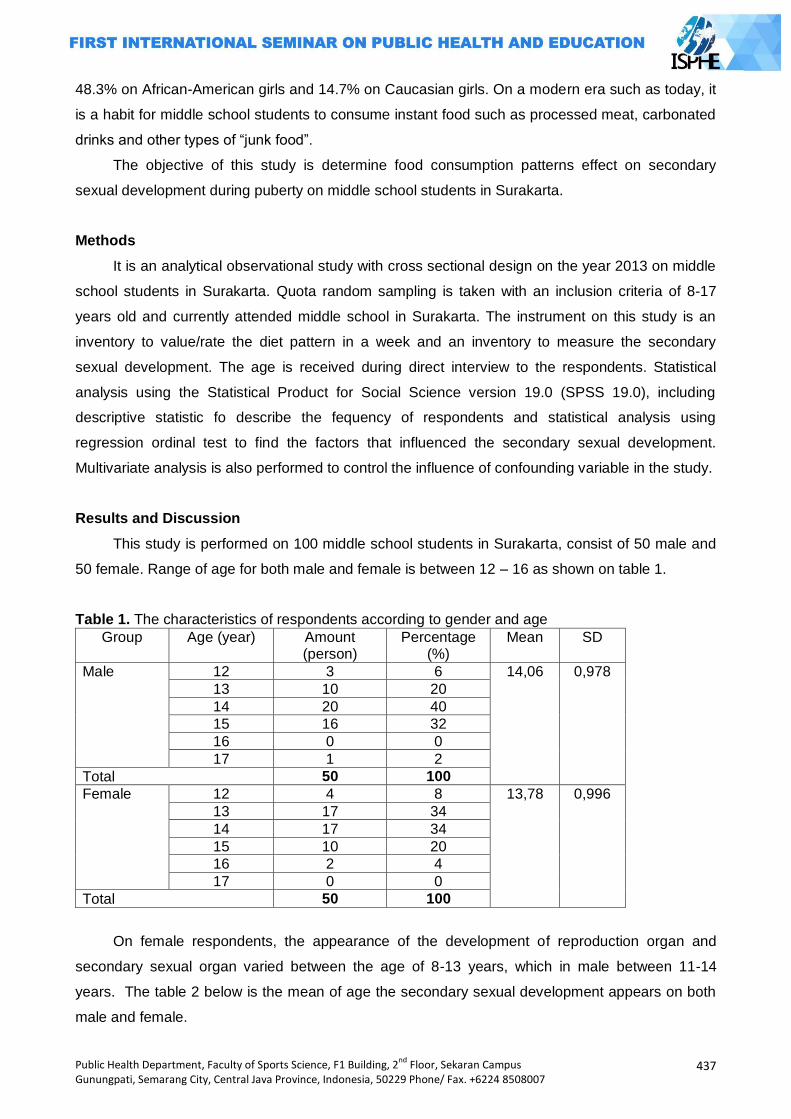
Public Health Department, Faculty of Sports Science, F1 Building, 2nd
Floor, Sekaran Campus Gunungpati, Semarang City, Central Java Province, Indonesia, 50229 Phone/ Fax. +6224 8508007
437
48.3% on African-American girls and 14.7% on Caucasian girls. On a modern era such as today, it
is a habit for middle school students to consume instant food such as processed meat, carbonated
drinks and other types of ―junk food‖.
The objective of this study is determine food consumption patterns effect on secondary
sexual development during puberty on middle school students in Surakarta.
Methods
It is an analytical observational study with cross sectional design on the year 2013 on middle
school students in Surakarta. Quota random sampling is taken with an inclusion criteria of 8-17
years old and currently attended middle school in Surakarta. The instrument on this study is an
inventory to value/rate the diet pattern in a week and an inventory to measure the secondary
sexual development. The age is received during direct interview to the respondents. Statistical
analysis using the Statistical Product for Social Science version 19.0 (SPSS 19.0), including
descriptive statistic fo describe the fequency of respondents and statistical analysis using
regression ordinal test to find the factors that influenced the secondary sexual development.
Multivariate analysis is also performed to control the influence of confounding variable in the study.
Results and Discussion
This study is performed on 100 middle school students in Surakarta, consist of 50 male and
50 female. Range of age for both male and female is between 12 – 16 as shown on table 1.
Table 1. The characteristics of respondents according to gender and age
Group Age (year) Amount (person)
Percentage (%)
Mean SD
Male 12 3 6 14,06 0,978
13 10 20
14 20 40
15 16 32
16 0 0
17 1 2
Total 50 100
Female 12 4 8 13,78 0,996
13 17 34
14 17 34
15 10 20
16 2 4
17 0 0
Total 50 100
On female respondents, the appearance of the development of reproduction organ and
secondary sexual organ varied between the age of 8-13 years, which in male between 11-14
years. The table 2 below is the mean of age the secondary sexual development appears on both
male and female.
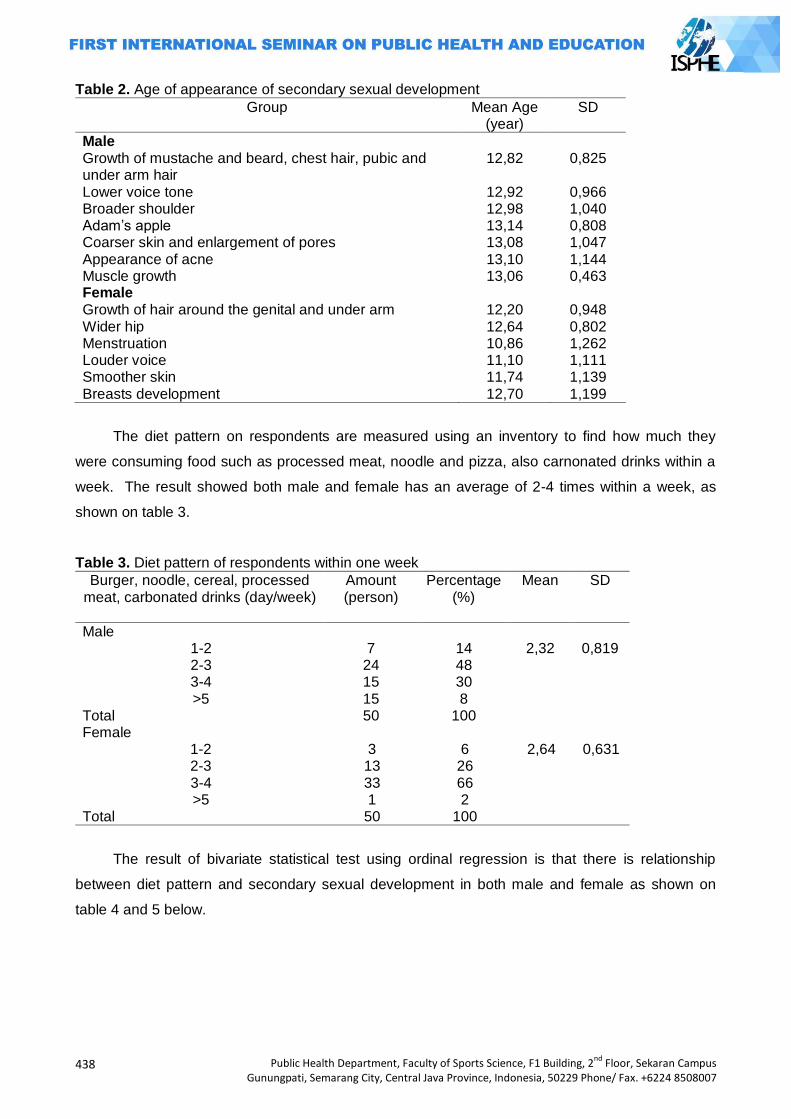
438
Public Health Department, Faculty of Sports Science, F1 Building, 2nd
Floor, Sekaran Campus Gunungpati, Semarang City, Central Java Province, Indonesia, 50229 Phone/ Fax. +6224 8508007
Table 2. Age of appearance of secondary sexual development
Group Mean Age (year)
SD
Male Growth of mustache and beard, chest hair, pubic and under arm hair
12,82 0,825
Lower voice tone 12,92 0,966 Broader shoulder 12,98 1,040 Adam‘s apple 13,14 0,808 Coarser skin and enlargement of pores 13,08 1,047 Appearance of acne 13,10 1,144 Muscle growth 13,06 0,463 Female Growth of hair around the genital and under arm 12,20 0,948 Wider hip 12,64 0,802 Menstruation 10,86 1,262 Louder voice 11,10 1,111 Smoother skin 11,74 1,139 Breasts development 12,70 1,199
The diet pattern on respondents are measured using an inventory to find how much they
were consuming food such as processed meat, noodle and pizza, also carnonated drinks within a
week. The result showed both male and female has an average of 2-4 times within a week, as
shown on table 3.
Table 3. Diet pattern of respondents within one week
Burger, noodle, cereal, processed meat, carbonated drinks (day/week)
Amount (person)
Percentage (%)
Mean SD
Male 1-2 7 14 2,32 0,819 2-3 24 48 3-4 15 30 >5 15 8
Total 50 100 Female
1-2 3 6 2,64 0,631 2-3 13 26 3-4 33 66 >5 1 2
Total 50 100
The result of bivariate statistical test using ordinal regression is that there is relationship
between diet pattern and secondary sexual development in both male and female as shown on
table 4 and 5 below.
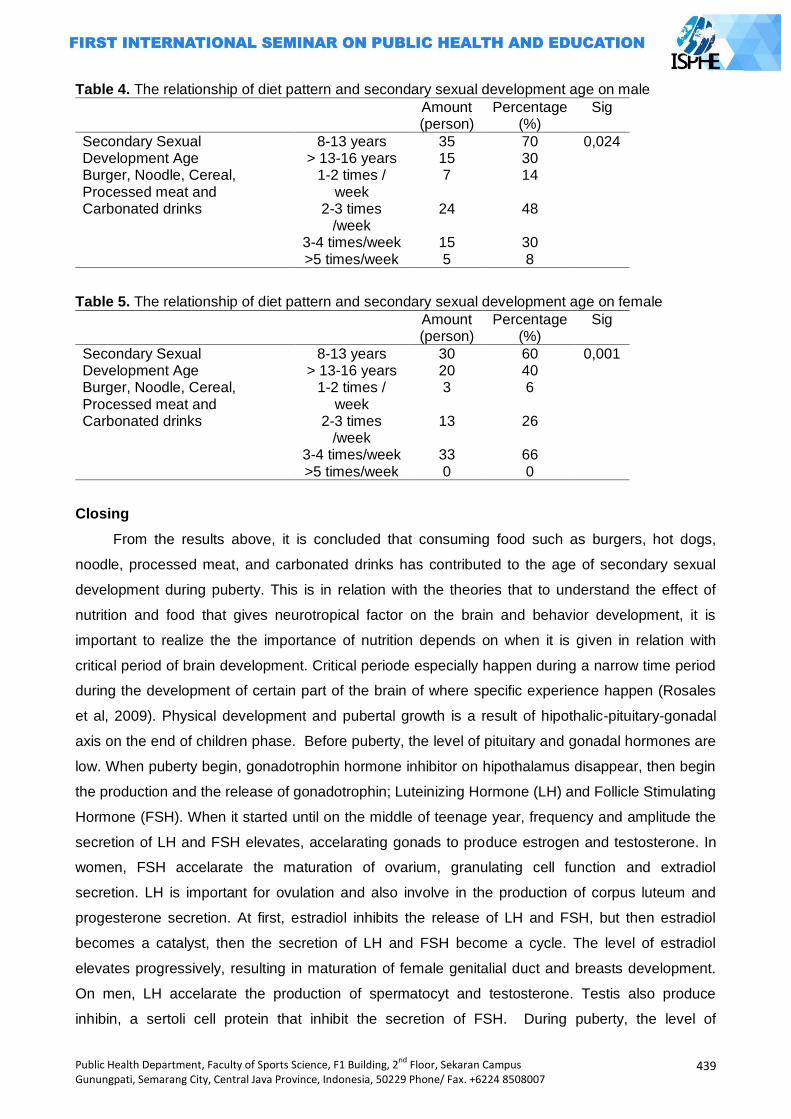
Public Health Department, Faculty of Sports Science, F1 Building, 2nd
Floor, Sekaran Campus Gunungpati, Semarang City, Central Java Province, Indonesia, 50229 Phone/ Fax. +6224 8508007
439
Table 4. The relationship of diet pattern and secondary sexual development age on male
Amount (person)
Percentage (%)
Sig
Secondary Sexual Development Age
8-13 years 35 70 0,024 > 13-16 years 15 30
Burger, Noodle, Cereal, Processed meat and Carbonated drinks
1-2 times / week
7 14
2-3 times /week
24 48
3-4 times/week 15 30 >5 times/week 5 8
Table 5. The relationship of diet pattern and secondary sexual development age on female
Amount (person)
Percentage (%)
Sig
Secondary Sexual Development Age
8-13 years 30 60 0,001 > 13-16 years 20 40
Burger, Noodle, Cereal, Processed meat and Carbonated drinks
1-2 times / week
3 6
2-3 times /week
13 26
3-4 times/week 33 66 >5 times/week 0 0
Closing
From the results above, it is concluded that consuming food such as burgers, hot dogs,
noodle, processed meat, and carbonated drinks has contributed to the age of secondary sexual
development during puberty. This is in relation with the theories that to understand the effect of
nutrition and food that gives neurotropical factor on the brain and behavior development, it is
important to realize the the importance of nutrition depends on when it is given in relation with
critical period of brain development. Critical periode especially happen during a narrow time period
during the development of certain part of the brain of where specific experience happen (Rosales
et al, 2009). Physical development and pubertal growth is a result of hipothalic-pituitary-gonadal
axis on the end of children phase. Before puberty, the level of pituitary and gonadal hormones are
low. When puberty begin, gonadotrophin hormone inhibitor on hipothalamus disappear, then begin
the production and the release of gonadotrophin; Luteinizing Hormone (LH) and Follicle Stimulating
Hormone (FSH). When it started until on the middle of teenage year, frequency and amplitude the
secretion of LH and FSH elevates, accelarating gonads to produce estrogen and testosterone. In
women, FSH accelarate the maturation of ovarium, granulating cell function and extradiol
secretion. LH is important for ovulation and also involve in the production of corpus luteum and
progesterone secretion. At first, estradiol inhibits the release of LH and FSH, but then estradiol
becomes a catalyst, then the secretion of LH and FSH become a cycle. The level of estradiol
elevates progressively, resulting in maturation of female genitalial duct and breasts development.
On men, LH accelarate the production of spermatocyt and testosterone. Testis also produce
inhibin, a sertoli cell protein that inhibit the secretion of FSH. During puberty, the level of
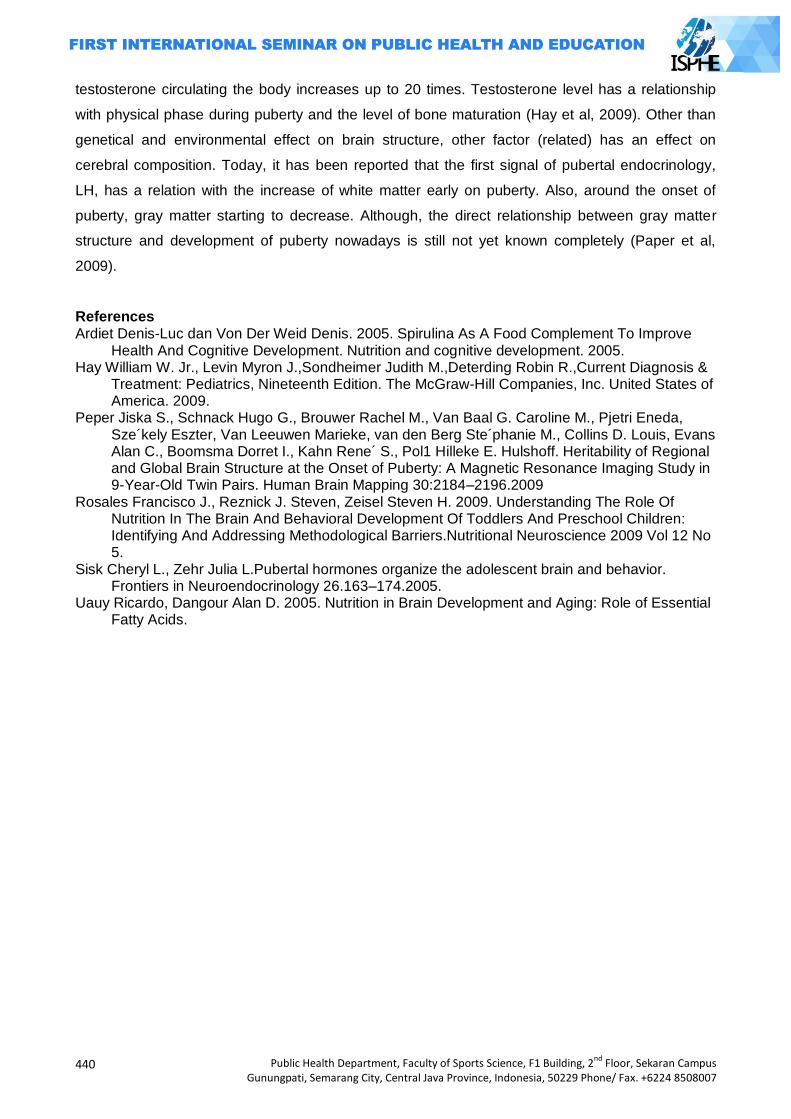
440
Public Health Department, Faculty of Sports Science, F1 Building, 2nd
Floor, Sekaran Campus Gunungpati, Semarang City, Central Java Province, Indonesia, 50229 Phone/ Fax. +6224 8508007
testosterone circulating the body increases up to 20 times. Testosterone level has a relationship
with physical phase during puberty and the level of bone maturation (Hay et al, 2009). Other than
genetical and environmental effect on brain structure, other factor (related) has an effect on
cerebral composition. Today, it has been reported that the first signal of pubertal endocrinology,
LH, has a relation with the increase of white matter early on puberty. Also, around the onset of
puberty, gray matter starting to decrease. Although, the direct relationship between gray matter
structure and development of puberty nowadays is still not yet known completely (Paper et al,
2009).
References Ardiet Denis-Luc dan Von Der Weid Denis. 2005. Spirulina As A Food Complement To Improve
Health And Cognitive Development. Nutrition and cognitive development. 2005. Hay William W. Jr., Levin Myron J.,Sondheimer Judith M.,Deterding Robin R.,Current Diagnosis &
Treatment: Pediatrics, Nineteenth Edition. The McGraw-Hill Companies, Inc. United States of America. 2009.
Peper Jiska S., Schnack Hugo G., Brouwer Rachel M., Van Baal G. Caroline M., Pjetri Eneda, Sze´kely Eszter, Van Leeuwen Marieke, van den Berg Ste´phanie M., Collins D. Louis, Evans Alan C., Boomsma Dorret I., Kahn Rene´ S., Pol1 Hilleke E. Hulshoff. Heritability of Regional and Global Brain Structure at the Onset of Puberty: A Magnetic Resonance Imaging Study in 9-Year-Old Twin Pairs. Human Brain Mapping 30:2184–2196.2009
Rosales Francisco J., Reznick J. Steven, Zeisel Steven H. 2009. Understanding The Role Of Nutrition In The Brain And Behavioral Development Of Toddlers And Preschool Children: Identifying And Addressing Methodological Barriers.Nutritional Neuroscience 2009 Vol 12 No 5.
Sisk Cheryl L., Zehr Julia L.Pubertal hormones organize the adolescent brain and behavior. Frontiers in Neuroendocrinology 26.163–174.2005.
Uauy Ricardo, Dangour Alan D. 2005. Nutrition in Brain Development and Aging: Role of Essential Fatty Acids.
Public Health Department, Faculty of Sports Science, F1 Building, 2nd
Floor, Sekaran Campus Gunungpati, Semarang City, Central Java Province, Indonesia, 50229 Phone/ Fax. +6224 8508007
441
THE ANALYSIS OF TENDANGAN SAMPING TECHNIQUE (T) OF PESILAT
DAERAH ISTIMEWA YOGYAKARTA
(A STUDY OF SPORT BIOMECHANIC)
Awan Hariono
Yogyakarta State University
Corresponding Author: [email protected]
Abstract
Introduction: Tendangan samping technique (T) has been used as a lethal weapon in pencak
silat. The kicks motion is less complex and relatively easy to master. However, it rarely for the
pesilat (pencak silat athlete) to execute. Research problem was in-depth performance enquiry of
the tendangan samping technique (T) of the pesilat Pelatda DIY from the ready position,
implementation, and follow through respectively. The core goal was to analyze the tendangan
samping (T) pesilat DIY based on sport biomechanic perspective.
Methods: Research design used in this study was a descriptive exploratory survey. The subjects
were all 8 pesilat DIY who won a national achievement and still actively engage in Pelatda DIY.
Data collection was done by recording the tendangan samping technique (T).
Results: The results indicated that: (1) at the readiness phase, the angle of knee flextion of back
leg of pesilat DIY was smaller than the angle of knee flextion the front leg. As the results it more
eficient for readiness movement; (2) the implementation phase of tendangan samping technique
(T) of pesilat DIY at impact phase were: the sight directly to the target, head position is in line with
front shoulder, and core position tends to the back side, and the angle which is formed between
attack foot and foothold at impact amid on 100o to 107o; (3) the follow through phase of tendangan
samping technique (T) was inefficient.
Key Words: Analysis, technique, tendangan samping (T), pesilat DIY
Introduction
In general, basis principle of pencak silat tanding category is to acquire score by doing attack
and defence. The score in pencak silat tanding category is achive when pesilat can do strike
technique, kicks and probably go inside object target and free from opponent defense. In order to
be able do the attack and defense, mastering of base technique of pencak silat is crucial. Kotot
(2004) describes base technique in pencak silat can be differentiated into six categories, they are:
(1) kuda-kuda; (2) ready position; (3) step pattern; (4) defense technique (defense and avoid); (5)
attack technique (beat, angle, and kicks); and (6) fallen technique. From six categosires, beat
technique, kicks technique, fallen technique can be used to get score in match pencak silat. So,
mastering of tendangan technique, tendangan and jatuhan is realy needed for pesilat to get
achievement optimally.
Furtheremore, for beginner the three techniques may not be taught simultaneously, but it is
taught sequentially based on useful priorities of each techniques. Agung Nugroho (2005) stated
442
Public Health Department, Faculty of Sports Science, F1 Building, 2nd
Floor, Sekaran Campus Gunungpati, Semarang City, Central Java Province, Indonesia, 50229 Phone/ Fax. +6224 8508007
basic techniques that can be used to get score, approximately 47% are predominantly used in
pencak silat tanding category is kicks technique.
Based on observations, tendangan samping (T) is one technique which is beneficial when it‘s
used in pencak silat tanding category. Beside having a longer range, tendangan samping
technique (T) generates more power and a great effect on the target after impact. Thus the using
of the tendangan samping technique (T) in pencak silat game has a high effectiveness to get score
during the match. By seeing from the trajectory motion, tendangan samping technique (T) is
relatively easy to do, but especially for the pesilat tanding category. Therefore, the implementation
of the tendangan samping technique (T) does not require a wide range of motion sequence. As we
look back, history proves that the tendangan samping technique (T) contribute to the pesilat DIY
for optimal achievement. They are: Slamet Latanggang, Purwowasono, and Sri Suharsih dominant
pesilat DIY who used tendangan samping technique (T) during the match. National and
international level achievements that they have got proved that tendangan samping technique (T)
are highly effective when it is used in a match.
Based on the recent observations, pesilat tanding category uses tendangan samping
technique (T), especially pesilat DIY. The reason of the difficulty level implementation tendangan
samping technique (T) becomes a new horizon that is appeared by pesilat tanding category while
practicing and playing. So, it‘s the need a research about motion tendangan samping (T) analysis
so it can be seen the efficiency and effectiveness. Results are expected to identify the performance
of tendangan samping technique (T) pesilat DIY. Thus the difficulty level pesilat tanding category of
DIY when doing the motion tendangan samping technique (T) can be determined and therapy will
be addressed.
Tendangan samping technique (T) for pencak silat tanding category
Kicks technique is an effort or process that is performed by using both legs to defend and
attack as an attempt to get score as much as possible. Kicks technique is often used as the main
weapon for both attacking and defensing. The basic concept to perform the kicks technique in a
match must begin with ready phase then lift your knees as high as the target then lashed to the
lower leg with a field goal followed by hip and leg rotation fulcrum, so can get maximum speed,
beside that, it‘s need to be see the health-related aspects, namely: avoid excessive stretching of
the joints, especially the knee as a pivot crack at the kicks.
Kicks technique is dominant technique which used by pesilat tanding category during the
tournament. Score is obtained when the pesilat used kicks technique and it can be on the target‘s
field that have been defined and significant effect on the field of targets (loud noise or affect the
opponent's position changed). The kicks techniques which is used in pencak silat tanding category,
including: tendangan depan (the front kick), tendangan sabit (particular technique in pencak silat),
tendangan samping “T” (in general called the side kick), and tendangan belakang (the back kick).
Those terminology will be use thoroughly in this article.
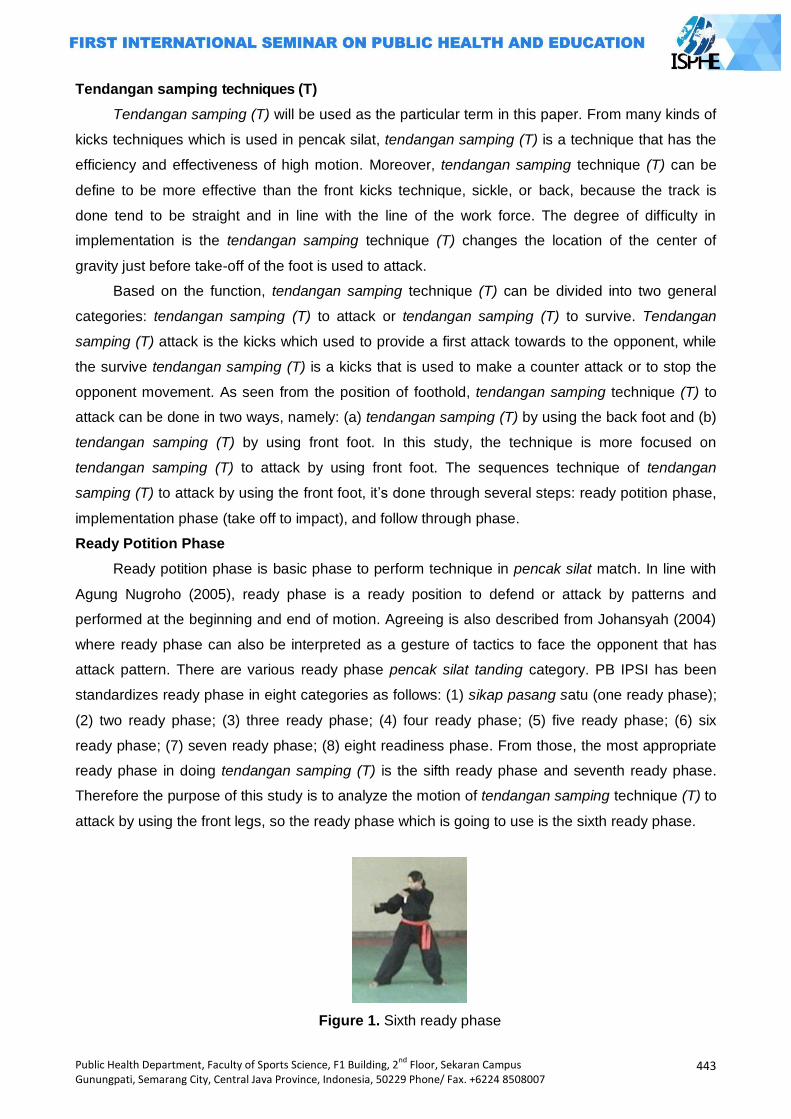
Public Health Department, Faculty of Sports Science, F1 Building, 2nd
Floor, Sekaran Campus Gunungpati, Semarang City, Central Java Province, Indonesia, 50229 Phone/ Fax. +6224 8508007
443
Tendangan samping techniques (T)
Tendangan samping (T) will be used as the particular term in this paper. From many kinds of
kicks techniques which is used in pencak silat, tendangan samping (T) is a technique that has the
efficiency and effectiveness of high motion. Moreover, tendangan samping technique (T) can be
define to be more effective than the front kicks technique, sickle, or back, because the track is
done tend to be straight and in line with the line of the work force. The degree of difficulty in
implementation is the tendangan samping technique (T) changes the location of the center of
gravity just before take-off of the foot is used to attack.
Based on the function, tendangan samping technique (T) can be divided into two general
categories: tendangan samping (T) to attack or tendangan samping (T) to survive. Tendangan
samping (T) attack is the kicks which used to provide a first attack towards to the opponent, while
the survive tendangan samping (T) is a kicks that is used to make a counter attack or to stop the
opponent movement. As seen from the position of foothold, tendangan samping technique (T) to
attack can be done in two ways, namely: (a) tendangan samping (T) by using the back foot and (b)
tendangan samping (T) by using front foot. In this study, the technique is more focused on
tendangan samping (T) to attack by using front foot. The sequences technique of tendangan
samping (T) to attack by using the front foot, it‘s done through several steps: ready potition phase,
implementation phase (take off to impact), and follow through phase.
Ready Potition Phase
Ready potition phase is basic phase to perform technique in pencak silat match. In line with
Agung Nugroho (2005), ready phase is a ready position to defend or attack by patterns and
performed at the beginning and end of motion. Agreeing is also described from Johansyah (2004)
where ready phase can also be interpreted as a gesture of tactics to face the opponent that has
attack pattern. There are various ready phase pencak silat tanding category. PB IPSI has been
standardizes ready phase in eight categories as follows: (1) sikap pasang satu (one ready phase);
(2) two ready phase; (3) three ready phase; (4) four ready phase; (5) five ready phase; (6) six
ready phase; (7) seven ready phase; (8) eight readiness phase. From those, the most appropriate
ready phase in doing tendangan samping (T) is the sifth ready phase and seventh ready phase.
Therefore the purpose of this study is to analyze the motion of tendangan samping technique (T) to
attack by using the front legs, so the ready phase which is going to use is the sixth ready phase.
Figure 1. Sixth ready phase
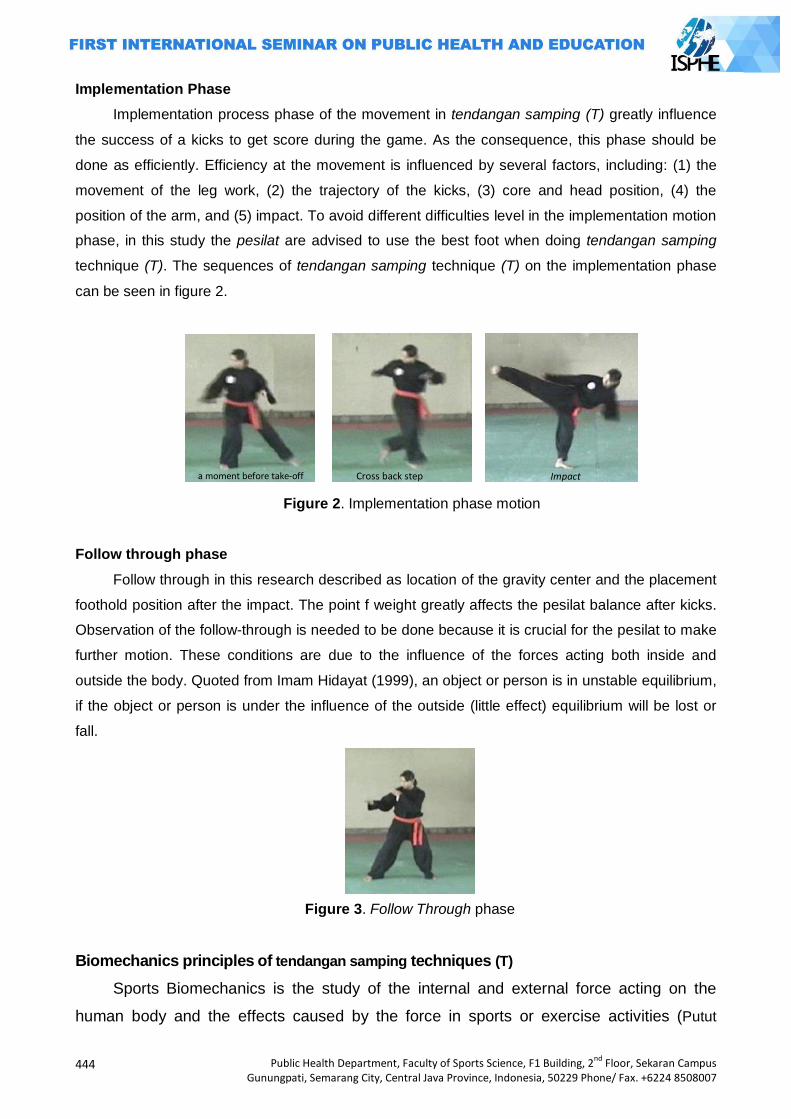
444
Public Health Department, Faculty of Sports Science, F1 Building, 2nd
Floor, Sekaran Campus Gunungpati, Semarang City, Central Java Province, Indonesia, 50229 Phone/ Fax. +6224 8508007
Implementation Phase
Implementation process phase of the movement in tendangan samping (T) greatly influence
the success of a kicks to get score during the game. As the consequence, this phase should be
done as efficiently. Efficiency at the movement is influenced by several factors, including: (1) the
movement of the leg work, (2) the trajectory of the kicks, (3) core and head position, (4) the
position of the arm, and (5) impact. To avoid different difficulties level in the implementation motion
phase, in this study the pesilat are advised to use the best foot when doing tendangan samping
technique (T). The sequences of tendangan samping technique (T) on the implementation phase
can be seen in figure 2.
Figure 2. Implementation phase motion
Follow through phase
Follow through in this research described as location of the gravity center and the placement
foothold position after the impact. The point f weight greatly affects the pesilat balance after kicks.
Observation of the follow-through is needed to be done because it is crucial for the pesilat to make
further motion. These conditions are due to the influence of the forces acting both inside and
outside the body. Quoted from Imam Hidayat (1999), an object or person is in unstable equilibrium,
if the object or person is under the influence of the outside (little effect) equilibrium will be lost or
fall.
Figure 3. Follow Through phase
Biomechanics principles of tendangan samping techniques (T)
Sports Biomechanics is the study of the internal and external force acting on the
human body and the effects caused by the force in sports or exercise activities (Putut
a moment before take-off Cross back step Impact
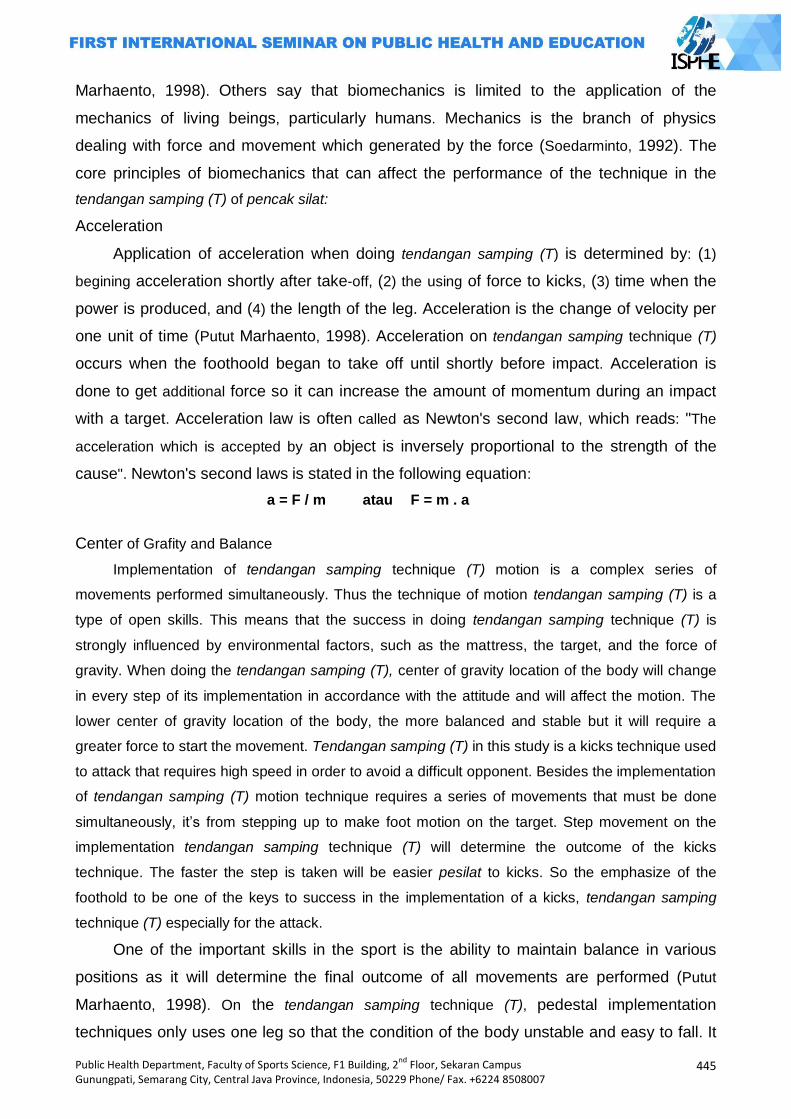
Public Health Department, Faculty of Sports Science, F1 Building, 2nd
Floor, Sekaran Campus Gunungpati, Semarang City, Central Java Province, Indonesia, 50229 Phone/ Fax. +6224 8508007
445
Marhaento, 1998). Others say that biomechanics is limited to the application of the
mechanics of living beings, particularly humans. Mechanics is the branch of physics
dealing with force and movement which generated by the force (Soedarminto, 1992). The
core principles of biomechanics that can affect the performance of the technique in the
tendangan samping (T) of pencak silat:
Acceleration
Application of acceleration when doing tendangan samping (T) is determined by: (1)
begining acceleration shortly after take-off, (2) the using of force to kicks, (3) time when the
power is produced, and (4) the length of the leg. Acceleration is the change of velocity per
one unit of time (Putut Marhaento, 1998). Acceleration on tendangan samping technique (T)
occurs when the foothoold began to take off until shortly before impact. Acceleration is
done to get additional force so it can increase the amount of momentum during an impact
with a target. Acceleration law is often called as Newton's second law, which reads: "The
acceleration which is accepted by an object is inversely proportional to the strength of the
cause". Newton's second laws is stated in the following equation:
a = F / m atau F = m . a
Center of Grafity and Balance
Implementation of tendangan samping technique (T) motion is a complex series of
movements performed simultaneously. Thus the technique of motion tendangan samping (T) is a
type of open skills. This means that the success in doing tendangan samping technique (T) is
strongly influenced by environmental factors, such as the mattress, the target, and the force of
gravity. When doing the tendangan samping (T), center of gravity location of the body will change
in every step of its implementation in accordance with the attitude and will affect the motion. The
lower center of gravity location of the body, the more balanced and stable but it will require a
greater force to start the movement. Tendangan samping (T) in this study is a kicks technique used
to attack that requires high speed in order to avoid a difficult opponent. Besides the implementation
of tendangan samping (T) motion technique requires a series of movements that must be done
simultaneously, it‘s from stepping up to make foot motion on the target. Step movement on the
implementation tendangan samping technique (T) will determine the outcome of the kicks
technique. The faster the step is taken will be easier pesilat to kicks. So the emphasize of the
foothold to be one of the keys to success in the implementation of a kicks, tendangan samping
technique (T) especially for the attack.
One of the important skills in the sport is the ability to maintain balance in various
positions as it will determine the final outcome of all movements are performed (Putut
Marhaento, 1998). On the tendangan samping technique (T), pedestal implementation
techniques only uses one leg so that the condition of the body unstable and easy to fall. It
446
Public Health Department, Faculty of Sports Science, F1 Building, 2nd
Floor, Sekaran Campus Gunungpati, Semarang City, Central Java Province, Indonesia, 50229 Phone/ Fax. +6224 8508007
means that the balance that is required when doing tendangan samping technique (T) is
unstable balance. As the result, the amount of knee flexion at the implementation phase
will give effect to the pesilat equilibrium level in the implementation motion phase.
Lever
Levers are used to gain mechanical advantage, where small force applied will be modified to
tackle and lift big load. The longer arm swing can produce the faster acceleration (Putut
Marhaento, 1998). Application of the lever on the tendangan samping technique (T) when pesilat
take off and impact on the target (or tug). The posistion of foothold and foot swing as a lever
effects on the results of tendangan samping (T) is done by a pesilat.
Force
Force is a quantity that has a direction, then it belongs to the vector magnitude (Putut
Marhaento, 1998). Newton's first law states that "If the resultant force acts on the object is zero
then the object will not move or move straight stationary". On the implementation tendangan
samping technique (T), a pesilat with more height and big body will give greater force to the target
at the time of impact. With great posture the force produced by the body that will be even greater.
Beside that the magnitude of the force is also influenced by the speed used. The higher the speed,
the greater force applied at the movement.
Momentum
Momentum is the result of mass times to speed. The magnitude of the momentum will affect
two objects collide each other (Putut Marhaento, 1998). On the tendangan samping technique (T),
force is done in one direction with motion so that the body mass and velocity when performing the
technique will determine the magnitude of momentum on the tendangan samping (T)
implementation.
Methods
The research design which is used in this study was a descriptive exploratory by using
survey method. Subjects in this study were 8 pesilat tanding category who has been achieved the
national achievement and still active in the Pelatda DIY. The instrument in this study is doing
tendangan samping technique (T) by using best foot. The phase of motion tendangan samping
technique (T) is observed in this study, namely: (1) the first phase, when they do readiness phase,
and (2) the second phase, when they do the movement (a moment before take-off and impact).
Collecting data in this study was done by recording the movement tendangan samping
technique (T) performed by all pesilat tanding category from DIY. Capturing is taken from three
directions, from right side, left side, and back. Furthermore, the data were analyzed by using
Dartfish Prosuite software analysis system. To enhance it, Kinovea software was used.
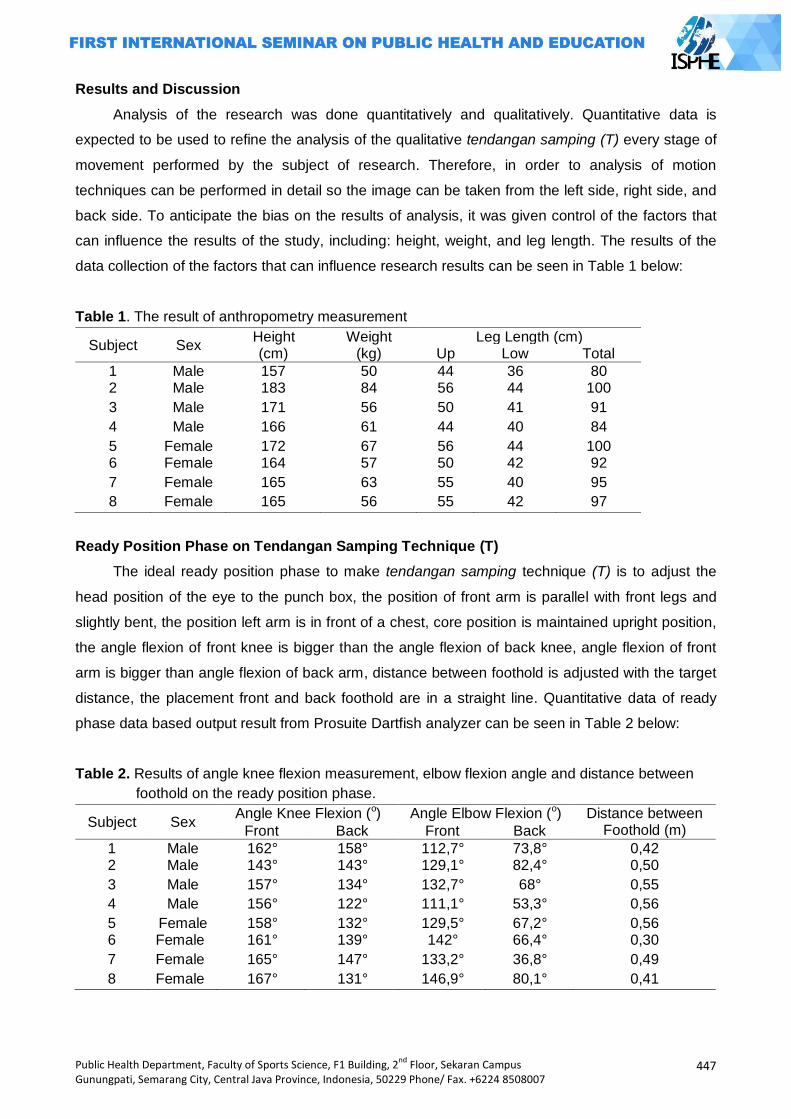
Public Health Department, Faculty of Sports Science, F1 Building, 2nd
Floor, Sekaran Campus Gunungpati, Semarang City, Central Java Province, Indonesia, 50229 Phone/ Fax. +6224 8508007
447
Results and Discussion
Analysis of the research was done quantitatively and qualitatively. Quantitative data is
expected to be used to refine the analysis of the qualitative tendangan samping (T) every stage of
movement performed by the subject of research. Therefore, in order to analysis of motion
techniques can be performed in detail so the image can be taken from the left side, right side, and
back side. To anticipate the bias on the results of analysis, it was given control of the factors that
can influence the results of the study, including: height, weight, and leg length. The results of the
data collection of the factors that can influence research results can be seen in Table 1 below:
Table 1. The result of anthropometry measurement
Subject Sex Height (cm)
Weight (kg)
Leg Length (cm) Up Low Total
1 Male 157 50 44 36 80 2 Male 183 84 56 44 100
3 Male 171 56 50 41 91
4 Male 166 61 44 40 84
5 Female 172 67 56 44 100 6 Female 164 57 50 42 92
7 Female 165 63 55 40 95
8 Female 165 56 55 42 97
Ready Position Phase on Tendangan Samping Technique (T)
The ideal ready position phase to make tendangan samping technique (T) is to adjust the
head position of the eye to the punch box, the position of front arm is parallel with front legs and
slightly bent, the position left arm is in front of a chest, core position is maintained upright position,
the angle flexion of front knee is bigger than the angle flexion of back knee, angle flexion of front
arm is bigger than angle flexion of back arm, distance between foothold is adjusted with the target
distance, the placement front and back foothold are in a straight line. Quantitative data of ready
phase data based output result from Prosuite Dartfish analyzer can be seen in Table 2 below:
Table 2. Results of angle knee flexion measurement, elbow flexion angle and distance between
foothold on the ready position phase.
Subject Sex Angle Knee Flexion (o) Angle Elbow Flexion (o) Distance between
Foothold (m) Front Back Front Back
1 Male 162° 158° 112,7° 73,8° 0,42 2 Male 143° 143° 129,1° 82,4° 0,50
3 Male 157° 134° 132,7° 68° 0,55
4 Male 156° 122° 111,1° 53,3° 0,56
5 Female 158° 132° 129,5° 67,2° 0,56 6 Female 161° 139° 142° 66,4° 0,30
7 Female 165° 147° 133,2° 36,8° 0,49
8 Female 167° 131° 146,9° 80,1° 0,41

448
Public Health Department, Faculty of Sports Science, F1 Building, 2nd
Floor, Sekaran Campus Gunungpati, Semarang City, Central Java Province, Indonesia, 50229 Phone/ Fax. +6224 8508007
In Table 3 can be seen that the measurements result of the amount of angle knee flexion and
angle flexion of the elbow is in conformity with the basic principles of motion tendangan samping
technique (T), except in subject 2. This indicates that the subject has been appropriated
quantitatively in doing ready position phase. The results of a qualitative observation of the
movement tendangan samping technique (T) can be described as follows:
Ready position phase from left side
In this study all the fighters use the right leg to do tendangan samping (T). Based on the
results of image retrieval techniques from the tendangan samping (T) toward the left side, can be
explained as follows: (1) All subjects outlook were on target at ready phase; (2) The position of the
right arm was in front, palm hand as high as waist, and elbows slightly bent with the hands parallel
to the front legs (except in subject 2 and subject 8); (3) The position of the left arm was in front of
the chest with elbow flexion under 90°; and (4) Location of the center of gravity tends between the
two fields, except in subject 2.
Ready position phase from right side
Results of capturing tendangan samping technique (T) from the right side, can be explained
as follows: (1) All Subject eyes were on target when doing the tendangan samping (T); (2) Core
slightly bent on the target except on subject 7 and 8; (3) All feet flat on the mattress, except on
subject 8; and ( 4 ) Distance of foothold in front fo mat with foothold in the back mat were different
between one object to another (between 30 cm - 56 cm).
Ready Position Phase from Back Side
The results capturing of the back tendangan samping technique (T), can be explained as
follows: (1) All subjects were slightly hunched the core on this phase; (2) Position both subject
feethold were in a straight line towards the target, except in subject 2; and (3) The amount of angle
knee flexion of the back leg were different between one subject to another subject (between 131° -
158°).
Overall head position, arm position, core positions, and placement of foothold which is
showed are not good enough. It means that the subject in doing readiness phase is not oriented on
the efficiency of motion but by custom made. If it seen from the angle of knee flexion, indicating
that the location of the center of gravity of the body is charged on the back feet so it is the
advantage for the subject when step in the direction of target motion. However, when it is seen
from togok position that tends to bend resulted testy motion is hampered because the location of
the center of gravity will shift toward the middle and the subject tends to result in a stable position.
Thus the level balance of the subject becomes higher and requires a greater force to begining
movement. In addition, the angle knee flexion on the whole subject is shown effective and efficient
manner so as to affect the motion of steps. This is shown by comparison of the magnitude of the
angle between the knee flexion forelimb and hind limb knee is relatively small.
Public Health Department, Faculty of Sports Science, F1 Building, 2nd
Floor, Sekaran Campus Gunungpati, Semarang City, Central Java Province, Indonesia, 50229 Phone/ Fax. +6224 8508007
449
Implementation of Tendangan Samping Technique (T)
Implementation phase includes a moment before take-off, step, and impact. Accuracy in
carrying out a series of movements that will determine the outcome of the tendangan samping (T)
is performed by the pesilat. The ideal movement on the implementation phase tendangan samping
technique (T) are: (1) head position adjustes to the view on punch box; (2) the movement of the
arm that is in front shifted toward the back of the body and the left arm tends to be drawn towards
the top though remain at the front of the chest; (3) a change in the location of the center of gravity
of the back foot to the front foot immediately before cross step behind; (4) legs which are used to
strike lifted simultaneously with the landing of the hind limbs; (5) waist-high raised knee before
lower leg toward the target; (6) the impact on the entire sole of the foot; (7) two arms tend on the
back body during an impact; and (8) foothold uses back foot on ready phase. The data capturing
on at each implementation phases are as follows.
A moment to Take Off
Shots on stage just before take-off showed that the position of the hind legs of all subjects
just before take-off rests on tip toes while the front knee flexion slightly lowered, except on the
subject 8. This shows that the displacement of the center of gravity lies from back leg to the front
leg. Change the location of the center of gravity toward the forefoot is expected to provide
additional force when the subject stepped motion. The position back foot rests on the tip of the
finger serves to provide additional pressure on the mat, thus simplifying the movement of the hind
legs during take-off.
Step
The capturing result on the stage steps are as follows: (1) Subject 1 showed that: when step
the back foot, front hand slightly pulled toward the back body, front legs lifted towards the right side
along with the back foot landing and then snapped on target; (2) Subject 2 showed that: front hand
drawn to near of the body while the back hand further away from the body at back foot, front foot
raised toward the right side along with the landing legs and then snapped back on target; (3)
Subject 3 showed that: the front arm slightly pulled toward the back of the body while the back arms
raised to near the chest on the back foot, front foot raised toward the right side after landing back
foot and then snapped toward the new target areas; (4) Subject 4 showed that: the front slightly
pulled toward the back body while the back arms raised to near the head during the back foot, front
foot raised toward the right side after landing back foot and then snapped toward the new target
areas; (5) Subject 5 showed that: front hand drawn to near body while the back hand raised to
chest level when the back foot, front foot raised toward the right side (slightly forward) along with
landing legs and then snapped back leads on target); (6) front hand tends quit while back hand is
pulled back slightly towards the back body at back foot, front foot lifted sideways after landing and
subsequent back leg snapped on target; (7) front hand pulled up closer to the body while the back
hand is also drawn to the front to attach to the body at back foot, front foot raised toward the right
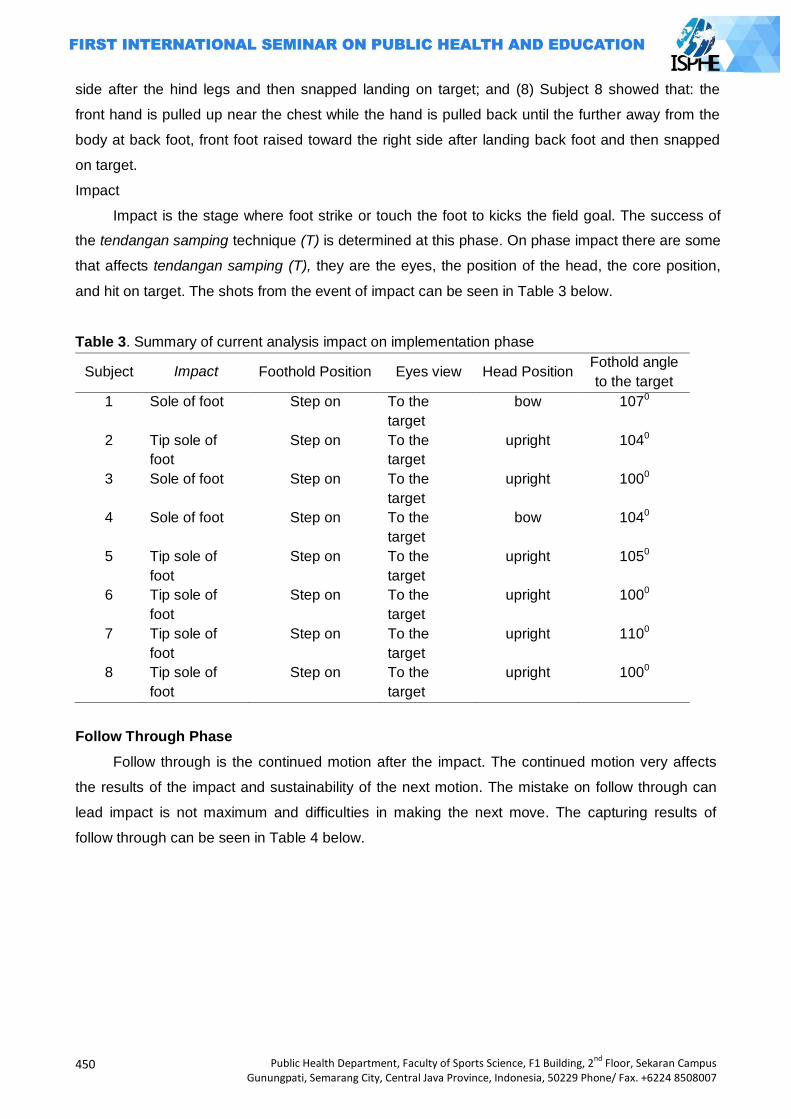
450
Public Health Department, Faculty of Sports Science, F1 Building, 2nd
Floor, Sekaran Campus Gunungpati, Semarang City, Central Java Province, Indonesia, 50229 Phone/ Fax. +6224 8508007
side after the hind legs and then snapped landing on target; and (8) Subject 8 showed that: the
front hand is pulled up near the chest while the hand is pulled back until the further away from the
body at back foot, front foot raised toward the right side after landing back foot and then snapped
on target.
Impact
Impact is the stage where foot strike or touch the foot to kicks the field goal. The success of
the tendangan samping technique (T) is determined at this phase. On phase impact there are some
that affects tendangan samping (T), they are the eyes, the position of the head, the core position,
and hit on target. The shots from the event of impact can be seen in Table 3 below.
Table 3. Summary of current analysis impact on implementation phase
Subject Impact Foothold Position Eyes view Head Position Fothold angle
to the target
1 Sole of foot Step on To the
target
bow 1070
2 Tip sole of
foot
Step on To the
target
upright 1040
3 Sole of foot Step on To the
target
upright 1000
4 Sole of foot Step on To the
target
bow 1040
5 Tip sole of
foot
Step on To the
target
upright 1050
6 Tip sole of
foot
Step on To the
target
upright 1000
7 Tip sole of
foot
Step on To the
target
upright 1100
8 Tip sole of
foot
Step on To the
target
upright 1000
Follow Through Phase
Follow through is the continued motion after the impact. The continued motion very affects
the results of the impact and sustainability of the next motion. The mistake on follow through can
lead impact is not maximum and difficulties in making the next move. The capturing results of
follow through can be seen in Table 4 below.

Public Health Department, Faculty of Sports Science, F1 Building, 2nd
Floor, Sekaran Campus Gunungpati, Semarang City, Central Java Province, Indonesia, 50229 Phone/ Fax. +6224 8508007
451
Table 4. Summary of the analysis on follow through phase
Subject Foot Position
Arm position toward
the body Eyes view
Attack foot Foothold Right Left
1 In front of foot hold Constant Front side Cross in fron Toward the
target
2 In front of foothold Sift to the
back Front side Cross in fron
Toward the
target
3 Cross with the
foothold Constant Cross in fron Cross in fron
Toward the
target
4 Cross with the
foothold
Sift to the
back Cross in fron Back side
Toward the
target
5 In front of foothold Constant Front side Back side Toward the
target
6 Cross with the
foothold Constant Cross in fron Cross in fron
Toward the
target
7 In line with foothold Sift to the
back Front side Back side
Toward the
target
8 In line with foothold Constant Front side Back side Outside the
target
In general, the discussion of data taking about tendangan samping technique (T) are:
Ready position phase on tendangan samping technique (T)
Ready position phase in pencak silat is a basic technique that must be mastered by every
pesilat. In the pencak silat tanding category, ready phase is the initial motion which done by pesilat
before making an attack or a defense in a series of simultaneous motion. So, the ready phase
greatly determines the success of the technique to be performed by the pesilat. Therefore, the
using of ready phase associated with the technique of motion plans that will be done by the pesilat.
Ready position phase in pencak silat is done in accordance with the techniques to be used.
To do a tendangan samping technique (T) is ideally using the sixth ready phase, it‘s the ready
phase which done foothold in front is in a straight line with the back foothold with the position of the
body sideways to the foothold. To gain speed, point weight should be on the back foothold. So the
back leg knee must be bent slightly but not too low, the knee which bent too low will make stable
readiness phase so it will make the balance of body. As the result, early movement of the
tendangan samping (T) tends to be slower. In ready position phase, there are many kinds that
affected: (1) eyes view on the target, (2) position of the arm, (3) maintained core upright position
(4) the angle of front knee flexion, (5) angle knee flexion behind the knee, (6) the distance between
foothold, and (7) the placement of foothold.
Based on the capturing results and the analysis by using Dartfish Prosuite and Kinovea, it
shows that when doing tendangan samping (T), all of the subject's eyes are on target. Back arm
position, almost all subjects‘ arm are positioned in front of the chest with elbow flexion under 900,
which is between 36.80 to 82.40 (except in testy 8). In testy 8, back elbow flexion tends to be
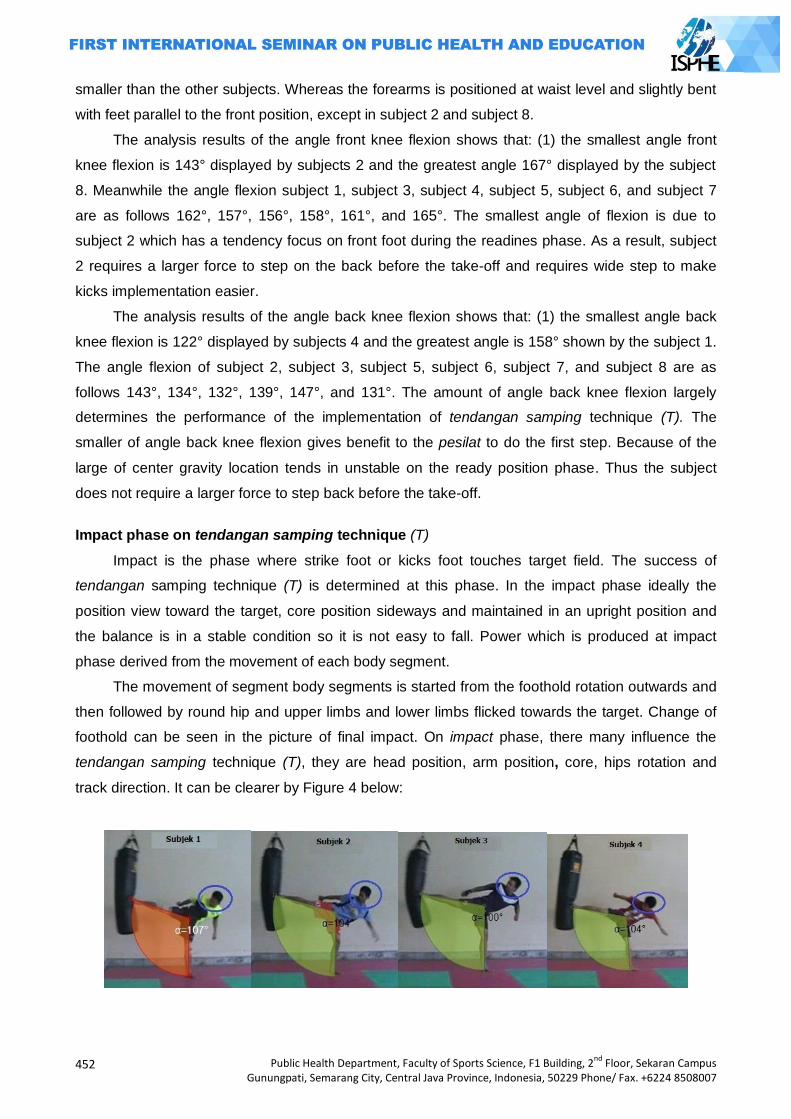
452
Public Health Department, Faculty of Sports Science, F1 Building, 2nd
Floor, Sekaran Campus Gunungpati, Semarang City, Central Java Province, Indonesia, 50229 Phone/ Fax. +6224 8508007
smaller than the other subjects. Whereas the forearms is positioned at waist level and slightly bent
with feet parallel to the front position, except in subject 2 and subject 8.
The analysis results of the angle front knee flexion shows that: (1) the smallest angle front
knee flexion is 143° displayed by subjects 2 and the greatest angle 167° displayed by the subject
8. Meanwhile the angle flexion subject 1, subject 3, subject 4, subject 5, subject 6, and subject 7
are as follows 162°, 157°, 156°, 158°, 161°, and 165°. The smallest angle of flexion is due to
subject 2 which has a tendency focus on front foot during the readines phase. As a result, subject
2 requires a larger force to step on the back before the take-off and requires wide step to make
kicks implementation easier.
The analysis results of the angle back knee flexion shows that: (1) the smallest angle back
knee flexion is 122° displayed by subjects 4 and the greatest angle is 158° shown by the subject 1.
The angle flexion of subject 2, subject 3, subject 5, subject 6, subject 7, and subject 8 are as
follows 143°, 134°, 132°, 139°, 147°, and 131°. The amount of angle back knee flexion largely
determines the performance of the implementation of tendangan samping technique (T). The
smaller of angle back knee flexion gives benefit to the pesilat to do the first step. Because of the
large of center gravity location tends in unstable on the ready position phase. Thus the subject
does not require a larger force to step back before the take-off.
Impact phase on tendangan samping technique (T)
Impact is the phase where strike foot or kicks foot touches target field. The success of
tendangan samping technique (T) is determined at this phase. In the impact phase ideally the
position view toward the target, core position sideways and maintained in an upright position and
the balance is in a stable condition so it is not easy to fall. Power which is produced at impact
phase derived from the movement of each body segment.
The movement of segment body segments is started from the foothold rotation outwards and
then followed by round hip and upper limbs and lower limbs flicked towards the target. Change of
foothold can be seen in the picture of final impact. On impact phase, there many influence the
tendangan samping technique (T), they are head position, arm position, core, hips rotation and
track direction. It can be clearer by Figure 4 below:

Public Health Department, Faculty of Sports Science, F1 Building, 2nd
Floor, Sekaran Campus Gunungpati, Semarang City, Central Java Province, Indonesia, 50229 Phone/ Fax. +6224 8508007
453
Figure 4. Impact phase on tendangan samping technique (T)
From the eight subjects are seemed that all eyes have been on target. However, when
viewed from the head position, it appears that subjects 6 and 8 subjects tend to different from the
other subjects. Beside it is influenced the magnitude force of stomping before the impact, head
position of the subject is greatly influenced by the high impact to the target. The higher impact was
done to the target field will lead head position of head tend to the back can‘t be maintained in an
upright position. This is in accordance with Newton's third law, which reads "When two objects
interact, the force of one object to another object are as big as and opposite direction". It means
that the greater the force on stomping will lead a reaction from the upper body to fight the direction
force from the actions of the foot.
By seeing the performance of eight subjects, it appears that hand position between one
subject to another is relatively different altough they havework principle mostly alike except on the
subject 6. On tendangan samping technique (T) motion, arm movement will determine the level of
impact on the target as well as influenced the magnitude style used to kicks. Arm position of
subject 6 shows that the force which used to perform is relatively small so kicks effect at impact
can‘t maximal. Beside that, front arm position of the subject 6 will tend to inhibit footstrike
movement to the top so that the impact on the target isn‘t high because of the contradictory
movement between arm and strikefoot.
Core in eight position on impact phase is almost the same, except for subject 7 that tend to
bend to the front. The touching between foot and field target on impact for subject 7 uses the tip of
your toes. This make the equilibrium level of subject 7 becomes unstable. As a result, subject 7
should be slightly bent the core to make location alteration of the center of gravity inwards. Thus
the level equilibrium subject 7 can be maintained on impact. However, there are several factors
that may affect core position in subject 7 at impact, they are: the strength of back muscles in
subject 7 is not good enough, the strength of leg muscle in subject 7 is not good enough, and
starting movement in subject 7 is not right.
In the pencak silat Tanding category, foothold position is very influential when doing
tendangan samping technique (T) therefore the function as pivot for every movement of the
segment body. Foothold position all subjects tend to the back, it means opposite with the force
direction done. This is done in order to level balance of the subject can be maintained at impact.
454
Public Health Department, Faculty of Sports Science, F1 Building, 2nd
Floor, Sekaran Campus Gunungpati, Semarang City, Central Java Province, Indonesia, 50229 Phone/ Fax. +6224 8508007
Follow through phase
From the recording data on follow through phase shows various differences from each
subject research. Follow through phase greatly determines the next motion. This research
discusses about the tendangan samping (T) which is udone to attack. For that, pesilat should be
able to perform efficient movement so it will not make next movement more difficult to do. But in
fact, almost all subjects have not shown good motion efficiency on follow through phase (except in
subject 2).
Every movement technique is a sequence that must be done simultaneously from the
starting up to follow through. Therefore, eror motion which is done on one phase will result the
errors motion at next phase. For that, based on the analysis results at follow through phase can be
concluded that the tendangan samping technique (T) which done by a pesilat DIY is still not
efficient enough in a match.
Closing
Based on the data analysis, the conclusions of this study can be presented as follows: (1)
performance of tendangan samping technique (T) of pesilat DIY on ready phase shows that the
angle knee flexion back leg tends to be smaller than the angle knee flexion knee front leg so it is
more efficient to make ready step motion; and (2) performance tendangan samping technique (T)
pesilat DIY impact phase, are: eyes focused on the target, the head position is in line with front
shoulders, and core position tends to the back, and the angle is formed between strike-leg and
foothold at impact between 100°-107°; and (3) performance tendangan samping (T) at follow
through is not efficient yet.
Suggestions that can be conveyed are: (1) It is necessary to socialize the using tool that can
be used for motion analysis as dartfish prosuite, kinovea and others; (2) For further research,
better to use camera that can record the movements which done quickly; (3) More sample is
needed to make the result more clearly; and (4) It‘s need to do analysis of all motion techniques
which used in pencak silat tanding category.
References Agung Nugroho. 2005. Laporan Penelitian Identifikasi Skor Prestasi Teknik Pencak Silat Pada
Kategori Tanding. Yogyakarta: FIK UNY. Hay, James G. 1987. The Biomechanics of sport techniques. Englewood Cliffs, N. J. Prentice-Hall,
Inc. Imam Hidayat. 1999. Biomekanika. Bandung: FPOK IKIP Bandung Johansyah Lubis. 2004. Pencak Silat Panduan Praktis. Jakarta: PT. Rajagrafindo Persada. Kotot Slamet H. 2004. Teknik Dasar Pencak Silat Tanding. Jakarta: PT. Dian Rakyat. O‘ong Maryono. 1999. Pencak Silat Merentang Waktu. Yogyakarta: Galang Pres. Putut Marhaento. 1998. Dasar-Dasar Biomekanika Olahraga. FPOK IKIP Yogyakarta PB. IPSI. 2003. Peraturan PerTandingan Pencak Silat Ikatan Pencak Silat Indonesia. Jakarta: PB.
IPSI. Soedarminto. 1992. Kinesiologi. Jakarta: Departemen Pendidikan dan Kebudayaan. Sukadiyanto. 2005. Pengantar Teori dan Metodologi Melatih Fisik. Yogyakarta: FIK UNY.
Public Health Department, Faculty of Sports Science, F1 Building, 2nd
Floor, Sekaran Campus Gunungpati, Semarang City, Central Java Province, Indonesia, 50229 Phone/ Fax. +6224 8508007
455
REDUCING CHILD MORTALITY
PAPERS

456
Public Health Department, Faculty of Sports Science, F1 Building, 2nd
Floor, Sekaran Campus Gunungpati, Semarang City, Central Java Province, Indonesia, 50229 Phone/ Fax. +6224 8508007
Public Health Department, Faculty of Sports Science, F1 Building, 2nd
Floor, Sekaran Campus Gunungpati, Semarang City, Central Java Province, Indonesia, 50229 Phone/ Fax. +6224 8508007
457
ASSOCIATED FACTORS WITH THE GROWTH AND DEVELOPMENT OF CHILDREN UNDER 5
YEARS OLD
Eny Retna Ambarwati1, Miftah1, Sukani Edi1
1Midwifery Academy of Yogyakarta, Indonesia
Corresponding Author: [email protected]
Abstract Introduction: About 35,4% children under five in Indonesia suffered from developmental
disorders. Data from the health department in 2012 for the growth of children under 5 in less nutritious in DIY counted as 42.41% and by 3.1% of severe malnutrition. The data from the district, the highest children under five that suffering malnutrition and poor was in KulonProgo district is 13.19% and 1.89%. According to Supariasa Lilly (200), postnatal environmental factors are the biggest factor in influencing the growth and development of the childr Methods: This research used observational analytic method, cross sectional approach. Population in the study were all Mothers who have children aged 1-5 years in the area posyanduSumberRejo, Girimulyo, KulonProgo, Yogyakarta. The sampling using total sampling.The collecting data using questionnaires, pre-screening questionnaire growcart and development.analysis to test the hypothesis with chi-square and Kendall tau. Results: Analyzed with chi-square , from the factors analyzed using the chi square of the growth factors showed educational status (p value 0.076> 0.05), economic status (p value 0.042 <0.05), the cultural environment (p value 0.034 <0.05), position of children in the family (p value 0.042 <0.05). to the factors with the development of economic factors obtained results (p value = 0.744> 0.05) environmental cultural factors (p value0, 909> 0.05) and the factor of sports or physical exercise (p value = 0.899> 0.05). while for the data on the social status factor with this development kendall tau using the analysis results obtained p value (o, 039 <0.05). Key Words: Factors, growth, development, toddlers.
Introduction
The growth and development of toddlers are the thing that need to get a big attention. This is
because this is a time of rapid growth and critical, commonly known as the golden period. The
golden period that occurs during the age of the children is a very important period in the
development of the children‘s phase due to the formation of personality and character began in this
period.
In the year of 2007 in Indonesia about 35.4% of children under five who suffer from
developmental disorders such as irregularities in gross motor skills, subtle, emotional and mental
aberrations. Whereas in 2008, the prevalence of growth fell to 23.1%.this is because Indonesia is
progressing in the educational program.
The provincial health profile of DIY in 2011Tri (2012), toddlers growth in 2011 from 39.510
toddlers aged 0 to 1 year was the prevalence of infants with developmental disorders both gross
motor, fine motor, emotional and mental lapses as much as 1,906 (6.82 %). Whereas according to
the health department in 2012 for growing toddlers in the diy as much as 42.41% undernutrition
and poor nutritional as much as 3.1%. for each KulonProgo district is 9.92% and 0.81%, 9.70%
458
Public Health Department, Faculty of Sports Science, F1 Building, 2nd
Floor, Sekaran Campus Gunungpati, Semarang City, Central Java Province, Indonesia, 50229 Phone/ Fax. +6224 8508007
Bantul and GunungKidul 0.44%, 9.22% and 0.69% Sleman, 6.89% and 0.45, Yogyakarta 6,68%
and 0.71%. Data for each district is known that toddlers who suffered the highest malnutrition and
poor were in KulonProgo. The growth and development of young children in the village Girimulyo is
highest number of children under five malnutrition and malnutrition among other villages in
KulonProgo, which is 13.19% and 1.89%.
There are many factors that affect the growth and development of toddlers discrepancy and
maternal health among other economic factors that impact the family eating patterns and nutritional
adequacy of the mother, the cultural factors that support the interests of pregnant and lactating
mothers, who generally low educational factors that impact on maternal knowledge is limited
regarding healthy lifestyles and the importance of nutrition for the mother's health and status of the
mother and child.
The growth process is a continuous process from conception to adult that follows a specific
pattern for each child. Where there is a continuous process and the complex interaction between
genetic factors and environmental factors, either environmental or environment before the child
was born after birth. Postnatal environmental factors are the biggest factor in affecting growth and
development. Another dominant factor affecting the growth and development of the nutritional
status of the baby born.If after the baby is born were malnourished, it can ascertained that the
growth of the children will be stunted.From the data collection that has been done by researchers
in the area of SumberRejo neighborhood health center, Village GirimulyoKulonProgo, Yogyakarta.
SumberRejo neighborhood health center is a purnamastrata. Based on a preliminary study
conducted by researchers, contained in a report obtained records of health. There are 56 infants
were available, the obtained results are less good for growth, there were 14 infants and toddlers for
development there are 3 experiencing delays.
Based on the things above, the researcher is interested in knowing "the Associated Factors
with the growth and development of toddlers in the region of SumberRejo, Girimulyo, KulonProgo,
Yogyakarta.
Methods
The type of observational analytic study using namely by trying to find the relationship
between the variables and make observations or measurements of the various study variables
according to the state of nature, without any intervention by the cross-sectional approach. The
population in this study were all mothers and infants in SumberRejo neighborhood health
center,Girimulyo, KulonProgo, Yogyakarta. The population in this study were 56 infants. This
sampling using total sampling to take all members of the population that being sampled. The
research instrument used in this study is a questionnaire in the form of checklists biographical
data, KPSP and scales. In this study primary data obtained directly from respondents' answers to
questions that poured into the questionnaire. The data analysis using the computer.
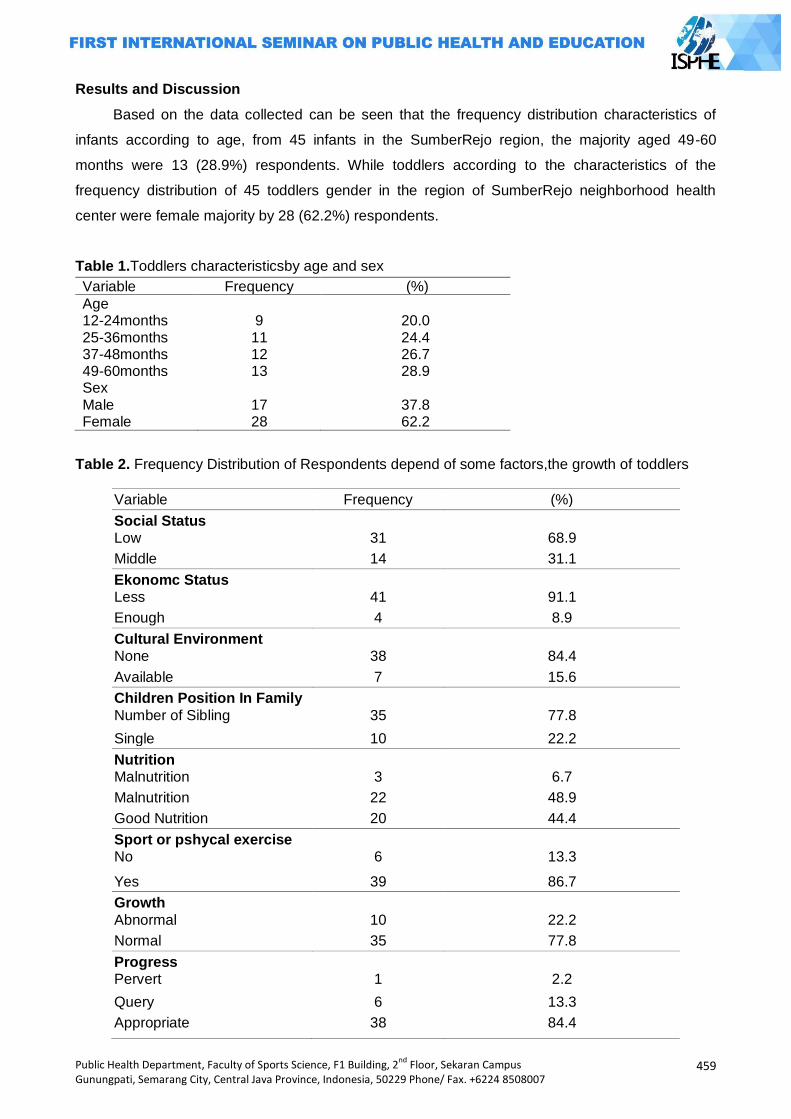
Public Health Department, Faculty of Sports Science, F1 Building, 2nd
Floor, Sekaran Campus Gunungpati, Semarang City, Central Java Province, Indonesia, 50229 Phone/ Fax. +6224 8508007
459
Results and Discussion
Based on the data collected can be seen that the frequency distribution characteristics of
infants according to age, from 45 infants in the SumberRejo region, the majority aged 49-60
months were 13 (28.9%) respondents. While toddlers according to the characteristics of the
frequency distribution of 45 toddlers gender in the region of SumberRejo neighborhood health
center were female majority by 28 (62.2%) respondents.
Table 1.Toddlers characteristicsby age and sex
Variable Frequency (%)
Age 12-24months
9
20.0
25-36months 11 24.4 37-48months 12 26.7 49-60months 13 28.9 Sex Male
17
37.8
Female 28 62.2
Table 2. Frequency Distribution of Respondents depend of some factors,the growth of toddlers
Variable Frequency (%)
Social Status Low
31
68.9
Middle 14 31.1
Ekonomc Status Less
41
91.1
Enough 4 8.9
Cultural Environment None
38
84.4
Available 7 15.6
Children Position In Family
Number of Sibling
35
77.8
Single 10 22.2
Nutrition Malnutrition
3
6.7
Malnutrition 22 48.9
Good Nutrition 20 44.4
Sport or pshycal exercise No
6
13.3
Yes 39 86.7
Growth
Abnormal
10
22.2
Normal 35 77.8
Progress Pervert
1
2.2
Query 6 13.3
Appropriate 38 84.4
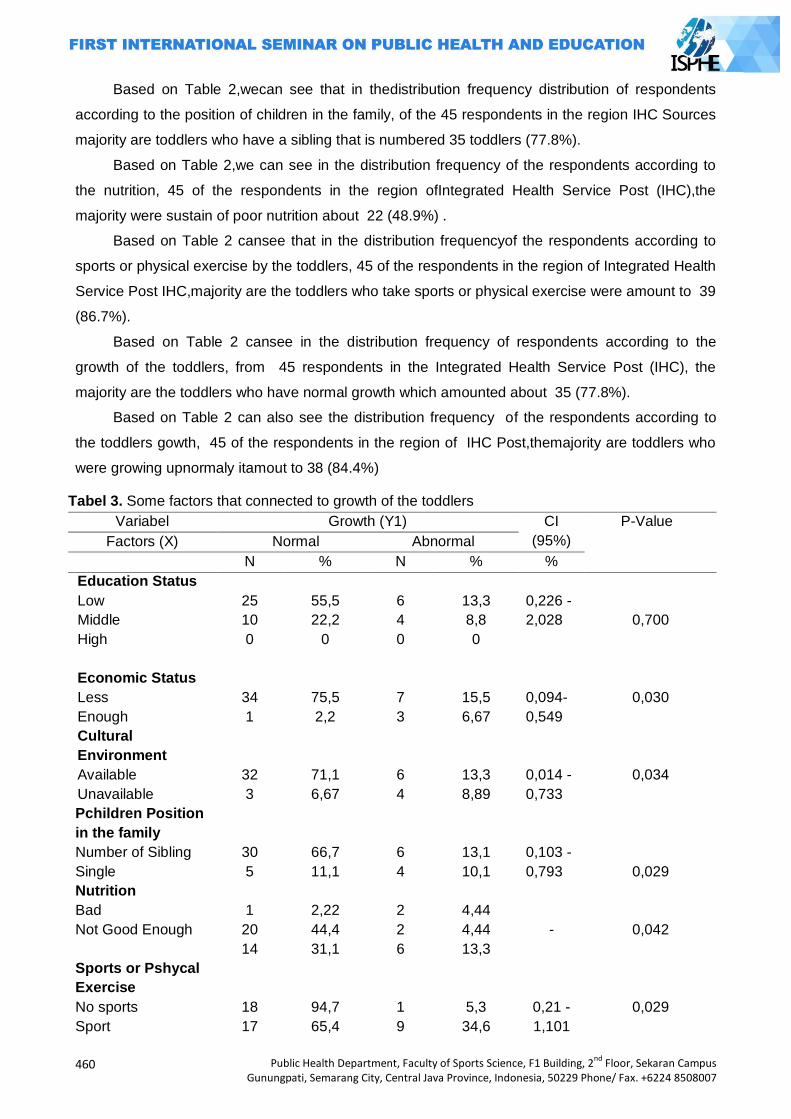
460
Public Health Department, Faculty of Sports Science, F1 Building, 2nd
Floor, Sekaran Campus Gunungpati, Semarang City, Central Java Province, Indonesia, 50229 Phone/ Fax. +6224 8508007
Based on Table 2,wecan see that in thedistribution frequency distribution of respondents
according to the position of children in the family, of the 45 respondents in the region IHC Sources
majority are toddlers who have a sibling that is numbered 35 toddlers (77.8%).
Based on Table 2,we can see in the distribution frequency of the respondents according to
the nutrition, 45 of the respondents in the region ofIntegrated Health Service Post (IHC),the
majority were sustain of poor nutrition about 22 (48.9%) .
Based on Table 2 cansee that in the distribution frequencyof the respondents according to
sports or physical exercise by the toddlers, 45 of the respondents in the region of Integrated Health
Service Post IHC,majority are the toddlers who take sports or physical exercise were amount to 39
(86.7%).
Based on Table 2 cansee in the distribution frequency of respondents according to the
growth of the toddlers, from 45 respondents in the Integrated Health Service Post (IHC), the
majority are the toddlers who have normal growth which amounted about 35 (77.8%).
Based on Table 2 can also see the distribution frequency of the respondents according to
the toddlers gowth, 45 of the respondents in the region of IHC Post,themajority are toddlers who
were growing upnormaly itamout to 38 (84.4%)
Tabel 3. Some factors that connected to growth of the toddlers
Variabel Growth (Y1) CI
(95%)
P-Value
Factors (X) Normal Abnormal
N % N % %
Education Status
Low
Middle
High
Economic Status
Less
Enough
25
10
0
34
1
55,5
22,2
0
75,5
2,2
6
4
0
7
3
13,3
8,8
0
15,5
6,67
0,226 -
2,028
0,094-
0,549
0,700
0,030
Cultural
Environment
Available
Unavailable
32
3
71,1
6,67
6
4
13,3
8,89
0,014 -
0,733
0,034
Pchildren Position
in the family
Number of Sibling
Single
30
5
66,7
11,1
6
4
13,1
10,1
0,103 -
0,793
0,029
Nutrition
Bad
Not Good Enough
1
20
14
2,22
44,4
31,1
2
2
6
4,44
4,44
13,3
-
0,042
Sports or Pshycal
Exercise
No sports
Sport
18
17
94,7
65,4
1
9
5,3
34,6
0,21 -
1,101
0,029
Public Health Department, Faculty of Sports Science, F1 Building, 2nd
Floor, Sekaran Campus Gunungpati, Semarang City, Central Java Province, Indonesia, 50229 Phone/ Fax. +6224 8508007
461
Based on Table 3 it can be see 45 of the respondents in the region of Integrated Health Service
Post ( IHC) in SumberRejo, in the social status factor (education) with normal and abnormaly
growth, themajority were the toddlers who have the low social status (education) as much as 25
(55.5%) respondents and 6 (13.3%) respondents. On the economic status factors with normal and
abnormaly growth,the majority are families who were less economic status of as much as 34
(75.5%) respondents, and 7 (15.4%) respondents. In the culturalenvironment factors with normal
and abnormal growth of the majority that there is a culture toddler environment thereby affecting
the growth of as many as 32 (71.1%) respondents and 6 (13.3%) respondents.
Based on Table 3 it can be see also from the 45 respondents in the region of SumberRejo
IHC Post, the position of the child within the family factor with normal and abnormal growth of the
majority were the toddler who already have relatives that as many as 30 (66.7%) respondents and
6 (3, 1%) of the respondents. In normal growth factors with the majority of the nutrients are children
under five suffering malnutrition as many as 20 (44.4%) respondents. While nutritional factors with
abnormal growththe majority are under five with good nutrition is as much as 6 (13.3%)
respondents.
Based on Table 3 it can be seen from 45 respondents in the region IHC Sources rejo, in
Sport or Physical factors with the normal growth of the majority of infants who are given no
exercise or physical exercise by parents that sebanyak18 (94.7%) respondents. While sports or
physical exercise factor with the majority of growth is not normal toddler given sport or physical
exercise by their parents as many as 9 (34.6%) respondents.
In the social status factor (education) with growth data were analyzedusing the chi-square
value of α = 0.05. In this analyze of the obtained results (p value = 0.0763> 0.05) then Ho is
accepted and Ha is rejected. It can be concluded there is no association between social status with
the growth of children aged 12-60 months.
While the factors of economic status, cultural environment, the position of children in the
family, nutrition and exercise or physical exercise data were analyzed using the chi-square value of
α = 0.05. On the status ofeconomicanalyze ofthe obtained results(p value 0.042<0.05), obtained
bythe analysis ofthe cultural environmentresults(p value 0.034<0.05), the position ofthechildin the
familyobtainedthe results ofthe analyze(p value 0.049<0.05), analyzeofthenutrition obtained
results(p value 0.042<0.05) andsportsorphysicalexerciseanalysis ofthe obtained results(p value
0.029<0.05). Then Ho is rejectedandHa accepted. Can beconcluded that there isa
relationshipbetweeneconomicstatus, culturalenvironment, the position ofchildren in the family,
nutritionandexerciseorphysical exercisegrowthof children aged12-60months.
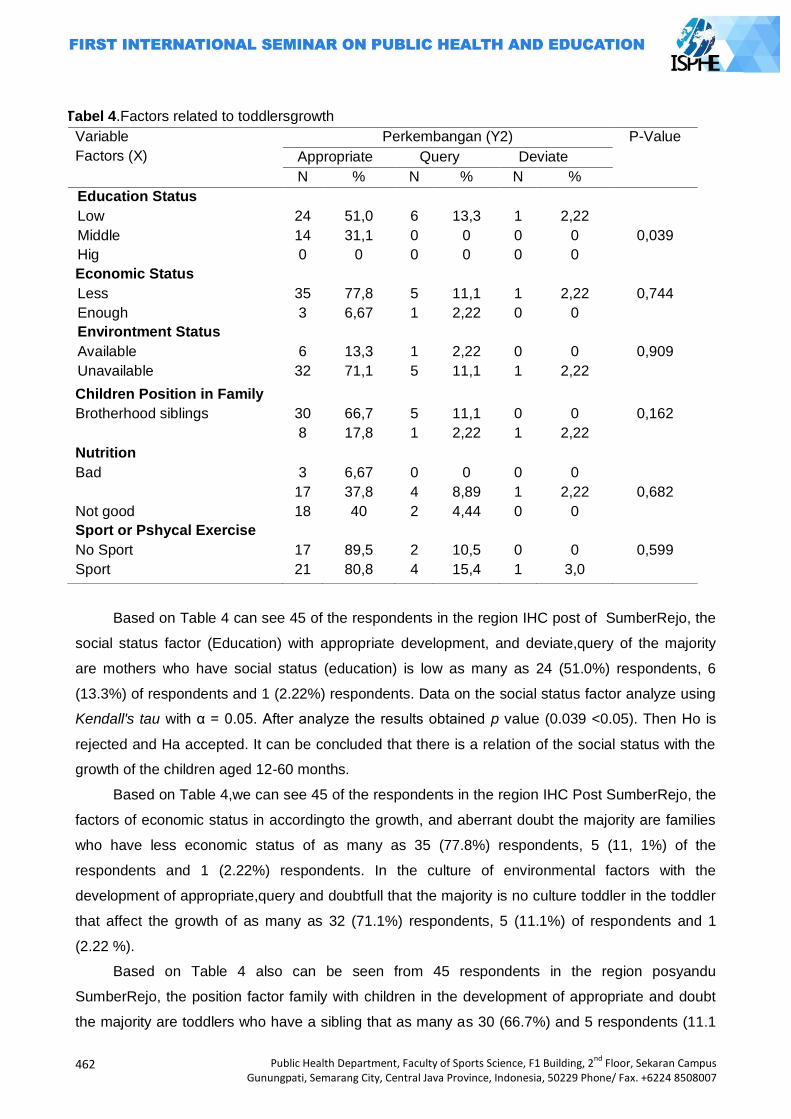
462
Public Health Department, Faculty of Sports Science, F1 Building, 2nd
Floor, Sekaran Campus Gunungpati, Semarang City, Central Java Province, Indonesia, 50229 Phone/ Fax. +6224 8508007
Based on Table 4 can see 45 of the respondents in the region IHC post of SumberRejo, the
social status factor (Education) with appropriate development, and deviate,query of the majority
are mothers who have social status (education) is low as many as 24 (51.0%) respondents, 6
(13.3%) of respondents and 1 (2.22%) respondents. Data on the social status factor analyze using
Kendall's tau with α = 0.05. After analyze the results obtained p value (0.039 <0.05). Then Ho is
rejected and Ha accepted. It can be concluded that there is a relation of the social status with the
growth of the children aged 12-60 months.
Based on Table 4,we can see 45 of the respondents in the region IHC Post SumberRejo, the
factors of economic status in accordingto the growth, and aberrant doubt the majority are families
who have less economic status of as many as 35 (77.8%) respondents, 5 (11, 1%) of the
respondents and 1 (2.22%) respondents. In the culture of environmental factors with the
development of appropriate,query and doubtfull that the majority is no culture toddler in the toddler
that affect the growth of as many as 32 (71.1%) respondents, 5 (11.1%) of respondents and 1
(2.22 %).
Based on Table 4 also can be seen from 45 respondents in the region posyandu
SumberRejo, the position factor family with children in the development of appropriate and doubt
the majority are toddlers who have a sibling that as many as 30 (66.7%) and 5 respondents (11.1
Tabel 4.Factors related to toddlersgrowth
Variable
Factors (X)
Perkembangan (Y2) P-Value
Appropriate Query Deviate
N % N % N %
Education Status
Low
Middle
Hig
Economic Status
Less
Enough
24
14
0
35
3
51,0
31,1
0
77,8
6,67
6
0
0
5
1
13,3
0
0
11,1
2,22
1
0
0
1
0
2,22
0
0
2,22
0
0,039
0,744
Environtment Status
Available
Unavailable
6
32
13,3
71,1
1
5
2,22
11,1
0
1
0
2,22
0,909
Children Position in Family
Brotherhood siblings
30
8
66,7
17,8
5
1
11,1
2,22
0
1
0
2,22
0,162
Nutrition
Bad
Not good
3
17
18
6,67
37,8
40
0
4
2
0
8,89
4,44
0
1
0
0
2,22
0
0,682
Sport or Pshycal Exercise
No Sport
Sport
17
21
89,5
80,8
2
4
10,5
15,4
0
1
0
3,0
0,599
Public Health Department, Faculty of Sports Science, F1 Building, 2nd
Floor, Sekaran Campus Gunungpati, Semarang City, Central Java Province, Indonesia, 50229 Phone/ Fax. +6224 8508007
463
%) respondents. While the majority of the aberrant development of a child is a toddler whose sole
yaiti 1 (2.22%) respondents.
Based on Table 4 it can be seen from 45 respondents in the region posyandu Sources rejo,
nutritional factors perkebangan accordance with the majority of infants who are well-nourished as
many as 18 (40%) of the respondents, the majority of development is aberrant meragukandan
toddlers who have malnutrition that is 4 (8.89%) of respondentsand 1 (2.22%) respondents.
Based on Table 4 also can be seen from 45 respondents in the region posyandu Sources
rejo, in sports or physical exercise factors in the development of appropriate, doubt and stray
toddlers majority is given sport or physical exercise by as many as 21 parents (80.8% )
respondents, 4 (15.4%) of respondents and 1 (3.0%) respondents.Data factors associated with the
development were analyzed using the chi-square value of α = 0.05. In the analysis of economic
factors obtained results (p value = 0.744> 0.05), in the environment of cultural factors obtained
results (p value = 0.909> 0.05), the position of the child in the family factor obtained results (p
value = 0.162> 0.05), on nutritional factors obtained results (p value = 0.682> 0.05), and the factor
of exercise or physical laitihan obtained results (p value = 0.599> 0.05), then Ho is accepted and
Ha is rejected. It can be concluded no Hubu with the economic, cultural environment, the position
of children in the family, nutrition and exercise or physical exercise with the development of
children aged 12-60 months.
Relations factors associatedwithtoddlergrowthin ruralareas IHC Girimulyo,
KulonProgoYogyakarta 2014.
The results of research among the indepenence variable and dependent variable analysis
that has been done the results obtained p value> 0.05), these variables are including:
The results based on the social status of mothers with infant growth in the region was obtained
SumberRejo IHC (p value = 0.700> 0.05), indicating that there was no significant relationship
between social status of the mothers with toddlers.
Mother's lack of knowledge and education of the parents, especially the mother is the most
important factor underlying cause because it affects the ability of individuals, families, and
communities in managing existing resources to obtain adequate food ingredients as well as the
extent to which health care facilities, nutrition, and environmental sanitation are available used as
well as possible for growth. So with low levels of education can lead to lack of understanding of
what is required tooptimal development of children's upbringing, so for social status has more
influence on the growth of early childhood development.
These results are consistent with research Suhendri, which revealed no significant
relationship between maternal education with the growth of children under 5 years (Toddlers)11 and
also in line with research Hartono, which revealed no relationship between the growth of children
aged 6-12 months with mother's education2While the results of research among indepenent
variable and dependent variable analysis has been done also obtained results p value <0.05),
464
Public Health Department, Faculty of Sports Science, F1 Building, 2nd
Floor, Sekaran Campus Gunungpati, Semarang City, Central Java Province, Indonesia, 50229 Phone/ Fax. +6224 8508007
these variables are:The first visible results of the study based on the economic status of families
with children under five in the region growth IHC SumberRejo obtained results (p value 0.042
<0.05), indicating that there is a significant relationship between the economic status of infant
growth.
Economic status may also affect the growth and development with children. Families who
have a child with a high economicgeneral nutritional needs is quite good compared to the low
socioeconomic children. Likewise, children from low-income families, lack of nutrition makes
children less intelligent and would be difficult to accept referrals from other health services that
support in assisting the growth and development of children.These results are consistent with
research Suyanto, A, which revealed that there is no significant relationship between family
socioeconomic level with growth of toddlers(Sundari, 2009).
The results of the second study described a culture based environment with growth in the
region toddler IHC SumberRejo obtained (p value 0.034 <0.05), indicating that there is a significant
relationship between culture Surrou with growing toddlers. This result is consistent with the results
of the study Soedjatmiko, which mention that growth and development of infants and toddlers are
especially influenced by Surrou with micro (mother) and mini-environments (family). Mother as
caregiver nearest child should know more processes of growth andchild development and the
factors that affect the process, but not in accordance with the results of developmental research
that says there is no connection between the cultural environment with the development (Suyanto,
2004).
The third study described results based on the position of children in families with toddlers in
the IHC SumberRejo obtained (p value 0.029 <0.05), indicating that there is a significant
relationship between the position of the child in the family with toddlers. For the position of the child
within the family itself can affect growth and development and is associated with significant
toddlers. In the first child, or a single, general intellectual abilities more prominent and fast growing
because often interact with adults. However, their motor skills are sometimes late because no
stimulation is usually performed sisterskandungnya(Hidayat, Aziz, 2008).
The fourth describes the results of research based nutrition with growth of infants in the IHC
region rejo source obtained (p value 0.042 <0.05), it isshows that there is a significant relationship
between nutrition with growth of infants. Nutrition is a critical component in supporting the
sustainability of growth and development. Nutrition becomes a need to grow and develop during
infancy. There is a need nutrients necessary nutrients for growth and development such as
proteins, carbohydrates, fats, minerals, vitamins, and water. If a person's nutritional needs are not
met, or less able to inhibit the growth and its development14. These results are in line with research
Lindawati, which revealed no significant relationship between the nutritional status of children
preschool aged 4 growth.
Public Health Department, Faculty of Sports Science, F1 Building, 2nd
Floor, Sekaran Campus Gunungpati, Semarang City, Central Java Province, Indonesia, 50229 Phone/ Fax. +6224 8508007
465
The fifth describes the results of research by sports or physical exercise with infant growth in
the region was obtained SumberRejo IHC (p value 0.029 <0.05), indicating that there is a
significant relationship between exercise or physical exercise with infant growth.
The process of child development can take place naturally, but the process is highly
dependentthe adults or the elderly. Important period in the development of the child is infancy.
Because at this time the base will affect the growth and development of the child determines the
next. In infancy, the development of language skills, creativity, social awareness, emotional, and
intelligence runs very fast and is a cornerstone of the next progression. Moral development as well
as the basics of personality is also formed in this period. During the critical period, the necessary
stimulation or stimulation that is useful for developing potential. The development of the child will
be optimal when the interaction is an order to the needs of children at different stages of
development, even as a baby still in uterus (Lily, 2003).
Of the theory can be explained that the provision of physical exercise is very important to the
growth and development of infants. These results are also in line with research Natalya, W, et al,
there is a link that explains the sport and physical exercise with the growth and development of
parents of children aged 1-3 years in the Village KampilWiradesa District of Pekalongan.
Researchers suggest parents to provide stimulation, exercise, and physical exercise is good for
their children to improve perkembangannya(Natalya dkk, 2007).
Relations factors related development stoddler In IHC regional resource rejo Girimulyo
Village, Kulon Progo Yogyakarta 2014.
The results of research among indepenent variable and dependent variable analysis that has
been done the results obtained p value> 0.05), these variables include:
The first study that is between the economic status of early childhood development obtained
results (p value = 0.744> 0.05), it can be concluded that there is no relationship with the economic
status of early childhood development. These results are consistent with research Sani, MY which
revealed no relationship between revenue with the development of children aged 1-5 years(Sani,
2014).
While the culture of early childhood development environment with the obtained results (p
value = 0.909> 0.05), it can be concluded that there is no relationship between the cultural
environment of early childhood development. According Sodjatmiko, This can be affected due to
the many different and toddler child care at home.
Future studies are among the position of children in families with early childhood
development obtained results (p value = 0.162> 0.05), it can be concluded that there is no
relationship between the position of children in families with early childhood development. The
results of the data is consistent with the theory development in JaenudinSutoto E, which states that
there is no significant relationship between the position yan child in the family with the growth and
development of balita (Jaenudin, 2000).
466
Public Health Department, Faculty of Sports Science, F1 Building, 2nd
Floor, Sekaran Campus Gunungpati, Semarang City, Central Java Province, Indonesia, 50229 Phone/ Fax. +6224 8508007
While the nutritional factors with early childhood development obtained results (p value =
0.682> 0.05), it can be concluded that there is no relationship between nutrition in early childhood
development. The results are in line with research Sutiari, N. K &Wulandari DAR, which revealed
no relationship between the nutritional status of the development balita.12 last factor is between
sports or physical exercise results obtained with early childhood development (p value = 0.599>
0.05), then it can be concluded that there is no relationship between sports or physical exercise
with early childhood development.
These results are consistent with research Sundari, who said there was no relationship
meaningful practice in the train toddler toddler's mother to do physical exercise to the health center
in the area ofearly childhood development Sudomoyo(Sudarti, Endang, 2010).As for the
independent variables and the dependent variable is obtained after analyzed by p value <0.05.
These variables are:Factor of social status with early childhood development obtained results (p
value 0.039 <0.05), it can be concluded that there is a relationship with the social status of early
childhood development. These results are consistent with research Sani, MY, which revealed no
relationship between education and development of children aged 1-5 years(Sani, 2014).
Closing
Based on the results of research on the factors associated with the growth and development
with a toddler in the IHC region Sumber Rejo can be concluded that:
The results of the analysis of the factors associated with the growth and development of the
toddlers obtained results that ther is no relation between of the growth factors with toddlers,
including the status factor sosial13. While that is not related to early childhood growth, such as
economic status, cultural environment, the position children in the family, nutrition, and sports or
physical exercise.
The results of the analysis of the factors associated with the growth and development of
infants is no relationship between the results obtained factors with infant growth, including the
factor of economic status, cultural environment, the position of children in the family, nutrition, and
sports or physical exercise. While there is a correlation with childhood growth, including the social
status.
Based on these conclusions, the authors can suggest some things that might be useful:
For Institutional Midwifery Academy of Yogyakarta expected that the results of this study can
provide insight as well as for institutional knowledge can be disseminated among other institutions
and can be applied in the institution. Work for the special people expected her parents to increase
knowledge about the nutritional needs of children and the development of children, so that parents
can implement a better upbringing, can stimulate a child's development and ensure optimal child
development can take place with well aligned in terms of physical, mental and psychosocial.
For researchers the need for further research with variables or other factors related to growth
and development of the toddlers ages of 12-60 months. And subsequent research should be the
Public Health Department, Faculty of Sports Science, F1 Building, 2nd
Floor, Sekaran Campus Gunungpati, Semarang City, Central Java Province, Indonesia, 50229 Phone/ Fax. +6224 8508007
467
development of measuring instruments for use KPSP no longer so much better result, other tools
such as the Denver etc.. For midwives for midwives are expected to further improve the quality of
care, especially in young children, especially when posyandu child growth monitoring and early
detection routine childhood developmental disorders. So that toddlers who have growth and
development that does not fit can be detected and handled properly and quickly.
References
DepKes, RI. 2009. Pedoman Pelaksanaan Stimulasi, Deteksi Dan Intervensi Dini Tumbuh Kembang Anak Di Tingkat Pelayanan Kesehatan Dasar. Jakarta: Departemen Kesehatan RI.
Hastono, Sabri. 2007. Statistik Kesehatan. Bandung : Raja Grafindo Perdasa. Hidayat, Aziz, A. 2008. Pengantar Ilmu Kesehatan Anak Untuk pendidikan Kebidanan. Jakarta :
Salemba Medika Jaenudin E . 2000. Stimulasi Keluarga Pada Perkembangan Bicara Anak Usia 6 Sampai 36 Bulan
Di Kelurahan Kuningan, Semarang Utara. (http://eprin ts.undip.ac.id/12544/1/2005PPDS455.pdf). Diakses tanggal 9 April 2014, Pukul 00.10 WIB.
Kania, N. 2006. Stimulasi Tumbuh Kembang Anak Untuk Mencapai Tumbuh Kembang Yang Optimal. (http://pustaka.unpad.ac.id/wpcontent/uploads/2010/02/stimulasi_tumbuh_kembang_anak_optimal.pdf).Diakses tanggal 10 April 2014, Pukul : 19. 23 WIB.
Lindawati. 2014. Faktor-Faktor yang Berhubungan Dengan Perkembangan Motorik Anak Usia Pra Sekolah (http://www.poltekkesjakarta1.ac.id/read-el-io-%20faktor-faktor-yang-berhubungan-dengan-perkembangan). Diakses tanggal 9 April 2014, Pukul : 21.00 WIB.
Lilly. 2003. Opening lilly. (http://addy 1571.files.wordpress.com). Diakses tang gal 0 Desember 2013. Pukul : 17.00 WIB.
Natalya, W, dkk.2007. HubunganStimulasi Orang TuaDenganPerkembanganAnakUsia 1-3 Tahun di DesaKampilKecamatanWiradesaKabupatenPekalongan. (http://www.e-skripsi.stikesmuh-pkj.ac.id). Diakses tang gal 10 April 2014, Pukul : 20.30 WIB.
Sani, M Y. 2014. Faktor-Faktor Yang Berhubungan Dengan Peran Ibu Dalam Menstimulasi Perkembangan Anak Balita (1-5 Tahun 2014). (http://nandarnurse.blogspot.com/2014/03/normal-0-false-false-false-en-usnone.html#axzz2yOnMlCin). Diakses tanggal 9 April 2014, Pukul : 20.00 WIB.
Sudarti, K, Endang. 2010. Asuhan Kebidanan Neonatus, Bayi, dan Anak Balita. Yogyakarta: Nuha Medika.
Suhendri, U. 2009. Faktor-Faktor Yang Berhubungan Dengan Status Gizi Anak Usia Dibawah 5 ahun Di Puskesmas Sepatan Kecamatan Sepatan Kabupaten Tanggerang Tahun 2009.(t.ac.id/dspace/bitstream/123456 789/2396/1/UCU%20SUHENDRI-FKIK.pdf. Diakses Tanggal 9 April 2014, Pukul : 19.00 WIB.
Sundari. 2009. Hubungan Penge- tahuan, Sikap, Dan Praktik Ibu Balita Dengan Stimulasi Dan Deteksi Dini Tumbuh Kembang Balita Di Wilayah Puskesmas Karangawen Ii Kabupaten Demak. (http://eprints.undip.ac.id /6155/1/3612.pdf). Diakses tanggal 10 April 2014, Pukul : 19.00 WIB.
Sutiari, N. K & Wulandari DAR .2011. Hubungan Status Gizi Balita dengan Pertumbuhan dan Perkembangan Anak Prasekolah di Desa Peguyangan, Kota Denpasar.(http://poltekkes-denpasar.ac.id/files/JIG/V2N2 /sutiari. pdf).Diakses tanggal 9 April 2014, Pukul : 20.10 WIB.
Suyanto, A. 2004. Hubungan Tingkat SosialEkonomiKeluarga Dan
KondisiSanitasiLingkunganDenganPertumbuhanBalita Di PropinsiJawa Tengah Tahun 2001-2002 (Correlation Between Household Sosio-Economic Level And Environmental Sanitation Condition With Underfive Years Old Children Growth In Central Java Province In 2001-2002). (http://eprints.undip.ac.id/14926/). Diakses tanggal 9 April 2014, Pukul : 20.10 WIB.
Soedjatmiko. 2001. Deteksi Dini Gangguan Tumbuh Kembang Balita. (http://saripediatri.idai.or.id/pdfile/3-3-12.pdf). Diakes tanggal 27 Mei 2014, Pukul : 10.00 WIB
Soetjiningsih. 2012. Tumbuh Kembang Anak. Jakarta: Buku Kedokteran EGC.

468
Public Health Department, Faculty of Sports Science, F1 Building, 2nd
Floor, Sekaran Campus Gunungpati, Semarang City, Central Java Province, Indonesia, 50229 Phone/ Fax. +6224 8508007
Tri. 2012.Hubungan Antar Pemberian Stimulasi Dini Oleh Ibu dengan Perkembangan Balita Di Taman Dalita Mithia Sido Arum, Sleman Yogyakarta. (http ://e-journal.respati.ac.id). Diakses
tanggal 17 September 2013, Pukul : 13.15 WIB.
Public Health Department, Faculty of Sports Science, F1 Building, 2nd
Floor, Sekaran Campus Gunungpati, Semarang City, Central Java Province, Indonesia, 50229 Phone/ Fax. +6224 8508007
469
IMPROVING HEALTH, CHILDCARE, AND
QUALITY OF MOTHER
PAPERS

470
Public Health Department, Faculty of Sports Science, F1 Building, 2nd
Floor, Sekaran Campus Gunungpati, Semarang City, Central Java Province, Indonesia, 50229 Phone/ Fax. +6224 8508007
Public Health Department, Faculty of Sports Science, F1 Building, 2nd
Floor, Sekaran Campus Gunungpati, Semarang City, Central Java Province, Indonesia, 50229 Phone/ Fax. +6224 8508007
471
LOTUS BIRTH IN RELATIONSHIP WITH GROWTH AND DEVELOPMENT STATUS OF INFANTSAGES 0-12 MONTHS IN THE YEAR 2013 BPM Tegal
Siswati1, Ani Margawati2, Mundarti3
1STIKES Bhakti Mandala Husada Slawi, Indonesia
2Diponegoro University, Indonesia 3Polytechnic Semarang, Indonesia
Corresponding Author: [email protected]
Abstract Introduction:Monitoring the growth and development of children since birth is very important.
When the birth of a baby with vacuum extraction or forceps can cause trauma to the baby's head so that the risk of damage to brain tissue that will affect the growth and development of infants. To minimize trauma to the baby's birth is the result of process which is a lotus birth childbirth without clamping the umbilical cord as it is not prefebly to do, let alone to cut the umbilical cord, and the cord is left alone to be separated from the baby naturally that lotus-born babies do not experience trauma and injury to the cord. Methods: The study is a survey of a case control analytic approach. Univariate and bivariate data analysis by using Spearman's Rhotest. Results: The status of the growing baby nour is hed all. Developmental status of infants aged 0-12 month swith a lot us birth number of 14 respondents (93.3%) with normal development and one respondent (6.7%) with the development of thed oubt. While no lotus birth in infants aged 0-12 month swith no normal development, the development ofa number of dubious13 respondents (86.7%) and the development of the irregularities number 2 respondents (13.3%). Significant relationship with p=0.000 (p <0.05) between birth lotus birth with growth status and development of infants aged 0-12 months. Key Words:Lotus birth, growth and developmental baby age 0-12 months Introduction
Monitoring the growth of children since beeing born is very important. Besides being able to
determine the normal pattern of growth in children, also determine the problem and the factors that
affect and interfere with the growth of the child from an early age. When known, the early growth
disorder prevention and treatment of these disorders can be overcome since early age.
One of Intranatal factors that affects the growth and development early on is how/birth
process. When the baby's birth with vacuum extraction or forceps can cause trauma to the baby's
head so that the risk of damage to brain tissue that will affect the growth and development of
infants. To minimize trauma to the baby as a result of the birth process with birth lotus which is the
labor process without clamp the umbilical cord as it is not preferebly to do, let alone to cut the
umbilical cord, and the cord is left alone to be separated from the baby naturally. With lotus-born
babies do not experience trauma and injury to the cord. The placenta is a source of blood for
infants that contain many stem cells, iron, oxygen, hormones and enzymes. One third of the total
blood supply is derived from the placenta to the baby through the umbilical cord is supplied. When
a new baby is born, the umbilical cord after a while will be clamped in two places and then be cut
between them and in a matter of minutes later, the placenta participate born. That's the delivery
472
Public Health Department, Faculty of Sports Science, F1 Building, 2nd
Floor, Sekaran Campus Gunungpati, Semarang City, Central Java Province, Indonesia, 50229 Phone/ Fax. +6224 8508007
procedure in accordance with the normal standard of care delivery that we always apply to the
current. However, there is a phenomenon called lotus birth. From the research, Sarah Buckley, MD
and International Midwife Robin Lim is the absence of weight loss dilaporkan (Marmi and Kukuh R,
2012; Menkes RI, 2010)
Chief of Obstetrics Gynecology Subdepartemen RSAL, Dr. Ramelan, Surabaya also said
that, as long as the placenta is still attached to the mother, there is blood flow from the placenta
enter the baby's body. There are some mothers who believe that the unity between the mother, the
baby, and the placenta should not be terminated just like that. Considered there is an energy that
strengthens a baby when close to the placenta. Thus, breaking the umbilical cord is left alone.
Lotus birth is actually also has many benefits and some of the advantages to the baby, as if
allowed to continue pulsating umbilical cord that allows the extension of maternal blood flow to the
fetus, baby stays close to the mother after birth, thus precipitating a longer time for the bounding
attachment, recovery strap center fast (2-3 days) than normal if the baby immediately cut and
prevent blood loss of 60 ml, which is equivalent to 1200 ml of blood adult.10 lotus birth method is
believed to increase the immune system in newborns and encourages mothers to soothe
themselves in the first week post partum as the recovery period so that the baby gets the attention
penuh (Maryunani, 2010).
Regardless of the strengths and weaknesses of lotus birth care that has been put forward as
above, let alone the pros and cons of application problems globally until the present time, we as
midwives and educators still have to know the progress of obstetrics, particularly in the lotus birth
is, what is the lotus birth and how her care, as being warm conversation and an evidence based
midwifery in the world, we should talk about it.
Children who are healthy, intelligent, attractive and have a certain start is the desire of every
parent. In order to achieve this there are various criteria that must be met in the growth and
development of children, one of them is heredity or genetics. However, in addition to hereditary
factors are still other factors that affect the quality of a child.
The quality of a child can be judged from the growth process. Growth process is the result
of the interaction of genetic factors and environmental factors. Increased survival and improvement
efforts, the development and improvement of the quality of life of children is an important effort for
the future of Indonesia better. Efforts to survival, development and improvement of the quality of
the child plays an important role since the early period of life, that period in the womb, babies and
toddlers. Child survival itself can be interpreted that the child did not die in the early years of life,
which is not until they reach the age of one year or under the age of five years.
Speaking of children can not be separated from the development of the child. The process of
child development is a continuous process from birth to adulthood. This means that a child's
growth and development stages of the process that must be passed by each child. A healthy child
will demonstrate optimal growth and development, in accordance with other children his age and
also in accordance with the standard parameters of children development.
Public Health Department, Faculty of Sports Science, F1 Building, 2nd
Floor, Sekaran Campus Gunungpati, Semarang City, Central Java Province, Indonesia, 50229 Phone/ Fax. +6224 8508007
473
Aspects of growth and development in childhood is a very important thing, which is often
overlooked by health workers, especially in the field. Normally handling more focused on
overcoming the disease, while the growth is negligible. It often happens, after the child recovers
from his illness, problems would arise with regard to growth, for example, the child will lose his
ability autonomy (Nursalamet al, 2008).
Optimal growth and development of a person influenced the result of interaction between
genetic factors, hereditary, and the constitution by environmental factors. Environmental factors in
order to provide a positive influence for the development of the child, it is necessary to the
fulfillment of certain basic needs. These basic needs can be grouped into three, need-biomedical
physical (custody), emotional needs and compassion (compassion), need for stimulation or
stimulation (teaser) (Murwani, 2008).
Concerns of parents to their children's growth and development is a strong indicator for the
presence of important issues. Most parents often compare their children's intelligence with their
peers so as to allow parents the right to make observations on the differences that occur. Parent
concerns about language, articulation, good motor skills, or general developmental delays are very
likely related to perkembangan (William, 2004).
Currently the incidence of malnutrition among children under five in the Central Java in 2009,
reaching 56 941 cases of infants with malnutrition, in 2010 to 43 616 cases, and in 2011 to 40 612
cases of malnutrition (Depkes, 2011).
According to data from the Bureau tegals in 2011, the number of infants who are scattered in
the district, as many as 224 059 children under five Tegal regency, but its coverage is only 77 396
toddler toddler or 34.54%, where as many as 72 782 children under five, or 94.03% with growth
and normal development, and as many as 4,614 infants or 5.96% with impaired growth and
development, the provision of 1,797 toddlers or 2.32% with malnutrition, 286 or 0.37% infants with
malnutrition, or 0.31% of 240 infants with deviation of the child's head circumference growth
measurements (PLKA), 1 toddler or 0.001% with pre-screening questionnaire developmental
aberrations (KPSP), 1,695 children under five, or 2.19% with impaired eyesight test (TDL), 264
infants or 0.34% with impaired power test hearing (TDL), 139 infants or 0.18% with a deviation
questionnaires mental emotional problems (KMME), 139 infants or 0.18% with disorder checklist
for autism in toddlers (CHAT), and the last 54 toddlers or 0.07 % with concentration problems and
hyperactivity (GPPH). In 2012, there were as many as 142 144 but the number of infants toddlers
coverage that comes only 66.01% 93 830 infants or toddlers where as many as 91 252 or 97.25%
with normal growth and development, as many as 2578 or 2.74% with growth or developmental
disorder, with the provisions of 1,392 or 1.48% infants with malnutrition, 1,055 or 1.12% infants
with malnutrition, 5 or 0.005% infants with visual impairment, and 1 or 0.001% toddlers with
hearing loss, 1 or 0.001% with autism, 117 or 0.12% with a concentration of attention hyperactivity
disorder (GPPH) (DinkesTegal, 2012).
474
Public Health Department, Faculty of Sports Science, F1 Building, 2nd
Floor, Sekaran Campus Gunungpati, Semarang City, Central Java Province, Indonesia, 50229 Phone/ Fax. +6224 8508007
The purpose of this research study to analyze the relationship between birth lotus birth with
growth and developmental status of infants aged 0-12 months in BPM Tegal.
Methods
This research is a survey of case-control analytic approach which is one form of analytical
study design that follows the journey towards the rear in order of time. The population in this study
were all mothers who gave birth to normal by 38-40 weeks gestation comes to birth with
spontaneous labor without complications in Griya Sehat BPM Rugayah, Amd.Keb., CHT
(Nursalam, 2008; Notoatmodjo, 2010).
In this study using non-probability sampling technique with the method in this study
sampling(Nursalam, 2008; Notoatmodjo, 2010). Sampel total number of 30 respondents, with a
lotus birth sample number 15 and number 15 infants without birth baby lotus birth. The
independent variable was the birth of a lotus birth in normal labor. As for the status of the
dependent variable is the growth and development of infants aged 0-12 months.
Sources of data used in this study is primary data is data obtained by direct interviews with
respondents and data from the examination of growth with anthropometric examination and
inspection checklist KPSP development using the baby. In this study also used secondary data is
data obtained from the Griya Sehat BPM Rugayah, Amd. Keb, CHT.
The analysis technique used to analyze the univariate analysis the variables of individual
characteristics that exist descriptively using frequency distributions and proportions. Bivariate
analysis to look at the relationship between two variables: the independent variable (lotus birth
birth at the normal delivery) and the dependent variable: growth and developmental status of
infants aged 0-12 months. To see the birth of a lotus birth relationship with growth status and
development among infants aged 0-12 months were done with a lotus birth is not done the analysis
used the Spearman test Rho (Handoko, 2009).
Results and Discussion
Characteristics of respondents research
Respondent characteristics examined included birth weight infants and the newborn Apgar
Score. Here's a description of each of the characteristics of the respondents are shown in Table 1:
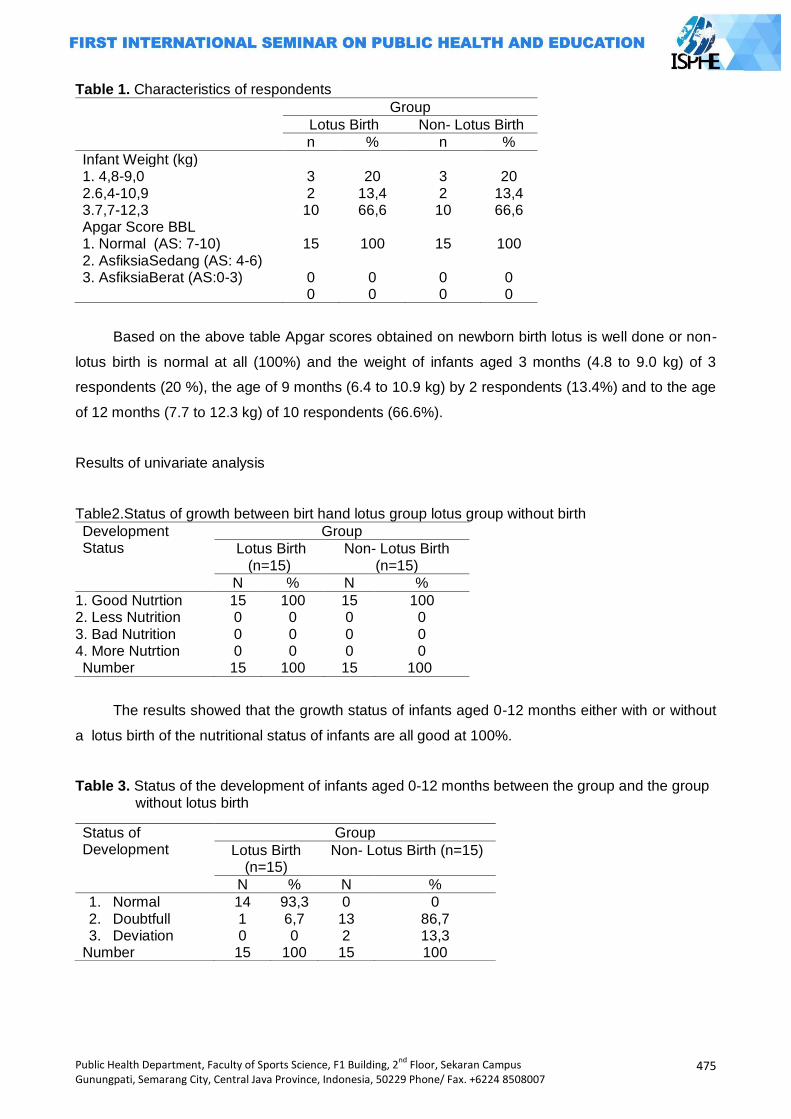
Public Health Department, Faculty of Sports Science, F1 Building, 2nd
Floor, Sekaran Campus Gunungpati, Semarang City, Central Java Province, Indonesia, 50229 Phone/ Fax. +6224 8508007
475
Table 1. Characteristics of respondents
Group
Lotus Birth Non- Lotus Birth
n % n %
Infant Weight (kg) 1. 4,8-9,0 3 20 3 20 2.6,4-10,9 3.7,7-12,3
2 10
13,4 66,6
2 10
13,4 66,6
Apgar Score BBL 1. Normal (AS: 7-10) 2. AsfiksiaSedang (AS: 4-6) 3. AsfiksiaBerat (AS:0-3)
15
0 0
100
0 0
15 0 0
100
0 0
Based on the above table Apgar scores obtained on newborn birth lotus is well done or non-
lotus birth is normal at all (100%) and the weight of infants aged 3 months (4.8 to 9.0 kg) of 3
respondents (20 %), the age of 9 months (6.4 to 10.9 kg) by 2 respondents (13.4%) and to the age
of 12 months (7.7 to 12.3 kg) of 10 respondents (66.6%).
Results of univariate analysis
Table2.Status of growth between birt hand lotus group lotus group without birth
Development Status
Group
Lotus Birth (n=15)
Non- Lotus Birth (n=15)
N % N %
1. Good Nutrtion 2. Less Nutrition 3. Bad Nutrition 4. More Nutrtion
15 0 0 0
100 0 0 0
15 0 0 0
100 0 0 0
Number 15 100 15 100
The results showed that the growth status of infants aged 0-12 months either with or without
a lotus birth of the nutritional status of infants are all good at 100%.
Table 3. Status of the development of infants aged 0-12 months between the group and the group without lotus birth
Status of Development
Group
Lotus Birth (n=15)
Non- Lotus Birth (n=15)
N % N %
1. Normal 2. Doubtfull 3. Deviation
14 1 0
93,3 6,7 0
0 13 2
0 86,7 13,3
Number 15 100 15 100
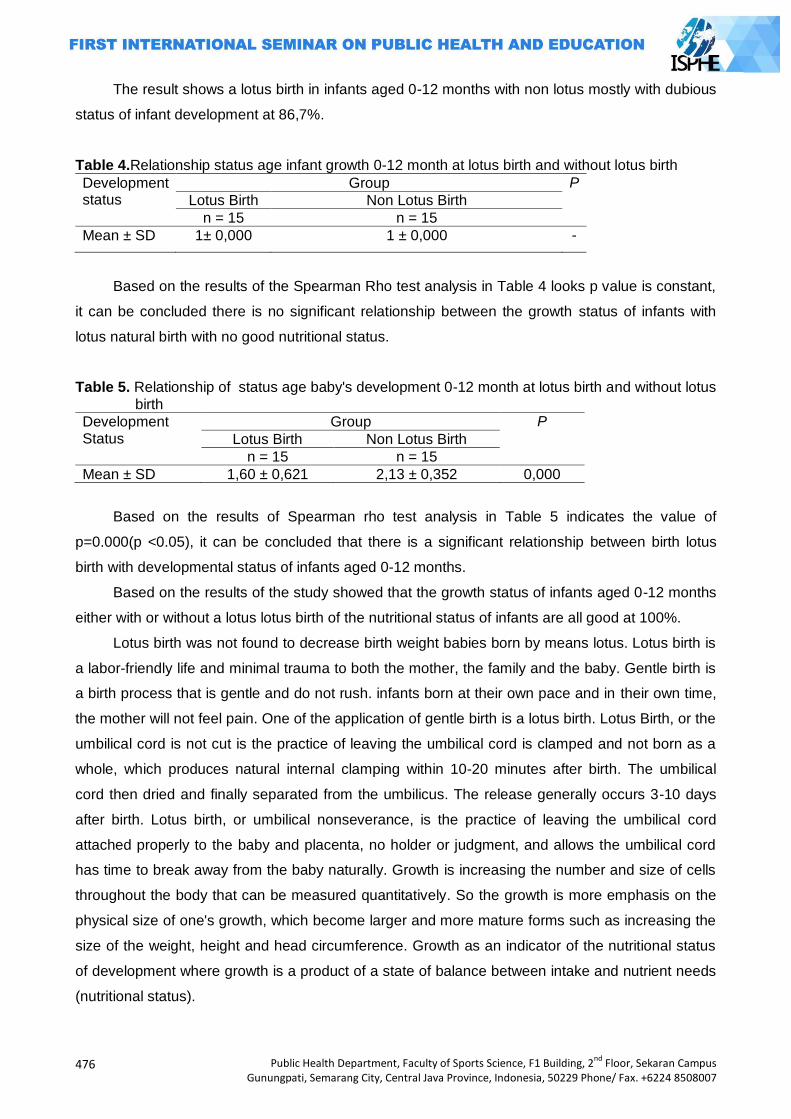
476
Public Health Department, Faculty of Sports Science, F1 Building, 2nd
Floor, Sekaran Campus Gunungpati, Semarang City, Central Java Province, Indonesia, 50229 Phone/ Fax. +6224 8508007
The result shows a lotus birth in infants aged 0-12 months with non lotus mostly with dubious
status of infant development at 86,7%.
Table 4.Relationship status age infant growth 0-12 month at lotus birth and without lotus birth
Development status
Group P
Lotus Birth Non Lotus Birth
n = 15 n = 15
Mean ± SD 1± 0,000 1 ± 0,000 -
Based on the results of the Spearman Rho test analysis in Table 4 looks p value is constant,
it can be concluded there is no significant relationship between the growth status of infants with
lotus natural birth with no good nutritional status.
Table 5. Relationship of status age baby's development 0-12 month at lotus birth and without lotus
birth
Development Status
Group P
Lotus Birth Non Lotus Birth
n = 15 n = 15
Mean ± SD 1,60 ± 0,621 2,13 ± 0,352 0,000
Based on the results of Spearman rho test analysis in Table 5 indicates the value of
p=0.000(p <0.05), it can be concluded that there is a significant relationship between birth lotus
birth with developmental status of infants aged 0-12 months.
Based on the results of the study showed that the growth status of infants aged 0-12 months
either with or without a lotus lotus birth of the nutritional status of infants are all good at 100%.
Lotus birth was not found to decrease birth weight babies born by means lotus. Lotus birth is
a labor-friendly life and minimal trauma to both the mother, the family and the baby. Gentle birth is
a birth process that is gentle and do not rush. infants born at their own pace and in their own time,
the mother will not feel pain. One of the application of gentle birth is a lotus birth. Lotus Birth, or the
umbilical cord is not cut is the practice of leaving the umbilical cord is clamped and not born as a
whole, which produces natural internal clamping within 10-20 minutes after birth. The umbilical
cord then dried and finally separated from the umbilicus. The release generally occurs 3-10 days
after birth. Lotus birth, or umbilical nonseverance, is the practice of leaving the umbilical cord
attached properly to the baby and placenta, no holder or judgment, and allows the umbilical cord
has time to break away from the baby naturally. Growth is increasing the number and size of cells
throughout the body that can be measured quantitatively. So the growth is more emphasis on the
physical size of one's growth, which become larger and more mature forms such as increasing the
size of the weight, height and head circumference. Growth as an indicator of the nutritional status
of development where growth is a product of a state of balance between intake and nutrient needs
(nutritional status).
Public Health Department, Faculty of Sports Science, F1 Building, 2nd
Floor, Sekaran Campus Gunungpati, Semarang City, Central Java Province, Indonesia, 50229 Phone/ Fax. +6224 8508007
477
Infancy is a time they experienced a period of rapid growth and development and is very
important, where the latter is the foundation that determines the quality of the successor generation
of the nation. Critical period in children 6-24 months of age, because the age group of 6-24 months
is the time period of critical growth and failure to thrive (growth failure) begin to show (Marmi and
Kukuh R, 2012).
The success of the development of a nation is closely related to a good quality of human
resources. Formation of optimal quality of human resources, both physical and psychological
health is very dependent on the growth process of children in the age dini (Nur, 2010).
Anthropometric parameters used one of them is the Weight (W) and height (TB) is used raw
HARVARD. To assess the growth of children, both infants and toddlers can use the anthropometric
measure of weight according to height (weight / height). Anthropometric measurements serve to
assess the nutritional status, monitor the health, growth and development and health of children.
Weight loss has a linear relationship with height. Under normal circumstances, the development of
body weight will be in line with the growth in height with a certain speed. index weight / height is a
good indicator for assessing the nutritional status of the present (now) (Marmi and Kukuh R, 2012).
Based on the test results of the univariate analysis showed a lotus birth in infants aged 0-12
months with normal development of a number of 14 respondents (93.3%) and 1 respondent (6.7%)
with the development of the doubt. While non lotus birth in infants aged 0-12 months with no
normal development, the development of a number of dubious 13 respondents (86.7%) and the
development of a number of irregularities had 2 respondents (13.3%).
The infants with lotus birth grows healthy and smartly, even beyond the average peers who
are non lotus birth. He assured that lotus birth baby boost immunity and prevent anemic due to the
blood supply of the placenta occurs optimally. The development includes the child's physical,
cognitive, emotional, language, motor skills (gross and fine), personal social and adaptive.
Monitoring child development is useful for finding irregularities / barriers early child development,
so that prevention efforts, the efforts of stimulation and recovery efforts and recovery efforts can be
provided with a clear indication as early as possible in the critical periods of growth and children
development (Sujiyatiniet al, 2011; Yessi, 2011; Robin, 2010; Sarah 2010).
Hastily cut the placenta may increase the risk of anemia, iron deficiency, and ultimately lead
to delays in brain development. After delivery, the baby's blood supply third is still in the umbilical
cord and placenta. By waiting for 30 seconds to 5 minutes before cutting the placenta or umbilical
cord stops pulsing until, doctors and parents can make sure the baby has received a full blood
supply. That infants who cut the cord as soon as possible to have iron levels lower until he reached
6 months. Although time is not so long, iron deficiency can affect brain development occurs. By
waiting until the umbilical cord stops pulsating naturally, the risk of anemia in infants can be
derived and can be helpful in the development process bayi (Morley, 2007).
Based on the statistical analysis of the results of the treatment group and the control group
showed a significant correlation with p <0.05 (p = 0.000) on the developmental status of infants
478
Public Health Department, Faculty of Sports Science, F1 Building, 2nd
Floor, Sekaran Campus Gunungpati, Semarang City, Central Java Province, Indonesia, 50229 Phone/ Fax. +6224 8508007
aged 0-12 months but to the growth status no significant correlation between the birth and the baby
with lotus and without a lotus birth. The results showed a lotus birth in infants aged 0-12 months
with normal development of a number of 14 (93.3%) of respondents and the number 1 (6.7%)
respondents with dubious development. While non lotus birth in infants aged 0-12 months with no
normal development, the development of a number of dubious 13 (86.7%) of the respondents and
the development of the irregularities number 2 (13.3%) of respondents.
Lotus birth this baby grow up healthy and intelligent, even beyond the average peers who are
not lotus birth. He assured that lotus birth baby boost immunity and prevent anemic due to the
blood supply of the placenta occurs optimal (Sujiyatiniet al, 2011; Yessi, 2011; Robin, 2010; Sarah
2010).
Growth is a process of changing the physical (anatomical) are characterized by increasing
the size of the various organs of the body caused by the addition of a magnification of the body's
cells. The development is growing perfectly functioning organ which can be achieved through the
growing maturity and learning. In infants with lotus birth for rapid growth and development,
especially in terms of cognitive, motor and social as well as the formation of children's self-
confidence. This research was also supported by a statement of Anik Maryunani that the factors
that affect the growth of the average baby is influenced by hereditary factors, nutritional factors, the
ability of parents factor (socio-economic), sex factor and the factor of race / ethnicity so not only
factor of mode of delivery only (lotus birth).
Babies with Lotus Birth proved to be more relaxed and peaceful so as not to cause stress to
the baby, weight loss does not occur and prevent the occurrence of jaundice. With lotus birth can
stabilize the immune system of infants and mothers of infants in the early postpartum hours and it
shows on all levels (relaxation, abundant healthy weight gain, and infant motor skills. Their greater
capacity for relaxation, compared with infants who without lotus.bayi lotus has a metabolic basis for
life, and make teething and other developmental stages is much better compared with non lotus
birth infants that show good coping skills during lifetime.
The amount of blood loss newborn child with early cord clamping can be understood by the
fact that the baby is only 9 -pound creates 10 ounces of blood (300 ml). Therefore, 180 ml This is
actually more than half the baby's blood supply and take up half of a person's blood supply will
weaken any child, or adult supporters who lost blood. That neonates have a right to their own
blood when they need it most: during the hours of vulnerable and the first 4-6 days the first week of
neonatal life. Blood loss due to cutting the umbilical cord immediately lead to extreme systemic
shortcomings of their neonates, shock and trauma that goes with it. Because at the time of birth,
the child is considered anemic if the loss of even 20 to 50 percent of the blood, and only 20 percent
blood loss can cause shock. Anemia is the reason our baby very sick, it can last until they are
school age, which can lead to developmental delays. The Associated Disorders another with low
blood volume is autism, cancer, brain tumors, leukemia, liver, kidney, holes in the heart, hormone
Public Health Department, Faculty of Sports Science, F1 Building, 2nd
Floor, Sekaran Campus Gunungpati, Semarang City, Central Java Province, Indonesia, 50229 Phone/ Fax. +6224 8508007
479
deficiencies, enzyme imbalances. All are associated with lack of blood at a child‘s birth (Sujiyatiniet
al, 2011; Yessi, 2011; Robin, 2010; Sarah 2010).
Factors labor / birth with vacuum extraction or forceps can cause trauma to the baby's head
so that the risk of damage to brain tissue that will affect the growth and development of infants.
Babies with lotus birth was not traumatized at all so there is no risk of tissue damage brain.
That infants with birth lotus absence of weight loss and jaundice in infants with lotus birth.
Infants receiving the full benefits of umbilical cord blood, including platelets that clot blood, plasma
(proteins from the blood), white blood cells to fight infection, red blood cells have iron and carries
oxygen to all cells, the stem cells to replace worn out cells, hormones and enzymes and iron
reserves, not the occurrence of respiratory distress syndrome (RDS), less possibility of damage to
the baby's brain (ie, cerebral palsy, schizophrenia, autism), need for blood transfusions for
premature infants, less possibility of organ damage in premature infants, improved baby‘s kidney
function (Sujiyatiniet al, 2011; Yessi, 2011; Robin, 2010; Sarah 2010).
Lotus birth has advantages for both the baby and mother which include: increased rates of
breastfeeding success, the possibility of faster healing of the navel, to avoid the risk of infection, do
not have to worry about shareholders or cut the umbilical cord, the baby and placenta respect /
spiritual reasons and maximize bonding mother and baby, baby transition occurs gently and
peacefully, which allows birth attendants to cut the umbilical cord at the right time, 100% guarantee
that infants get the optimal and specific volume of blood needed for infants, encourage mothers to
calm down during the first week the postpartum recovery period so that the baby gets full attention,
reducing infant mortality due to visitors who want to meet the baby. Most visitors would prefer to
wait until the placenta go off (Sujiyatiniet al, 2011; Yessi, 2011; Robin, 2010; Sarah 2010).
Birth of a lotus birth midwifery evidence base needs to be applied in the midwifery service.
Lotus birth is one intranatal factors that affect the growth and development of infants. Another
factor affecting the growth and development of infants include family conditions, nutrients
(nutrition), emotional, gender, ethnicity, intelligence, socioeconomic status, level of health, function
gland hormone thyroxine, a state in the mother's womb and body build figure(Marmi and Kukuh R,
2012; Sanjaya, 2010).
Child development takes place regularly, are interrelated and continuous starts from
conception to adulthood .. although there are variations, but each child will pass through a certain
pattern. Tanuwijaya explained about the stages of child development is divided into two, namely
the pre-natal and post the natal.1Orang parents, caregivers and educators need to know the
stages of child development, if development occurs normally or no deviation. When children
experience irregularities in the growth and development in order to be taken to a health facility so
that it can overcome early (Marmi and Kukuh R, 2012).
The entire process usually occurs within a few minutes after birth and when the baby started
to cry and his skin is pink, the process is complete. Clamping and cutting the umbilical cord at the
moment of the transformation process is the fetal circulation of oxygen into the circulatory system
480
Public Health Department, Faculty of Sports Science, F1 Building, 2nd
Floor, Sekaran Campus Gunungpati, Semarang City, Central Java Province, Indonesia, 50229 Phone/ Fax. +6224 8508007
of adult / baby are very disturbing this life support system and can cause serious illness. In this
study said that when talipusat done clamping, Pulse rate and decreased Cardiac Out Put 50%.
Because 50% of the venous return to the heart has been turned off (clamped off). There are so
many unfortunate consequences in cutting the umbilical cord immediately after birth and in the
study said the risk for brain-injury, cerebral palsy, asfixyia, autism, yellow baby incidence of anemia
in infants is even more (Morley, 2007).
Closing
Some of the conclusions in this study are as follows: the characteristics of the Apgar Score
all normal newborns and for baby's weight is also normal in all. Status growing baby nourished all
at 100% either done or not done lotus lotus. Developmental status of infants aged 0-12 months
with a lotus birth some 14 respondents (93.3%) with normal development and one respondent
(6.7%) with the development of the doubt. While no lotus birth in infants aged 0-12 months with no
normal development, the development of a number of dubious 13 respondents (86.7%) and the
development of a number of irregularities had 2 respondents (13.3%). There is a significant
relationship with p = 0.000 (p <0.05) between birth lotus birth with growth and developmental
status of infants aged 0-12 months.
Suggestions for BPM can work according to the duties and obligations with full responsibility
and professionalism in carrying out midwifery care based on the evidence base is mainly about the
birth of lotus birth. For Health Institutions can develop a lotus birth birth as one of the evidence
base in obstetrics and for Other researchers can develop further studies with large sample sizes
and developed for experimental research on a lotus birth.
References
Alimul, Aziz. Pengantar Ilmu Kesehatan Anak Untuk Pendidikan Kebidanan. Jakarta: Salemba
Medika; 2011. h.32 Asri, Dwi dan Cristine Clervo p : Asuhan Persalinan Normal. Yogjakarta. Nuha Medika : 2010. h. 2 Birth –Brain Injury caused by Umbilical Cord Clamping: From Imbecility and Cerebral Palsy to
Minimal Mental Retardation, By George Malcom Morley, MB ChB FACOG. Dec 2007
Dinas Kesehatan Kabupaten Tegal. Profil Kesehatan Kabupaten Tegal 2012. Tegal: Dinkes Tegal;
2012 Dokter Sanjaya. PenundaanPemotonganTaliPusat. 2010 Fida dan Maya. Pengantar Ilmu Kesehatan Anak. Yogyakarta: D-Media; 2012. h.20 Firman F, Wirakusumah. Obstetri Fisiologi. Jakarta: EGC; 2010. h.2-4;127 Handoko Riwikdikdo. Statistik untuk Penelitian Kesehatan dengan Aplikasi Program SPSS. 2009.
Yogyakarta : Pustaka Rihama Hastono S.P., Analisis Data Kesehatan. FKM UI. Jakarta. 2007. Hidayat. 2007. Riset Keperawatn dan Teknik Penulisan Ilmiah. Jakarta : Penerbit Salemba Hidayat A.A. Metode Penelitian Keperawatan dan Teknik Analisis Data. Jakarta; Salemba Medika.
2007 http//www.gizi,depkes Buku-laptah,2011.pdf JNPK_KR. Buku Acuan Persalinan Normal, Jakarta; Tridasa Printer; 2008. h. 1-37; 43; 62-63 Kasjono H.S., Yasril. 2009. Teknik Sampling untuk Penelitian Kesehatan. Yogyakarta : Graha
Ilmu.h. 129.
Public Health Department, Faculty of Sports Science, F1 Building, 2nd
Floor, Sekaran Campus Gunungpati, Semarang City, Central Java Province, Indonesia, 50229 Phone/ Fax. +6224 8508007
481
Manuaba. Ilmu Kebidanan, Penyakit Kandungan dan KB untuk Pendidikan Bidan. Jakarta: EGC; 2010. h. 28-541.
Marmi dan Kukuh R, Asuhan Neonatus, Bayi, Balita dan Anak Pra Sekolah. Yogyakarta : Pustaka Pelajar ; 2012
Maryunani, Anik. Ilmu Kesehatan Anak Dalam Kebidanan. Jakarta: TIM; 2010. h.1 Menkes RI. Instrumen Pelaksanaan SDIDTK di Tingkat Pelayanan Kesehatan Dasar. Jakarta:
Bakti Husada; 2010. h.1 Menkes RI. Pedoman Pelaksanaan SDIDTK di Tingkat Pelayanan Kesehatan Dasar. Jakarta:
Bakti Husada; 2010. h.1 Murwani, Anita. Pengantar Konsep Dasar Keperawatan. Yogyakarta: Fitramaya; 2008. h.96 Notoatmodjo S., Metodologi Penelitian Kesehatan. Rineka Cipta. Jakarta. 2010. Nursalam, et al. Asuhan Keperawatan Bayi dan Anak. Jakarta: Salemba Medika; 2008. h.45 Nur, Waffi Muslihatun. Asuhan Neonatus Bayi dan Balita. Yogyakarta: Fitramaya; 2010. h.81 Nursalam, Konsep dan Penerapan Metodologi Penelitian. Salemba Medika. Jakarta. 2008. Riwidikdo H., Statistik untuk Penelitian Kesehatan. Rohima Press. Yogyakarta. 2012. Robin Lim. Lotus Birth.2010 Robin Lim, Gentle Birth.2010 Sarah Buckley, Lotus Birth.2010 Soetjiningsih. Tumbuh Kembang Anak dan Remaja. Jakarta: Sagung Seto; 2002. h.7-18 Sudigdo dan Sofyan. Dasar-dasar Metodologi Penelitian Klinis. 2011. Sagung Seto Sugiyono, Statistika untuk Penelitian. Alfabeta. Bandung. 2007. Sujiyatini, dkk. Asuhan Kebidanan Persalinan. Yogyakarta: Rohima Press; 2011; 36 Sumarah, Yani Widyastuti, Nining Wiyati. Perawatan Ibu Bersalin. Yogyakarta: Fitramaya; 2008. h.
23-35 Supartini, Yupi. Konsep Dasar Keperawatan Anak. Jakarta: EGC; 2004. h.23 Varney, Helen. Buku Ajar Asuhan Kebidanan. Jakarta: EGC; 2007. h. 672-788 William, M. Pedoman Klinis Pediatrik. Jakarta: EGC; 2004. h.32 Yanti. Buku Ajar Asuhan Kebidanan Persalinan. Yogyakarta: Pustaka Rihana; 2009. h. 3-7 Yessi Aprilia. Lotus Birth ― A Gentle Way to Gentle Birth and Gentle Mothering. 2011
482
Public Health Department, Faculty of Sports Science, F1 Building, 2nd
Floor, Sekaran Campus Gunungpati, Semarang City, Central Java Province, Indonesia, 50229 Phone/ Fax. +6224 8508007
EFFECT OF COMBINATION METHODS TO MASSAGE WOOLWICH AND ENDORPHINE
HORMONE PROLACTIN LEVELS AND BREAST MILK VOLUME
(ON MOTHERS POSTPARTUM STUDY IN HEALTHY PREGNANT GRIYA MEJASEM TEGAL)
Siti Erniyati Berkah Pamuji1, Supriyana2, Sri Rahayu3
1Bhakti Mandala Husada Slawi, Indonesia
2Diponegoro University, Indonesia
3Politechnic Semarang, Indonesia
Correspoding Author: [email protected]
Abstract Introduction: Lactation is the whole process of production and expenditure breast milk. Lactation occurs under the influence of pituitary hormones prolactin and oxytocin. Disruption caused by factors on lactation baby , the mother and the environment that can affect the hormone prolactin levels and breast milk volume. Coverage Exclusive breastfeeding Tegal in 2011 only 47.9 %, a target of achieving 80% exclusive breastfeeding. One of the efforts to increase lactation in mothers postpartum with a combination of massage methods woolwich and endorphine. Methods: The study was Quasy experiment with the design of non randomized controlled trial desain pretest posttes control group. The number of samples are 40 respondents divided into intervention groups and one control group . Data analysis was performed using univariate , bivariate with independent t test, wilcoxon signed rank test and mann whitney test. Results: The results based on bivariate analysis showed the average score in the intervention group hormone prolactin is 103,80 ng / ml with a standard deviation of 12,60 ng / ml and breast milk volume 17,40 cc with a standard deviation of 6,91 cc . The control group average score is 60,90 ng/ml with a standard deviation of 41,45 ng/ml and breast milk volume 0,60 cc with a standard deviation of 0,84 cc, p value hormone prolactin 0,034 and p value breast milk volume 0,000 ( p < 0.05), It is mean that there are differences in the average levels of the hormone prolactin and breast milk volume, which is significant of the two treatments. Key Words: Massage woolwich and endorphine, hormone prolactin levels, breast milk volume
Introduction
Lactation is the whole process of breast feeding from breast milk is produced through the
process of sucking and swallowing baby breast milk (Ambarwati, 2009). Lactation occurs under the
influence of various endocrine glands, especially the pituitary hormones prolactin and oxytocin.
Seeing the physiology of lactation process itself that is the production and secretion of breast milk,
the factors that affect the process of lactation among other positions and proper fixation of the baby
on the breast as well as the frequency and duration of breastfeeding, breast discharge, nutrition,
maternal state of both physical and psychological as well as the state of the breast. Disorders of
the lactation occurs due to various factors, including the factors the baby, the mother and the
environment (Ambarwati, 2009).
According to data from the 2012 IDHS 42% of mothers breastfeed however, only 44% were
successful lactation at 1 hour after birth and only 62% in the first days after birth, and 50.8% in the
Public Health Department, Faculty of Sports Science, F1 Building, 2nd
Floor, Sekaran Campus Gunungpati, Semarang City, Central Java Province, Indonesia, 50229 Phone/ Fax. +6224 8508007
483
first 1 month. Early lactation or breast feeding early in the first hour after birth will stimulate an
increase in prolactin in the blood and reached a peak at 45 minutes. If breast milk is emptied
completely removed or it will increase milk production becomes more. Early breastfeeding can
affect breastfeeding infants until the age of 6 months (exclusive breastfeeding) (BPS, 2012). Based
on data from the Department of Health breastfeeding week 2013 coverage of exclusive
breastfeeding in Indonesia in 2010 was 61.3%, increasing to 61.5% in 2011 and decreased in 2012
to 61.1%, while the national target coverage Exclusive breastfeeding in 2012 is 80% (Kemenkes
RI, 2013).
Addressing the problems of lactation, the Indonesian government has been promoting the
program through the lactation Lactation Management which is one of the programs of the Maternal
and Child Health (MCH). Lactation management is a holistic governance concerning the use of
lactation and breastfeeding, towards a successful breastfeeding for maintaining the health of the
mother and her baby (Suradi, 2004). In addition, to increase the scope of exclusive breastfeeding
with Government Regulation (PP) No. 33/2012 on Exclusive Breastfeeding as a guarantee of the
fulfillment of the right of the baby to get the best food source (ASI) since birth until the age of six
months without adding and / or replacing with food or other drinks, protecting mothers in exclusive
breastfeeding for infants, Early Initiation of Breastfeeding program (IMD), setting the use of infant
formula and other baby products, as well as a means of breast-feeding in the workplace and other
public facilities (Kemenkes RI, 2013).
Based on the profile of Central Java Provincial Health Office showed that exclusive
breastfeeding coverage in 2010 is 40.24%, increased to 45.18% in 2011 and decreased to 25.5%
in 2012 Tegal District Health Profile shows that the coverage of ASI exclusive in 2011 only 47.9%.
The number is still very low when compared with the target of achieving 80% exclusive
breastfeeding. During this monitoring tool or monitoring Exclusive breastfeeding is considered that
there is no scope of administration is still very low (Purnomo, 2011).
Efforts are being made to the District Health Office enhancement Tegal Early Initiation of
Breastfeeding Lactation (IMD) at Normal Delivery Care (APN), the importance of health promotion
of lactation, lactation counseling on maternal classes, lactation counselor training, but has not
made an effort to increase lactation with a combination Woolwich and endorphine massage
method (Purnomo, 2011). Preliminary studies in Griya Healthy Pregnancy is one of the Mejasem
clinic located in Tegal regency, which is owned by a midwife who focuses on maternal care during
pregnancy, labor, childbirth, breastfeeding and infant health services physiologically. The number
of deliveries at the Griya physiological Healthy Pregnant from January - June 2013 some 143
mothers give birth, and almost 75% of breast milk out smoothly at the 5 (five) days postpartum.
From the preliminary study interviews were conducted on 12-13 July 2013 to 8 postpartum
primiparous mothers in Griya Healthy Pregnancy, 2 people saying their milk out slightly soon after
birth, 4 people say breastfeeding her out after 3 days of birth and 2 people say breastfeeding her
exit after 1 week postpartum and mothers are afraid can‘t provide enough milk.
484
Public Health Department, Faculty of Sports Science, F1 Building, 2nd
Floor, Sekaran Campus Gunungpati, Semarang City, Central Java Province, Indonesia, 50229 Phone/ Fax. +6224 8508007
To prevent and deal with the problems of lactation, it is possible that a combination of
massage intervention Woolwich and endorphine. This method is done with the aim to improve the
reflexes of prolactin and oxytocin reflex (let down reflex). Woolwich massage method is based on
the observation that the flow of breast milk is more important than breast milk secretion by
glandular breast milk. Massage performed in exactly the lactiferous sinus area 1-1.5 cm above the
areola, with the aim of removing the existing breast milk in the lactiferous sinus. The massage will
stimulate nerve cells in the breast, the stimulus is passed to the hypothalamus and anterior
pituitary to respond by removing the hormone prolactin, which would be transported by the blood to
the breast myoepithelial cells to produce milk. The benefits of massage method is to increase
spending Woolwich breastfeeding, increase breast milk secretion and prevent breast inflammation
or mastitis (Moehyi, 2008).
Endorphine Massage is a massage technique and a light touch is very important for pregnant
women to help provide a sense of calm and comfortable. This light touch massage that is very light
cover that can make fine hairs stand up on the skin surface. This massage is usually performed on
maternal, research shows that this technique increases the release of hormones endorphine (gives
a sense of comfort and calm) and the hormone oxytocin. So when massage is given to the mother
postpartum endorphine can provide a sense of calm and comfortable during lactation thus
improving the response of the posterior pituitary to produce the hormone oxytocin can improve the
let down reflex. With a combination of methods is possible endorphine Woolwich with massage can
increase milk production and expenditure characterized by an increased volume of milk, and the
levels of the hormone prolactin (Aprillia and Brenda, 2011; Aprilia 2011). The combination of
massage methods Woolwich and endorphine given to mothers postpartum primiparous 2 times /
day at a time when the morning and evening for 3 days postpartum.
According to these problems, the research done with the aim to prove the effect of the
combination of massage methods Woolwich and endorphine on prolactin levels and breast milk
volume in mothers postpartum in Griya Healthy Pregnant Mejasem Tegal.
Methods
This research is an experimental study, which quasy-experiment with a non-randomized
controlled trial design pretest posttest control group design. In this study there are two (2) groups,
the intervention group were given a combination of massage methods and endorphine Woolwich,
and were not given the intervention group (control group). The population in this study were
primiparous postpartum mothers in Healthy Pregnant Griya Mejasem in the month of November
2013 to January 2014 sampling technique in this study using purposive sampling nonprobability
sampling. The data taken in this study is primary data that measure hormone prolactin levels and
breast milk volume, the data were analyzed using the Test of Independent Samples T-test,
Wilcoxon Signed Rank Test and Mann Whitney rank test because the data are not normally
Public Health Department, Faculty of Sports Science, F1 Building, 2nd
Floor, Sekaran Campus Gunungpati, Semarang City, Central Java Province, Indonesia, 50229 Phone/ Fax. +6224 8508007
485
distributed data processing and data analysis using SPSS for Windows version 16.0
(Sastroasmoro, 2008; Arikunto, 2006; Sugiyono, 2006, Supranto, 2000).
Results and Discussion
Characteristics of respondents by age mothers post partum respondent obtained a mean age
of 25.30 years (SD ± 4.96), age of the youngest 19 years old and the oldest 32 years. While in the
control group gained an average respondent age 24.20 years (SD ± 2.74), with the youngest aged
20 and the oldest 28 years. From the results of statistical tests Independent Samples t-test
obtained p value 0.550> α 0.05, which means the age of the respondent homogeneous or no
difference in the mean age of respondents in the intervention group and the control. Respondents
based education in the intervention group most respondents had high school. Whereas in the
control group the average high school educated respondents and diploma III. From the results
obtained statistical test Chi Square p value 0.669> 0.05, which means that α education
respondents in the intervention and control groups were homogeneous or similar. Based on the
work of the highest in the intervention group gained an average respondent job housewife and
private. While in the control group most of the respondents were housewives. From the results
obtained statistical test Chi Square p value 0.801> 0.05, which means that α respondents work in
the intervention and control groups were homogeneous or similar. It is based on the following
table:
Table 1. Comparison of respondent characteristics on intervention group and control group
No Variabel Group P Value
Intervention Control
1 Age a. Mean±SD b. Minimum-Maximum
25,30 ±4,96
19-32
24,20±2,74
20-28
0,550a
2 Education a. Elementary school b. Junior High School c. Senior High School d. D III e. S1 Degree
1 (10%) 1 (10%) 5 (50%) 2 (20%) 1 (10%)
2 (20%) 3 (30%) 3 (30%) 2 (20%)
0,669b
3 Occupation a. House Wife b. Non-formal workers c. Civil Servant
4 (40%) 4 (40%) 2 (20%)
5 (50%) 4 (40%) 1 (10%)
0,801b
aIndependent t test bChi Square
The results showed that levels of the hormone prolactin pre-action in the intervention group
had a mean value of 91.90 ng / ml (SD ± 8.55), whereas the control group had a mean value of
85.38 ng / ml (SD ± 6.40). Pre-action volume of milk in the intervention group had a mean value of
1.80 cc (SD ± 0.75), whereas the control group had a mean value of 1.70 cc (SD ± 0.63). The
results of the statistical test Independent Samples t-test measures levels of the hormone prolactin
486
Public Health Department, Faculty of Sports Science, F1 Building, 2nd
Floor, Sekaran Campus Gunungpati, Semarang City, Central Java Province, Indonesia, 50229 Phone/ Fax. +6224 8508007
in the pre-intervention group and the control group showed p value 0.069> 0.05, which means that
α Ho is accepted, there is no difference in levels of the hormone prolactin levels pre-action in the
intervention group and the control group. Meanwhile, test results of the Independent Samples t-test
pre-action volume of milk in the intervention group and the control group showed p value 0.751> α
0.05, which means that Ho is accepted, there is no difference in the volume of milk pre-action in
the intervention group and the control group.
The mean increase in levels of the hormone prolactin action at the post-intervention group
196.02 ng / ml (SD ± 8.38). While the average levels of the hormone prolactin after-action in the
control group 146.50 ng / ml (SD ± 43.84). The mean increase in the volume of milk after the action
in the intervention group 19.30 cc (SD ± 7.02). While the average levels of the hormone prolactin
after-action in the control group of 2.40 cc (SD ± 1.07). Results of Mann Whitney test test
measures levels of the hormone prolactin after the intervention group and the control group
showed p value 0.006 <α 0.05, which means that Ho is rejected, there are differences in the levels
of the hormone prolactin levels after the action in the intervention group and the control group.
Meanwhile, test results of the Independent Samples t-test post-action volume of milk in the
intervention group and the control group showed p value 0.000 <α 0.05, which means that Ho is
rejected, there are differences in the volume of milk after the action in the intervention group and
the control group.
The results of Wilcoxon signed rank test levels of the hormone prolactin in the intervention
group of pre and post measures obtained p value 0.005 <α 0.05, which means that Ho is rejected,
which means that there are differences in the levels of the hormone prolactin in the intervention
group pre and post measures. To the volume of milk in the intervention group pre and post
measures, the results of Wilcoxon signed rank test p value test value 0.005 <α 0.05, so Ho is
rejected, which means that there are differences in the volume of milk in the intervention group pre
and post measures. The difference in levels of the hormone prolactin pre and post actions in the
control group, it is known from test results obtained Wilcoxon signed rank test p value 0.005 <α
0.05, which shows the results of that Ho is rejected, so there are differences in the levels of the
hormone prolactin pre and post actions in the control group . While the volume of milk in the control
group at pre and post measures of test results obtained Wilcoxon signed rank test p value 0.068>
0.05 α Ho is accepted which means there is no difference in the volume of milk in the control group
pre and post measures.
The difference in levels of the hormone prolactin seen from the difference between the
intervention group and the control group showed p value 0.034 <α 0.05 (Mann Whitney test), so Ho
is rejected which means that there are differences in the levels of the hormone prolactin in the
intervention group and the control group. As for the volume of milk seen from the difference
between the intervention group and the control group obtained p value 0.000 <α 0.05 (Mann
Whitney test test) which means that Ho is rejected, there are differences in the volume of milk in
the intervention group and the control group. The foregoing is based on the following table:
Public Health Department, Faculty of Sports Science, F1 Building, 2nd
Floor, Sekaran Campus Gunungpati, Semarang City, Central Java Province, Indonesia, 50229 Phone/ Fax. +6224 8508007
487
Table 2. Comparison of hormone prolactin levels and breast milk volume at pre and post actions
inter-group, in each group and the difference (gain score) inter-group
No Variabel Group p value
Intervension Control
1 Prolactin (pra) (ng/ml): a. Mean±SD b. Minimum-Maximum
91,90±8,55
79,13 – 108,00
85,38±6,40
72,48 – 93,60
0,069c
2 Milk Volume (pra) (cc) : a. Mean±SD b. Minimum-Maximum
1,80±0,75 1,00 – 3,00
1,70±0,63 1,00 – 3,00
0,751c
3 Prolactin (pasca) (ng/ml) : a. Mean±SD b. Minimum-Maximum
196,02±8,38
179,85 – 200,00
146,50±43,84 99,00 – 200,00
0,006d
4 Milk Volume (pasca) (cc): a. Mean±SD b. Minimum-Maximum
19,30±7,02
10,00 – 30,00
2,40±1,07 1,00 – 4,00
0,000c
5 Hormon Prolaktin (p value): 0,005e 0,005e 6 Milk Volume (p value): 0,005e 0,068e 7 Gain Score Prolactin (ng/ml) :
a. Mean±SD b. Minimal-Maksimal
103,80±12,60 80,00 – 120,00
60,90±41,45
19,00 – 116,00
0,034f
8 Gain Score of Milk Volume (cc): a. Mean±SD b. Minimum-Maximum
17,40±6,91
9,00 – 28,00
0,60±0,84 0,00 – 2,00
0,000f
c Independent Samples T-test dMann_Whitney Test eWilcoxon signed rank test fMann_Whitney Test
In this study, the characteristics of postpartum maternal variables were age, education and
employment. Based on the analysis that the respondent's age there were no differences between
the intervention and control groups, while education and employment in the intervention group and
the control group is homogeneous or equivalent. So that the characteristics of the respondents in
this study, is not a factor that affects the mother postpartum. This is consistent with the research
results Indriyani (2006) which states that there is no relationship between demographic
characteristics, age, education, parity and milk production on the job with postpartum mothers with
cesarean section. Age, education and employment is indirect factors that affect the prolactin levels
and breast milk volume in mothers of postpartum. Factors directly affecting the prolactin levels and
breast milk volume in lactating postpartum maternal behavior, psychological factors and
physiological factors of postpartum mothers (Reeder, 2011; Sulistyawati, 2009; Biancuzzo, 2003).
Based on the analysis, the average value of the increase in levels of the hormone prolactin
after-action greater in the intervention group than in the control group, as well as the volume of milk
after the action in the intervention group had an average increase in value greater than the control
group. It shows that the combination of massage methods and endorphine Woolwich has been
found to increase levels of the prolactin and breast milk volume in mothers postpartum. Prolactin
levels and breast milk volume of pre-action in the intervention group and the control group showed
no difference, while the hormone prolactin levels and breast milk volume after the action is higher
in the intervention group compared with the control group.
488
Public Health Department, Faculty of Sports Science, F1 Building, 2nd
Floor, Sekaran Campus Gunungpati, Semarang City, Central Java Province, Indonesia, 50229 Phone/ Fax. +6224 8508007
From the analysis of the levels of the prolactin in each group, known levels of the prolactin in
the intervention group pre and post outcome measures showed no differences in prolactin levels
pre and post actions in the intervention group. Similarly, in the control group, the levels of the
prolactin pre and post outcome measures showed no differences.
Postpartum mothers who breastfeed, her prolactin hormone levels increase with decreasing
levels of estrogen and progesterone as well as stimulation baby sucking on the nipple of the
mother. Levels of the prolactin in postpartum mothers would be normal 3 months after giving birth
to weaning the child and at that time there will be no increase in prolactin despite the baby's
sucking, but spending persists milk (Soetjiningsih, 1997). Thus physiologically all postpartum
mothers who breastfeed will have elevated levels of the prolactin.
Volume of milk pre and post actions in the intervention group showed no difference in the
volume of milk results. Instead the volume of milk in mothers postpartum control group showed no
difference in the results or increase the volume of milk.
Factors affecting the increase in the volume of milk is a factor of the mother and baby,
mother factor of very influential factor is the tranquility of the soul and the mind (Soetjiningsih,
1997). Non-pharmacological management to increase milk production by Woolwich and
endorphine massage method is one alternative to improve the comfort and relaxation portpartum
mother during lactation so as to increase the volume of milk.
The combination method Woolwich massage and reflex stimulation of the formation of
endorphine give breast milk (prolactin reflex) and expenditure ASI (let down reflex) before
breastfeeding excluded or squeezed. This action can give the sensation of relaxing on the mother
and expedite the flow of the nerves and ducts (ductal system) both breasts. Massage can stimulate
endorphine secretion and stimulates prolactin and oxytocin reflex thus increasing the volume of
milk (Suradi, 2004).
This is consistent with the findings that the levels of the hormone prolactin postpartum
mothers were given the intervention were higher than in maternal postpartum in the control group
and concluded that there is a difference between the levels of the prolactin in postpartum
primiparous mother after being given a combination of massage methods Woolwich and
endorphine with p value 0.034 at measurement day 4. Volume breastfeeding postpartum mothers
were given the intervention were higher than in maternal postpartum in the control group and
concluded that there is a difference between the volume of milk in the postpartum primiparous
mother after being given a combination of massage methods Woolwich with endorphine with p
value of 0.000 at day 4 measurements. It can be assumed that the postpartum mothers are given a
combination of massage methods and endorphine Woolwich has great significance in improving
the hormone prolactin levels and breast milk volume in the control group.
Increased levels of the prolactin and breast milk volume is strongly influenced by the physical
preparation of the breast so that the breast care needs to be done. One of the recommended
treatment method is a method of Woolwich. This method is based on the observation that the flow
Public Health Department, Faculty of Sports Science, F1 Building, 2nd
Floor, Sekaran Campus Gunungpati, Semarang City, Central Java Province, Indonesia, 50229 Phone/ Fax. +6224 8508007
489
of breast milk is more important than breast milk secretion by glandular breast milk. With the
method of Woolwich, will affect the vegetative nerves and subcutaneous tissue so that the tissue
can relax the blood flow in the duct system, the remnants of duct system cells are discarded so as
not to inhibit the flow of milk through the ductus lactiferus so the milk flow will be smooth. Massage
Woolwich triggering stimuli myoepithelial cells around the mammary gland, the hypothalamus is
forwarded to the stimuli that trigger the anterior pituitary prolactin to produce. In addition,
inflammation of the breast or dams can be prevented (Moehyi, 2008; Potter, 2005).
Another factor affecting the increase in the prolactin levels and breast milk volume is
maternal psychological factors. With increasing endorphine release endorphine massage is
sedative which flows into the maternal circulation that cause vasodilation response that increases
blood flow so the body becomes relaxed and calm, thus triggering the oxytocin plays a role in the
mechanism of let down reflex (spending ASI) that affecting Similarly prolactin secretion (prolactin
reflex) (Bobagim, 2004).
Massage of endorphine is a gentle way to help the mother feel more refreshed, relaxed and
comfortable during labor. Massage is performed for approximately 20 minutes will make the mother
more pain-free and relaxed. Massage is given a very light touch that can make fine hairs standing
on the surface of the skin (Aprillia, 2011). Gate control theory says that the stimulation of the skin
surface (sub-cutaneous) cell activating transmission (T) sensory nerve fibers A-beta bigger and
faster. This process lowers pain transmission through C fibers and A delta-small diameter so that
the gate closes synaptic transmission implus pain (Potter and Ane, 2005). Cutaneous stimulation
on the body in general are often centered on the back and shoulders. Cutaneous stimulation of
peripheral fibers will stimulate fibers to transmit impulses through the dorsal horn in the spinal cord,
when the impulse is carried by A-beta fibers dominate the mechanism will close the gate so that
pain impulses are not delivered to the brain, thus giving the sensation of relaxing on the body
(Smeltzer, 2001). It happens because massage stimulates the body to release endorphins which
compound is a natural pain reliever. For breastfeeding mothers postpartum, massage makes the
mother feel more comfortable and relaxed. The touch of someone who cares and wants to help a
source of strength when mom got sick, tired, and strong. Many parts of the body can be massaged,
such as the head, neck, back, and legs. When massaging, the masseuse must consider the
response of the mother, whether a given pressure is appropriate (Aprilia and Brenda, 2011; Aprilia,
2011).
The volume of breast milk and breastfeeding are spending a little on the first days after
delivery become a drag on postpartum mothers in breastfeeding their babies early. Lack of volume
of milk in the first days after birth may be caused by lack of the prolactin and oxytocin stimulation
were very instrumental in the process of production and expenditure breast milk. These conditions
generally experienced by primiparous postpartum mothers, due to lack of experience and
psychological changes that may affect the prolactin and oxytocin (Soetjiningsih, 1997).
490
Public Health Department, Faculty of Sports Science, F1 Building, 2nd
Floor, Sekaran Campus Gunungpati, Semarang City, Central Java Province, Indonesia, 50229 Phone/ Fax. +6224 8508007
Effect of a combination of massage methods Woolwich and endorphine on levels of the
hormone prolactin and breast milk volume is based on research conducted by Maliha (2011) on the
effectiveness of massage rolling (back) to milk production in mothers postoperative section at
Muhammadiyah Hospital Palembang results obtained were no significant differences average milk
production post SC mother performed after rolling massage (back) in the control group and
intervention with p value = 0.001 (Prasetyo, 2010).
At some point massage techniques can remove the blockage in the blood so that blood and
energy flow in the body will return smoothly. Head, arms, neck and back are the areas where
women often experience tension. The area is an acupressure point to expedite the process of
lactation. Additionally innervated by nerves in the breast or the spinal cord which spreads along the
dorsal spine. Massage is performed on the head area to help stimulate energy, lower stress levels
and make the mind becomes more convenient. Massage is one of the effective supportive therapy
to reduce physical discomfort as well as improve mood disorders. Reduction of discomfort in
breastfeeding mothers breast milk will help smooth expenditure (Aprilia and Brenda, 2011; Aprilia,
2011).
Another study by Azizah (2011) on the effect of massage on pain intensity endorphine first
stage of normal labor mothers of primiparous at BPS S and B Demak, showed no effect of
massage on pain intensity endorphine first stage of normal labor mothers of primiparous at BPS
Demak S and B (p value = 0.000 <0.05). Endorphine massage is one of the non-pharmacological
therapies to reduce or relieve pain in childbirth. This massage excitatory impulses that cause the
receptor to move quickly from the peripheral nerves to reach the gate of the first run slower pain
impulses along pain fibers. Then the brain receives and interprets sensations in general do not
receive the message and the message of pain.
Endorphine substances can increase the release of oxytocin, a hormone that facilitates the
delivery so as to reduce pain. Associated with the postpartum period, endorphine hormones
increase production of the hormone oxytocin plays a role in the increase in the volume of milk (let
down reflex). In addition, endorphine sensation relaxed and comfortable in postpartum mothers,
reduce stress and anxiety. Factors that inhibit the secretion of the oxytocin is the stress and
anxiety (Maliha, 2011; James; Pornratshaneewirapong, 2005).
Effect of combination method with massage Woolwich endorphine on prolactin levels and
breast milk volume is very significant, if this technique is done by mothers, especially primiparous
postpartum mother‘s lactation on a regular basis then the problems that arise in the first days of
delivery like a little breast milk volume and milk expenditures not smooth, early formula feeding to
infants can be addressed so as to improve the coverage of breastfeeding in the first hour of birth
even exclusive breastfeeding for 6 months.
Public Health Department, Faculty of Sports Science, F1 Building, 2nd
Floor, Sekaran Campus Gunungpati, Semarang City, Central Java Province, Indonesia, 50229 Phone/ Fax. +6224 8508007
491
Closing
After doing this research it can be concluded that: (1) Characteristics of the postpartum
mother‘s variables were age, education and employment in the intervention group and the control
group is homogeneous or similar. 2. Prolactin levels and breast milk volume of pre-action in the
intervention group and the control group showed no difference (p = 0.069 and p = 0.751). While the
prolactin levels and breast milk volume after the action in the intervention group and the control
group showed no difference (p = 0.006 and p = 0.000); (2) There is a difference in levels of the
prolactin in the intervention group pre and post measures, the results of p value 0.005 <α (0.05).
To the volume of milk in the intervention group pre and post actions there is a difference, where the
p value 0.005 <α (0.05).; (3) There is a difference between the levels of the prolactin in postpartum
primiparous mother after being given a combination of massage methods Woolwich with
endorphine compared with the control group in which the p value 0.034. Volume breastfeeding
postpartum mothers were given the intervention were higher than in maternal postpartum in the
control group and concluded that there is a difference between the volume of milk in the
postpartum primiparous mother after being given a combination of massage methods Woolwich
with endorphine with p value of 0.000.
Health professionals (midwives) should apply a combination of intervention methods in
Woolwich and endorphine postpartum massage visits (KF1) and disseminate to the public so as to
increase the scope of exclusive breastfeeding in infants. Hospitals, health centers can improve the
coverage of exclusive breastfeeding by applying / using a combination of intervention methods and
endorphine Woolwich massage to increase levels of the hormone prolactin and breast milk volume
in mothers postpartum. For the District Health Office management programs need to establish
policies lactation (breastfeeding counselor training) by means of the development of one
complementary therapy massage combination method Woolwich and endorphine for health
workers, especially for midwives to achieve exclusive breastfeeding coverage. Improving
postpartum health for the mother during lactation and prevent problems in lactation with stay
relaxed, maintain nutrition and treatment with the method of breast massage Woolwich and
endorphine. For further research the need for further research on the Effect of Combination
Methods endorphine Massage Woolwich and the hormone prolactin levels and breast milk volume
with a larger sample size by controlling the nutritional factors respondents.
References
Ambarwati, R,E., Wulandari, D. (2009) Asuhan Kebidanan Nifas. Jogjakarta: Mitra Cendika Press. Aprilia, Yesie. (2011) Siapa Bilang Melahirkan Itu Sakit. Yogyakarta : Penerbit ANDI. Aprillia, Yesie & Brenda Ritchmond, (2011) Gentle Birth ―Melahirkan Nyaman Tanpa Rasa Sakit‖,
Jakarta : Gramedia. Arikunto, S . (2006) Prosedur Penelitian Suatu Pendekatan Praktik. Edisi Revisi VI . Jakarta:
Rineka Cipta. Azizah, Iin Nur, dkk (2011). Pengaruh Endorphine Massage Terhadap Intensitas Nyeri Kala I
Persalinan Normal Ibu Primipara di BPS S dan B Demak. http:jurnal.unimus.ac.id
492
Public Health Department, Faculty of Sports Science, F1 Building, 2nd
Floor, Sekaran Campus Gunungpati, Semarang City, Central Java Province, Indonesia, 50229 Phone/ Fax. +6224 8508007
Badan Pusat Statistik. (2012). Survei Demografi dan Kesehatan Indonesia. BPS-BKKBN Kemenkes RI-Measure DHS, ICF International.
Biancuzzo, M. (2003) Breastfeeding the newborn: Clinical strategies for nurses. St. Louis: Mosby. Bobak IM, Lowdermilk DL, Jensen MD. (2004 ). Buku Ajar Keperawatan Maternitas (Maternity
Nursing) Edisi 4, Maria A Wijayarti dan Peter Anugerah (penterjemah). Jakarta: EGC. Jones L, Othman M, Dowswell T, Alfirevic Z, Gates S, Newburn M, Jordan S, Lavender T, Neilson
JP. Pain management for women in labour: an overview of systematic reviews (Review). The Cochrane Collaboration. Published by JohnWiley & Sons, Ltd. Copyright © 2012
James N. Dillard, MD, DC, CAc, FAAPM&Ra,b, Sharon Knapp, MS, FNP, NP-Cc. Complementary and Alternative Pain Therapy in the Emergency Department.
Kemenkes RI (2013). Pekan ASI Sedunia 2013. Direktorat Jenderal Bina Gizi dan KIA. www.gizikia.depkes.go.id
Maliha, amin. Efektivitas Massage Rolling (Punggung) Terhadap Produksi ASI Ibu Postpartum Sectio Secarea di Rumah Sakit Muhammadiyah Palembang tahun 2011.
Moehyi, Syamien. (2008). Bayi Sehat dan Cerdas Melalui Gizi dan Makanan Pilihan : Panduan Asupan gizi untuk bayi dan balita. Jakarta : Pustaka Mina.
Pornratshanee Weerapong, et.al. The Mechanisms of Massage and Effects on Performance, Muscle Recovery and Injury Prevention. Sports Med 2005; 35 (3): 235-256 0112-1642/05/0003-0235/$34.95/0
Potter & Anne Griffin Perry. 2005. Buku Ajar Fundamental Keperawatan. Jakarta: EGC. Prasetyo. 2010. Konsep dan Keperawatan Nyeri. Yogyakarta : GrahaIlmu. Purnomo, Rizal (2011). Profil Dinas Kesehatan Kabupaten Tegal Tahun 2011 Reeder, Sharon J. (2011). Keperawatan Maternitas: kesehatan wanita, bayi & keluarga. Jakarta :
EGC. Sastroasmoro, S., Ismael, S (2008). Dasar-Dasar Metodologi Penelitian Klinis. Jakarta : CV
Sagung Seto Smeltzer, C. 2001. Buku Ajar Keperawatan Medikal Bedah Edisi 8.Vol. 1. Jakarta: EGC. Soetjiningsih. (1997). ASI Petunjuk Untuk Tenaga Kesehatan. Jakarta: EGC. Sugiyono. (2006). Metode Penelitian Kuantitatif, Kualitatif dan R & D. Bandung : Alfabeta Sulistyawati, Ari. (2009). Buku Ajar Asuhan Kebidanan pada Ibu Nifas. Yogyakarta : Penerbit Andi. Supranto, J. (2000). Teknik Sampling untuk Survei dan Eksperimen. Jakarta : PT Rineka Cipta Suradi & Tobing (2004). Manajemen Laktasi. Jakarta : Perinasia
Public Health Department, Faculty of Sports Science, F1 Building, 2nd
Floor, Sekaran Campus Gunungpati, Semarang City, Central Java Province, Indonesia, 50229 Phone/ Fax. +6224 8508007
493
ELIMINATING HIV AIDS, MALARIA,
AND OTHER DIESEASE
PAPERS

494
Public Health Department, Faculty of Sports Science, F1 Building, 2nd
Floor, Sekaran Campus Gunungpati, Semarang City, Central Java Province, Indonesia, 50229 Phone/ Fax. +6224 8508007
Public Health Department, Faculty of Sports Science, F1 Building, 2nd
Floor, Sekaran Campus Gunungpati, Semarang City, Central Java Province, Indonesia, 50229 Phone/ Fax. +6224 8508007
495
RISK FACTORS OF HOST THE ELDERLY ACUTE RESPIRATORY INFECTIONS (ARI) IN ULAK KARANG HEALTH CENTER
Fauziah Elytha1, Masrul1, Rafni Mustika1
1University of Andalas, Indonesia
Corresponding Authors: [email protected]
Abstract Introduction: This study purpose to determine the risk factors that contribute to host ARI incidence in older adults in the Ulak Karang of Health Center in 2012. Host whose role is the nutritional status, smoking, and comorbidities. Methods: This study used a case-control design with mathing age and gender. The total sample of 126 people (63 cases and 63 controls). The study was conducted from May to July of 2013 samples were taken by systematic random sampling. Data were analyzed using multivariate analysis by logistic regression to test the conditional backward method. Results: The results found that respondents have less risk of nutritional status 37 times greater risk of respiratory infection than seniors who have normal nutritional status (OR = 37, 95% CI: 15.34 to 89.374). Another variable that has a significant role on the incidence of respiratory infection in the elderly in Ulak Karang Health Center are elderly respondents who had a concomitant disease (p = 0.038, OR = 24, 95% CI: 10.49 to 55.28). Smoking variables were risk factors that contribute to the incidence of ARI as having p-value> 0.05 (0.67). Keywords: Risk factors, ARI elderly Introduction
One indicator of the success of development is increase in life expectancy of the population.
Increased life expectancy caused the number of elderly is increasing every year. According to
WHO, elderly (seniors) are a group of people aged 60 years or more. (2009) Ministry of Health to
classify the elderly into three groups, namely pre elderly (45-59 years), elderly (60-69 years), high
risk elderly (≥ 70 years or ≥ 60 years of age with health problems). (Ministry of Health of the
Republic of Indonesia, 2012)
The number of elderly in the world is expected in 2025 will reach 1.2 billion, and by 2050
would be 2 billion (21% of total world population), of which approximately 80% live in developing
countries. Indonesia is one of the fast growing countries lansianya, where the number of elderly in
2000 reached 14.4 million persons (7.18%) and the year 2007 has reached 18.96 million people
(8.42%). (Summary of Material Dialog Metro TV, 2009). This number is predicted to double to 28.8
million people (11.34%) in 2020. Increasing of life expectancy and the number of elderly would
result in changes to various aspects of life, be it social, economic, and especially health, due to the
increasing age , then the function of organs will decrease either due to natural factors as well as
disease. (Summary of Material Dialog Metro TV, 2009).
Disease that is often experienced by the elderly is a degenerative disease, cardiovascular,
cancer, and other non-infectious diseases. However, do not rule out the possibility that infectious
diseases are also more and more, this was due to a decrease in the immune system of the elderly.
496
Public Health Department, Faculty of Sports Science, F1 Building, 2nd
Floor, Sekaran Campus Gunungpati, Semarang City, Central Java Province, Indonesia, 50229 Phone/ Fax. +6224 8508007
One of the infectious diseases found in the elderly is Acute Respiratory Infection (ARI). (Darmojo,
2009)
Acute Respiratory Infection (ARI) is an infectious disease that is most prevalent in the
community and often cause health problems. Therefore, precautions and infection control in health
care facilities should not be ignored and must be implemented effectively. (WHO, 2007) ARI
classified on pneumonia and not pneumonia. Pneumonia is an example of ARI is not cold like
cough, rhinitis, pharyngitis, tonsillitis and upper airway diseases other. (Ministry of Health of the
Republic of Indonesia, 2010) On the epidemiology of ARI pneumonia in the elderly community is
also divided into pneumonia and nosocomial pneumonia. (Darmojo, 2009)
ARI very high mortality rate in infants, children, and elderly people, especially in countries
with low per capita income and middle. (WHO, 2007) ARI pneumonia is the fourth leading cause of
death and lung infections in elderly which can be acute or chronic. Acute pneumonia is very
dangerous because it can decrease the immune system that causes rapid patients susceptible to
other diseases or exacerbating other existing disease, whereas patients with chronic pneumonia is
often too late to get treatment because they do not realize they have the disease. (Agus A, 2010)
Risk factors of ARI elderly based on the concept of the triangle models of infections include
agent factors, host (Host) and environmental conditions. The occurrence of one of the components
of balance disorders, a cause of ARI. Host factors are determinants of the occurrence of infectious
diseases, one of which is a respiratory infection. This is due to respiratory disease can occur in a
person depends / determined by the immunity / resistance the person concerned. (Notoatmodjo S,
2009)
Based on the results in 2007 Riskesdas ARI morbidity in West Sumatra were the highest of
the various infectious diseases that are 26.4% of cases with a population of 4,697,764 people
which is based on diagnosis and symptom prevalence in the age group 55-64 years, 65-74 years ,
and> 75 years respectively were 31.6%, 34.7%, and 37.7%. Agency (Health Research and
Development, 2008) In the health profile of West Sumatra in 2010, ARI was ranked first of 10 most
diseases. It shows that ARI become one of the health problems in West Sumatra.
Based on the profile of Padang City Health Department in 2011, ISPA still ranks first on the
10 most prevalent diseases in the community and also affects many elderly (19.9% in 2010 and
22.6% in 2011 to 82 784 the number of elderly people). (Padang City Health Department, 2012)
This shows that ARI morbidity in the elderly in the city of Padang is increasing every year.
This study aimed to determine the risk factors that contribute to host ARI incidence in the
elderly in Ulak Karang Health Center in 2012.
Methods
This study is an analytic studies with case-control design (case control study) were used to
determine the risk factors for the incidence of respiratory infection in the elderly host.
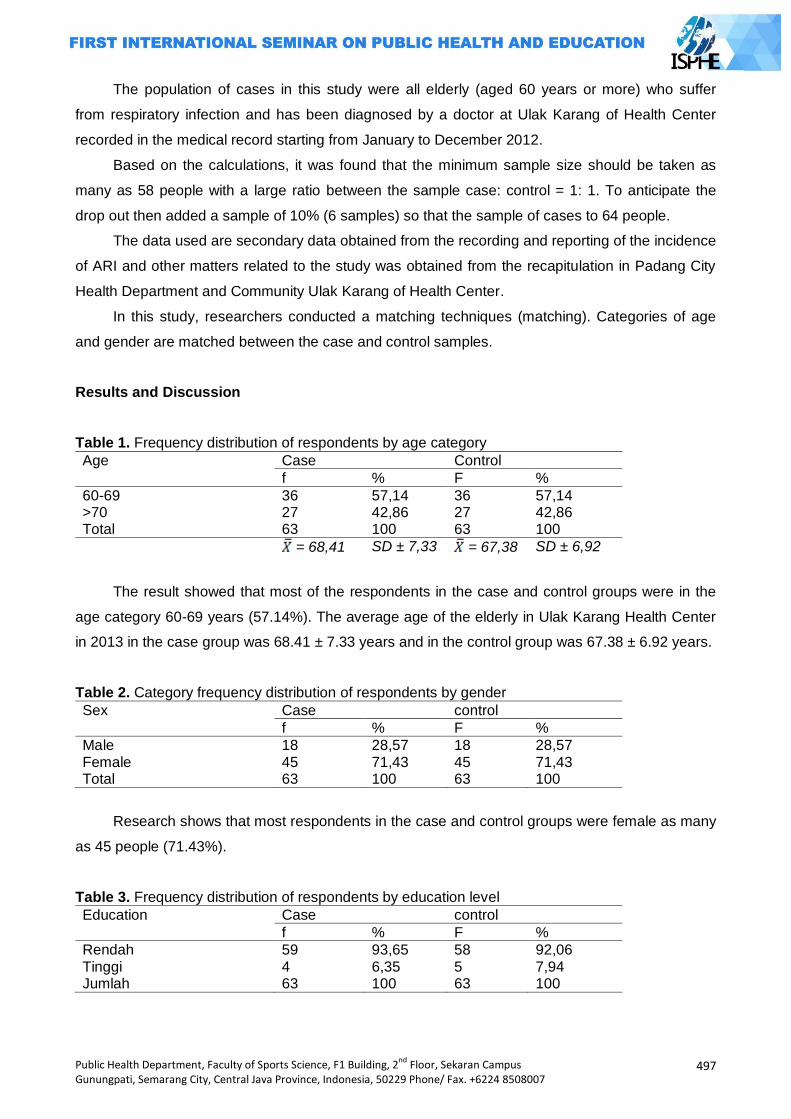
Public Health Department, Faculty of Sports Science, F1 Building, 2nd
Floor, Sekaran Campus Gunungpati, Semarang City, Central Java Province, Indonesia, 50229 Phone/ Fax. +6224 8508007
497
The population of cases in this study were all elderly (aged 60 years or more) who suffer
from respiratory infection and has been diagnosed by a doctor at Ulak Karang of Health Center
recorded in the medical record starting from January to December 2012.
Based on the calculations, it was found that the minimum sample size should be taken as
many as 58 people with a large ratio between the sample case: control = 1: 1. To anticipate the
drop out then added a sample of 10% (6 samples) so that the sample of cases to 64 people.
The data used are secondary data obtained from the recording and reporting of the incidence
of ARI and other matters related to the study was obtained from the recapitulation in Padang City
Health Department and Community Ulak Karang of Health Center.
In this study, researchers conducted a matching techniques (matching). Categories of age
and gender are matched between the case and control samples.
Results and Discussion
Table 1. Frequency distribution of respondents by age category
Age Case Control
f % F %
60-69 36 57,14 36 57,14 >70 27 42,86 27 42,86 Total 63 100 63 100
= 68,41 SD ± 7,33 = 67,38 SD ± 6,92
The result showed that most of the respondents in the case and control groups were in the
age category 60-69 years (57.14%). The average age of the elderly in Ulak Karang Health Center
in 2013 in the case group was 68.41 ± 7.33 years and in the control group was 67.38 ± 6.92 years.
Table 2. Category frequency distribution of respondents by gender
Sex Case control
f % F %
Male 18 28,57 18 28,57 Female 45 71,43 45 71,43 Total 63 100 63 100
Research shows that most respondents in the case and control groups were female as many
as 45 people (71.43%).
Table 3. Frequency distribution of respondents by education level
Education Case control
f % F %
Rendah 59 93,65 58 92,06 Tinggi 4 6,35 5 7,94 Jumlah 63 100 63 100
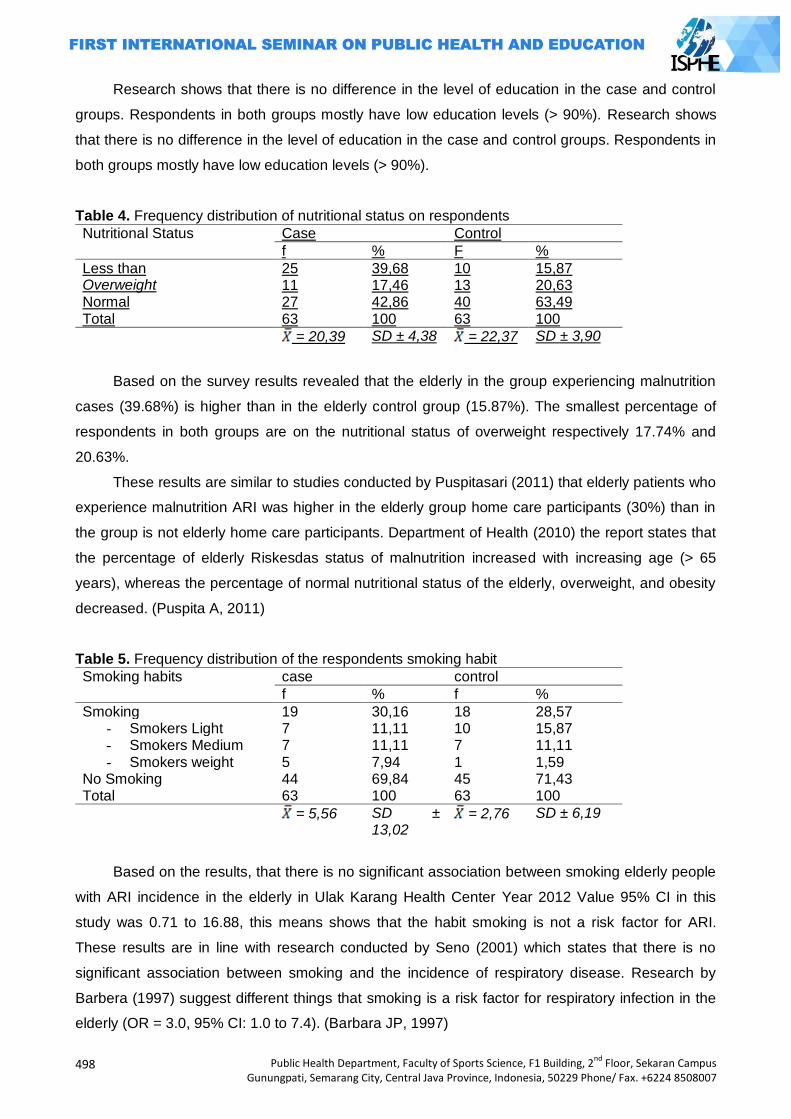
498
Public Health Department, Faculty of Sports Science, F1 Building, 2nd
Floor, Sekaran Campus Gunungpati, Semarang City, Central Java Province, Indonesia, 50229 Phone/ Fax. +6224 8508007
Research shows that there is no difference in the level of education in the case and control
groups. Respondents in both groups mostly have low education levels (> 90%). Research shows
that there is no difference in the level of education in the case and control groups. Respondents in
both groups mostly have low education levels (> 90%).
Table 4. Frequency distribution of nutritional status on respondents
Nutritional Status
Case Control
f % F %
Less than 25 39,68 10 15,87 Overweight 11 17,46 13 20,63 Normal 27 42,86 40 63,49 Total 63 100 63 100 = 20,39 SD ± 4,38 = 22,37 SD ± 3,90
Based on the survey results revealed that the elderly in the group experiencing malnutrition
cases (39.68%) is higher than in the elderly control group (15.87%). The smallest percentage of
respondents in both groups are on the nutritional status of overweight respectively 17.74% and
20.63%.
These results are similar to studies conducted by Puspitasari (2011) that elderly patients who
experience malnutrition ARI was higher in the elderly group home care participants (30%) than in
the group is not elderly home care participants. Department of Health (2010) the report states that
the percentage of elderly Riskesdas status of malnutrition increased with increasing age (> 65
years), whereas the percentage of normal nutritional status of the elderly, overweight, and obesity
decreased. (Puspita A, 2011)
Table 5. Frequency distribution of the respondents smoking habit
Smoking habits case control
f % f %
Smoking 19 30,16 18 28,57 - Smokers Light 7 11,11 10 15,87 - Smokers Medium 7 11,11 7 11,11 - Smokers weight 5 7,94 1 1,59
No Smoking 44 69,84 45 71,43 Total 63 100 63 100
= 5,56 SD ± 13,02
= 2,76 SD ± 6,19
Based on the results, that there is no significant association between smoking elderly people
with ARI incidence in the elderly in Ulak Karang Health Center Year 2012 Value 95% CI in this
study was 0.71 to 16.88, this means shows that the habit smoking is not a risk factor for ARI.
These results are in line with research conducted by Seno (2001) which states that there is no
significant association between smoking and the incidence of respiratory disease. Research by
Barbera (1997) suggest different things that smoking is a risk factor for respiratory infection in the
elderly (OR = 3.0, 95% CI: 1.0 to 7.4). (Barbara JP, 1997)
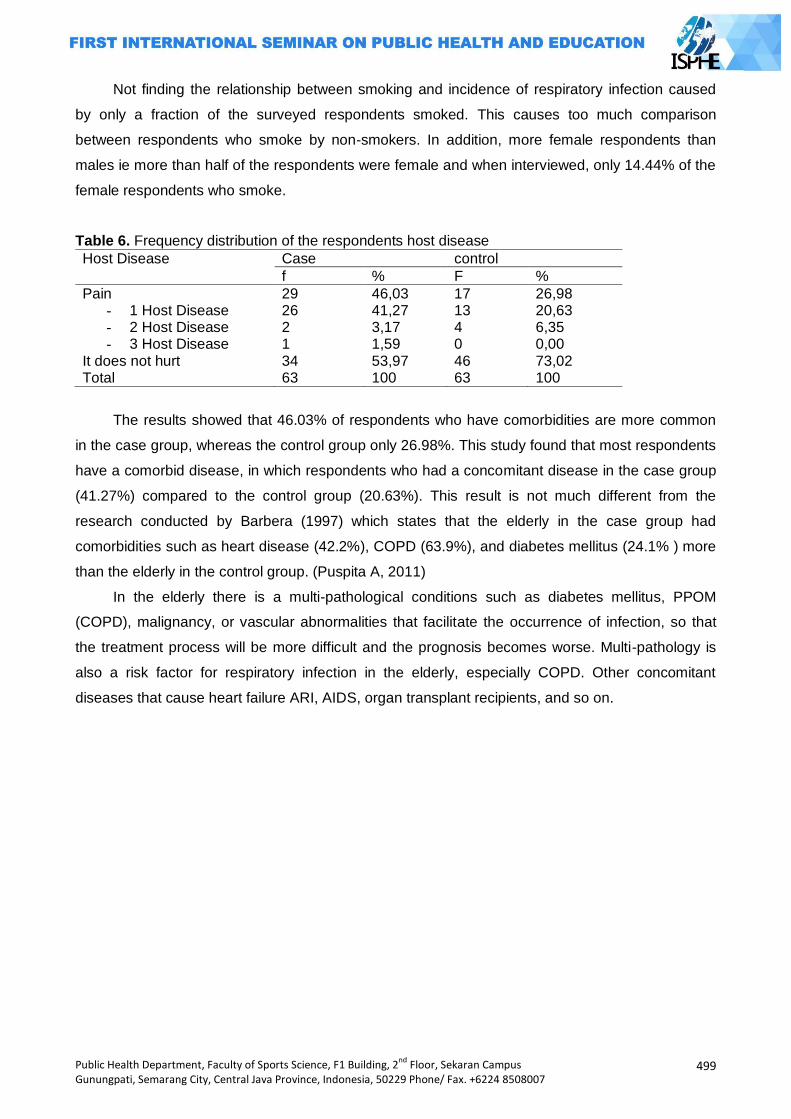
Public Health Department, Faculty of Sports Science, F1 Building, 2nd
Floor, Sekaran Campus Gunungpati, Semarang City, Central Java Province, Indonesia, 50229 Phone/ Fax. +6224 8508007
499
Not finding the relationship between smoking and incidence of respiratory infection caused
by only a fraction of the surveyed respondents smoked. This causes too much comparison
between respondents who smoke by non-smokers. In addition, more female respondents than
males ie more than half of the respondents were female and when interviewed, only 14.44% of the
female respondents who smoke.
Table 6. Frequency distribution of the respondents host disease
Host Disease Case control
f % F %
Pain 29 46,03 17 26,98 - 1 Host Disease 26 41,27 13 20,63 - 2 Host Disease 2 3,17 4 6,35 - 3 Host Disease 1 1,59 0 0,00
It does not hurt 34 53,97 46 73,02 Total 63 100 63 100
The results showed that 46.03% of respondents who have comorbidities are more common
in the case group, whereas the control group only 26.98%. This study found that most respondents
have a comorbid disease, in which respondents who had a concomitant disease in the case group
(41.27%) compared to the control group (20.63%). This result is not much different from the
research conducted by Barbera (1997) which states that the elderly in the case group had
comorbidities such as heart disease (42.2%), COPD (63.9%), and diabetes mellitus (24.1% ) more
than the elderly in the control group. (Puspita A, 2011)
In the elderly there is a multi-pathological conditions such as diabetes mellitus, PPOM
(COPD), malignancy, or vascular abnormalities that facilitate the occurrence of infection, so that
the treatment process will be more difficult and the prognosis becomes worse. Multi-pathology is
also a risk factor for respiratory infection in the elderly, especially COPD. Other concomitant
diseases that cause heart failure ARI, AIDS, organ transplant recipients, and so on.
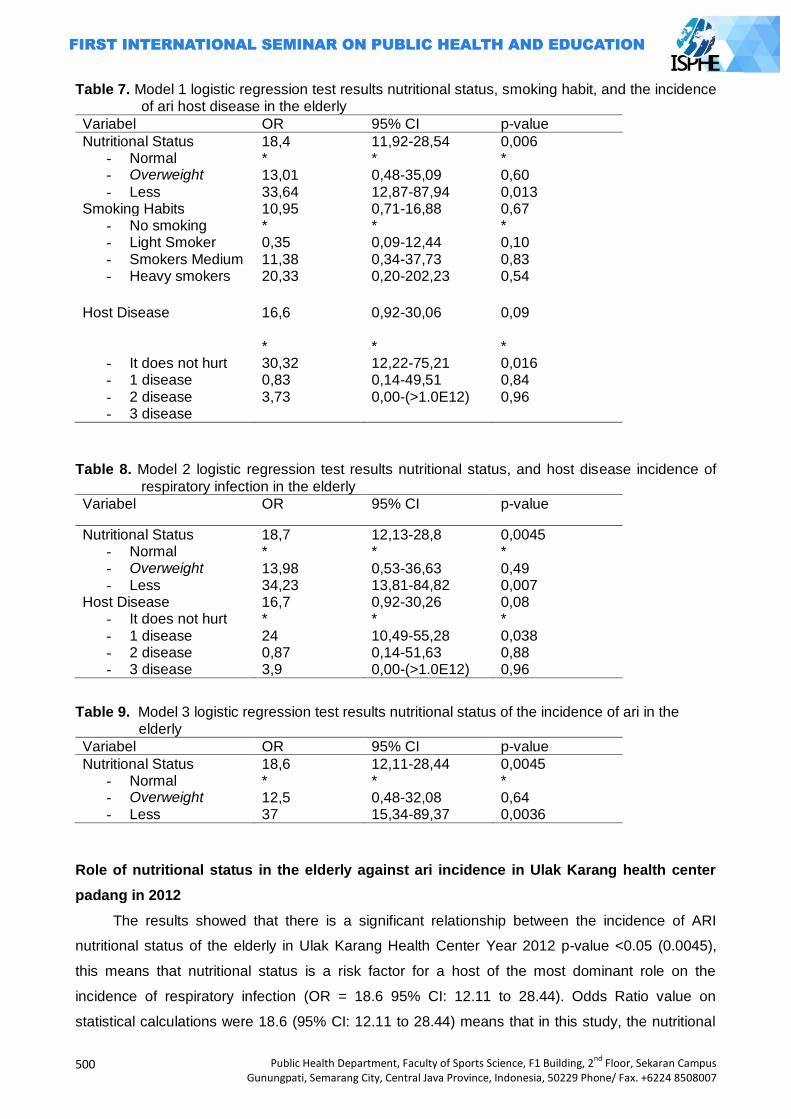
500
Public Health Department, Faculty of Sports Science, F1 Building, 2nd
Floor, Sekaran Campus Gunungpati, Semarang City, Central Java Province, Indonesia, 50229 Phone/ Fax. +6224 8508007
Table 7. Model 1 logistic regression test results nutritional status, smoking habit, and the incidence of ari host disease in the elderly
Variabel OR 95% CI p-value
Nutritional Status 18,4 11,92-28,54 0,006 - Normal - Overweight
- Less
* 13,01 33,64
* 0,48-35,09 12,87-87,94
* 0,60 0,013
Smoking Habits 10,95 0,71-16,88 0,67 - No smoking - Light Smoker - Smokers Medium - Heavy smokers
* 0,35 11,38 20,33
* 0,09-12,44 0,34-37,73 0,20-202,23
* 0,10 0,83 0,54
Host Disease
16,6 0,92-30,06 0,09
- It does not hurt - 1 disease - 2 disease - 3 disease
* 30,32 0,83 3,73
* 12,22-75,21 0,14-49,51 0,00-(>1.0E12)
* 0,016 0,84 0,96
Table 8. Model 2 logistic regression test results nutritional status, and host disease incidence of
respiratory infection in the elderly
Variabel OR 95% CI p-value
Nutritional Status 18,7 12,13-28,8 0,0045 - Normal - Overweight - Less
* 13,98 34,23
* 0,53-36,63 13,81-84,82
* 0,49 0,007
Host Disease 16,7 0,92-30,26 0,08 - It does not hurt - 1 disease - 2 disease - 3 disease
* 24 0,87 3,9
* 10,49-55,28 0,14-51,63 0,00-(>1.0E12)
* 0,038 0,88 0,96
Table 9. Model 3 logistic regression test results nutritional status of the incidence of ari in the elderly
Variabel OR 95% CI p-value
Nutritional Status 18,6 12,11-28,44 0,0045 - Normal - Overweight - Less
* 12,5 37
* 0,48-32,08 15,34-89,37
* 0,64 0,0036
Role of nutritional status in the elderly against ari incidence in Ulak Karang health center
padang in 2012
The results showed that there is a significant relationship between the incidence of ARI
nutritional status of the elderly in Ulak Karang Health Center Year 2012 p-value <0.05 (0.0045),
this means that nutritional status is a risk factor for a host of the most dominant role on the
incidence of respiratory infection (OR = 18.6 95% CI: 12.11 to 28.44). Odds Ratio value on
statistical calculations were 18.6 (95% CI: 12.11 to 28.44) means that in this study, the nutritional
Public Health Department, Faculty of Sports Science, F1 Building, 2nd
Floor, Sekaran Campus Gunungpati, Semarang City, Central Java Province, Indonesia, 50229 Phone/ Fax. +6224 8508007
501
status of the elderly who have less / overweight risk 18 times greater risk of respiratory infection
than the elderly who have a normal nutritional status. In addition, the results also show that the
nutritional status of the elderly is approximately 37 times greater risk of respiratory infection risk
than the elderly who have a normal nutritional status.
However, these results differ from the findings Puspitasari (2011) which states that instead of
the nutritional status of the elderly are susceptible to cause respiratory disease, but respiratory
infection that causes the nutritional status of the elderly has declined (p <0.05). (Barbara JP, 1997)
It is also stated by Dewa et al (2003) in Ocktafiany which states that nutritional status does not give
an increased risk of respiratory disease. (Oktaviany E, 2010)
Nutritional status is closely related to the state of nutrition in the elderly who are often not
good and can affect incubation, trips, as well as the impact of the infection. Malnutrition in the
elderly will lead to decreased immune system so that the elderly are more susceptible to infectious
diseases, particularly respiratory infection. (Darmojo B, 2004) Azad (2002) in Puspitasari (2011)
states that the individual is at risk of respiratory tract infections, heart problems, pressure sores,
premature death, and multi-organ disorder is malnourished individuals. (Barbara JP, 1997)
In addition, being overweight can also aggravate a person's lung function. In obesity, typically
occurs accumulation of fat in the neck, chest, and abdominal wall that can interfere with the
fulfillment of the chest wall, thus causing a decrease in lung volume or respiratory movement
occurs limitations (restriction) so as to facilitate the occurrence of infection in the lung, especially of
ARI. (Darmojo B, 2004)
Role against smoking habit incidence of ari in the elderly at Ulak Karang health center in
2012
Based on the results, that there is no significant association between smoking elderly people
with ARI incidence in the elderly in Ulak Karang Health Center Year 2012 Value 95% CI in this
study was 0.71 to 16.88, this means shows that the habit smoking is not a risk factor for ARI.
These results are in line with research conducted by Seno (2001) which states that there is no
significant association between smoking and the incidence of respiratory disease. Research by
Barbera (1997) suggest different things that smoking is a risk factor for respiratory infection in the
elderly (OR = 3.0, 95% CI: 1.0 to 7.4). (Puspitasari, 2011)
Smoking can cause constriction of the airways that worsen pulmonary function. (B Darmojo
2004) Impact of smoking on the lungs is impaired movement of the cilia in the respiratory tract,
damaging the function of the alveoli, causing inflammation and thus susceptible to infection. (Agua
A, 2009) This is due to the ingredients contained in cigarettes such as tar, nicotine, benzopyrin,
metikloridee, acetone, ammonia, and carbon monoxide. (Buntan Mn)
Not finding the relationship between smoking and incidence of respiratory infection caused
by only a fraction of the surveyed respondents smoked. This causes too much comparison
between respondents who smoke by non-smokers. In addition, more female respondents than
502
Public Health Department, Faculty of Sports Science, F1 Building, 2nd
Floor, Sekaran Campus Gunungpati, Semarang City, Central Java Province, Indonesia, 50229 Phone/ Fax. +6224 8508007
males ie more than half of the respondents were female and when interviewed, only 14.44% of the
female respondents who smoke.
Role of host disease in the elderly against ari incidence in Ulak Karang health center
padang in 2012
The results showed that there is a significant relationship between the elderly who have a 1-
morbidities (COPD / heart disease / diabetes mellitus) with the incidence of respiratory infection in
the elderly in Ulak Karang Health Center Year 2012 p-value <0.05 (0.038), it is means the elderly
who have a comorbid disease is a risk factor for ARI. Odds Ratio value on statistical calculations
were 24 (95% CI: 10.49 to 55.28) means that in this study, the elderly who have a comorbid
disease risk 24 times greater risk of respiratory infection than seniors who do not have co-
morbidities.
This is consistent with the results of research conducted by Barbera (1997) which states that
the elderly who have comorbidities such as COPD (OR = 5.8 CI: 3.1 to 11.1), heart disease OR =
2.2 CI: 1 , 2 to 4.0), and diabetes mellitus (OR = 3.5 CI: 1.6 to 7.5) risk of respiratory disease. (IP
Barbera, 1997) It is also stated by Hertzen et al (1996) in his research that the elderly who suffer
from COPD with pneumonia risk 7.4 times compared to the elderly who do not suffer from COPD
(OR = 7.4, 95% CI: 2.1 - 25.7). (Von Hertzen)
In the elderly there is a multi-pathological conditions such as diabetes mellitus, PPOM
(COPD), malignancy, or vascular abnormalities that facilitate the occurrence of infection, so that
the treatment process will be more difficult and the prognosis becomes worse. Increased incidence
and prevalence of respiratory infection in the elderly is associated with a patient's illness such as
diabetes mellitus, heart disease, and COPD.
Diabetes mellitus causes a decrease in the body's immune system functions better the
process of chemotaxis and phagocytosis. In heart disease, especially congestive heart failure
accompanied by pulmonary edema, decreased lung clearance function so that colonization of
germ duct breath easily multiply. Patients who previously often consume drugs are sedatives or
hypnotics high risk of aspiration of making it easier for an infection because both drugs suppress
cough stimuli.
In this research found that elderly people who have a comorbid disease is a risk factor that
contributes to the incidence of ARI. This is because the group of cases that have more
comorbidities than the cases had two or three comorbidities. So that the statistical results only the
elderly who have a significant comorbidities on the incidence of respiratory infection in the elderly
Closing
Variables and the nutritional status of the elderly who have co-morbidities in this study is a
risk factor for respiratory infection in the elderly. From these two variables, nutritional status is a
risk factor for the occurrence of ARI dominant. While the smoking variable, not a risk factor in this
study.
Public Health Department, Faculty of Sports Science, F1 Building, 2nd
Floor, Sekaran Campus Gunungpati, Semarang City, Central Java Province, Indonesia, 50229 Phone/ Fax. +6224 8508007
503
The clinic should provide health education to the community through efforts dioptimalkannya
promotion and health education in a variety of existing posyandu elderly, as well as any related
respiratory disease risk factors associated with it. For the community needs to be improved
nutritional status in the elderly with nutritious foods and participate in a variety of outreach activities
conducted by health institutions associated with ARD and various risk factors associated with it so
as to increase the knowledge society, especially the elderly.
References
Agus A. 2010. Disease in Old Age. Jakarta: EGC. Agency for Health Research and Development. 2008. Results Health Research (Riskesdas) 2007
West Sumatra Jakarta: Ministry of Health. Barbera JP. 1997. Reduction In Hospital Admissions For Pneumonia In Non-institutionalized
Elderly People As A Result Of Influenza Vaccination: A Case Control Study In Spain. J Epidemiol Community Health 1997. 51: 526-30.
Bustan MN. Epidemiology of Communicable Diseases. Jakarta: Rineka Reserved. Darmojo B. 2004. Textbook of Geriatric (Elderly Health Sciences). London: School of Medicine. Padang City Health Office. 2012. Department of Health Annual Report Year 2011. Padang
Padang: DKK Padang. Ministry of Health of the Republic of Indonesia. 2012. Nutrition Guidelines for Elderly Care. Jakarta:
Ministry of Health. Ministry of Health of the Republic of Indonesia. 2010. Health Profile of Indonesia Year 2009
Jakarta: Kemterian of Health. Notoatmodjo S. 2007. Public Health Sciences and the Arts. Jakarta: Rineka Copyright. E. 2012. Conditions Ocktafiany Home And Basic Sanitation Facilities With Disease incidence of
Acute Respiratory Infections, Diarrhea, And Tuberculosis In Sukabumi 2010-2011 [thesis]. Depok: University of Indonesia.
Elderly residents. 2009 [cited 20 November 2012]; Available from: menegpp.go.id. Puspitasari A. 2011. Performance of Food Consumption, Health Status, Depression Level, and
Status of the Elderly Nutrition Program Participants and Non-Participants Home Care IN Tegal Alur, West Jakarta [Thesis]. Bogor: Bogor Agricultural University.
Summary of Material Dialog Metro TV [database on the Internet]. National Commission on the Elderly. 2009 [cited 2 November 2012]. Available from: http://www.komnaslansia.or.id.
Von Hertzen I, at all. 1996. Chlamidya pneumoniae antibodies in chronic obstructive pulmonary disease. International Journal of Epidemiology. 25: No. 3.
WHO. 2007. Prevention and Control of Acute Respiratory Infections (ARI) which Tend Being acute respiratory diseases in health care. Geneva: WHO.
504
Public Health Department, Faculty of Sports Science, F1 Building, 2nd
Floor, Sekaran Campus Gunungpati, Semarang City, Central Java Province, Indonesia, 50229 Phone/ Fax. +6224 8508007
DO CHILD TO CHILD APPROACH PREVENT DENGUE HEMORRHAGIC FEVER?
Forman Novrindo Sidjabat1, Sitti Badrah2, Ridwan2
1 Diponegoro University, Indonesia
2Mulawarman University, Indonesia
Corresponding Author: [email protected]
Abstract Introduction: Many villages in Tarakan have been established as an endemic dengue. Children become vulnerable group of dengue exposed, so, they are expected to be the forefront of efforts to prevent dengue. Child to child is approach of health promotion and education with 6 stages that easy understanding for children and used to improve their capability. The purpose of this research is to determine the effectiveness of child to child approach to improve knowledge, attitude and practice of the child to prevent dengue hemorrhagic fever.
Method: A quasi-experimental research method was used by non randomized One Group Pretest
Posttest. The population in this study was all 6-12 years old students in SDN 001 Selumit Village of Tarakan and 15 students as samples by purposive sampling. Data were analyzed with univariate and bivariate
analysis with Paired T-test (α = 0.05). Result: The result showed there is an increase in respondents dengue fever prevention knowledge
(p value = 0.000), there is an increase in respondents dengue fever prevention attitude (p value = 0.000) and there is an increase in respondents dengue fever prevention practice (p value = 0.000). Child to child approach can prevent dengue hemorrhagic fever because children can improve their capability to perform preventive with use this approach. Keywords: Attitude, CTC, dengue, knowledge, practice Introduction
Child to child is an approach to health promotion and community development led by the
children. It is based on the belief that children can be actively involved in their communities and in
solving community problems (Gibbs, 2002)
The general objective to be achieved child to child approach are: helping to connect the
areas of health and education in the community thus will improve the lives of families, children and
adults; actively involves children and adults in improving the health status of the community; and
encouraging children to do activities individually and also in groups so as to benefit themselves
and others people without additional burden. And specific objectives to be achieved child to child
approach are linking between what children learn at this point with what he will do and connecting
what is done by the children in the class / school with what was done by the children in the home
and in the community (Gibbs, 2002).
Child to child approach develop knowledge and skills like to promote, thinking about health
problem and conduct disease prevention; attitude to foster the willingness of children through what
they learn and how they learn; and changes in behavior and habits of children (Bailey, 1992).
Child to child focuses on developing the potential of individuals and communities to share the
responsibility in order to improve their own health status. Child or group of children can act as
Public Health Department, Faculty of Sports Science, F1 Building, 2nd
Floor, Sekaran Campus Gunungpati, Semarang City, Central Java Province, Indonesia, 50229 Phone/ Fax. +6224 8508007
505
agents of renewal, they can spread the knowledge, teaching skills, demonstrating an example and
cooperate with their peers, younger children, friends from their peers, families and communities
that exist in the surrounding environment. (Bailey, 1992)
According to Gibbs (2002) approach to child to child using a series of linked activities,
starting from children to think about health problems, make decisions, develop life skills to enhance
health and take practice to improve their health in the community, with the support from adults. Six
things that must be developed in this method to involve the activity of the child are: choosing
carefully to understand health issues, seeking information as much as possible, discuss the
findings and plan of practice, doing practice, discuss the results and evaluate, and doing better and
sustainable activities.
East Kalimantan Health Department (2011) noted, the percentage rate of deaths CFR (Case
Fatality Rate), which is 0.88 percent and the average case - Incident Rate (IR) of 12.71 per 100
thousand inhabitants of standard indicators 55 per 100 thousand population, so that people
continue to be cautious about the transmission of dengue virus by mosquitoes. In 2011 the highest
dengue cases occurred in Tarakan, which reached 260 cases (Tarakan City Health Department,
2012).
Of the 21 urban village in the city of Tarakan there are some areas in Tarakan which became
endemic ie Pamusian Village, Sebengkok Village, Selumit Village, Selumit Pantai Village and
Gunung Lingkas Village where there are 289 cases in the year 2009 the number of deaths until
mid-May as 3 cases and continue to grow until a total of 12 people died in the year 2009, while for
controlling the spread of this disease Tarakan City Health Department is more focused on practice
fogging (Kaltara Academy of Nursing, 2011).
Today the case of dengue hemorrhagic fever are not only found in the adult age group but
are now often found in cases of dengue hemorrhagic fever that attacked vulnerable age groups
such as groups of school-age children each year. In contrast to other environment-linked diseases
that show a surge of patients in a given time, the child will be affected by dengue slowly from one
child to another child because of the characteristics of different endurance but tend to be weak and
the distance vector of dengue fly as far as 100 meters.
The purpose of this study was to determine the effect of child to child approach to increase
the knowledge, attitudes and practices of children in the prevention of dengue fever in the SDN
001 Tarakan. In addition, this research is useful to improve the capacity of the child in the
prevention of dengue hemorrhagic fever (DHF) ranging from children to analyze and act upon the
stages of child to child approach, as according to the Edgar Dale theory where the best of learning
is to conduct simulations and as according Roger Everett is adoption started when people have
awareness and interest that can make decision to try the innovation.
506
Public Health Department, Faculty of Sports Science, F1 Building, 2nd
Floor, Sekaran Campus Gunungpati, Semarang City, Central Java Province, Indonesia, 50229 Phone/ Fax. +6224 8508007
Methods
Characteristically Research Type Pre-experiment, the model of One Group Pretest Posttest
Design the experiments were carried out on a group without a comparison group. The experiment
was conducted in SDN 001 Tarakan in Selumit Village, where this village is the village endimes
DHF in Tarakan and was conducted in July-August of 2012.
The population in this study were all students of SDN 001 Tarakan aged 6-12 years and
living in the Selumit Village, this is because the object of the study is that children who live in an
area of endemic dengue in Tarakan. Sampling technique is purposive sampling where purposive
sampling is based on a considerations particular made by the researchers themselves, the
characteristics and conditions that have been previously known populations (Notoadmojo, 2005).
Inclusion criteria set by the researchers is as follows: (1). Students who live in homogeneous, (2).
Students who had never received counseling about Dengue Fever, (3). Students grade 5 or 6, (4).
Students who are willing to study.
Before initial observation (pre-test) over previous researchers preparing to conduct licensing
and the formation of a group by selecting the criteria learners with a homogeneous group in a
neighborhood that is then used as the group that will follow the approach of the group discussions
with the child to child.
After making the formation of the group, the researchers conducted a pre-test by conducting
interviews and observations to the students of SDN 001 Tarakan to get the value of the knowledge,
attitudes and practices of the child before the child to child approach held.
After the initial observation / pre-test and researcher to treatment or intervention by the
practice approaches using the concept of child to child or so-called six steps (Bailey, Donna et al.,
1994), where the stages of implementation contained in the module child to child. The method
used in the health education group discussions and in the end by making requirements or facilities
that need to address the priority problem. In this case the researchers gave respondents the
opportunity to play a role in making this facility, which will be tailored to the circumstances at the
time. For each step in the child to child is required each time one day so that the total time required
is 6 days, but because the present study measures were taken until at the child to take action so
time to practice is 4 days.
The final stage researchers conducted a post-test after the holding of child to child approach
by means of interviews and observations to determine the knowledge and attitudes of learners
SDN 001 Tarakan after child to child approach. Activity post-test was performed 1 day after the
series of child to child approach ends.
Information and data from respondents was obtained through a questionnaire sheet and
observation sheet distributed to all respondents. Questionnaire sheets and observation sheets
used consisted of 4 sections. For part A is the identity of respondents, a part B is 18 questions
about the respondents' knowledge of dengue fever prevention, a part C is 13 about the respondent
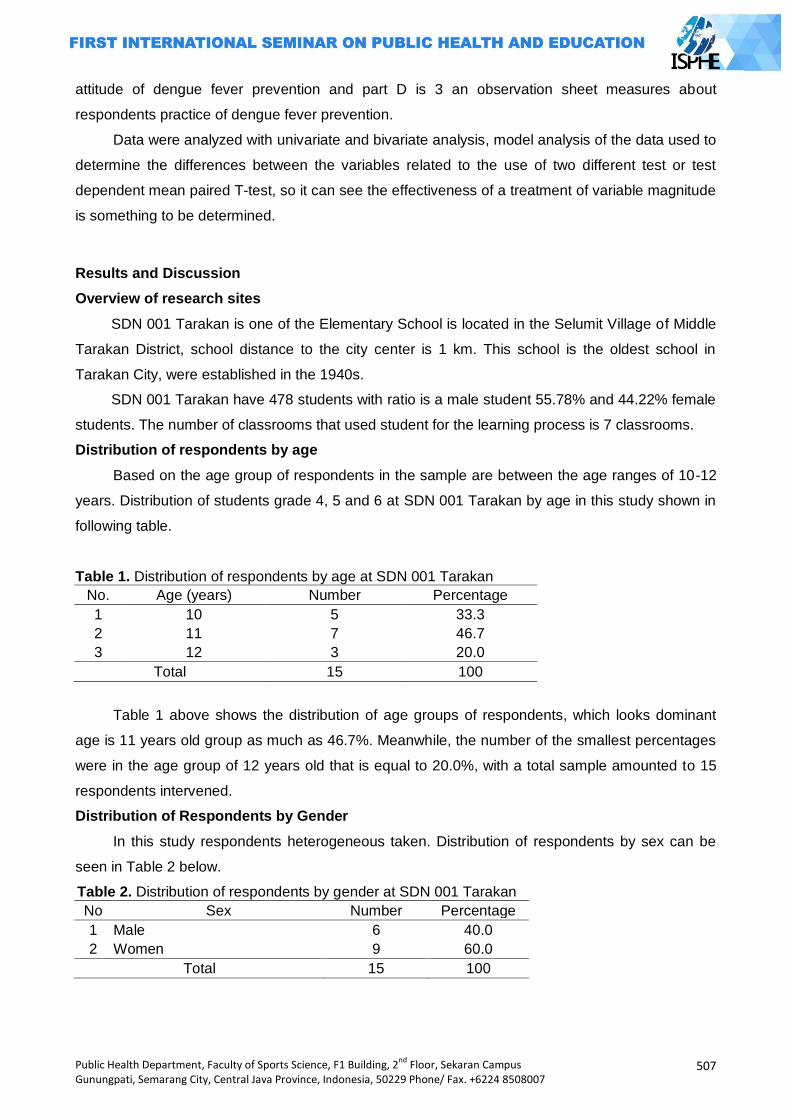
Public Health Department, Faculty of Sports Science, F1 Building, 2nd
Floor, Sekaran Campus Gunungpati, Semarang City, Central Java Province, Indonesia, 50229 Phone/ Fax. +6224 8508007
507
attitude of dengue fever prevention and part D is 3 an observation sheet measures about
respondents practice of dengue fever prevention.
Data were analyzed with univariate and bivariate analysis, model analysis of the data used to
determine the differences between the variables related to the use of two different test or test
dependent mean paired T-test, so it can see the effectiveness of a treatment of variable magnitude
is something to be determined.
Results and Discussion
Overview of research sites
SDN 001 Tarakan is one of the Elementary School is located in the Selumit Village of Middle
Tarakan District, school distance to the city center is 1 km. This school is the oldest school in
Tarakan City, were established in the 1940s.
SDN 001 Tarakan have 478 students with ratio is a male student 55.78% and 44.22% female
students. The number of classrooms that used student for the learning process is 7 classrooms.
Distribution of respondents by age
Based on the age group of respondents in the sample are between the age ranges of 10-12
years. Distribution of students grade 4, 5 and 6 at SDN 001 Tarakan by age in this study shown in
following table.
Table 1. Distribution of respondents by age at SDN 001 Tarakan
No. Age (years) Number Percentage
1 10 5 33.3
2 11 7 46.7
3 12 3 20.0
Total 15 100
Table 1 above shows the distribution of age groups of respondents, which looks dominant
age is 11 years old group as much as 46.7%. Meanwhile, the number of the smallest percentages
were in the age group of 12 years old that is equal to 20.0%, with a total sample amounted to 15
respondents intervened.
Distribution of Respondents by Gender
In this study respondents heterogeneous taken. Distribution of respondents by sex can be
seen in Table 2 below.
Table 2. Distribution of respondents by gender at SDN 001 Tarakan
No Sex Number Percentage
1 Male 6 40.0
2 Women 9 60.0
Total 15 100
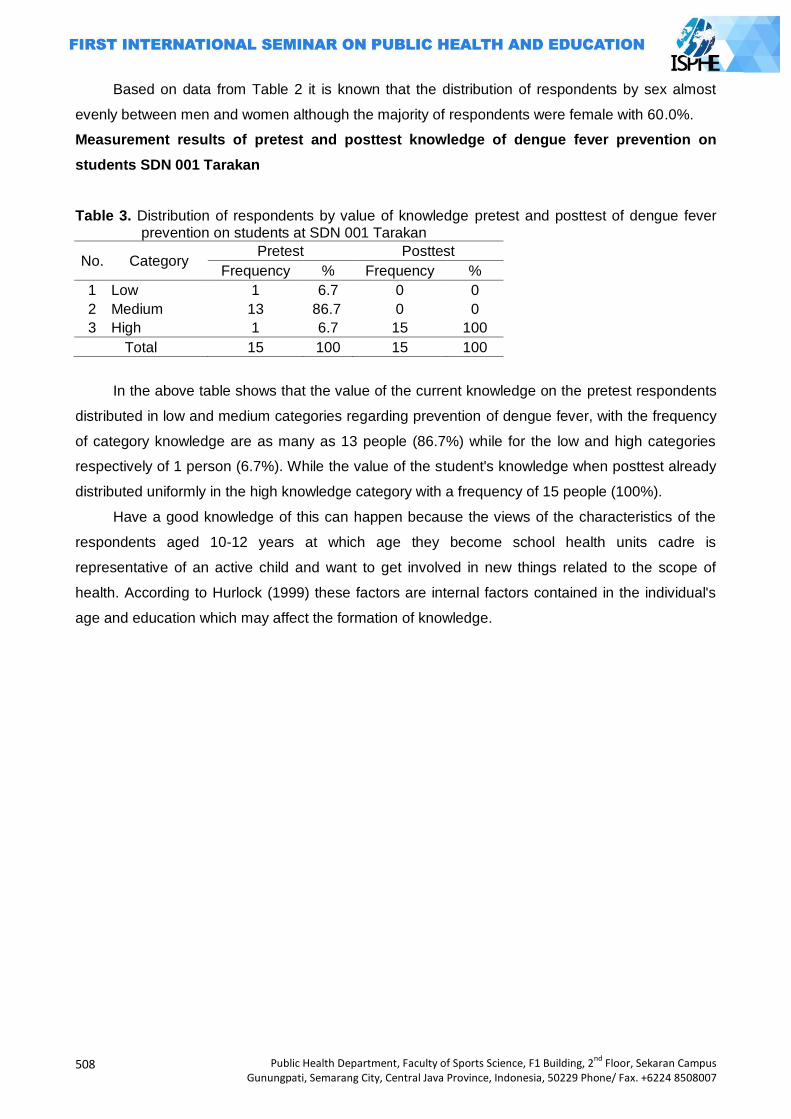
508
Public Health Department, Faculty of Sports Science, F1 Building, 2nd
Floor, Sekaran Campus Gunungpati, Semarang City, Central Java Province, Indonesia, 50229 Phone/ Fax. +6224 8508007
Based on data from Table 2 it is known that the distribution of respondents by sex almost
evenly between men and women although the majority of respondents were female with 60.0%.
Measurement results of pretest and posttest knowledge of dengue fever prevention on
students SDN 001 Tarakan
Table 3. Distribution of respondents by value of knowledge pretest and posttest of dengue fever prevention on students at SDN 001 Tarakan
No. Category Pretest Posttest
Frequency % Frequency %
1 Low 1 6.7 0 0
2 Medium 13 86.7 0 0
3 High 1 6.7 15 100
Total 15 100 15 100
In the above table shows that the value of the current knowledge on the pretest respondents
distributed in low and medium categories regarding prevention of dengue fever, with the frequency
of category knowledge are as many as 13 people (86.7%) while for the low and high categories
respectively of 1 person (6.7%). While the value of the student's knowledge when posttest already
distributed uniformly in the high knowledge category with a frequency of 15 people (100%).
Have a good knowledge of this can happen because the views of the characteristics of the
respondents aged 10-12 years at which age they become school health units cadre is
representative of an active child and want to get involved in new things related to the scope of
health. According to Hurlock (1999) these factors are internal factors contained in the individual's
age and education which may affect the formation of knowledge.
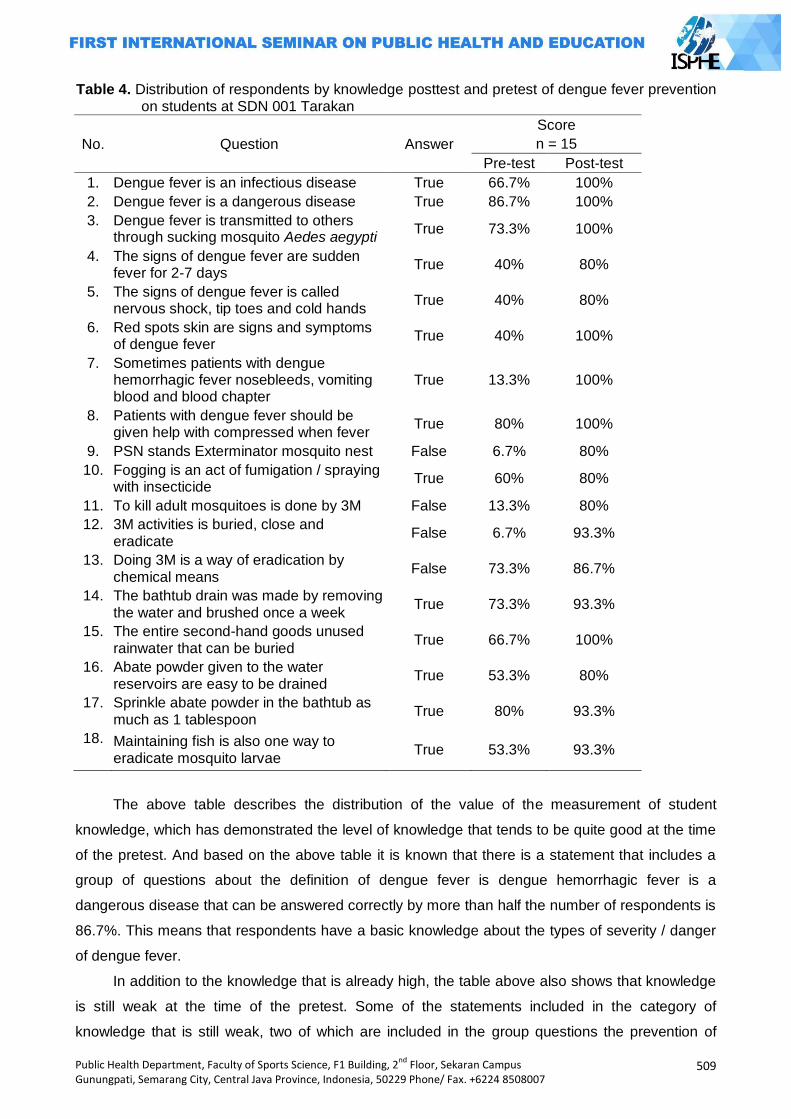
Public Health Department, Faculty of Sports Science, F1 Building, 2nd
Floor, Sekaran Campus Gunungpati, Semarang City, Central Java Province, Indonesia, 50229 Phone/ Fax. +6224 8508007
509
Table 4. Distribution of respondents by knowledge posttest and pretest of dengue fever prevention on students at SDN 001 Tarakan
No. Question Answer
Score
n = 15
Pre-test Post-test
1. Dengue fever is an infectious disease True 66.7% 100%
2. Dengue fever is a dangerous disease True 86.7% 100%
3. Dengue fever is transmitted to others through sucking mosquito Aedes aegypti
True 73.3% 100%
4. The signs of dengue fever are sudden fever for 2-7 days
True 40% 80%
5. The signs of dengue fever is called nervous shock, tip toes and cold hands
True 40% 80%
6. Red spots skin are signs and symptoms of dengue fever
True 40% 100%
7. Sometimes patients with dengue hemorrhagic fever nosebleeds, vomiting blood and blood chapter
True 13.3% 100%
8. Patients with dengue fever should be given help with compressed when fever
True 80% 100%
9. PSN stands Exterminator mosquito nest False 6.7% 80%
10. Fogging is an act of fumigation / spraying with insecticide
True 60% 80%
11. To kill adult mosquitoes is done by 3M False 13.3% 80%
12. 3M activities is buried, close and eradicate
False 6.7% 93.3%
13. Doing 3M is a way of eradication by chemical means
False 73.3% 86.7%
14. The bathtub drain was made by removing the water and brushed once a week
True 73.3% 93.3%
15. The entire second-hand goods unused rainwater that can be buried
True 66.7% 100%
16. Abate powder given to the water reservoirs are easy to be drained
True 53.3% 80%
17. Sprinkle abate powder in the bathtub as much as 1 tablespoon
True 80% 93.3%
18. Maintaining fish is also one way to eradicate mosquito larvae
True 53.3% 93.3%
The above table describes the distribution of the value of the measurement of student
knowledge, which has demonstrated the level of knowledge that tends to be quite good at the time
of the pretest. And based on the above table it is known that there is a statement that includes a
group of questions about the definition of dengue fever is dengue hemorrhagic fever is a
dangerous disease that can be answered correctly by more than half the number of respondents is
86.7%. This means that respondents have a basic knowledge about the types of severity / danger
of dengue fever.
In addition to the knowledge that is already high, the table above also shows that knowledge
is still weak at the time of the pretest. Some of the statements included in the category of
knowledge that is still weak, two of which are included in the group questions the prevention of
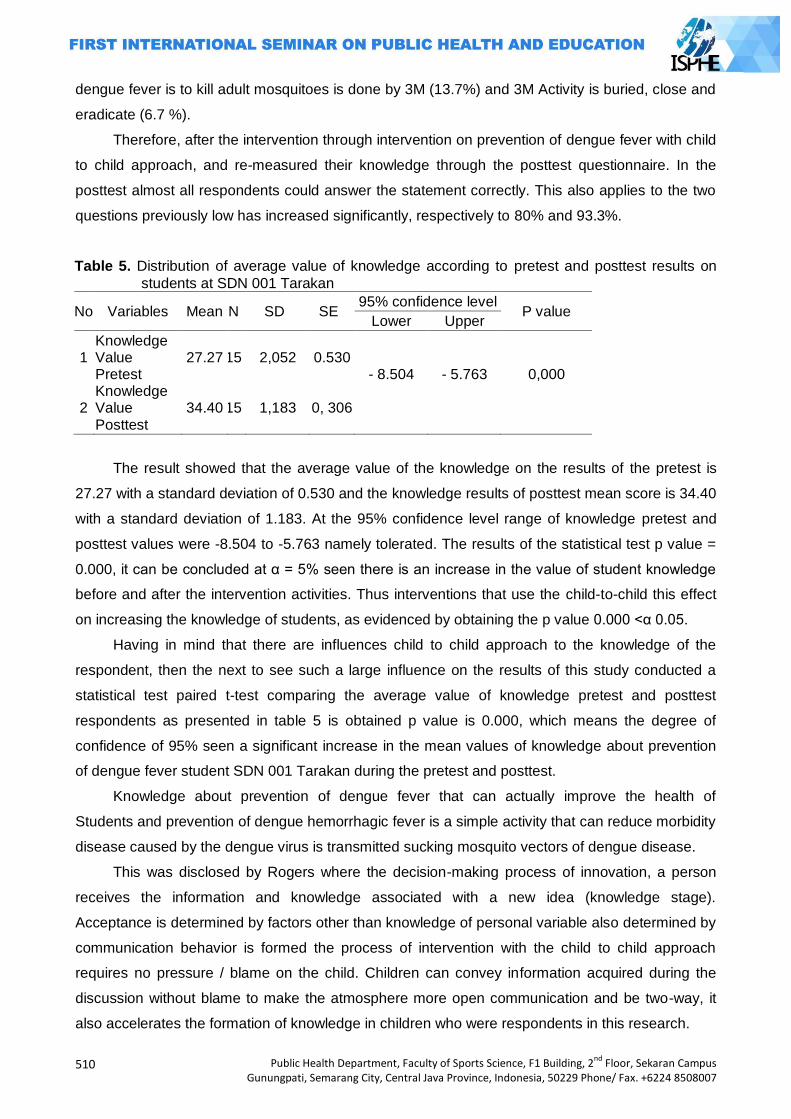
510
Public Health Department, Faculty of Sports Science, F1 Building, 2nd
Floor, Sekaran Campus Gunungpati, Semarang City, Central Java Province, Indonesia, 50229 Phone/ Fax. +6224 8508007
dengue fever is to kill adult mosquitoes is done by 3M (13.7%) and 3M Activity is buried, close and
eradicate (6.7 %).
Therefore, after the intervention through intervention on prevention of dengue fever with child
to child approach, and re-measured their knowledge through the posttest questionnaire. In the
posttest almost all respondents could answer the statement correctly. This also applies to the two
questions previously low has increased significantly, respectively to 80% and 93.3%.
Table 5. Distribution of average value of knowledge according to pretest and posttest results on
students at SDN 001 Tarakan
No Variables Mean N SD SE 95% confidence level
P value Lower Upper
1 2
Knowledge Value Pretest Knowledge Value Posttest
27.27
34.40
15
15
2,052
1,183
0.530
0, 306
- 8.504
- 5.763
0,000
The result showed that the average value of the knowledge on the results of the pretest is
27.27 with a standard deviation of 0.530 and the knowledge results of posttest mean score is 34.40
with a standard deviation of 1.183. At the 95% confidence level range of knowledge pretest and
posttest values were -8.504 to -5.763 namely tolerated. The results of the statistical test p value =
0.000, it can be concluded at α = 5% seen there is an increase in the value of student knowledge
before and after the intervention activities. Thus interventions that use the child-to-child this effect
on increasing the knowledge of students, as evidenced by obtaining the p value 0.000 <α 0.05.
Having in mind that there are influences child to child approach to the knowledge of the
respondent, then the next to see such a large influence on the results of this study conducted a
statistical test paired t-test comparing the average value of knowledge pretest and posttest
respondents as presented in table 5 is obtained p value is 0.000, which means the degree of
confidence of 95% seen a significant increase in the mean values of knowledge about prevention
of dengue fever student SDN 001 Tarakan during the pretest and posttest.
Knowledge about prevention of dengue fever that can actually improve the health of
Students and prevention of dengue hemorrhagic fever is a simple activity that can reduce morbidity
disease caused by the dengue virus is transmitted sucking mosquito vectors of dengue disease.
This was disclosed by Rogers where the decision-making process of innovation, a person
receives the information and knowledge associated with a new idea (knowledge stage).
Acceptance is determined by factors other than knowledge of personal variable also determined by
communication behavior is formed the process of intervention with the child to child approach
requires no pressure / blame on the child. Children can convey information acquired during the
discussion without blame to make the atmosphere more open communication and be two-way, it
also accelerates the formation of knowledge in children who were respondents in this research.
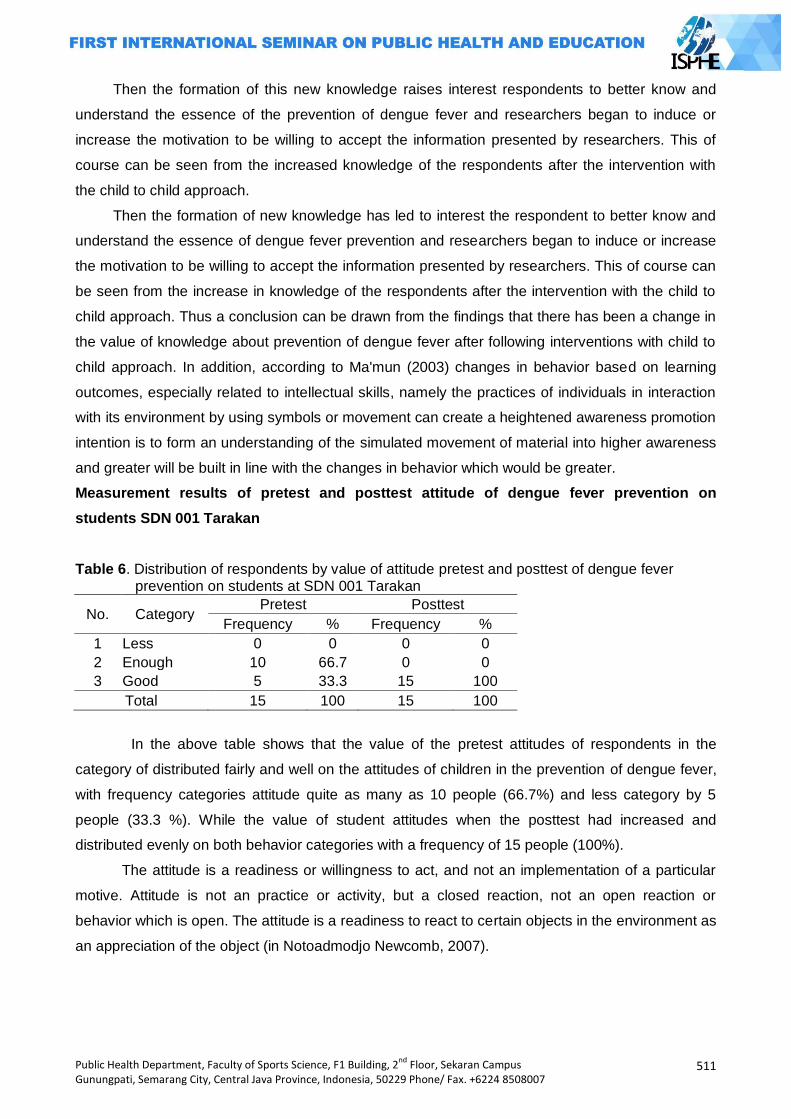
Public Health Department, Faculty of Sports Science, F1 Building, 2nd
Floor, Sekaran Campus Gunungpati, Semarang City, Central Java Province, Indonesia, 50229 Phone/ Fax. +6224 8508007
511
Then the formation of this new knowledge raises interest respondents to better know and
understand the essence of the prevention of dengue fever and researchers began to induce or
increase the motivation to be willing to accept the information presented by researchers. This of
course can be seen from the increased knowledge of the respondents after the intervention with
the child to child approach.
Then the formation of new knowledge has led to interest the respondent to better know and
understand the essence of dengue fever prevention and researchers began to induce or increase
the motivation to be willing to accept the information presented by researchers. This of course can
be seen from the increase in knowledge of the respondents after the intervention with the child to
child approach. Thus a conclusion can be drawn from the findings that there has been a change in
the value of knowledge about prevention of dengue fever after following interventions with child to
child approach. In addition, according to Ma'mun (2003) changes in behavior based on learning
outcomes, especially related to intellectual skills, namely the practices of individuals in interaction
with its environment by using symbols or movement can create a heightened awareness promotion
intention is to form an understanding of the simulated movement of material into higher awareness
and greater will be built in line with the changes in behavior which would be greater.
Measurement results of pretest and posttest attitude of dengue fever prevention on
students SDN 001 Tarakan
Table 6. Distribution of respondents by value of attitude pretest and posttest of dengue fever prevention on students at SDN 001 Tarakan
No. Category Pretest Posttest
Frequency % Frequency %
1 Less 0 0 0 0
2 Enough 10 66.7 0 0
3 Good 5 33.3 15 100
Total 15 100 15 100
In the above table shows that the value of the pretest attitudes of respondents in the
category of distributed fairly and well on the attitudes of children in the prevention of dengue fever,
with frequency categories attitude quite as many as 10 people (66.7%) and less category by 5
people (33.3 %). While the value of student attitudes when the posttest had increased and
distributed evenly on both behavior categories with a frequency of 15 people (100%).
The attitude is a readiness or willingness to act, and not an implementation of a particular
motive. Attitude is not an practice or activity, but a closed reaction, not an open reaction or
behavior which is open. The attitude is a readiness to react to certain objects in the environment as
an appreciation of the object (in Notoadmodjo Newcomb, 2007).
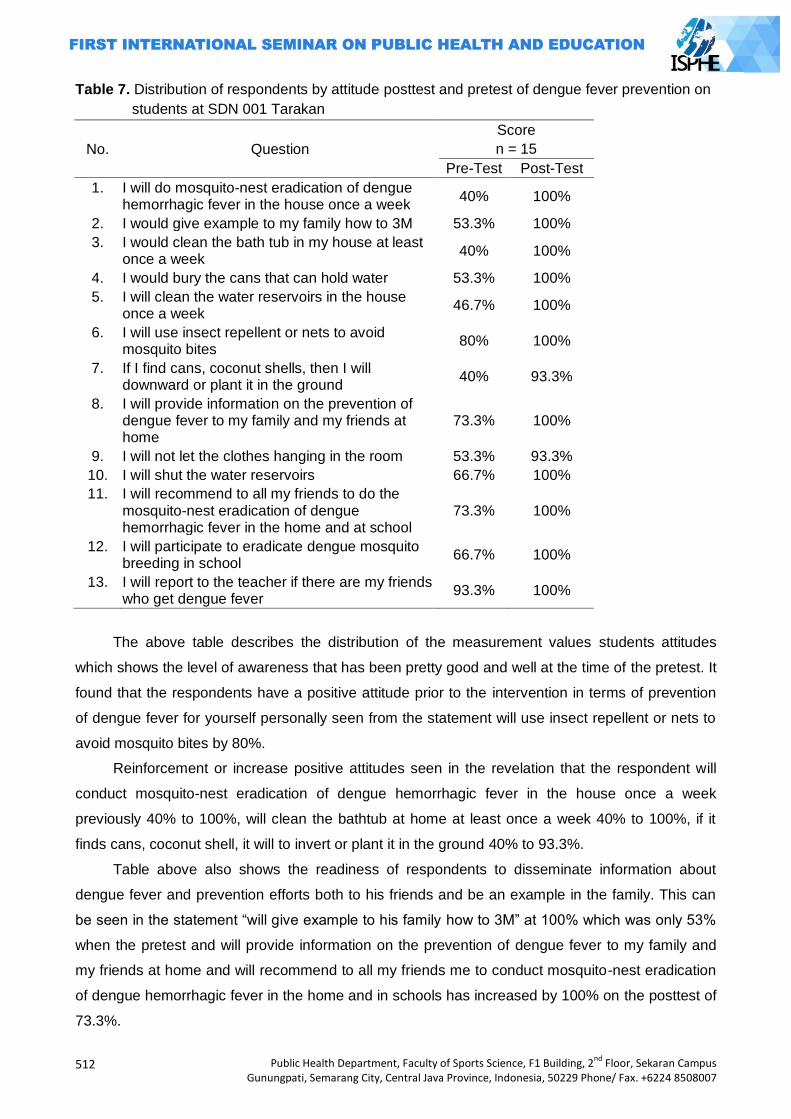
512
Public Health Department, Faculty of Sports Science, F1 Building, 2nd
Floor, Sekaran Campus Gunungpati, Semarang City, Central Java Province, Indonesia, 50229 Phone/ Fax. +6224 8508007
Table 7. Distribution of respondents by attitude posttest and pretest of dengue fever prevention on
students at SDN 001 Tarakan
No. Question
Score
n = 15
Pre-Test Post-Test
1. I will do mosquito-nest eradication of dengue hemorrhagic fever in the house once a week
40% 100%
2. I would give example to my family how to 3M 53.3% 100%
3. I would clean the bath tub in my house at least once a week
40% 100%
4. I would bury the cans that can hold water 53.3% 100%
5. I will clean the water reservoirs in the house once a week
46.7% 100%
6. I will use insect repellent or nets to avoid mosquito bites
80% 100%
7. If I find cans, coconut shells, then I will downward or plant it in the ground
40% 93.3%
8. I will provide information on the prevention of dengue fever to my family and my friends at home
73.3% 100%
9. I will not let the clothes hanging in the room 53.3% 93.3%
10. I will shut the water reservoirs 66.7% 100%
11. I will recommend to all my friends to do the mosquito-nest eradication of dengue hemorrhagic fever in the home and at school
73.3% 100%
12. I will participate to eradicate dengue mosquito breeding in school
66.7% 100%
13. I will report to the teacher if there are my friends who get dengue fever
93.3% 100%
The above table describes the distribution of the measurement values students attitudes
which shows the level of awareness that has been pretty good and well at the time of the pretest. It
found that the respondents have a positive attitude prior to the intervention in terms of prevention
of dengue fever for yourself personally seen from the statement will use insect repellent or nets to
avoid mosquito bites by 80%.
Reinforcement or increase positive attitudes seen in the revelation that the respondent will
conduct mosquito-nest eradication of dengue hemorrhagic fever in the house once a week
previously 40% to 100%, will clean the bathtub at home at least once a week 40% to 100%, if it
finds cans, coconut shell, it will to invert or plant it in the ground 40% to 93.3%.
Table above also shows the readiness of respondents to disseminate information about
dengue fever and prevention efforts both to his friends and be an example in the family. This can
be seen in the statement ―will give example to his family how to 3M‖ at 100% which was only 53%
when the pretest and will provide information on the prevention of dengue fever to my family and
my friends at home and will recommend to all my friends me to conduct mosquito-nest eradication
of dengue hemorrhagic fever in the home and in schools has increased by 100% on the posttest of
73.3%.
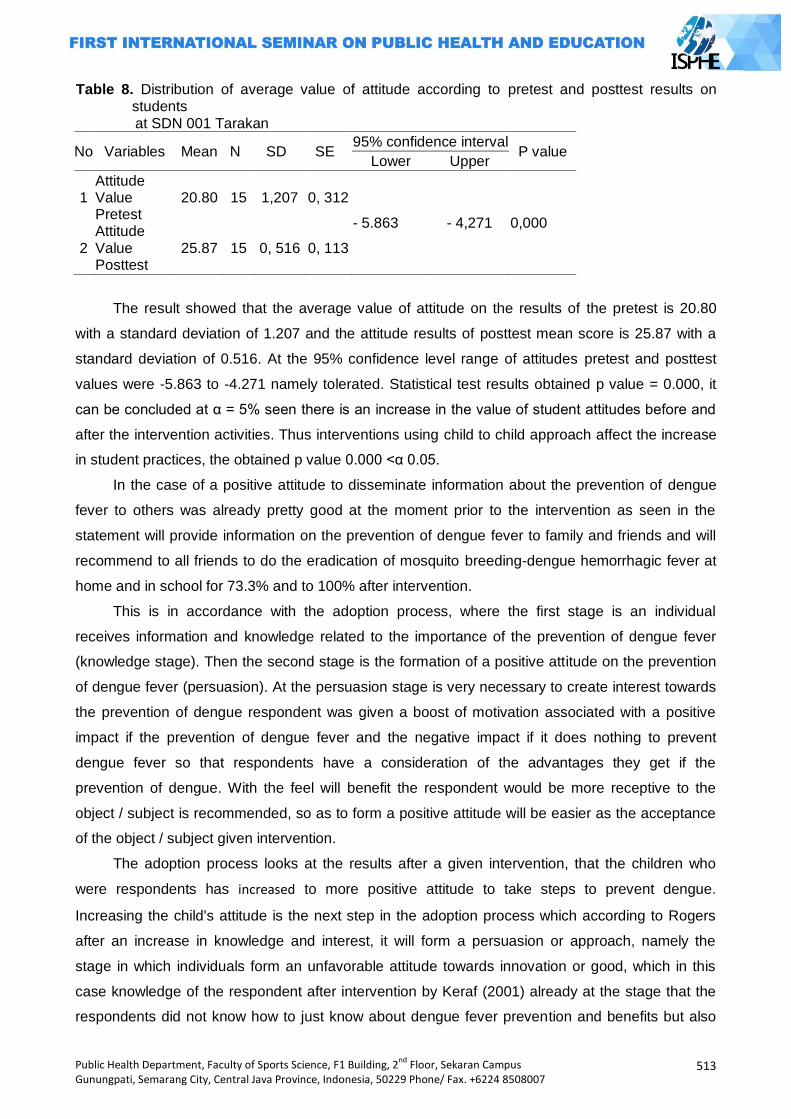
Public Health Department, Faculty of Sports Science, F1 Building, 2nd
Floor, Sekaran Campus Gunungpati, Semarang City, Central Java Province, Indonesia, 50229 Phone/ Fax. +6224 8508007
513
Table 8. Distribution of average value of attitude according to pretest and posttest results on students
at SDN 001 Tarakan
No Variables Mean N SD SE 95% confidence interval
P value Lower Upper
1 2
Attitude Value Pretest Attitude Value Posttest
20.80
25.87
15
15
1,207
0, 516
0, 312
0, 113
- 5.863 - 4,271 0,000
The result showed that the average value of attitude on the results of the pretest is 20.80
with a standard deviation of 1.207 and the attitude results of posttest mean score is 25.87 with a
standard deviation of 0.516. At the 95% confidence level range of attitudes pretest and posttest
values were -5.863 to -4.271 namely tolerated. Statistical test results obtained p value = 0.000, it
can be concluded at α = 5% seen there is an increase in the value of student attitudes before and
after the intervention activities. Thus interventions using child to child approach affect the increase
in student practices, the obtained p value 0.000 <α 0.05.
In the case of a positive attitude to disseminate information about the prevention of dengue
fever to others was already pretty good at the moment prior to the intervention as seen in the
statement will provide information on the prevention of dengue fever to family and friends and will
recommend to all friends to do the eradication of mosquito breeding-dengue hemorrhagic fever at
home and in school for 73.3% and to 100% after intervention.
This is in accordance with the adoption process, where the first stage is an individual
receives information and knowledge related to the importance of the prevention of dengue fever
(knowledge stage). Then the second stage is the formation of a positive attitude on the prevention
of dengue fever (persuasion). At the persuasion stage is very necessary to create interest towards
the prevention of dengue respondent was given a boost of motivation associated with a positive
impact if the prevention of dengue fever and the negative impact if it does nothing to prevent
dengue fever so that respondents have a consideration of the advantages they get if the
prevention of dengue. With the feel will benefit the respondent would be more receptive to the
object / subject is recommended, so as to form a positive attitude will be easier as the acceptance
of the object / subject given intervention.
The adoption process looks at the results after a given intervention, that the children who
were respondents has increased to more positive attitude to take steps to prevent dengue.
Increasing the child's attitude is the next step in the adoption process which according to Rogers
after an increase in knowledge and interest, it will form a persuasion or approach, namely the
stage in which individuals form an unfavorable attitude towards innovation or good, which in this
case knowledge of the respondent after intervention by Keraf (2001) already at the stage that the
respondents did not know how to just know about dengue fever prevention and benefits but also
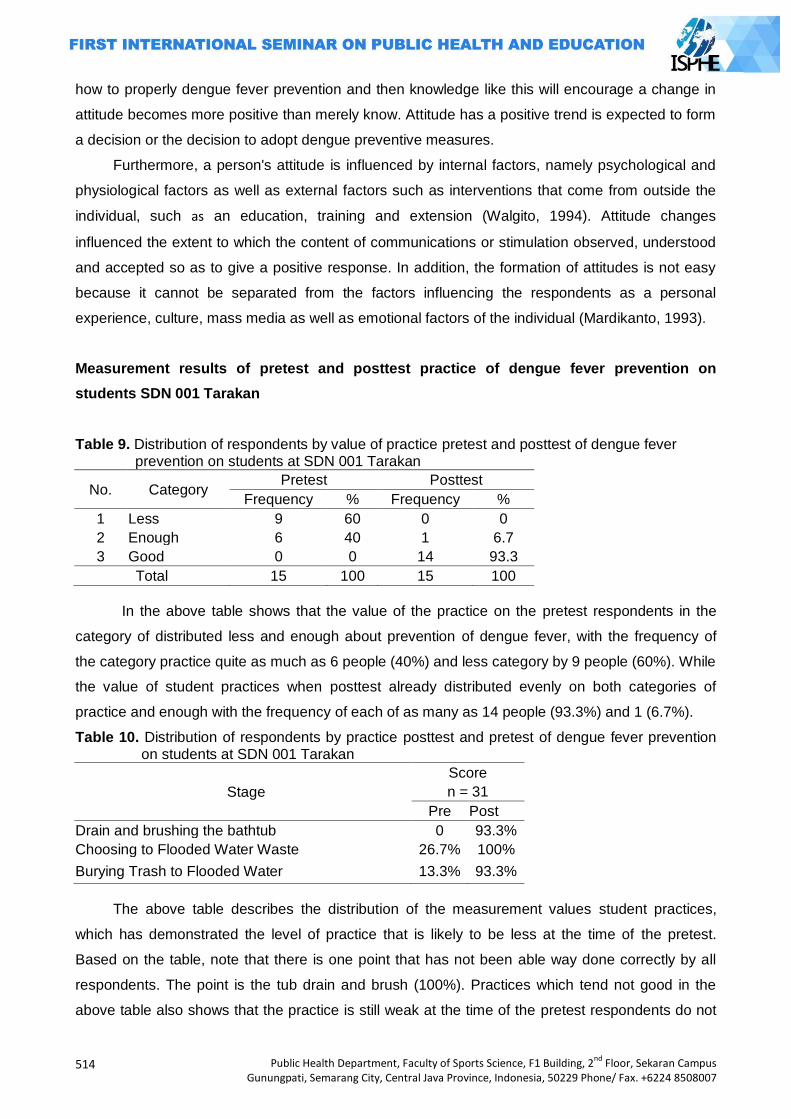
514
Public Health Department, Faculty of Sports Science, F1 Building, 2nd
Floor, Sekaran Campus Gunungpati, Semarang City, Central Java Province, Indonesia, 50229 Phone/ Fax. +6224 8508007
how to properly dengue fever prevention and then knowledge like this will encourage a change in
attitude becomes more positive than merely know. Attitude has a positive trend is expected to form
a decision or the decision to adopt dengue preventive measures.
Furthermore, a person's attitude is influenced by internal factors, namely psychological and
physiological factors as well as external factors such as interventions that come from outside the
individual, such as an education, training and extension (Walgito, 1994). Attitude changes
influenced the extent to which the content of communications or stimulation observed, understood
and accepted so as to give a positive response. In addition, the formation of attitudes is not easy
because it cannot be separated from the factors influencing the respondents as a personal
experience, culture, mass media as well as emotional factors of the individual (Mardikanto, 1993).
Measurement results of pretest and posttest practice of dengue fever prevention on
students SDN 001 Tarakan
Table 9. Distribution of respondents by value of practice pretest and posttest of dengue fever prevention on students at SDN 001 Tarakan
No. Category Pretest Posttest
Frequency % Frequency %
1 Less 9 60 0 0
2 Enough 6 40 1 6.7
3 Good 0 0 14 93.3
Total 15 100 15 100
In the above table shows that the value of the practice on the pretest respondents in the
category of distributed less and enough about prevention of dengue fever, with the frequency of
the category practice quite as much as 6 people (40%) and less category by 9 people (60%). While
the value of student practices when posttest already distributed evenly on both categories of
practice and enough with the frequency of each of as many as 14 people (93.3%) and 1 (6.7%).
Table 10. Distribution of respondents by practice posttest and pretest of dengue fever prevention on students at SDN 001 Tarakan
Stage
Score
n = 31
Pre Post
Drain and brushing the bathtub 0 93.3%
Choosing to Flooded Water Waste 26.7% 100%
Burying Trash to Flooded Water 13.3% 93.3%
The above table describes the distribution of the measurement values student practices,
which has demonstrated the level of practice that is likely to be less at the time of the pretest.
Based on the table, note that there is one point that has not been able way done correctly by all
respondents. The point is the tub drain and brush (100%). Practices which tend not good in the
above table also shows that the practice is still weak at the time of the pretest respondents do not
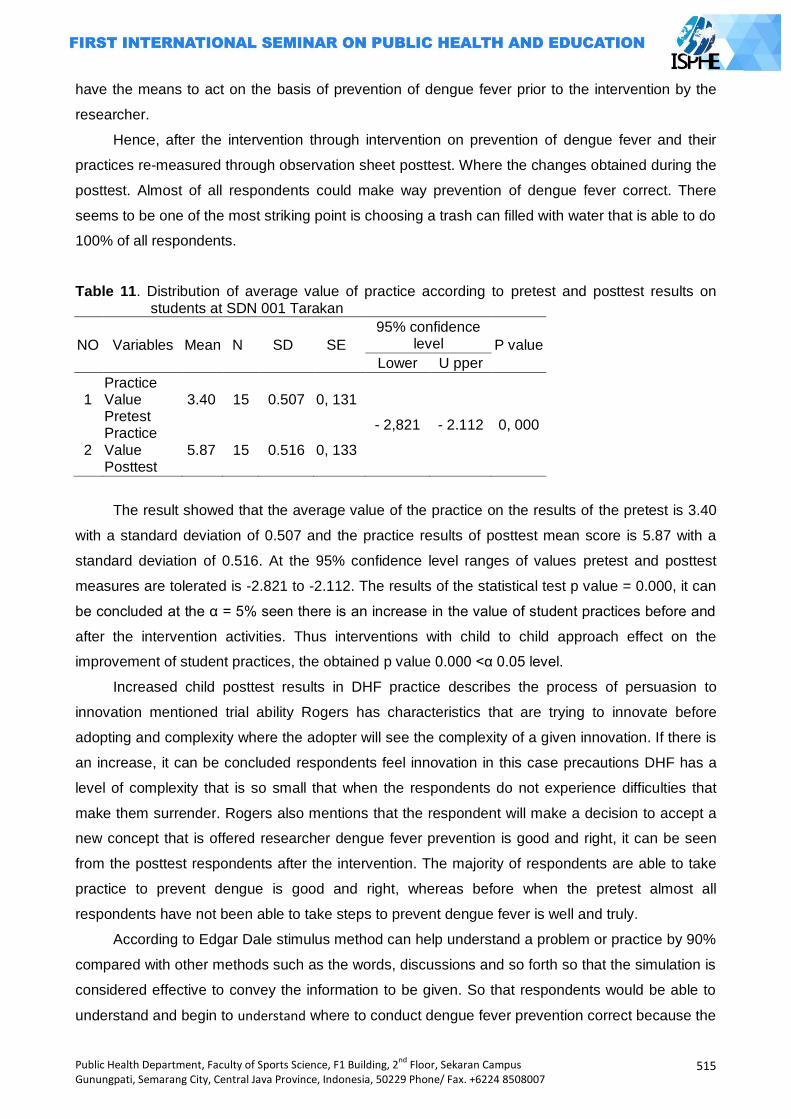
Public Health Department, Faculty of Sports Science, F1 Building, 2nd
Floor, Sekaran Campus Gunungpati, Semarang City, Central Java Province, Indonesia, 50229 Phone/ Fax. +6224 8508007
515
have the means to act on the basis of prevention of dengue fever prior to the intervention by the
researcher.
Hence, after the intervention through intervention on prevention of dengue fever and their
practices re-measured through observation sheet posttest. Where the changes obtained during the
posttest. Almost of all respondents could make way prevention of dengue fever correct. There
seems to be one of the most striking point is choosing a trash can filled with water that is able to do
100% of all respondents.
Table 11. Distribution of average value of practice according to pretest and posttest results on students at SDN 001 Tarakan
NO Variables Mean N SD SE
95% confidence level P value
Lower U pper
1
2
Practice Value Pretest Practice Value Posttest
3.40
5.87
15
15
0.507
0.516
0, 131
0, 133
- 2,821 - 2.112 0, 000
The result showed that the average value of the practice on the results of the pretest is 3.40
with a standard deviation of 0.507 and the practice results of posttest mean score is 5.87 with a
standard deviation of 0.516. At the 95% confidence level ranges of values pretest and posttest
measures are tolerated is -2.821 to -2.112. The results of the statistical test p value = 0.000, it can
be concluded at the α = 5% seen there is an increase in the value of student practices before and
after the intervention activities. Thus interventions with child to child approach effect on the
improvement of student practices, the obtained p value 0.000 <α 0.05 level.
Increased child posttest results in DHF practice describes the process of persuasion to
innovation mentioned trial ability Rogers has characteristics that are trying to innovate before
adopting and complexity where the adopter will see the complexity of a given innovation. If there is
an increase, it can be concluded respondents feel innovation in this case precautions DHF has a
level of complexity that is so small that when the respondents do not experience difficulties that
make them surrender. Rogers also mentions that the respondent will make a decision to accept a
new concept that is offered researcher dengue fever prevention is good and right, it can be seen
from the posttest respondents after the intervention. The majority of respondents are able to take
practice to prevent dengue is good and right, whereas before when the pretest almost all
respondents have not been able to take steps to prevent dengue fever is well and truly.
According to Edgar Dale stimulus method can help understand a problem or practice by 90%
compared with other methods such as the words, discussions and so forth so that the simulation is
considered effective to convey the information to be given. So that respondents would be able to
understand and begin to understand where to conduct dengue fever prevention correct because the
516
Public Health Department, Faculty of Sports Science, F1 Building, 2nd
Floor, Sekaran Campus Gunungpati, Semarang City, Central Java Province, Indonesia, 50229 Phone/ Fax. +6224 8508007
direct role and carry out the process of identification, evaluation and determine a plan of practice in
accordance with the correct phase. Respondents were very enthusiastic about their work because
they feel like a professional officer to pass judgment on their environment.
Characteristics of children who do not like themselves to activities that require gross also be
constraints on this study, it was found that 1 child with no right answer to the question of 3M
activities is buried, close and take a commission; drain the tub is done by removing the water and
brushed once a week; and abate powder given to shelters easily drained the reason the child does
not want told to practice when the correct answer, it is not a point reinforced by the child practice
proper precautions of dengue fever at the time of the posttest (observation) and bury the bathtub
drain waste disgust which reason it has been established researcher at the sight of the child
statement in section C questionnaire (attitude) that if they find cans or coconut shells will
downward or plant it ground. Another problem found is that some children are not thorough in
answering the questionnaire at the time of the posttest, but according to the researchers of the
respondents have a good understanding of the prevention of dengue fever it is seen from the
explanation the child at the time of the practice stages to do counseling on the prevention of
dengue fever correctly and better.
Circumstances which increase both the knowledge, attitudes and practices the child after the
intervention given above suggests that intervention with child to child approach is very useful for
the improvement of dengue fever prevention practice, as the child to child approaches tendency of
respondents to understand information about the charge easier because respondents were not
only serves as an object which only receive information but also act as subjects who seek
information and conduct an practice plan in accordance with the fact that available in the
environment.
Child to child approach is implemented until child is able to plan and take practice of dengue
fever prevention. Children who had previously given the task to find information about dengue
consulted to determine what the problem was the cause of the occurrence of dengue cases.
Determination of the problem is determined by the child based on the information they hold, after
the problem is determined the child will be assigned to the neighborhood to observe and examine
their school environment to look for the existence of the problems that they have formulated.
Children will re-define the priority issues of the findings that they get during the observation of their
environment. Afterwards the child is required to think creatively plan of practice that they will do to
overcome the problems they found, facilitator guidance is needed at this stage.
Children who responded chose to disseminate information by lecture and create a poster that
contains the information that they understand. According to them the way more easily and have a
high prestige because it would be as a teacher for the children of other classrooms. At this stage
child has been able to demonstrate an active role and are involved in the prevention of dengue
within the school. Individual children become more bold and confident in expressing opinions or
ideas they have presented to many people. Stages of child to child is also indirectly teach children
Public Health Department, Faculty of Sports Science, F1 Building, 2nd
Floor, Sekaran Campus Gunungpati, Semarang City, Central Java Province, Indonesia, 50229 Phone/ Fax. +6224 8508007
517
more actively and critically to solve problems that they find to create a solution based on the
information they are looking for related problems.
Thus children have increased knowledge, attitudes and practices with given intervention with
child to child approach or child process to actively become actors in this intervention so as to
facilitate the reception of information is the goal of researchers. Child to child approach also runs
well on this research has been done seen from the 5th stage of the 6 stages that exist, where the
process of discussing the DHF information and report findings and when the child explain DHF
information to groups of respondents and other friends in different classes shows that the core of
this approach from child to child.
Respondents (children) skill increased both in terms of DHF precautions that are part of the
process of intervention and children's skills in spreading information that is part of the output step
child to child approach is the first step and added value in the decision-making process to adopt.
Where according to Rogers after knowledge and positive attitude towards an innovation then
someone would choose to adopt or not such behavior. And this increase proves that the
respondent has received a new concept offered by researchers. So, school-age children especially
SDN 001 Tarakan can spearhead the repair / improvement of public health, particularly in view of
the Tarakan City problems of increasing number of DHF cases.
Closing
From the results of research and analysis of an increase in knowledge, attitudes and
practices on prevention of dengue fever after a given intervention with the child to child approach
on SDN 001 Tarakan students.
There is increasing knowledge of children in the prevention of dengue fever with a mean
value of 27.27 before and after intervention with a mean value of 34.40 (p value = 0.000). There is
an increase in the children attitude to prevent dengue fever before with a mean value of 20.80 and
after intervention with a mean value of 25.87 (p value = 0.000). There is an increase in children
practices in the prevention of dengue fever before with a mean value of 3.40 and after intervention
with a mean value of 5.87 (p = 0.000).
So, child to child approach can prevent dengue hemorrhagic fever because children can
improve their capability to perform preventive with use this approach.
In improving students knowledge SDN 001 Tarakan especially regarding dengue fever
prevention strategies are needed sustainable health promotion and sustainable to deliver health
information related problems. To coordinate with teachers to arrange students UKS to be optimal in
honing the children skill to spread information and serve as a model for dengue fever prevention
within the school. Coordinated with the mother or parents to monitor children at home in dengue
fever prevention practice. Conduct training and collaboration with UKS to health promotion in
schools. To advocate to the City Health Office or Health Center to provide advanced training in
518
Public Health Department, Faculty of Sports Science, F1 Building, 2nd
Floor, Sekaran Campus Gunungpati, Semarang City, Central Java Province, Indonesia, 50229 Phone/ Fax. +6224 8508007
order to deepen children's knowledge and ability to conduct dengue fever prevention. To advocate
to the Department of Education and Culture to coaching / training the teachers so that the
continuation this approach have adult facilitators who have already understood. There needs to be
a sustainable activity because in this study only to the posttest and the CTC approach is
uninterrupted cycle process in practice but rather to evaluate the child and make improvements
that increase the likelihood of behavior change.
References
Bailey, Donna et al. 1994. Child to Child: A Resource Book Part 1 Implementing the Child to Child Approach. Lodon: of British Library Cataloging
Child to Child Brochure. An International Network Promoting Children's Participation In Health And Development. www.talcuk.org (accessed on March 21, 2012)
Dinas Kesehatan Kota Tarakan. 2012. Data Kasus DHF Per Bulan Kota Tarakan Provinsi Kalimantan Timur Tahun 2001-2012. Tarakan: Dinkes Kota Tarakan.
Gibbs, Sara dkk. 2002. Child to Child: A Practical Guide Empowering Children as Active Citizen. London: www.child-to-child.org (accessed on March 16, 2012)
Http://www.utwente.nl/cw/theorieenoverzicht/ Levels% 20of% 20theories / macros / Diffusion of Innovation% 20of% 20% 20Theory. doc / (accessed on May 3, 2012)
Hurlock, Elizabeth. B. 1999. Psikologi Perkembangan Suatu Pendekatan Sepanjang Rentang Kehidupan (translation). Jakarta: Erlangga.
Keraf, S. 2001. Filsafat Ilmu Pengetahuan. Jogjakarta: Sagung Seto Notoatmodjo, Soekidjo. 2005. Promosi Kesehatan Teori dan Aplikasi. Jakarta: Rineka Cipta. Notoatmodjo, Soekidjo. 2007. Promosi Kesehatan dan Ilmu Perilaku. Jakarta: Rineka Cipta Makmun, Abin Syamsuddin. 2003. Psikologi Pendidikan. Bandung: PT. Rosda Karya Remaja Mardikanto, T. 1993. Penyuluhan Pembangunan Pertanian. Surakarta: Sebelas Maret University
Press Nursing Academy North Borneo. 2011. http://akperkaltara.ac.id/index.php?option=com_content
&view=article&id=56:ada-5-kasus-klb-gelar-fogging-massal-dinkes-programkan-juli&catid=1:latest-news (accessed on March 13, 2012)
Rogers, EM 1995. Key Variables in the Diffusion Model. http://nnlm.gov/archive/pnr/eval/rogers.html (accessed on May 3, 2012)
Rogers, EM. 1997. Diffusion of Innovations Theory, the adoption of new ideas, media, etc. Rogers, Everett M. Diffusions of Innovation 1995 (translation). New York: Tree Press
Walgito, Bimo. 1994. Pengantar Psikologi Umum. Yogyakarta: Andi Offset
Public Health Department, Faculty of Sports Science, F1 Building, 2nd
Floor, Sekaran Campus Gunungpati, Semarang City, Central Java Province, Indonesia, 50229 Phone/ Fax. +6224 8508007
519
ENSURE ENVIRONMENTAL SUSTAINABILITY
AND HEALTH IN PUBLIC DEVELOPMENT
PAPERS

520
Public Health Department, Faculty of Sports Science, F1 Building, 2nd
Floor, Sekaran Campus Gunungpati, Semarang City, Central Java Province, Indonesia, 50229 Phone/ Fax. +6224 8508007
Public Health Department, Faculty of Sports Science, F1 Building, 2nd
Floor, Sekaran Campus Gunungpati, Semarang City, Central Java Province, Indonesia, 50229 Phone/ Fax. +6224 8508007
521
THE RELATIONSHIP OF LIVING CLEAN AND HEALTHY BEHAVIOR IN HOUSEHOLD ORDER WITH OCCURRENCE OF DIARRHEA IN TODDLERS IN LUBUK BUAYA VILLAGE PADANG CITY IN 2012
Masrizal Dt.Mangguang
University of Andalas, Indonesia
Corresponding Author: [email protected]
Abstract Introduction: Diarrheal disease in Indonesia is one of the public health problem, due to the high number of pain and mortality especially in toddlers. From 6 work-area Clinics that located in area of lubuk buaya, Lubuk Buaya village is the highest area that has the diarrhea case in toddlers , i.e. 192 cases (10%) patients with diarrhea. This research aims is to look for the image and relationship of life clean and healthy behavior in household order with occurrence of diarrhea in toddlers in Kelurahan Lubuk Buaya in 2012. Methods: This research uses a cross sectional design research with the total sample as many as 95 mothers taken using multistage random sampling techniques. The Data is done in univariate, multivariate and bivariat use chi-square test and logistic regression test with α=0,05. Results: The results show that case of diarrhea in toddlers is 27.4%, mother's knowledge about
PHBS is high, mother‘s maternal attitude of PHBS is positive, pengggunaan use of clean water, latrines and hand washing using SOAP either. Variables that showed relationship with incidence of diarrhea in toddlers is the use of the toilet (p = 0.046) and hand washing using SOAP (p = 0,019), whereas the use of clean water has no relationship with the occurrence of diarrhea in toddlers (p = 0,290). The predominant factors that influence the incidence of diarrhea in toddlers is hand washing using SOAP. To increase health promotion efforts on clean living and healthy behavior especially hand washing using SOAP needs to be done in order to increase public awareness to change bad habits that cause diarrheal disease. Key Words: Diarrhea, clean living and healthy behavior, household, toddler Introduction
Untill now The diarrheal disease still be a world health problem, especially in developing
countries. The magnitude of the problem can be seen from the high numbers of pain and death
due to diarrhea. WHO estimates 4 million cases in the world occurred in 2000 and 2.2 million of
them died, mostly children under 5 years. This is comparable to 1 child dies every 15 seconds or
20 jumbo jets crashed every day. In Indonesia, diarrhea is still one of the major public health
problem. This is due to the high numbers of pain and still cause many deaths especially in infants
and toddlers, and often give rise to extraordinary events (of the OUTBREAK). Proportionately
diarrhea is more occurred on the toddler (55 %). Deaths from diarrhea in toddlers was 75,3 per
100.00 toddler (Household Health Survey results/SKRT 2004). Based on the results of Health
Research Foundation (Riskesdas) in 2007 that diarrheal disease is the leading cause of death in
infants (31.4%) and toddlers (25.2 %).
Based on the results of a survey of diarrhea morbidity conducted by Ministry of health 3
times a year since 1996-2010, the number of pain diarrhea increased from 1996 to 2006, then
dropped in 2010. In 2010, the number of pain diarrhea 411 of 1,000 inhabitants. This figure is
522
Public Health Department, Faculty of Sports Science, F1 Building, 2nd
Floor, Sekaran Campus Gunungpati, Semarang City, Central Java Province, Indonesia, 50229 Phone/ Fax. +6224 8508007
having a bit of a decrease in 2006 compared to a $ 423 of 1,000 inhabitants. in 2010 the outbreak
also occurred in 11 provinces with a case fatality rate (cfr) 1.74%.
The national prevalence of diarrhea is 9.00% and the prevalence of diarrhea in West
Sumatra Province remained above the national prevalence rate of 9.2%. Problems due to diarrheal
diseases also occur in Padang city, a city in the province of West Sumatra. From 20 clinics in
Padang city, Lubuk Buaya is the public health clinics that has the highest case of diarrhea in
padang. Work-area Clinics District Koto Tangah Padang city consists of 6 village, such as: Lubuk
Buaya village, Batang Kabung Ganting, Pasia Nan Tigo, Bungo Pasang, Parupuk Tabing dan
Tunggul Hitam. From that 6 village there is a high incidence rate village of diarrhea case which is
Lubuk Buaya village (Depkes RI, 2008; Dinkes Provinsi Sumbar, 2001).
Based of the annual report in lubuk buaya clinic the number of incident diarrhea in Lubuk
Buaya village in 2011 as much as 470 cases of diarrhea, or 2.5%, while the number of cases of
diarrhea in toddler's in Lubuk Buaya village as much as 192 cases of diarrhea or 10%. In 2009 the
case of diarrhea in Lubuk Buaya village as much as 321 cases of diarrhea and 172 cases occur in
toddlers. In 2010 the case of diarrhea in Lubuk Buaya village has increased, which is as many as
336 cases of diarrhea and 186 such cases occur in toddlers (Dinkes Provinsi Sumbar, 2001).
Healthy conditions can be achieved by changing the behaviours of unhealthy lifestyles to be
clean and healthy (PHBS) and creating a healthy environment in the household. The parents,
especially the mother had a very strategic role to lower numbers of pain and death due to diarrhea
diseases. This is because in the family, the mother typically instrumental take care of households
included in the activities of the child health care.
According to Blum (1974) suggests that behavior is the dominant factor that affecting the
health of the environment, where after the behavior has always played well in the environment, the
physical environment, social or socio-cultural and then recently supported by the availability of
health facilities that are affordable by the public, and the lattest is the hereditary factors, where the
factor is closely related to genes passed down to the individual (Dinkes Kota Padang, 2011).
Based on 7 indicators of PHBS and 3 indicators of a healthy lifestyle that is associated with
the incidence of diarrhea is hand washing using SOAP, use clean water, and using the toilet.
Based on studies of Sitinjak (2011), there is a relationship between the incidence of diarrhea and
use of clean water, use of latrines and handwashing (Puskesmas Lubuk Buaya, 2011).
From the annual report of the public health clinics in Lubuk Buaya, a household that used
PHBS in Lubuk Buaya village in 2011 is 4.7%. Sanitation inspection results in Lubuk Buaya village
shows that as much as 75% of families who already have access to clean water, it is still below the
target of clinics that is 77,30%. Meanwhile, the number of families that already have a Privy is as
much 87,6% and there is still a 12.38% of households that do not have latrines and the percentage
of households that hand washing using SOAP is 60%
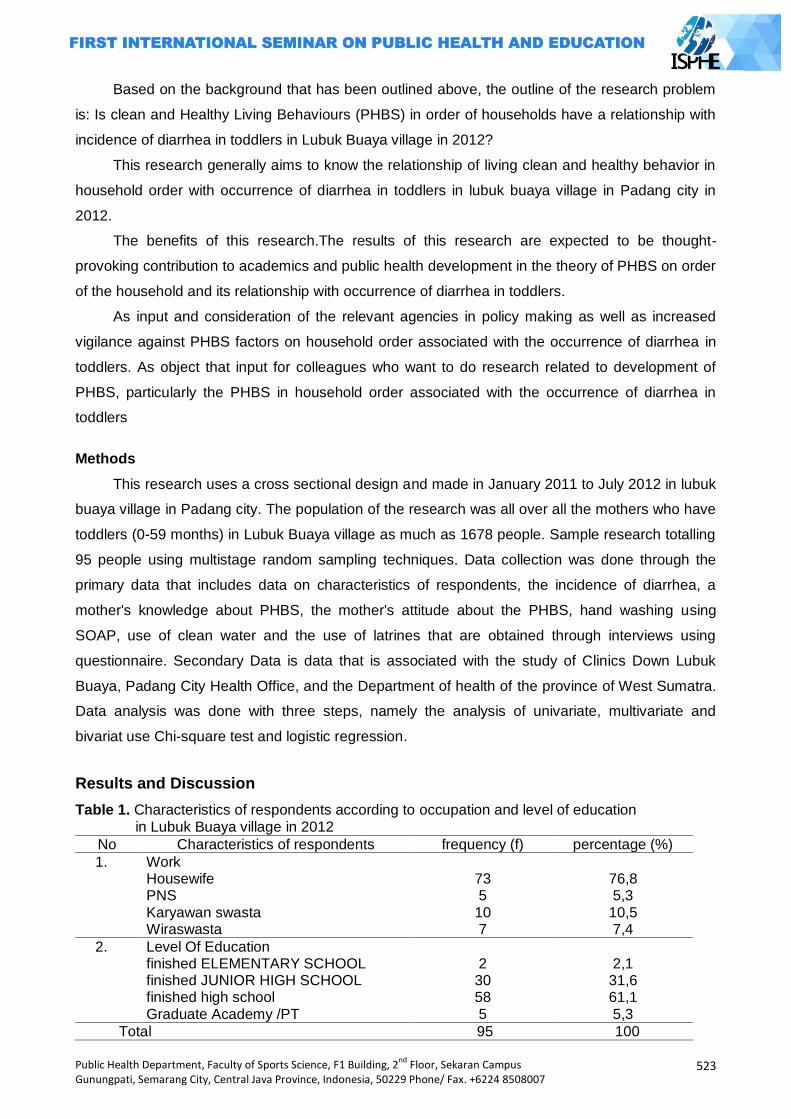
Public Health Department, Faculty of Sports Science, F1 Building, 2nd
Floor, Sekaran Campus Gunungpati, Semarang City, Central Java Province, Indonesia, 50229 Phone/ Fax. +6224 8508007
523
Based on the background that has been outlined above, the outline of the research problem
is: Is clean and Healthy Living Behaviours (PHBS) in order of households have a relationship with
incidence of diarrhea in toddlers in Lubuk Buaya village in 2012?
This research generally aims to know the relationship of living clean and healthy behavior in
household order with occurrence of diarrhea in toddlers in lubuk buaya village in Padang city in
2012.
The benefits of this research.The results of this research are expected to be thought-
provoking contribution to academics and public health development in the theory of PHBS on order
of the household and its relationship with occurrence of diarrhea in toddlers.
As input and consideration of the relevant agencies in policy making as well as increased
vigilance against PHBS factors on household order associated with the occurrence of diarrhea in
toddlers. As object that input for colleagues who want to do research related to development of
PHBS, particularly the PHBS in household order associated with the occurrence of diarrhea in
toddlers
Methods
This research uses a cross sectional design and made in January 2011 to July 2012 in lubuk
buaya village in Padang city. The population of the research was all over all the mothers who have
toddlers (0-59 months) in Lubuk Buaya village as much as 1678 people. Sample research totalling
95 people using multistage random sampling techniques. Data collection was done through the
primary data that includes data on characteristics of respondents, the incidence of diarrhea, a
mother's knowledge about PHBS, the mother's attitude about the PHBS, hand washing using
SOAP, use of clean water and the use of latrines that are obtained through interviews using
questionnaire. Secondary Data is data that is associated with the study of Clinics Down Lubuk
Buaya, Padang City Health Office, and the Department of health of the province of West Sumatra.
Data analysis was done with three steps, namely the analysis of univariate, multivariate and
bivariat use Chi-square test and logistic regression.
Results and Discussion
Table 1. Characteristics of respondents according to occupation and level of education in Lubuk Buaya village in 2012
No Characteristics of respondents frequency (f) percentage (%)
1. Work Housewife PNS Karyawan swasta Wiraswasta
73 5 10 7
76,8 5,3 10,5 7,4
2. Level Of Education finished ELEMENTARY SCHOOL finished JUNIOR HIGH SCHOOL finished high school Graduate Academy /PT
2 30 58 5
2,1 31,6 61,1 5,3
Total 95 100
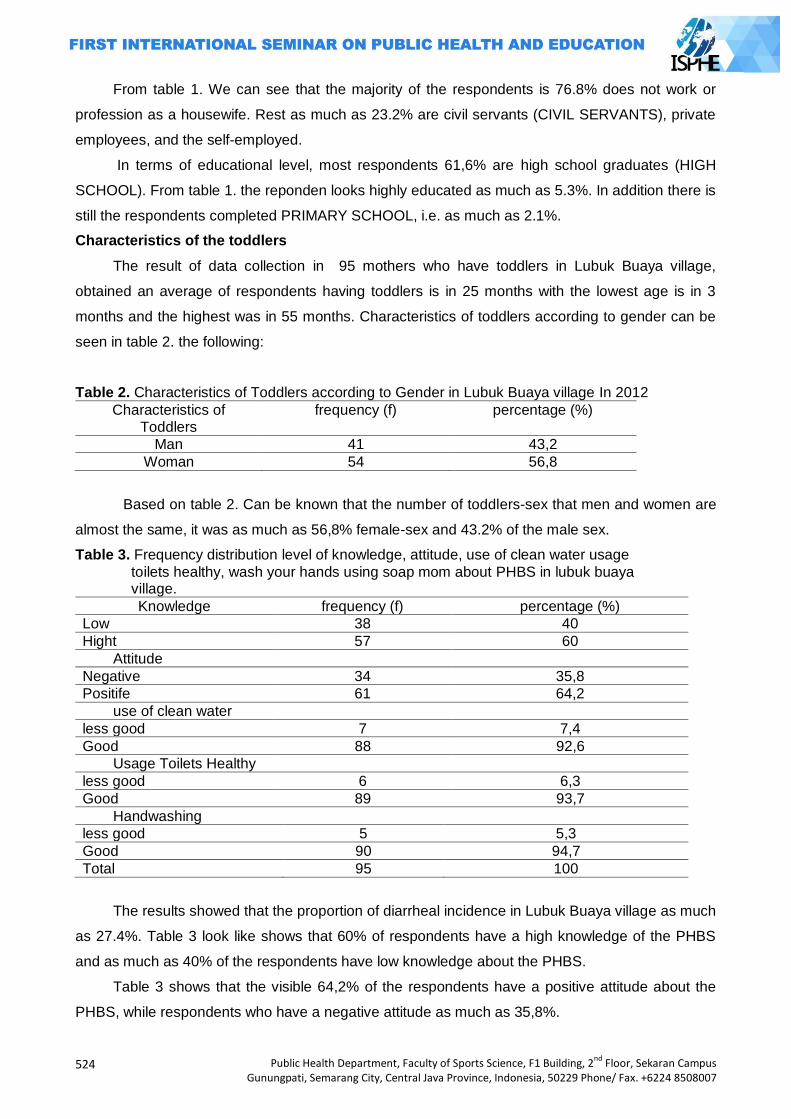
524
Public Health Department, Faculty of Sports Science, F1 Building, 2nd
Floor, Sekaran Campus Gunungpati, Semarang City, Central Java Province, Indonesia, 50229 Phone/ Fax. +6224 8508007
From table 1. We can see that the majority of the respondents is 76.8% does not work or
profession as a housewife. Rest as much as 23.2% are civil servants (CIVIL SERVANTS), private
employees, and the self-employed.
In terms of educational level, most respondents 61,6% are high school graduates (HIGH
SCHOOL). From table 1. the reponden looks highly educated as much as 5.3%. In addition there is
still the respondents completed PRIMARY SCHOOL, i.e. as much as 2.1%.
Characteristics of the toddlers
The result of data collection in 95 mothers who have toddlers in Lubuk Buaya village,
obtained an average of respondents having toddlers is in 25 months with the lowest age is in 3
months and the highest was in 55 months. Characteristics of toddlers according to gender can be
seen in table 2. the following:
Table 2. Characteristics of Toddlers according to Gender in Lubuk Buaya village In 2012
Characteristics of Toddlers
frequency (f) percentage (%)
Man 41 43,2
Woman 54 56,8
Based on table 2. Can be known that the number of toddlers-sex that men and women are
almost the same, it was as much as 56,8% female-sex and 43.2% of the male sex.
Table 3. Frequency distribution level of knowledge, attitude, use of clean water usage
toilets healthy, wash your hands using soap mom about PHBS in lubuk buaya village.
Knowledge frequency (f) percentage (%)
Low 38 40
Hight 57 60
Attitude
Negative 34 35,8
Positife 61 64,2
use of clean water
less good 7 7,4
Good 88 92,6
Usage Toilets Healthy
less good 6 6,3
Good 89 93,7
Handwashing
less good 5 5,3
Good 90 94,7
Total 95 100
The results showed that the proportion of diarrheal incidence in Lubuk Buaya village as much
as 27.4%. Table 3 look like shows that 60% of respondents have a high knowledge of the PHBS
and as much as 40% of the respondents have low knowledge about the PHBS.
Table 3 shows that the visible 64,2% of the respondents have a positive attitude about the
PHBS, while respondents who have a negative attitude as much as 35,8%.
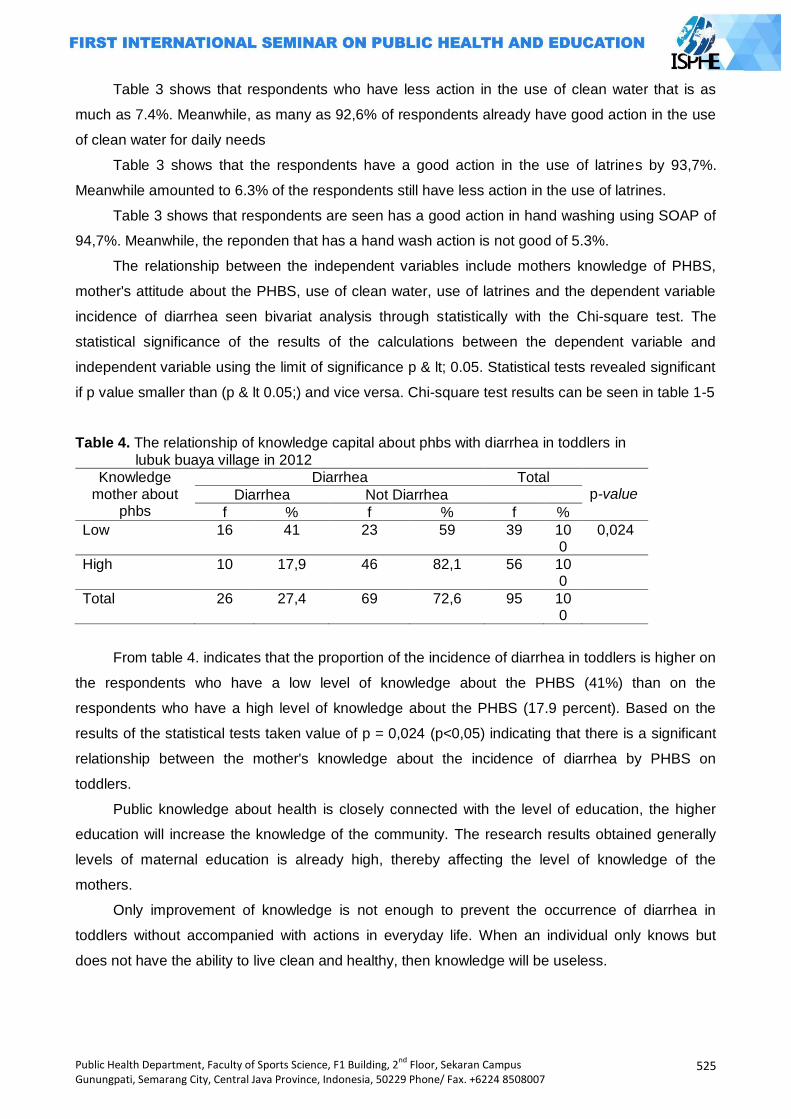
Public Health Department, Faculty of Sports Science, F1 Building, 2nd
Floor, Sekaran Campus Gunungpati, Semarang City, Central Java Province, Indonesia, 50229 Phone/ Fax. +6224 8508007
525
Table 3 shows that respondents who have less action in the use of clean water that is as
much as 7.4%. Meanwhile, as many as 92,6% of respondents already have good action in the use
of clean water for daily needs
Table 3 shows that the respondents have a good action in the use of latrines by 93,7%.
Meanwhile amounted to 6.3% of the respondents still have less action in the use of latrines.
Table 3 shows that respondents are seen has a good action in hand washing using SOAP of
94,7%. Meanwhile, the reponden that has a hand wash action is not good of 5.3%.
The relationship between the independent variables include mothers knowledge of PHBS,
mother's attitude about the PHBS, use of clean water, use of latrines and the dependent variable
incidence of diarrhea seen bivariat analysis through statistically with the Chi-square test. The
statistical significance of the results of the calculations between the dependent variable and
independent variable using the limit of significance p & lt; 0.05. Statistical tests revealed significant
if p value smaller than (p & lt 0.05;) and vice versa. Chi-square test results can be seen in table 1-5
Table 4. The relationship of knowledge capital about phbs with diarrhea in toddlers in
lubuk buaya village in 2012
Knowledge mother about
phbs
Diarrhea Total p-value Diarrhea Not Diarrhea
f % f % f %
Low 16 41 23 59 39 100
0,024
High 10 17,9 46 82,1 56 100
Total 26 27,4 69 72,6 95 100
From table 4. indicates that the proportion of the incidence of diarrhea in toddlers is higher on
the respondents who have a low level of knowledge about the PHBS (41%) than on the
respondents who have a high level of knowledge about the PHBS (17.9 percent). Based on the
results of the statistical tests taken value of p = 0,024 (p<0,05) indicating that there is a significant
relationship between the mother's knowledge about the incidence of diarrhea by PHBS on
toddlers.
Public knowledge about health is closely connected with the level of education, the higher
education will increase the knowledge of the community. The research results obtained generally
levels of maternal education is already high, thereby affecting the level of knowledge of the
mothers.
Only improvement of knowledge is not enough to prevent the occurrence of diarrhea in
toddlers without accompanied with actions in everyday life. When an individual only knows but
does not have the ability to live clean and healthy, then knowledge will be useless.
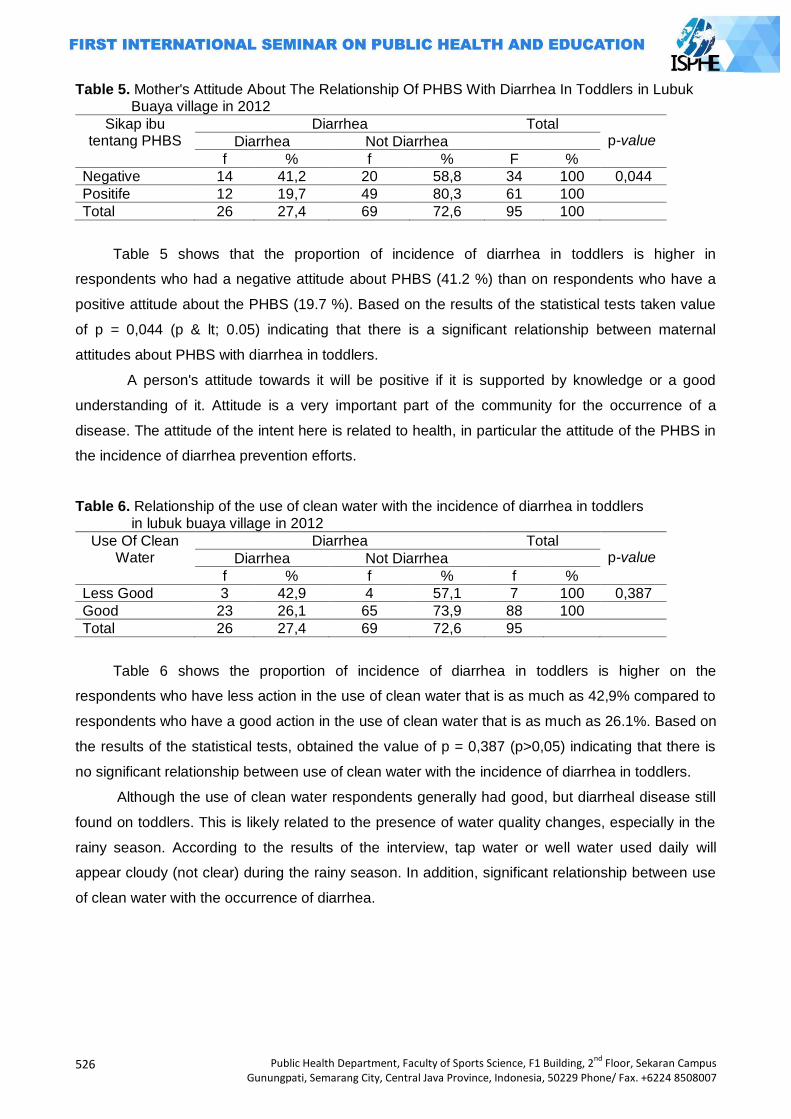
526
Public Health Department, Faculty of Sports Science, F1 Building, 2nd
Floor, Sekaran Campus Gunungpati, Semarang City, Central Java Province, Indonesia, 50229 Phone/ Fax. +6224 8508007
Table 5. Mother's Attitude About The Relationship Of PHBS With Diarrhea In Toddlers in Lubuk Buaya village in 2012
Sikap ibu tentang PHBS
Diarrhea Total p-value Diarrhea Not Diarrhea
f % f % F %
Negative 14 41,2 20 58,8 34 100 0,044
Positife 12 19,7 49 80,3 61 100
Total 26 27,4 69 72,6 95 100
Table 5 shows that the proportion of incidence of diarrhea in toddlers is higher in
respondents who had a negative attitude about PHBS (41.2 %) than on respondents who have a
positive attitude about the PHBS (19.7 %). Based on the results of the statistical tests taken value
of p = 0,044 (p & lt; 0.05) indicating that there is a significant relationship between maternal
attitudes about PHBS with diarrhea in toddlers.
A person's attitude towards it will be positive if it is supported by knowledge or a good
understanding of it. Attitude is a very important part of the community for the occurrence of a
disease. The attitude of the intent here is related to health, in particular the attitude of the PHBS in
the incidence of diarrhea prevention efforts.
Table 6. Relationship of the use of clean water with the incidence of diarrhea in toddlers in lubuk buaya village in 2012
Use Of Clean Water
Diarrhea Total p-value Diarrhea Not Diarrhea
f % f % f %
Less Good 3 42,9 4 57,1 7 100 0,387
Good 23 26,1 65 73,9 88 100
Total 26 27,4 69 72,6 95
Table 6 shows the proportion of incidence of diarrhea in toddlers is higher on the
respondents who have less action in the use of clean water that is as much as 42,9% compared to
respondents who have a good action in the use of clean water that is as much as 26.1%. Based on
the results of the statistical tests, obtained the value of p = 0,387 (p>0,05) indicating that there is
no significant relationship between use of clean water with the incidence of diarrhea in toddlers.
Although the use of clean water respondents generally had good, but diarrheal disease still
found on toddlers. This is likely related to the presence of water quality changes, especially in the
rainy season. According to the results of the interview, tap water or well water used daily will
appear cloudy (not clear) during the rainy season. In addition, significant relationship between use
of clean water with the occurrence of diarrhea.
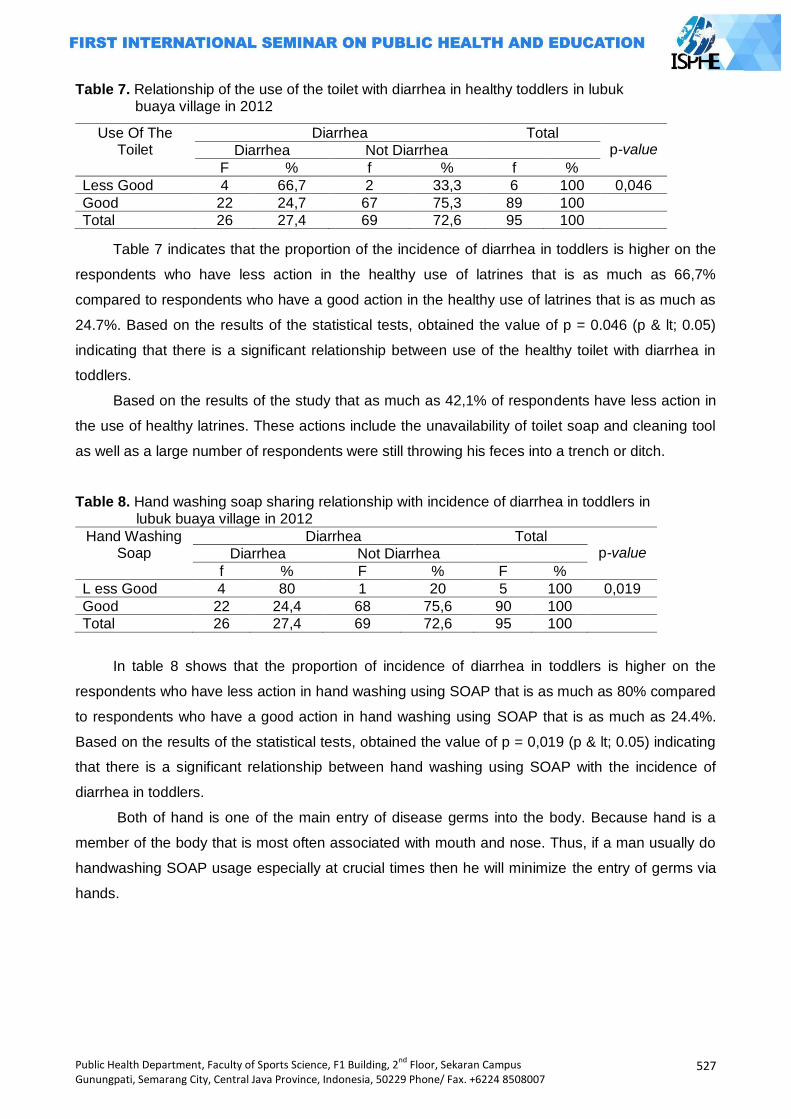
Public Health Department, Faculty of Sports Science, F1 Building, 2nd
Floor, Sekaran Campus Gunungpati, Semarang City, Central Java Province, Indonesia, 50229 Phone/ Fax. +6224 8508007
527
Table 7. Relationship of the use of the toilet with diarrhea in healthy toddlers in lubuk buaya village in 2012
Table 7 indicates that the proportion of the incidence of diarrhea in toddlers is higher on the
respondents who have less action in the healthy use of latrines that is as much as 66,7%
compared to respondents who have a good action in the healthy use of latrines that is as much as
24.7%. Based on the results of the statistical tests, obtained the value of p = 0.046 (p & lt; 0.05)
indicating that there is a significant relationship between use of the healthy toilet with diarrhea in
toddlers.
Based on the results of the study that as much as 42,1% of respondents have less action in
the use of healthy latrines. These actions include the unavailability of toilet soap and cleaning tool
as well as a large number of respondents were still throwing his feces into a trench or ditch.
Table 8. Hand washing soap sharing relationship with incidence of diarrhea in toddlers in lubuk buaya village in 2012
Hand Washing Soap
Diarrhea Total p-value Diarrhea Not Diarrhea
f % F % F %
L ess Good 4 80 1 20 5 100 0,019
Good 22 24,4 68 75,6 90 100
Total 26 27,4 69 72,6 95 100
In table 8 shows that the proportion of incidence of diarrhea in toddlers is higher on the
respondents who have less action in hand washing using SOAP that is as much as 80% compared
to respondents who have a good action in hand washing using SOAP that is as much as 24.4%.
Based on the results of the statistical tests, obtained the value of p = 0,019 (p & lt; 0.05) indicating
that there is a significant relationship between hand washing using SOAP with the incidence of
diarrhea in toddlers.
Both of hand is one of the main entry of disease germs into the body. Because hand is a
member of the body that is most often associated with mouth and nose. Thus, if a man usually do
handwashing SOAP usage especially at crucial times then he will minimize the entry of germs via
hands.
Use Of The Toilet
Diarrhea Total p-value Diarrhea Not Diarrhea
F % f % f %
Less Good 4 66,7 2 33,3 6 100 0,046
Good 22 24,7 67 75,3 89 100
Total 26 27,4 69 72,6 95 100
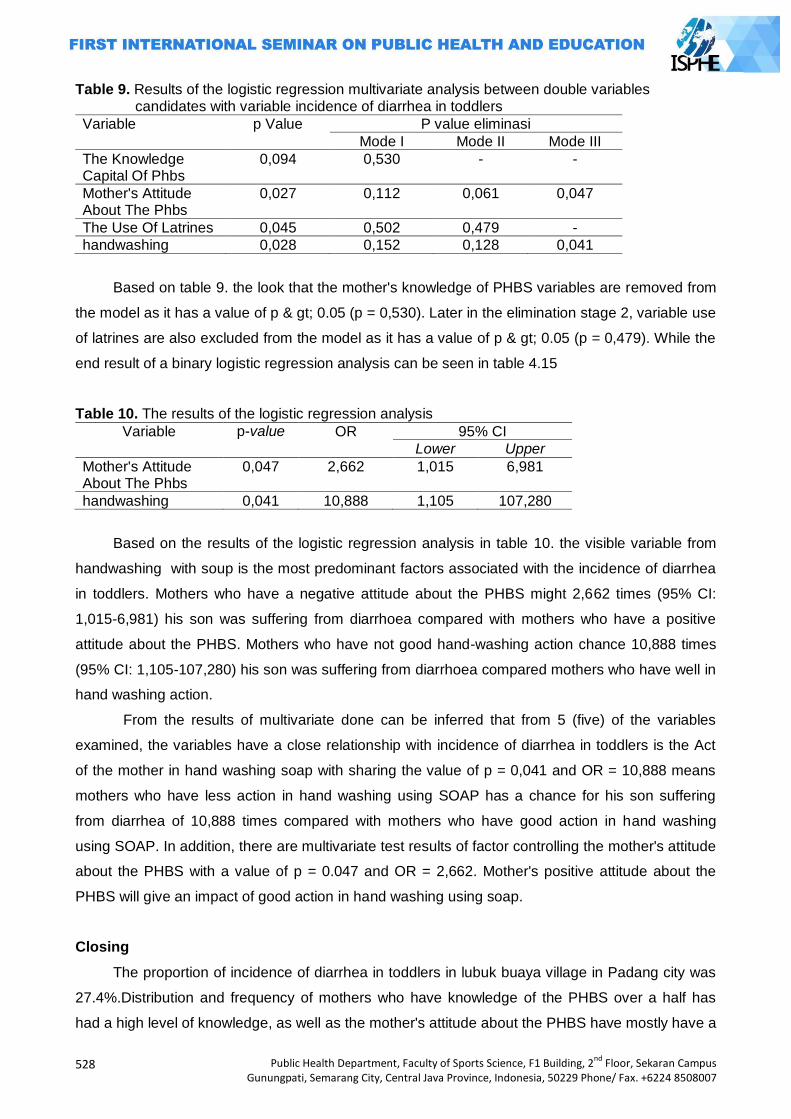
528
Public Health Department, Faculty of Sports Science, F1 Building, 2nd
Floor, Sekaran Campus Gunungpati, Semarang City, Central Java Province, Indonesia, 50229 Phone/ Fax. +6224 8508007
Table 9. Results of the logistic regression multivariate analysis between double variables candidates with variable incidence of diarrhea in toddlers
Variable p Value P value eliminasi
Mode I Mode II Mode III
The Knowledge Capital Of Phbs
0,094 0,530 - -
Mother's Attitude About The Phbs
0,027 0,112 0,061 0,047
The Use Of Latrines 0,045 0,502 0,479 -
handwashing 0,028 0,152 0,128 0,041
Based on table 9. the look that the mother's knowledge of PHBS variables are removed from
the model as it has a value of p & gt; 0.05 (p = 0,530). Later in the elimination stage 2, variable use
of latrines are also excluded from the model as it has a value of p & gt; 0.05 (p = 0,479). While the
end result of a binary logistic regression analysis can be seen in table 4.15
Table 10. The results of the logistic regression analysis
Variable p-value OR 95% CI
Lower Upper
Mother's Attitude About The Phbs
0,047 2,662 1,015 6,981
handwashing 0,041 10,888 1,105 107,280
Based on the results of the logistic regression analysis in table 10. the visible variable from
handwashing with soup is the most predominant factors associated with the incidence of diarrhea
in toddlers. Mothers who have a negative attitude about the PHBS might 2,662 times (95% CI:
1,015-6,981) his son was suffering from diarrhoea compared with mothers who have a positive
attitude about the PHBS. Mothers who have not good hand-washing action chance 10,888 times
(95% CI: 1,105-107,280) his son was suffering from diarrhoea compared mothers who have well in
hand washing action.
From the results of multivariate done can be inferred that from 5 (five) of the variables
examined, the variables have a close relationship with incidence of diarrhea in toddlers is the Act
of the mother in hand washing soap with sharing the value of p = 0,041 and OR = 10,888 means
mothers who have less action in hand washing using SOAP has a chance for his son suffering
from diarrhea of 10,888 times compared with mothers who have good action in hand washing
using SOAP. In addition, there are multivariate test results of factor controlling the mother's attitude
about the PHBS with a value of p = 0.047 and OR = 2,662. Mother's positive attitude about the
PHBS will give an impact of good action in hand washing using soap.
Closing
The proportion of incidence of diarrhea in toddlers in lubuk buaya village in Padang city was
27.4%.Distribution and frequency of mothers who have knowledge of the PHBS over a half has
had a high level of knowledge, as well as the mother's attitude about the PHBS have mostly have a
Public Health Department, Faculty of Sports Science, F1 Building, 2nd
Floor, Sekaran Campus Gunungpati, Semarang City, Central Java Province, Indonesia, 50229 Phone/ Fax. +6224 8508007
529
positive attitude. While the distribution and frequency of actions of the mother in the use of clean
water, use of latrines and handwashing are generally the mother has had good action in the use of
clean water, use of latrines, and wash your hands using SOAP.
The variables that are associated with the incidence of diarrhea is the knowledge capital of
PHBS, mother's attitude about PHBS, mothers action in use of healthy latrines and mother action
of hand washing using SOAP. While the use of clean water action in not related to the incidence of
diarrhea.
The most dominant factors affecting the incidence of diarrhea is hand washing using SOAP
while the mother's attitude about PHBS is the factors controlling which means if the mother has a
positive attitude about the PHBS, then the mother may have a good action in hand washing using
SOAP.
Relevant agencies, relevancy for health promotion efforts such as the extension of more
intensive PHBS to society especially mothers who have toddlers about the importance of hand
washing using SOAP, especially before eating and after food touches/defecate to avoid the
incidence of diarrhea in toddlers. Giving free SOAP to society can also be made so that
promotional efforts can run more effectively to bring behavior change.Provide assistance to the
provision of public toilets do not have latrines.The clinics need held a cross-cutting cooperation
with religious figures and community leaders. Thus outreach is not limited to organized at
posyandu, but can also be done in the activities of religious instruction, lectures, activities of the
PKK or other gatherings.
Community, is expected to especially mothers who have babies in order to change the habits
of life of the less healthy ones can cause diarrheal disease in toddlers. One with a hand wash
using SOAP getting used especially before eating/meal preparation.
Other researchers, for further research with the same problem, it is expected that further
deepens the research coverage because each free variable in this study developed again into
more specific variables. In addition, qualitative research designs can be used to knowthe other
factors that related to the incidence of diarrhea.
References
Adisasmito, Wiku. Faktor Resiko Diare pada Bayi dan Balita di Indonesia. Makara Kesehatan Juni 2007 vol. 11 no. 1 dari www. journal.ui.ac.id.[21 Maret 2012]
Direktorat Jenderal PP dan PL. Buku Pedoman Pengendalian Penyakit Diare. Jakarta: Departemen Kesehatan RI; 2011
Badan Penelitian dan Pengembangan Kesehatan. Survei Kesehatan Rumah Tangga tahun 2004. Jakarta: Departemen Kesehatan RI; 2005
Badan Penelitian dan Pengembangan Kesehatan. Laporan Hasil Riset Kesehatan Dasar (Riskesdas) Indonesia Tahun 2007. Jakarta: Departemen Kesehatan RI; 2008
Departemen Kesehatan RI. Profil Pengendalian Penyakit dan Penyehatan Lingkungan Tahun 2009. Jakarta: Kementrian Kesehatan RI; 2010
Dinas Kesehatan Provinsi Sumatera Barat. Laporan Tahunan 2010. Padang: Dinas Kesehatan Provinsi; 2011
530
Public Health Department, Faculty of Sports Science, F1 Building, 2nd
Floor, Sekaran Campus Gunungpati, Semarang City, Central Java Province, Indonesia, 50229 Phone/ Fax. +6224 8508007
_________. Laporan tahunan dinas kesehatan kota padang tahun 2011. Padang: Dinas Kesehatan Kota Padang; 2011
_________. Laporan Tahunan Puskesmas Lubuk Buaya. Padang: Puskesmas Lubuk Buaya; 2011 Notoadmodjo. Kesehatan Masyarakat Ilmu dan Seni. Jakarta: Rineka Cipta; 2007 Sitinjak LH. Hubungan Perilaku Hidup Bersih Dan Sehat Dengan Kejadian Diare Di Desa Pardede
Onan Kecamatan Balige Tahun 2011. Medan. Fakultas Kesehatan Masyarakat Universitas Sumatera Utara; 2011 [online]. http://repository.usu.ac.id/. [ 25 maret 2012]
________. Panduan Penyelenggaraan Hari Cuci Tangan Pakai Sabun Sedunia, Jakarta; 2009

ISBN 978-602-71138-0-0
BOOK 2

ii
iii
PUBLIC HEALTH DEPARTMENT FACULTY OF SPORTS SCIENCE
SEMARANG STATE UNIVERSITY
BOOK 2
iv
FIRST INTERNATIONAL SEMINAR ON PUBLIC HEALTH AND EDUCATION (ISPHE)
PROCEEDINGS
Public Health Department, Semarang State University
Published by:
Public Health Department
Faculty of Sports Science
F1 Building, 2nd
Floor, Sekaran Campus, Gunungpati
Semarang City, Central Java Province, 50229
Email : [email protected]; [email protected]; [email protected]
Telp. +6224 8508107, Fax. +6224 8508007
This publication is in copyright. Subject to statutory expection and to the provisions of relevant collective
licensing agreements, no reproduction of any part may take place without the written permission of the
Public Health Department, Semarang State University.
First published in September 2014
Editor : Oktia Woro K.H., Tandiyo Rahayu, Soegiyanto K.S., Mungin Edy Wibowo, Doune
MacDonald, Songpol Tornee, Maria Consorcia LIM Quizon
Manuscript Team : Dina Nur A.N., Chatila Maharani, Muhammad Azinar, Lukman Fauzi
Layout : Efa Nugroho
Cover design : Muhammad Iqbal
Library cataloguing in Publication Data:
First International Seminar on Public Health and Education (ISPHE) Proceedings published by the Public
Health Department, Semarang State University – includes bibliographical references.
Series ISBN 978-602-71138-0-0
Distributed by:
Public Health Department, Semarang State University
F1 Building, 2nd
Floor, Sekaran Campus, Gunungpati
Semarang City, Central Java Province, 50229
Email : [email protected]; [email protected]; [email protected]
Telp. +6224 8508107, Fax. +6224 8508007
v
PREFACE Assalamu’alaikum warrahmatullahi wabarakatuh
Firstly, may we made our highest praise and thank to Allah The Almighty, for His bless so that we are able
to conduct such an precious moment; First International Seminar on Public Health and Education 2014 in
Semarang Indonesia, to share our knowledge and ideas with so much warm and friendship from worldwide
public health and education community.
International Seminar on Public Health and Education 2014 is aimed to gather all of experts, researchers,
academicians and practitioners in health education field in general as well as national and international
level in one prestigious academic forum which to discuss all health-education-related issues, ranging from
human resources, curriculum, institutionalization etc. The seminar also proposed to contribute to the focus
of health development direction; by considering also situation and the status of local health condition from
each region, both national and regional levels as well as its relation to global health trends
I would like to deliver our highest respect and appreciation to our honorable speakers, Prof. Dr. Ir. H.
Musliar Kasim, M.S (Indonesia vice Minister of Education and Culture for Education Affairs) and to the
Rector of Semarang State University for their support and appreciation on this seminar; and my deep
gratitude to our honorable guests: Prof. Doune Macdonald (Queensland University Australia), Maria
Consorcia LIM Quizon, MD (South Asia Field Epidemiology and Technology Network, Inc , Philippine), Dr.
Khancit Limpakarnjanarat (WHO Indonesia Representative), and also Assist. Prof. Dr. Songpol Tornee
(Srinakharinwirot University, Thailand). I really expect that this seminar will be beneficial for all of us and to
the development of the Public Health and Education field.
Allow me to express my gratitude to the participants and audiences from Indonesia and other foreign
countries who are enthusiastic in attending this seminar. I do hope that all audiences will gain important
values and collaborate it into our own fields and make significant changes in the future. Besides that, I also
convey my appreciation to all of organizing committee who has given their outstanding commitment for
presenting this occasion.
Wassalamu’alaikum warrahmatullahi wabarakatuh
Sincerely yours
Rudatin Windraswara

vi
vii
Content
Cover .................................................................................................................................................................... i
Preface .................................................................................................................................................................. v
Content.................................................................................................................................................................. vii
ORAL PRESENTATIONS
SPORT HEALTH EDUCATION AT SCHOOL
1. The Implementation of Modification in Football Learning at Elementary School as an Injury Prevention Effort to Students
Yudanto; Yogyakarta State University,Indonesia ........................................................................................ 535
2. Model Development of Learning Tools of Physical Education to Improve
Students’ Interest in Elementary School Dwi Supriyanto; Semarang State University, Indonesia ............................................................................... 544
3. The Development of Sport through Extracurricular in the Secondary School Muh. Mariyanto; Semarang State University, Indonesia .............................................................................. 554
4. Safe Exercise Guidelines to Achieve and Maintain Life Quality of the Elderly M. Irfan; State University of Medan, Indonesia ............................................................................................ 559
5. The Role of Coach's Leadership Style in Achieving the Sport Achievement Komarudin; Yogyakarta State University, Indonesia .................................................................................... 567
6. Health Education Based on Character Education through Active Intervention of School Curriculum
dr. Farid Eka Wahyu Endarto; Malang State University, Indonesia ............................................................. 573
7. Outdoor Activity's Manner Survey to Teacher the Need Elementary School at Year Semarang City 2013
Ipang Setiawan; Semarang State University, Indonesia .............................................................. 586
8. The Leadership of a Sports Coach Devi Tirtawirya; State University of Yogyakarta, Indonesia ......................................................................... 598
9. Model Development of Problem-Based Learning Curriculum Management for Public Health Student Nurjazuli
1, Onny Setiani
1 , Maman Rachman
2, Haryono
2;
1Diponegoro University, Semarang Indonesia,
2Semarang State University, Indonesia ....................................................................................................... 603
IMPROVING HEALTH, CHILDCARE AND QUALITY OF MOTHER
10. Community Empowerment Planning in the Exclusive Breast Feeding by Intervention Mapping (Case Studies in Kota Wilayah Selatan Public Health Center of Kediri) Nurnaningsih Herya Ulfah; Malang State University, Indonesia................................................................... 619
11. Description of Eating Behavior and the Occurance of Digestion Disorders of Street Children in Semarang Intan Apriliyani
1, Widya Hary Cahyati
1, Sofwan Indarjo
1; Semarang State University, Indonesia ................ 625
viii
ELIMINATING HIV/AIDS, MALARIA AND OTHER DISEASES 12. Multivariate Adaptive Regression Splines Modeling to Predict the Number
of Hiv/Aids Cases Herlina Jusuf; Gorontalo State University, Indonesia ................................................................................... 637
13. Study of Environmental Factors on Dengue Haemorrhagic Fever (Dhf) Cases Lintje Boekoesoe; Gorontalo State University, Indonesia ............................................................................ 645
ENSURE ENVIRONMENTAL SUSTAINABILITY AND HEALTH IN PUBLIC DEVELOPMENT 14. Model of Fishing Communities Welfare in Coastal Area in Gorontalo Utara District Rama Hiola
1, Herlina Jusuf
1, Yuniarti Koniyo
1;
1Gorontalo State University, Indonesia ............................... 665
15. Toheren Lighting Standard and Factors Affecting Fatigue Eye for the Craftsmen Karawo in District Gorontalo
Reni Hiola; Gorontalo State University ........................................................................................................ 679
16. Relationship of Pelvic Rocking With Ball on The Duration of Phase Birthing Cervical Dilatation Women Deliveryin Griya Hamil Sehat Mejasem 2014
Adevia Maulidya Chikmah, Semarang State University, Indonesia .............................................................. 689
17. Decrease The Pulse and Blood Pressure In Elderly With Gymnastic Program Ardian Khoerul Anam, Fandy Sadewa, Semarang State University, Indonesia ............................................ 696 18. Knowledge Level Relationship With Mom Interests In Bringing Their Babies For Immunizations In Puskesmas Tayu I Pati Regency Ana Zumrotun Nisak
1, Titi Suherni
2, Sugih Wijayati
2,
1Semarang State University,
2Health Polytechnic
Semarang, Indonesia ................................................................................................................................... 702
19. Discriminant Analysis The Adequate Level of Family Protein Consumption In
Bogor District Ardiana Priharwanti, Semarang State University, Indonesia ........................................................................ 709
20. The Relation Between The Duration Of Iud Used With The Infection Rate In The Iud
Acceptors Post-Used In 6 Months – 5 Years In Jekulo Subdistrict, Kudus District Atun igati
1, Dewi Hartinah
1, Candra Dewi
2,
1Semarang State University,
2STIKES Muhammadiyah Kudus,
Indonesia ...................................................................................................................................................... 719
21. Relationship Between Anemia In Pregnancy With Low Birth Weight Infantsin
Dr Moewardi Hospital Citra esmi Lestariana Putri
1, Ag Kirwanto
2, Sri Wahyuni
2,
1Semarang State University,
2Health
Polytechnic of Surakarta Indonesia .............................................................................................................. 727
22. The Correlation Between Knowledge And Attitude About Teenage Pregnancy On
Female Student At Ungaran 2 State Senior High School In 2014 Dwi Wiratri, Dwi Novitasari, Yuliaji Siswanto, Semarang State University, Ngudi Waluyo School of Health, Indonesia ...................................................................................................................................................... 733 23. The Description Of Mothers’ Knowledge About Giving Pacifier To Babies In
Gumilir Cilacap Of The Year 2014 Eka Mei Susanti, Semarang State University, Indonesia .............................................................................. 741

ix
POSTER PRESENTATION
24. Knowledge Level Students of Pjkr 2011 Fik Uny Force on Concepts and Teaching Materials Course Target Games Tgfu
Aris Fajar Pambudi; Yogyakarta University, Indonesia ................................................................................ 749
25. Role of Women In Water Resources Utilization Education For Children Indah Prasetyawati, Tri Purnama Sari, Yogyakarta State University, Indonesia ........................................... 759

x

ORAL PRESENTATIONS

532
Public Health Department, Faculty of Sports Science, F1 Building, 2nd
Floor, Sekaran Campus Gunungpati, Semarang City, Central Java Province, Indonesia, 50229 Phone/ Fax. +6224 8508007
Public Health Department, Faculty of Sports Science, F1 Building, 2nd
Floor, Sekaran Campus Gunungpati, Semarang City, Central Java Province, Indonesia, 50229 Phone/ Fax. +6224 8508007
533
SPORT HEALTH EDUCATION AT SCHOOL
PAPERS

534
Public Health Department, Faculty of Sports Science, F1 Building, 2nd
Floor, Sekaran Campus Gunungpati, Semarang City, Central Java Province, Indonesia, 50229 Phone/ Fax. +6224 8508007
Public Health Department, Faculty of Sports Science, F1 Building, 2nd
Floor, Sekaran Campus Gunungpati, Semarang City, Central Java Province, Indonesia, 50229 Phone/ Fax. +6224 8508007
535
THE IMPLEMENTATION OF MODIFICATION IN FOOTBALL LEARNING AT ELEMENTARY SCHOOL AS AN INJURY PREVENTION EFFORT
TO STUDENTS
Yudanto
Yogyakarta State University,Indonesia
Corresponding Author: [email protected]
Abstract Introduction: Football is included in the scope of the game and sport in Physical Education lessons in elementary school. The game of football is very exciting for everyone, including children. Learning football in elementary school has the potential for injury to the student, if it is done inappropriate with the growth phase and development of students. Results: Potential injuries in football play can be minor and serious injury. Minor injury includes: abrasions, bleeding under the skin, strains and sprains, muscle cramps, and muscle bruising. Serious injury includes: muscle tearing, ligament or fracture. The potential for injury to the student in learning football in elementary school can be prevented by applying modifications. Modification is one effort that can be done by teachers in learning to reflect developmentally appropriate practice, which means that a given teaching assignment should pay attention to changes in the ability of children and can help encouraging these changes. Modifications can be made to: (1) the size of the field, (2) the shape, size and amount of equipment used, (3) the type of skill that is used, (4) rule, (5) the number of players, (6) organization of the game and (7) the purpose of the game. Key Words: Modification, football, injury, elementary school students.
Introduction
The Physical, Sport, and Health Education subject is included as one effort to realize a
complete human which is held at school, both from primary to secondary education level.
Education as a process of human development lasts a lifetime, Physical Education, Sport and
Health taught in school has a very important role, which gives an opportunity to students to be
directly involved in a variety of learning experiences through physical activity, sport and health that
are selected and performed systematically. The debriefing the learning experience is more
intended to foster the growth of physical and psychological development better, as well as forming
a healthy and fit lifestyle throughout life.
The achievement of the objectives of the Physical, Sport, and Health Education in Primary
Schools should consider the learning objectives, students' abilities, methods, materials, facilities
and infrastructures, as well as the pleasure of learning activities of students. The elements
mentioned above must be considered, so that the learning process will go well and successful, so
that the expected objectives will be achieved. Game sport is one element in curriculum that
dominates enough in the subjects of Physical, Sport, and Health Education Elementary School.
Sport games include small ball and large ball games. Small ball games taught in elementary
schools include: baseball, kippers, rounders, softball, and baseball, while the big ball games taught
in elementary schools include: football, volleyball, and basketball.

536
Public Health Department, Faculty of Sports Science, F1 Building, 2nd
Floor, Sekaran Campus Gunungpati, Semarang City, Central Java Province, Indonesia, 50229 Phone/ Fax. +6224 8508007
The football materials taught in Physical, Sport, and Health Education subject is a medium
used in the educational process. The material taught football game in elementary school must be
customized to the children stage of growth and development. The material for the football game in
elementary school must be given in a different form. The form of football games for elementary
school students should be different with the material form of football game for adults. The main
purpose of learning the game in elementary school is that children gain the excitement. Sports are
used as a medium of learning in school physical education which has the potential injury. Big and
little risks of injury caused by the accident depend on the type of exercise performed and the
parties involved in the learning, such as teacher and students. The game of football certainly has a
greater potential to cause injury to the others like volleyball game.
The efforts to avoid accidents in physical education teaching, especially in football game
material are needed. A teacher should understand the dangers and mistakes made in learning the
game of football. Factors of accidents in physical education lessons, including: lack of leadership,
lack of good equipment are used, the children‟s behaviour cannot be predicted, inadequate skills,
not good physical condition, and the risk that characterizes the type of the activity itself, (Sayarti
Soetopo, 2004: 7.5). Basically injury in learning football game can be prevented. One effort that
can be done is to modify the implementation of learning the game of football. Modification is one
way that can be done by teachers to reflect developmentally learning practice, which means that
given teaching assignments should pay attention to changes in the ability of children and can help
drive these changes. Therefore, the teaching task should match with the developmental level of
students who are learning. Appropriate teaching tasks must be able to accommodate any changes
and differences in the characteristics of each individual as well as pushing it in the direction of
change for the better.
Results and Discussion
The Injury in Football Game Leaning
Injury in football game in school learning can possibly occur in students. Environmental and
student pressures received by students at the time of learning the game often cause an accident or
injury. Basically, the injury is a result rather than the forces acting on the body or body part than
that exceeded the body's ability to cope, these forces can happen quickly or long-term. All kinds of
sports injuries are injuries that occur, either at the time of exercise or at the time of exercise (game)
or afterwards. Sports injuries are caused due to the pain of exercise, which can cause defects,
wounds and damaged muscles or joints as well as other parts of the body, (Andung Sudijandoko,
2000: 7). Injuries that occur in football can be minor and major injury. Minor injury is an injury that
is not followed by significant tissue damage in our bodies. In minor injury, it is usually not required
any treatment, and will heal by itself after a break some time. Students, who suffer minor injuries in
football play, usually will still be able to continue the game. The examples of minor injuries are:
abrasions, hematomas, strains and sprains of the level, muscle cramps, and muscle bruises

Public Health Department, Faculty of Sports Science, F1 Building, 2nd
Floor, Sekaran Campus Gunungpati, Semarang City, Central Java Province, Indonesia, 50229 Phone/ Fax. +6224 8508007
537
(contusions). Whereas, major injuries are serious injury, where the injury we find any damage to
the body tissues.
Students, who suffer major injuries in football play, usually cannot continue playing. The
examples of serious injury are: injury to the head (concussion or injury that causes fainting, and a
broken nose), injury to the knee (contusions, sprains, strains, dislocations of the patella, and the
tear meniscus), injury to the ankle (the medial malleolus fractures of the tibia , talokruralis
dislocations, muscle tears and ligament, haemarthrosis), injury to the spine (vertebral fracture and
dislocation of the spine), and injury to the shoulder (luksasio (subluksasio) of the shoulder joint and
joints akroinioklavikularis), (Hardianto Wibowo, 2007: 108 ).
Causes of Sport Injury
Learning of physical education in schools has the potential for injury to the student. Watson
(1992) cited by Santosa Giriwijoyo (2013: 99) states that the teaching of physical education in
schools, accounted for around a quarter of all cases of sports injuries, and the incident in the boys
much bigger in sports outside of school, with the largest number occurs during exercise. Factors
that could cause sports injuries in children include: (1) carelessness, (2) fraud or illegal game of
opposing players, (3) field or a bad play equipment, (4) body size or strength is not appropriate the
activities carried out or not in accordance with the opponent to be faced, (5) inadequate level of
fitness or any postural problems, (6) the absence or not good protective equipment, (7) shoes or
sports equipment that is not appropriate, (8) rudimentary healing injury, (9) monitoring or refereeing
is not good, and (10) lack of sufficient heating, (Santosa Giriwijoyo, 2013: 99). Further Andun
Sudijandoko (2000: 18-21) explains that the cause of injury, among others: (1) factors sportsmen,
including: age, personal factors, experience, level of exercise, technique, warming up, recovery
period, body condition, and balance nutrients, (2) the equipment and facilities, and (3) the
character of the sport factor.
Dunkin (2004), quoted by Yustinus Sukarmin (2005: 15) says that the injury occur at
exercise is caused by several things, namely: (1) accident, (2) implementation of poor training, (3)
equipment that does not comply , (4) lack of physical condition preparation, and (5) inadequate
warming and stretching. The factors of accidents or injuries in physical education lessons, include
lack of leadership, lack of good equipment is used, the children‟s behavior that cannot be
predicted, inadequate skills, good physical condition, and the risk characteristics of the types of
activities itself, (Sayarti Soetopo, 2004: 7.5). Hardianto Wibowo (2007: 13) explains that the causes
of sports injuries, among others are: (1) external violence (the causes of which are from outside),
for example: the presence of body contact, as sport equipments, and state of the field that does not
meet requirements, (2) internal violence (causes originating from inside), for example: coordinating
the muscles and joints that are less than perfect, the size of the feet or legs of unequal length, the
strength of the muscles that are antagonistic unbalanced, and the lack of heating, and (3) over-use
(continuous usage or too tired), for example: the use of excessive muscle or too tired.

538
Public Health Department, Faculty of Sports Science, F1 Building, 2nd
Floor, Sekaran Campus Gunungpati, Semarang City, Central Java Province, Indonesia, 50229 Phone/ Fax. +6224 8508007
Prevention of Sport Injury
To prevent is better than to cure, it is still a rule that must be made and adhered to.
Prevention of sports injuries can be done by: (1) changing the rules, (2) modification of equipment
adjusted to the size, strength and skill level, (3) the right shoes, the use of protective equipments
required, (4) the selection of appropriate exercise and in particular children through a special
assessment, and (5) improvements in training techniques and exercise programs, including proper
warming up, strength, and flexibility exercises, appropriate loading portion, and step by step
intensity, (Santosa Giriwijoyo, 2013: 102). Congeni (2002), quoted by Yustinus Sukarmin (2005:
16) explains that injury prevention measures can be done through: (1) having a good physical
condition at the time of exercise, (2) determine and implement the rules of the game, (3) use of
appropriate and good protective equipment, (4) knowing how to use gym equipments, (5) warming
up before exercise, and (6) do not exercise at the time of having fatigue or sickness.
The prevention of sports injuries can also be done in several ways, such as: (1) prevention
through improved skills, (2) prevention through fitness, (3) warming up, (4) consider to the
environment is used, (5) using appropriate equipments, (6) using the appropriate sport apparels,
(7) prevention through aids, and (8) sportsmanship and responsibilities of coach, official, medical
personnel and athletes, (Andun Sudijandoko, 2000: 22).
Injury Prevention in Learning of Football Game in Elementary School through Modification
Football is very attractive to children. The flexibility to do a variety of movements, such as
jumping into the air, twisting body, and rotates once, a movement that has the potential to cause
injury. Heading a ball from a powerful kick from close range is to children, especially if the ball is a
ball that is used standard. The use of modified balls is by soft materials, such as synthetic rubber in
several sizes (large or small) is very suitable for primary school children, (Rusli Lutan, 2001: 139).
The prevention of injury to student in learning the game of football in elementary school can be
done in various ways. One of the ways that can be used for injury prevention is by the application
of learning through a modification football. A football game is done by a child, who cannot create a
sense of fun and joy and cause inactive children to move, there should be an evaluation of the
game.
Modification of the game is one of the alternative ways that can be used to improve the
shape of the game. As what was said by Pangrazi (1989: 488) that a game can be modified and
created in the form of new variations that can be done by the teacher or the child and even both.
According Yoyo Bahagia (2000: 1), it is stated that in a study of learning, especially in physical
education in schools, can be done by using a modification. Modification is one effort that can be
done by teachers to reflect developmentally learning practice, which means that a given teaching
assignments should pay attention to changes in the ability of children and can help drive these
changes. Therefore, the teaching task should match the developmental level of students who are

Public Health Department, Faculty of Sports Science, F1 Building, 2nd
Floor, Sekaran Campus Gunungpati, Semarang City, Central Java Province, Indonesia, 50229 Phone/ Fax. +6224 8508007
539
learning. Appropriate teaching task must be able to accommodate any changes and differences in
the characteristics of each individual as well as pushing it in the direction of change for the better.
Modification of the game has some very important benefits, one of which for the prevention
of injury to the student. Further, Yoyo Bahagia (2000: 1) states that the modification has to analyze
the essence of the subject matter as well as developing the learning materials form of learning
activities that can potentially facilitate students in learning. This method is intended to guide, direct,
and learning students who cannot otherwise be able to, from a level that was lower to have a
higher level. In connection with the modification of sport or game that is applied in the teaching of
physical education in schools, Gusril (2004: 46-48) states that the modification has advantages
and effectiveness, which includes: (1) Improve Students‟ Motivation and Joy in Learning Physical
Education. Sport learning orientation and modified game into physical education, namely: to
motivate children‟s pleasure. Children who follow the pleasure of learning will encourage the
motivation to participate in the following study physical education. Eventually children will have the
opportunity to actively move, so the goal of learning to improve the fitness of the children will be
achieved; (2) Increase Student Learning Activity. The principle of sport and game modification is
learning activities. Therefore, in the teaching of physical education, it needs to be stressed the time
to take advantage of motion activity. According to Jones (1995) quoted by Yoyo Bahagia (2000:
47) that states that in teaching physical education teacher should be able to utilize 50% of the time
available to the motion activity. In this regard, the teacher should be required to design learning
physical education in such a way, good materials, methods, and effective learning organization; (3)
Increase Learning Outcome of Student Physical Education. As has been stated above, that the
principle of using a modified learning is learning and fun activities, giving students the chance to
experience high activity and provide a lot of motion. According to Toho Cholik Mutohir (2000: 108),
the modification of sport is to encourage children to perform motion tasks with a higher success
rate than the traditional approach. If the child has a lot of movement experience will certainly
contribute to the improvement of physical fitness. Physical fitness is one aspect that is very
important for the basic capital gain optimal learning results.
Overcome the Lack of Facilities and Infrastructures
One of supports of the learning process of physical education is the availability of existing
infrastructure. Facility is a tool that is used in physical education, while infrastructure covers the
place used in the field of physical education. To create the learning process of physical education
of good quality, it is necessary to have adequate facilities and infrastructure. If the availability of
infrastructure is inadequate, then the teacher needs to be adjusted for creativity or create some
form of modification to overcome the problem of infrastructure.

540
Public Health Department, Faculty of Sports Science, F1 Building, 2nd
Floor, Sekaran Campus Gunungpati, Semarang City, Central Java Province, Indonesia, 50229 Phone/ Fax. +6224 8508007
The Principles of Modifying Football Game
The game of football is essentially included as invasion game and team game, because in
this game each team tries to do an attack that aims to score goals against the opposing team.
Learning the game of football in elementary school, should be tailored to the stage of growth and
development of students. Students should not be taught the game of football like adults. Further,
Pangrazi (1989: 597) states that the game of football 11 people 11 people opposed, not exactly
taught to elementary school age children. A football game is given to elementary school age
children, must be modified in accordance with the stage of growth and development of children. To
create a modified game of football, there are considerations that need attention. The main purpose
of learning the game of football is the children so that children gain the excitement. The form of
football games as a result of modifications made simple real game. Modifications can be made to
reduce the size of the field, the width of the goal, the number of players, and shorten time to play,
(Soendoro, 2004: 14). Modifying a game should not change the challenges in the game.
Modifications game should also provide an opportunity to the players to perform technical and
tactical exercises. Modification of the game also includes changes related to the size, weight
equipment used, play areas, old games, the rules are used, the number of players in a team, the
size of the wicket, a net height, players position shift, or how to score goals or numbers ,
(Siedentop: 2004: 59).
In accordance with Siedentop (2004: 60-64), there are some keys or strategies to modify a
fun and challenging game that can make children attracted to do, they are: (1) How to Score
Easily, children will love a game that aims to form scores or numbers. Scoring is a way to describe
success in a game. Children will feel bored and frustrated, when doing a hard or difficult game
scores / numbers. For example, children will feel bored or not happy, when playing football rarely
or too difficult to score against opponent. Therefore, the game of football can be modified to
increase the amount of the goal, so that the children will have a frequency to score more. Another
possible way is to increase the height and width of the goal; (2) Slow Down the Move of A Ball or
Object, Slow down the movement of the ball or the object used in the game will help children. This
will facilitate the children in anticipation of the ball or the object used in the game. For example, in
the game of tennis, the children will find it difficult to anticipate or hit the ball, if the ball is hard to
use (standard or normal size). The ball movement can be slowed down by using a ball that is not
hard (soft), so that the children will be easier to anticipate or hit the ball. Similarly, football game,
children will be easier to kick the ball, if the ball is not hard to use or use a ball made of plastic,
rather than using a hard ball (standard ball); (3) Increase the Opportunity to Train Technique and
Tactic, one of the key strategies for modifying the game is trying to improve the technical and
tactical training opportunities to children. This effort can be done by reducing the number of
participants involved in a game. In the game of football is played 11 vs. 11, will make children have
the opportunity to practice the techniques and tactics. Opportunity training techniques and tactics
in the game of football can be done by reducing the number of participants, for example, a football
Public Health Department, Faculty of Sports Science, F1 Building, 2nd
Floor, Sekaran Campus Gunungpati, Semarang City, Central Java Province, Indonesia, 50229 Phone/ Fax. +6224 8508007
541
game 7 vs. 7; (4) Possibly to Perform the Game Systematically to Emerge Tactic Learning.
Attacking game (invasion games) presents many complex and difficult tactics when studied by
beginner students. Small-sides games (small game) is one way that can be used to solve the
problem and improve the tactics students with a sense of comfort, while playing an attacking game
form (invasion games). Examples of small game-sides soccer games in the game for primary
school children can get through the competition 1 Vs 1 who played on the basketball court are only
using half of the field. In this game students have to do dribble and shooting when attacked and the
student must maintain the area and tried to snatch the ball when defending or attacked. The size
and shape of the field of play will also help to determine how the tactics learned. Form of a large
field provides an opportunity for students to conduct long-range shot, otherwise when using small
or short field allows students to frequently use the short pass; (5) Change the Rules in the Scoring,
game modifications can be done by changing the way of scoring rules. It is very important to do,
because the goal or objective in the game is to produce a score against opponents. Modification of
the scoring can be done in accordance with the objectives and the needs of the game.
Aussie Sport (1993) cited by Gusril (2004: 45-46) argues that there are four elements that
need to be considered in modifying exercise in teaching physical education, namely: (1) Field Size
Modification, modifying the field size and the time aims to reduce student expectations of physical
abilities. Modifications to the size of the field can be adjusted to the situation and conditions that
are available on the school field; (2) Modifying the Equipments, modifying equipments includes
equipment needed for learning. In the game of football for elementary school students, the
equipment used should be adjusted to the growth and development of students. This will make
students feel more comfortable doing and avoid the possibility of injury. A football game is done by
students in elementary schools using an adult size football field and will make the students feel
happy and less enthusiastic in following the game. Students will feel pain and can lead to injury,
since it uses the ball for adult or standard size; (3) Modifying the Game Time, modifying the
duration of the game aims to give full concentration and fun for students to follow the learning of
physical education. A long time will make the bored students to perform movement tasks.
Determination of time spent used is adjusted to the existing needs, (4) Rules Modification,
modification of the rules aims to help students develop the skills and enjoyment in performing the
game without breaking the original rule of the game. Regulations are made in the game is done
and agreed collectively or teacher sets it first, then notify to the students.
According Yoyo Bahagia (2000: 31-32), modification of a sport game can be done by
reducing the structure of the game. These structures include: (1) the size of the field, (2) the shape,
size, and amount of equipment used, (3) the type of skill that is used, (4) rules, (5) the number of
players, (6) the organization of the game and (7) the purpose of the game. Furthermore, Knut
Dietrich (1984: 12-13) explains that football game can be done in a modified form. The modification
can be applied in terms of: (1) changes in the number of players who play, (2) changes in the size
of the field and equipment, and (3) changes in the rules of the game. Football International
542
Public Health Department, Faculty of Sports Science, F1 Building, 2nd
Floor, Sekaran Campus Gunungpati, Semarang City, Central Java Province, Indonesia, 50229 Phone/ Fax. +6224 8508007
Federation Association or called FIFA explains that the existing rules of football can be modified for
children under the age of 16 years old, female players, veteran players (over the age of 35 years),
and players who suffer disability. According to FIFA (2007: 3), it is explained that the points can be
modified regulations in the football game include: (1) the size of the field used for play, (2) the size,
weight and materials used ball, (3) the height and the width of the goal, (4) the length of the game,
and (5) substitutions.
Closing
Injury in learning football game in elementary school is something that is not expected by
anyone. To that end, all parties involved must always seek to avoid and prevent it. The main
actions must be taken to prevent injury. We must first know and understand the factors that lead to
injury and then try to minimize the factors. One of the efforts that can be done by physical
education teachers is to avoid injury in learning the game of football in elementary schools by
implementing a modification.
Modification is one effort that can be done by teachers in order to make the learning reflect
developmentally which means that a given teaching assignment should consider changes in the
ability of children and can help drive these changes. In order to create a modified form, especially
in football game, then the modification can be done in terms of: (1) the size of the field, (2) the
shape, size, and amount of equipment used, (3) the type of skill that is used, (4) the rules, (5) the
number of players, (6) the organization of the game and (7) the purpose of the game.
References
Andun Sudijandoko. 2000. Perawatan dan Pencegahan Cedera. Depdiknas, Direktorat Jenderal
Pendidikan Dasar dan Menengah Bagian Proyek Penataran Guru SLTP Setara D-III.
Dietrich, Knut dan Dietrich, K.J. 1984. Sepakbola: Aturan dan Latihan. Terjemahan Agus Setiadi. Jakarta: Gramedia.
FIFA. 2007. Laws of he Games. Switzerland: FIFA. Gusril. 2004. Efektivitas Ancangan Modifikasi Olahraga ke dalam Pendidikan jasmani. Jurnal
Nasional Pendidikan jasmani dan Ilmu Keolahragaan. Volume III, Nomor 1, Edisi April, Halaman: 45-46.
Hardianto Wibowo. 2008. Pencegahan dan Penatalaksanaan Cedera Olahraga. Jakarta: Penerbit Buku Kedokteran EGC.
Pangrazi, Daur P. dan Daur, Victor P. 1989. Dynamic Physical Education for Elementary School Children. (Nine Edition). USA: Macmillan Publishing Company.
Rusli Lutan. 2001. Penanggulangan Cedera Olahraga pada Anak Sekolah Dasar. Jakarta: Depdiknas, Direktorat Jenderal Pendidikan Dasar dan Menengah.
Santosa Giriwijoyo. 2013. Ilmu Kesehatan Olahraga. Bandung: Remaja Rosdakarya. Sayarti Soetopo. 2004. P3K dan Pencegahan Cedera. Jakarta: Pusat Penerbitan Universitas
Terbuka. Siedentop, Daryl, et al. 2004. Complete Guide to Sport Education. USA: Human Kinetics. Soendoro dan Syamsir Aziz. 2004. Pembelajaran Permainan Sepakbola. Jakarta: Depdiknas.
Dirjen Pendidikan Dasar dan Menengah, Direktorat Tenaga Kependidikan. Toho Cholik Mutohir dan Gusril. 2004. Perkembangan Motorik pada Masa Anak-Anak. Jakarta:
Proyek Pengembangan dan Keserasian Kebijakan Olahraga, Dirjen Olahraga, Depdiknas.

Public Health Department, Faculty of Sports Science, F1 Building, 2nd
Floor, Sekaran Campus Gunungpati, Semarang City, Central Java Province, Indonesia, 50229 Phone/ Fax. +6224 8508007
543
Yoyo Bahagia dan Adang Suherman. 2000. Prinsip-Prinsip Pengembangan dan Modifikasi Cabang Olahraga. Jakarta: Depdikbud, Dirjen Pendidikan Dasar dan Menengah, Bagian Proyek Penataran Guru SLTP Setara D-III.
Yustinus Sukarmin. 2005. Cedera Olahraga dalam Perspektif Teori Model Ekologi. Medikora Volume I, No. 1 Edisi April, Halaman: 15-16.
544
Public Health Department, Faculty of Sports Science, F1 Building, 2nd
Floor, Sekaran Campus Gunungpati, Semarang City, Central Java Province, Indonesia, 50229 Phone/ Fax. +6224 8508007
MODEL DEVELOPMENT OF LEARNING TOOLS OF PHYSICAL EDUCATION TO IMPROVE STUDENTS’ INTEREST IN ELEMENTARY SCHOOL
Dwi Supriyanto
Semarang State University, Indonesia
Corresponding Author: [email protected]
Abstract Introduction: This research was aimed at developing and producing multifunction tools as well as effective learning samples to be done in physical education at elementary schools. Methods: This research used research and development on learning tools for elementary schools. Research instrument used in this research were questionnaire, observation, and measurement. Reseach data were the assessment of the quality of product, dan the result of students‟ Vo2 Max. Data analysis used descriptive-quantitative in order to know the percentage students‟ interest after using multifunction tools and to know the percentage of the improvements of students‟ Vo2 Max. Results: The research findings were as follows: (1) the development of multifunction tools which can be used in physical education, (2) the result of field tesing on the product which was carried out at SD 2 Trimodadi, SDN 2 Ratu Abung, dan SDN 1 Ratu Abung showed that the improvement of Vo2 Max was 62,81%, (3) the result of the product acceptance in the aspect of internal and external was 94,58%.It can be conlcuded that the development of the model of learning tools in pyisical education empirically produced the effective product of multifunction tools and it can be implemented in phisical education at elementary schools. Key Words: Learning tools, physical education, interest, elementary schools Introduction
Sports physical education and health is an integral part of education as a whole due to join
the intellectual life of the nation's existence. Physical education subject matter and motion have
pedagogical objectives as its activity. Physical education has the goal of education as 1) the
development of the organs of the body to improve health and fitness, 2) development of the
neuromuscular junction, 3) emotional mental development, 4) social development, and 5) of
intellectual development. The final goal of sports and physical education lies in its role as a unique
container perfecting character, and as a vehicle to own and form a strong personality, good
character and noble nature. The description makes it clear that physical education and sport is an
educational tool as well as acculturation. This process is a condition that allows humans are able to
continue to survive as human beings.
Education is the effort to influence the formation and the formation of personality, including
changes in behavior, because it's physical education and sports always involve a social dimension,
in addition to the criteria that emphasize the physical nature of skill, agility and performance of
"permissibility". The social dimension involves relationships between people, between learners and
facilitators or directors.
To achieve the goal of physical education required in a process called learning process.
According Hamalik (2007) learning is a process. Learning is not a destination but a process to
achieve the goal. Goal is achieved is the result and evidence of a change in behavior of the
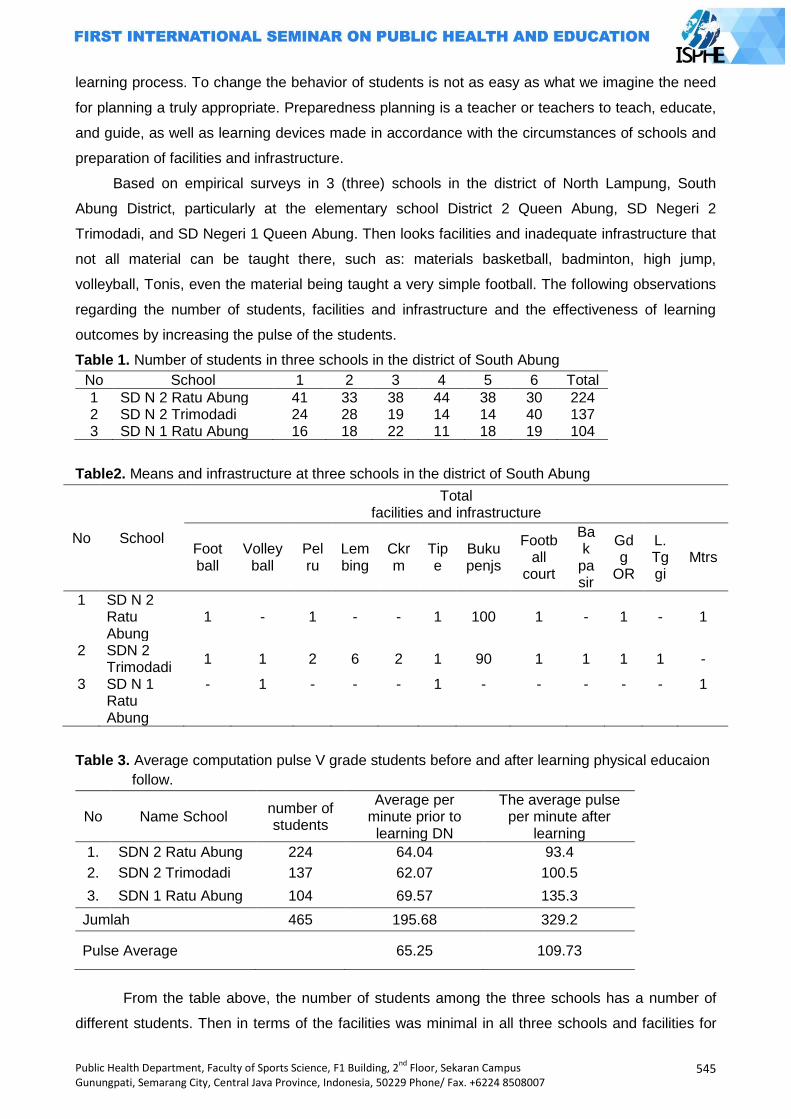
Public Health Department, Faculty of Sports Science, F1 Building, 2nd
Floor, Sekaran Campus Gunungpati, Semarang City, Central Java Province, Indonesia, 50229 Phone/ Fax. +6224 8508007
545
learning process. To change the behavior of students is not as easy as what we imagine the need
for planning a truly appropriate. Preparedness planning is a teacher or teachers to teach, educate,
and guide, as well as learning devices made in accordance with the circumstances of schools and
preparation of facilities and infrastructure.
Based on empirical surveys in 3 (three) schools in the district of North Lampung, South
Abung District, particularly at the elementary school District 2 Queen Abung, SD Negeri 2
Trimodadi, and SD Negeri 1 Queen Abung. Then looks facilities and inadequate infrastructure that
not all material can be taught there, such as: materials basketball, badminton, high jump,
volleyball, Tonis, even the material being taught a very simple football. The following observations
regarding the number of students, facilities and infrastructure and the effectiveness of learning
outcomes by increasing the pulse of the students.
Table 1. Number of students in three schools in the district of South Abung
No School 1 2 3 4 5 6 Total
1 SD N 2 Ratu Abung 41 33 38 44 38 30 224 2 SD N 2 Trimodadi 24 28 19 14 14 40 137 3 SD N 1 Ratu Abung 16 18 22 11 18 19 104
Table2. Means and infrastructure at three schools in the district of South Abung
No School
Total facilities and infrastructure
Foot ball
Volley ball
Pelru
Lembing
Ckrm
Tipe
Buku penjs
Football
court
Bak
pasir
Gdg
OR
L. Tggi
Mtrs
1 SD N 2 Ratu Abung
1 - 1 - - 1 100 1 - 1 - 1
2 SDN 2 Trimodadi
1 1 2 6 2 1 90 1 1 1 1 -
3 SD N 1 Ratu Abung
- 1 - - - 1 - - - - - 1
Table 3. Average computation pulse V grade students before and after learning physical educaion
follow.
No Name School number of students
Average per minute prior to learning DN
The average pulse per minute after
learning
1. SDN 2 Ratu Abung 224 64.04 93.4
2. SDN 2 Trimodadi 137 62.07 100.5
3. SDN 1 Ratu Abung 104 69.57 135.3
Jumlah 465 195.68 329.2
Pulse Average 65.25 109.73
From the table above, the number of students among the three schools has a number of
different students. Then in terms of the facilities was minimal in all three schools and facilities for
546
Public Health Department, Faculty of Sports Science, F1 Building, 2nd
Floor, Sekaran Campus Gunungpati, Semarang City, Central Java Province, Indonesia, 50229 Phone/ Fax. +6224 8508007
exercise is a very pretty place for 2 (two) schools Abung SD Negeri 2 Queen and 2 Trimodadi
Elementary School has a football field wide enough while the Queen Abung Elementary School
has only one page school for exercise. But the field is large enough that can‟t be used to its full
potential for learning physical educaion. Field is due to limitations such as no pole volleyball,
basketball pole, pole badminton, high jump pole, or a football goal post. As for the increase in
pulse rate was not maximized.
To the authors will make a modification to a multifunction device that can use a variety of
sports, such as a football field, volleyball, basketball, badminton, Tonis, and high jump. This tool is
made using a metal consisting of two pieces that can be formed into2 (two) pieces of goal ball, 2
(two) volleyball pole, 2 (two) basketball pole, 2 (two) badminton pole, 2 (two) poleTonis and 2 (two)
high jump. Expected after this modification development model used by the teacher penjas it will
be easier to set up equipment, space, materials, or methods of learning, time spent will be more
effective and efficient. Then be able to increase students interest in learning so as to provide
students the impact of increased physical fitness.
Definition of interest in learning: to do something and achieve maximum results then
someone needs to have an interest. Great interest to study its effects, because the material of the
lessons learned are not in accordance with the interest of the students will not learn well. Interest
does not grow by itself but needs the stimulus of interest. According to Riber (in Shah, 2009: 152)
is not a term that popular interest in psychology due to its dependence on a variety of other internal
factors, such as concentration, curiosity, motivation, and needs. Under the Big Indonesian
Dictionary (KBBI) (2007: 744) interest is the tendency of high hearts on things. Further, according
to Hilgard (in Slameto, 2003: 57) is persisting interest Tendency to pay attention to and enjoy some
activity or content.
According to Gie (1998) the importance of interest in relation to the implementation of the study
are: interests and equitable delivery of attention, interest creation of concentration, prevent
interference from outside interests, interest in strengthening the adhesion of materials at the
memory and interest minimize boredom in self-study learning
From the above it can be concluded that the definition of interest in learning is the tendency
of people to feel something. And interests are affected by several things, namely: internal factors
and external factors.
Factors that affect learning: in the learning does not just run smoothly, usually have the
constraints that affect the learning process. According Aunurrahman (2009: 178) the issues that
affect the learning process among internal factors and external factors. Internal factors include: 1)
characteristics / characteristics of students, 2) attitudes toward learning, 3) motivation to learn, 4)
concentrations studied, 5) process the learning material, 6) explore learning outcomes, 7) self-
confidence, 8) and study habits. While external factors are: 1) the teacher factor, 2) the social
environment (including peers), 3) school curriculum, 4) and the facilities and infrastructure.
Public Health Department, Faculty of Sports Science, F1 Building, 2nd
Floor, Sekaran Campus Gunungpati, Semarang City, Central Java Province, Indonesia, 50229 Phone/ Fax. +6224 8508007
547
Meanwhile, according to Mudjiono Dimyati and the factors that affect learning outcomes are
influenced by 2 (two) factors: internal factors and external factors. Internal factors include: 1)
attitudes toward learning, 2) motivation to learn, 3) the concentration studied, 4) ability to process
materials, 5) ability to keep learning proceeds, 6) ability to explore the learning outcomes, 7) ability
to perform or demonstrate learning outcomes, 8) self-confidence of students, 9) the success of
intelligence and learning, 10) study habits, 11) the ideals of the student. Then the external factors
that affect learning, including: 1) the teacher as a mentor to learn, 2) infrastructure and means of
learning, 3) policy assessment, 4) the social environment of students at the school, 5) the school
curriculum. Also according to Baharuddin and Wahyuni (2007) factors that affect learning divided
into two categories, namely internal and external factors. Internal factors include: physiological
factors (state of tonus, a state of physical functioning) and psychological (student intelligence,
motivation, interests, attitudes, and talents).
From the above it can be concluded that the factors that affect learning are divided into 2
(two) factors: internal factors and external factors. These factors need to look for a solution so that
the learning process can proceed smoothly.
Learning strategies: learning strategy was initially used for the military to use the entire
military force to win a war. According to Sanjaya (2010) strategy of learning that teachers
implemented a strategy will depend on the approach used, whereas a strategy of how it can set a
variety of learning methods. In an attempt to run a method of learning the teacher can determine
the techniques that are considered relevant to the use of the method, and the use of techniques
that every teacher has a tactic that may vary from one teacher to another teacher.
Learning is a process of adding new information and skills. Therefore it is necessary for
effective learning strategies and efficient way to achieve it all. Before we determine the learning
strategies that can be used then there are several considerations that must be considered,
including: considerations relating to the objectives to be achieved, considerations relating to the
materials or instructional material, consideration of students' corner, and other considerations. that
is considered in terms of strategy itself, because so many strategies that we can choose to
learning tudents.
From the above it can be concluded that the learning strategy is an approach that requires
learning strategies, methods, techniques, and tactics in the learning process by considering
aspects of the purpose, content, students, and other considerations related to learning.
Physical education: to improve learning process on Physical Education, Sports, and Health, it
needs a learning which is in accordance with the students‟ characteristics and school condition.
According to Mutohir (2002) modification can be carried out on tools, field size, rules of the game,
etc. On this modification approach, a teacher should be able to utilize existing environment
optimally so that it can foster situation and condition that makes students happy to learn. Thus, by
using TGFU it can be answered that teaching skill games for tactics and tactics for skills.

548
Public Health Department, Faculty of Sports Science, F1 Building, 2nd
Floor, Sekaran Campus Gunungpati, Semarang City, Central Java Province, Indonesia, 50229 Phone/ Fax. +6224 8508007
The purpose of modifying the learning in school soccer is an effort to influence student
teaches for ease in learning to play soccer, although the infrastructure is owned by the school was
minimal. The method or methods used by teachers in the delivery of learning in school soccer is
the creativity of teachers in modifying lessons soccer because of lack of facilities an infrastructure
that exist in schools in general, and to create an optimal learning strategies to encourage initiative
and facilitate students‟ learning. Modification of learning soccer in question was modification of the
tooling infrastructure and facilities and modification to the rules in the game. The results are
models of learning a new style of soccer (Boladiator), four soccer goal, soccer castle, soccer and
soccer dhogdhog, triangle.
For the implementation of Physical Education, Sports and Health in Elementary School, thus
it needs an implementation guidelines. According to Lutan (2002) there are 9 basic guidelines in
implementing Physical Education, Sports and Health program in Elementary School, among
others: developing the fitness accompanied by the development of skill, no using task execution or
a kind of exercise to punish students, for example, when students come late or make mistakes by
breaking rules, implementing the assessment by focusing more on process than solely on result,
no cornering the position of physical education, sports, and health program as an activity which
can bring negative impacts toward other subject matters which are judged underachievers, giving
assistance to students to achieve the desired standard (criterion), presenting the activity by paying
attention to local culture, presenting physical fitness program must be accommodated in a program
fulfilling the rules of health and giving encouragement, and avoiding mockery.
It often happens the misuse of language between physical education and physical activity.
According to Michigan (2005) there are things that distinguish between Physical Education, Sports,
and Health and Physical Activity, namely: physical education program teach developmentally and
sequentially appropriate skills and knowledge and confidence needed to establish and sustain an
active lifestyle in a safe, supportive environment. Physical education teachers evaluate student
knowledge, motor and social skills, and provide feedback for student improvement. Physical
activity is bodily movement of any type and may include recreational,fitness and sport activities as
well as daily activities like walking to school. Physical education is the foundation for physical
activity. Here some ways to introduce physical activity into your school and students day.
Furthermore, according to Chunlei LU and Amanda De Lisio (2009) there are three
categories of fundamental movement, namely: locomotor / travel, a skill which involves moving the
body to any direction from one point to another, for example: walking, running, hopping, skipping,
galloping /sliding, leaping, chasing, fleeing, dodging, manipulative skill which involves handling and
controlling a thing by part of a tool or body, for example: propulsion, throwing, batting, kicking,
punting, strinking, dribbling, receipt: catching, collecting, volleying and stability skill involves body
balance either in one place (static) or moving (dynamic), for example: bending, stretching, twisting,
turning, rolling, balancing, weight transferring, curl-up, jump landing, pushing, pulling, rocking,
swaying.
Public Health Department, Faculty of Sports Science, F1 Building, 2nd
Floor, Sekaran Campus Gunungpati, Semarang City, Central Java Province, Indonesia, 50229 Phone/ Fax. +6224 8508007
549
It is of course that in Physical Education, Sports and Health can‟t be separated from the
growth and development of the students related to cognitive, affective and psychomotor, health
and the formation of physical fitness.
The goal of physical education is to assist every child in the development of a healthy life
style (Pangrazi & Gibbons, 2008; Ring,2006). More specifically, CAHPERD (2005) highlights the
importance of physical education in assisting student to: (a) acquire skills that enable them to
perform a variety of physical activity; (b) acquire skills that will have them become physically fit; (c)
participate regularly in physical activity because they find it enjoyable and exhilarating; (d)
understand and value physical activity; (e) understand with others; (f) display responsible and
socialbehavior during physical activity; and (g) display an understanding of and a respect for all
people during physical activity (Chunlei LU & Amanda De Lisio, 2009).
Besides learning Physical Education, Sports and Health which is practical in nature, the
learning Physical Education is also theoretical. The subject matters which are theoretical, among
others: 1) the culture of healthy living, 2) History and rules in games. In teaching philosophy of
theoretical subject matters on Physical Education, Sports, and Health, the presentation is
organized as follows: 10 percent from what we read, 20 percent from what we listen, 30 percent
from what we see, 50 percent from what we see and listen, 70 percent from what we speak and 90
percent from what we read, listen, see, speak and do Edgar Dale (in Harvey Grout and Gareth
Long, 2009: 180).
The learning Physical Education,Sports, and Health will not succeed without a teacher,
because he or she has a very central role in education. A teacher is an important element in
education because he or she is an intellectual factor who makes this nation proceed and able to
compete with other nations. A teacher is a professional educator whose main jobs are educating,
teaching, guiding, directing, training, assessing, and evaluating learning participants (Undang-
undang Republik Indonesia No.20 Tahun 2003 Bab I Pasal 1:2). About the teacher, Mudjiono and
Dimyati explain that a teacher is a professional educator.
There are 6 (six) activities in teaching, among others: activities, management, organization,
planning, instruction, and evaluation, in line with the basic experience of a Physical Education,
Sports, and Health teacher which must be mastered by a physical education teacher in
Elementary School. According to Mutohir (2002: 15) the teacher of Physical Education, Sports,
and Health in Elementary School must have following characteristics, for example: 1) having the
capacity to identify the characteristics of Elementary School students on: a) physical growth, b)
mental development, c) social and emotional development in accordance with phases of children
growth of Elementary School students, 2) able to encourage and provide opportunities to
Elementary School students to be creative and active in learning process of Physical Education,
Sports, and Health and able to develop potential ability and motor skills of Elementary School
students, 3) able to provide guidance and development to Elementary School students in learning
process to achieve the goal of Physical Education, Sports, and Health.

550
Public Health Department, Faculty of Sports Science, F1 Building, 2nd
Floor, Sekaran Campus Gunungpati, Semarang City, Central Java Province, Indonesia, 50229 Phone/ Fax. +6224 8508007
In learning process, a teacher needs facilities and infrastructure that support for the smooth
of teaching process. Based on National Sports System No.3 Year 2005 article 1: sport facilities are
equipment and supplies which are used for sport activities while sport infrastructure is a place or a
room including the environment that is used for sport activity or organization of sport events.
In relation to facilities and infrastructure which Elementary School has, of course there are
still some constraints in their availability. Based on survey by:
In the joint Oireachtas Report on the Status of PE 2005 it was noted that there was never a
period of significant funding in the area of PE nor had it ever been seen as worthy of serious
investment or concentration either in them of resources or planning.
The following is the result of survey on facilities and infrastructure which are very important
factors in learning Physical Education, Sports, and Health.
According to a recent INTO survey carried out in 2005, the situation in school in relation to
PE facilities was still unsatisfactory. While the vast majority (88%)of respondent indicated that their
school had a suitable – surfaced school yard which could be used for PE, only 39% indicated that
their school had a general – purpose (GP) room, though a small majority of respondents (68%)
indicated that they had access to a hall for PE. However, as indicated in previous surveys, such
facilities are not always adequate. Therefore, it‟s quite clear that very high percentage of primary
schools either don‟t have PE halls or are relying on inadequate and unsatisfactory hall. A
significant minority (23%) did not have access to a playing field. Although PE facilities in schools
include astro truf, a shared assembly place, all weather pitch and access to a local sport center.
According to Sukintaka (2004) there are several requirements in provision of facilities and
infrastructure of Physical Education, Sports, and Health in schools, among others: 1) safe, safety is
the most important element in implementing the learning of Physical Education, Sports, and
Health. Safety will reduce injury during learning process. Safety element is the top priority before
other elements, 2) easy and cheap, It means that facilities and infrastructure are easily obtained
and prepared, or it is easily obtained with relatively low price (unexpensive). It has good durability,
3) Interesting, 4) Spurring to move.
The facilities and infrastructure spur students to move. 1) fit to the need. In provisioning the
facilities and infrastructure are adapted to the students‟ need and the user, 2) fit to the goal, 3)
tough, not easily broken, facilities and infrastructure should not be easily damaged although it is
cheap to make them, 4) Fit to environment.
Development of model multi-functional tool: to determine the nature of the model in this
study, it takes some understanding of the term model. According to S. Udin Winataputra (2005: 3)
states that the model is defined as a conceptual framework that is used as a guide in conducting
the activities. In that sense the model is defined as a conceptual framework that is used as a guide
in conducting activities. In that sense the model is defined as any object or thing clone of the real
objects, such as the globe is a model of the earth where we live. In the context of this study the
term model is used to indicate the first sense, namely as a conceptual framework used in
Public Health Department, Faculty of Sports Science, F1 Building, 2nd
Floor, Sekaran Campus Gunungpati, Semarang City, Central Java Province, Indonesia, 50229 Phone/ Fax. +6224 8508007
551
conducting the activities. Further according to Gagne, Briggs, quoted by Day Amirullah Rachman
(2004: 43) says that the model is a sequential set of procedures for the realization of a process,
media selection and evaluation.
Development models can also be done in various fields of scientific study, one in education.
According Sugiyono (2010) products generated through R & D studies are expected to increase
the productivity of education, the graduate of a polynomial, quality and relevant as necessary.
Educational products such as teaching methods, educational media, textbooks, evaluation system,
the arrangement of the classroom for a particular learning model and many others.
Tools will be developed that is tailored to the needs of schools today. Many schools that
have a broad field but has not been able to properly maximized. Therefore made a multi-function
tool. It is made of iron that can be formed a variety of fields, among others: Goalkeeper soccer,
volleyball pole, basketball pole, pole high jump, pole badminton, tennis and pole pole Tonis.
Based on the above description then this development are intended to provide a model of a
learning tool to enhance the learning interest of students in primary school is a media / learning
tool designed and developed to help achieve the goal of learning in primary school.
Methods
This research is a developmental research. This model development is descriptive
quantitative, that is, a procedure which describes steps that must be taken to generate products. In
developing the product, he , the writer, refers to a developmental model Borg and Gall quoted by
Ardhana (2002). The following are steps that may be fully followed: 1) conduct a research and
gather information, 2) planning, 3) developing the initial product form, 4) conducting expert
validation, 5) conducting first stage of the field test, 6) conducting revision of the initial product, 7)
conducting second stage of the field test, 8) conducting revision of the main product, 9) conducting
trial of the final product, 10) conducting revision of the final product, 11) disseminating and
implementing the final product
The trial subjects to be tested are the students of Elementary School in 3 (three) Elementary
Schools located in South Abung Sub-District, North Lampung Regency, namely, SD Negeri 2 Ratu
Abung, SD Negeri 2 Trimodadi and SD Negeri 1 Ratu Abung. The data used on this research is
the students‟ acceptability toward the developed product, the data on the students‟ learning
interest, the data on the effectiveness of generated product. The instrument used in developing this
product is questionnaire and observation. The technique of analysis used to calculate the pulse
uses T-test with 5% level of significance.
Results and Discussion
Based on the steps of the developmental research to generate product that has been done,
thus it is obtained a final product in the form of developing learning facilities of Physical Education,
Sports, and Health to improve students‟ learning interest in Elementary School. The use of product

552
Public Health Department, Faculty of Sports Science, F1 Building, 2nd
Floor, Sekaran Campus Gunungpati, Semarang City, Central Java Province, Indonesia, 50229 Phone/ Fax. +6224 8508007
modified model on basket ball subject matter has given the impact or influence to the increase of
the students‟ pulse for SDN 2 Trimodadi 58.93%, SD N 2 Ratu Abung 63.51% and SD N 1 Ratu
Abung 66%.
Students‟ responses toward the internal aspect after using the development of learning tool
of Physical Education, Sports, and Health to improve students‟ learning interest in Elementary
School indicate that of 66 students , including in internal category of the students who answer
“Yes” 97.63% and students who answer “No” 2.37%. Seen from the result of students‟ response
toward the internal aspect after using the learning tool above , it can be concluded that most of the
students will have encouragement on the basis of awareness on the benefit of joining Physical
Education, Sports, and Health subject matter, interest of curiosities to conducted Physical
Education, Sports, and Health lesson, and like the safety and comfort while joining Physical
Education, Sports, and Health lesson, improve activity in learning process. Therefore, after
students join Physical Education, Sports, and Health lesson, the students‟ fitness increases. They
get the attention and pleasure in Physical Education, Sports, and Health learning process.
The students‟ responses toward external aspect after using developmental product of
learning tool for Physical Education,Sports, and Health to improve students‟ learning interest in
Elementary School indicate that of 66 students, it is found that 91.53% of students answer “Yes”
and 8.47% of students answer “No”. Seen from the result of students‟ response on internal aspect
after using the development of learning tool for Physical Education, Sports, and Health to improve
the students‟ learning interest in Elementary School that the quality and quantity of the facilities
and infrastructures support the learning process very much, then with the existing facilities and
infrastructures, all of the material can be taught and students are pleased by the tool used. Then
the factor of professional teacher of Physical Education, Sports, and Health is very helpful in
learning process.
Based on the description of students‟ respondent toward internal and external factors above,
it can be concluded that the developmental product of learning tool for Physical Education, Sports,
and Health to improve students‟ learning interest in Elementary School provides a good impact on
the students‟ interest in joining Physical Education, Sports, and Health learning and is able to
improve the students‟ pulse so that it will influence to the improvement of students‟ physical fitness.
Closing
The result of this research is the form of a developmental learning tool for Physical
Education, Sports, and Health to improve students‟ learning interest in Elementary School. The
result of a developmental learning tool for Physical Education, Sports , and Health can improve
the students‟ pulse so that it is found that the effectiveness of learning Physical Education, Sports,
and Health through basket ball game. The average of pulse increase in SDN 2 Trimodadi is
58.93%, SDN 2 Ratu Abung is 63.51% , and SDN 1 Ratu Abung is 66%. The development of
learning tool for Physical Education, Sports,and Health can improve students‟ learning interest in
Public Health Department, Faculty of Sports Science, F1 Building, 2nd
Floor, Sekaran Campus Gunungpati, Semarang City, Central Java Province, Indonesia, 50229 Phone/ Fax. +6224 8508007
553
Elementary School with the average increase on internal factor 97.63% on option “Yes” and 2.3%
on option “No” meanwhile on external factor it is 91.53% on option “Yes” and 8.4% on option “No”.
For Physical Education, Sports , and Health teachers in Elementary School ,they can use
this developmental learning tool at school in various learning ,for example volley ball, football,
badminton, takraw, high jump, and pull up. The researcher hopes that in using the learning tool for
Physical Education, Sports, and Health needs to be accompanied with appropriate learning
method. For Physical Education, Sports, and Health teachers in Elementary School it is hoped to
develop other interesting learning tools to be used in Physical Education, Sports, and Health
learning.
References
Borg, Walter R. dan Gill, Meredith, Damien. (1993). EducationalResearch: An Introduction Fourth
Edition. New York: Longman Inc
Chunlei LU and Amanda De Lisio. 2009. Specifics for generalists: Teaching elementary physical
education. International Electronic Journal of Elementary EducationVol.1, Issue 3, June,
2009.http://www.iejee.com/1_3_2009/lu.pdf (29-3-2013)
Erlina Listyarini. Modification Of Learning In School Soccer. Yogyakarta State University.
http://staff.uny.ac.id/sites/default/files/131791768/MODIFICATION%20O%20LEARNING%20IN%2
0SCHOOL%20SOCCER.pdf
Harvey Grout and Gareth Long. 2009. Improving Teaching andLearning in Physical
Education.New York. Open University Press
Michigan. 2005. Tips and Tools To Promote Physical Education And Physical Activity.Amerika
Serikat:
http://www.michigan.gov/documents/mde/TipsandToolsToPromotePEPA 290404_7.pdf
Mudjiono dan Dimyati. (2002). Belajar dan Pembelajaran. Jakarta: Rinieka Cipta.
Oemar Hamalik. (2007). Proses Belajar Mengajar. Bandung: Bumi Aksara
Rusli Lutan. (2002). Menuju Sehat Bugar. Jakarta Pusat: Dirjen Olahraga, Depdikbud.
Sukintaka. 2001. Teori Pendidikan Jasmani. Solo: EsaGrafika
Suryobroto, B. 2004. Manajemen Pendidikan Sekolah. Jakarta: PT Renika Cipta
Sutrisno Hadi. (1990). Analisis Butir untuk Instrumen Angket, rest dan Skor Nilai dengan Basica.
Yogyakarta: Andi Offset.
Toho Cholik Mutohir. 2002. Gagasan-gagasan tentang Pendidikan Jasmani dan Olahraga.
Surabaya: UNESA.
Undang Undang Republik Indonesia No 20. 2003. Sistim Pendidikan Nasional. Jakarta: Asa
Mandiri.
554
Public Health Department, Faculty of Sports Science, F1 Building, 2nd
Floor, Sekaran Campus Gunungpati, Semarang City, Central Java Province, Indonesia, 50229 Phone/ Fax. +6224 8508007
THE DEVELOPMENT OF SPORT THROUGH EXTRACURRICULAR IN THE SECONDARY SCHOOL
Muh. Mariyanto
Semarang State University, Indonesia
Corresonding Author:
Abstract The development of sport education is aimed to get knowledge, personality, ability, health,
and fitness of body and also to develop sport interest and talent. It is done as a systematic unity that is related to the national education system. It is done by doing an intracurricular or extracurricular. (Paragraph 5 of government regulation No. 16 of 2007 in implementation of sport)
In order to create an extracurricular policy well, it is needed to observe students‟ condition andpotential and also potential of the school. Especially, in the development of sport, it should have an accurate study about that. After policy of extracurricular activity is created, the next step is to dig up and support students‟ potential and school‟s potential, so the development of sport operationally can be done well.
Extracurricular is an activity that is done by students in outside the activity of the normal curriculum of school or university education. Extracurricular activities exist at all levels of education, from elementary until collage.(wikipedia, free encyclopedia).
The problems are whether extracurricular activities which are related to motor skills or sport at school age can be performed continuously. Participation of children who follow the current activity can be more in the same age of few years ago or a few years to later. Then, whether the existing data can be used to create an accurate policy to determine extracurricular activities in the next generation.
Keywords: Extracurricular, sport
Introduction
Based on explanation of constitution of Indonesia No. 3 of 2005 on System of National
sport Roman 1, the general statement stated that by this law, the national sport system of
coaching and development, basically there is a coaching and development of sport which is begin
with the stage of introducing of the sport, monitoring and guiding , and also development of talent
and improvement of performance. Those stages are aimed to make massive, civilization,
prospect, and development of talent and also improvement the performance at local, national,
and international level. All stages involve elements of the family, associations, educational units,
and sports organizations in society, both at local and central levels. Furthermore, the Government
Regulation (PP) of the Republic of Indonesia Number 16 of 2007 on the implementation of sports
Chapter I General Provisions, paragraph 1, article 2: Instructor of the sport is a person who has an
interest and knowledge, leadership, managerial ability, and or funding dedicated to the benefit of
coaching and sports development.
The government regulation, in part three on coaching and developing sport education
paragraph 2: (1) coaching and developing of sport education is aimed to obtain knowledge,
personality, ability, health and fit and also development of interest and talent (2) Coaching and
Public Health Department, Faculty of Sports Science, F1 Building, 2nd
Floor, Sekaran Campus Gunungpati, Semarang City, Central Java Province, Indonesia, 50229 Phone/ Fax. +6224 8508007
555
developing sport education as sated at article (1) can be done through activities like intracurricular
or extracurricular.
The extracurricular activity is tended to students to develop their personality, talents, and
abilities in every field beside the academic field. This activity is held independently by school and
the students to pioneer the activities non- school activity. The extracurricularactivity can be a form
of arts activity, sports, personality development, and other activities which is aimed to make
positive activity to develop students. (Wikipedia the free encyclopedia).
Sport Extracurricular
For children or students, generally they have time to develop their personality, at this time
the children want to form a habit to achieve success or to make a creative period. And in this age
many children have an interest to play something or a playing period. So, it is not a surprising if at
the age of children of Secondary School (SLP), there are still many desires to perform motor
activity after school. Those who have an interest in motor activity, sports or activities that are still
related to physical education in school, then school is required to provide a place or facilities to
their participation in the activity or sport. If there is no facility, then they will turn their attention to
other types of activities.
The fact shows that many boys and girls have the opportunity to participate in sports
exercises even they want to participate in competition as their choice. This condition indicates that
the students need a help from others to achieve their goals. In thisprocess, the students have the
opportunity to growth and to fulfill the personal needed by communication to the teacher or
instructors who are expected to provide guidance. Parents generally support someactivities which
are conducted outside of the classroom or in regular class as well managed. There are several
activities that are offered in schools in each area or region. The time is taken in late afternoon,
when school hours are over, could start at 14.30 at noon or 15.30 in late afternoon.
Even in the days close to holiday or in the end of vacation there will be joint activities, which
are provided in one day in every period of the school for all students who want hiking, jogging, or
camping. The emphasis of those activities are on the learning activity, improve skills, or informal
participation.
The instructor or trainers are physical teachers or teachers of other subjects who are
interested and have the skills in school, even though they teach other subjects than physical
education. The instructors have the capacity and resource that can trigger a sense of group. Group
formed when members of both instructor and students try to think and act as one entity. An
instructor is seen as a central on transforming the individual into the group, whichis the unity of the
team. By developing and managingthe relationship between instructor/teacher and student in
school in joining school competition for school sports or student‟s week sport, also observe the
regulations that are applied from the association of sport.
556
Public Health Department, Faculty of Sports Science, F1 Building, 2nd
Floor, Sekaran Campus Gunungpati, Semarang City, Central Java Province, Indonesia, 50229 Phone/ Fax. +6224 8508007
Administration and operational extracurricular programs are depending on the physical
teachers in schools. Although physical teachers are busy with this program, but usually it is a
voluntary time contributions and energy. And sometimes teachers of other subjects who are
interested in the sport will help in being a leader, coaching, or organizing teams. The students
often try to keep the program run. To illustrate the nature of the participation they use a model that
aim to identify and determine the nature of the relationship between the coach and athlete or
teacher and student, and there is a facility to evaluate the relationship. The relationship is defined
as a situation between two people who have 'feelings, cognition and behavior causal. The feeling
among members indicated the presence of mind, behavior and interconnection between members.
Lack of facilities and equipment that suffered the development programs or sports coaching
will limit the extracurricular activity. In addition, many school administrators are apathetic towards
extracurricular activities, although some principals support when they know the sport in the late
afternoon is a way to reduce juvenile delinquency. There is a balance between the needs and
independence which fluctuates in activity and time. Strong emphasis on extracurricular program
can imbed the availability of infrastructure or facilities and staff to take part so the extracurricular
activities can be performed well.
Based on school classification, there are some school which have a lot of sport clubs but
the others only have a few sport club. And schools in rural area have two to five teams that
competed in the holiday against similar teams from other schools, it was a friendly match. The
schools strive or struggle to get into the inter-school competition of large-scale, such as the student
sports week.
In order to provide maximum benefit and minimum risk to the body, then the exercises can
be done by true recommendation, that is the "FITT": The frequency, indicating the amount of
exercise that should be done, it is suggest that 3 to 5 times a week. Intensity, indicate the size of a
lighter or burden of severity that is carried out during the exercise. Types refer to the form / variety
of activities that is taken. Time, refer to how the length of time the exercise takes. Length and
intensity of exercise have correlation (Giam& Tea, 1993). Team to get success beside should have
the support and guidance from the instructor, they also should get support, attention, help and trust
from teammates. All athletes are participating personally, like each other, trust, and
interdependent.
Cost for operational activities derived from participating fees or who follow the games, the
schools which is supported by the donations of parents, and citizens who have capability to pay. In
some school systems, the trainer receives additional compensation for their service, or reduced
their teaching time during the competition. One school sports team can have 7 to 8 trainer. Some
small schools can only compete in individual sports, but the larger school and more famous can
have teams that play team sports and more sports up to 10. Sports trainer will lead the ongoing
extracurricular activities went well; he will be responsible for the progress of the students or
athletes. And the trainer also dare to apply knowledge and skills.
Public Health Department, Faculty of Sports Science, F1 Building, 2nd
Floor, Sekaran Campus Gunungpati, Semarang City, Central Java Province, Indonesia, 50229 Phone/ Fax. +6224 8508007
557
In the realization of result of coaching, besides the achievement as their goal, there are
also psychomotor, cognitive and affective goal. On cognitive aspects, coaching can develop
intelligence and creative imagination, whereas the affective aspects will make good
characterpersonality. Developing skills, which followed the development of intelligence can
understand and solve the problems of life, or can adapt to the situation. And the development of
creative imagination, that is learning initiative and creative in finding other alternatives. In the
development of character that is got a habit to do something based on the life principles to become
a principle of their personal development. The activity of physical teacher can develop motor
coordination in the form of skill or game. While coach can organize and manage training program
comprehensivelyincludes the elements of the physical components and personality which is
appropriate and necessary.
A Good trainer or teacher at school is a factor that can determine the achievement of
students and schools. The Terms of coach or teacher there are have a good personality, have
loyalty to duty, educated, professional, committed, a warrior and a devotee, health and have moral,
a stable emotion and others.
The Results that are expected by the coach in developing the students' extracurricular
activities that are there will be built physiological characteristics, psychological and sociological. At
physiological characteristics, it includes: (1). Better coordination of motion, (2). The Appearance of
body looks healthy and strong, (3). There is the difference in strength of muscle between boys and
girls. The results of this exercise make their heart more powerful. During activities that require
endurance, the large muscles of the body moves, blood circulation will be better, blood volume
increases, and the number of capillaries in the muscle also increase, so that the blood circulation
accordance to the level of activity.
In psychological characteristics include: (1). Feel proud of their own skills, (2). Expanding the
scope of attention, (3) Care to the group, (4). Want to get receive acknowledgementfrom the
teacher, (5). want to appreciate and uphold the meaning of punctuality. Students have the
discipline, attitude, diligent, efficient and beneficial to his development.
In the sociological character include: (1). Critic to adults and their actions, (2). Glad
appreciating by parents, (3). His temper is explosive, (4). Willing to do anything to be known by
others, (5). Increased sense of cooperation, and show he quality of his leadership., (6). Loyal to the
group or team. Despite the explosive emotions, students are expected to be in control, so they
have an emotional maturity that can support their improvement, especially to the confidence and
respect to others.
The implication of motor activity push on ; (1) Maximum participation; (2) the success of
each child; (3) understanding of human movement; (4) understanding the potential of the child; (5)
independent growth and (6) creativity. The exercises and sport situation can help individuals to
manage environment and their duties and also help the behavior according to the rule, obedience
the training and help their lifestyle management and development skills (Rejeski et al., 2003).
558
Public Health Department, Faculty of Sports Science, F1 Building, 2nd
Floor, Sekaran Campus Gunungpati, Semarang City, Central Java Province, Indonesia, 50229 Phone/ Fax. +6224 8508007
The effectiveness of extra-curricular sport activity system sporting is highly dependent on
the planning system. It means that the planning system is a process to prepare the things that will
be done in the future to achieve a predetermined goal. Therefore, a mature planning of
extracurricular activity systemis very necessary.
Planning extracurricular sports activities should be viewed as a tool that can help
leaders,coaches or teachers at school becomes more efficient in carrying the duties and functions.
The planning help to reach the target of students to follow the sport better, and give the opportunity
to easily controlled and monitored in its implementation. Thus, a systematic and systemic planning
program will make the program a coherent, integrated and sustainable.
References
Giam,C.K., & The C.K., 1993. IlmuKedokteranOlahraga, AlihBahasa; HertonoSatmoko, Jakarta, BinaRupaAksara.
http://id.wikipedia.org/wiki/Ekstrakurikuler
Mark R. Beauchamp., Mark A. Eys. 2007., Group Dynamics in Exercises and Sport Psychology., e-
Book. Routledge
Tom Martinek and Don Hellison. 2009., Youth Leadership in Sport and Physical Education., e-
Book. Palgrave Macmillan
Constitution of Republik Indonesia No. 3 on 2005 on National sport system, Jakarta : Biro
HumasdanHukumKementerian Negara PemudadanOlahragaRepublik Indonesia , 2007
Public Health Department, Faculty of Sports Science, F1 Building, 2nd
Floor, Sekaran Campus Gunungpati, Semarang City, Central Java Province, Indonesia, 50229 Phone/ Fax. +6224 8508007
559
SAFE EXERCISE GUIDELINES TO ACHIEVE AND MAINTAIN LIFE QUALITY OF THE ELDERLY
M. Irfan
State University of Medan, Indonesia
Corresponding Author: [email protected]
Abstract The number of elderly citizens in Indonesia in 2020 is expected to increase 11.34% or 28.8
million people. This fact should be taken wisely so that people who are in the elderly age are able to be independentand not considered as a burden by the family or other community groups. During this age, physical and mental decadence will happen such as as easily infected by disease, especially those degenerative ones. Sport can be used as the activity to anticipate the acceleration of that organism setbacks. Based on the results of a study even found that the 50% occurrence of these organisms setbacks due to lack of physical activity. The exercise which is done wisely, under the guidance of doctor's instructions and coaches is certainly safe and expected to maintain the physical fitness, so the daily activities can be done well without being a burden to family even though already become an elderly. Key Words: Sports, elderly. Introduction
The number of Indonesian population according to the Census of Population (CP) in 2010
was 237.6 million people. This large amount of the population consists of infants, children, adults,
and elderly. In addition, particularly, the number of the elderly according to Family Data Collection
conducted in 2010 by the National Family Planning Coordinating Board (BKKBN) found that the
number of elderly population in Indonesia was 15.5 million people. This number is predicted to
grow in the following years.WHO estimates that the elderly population in Indonesia in 2020 will
increase 11.34% or 28.8 million people. Therefore, Indonesia will be later predicated as a country
of the world's largest number of the elderly. This large number of elderly citizens should be
handled properly and wisely, so people who are on the elderly age are able to be independent and
not be regarded as a burden to the State or other community groups.
Getting old is not merely a goal, the real goal of becoming old is how one can live up to the
elderly age with good quality of life. Exercise activity is an activity that can help improving the
quality of mental and physical function along with the changing of age into the elderly age.
Naturally, as one enters the elderly age, the setbacks of physical and mental condition will
happen such as vulnerable to disease, especially degenerative diseases. However, exercise
activity done by the elderly will not be harmful if done properly and wisely. The physical fitness of
people who are in the elderly age is somehow very low. Therefore the frequency of the exercise
done at moderate to sub-maximal level will be safe and this can also improve the physical fitness.
(Giant, 1993). Although organism setbacks happen during the elderly age, in fact that the 50% of
the organisms setbacks occurred due to lack of physical activity. (Giant, 1993).
560
Public Health Department, Faculty of Sports Science, F1 Building, 2nd
Floor, Sekaran Campus Gunungpati, Semarang City, Central Java Province, Indonesia, 50229 Phone/ Fax. +6224 8508007
Based on the explanation above telling that exercise activity can have a positive impact on
the quality of life of the elderly, this paper will discuss about how exercise can be done safely by
the elderly. The quality of life that is expected to be achieved with exercising for the elderly is
certainly to improve physical fitness, physical and mental health so they can avoid from counting
on others in carrying out the activities of the daily life and they can enjoy a happy life.
Discussion
Concept and changes in organisms in the elderly age
Elderly age is the period in which a person has reached old age in proportion and function
and has shown deterioration over the time. There are several opinions regarding to the age
rioration, they are 60, 65 and 70 years old (Akhmadi, 2009). WHO uses the chronological elderly
limits which are at the age of 60 years and above. This is done by WHO as a benchmark standard
in formulating the policies of health problems and therefore, the Indonesian law (UU.RI) No. 13,
1998 states that a person enters the elderly age when he is 60 years old and above.
In concept, what is called by elderly or aging is a decrease in the DNA recovery activity, gene
expression (aging gene activation), the decrease of immune system activity (particularly the
thymus), the decease of brain cells, the release radical activity (causing irreversible cell damage),
cells divide only a few times (cessation of the internal clock) (Nieman, 1989). These changes
further impact on such as body composition changes so that the size and number of muscle fibers
are reduced due to the protein reduce, the increase of fat amount, lung function reduce, cardiac
muscle strength and quality of bone density decrease (Strauss, 1984)
Brooks (1985) suggests changes that occur in an organism which is the impact of the aging
process for each individual namely; In the elderly age, it occurs muscle contraction
(musculoskeletal) while the increase in the amount of fat also happens. As age increases, there
will be fat accumulation, mainly around the torso (truncus) and around internal organs. Muscle loss
caused by PH decrease in muscle cells thus affects blood distribution to the muscles. Furthermore,
this what makes the muscles become stiff, strength reduce, and it also occurs the decrease in
nerve conduction velocity to muscle. Moreover, cell mitochondrial which functions to produce
adenosine triphospat (ATP) decreases in number, the muscle is susceptible to fatigue.
As bone mineral mass and joint flexibility reduce, it results in osteoporosis which causes in a
high risk of fractures. Kiposis occurs (due to decreased height slouch) (see figure). For men, bone
mass will begin to decrease approximately 1% per year when it enters the age of 50, while women
begin to lose bone mass at a younger age which is at the age of 30, with a decline rate of 2-3% per
year after the menopause. Furthermore, this problem affects the reduce of Range of Motion (ROM)
of the joint which results in the movement which becomes limited.
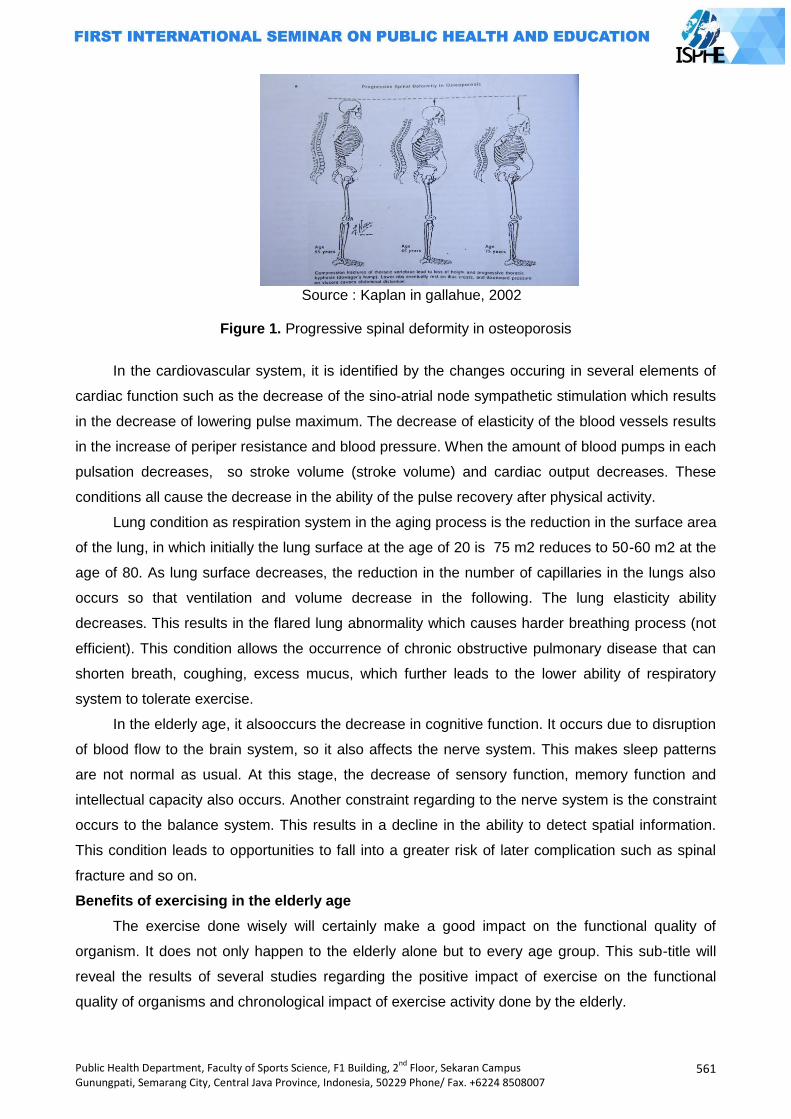
Public Health Department, Faculty of Sports Science, F1 Building, 2nd
Floor, Sekaran Campus Gunungpati, Semarang City, Central Java Province, Indonesia, 50229 Phone/ Fax. +6224 8508007
561
Source : Kaplan in gallahue, 2002
Figure 1. Progressive spinal deformity in osteoporosis
In the cardiovascular system, it is identified by the changes occuring in several elements of
cardiac function such as the decrease of the sino-atrial node sympathetic stimulation which results
in the decrease of lowering pulse maximum. The decrease of elasticity of the blood vessels results
in the increase of periper resistance and blood pressure. When the amount of blood pumps in each
pulsation decreases, so stroke volume (stroke volume) and cardiac output decreases. These
conditions all cause the decrease in the ability of the pulse recovery after physical activity.
Lung condition as respiration system in the aging process is the reduction in the surface area
of the lung, in which initially the lung surface at the age of 20 is 75 m2 reduces to 50-60 m2 at the
age of 80. As lung surface decreases, the reduction in the number of capillaries in the lungs also
occurs so that ventilation and volume decrease in the following. The lung elasticity ability
decreases. This results in the flared lung abnormality which causes harder breathing process (not
efficient). This condition allows the occurrence of chronic obstructive pulmonary disease that can
shorten breath, coughing, excess mucus, which further leads to the lower ability of respiratory
system to tolerate exercise.
In the elderly age, it alsooccurs the decrease in cognitive function. It occurs due to disruption
of blood flow to the brain system, so it also affects the nerve system. This makes sleep patterns
are not normal as usual. At this stage, the decrease of sensory function, memory function and
intellectual capacity also occurs. Another constraint regarding to the nerve system is the constraint
occurs to the balance system. This results in a decline in the ability to detect spatial information.
This condition leads to opportunities to fall into a greater risk of later complication such as spinal
fracture and so on.
Benefits of exercising in the elderly age
The exercise done wisely will certainly make a good impact on the functional quality of
organism. It does not only happen to the elderly alone but to every age group. This sub-title will
reveal the results of several studies regarding the positive impact of exercise on the functional
quality of organisms and chronological impact of exercise activity done by the elderly.
562
Public Health Department, Faculty of Sports Science, F1 Building, 2nd
Floor, Sekaran Campus Gunungpati, Semarang City, Central Java Province, Indonesia, 50229 Phone/ Fax. +6224 8508007
Skeletal muscle strength can be improved through exercise activity, with doing exercise,
quality of bone density and strength will be better in the elderly, so fractures due to osteoporosis
can be prevented. By exercising, it will decrease the incidence that may cause hip fractures for the
elderly (Megan, 2008). Westcott, WL, and Baechle, TR, quoted by EriDesmariniNasution (1999)
states that sports activities can avoid losing muscle strength by doing regular strengthening
exercises.
Moreover, it can replace a large number of muscles that are reduced in a relatively short time
through a simple strengthening exercise program. This was revealed by the research. Average of
the elderly respondents aged 61 to 80 years after completing my strength training for 2 months,
they could add their weight muscle by 2.4 pounds, even after the participants continued the
exercise program for 18 months, they could gain muscle to 5 pounds and reduce 17 pounds of fat.
Sports activities can be used as a program to address the problem on joint movement
capabilities with flexibility exercises. Flexibility exercises provide a great opportunity to make the
movement so that the power and flexibility of tendons and ligaments can be maintained.
Maintaining muscle strength across the joints can reduce pain in osteoarthritis cases so Range of
Motion of the joint (ROM) can be maintained. Joints have very important role in performing the
movement as if the joints cannot be moved in accordance with the broad movement (ROM), then
the movement will be stiff.
The role of exercise activity is huge in keeping the possible causes of death from
cardiovascular disease. According to the Biological http://digilib.unipasby.ac.id states that current
cardiovascular disease causing death are, stroke (40%) and coronary heart disease (15%).
Activities undertaken by the wise exercise can lower blood pressure, reduce the fat content of the
blood vessels, LDL, triglycerides and increase HDL cholesterol, and accelerate recovery after
physical activity, helps restore cardiac abnormalities as well as the recovery program after
myocardial infarction. Sri Hartini Research (2009) in http://download.portalgaruda.org suggests that
elderly gymnastic imposed in elderly smokers can lower blood cholesterol levels between 28-43
mg / dl. In addition, not only it improves the condition of the cardiovascular system, the exercise
activity can prevent osteoporosis to the sternum, recover respiratory muscles, and improve the
immune system.
Exercise activity in older adults could prevent or slow the loss of cognitive abilities. (Craven
&Heirnly in Darmojo, 1999). The impact of exercise activity can increase blood flow to the brain
and improve brain neurotransmitters. This also improves the mod, and the ability of dealing with
stress and depression. Furthermore, exercise activities undertaken by the elderly will create a
situation of social interaction. Social interaction that occurs will be very helpful for the elderly to
improve and enhance the ability of mod in dealing with stress and depression. Condition of
capabilities in facing stress and depression in the elderly age is needed because at this time the
possibility of stress and depression are very likely to occur due to the loss or deterioration of pre-
existing conditions such as the inclusion of retirement, loss of a spouse, and so on.
Public Health Department, Faculty of Sports Science, F1 Building, 2nd
Floor, Sekaran Campus Gunungpati, Semarang City, Central Java Province, Indonesia, 50229 Phone/ Fax. +6224 8508007
563
Sports activities can help decreasing brain power on the elderly age, the more exercise the
sharpness of mind will also be improved. And, it naturally increases the feeling of happiness and
boosts self-confidence (MOH, 2000). Barclay (2006). http://search.medscape.com/usclient/ederly
explained that, regular exercise performed three times a week can prevent dementia 40% with a
confidence level of 95% CI = 0.44 to 0.86 with P = 0.004 showed significant correlation between
regular exercise performed and delaying the occurrence of dementia in the elderly age with the
pattern of training activities undertaken as walking, aerobic gymnastics, swimming and cycling.
Sidiarto et.al (2003) stated in his study that, the variance of exercises of a certain pattern of
range of motion that is aimed as an exercise to maintain cognitive function by identifying the Mini
Mental State Examination examination (MMSE) in elderly age indicates that there is a significant
correlation between the pattern of motion referred to cognitive abilities. Syamsul (2006) states that,
statistical calculation results with the chi square test found that there is a significant relationship
between exercise activity and cognitive abilities of elderly age (p value = 0.002). It can be
concluded that the elderly who exercise with a good chance have the cognitive ability of 3.16 times
better than the elderly who exercise with less well.
Guidelines for safe exercise for the elderly
As previously mentioned above, indeed, exercise is very helpful for the elderly in maintaining
organism functions such as maintaining and maximizing the function of muscles, joints,
cardiovascular system, respiratory system and the cognitive abilities. Jeffry Tenggara (2009)
suggested that regular exercise activity does have a good effect to improve the health of the
elderly, but erroneous physical activity would lead to greater risk than the benefits achieved.
Generally, the further discussion will reveal the dose of exercise, type of exercise (sports), and the
things that should become the concern in order to make the exercise program followed completely
safe and positive for the elderly.
Dose of exercises refers to the frequency, duration and intensity. How many sports activities
done within one week is termed the "frequency". Frequency of exercise in the elderly can be done
at least 3 times per week (dawn in: http://staff.uny.ac.id) .Giant CK & The KC, (1993) stated that
the frequency of exercise to improve and maintain physical fitness at least performed 3 to 5 times
per week (every other day, three times a week.
How long will it be done a sport activity is termed as a "duration". To improve physical fitness
for the elderly takes 20-60 minutes / session for each exercise and the exercise results will appear
after 8-12 weeks and will be stable after 20 weeks (Agussupri, 2004).
How hard sport activity undertaken is called the "intensity". Intensity indicates the degree of
training quality. Exercise intensity is measured by the increase of heart rate. To determine the
intensity of exercise, the easiest way is; firstly, determine the maximum heart rate (maximum
pulse) per minute. To measure maximum per minute heart rate, it uses the 220 minus age formula.
Next, to determine high or low intensity of an exercise that will be applied is to determine the
percentage of maximum heart rate (maximum pulse). For clearer explanation, the concept of
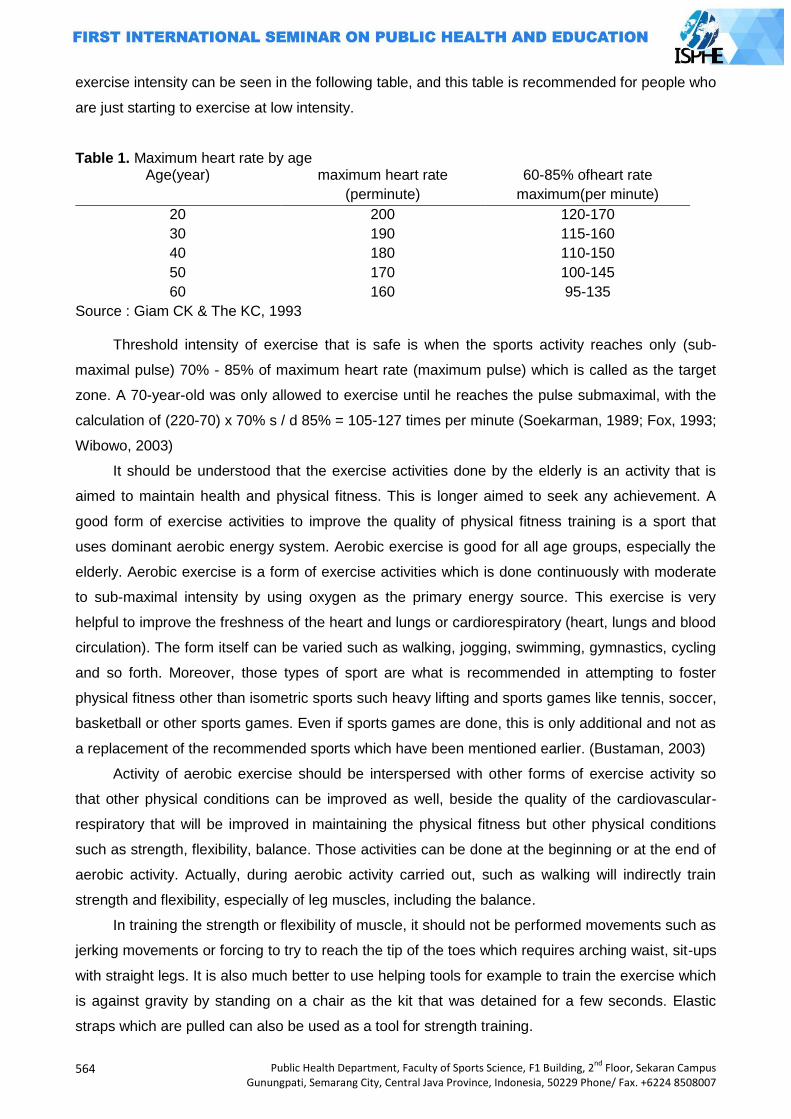
564
Public Health Department, Faculty of Sports Science, F1 Building, 2nd
Floor, Sekaran Campus Gunungpati, Semarang City, Central Java Province, Indonesia, 50229 Phone/ Fax. +6224 8508007
exercise intensity can be seen in the following table, and this table is recommended for people who
are just starting to exercise at low intensity.
Table 1. Maximum heart rate by age Age(year) maximum heart rate
(perminute)
60-85% ofheart rate
maximum(per minute)
20
30
40
50
60
200
190
180
170
160
120-170
115-160
110-150
100-145
95-135
Source : Giam CK & The KC, 1993
Threshold intensity of exercise that is safe is when the sports activity reaches only (sub-
maximal pulse) 70% - 85% of maximum heart rate (maximum pulse) which is called as the target
zone. A 70-year-old was only allowed to exercise until he reaches the pulse submaximal, with the
calculation of (220-70) x 70% s / d 85% = 105-127 times per minute (Soekarman, 1989; Fox, 1993;
Wibowo, 2003)
It should be understood that the exercise activities done by the elderly is an activity that is
aimed to maintain health and physical fitness. This is longer aimed to seek any achievement. A
good form of exercise activities to improve the quality of physical fitness training is a sport that
uses dominant aerobic energy system. Aerobic exercise is good for all age groups, especially the
elderly. Aerobic exercise is a form of exercise activities which is done continuously with moderate
to sub-maximal intensity by using oxygen as the primary energy source. This exercise is very
helpful to improve the freshness of the heart and lungs or cardiorespiratory (heart, lungs and blood
circulation). The form itself can be varied such as walking, jogging, swimming, gymnastics, cycling
and so forth. Moreover, those types of sport are what is recommended in attempting to foster
physical fitness other than isometric sports such heavy lifting and sports games like tennis, soccer,
basketball or other sports games. Even if sports games are done, this is only additional and not as
a replacement of the recommended sports which have been mentioned earlier. (Bustaman, 2003)
Activity of aerobic exercise should be interspersed with other forms of exercise activity so
that other physical conditions can be improved as well, beside the quality of the cardiovascular-
respiratory that will be improved in maintaining the physical fitness but other physical conditions
such as strength, flexibility, balance. Those activities can be done at the beginning or at the end of
aerobic activity. Actually, during aerobic activity carried out, such as walking will indirectly train
strength and flexibility, especially of leg muscles, including the balance.
In training the strength or flexibility of muscle, it should not be performed movements such as
jerking movements or forcing to try to reach the tip of the toes which requires arching waist, sit-ups
with straight legs. It is also much better to use helping tools for example to train the exercise which
is against gravity by standing on a chair as the kit that was detained for a few seconds. Elastic
straps which are pulled can also be used as a tool for strength training.
Public Health Department, Faculty of Sports Science, F1 Building, 2nd
Floor, Sekaran Campus Gunungpati, Semarang City, Central Java Province, Indonesia, 50229 Phone/ Fax. +6224 8508007
565
In addition to those described in the previous sections, the elderly who want to under go
exercise training program should consider the following things as well: (1) Consultwith a physician
before undergoing the exercise program, especially if suffering from certain diseases, such as
hypertension and so on; (2) If the painarises during exercise in left chest stop exercise and
immediately consult a doctor; (3) Do the warming up before the activity, the warming upactivity
may be in the form the strength or flexibility exercises; (4) Drink enough water so tha tthe balance
of fluids in the body remains in an ideal capacity; (5) Progression of the exercise done must be
reasonable, it isrecommended for the presence of as ports consultant who is really competent; (6)
Wear loose clothing with good material that absorbs weat; (7) Wear athletic shoes can reduce the
pressure of the movements done while doing sport activity; (8) Principally,exercise can be done
anytime, butin this case it is recommended if exercise is done in the morning when the air is still
clean.
Closing
Advanced age is a great gift from the Almighty. Increasing age means more opportunities to
be more useful for many people, getting the chance to experience, witness the joy of life. Thanking
God for the gift with establishing and maintaining fitness and health condition by doing the exercise
wisely. This wise exercise makes the quality of life until reaching old age so it won‟t turn into a
burden for the people around.
References
AgusSupriyanto, 2004. Olahraga untuk Kebugaran dan Kesehatan,Jakarta: JurnalNasionalPendidikanJasmanidanIlmuKeolahragaan Volume3,Nomor2,Agustus
Akhmadi, 2008.MenjagaKesehatanLanjutUsiaAgarTetapPrima.Yogyakarta: FKUGMhttp://akhmadi.multiply.com/journal/item/10
BrooksdanFahey, 1985.ExercisePhysiologyHumanBioenergeticsanditsApplications.NewYork:Macmillan PublishingCompany.
Bustaman, A, 2003.PembinaanKesegaranJasmaniUntukLanjutUsia. Jakarta.PTRajaGrafinsoPersada.
Darmojo dan. Martono,1999.Buku Ajar Geriatri(IlmuKesehatanUsiaLanjut). Jakarta: balaiPenerbitFKUI
Depkes RI, 2000, PedomanPerawatanKesehatanUsiaLanjut. Jakarta, DepKes DirektoratBinaKetahananKeluargalansiadanRentan BKKBN.2012.
PembinaanFisikBagiLansia.Jakarta EriDesmariniNasution, 1999.KembaliBugarsetelahLimaPuluh.(TerjemahandariWestcottWayne L.
danBaechleThomas R.). Jakarta: PT RajaGrafindoPersada. FajarSriwahyuniati. MenjagaKesehatan Dan
KebugaranBagiLansiaMelaluiBerolahraga.http://staff.uny.ac.id Gallahue.&Ozmun, 2002. Understanding Motor Development (Infants, Children, Adulescents,
Adults). New York: Published by McGraw-Hill, a business Unit of The McGraw-HillCompanies.Inc.
Giant CK danTehKC., 1992.Sport Medicine, Exercise and Fitnes . PG Publishing : Singapore.http://digilib.unipasby.ac.id
http://search.medscape.com/usclient/ederly JeffryTenggara, 2009.ElderlyExercise-OlahragauntukLanjutUsia,BagianI.Jakarta: FKUI-RSCM.
http://www.dennysantoso.com/elderly-exercise-olahraga-untuk-lanjut...
566
Public Health Department, Faculty of Sports Science, F1 Building, 2nd
Floor, Sekaran Campus Gunungpati, Semarang City, Central Java Province, Indonesia, 50229 Phone/ Fax. +6224 8508007
Megan Johnston, 2008. Participation of Eldery in Cardiac Rehabilitation: Exercise Consideration for the Eldery. Current Issue in Cardiac Rehabilitation and prevention, Vol.16, No.3:1-3.
Syamsul Anwar, 2006. AnalisisHubunganDukunganSosialdanOlahragaTerhadapKemampuanKognitifLanjutUsia diPantiSasanaTresnaWerda Budi Mulia DKI Jakarta. Tesis:Jakarta.UI. Program PascasarjanaIlmuKeperawatan
Sidiarto. K., Sidiarto L., Samino, Munir, Nugroho, 2002. KiatPanjangUmurdenganGerakdanLatihOtak, Jakarta, AAZI
Sri hartini, 2009. EfektivitasSenamLansiaTerhadapPenurunanKadar KolesterolDarahPadaLansiaMerokokDiDusunPirakMertosutanSidoluhurGodeanSlemanYogyakarta Tahun2009http://download.portalgaruda.org
StraussRH,1884. SportsMedicine.Philadelpia; WBSaunders,p.278. Prima,2008.LansiaHarusTerusLakukanGerakBadan.http://www.waspada.co.id/index2.php?option
=com_content&do_pd... Wibowo,H,2003.LanjutUsiadanOlahragadalamPerkembanganOlahragaTerkiniKajianParaPakar.Jak
arta. PTRajaGrafindoPersada.
Public Health Department, Faculty of Sports Science, F1 Building, 2nd
Floor, Sekaran Campus Gunungpati, Semarang City, Central Java Province, Indonesia, 50229 Phone/ Fax. +6224 8508007
567
THE ROLE OF COACH'S LEADERSHIP STYLE IN ACHIEVING THE SPORT ACHIEVEMENT
Komarudin
Yogyakarta State University, Indonesia
Corresponding Author:
Abstract Achieving an achievement in the field of sports is basically an accumulative result of various
aspects / elements that support the realization of achievement. This paper highlighted some issues especially regarding the function of the coach as a leader, who led the athletes in order to achieve the highest achievement. The function of a coach as a leader is interesting to be studied and evaluated, because one of the main keys to the success of the athlete is the ability of a coach to lead his athletes.
Coach is a leader who gained the confidence to command or give instruction to the athletes who have given him credence to achieve certain goals that is the achievement. The role of the coach as a team leader in micro can affect morale, satisfaction and quality of life of the athletes, the athlete 's success ultimately will affect the macro-level team performance because the behavior of a team is strongly influenced by the behavior of each Individual in the team.
A leader or coach, as an Individual should have a high skill level in accordance with the duties which they are responsible. The rationale is that leadership is a situation or circumstance that is special and unique, for which he should be able to adjust to the cırcumstances / situation. A successful leader in a particular situation with his leadership style may not work in other situations, so he had to adjust his leadership style to the situation at hand (be flexible).
Key words: coach's leadership style, national sports, and achievement Introduction
In the reformation era nowadays, looking for an appropriate leader is not easy. It is due to the
fact that most of professionals available now are not ready yet to be a wise leader. This also
happens in the national sports world, in which most of the coach as the team leader may have high
education, but they do not have enough experience, or on the contrary, they have lots of
experiences without high education. Those imbalances, for a coach, can cause a very significant
effect towards the harmony and performance or achievement of the team he leads.
Achieving an achievement in the field of sport is basically an accumulative result of various
aspects / elements that support the realization of achievements. The main problem in this paper is
about the function of a coach as a leader, who leads his athletes in the means of achieving the
highest achievements. The function of a coach as a leader is interesting to be studied and
evaluated, because one of the main keys in the athletes‟ success is on the ability of the coach in
leading his athletes.
This case is reflected from the interaction happens in the field. Brooks and Fahey (1984)
state that a coach has duties as a planner, leader, friend, advisor, and the controller of the
rehearsal program. Whereas an athlete has a duty to do the rehearsal based on the program
determined by the coach.
568
Public Health Department, Faculty of Sports Science, F1 Building, 2nd
Floor, Sekaran Campus Gunungpati, Semarang City, Central Java Province, Indonesia, 50229 Phone/ Fax. +6224 8508007
There are some approaches done by a coach in realizing the program arranged, such as
through the style which is a way of working that is usually done as someone‟s special
characteristics (logman: 1987). This paper tries to evaluate the coaches‟ style in performing their
duty as the team /athlete leader, in order to improve their achievements.
Leader, leadership and coach
A leader is someone who guides and leads an individual, group, and organization (Logman:
1987). Whereas leadership is a process of influencing people to lead their efforts for achieving
certain goals (Gibson and Hodgetts: 1986). Therefore, a leader is someone who does an activity or
a process of influencing people in a certain situation, through communication process, which is led
to achieve certain goals. A leader is also “a person who occupies a central role or position of
dominance and influence in a group” (Modern Dictionary of Sociology). Then Forsyth (1983) states
that leadership is a reciprocal process, in which an individual is allowed to influence and motivate
others to ease the achievement that is satisfying for both the groups and the individual‟s goal.
Coach is a leader who gained the confidence to command or give instruction to the athletes
who have given him credence to achieve certain goal that is achievement. The role of the coach as
a team leader in micro can affect morale, satisfaction and quality of life of the athletes, the athlete's
success ultimately will affect the macro-level team performance because the behavior of a team is
strongly influenced by the behavior of each Individual in the team.
Approaches in the leadership
Approach in leadership according to Chelladurai (1985) can be grouped into three main
groups, namely: (1) the approach related to the characteristics of the leader, (2) the approach with
regard to the behavior of the leader, and (3) the approach related to the characteristics and or
behavior of the leader in the context of considering the characteristics of the members and the
organization.
Leader’s traits approach
Leader‟s traits approach is to explain the performance differences of workers in terms of their
leader‟s traits, which are essentially related to the identification of a set of characteristics of a
person that would distinguish between a good or bad leader. Edwin Ghiselli in Handoko T (1991)
suggested the important traits for effective leadership are as follows: ability in his capacity as
supervisor (supervisory ability), namely with regard to the implementation of the basic functions of
management, especially regarding the direction and supervision of the work of others, the need for
achievement in work, which includes the issue of responsibility and desire to succeed, firmness
(decisiveness), the ability to make decisions and solve problems with a skilled, thoughtful, and
precise way, confidence, a view towards him which is able to deal with the problem, initiative, the
ability to act, including developing a series of activities and finding new ways or innovation.
Public Health Department, Faculty of Sports Science, F1 Building, 2nd
Floor, Sekaran Campus Gunungpati, Semarang City, Central Java Province, Indonesia, 50229 Phone/ Fax. +6224 8508007
569
Leader’s behavior approach
Chelladurai (1985) identifies leader‟s behavior in sport coaching consists of five dimensions,
namely: (1) training and instruction, (2) democratic behavior, (3) autocratic behavior, (4) the
behavior of social support, and (5) behavioral feedback / positive feedback or rewards.
Situation contingency approach
Leadership style behaviors depend on the situation factors or circumstances that are the
main reason in the performance difference. From the perspective of leadership system this
situation consists of leaders, members, and context-run organizations.
Fiedler‟s Contingency Model of Leadership.
Fiedler (1967: 36) pointed three important situational dimension factors that are believed to
affect the need or effectiveness of leaders, namely: 1) relationship of Leader - Member: describe
the influence and trust of the leader among his followers, 2) task Structure: describe the degrees,
in which the leader‟s work is programmed and arranged in detail, 3) leader‟s Position Power: the
authority given to the position of leader.
Situation is assessed in terms of favorable or not, when it is combined with task-oriented
leadership style it will be effective. If the favorable or unfavorable situation is only moderate, leader
type of human relationship or the tolerant and easy-going one will be very effective.
Multidimensional Model of Leadership
Various theories have been highlighted a lot about leadership, that is the leadership in terms
of perspective or different point of view, but the review was limited to the number of variables that
are considered relevant or appropriate. Leadership should be viewed from various perspectives
that are systematic. It requires a combination or a combination of various perspectives or
theoretical perspective in order to obtain a comprehensive insight in leadership. Chelladurai (1985:
158) in this case presents a multidimensional model of leadership or various dimensions, which
tries to integrate or merge the existing leadership theories.
Basically leadership model focuses on three leader behaviors, namely: (1) the needed
leader‟s behavior, (2) the preferred leader‟s behavior, and (3) the actual leader‟s behavior. These
three types define leadership behaviors that are classified into: a) the characteristics of the
situation, b) the characteristics of members, and c) the characteristics of the leader, and d) as a
result of the process of leadership behavior in this model is the appearance of the group and
member‟s satisfaction.
Coach's leadership style
Coach is a professional whose job is to help athletes and sports teams to improve and
enhance their performance. Because the coach is a professional, he is expected to provide
professional services in accordance with existing standards (Pate, RB. Mc.Clenaghan and Rotella:
1984).

570
Public Health Department, Faculty of Sports Science, F1 Building, 2nd
Floor, Sekaran Campus Gunungpati, Semarang City, Central Java Province, Indonesia, 50229 Phone/ Fax. +6224 8508007
A coach should regularly adjust to the latest developments, able to change or modify his
coaching practice. Such changes may occur if the coach: (1) have an understanding of the
principles established in each of the relevant science, (2) regularly seek new knowledge in sports
science. The coach does not have to be a real scientist but to be a professional, he should be an
active consumer of scientific information and apply it.
There are many styles of leadership with different ways in sport in order to realize or achieve
something to be achieved in order to succeed, for example, there is a coach whose style is cold
and indifferent to the athletes, some are warm and caring and some others are hard or soft.
The following will discuss the leadership style that is often done by coaches and leadership
techniques that can support the coaching process.
Authoriter style.
Authoriter leadership style generally has some characteristics: using the authority or power to
control athletes, ruling the athletes, acting in the ways influenced by inhumane feelings
(impersonal), trying to do things according to the self-beliefs or desires, giving sanction (penalty) to
the athletes who do not obey his orders, determine the distribution of tasks / work that should be
done, assessing the strength or condition of his ideas.
Researches show that authoriter leadership style is advantageous in certain circumstances.
Moreover, it also shows that this style is done especially if the speed and action are urgently
needed. In other words, if in a large group involving complex tasks, requiring action and rapid
decision making, the authoriter leadership style can also be used to make the athletes feel more
safe and protected in distressed situations. However, this authoriter leadership style has some
weaknesses, namely: There are more works to do, but it‟s lack in quality and The team members
tend to show the lack of member‟s satisfaction.
Democratic style.
Coaches who have this style generally have characteristics: Acting in a way that is friendly
and familiar, opening the team‟s opportunity as a unity in arranging plans, allowing the group or
team members to interact with other team members without asking for permission to the coach,
accepting suggestions and giving little instructions or commands to the team members.
Coaches who use the democratic leadership style particularly believe or sure that this style
will give something that is very effective for the development of athletes in terms of providing
independence to think and transfer / transfer the values of sport. The weakness of this style is in
terms of effective use of time and is less effective in making a quick decision.
In various leadership studies, it is proven that a leader should not hold or always tend to use
a particular leadership style that can be used in any levels in different situations. Many coaches
show a combination between authoriter and democratic leadership style to complete the strengths
and weaknesses possessed by these two styles.
Public Health Department, Faculty of Sports Science, F1 Building, 2nd
Floor, Sekaran Campus Gunungpati, Semarang City, Central Java Province, Indonesia, 50229 Phone/ Fax. +6224 8508007
571
Style that gives more attention to athletes (people centered).
Coaches who are focused more on the discovery of the athletes‟ personal need. In a
pleasant situation, it would be more effective if the coach apply a leadership style which gives more
attention to athletes. If the position of the ruler's power is strong enough, then the leader who is
concerned more on athletes would be more appropriate, that is in an effort to develop better
relationships with his athletes.
The advantages of people centered leadership style are: can reduce tension and anxiety, although
the task is not executed properly or lost in the match, can better communicate with the athletes
who are falter, restless, and feeling uncertain and can be more effective in a pleasant situation for
him, that is when the athletes need guidance in making decisions.
Style that emphasizes more on task (task-oriented)
Coaches who emphasize more on the task in their leadership style, tend to focus on the
achievement of victory in the competition. If the leader has the support of the group, the task is
clear, and has a lot of power then the task-oriented leadership style is more suitable. Similarly, in a
very unfavorable situation, as well as a leader who has a bad relationship with his members, the
task is unclear, and he has little formal power, then the task-oriented leadership style can also be
done. The strengths of task-oriented leadership style application are: more efficient, all efforts
directed to the task that should be performed, do not spend much time for private communication
with the athletes and among athletes, giving instructions quickly, decisively, and directly on the
tasks that should be executed and effective in a favorable or unfavorable situation for the leader,
for example, many athletes are stubborn, lack of discipline, and need decisive leadership.
Generally, the coaches who are very people centered, they too much emphasize on human
relationships, and less concerned on the high morale or team‟s success. The coaches who are
very task-oriented, they are negligent or failed to organize / solve interpersonal conflicts, because
they too much emphasize on the winnings. Therefore, coaches need to learn and adjust
themselves to the situations that fit between the style of people-centered and task-oriented.
Closing
A leader or coach, as the individual should have a high skill level in accordance with the
duties which they are responsible. The rationale is that leadership is a situation or specific and
unique circumstances, for which he should be able to adjust himself to any circumstance /
situation. A successful leader in a given situation with his leadership style may not work in other
situations, so he had to adapt his leadership style to the situation at hand (must be flexible).
The relation to the application of leadership styles in the means to achieve the maximum
achievement in sports, it can be concluded as follows: there is no coach‟s leadership style that can
be generalized, and is suitable to be applied at all times or at various situations, each coach's
leadership style will work well if it is done appropriately, in accordance with the needs and
572
Public Health Department, Faculty of Sports Science, F1 Building, 2nd
Floor, Sekaran Campus Gunungpati, Semarang City, Central Java Province, Indonesia, 50229 Phone/ Fax. +6224 8508007
characteristics of the situation, do not rivet on a particular coach‟s leadership style, a good coach‟s
leadership style is taking the positive things from each style, then combines and applies them to
the appropriate situation, no need to hesitate to combine various coach‟s leadership styles and if
the achievement does not work, it should be evaluated carefully and do not immediately blame the
coach‟s leadership applied.
References
Brooks, George A. and Thomas D. Fahey (1984), Fundamentals of Human Performance, New York : Mc.Millan Publishing Company.
Celladurai P., (1985), Sport Management, London : Pear Creative Ltd. Cox, Richard H., Sport Psychology Concepts An Aplications, Dubuque, Iowa : Wm.C.Brown
Publishers. Fiedler, Fred E., (1967) A Theory of Leadership Effectiveness, New York: Mc.Graw- Hill Book. Forsyth, Doneelson R., (1983), An Introduction to Group Dynamics, Montury CA : Brook/ Cola
Publishing Company. Gibson, Jane W., and Richard M. Hodgetts, (1986), Organizational Cmmunication; A Managerial
Perspective, New York : Academic Press College Division. Handoko T. Hani, (1991), Manajemen, Yogyakarta : BPFE. Logman (1989), Dictionary Contemporary English, Bungay, Suffolk : Logman. Pate, Russel R., Bruce Mc.Clenaghan, and Robert Rotella, (1984), Scientific Foundation of
Coaching, New York : Saunders College Publishing.
Public Health Department, Faculty of Sports Science, F1 Building, 2nd
Floor, Sekaran Campus Gunungpati, Semarang City, Central Java Province, Indonesia, 50229 Phone/ Fax. +6224 8508007
573
HEALTH EDUCATION BASED ON CHARACTER EDUCATION THROUGH ACTIVE INTERVENTION OF SCHOOL CURRICULUM
dr. Farid Eka Wahyu Endarto
Malang State University, Indonesia
Corresponding Author: [email protected]
Abstract One particular model of education that should implemented in specific communities in order
to make them better. "To turn a man into a good course, it is very dependent on how the educational model implemented" (Gandhi 2011: 24). Healthy behavior is one's actions in maintaining and improving his or her health (Becker, 1979). The most effective way to change behaviorfrom bad behavior that is detrimental to the health of the health benefits is through health education.School health system is one of the way to maintain and to teach health education efforts aimed at learners (Department of Health, 2010). Ironically,School Health System runs only for the sake of school competition, thus failing to affect students in maintaining healthy habits in everyday life.
The next form of national policy in supporting health education in schools is through environmental education programs and Adiwiyata programs. This policy is very close with the implementation of moral values to appreciate and take responsibility for nature. This opinion is supported by Murtilaksono et.al (2011). In accordance with national education goals based on character education, health education cannot be separated from the formation of character to shape student behavior. Characters are not born with. The character for healthy behavior comes from the experience and education of individuals, not automatically achieved from the baby. There is an aspect of learning behavior.
The phenomenon from temporary observation activities in several schools in Malang shows that Environmental Education program, Adiwiyata and UKS just become routine image to win awards from the government without thinking about the program sustainability and its original achievement in teaching students to understand and to internalize behaviors of character education.
All parties concerned are expected to adopt the "health education based character education through active intervention in the school curriculum" at all levels to modify the behavior of the entire community healthy, one of them by modifying the curriculum. With the creation of a homogeneous character of healthy students, when they reach reproductive age they will create a culture of healthy living voluntarily in the family, community, and the government as part of a new generation of national policy makers in the future. At the end, Indonesian nation health improve by itself.
INTRODUCTION
Background
The images of education in Indonesia cannot be separated from the initial understanding of
the basic philosophy of education. Educational practitioners always face a big question underlying
the meaning and purpose of education. One of the big questions among the people in Indonesia to
this date is why education, which is believed to be able to improve their status, creates irony. Is
education important so that it should always be there? At the end, the practitioner education move
to always look for something new and to always innovate on the types of education, such as what
and why some particular educational model should be implemented in specific communities in
order to make them better. "To turn a man into a good course, it is very dependent on how the
educational model implemented" (Gandhi 2011: 24). Based on Encarta dictionary, model is
574
Public Health Department, Faculty of Sports Science, F1 Building, 2nd
Floor, Sekaran Campus Gunungpati, Semarang City, Central Java Province, Indonesia, 50229 Phone/ Fax. +6224 8508007
"something that is used as the basic of a process or system". Moreover, Wikipedia defines
education as “any act or experience that has a formative effect on the…,or physical ability of an
individual….Education is the process by which society deliberately transmits its accumulated
knowledge, skills and values from one generation to another.” Meanwhile, Mudyaharjo (2010)
equates education with life. He argues that education is any situation in life that affects the growth
of a person. Additionally, education is a process that is attachedin every life, and walk all the way
with humans.
Education in Indonesia is described in order to provide constructive impact and contribute
to the Human Resources (HR) quality, as defined in Republic Act No 20 of 2003 on National
Education System or the National Education System Chapter II, Article 3:
National education serves the purposes of developing skill and character as well as useful
civilization in order to develop students‟ potential for being religious, well behaved, healthy,
knowledgeable, skillful, creative, independent, and for being democratic citizen and
responsible.
By Act No. 20 of 2003 on the consistency of the implementation of education in developing
intellectual life of the nation, educators they consistently provide empowering education.
Empowering education is the process of humanizing children so that their potential can turn into
actual maturity and independence in their lives. To the very least, by having empowering
education, every child will get a basic need, such as knowing their rights and responsibilities as
individuals, as the members of society and as the creature of God. Empowering education should
be pursued ranging from early childhood education, primary, secondary, up to higher education
(Syafaruddin, 2008).
John Dewey in Nugroho (2008: 19) describes education as a process of formation,
recapitulation, retrospection, and reconstruction as in the following quotation
1. Education as formation ... .all education forms character, mental, and moral, but formation
consists in the selection and coordination of native activities so that they may Utilize the
subject matter of the social environment. Moreover, the formation is not only a formation of
a native activities, but it takes place through them. It is a process of reconstruction,
reorganization ...
2. Education as recapitulation and retrospection ... .The individual develops, but his proper
development consists in repeating orderly stages the past evolution of animal life and
human history. The former recapitulation Occurs physiologically; the latter should be made
to occur by means of education "...
3. Education as reconstruction ... .It is that reconstruction or reorganization of experience the
which adds to the meaning of experience, and in the which increases the ability to direct the
course of subsequent experience ...
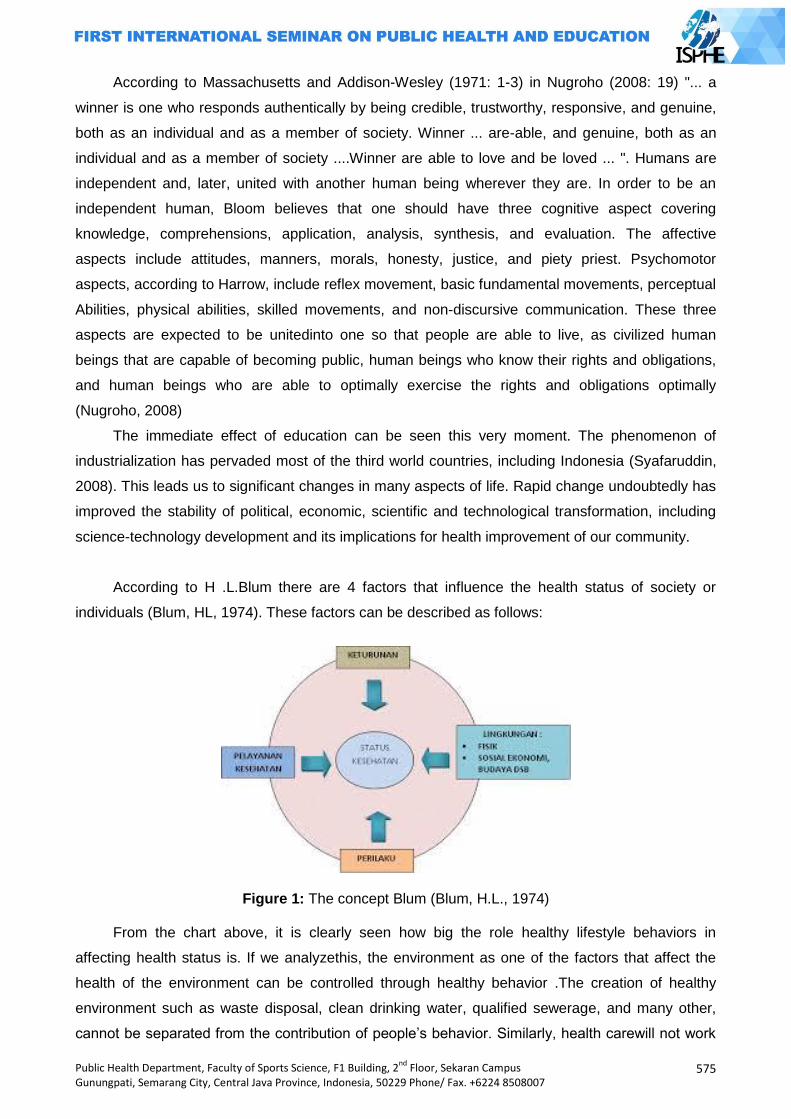
Public Health Department, Faculty of Sports Science, F1 Building, 2nd
Floor, Sekaran Campus Gunungpati, Semarang City, Central Java Province, Indonesia, 50229 Phone/ Fax. +6224 8508007
575
According to Massachusetts and Addison-Wesley (1971: 1-3) in Nugroho (2008: 19) "... a
winner is one who responds authentically by being credible, trustworthy, responsive, and genuine,
both as an individual and as a member of society. Winner ... are-able, and genuine, both as an
individual and as a member of society ....Winner are able to love and be loved ... ". Humans are
independent and, later, united with another human being wherever they are. In order to be an
independent human, Bloom believes that one should have three cognitive aspect covering
knowledge, comprehensions, application, analysis, synthesis, and evaluation. The affective
aspects include attitudes, manners, morals, honesty, justice, and piety priest. Psychomotor
aspects, according to Harrow, include reflex movement, basic fundamental movements, perceptual
Abilities, physical abilities, skilled movements, and non-discursive communication. These three
aspects are expected to be unitedinto one so that people are able to live, as civilized human
beings that are capable of becoming public, human beings who know their rights and obligations,
and human beings who are able to optimally exercise the rights and obligations optimally
(Nugroho, 2008)
The immediate effect of education can be seen this very moment. The phenomenon of
industrialization has pervaded most of the third world countries, including Indonesia (Syafaruddin,
2008). This leads us to significant changes in many aspects of life. Rapid change undoubtedly has
improved the stability of political, economic, scientific and technological transformation, including
science-technology development and its implications for health improvement of our community.
According to H .L.Blum there are 4 factors that influence the health status of society or
individuals (Blum, HL, 1974). These factors can be described as follows:
Figure 1: The concept Blum (Blum, H.L., 1974)
From the chart above, it is clearly seen how big the role healthy lifestyle behaviors in
affecting health status is. If we analyzethis, the environment as one of the factors that affect the
health of the environment can be controlled through healthy behavior .The creation of healthy
environment such as waste disposal, clean drinking water, qualified sewerage, and many other,
cannot be separated from the contribution of people‟s behavior. Similarly, health carewill not work
576
Public Health Department, Faculty of Sports Science, F1 Building, 2nd
Floor, Sekaran Campus Gunungpati, Semarang City, Central Java Province, Indonesia, 50229 Phone/ Fax. +6224 8508007
well if there is no change in behavior, although health care institutions such as neighborhood
health are established. If there is no participation of the community to take advantage of the health
services, the health care plan will fail. The lack of participation of these communities might be due
to the lack of awareness, and lack of awareness is due to the lack of knowledge about the benefits
of the use of health services in improving their health status.
Healthy behavior is one's actions in maintaining and improving his or her health (Becker,
1979). The behavior itself can be categorizedas covert behaviors and overt behaviors. Covert
behavior deals with knowledge and attitudes towards an object while covert behavior is deal with
actions. The most effective way to change behaviorfrom bad behavior that is detrimental to the
health of the health benefits is through health education.
Educational process takes place in an educational setting or educational institution. It is
usually divided into informal education (that takes place in family), formal education (that takes
place in educational institution), and community education.
The coaching and development of school health is one of the ways to maintain health and it
is aimed at students. It is one important link in improving the physical quality of the population
(Department of Health, 2010). In 2010, the number of students was estimated at 30% of the total
population of Indonesia, or about 73 million people. The number will continue to grow in line with
increased awareness of the importance of education in Indonesia. With this large number, the
health problems faced by children of school age are certainly very complex and varied
(Department of Health, 2010).
Educational Sustainable Development has been the concept of the development of health
education in Indonesia through Healthy School program. One example of its application is through
the socialization of healthy school competition. The problem is that school health system owned by
most school is only functioned when there is competition held. This is evidenced by the inability of
the program to influence students in maintaining healthy habits in everyday life, such as the habit
of washing hands, let alone the program these programs proposed by the school health system:
1. Health education: school health system teacher, apprentice doctor.
2. Health services: immunization, health networking, periodic medical examinations,
first aid treatment, medical referral, and case management nutritional anemia.
3. Development of a healthy school environment.
They are generally implementedin a part related to the improvement of physical facilities and
modifications to the environment. At the stage of the educational process, lecturing and counseling
on school health system to teacher and student learners are the only programs that can be
applied. Thus, it cannot create schools that reflect a role model healthy habits in a comprehensive
manner daily educational process.
In accordance with national education goals based character education, health education
cannot be separated from the formation of character to shape the behavior of students as
prospective members of the community who are health conscious and concerned about the
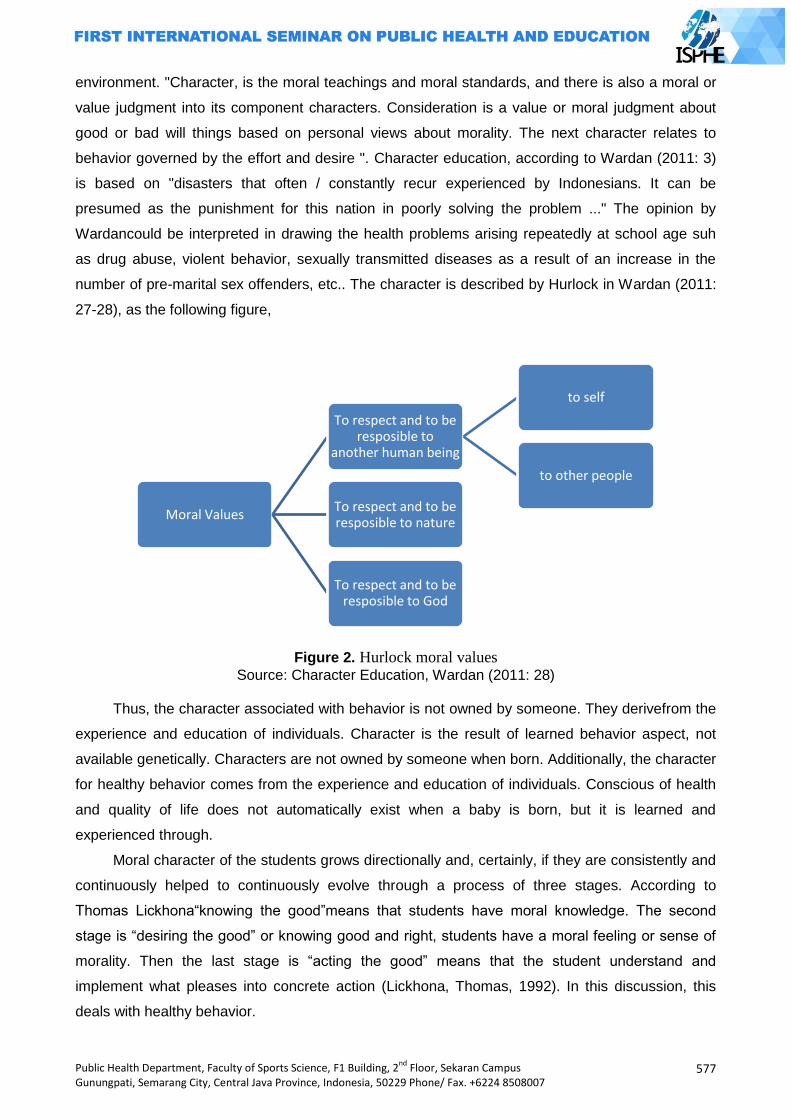
Public Health Department, Faculty of Sports Science, F1 Building, 2nd
Floor, Sekaran Campus Gunungpati, Semarang City, Central Java Province, Indonesia, 50229 Phone/ Fax. +6224 8508007
577
environment. "Character, is the moral teachings and moral standards, and there is also a moral or
value judgment into its component characters. Consideration is a value or moral judgment about
good or bad will things based on personal views about morality. The next character relates to
behavior governed by the effort and desire ". Character education, according to Wardan (2011: 3)
is based on "disasters that often / constantly recur experienced by Indonesians. It can be
presumed as the punishment for this nation in poorly solving the problem ..." The opinion by
Wardancould be interpreted in drawing the health problems arising repeatedly at school age suh
as drug abuse, violent behavior, sexually transmitted diseases as a result of an increase in the
number of pre-marital sex offenders, etc.. The character is described by Hurlock in Wardan (2011:
27-28), as the following figure,
Figure 2. Hurlock moral values
Source: Character Education, Wardan (2011: 28)
Thus, the character associated with behavior is not owned by someone. They derivefrom the
experience and education of individuals. Character is the result of learned behavior aspect, not
available genetically. Characters are not owned by someone when born. Additionally, the character
for healthy behavior comes from the experience and education of individuals. Conscious of health
and quality of life does not automatically exist when a baby is born, but it is learned and
experienced through.
Moral character of the students grows directionally and, certainly, if they are consistently and
continuously helped to continuously evolve through a process of three stages. According to
Thomas Lickhona“knowing the good”means that students have moral knowledge. The second
stage is “desiring the good” or knowing good and right, students have a moral feeling or sense of
morality. Then the last stage is “acting the good” means that the student understand and
implement what pleases into concrete action (Lickhona, Thomas, 1992). In this discussion, this
deals with healthy behavior.
Moral Values
To respect and to be resposible to
another human being
to self
to other people
To respect and to be resposible to nature
To respect and to be resposible to God
578
Public Health Department, Faculty of Sports Science, F1 Building, 2nd
Floor, Sekaran Campus Gunungpati, Semarang City, Central Java Province, Indonesia, 50229 Phone/ Fax. +6224 8508007
The next form of national policy in supporting health education in schools is through
environmental education programs that are clearly stated in the standard school Adiwiyata. This
policy is very close in the planting of moral values to appreciate and take responsibility for nature.
This opinion is supported by Murtilaksono et.al (2011) who defines environmental education as
"efforts to change behaviors and attitudes of individuals to improve their knowledge, skills, and
awareness of environmental values, issues and problems and to motivate people to participate in
the efforts of preserving the environment for the present and future generation. In addition, Bakshi
and Naveh (1978: 3) definesenvironmental education “like health, peace or sex education, a field
of education that has to do with strong emotions on the side of the learners as well as the
teachers."
National Programmed, which has been running, rests on the policy of Environmental
Education between the Ministry of Environment to the Minister of National Education No. 03 /
MenLH / 02/2010, No.01 / II / KB / 2010 dated February 1, 2010 on Environmental Education
through Adiwiyata program. Adiwiyata is a program that aims to create favorable conditions for
schools as the places of learning and building awareness of the school community (teachers,
students, and other workers), to encourage the efforts in saving the environment and sustainable
developmentthat can ultimately achieve institutional school care and cultured environment based
on the norms of togetherness, openness, honesty, justice, and the preservation of the environment
and natural resources (Ministry of Environment, 2010). Implicitly Adiwiyata is an implementation of
the concept of HL. Bloom introduced a new paradigm in holistic healthy school environment which
aims to prepare students as volunteers who care about the environment and health.
Health education is part of the character education implicitly affirmed in Plan 13 National
Long Term Development (RPJPN) 2005-2015 and is one of the priorities of national development
(Puskurbuk, 2011). Based on to the Guidelines issued by the Character Education Puskurbuk in
2011, the education unit is actually has been developed and implement the values of character
building through education unit operational program. It just needs to be strengthened with the
values of character that will be developed in the educational unit of the 19 values results of
empirical studies, namely religious, honest, tolerance, discipline, hard work, creative, independent,
democratic, curiosity, a sense of pride, patriotism, respect for achievement, friends /
communicative, love peace, love reading, environmental care, social care , and responsibility. In
fact, Environmental Education has been launched in Indonesia in its school curricula started in
1984 through the Population and Environment Education (PKLH). What matters is that the impact
of environmental education has not been experienced. This is evident from observations showing
that there are still many students who do not dispose of waste in the right place either at school or
on the streets, smoke outside the school, spit, have premarital sex and fight between students
Indratno (2007) said that the Curriculum Education Unitin 2006 was launched by the
government to provide a broader space to teachers, school administrators, and students in the
teaching-learning process. The curriculum is a set of plans and arrangements regarding the
Public Health Department, Faculty of Sports Science, F1 Building, 2nd
Floor, Sekaran Campus Gunungpati, Semarang City, Central Java Province, Indonesia, 50229 Phone/ Fax. +6224 8508007
579
purpose, content, and teaching materials and methods used to guide the implementation of
learning activities to achieve specific educational objectives (Act No.20 of 2003 Chapter I, Article 1,
point 19). Meanwhile, the Education Unit Level Curriculum is the operational curriculum developed
by and implemented in each educational unit (PP No. 19 Year 2005 Chapter I, Article 1, point 15).
Curriculum Education Unit is characterized by decentralization, accommodative, and can educate
teachers, students, and school administrators as they are is given the opportunity to rise and fall in
drafting and developing its own curriculum in accordance with the vision, mission, and goals of
their school. Although the curriculum is not the only determinant of the quality of education and not
a single translation of the vision of education, the curriculum does not have a central role in the
quality of education. The curriculum also can be a strategic tool for shaping the conception sow
interests and behavior of individuals and the school community including the behavior to be able to
organize and develop the habit of healthy living. The curriculum can be said to be loaded with the
interests of the power unit or school education and can become a benchmark in seeing how the
school interest is formulated and how school implement it to achieve its vision, mission, and goals
Environment-based curriculum based on Adiwiyataguidelines issued by the Ministry
Environment 2010 is the curriculum that has a vision and a mission that cares about culture and
environment in accordance with the basic norms and basic principles of Adiwiyata. The mission
and vision is set out in the Education Unit Level Curriculum documents and the programs are
outlined in the plan internalized to all citizens of the school. Unit Level Curriculum documents
reflect the school's policy on the development of health learning materials are implemented in an
integrated manner on subjects or monolithic as a separate subject.
The phenomenon from temporary observation activities in several schools in the of Malang
shows that Environmental Education program, Adiwiyata and UKS just become routine image to
win awards from the government without thinking about the program sustainability and its original
achievement in teaching students to understand and to internalize behaviors of character
education.
The losses that will suffer when the implementation of this policy is not carried out correctly is
that the government and the school will fail to achieve the goal of the program, that is to foster
healthy behaviors educates students who will eventually be brought into daily habits in society.
Furthermore, in the future, these students will not be able to educate their children to instill healthy
behavior early on. As a result, the maturity cycle behavior for health-conscious society will continue
uninterrupted and cannot grow naturally in the environment as more negative behavior than
behavior maintained by a healthy environment that successfully crystallized and became a culture.
The National Programmed will forever just be a mere jargon and slogan among the people without
ever being managed to become a new culture based on individual health behaviors as part of
community members.
580
Public Health Department, Faculty of Sports Science, F1 Building, 2nd
Floor, Sekaran Campus Gunungpati, Semarang City, Central Java Province, Indonesia, 50229 Phone/ Fax. +6224 8508007
Purpose
This theme is the researcher‟s concern on viewing the implementation of health education
policy in Indonesia, as it does not contribute a significant role in improving the health status of
comprehensive and sustainable society. Therefore, the purposes of this conceptual idea are:
General purpose
1. To provide contributions in improving the education system of national health.
2. To provide an alternative discourse to the policy makers in order to formulate a strategic step
in dealing with the national health issue through education.
3. To provide preventive paradigm‟s role in the community in order to solve national health
issue.
Special Purpose
1. To provide a proposed health education concept based on character education through
active intervention in school curriculum.
2. To provide an alternate curriculum modification to accommodate health values that will be
implemented in early years.
3. To increase the understanding and knowledge of educators or teachers in health as well as
to create teachers who have healthy character and teachers who inspire students.
4. To create homogeneous students in their character and in their behavior in the community.
Benefits
By creating homogeneous students in their character and in their behavior in the community,
it is hoped that they will massively cultivate healthy life by volunteering either within their own
families, communities, or the government as part of a golden generation of policy makers
nationwide as they reach productive age. Therefore, the health status improvement in Indonesia
will follow.
Ideas
Taking into account the complexity of the phenomena involved, it is necessary to have an
intensively cross-sector cooperation in order to achieve the national goal of optimal health
education, starting from the role of the ministry of health, ministry of education, and local
governments, along with related local government offices that houses education and health issues,
including school Action Reviews himself as the spearhead of the national policy.
All concerned parties are expected to adopt the "health education based character education
through active intervention in the school curriculum" at all levels to be able to modify the health
behaviors of all members of society, not just students, but also primarily on all teachers at the
school level, and prospective educators still exist in higher education.

Public Health Department, Faculty of Sports Science, F1 Building, 2nd
Floor, Sekaran Campus Gunungpati, Semarang City, Central Java Province, Indonesia, 50229 Phone/ Fax. +6224 8508007
581
In short, the character of the students is actually the reflection of character educators
encountered in everyday situations, while the environment is the reflection of the majority of the
internalization of the character of the community. The implications is that the community that has
bad character is impossible to create a good environment, and vice versa.
Applied solution
Government with all related department has launched some national-scale programs that
has been monitored and evaluated through:
1. National Health Enterprises Program
2. Environmental Education Program
3. AdiwiyataSchool Program
4. Increasing the role of schools in preparing its own curriculum.
As described above, these programs are effective in creating the infrastructure and
educational facilities-based environmental health standards, but the drawback is that the program
has not been able to touch the improvement of the character of the perpetrator, all citizens of the
school. There are still a number of negative habits of students and teachers as role models, e.g
smoking and littering.
New ideas offered
Based on the existing empirical facts and solutions ever offered, a breakthrough effort to
improve the quality of health education in Indonesia is carried out through the following
Table 1. The Strategies for improving the quality of health education based on character
education through active intervention of the school curriculum
Aspects Strategies
Internal reinforcement
Integration of health education curriculum in all school subjects The Classroomprogram based of healthy habits in schools is expected to be the of the future culture Improvement of the quality of teachers and educators in the character of a health based schoolthrough the control and management systems in higher education curriculum Application of the rules in the world of health-oriented educational environment The implementation of government policies that support internal program
External development
Increasing the role of the school in solving problems in environmental health
Development cooperation in the field of education that habituation oriented holistic health behavior.
Here are the examples of the technical character of health education strategic move that are
expected to change the paradigm of health education in the future,

582
Public Health Department, Faculty of Sports Science, F1 Building, 2nd
Floor, Sekaran Campus Gunungpati, Semarang City, Central Java Province, Indonesia, 50229 Phone/ Fax. +6224 8508007
1. The process of health education should be reflected either expressed or implied in all types
of subject as an initial effort of planting, so that the students will always get the material and
moral health from all subject teachers:
a. Applying the sample ergonomics and proper posture applications in everyday life
when describing some of the subject matter of physics.
b. Chemistry teacher warns the dangers of lead and how to avoid it when describing
the material elements of Chemistry
c. A math teacher teaches about the calorie count of a healthy diet on a multiplication
operation
d. Indonesian Language teacher imparts knowledge about effective communication
using role play so that they are used to solve the problem with dialogue and
discussion to reduce acts of violent behavior in students, etc..
2. The process of education should reflect the main concerns of the school community in
maintaining a sustainable environment:
a. Giving the responsibility of the school plants and the animals to the students to on a
daily basis and it is included in the assessment criteria for the students' academic
success habits that lead to appreciating and taking care of nature.
b. Making regular a variety exercise of simple waste treatment, to improve the
student's role in cleaning environment so that next time when the problem arises in
the community, they are able to help resolve them effectively.
3. The process of health education should be reflected in the habit of school and teacher
assessment standards in teaching and learning activities in order to gradually become a
culture:
a. Requiring students to wash their hands before and after coming out of the class,
meaning that each class should be available for hand washing facilities.
b. Prioritizing teacher psychological punishment that fits the needs of students
problems not with physical punishment and violence.
c. Requiring teachers and students to actively communicate with each other at the
time outside of lessons to practice the communication skills of students in the
community in the future, especially in the problem solving process
d. Giving more priority assessment on hygiene students so that they to be encouraged
to make hygiene as a key target in behavior, for example: class grouping is not only
based on achievement but also based on cleanness and social problem track record
4. The process of health education should be able to accommodate the development of moral
and social health of teachers and students, by working with the other parties involved in
running the educational process, for example:
a. Giving practice of moral and religious material to social institutions such as nursing
homes to teach polite attitude and obligation to parents

Public Health Department, Faculty of Sports Science, F1 Building, 2nd
Floor, Sekaran Campus Gunungpati, Semarang City, Central Java Province, Indonesia, 50229 Phone/ Fax. +6224 8508007
583
b. Visiting school for the gifted to enhance the students' gratitude and empathy.
c. Developing and improving the teacher's role as the ideal role model for students, so
teachers are not allowed to appear negative habits teacher at school.
Some of the examples above are just small parts in the implementation of healthy behaviors
in students which includes physical health or physical, mental, social, and spiritual, as defined by
WHO. Furthermore, our common hope is the process of health education can be experienced in
the community while the healthy behavior can become the culture. It should start from formal
educational institutions that instill awareness of what is good and what is bad on students. It should
be repeated constantly by all the teachers, deepened continue at every level of education and
internalized within the community so that, one day in society, these students will be able to get
used to the health pattern in their children in particular, and cultivate the general public at large,
healthy conscious generation eventually we managed to get up right now a currently dominate the
productive population pyramid and become an important part of policy makers in the community
who are always based on the principle of holistic health.
The parties that can implement the idea
This idea can be realized through the active participation of the parties as follows:
Table 2. Identification implementing, funding sources and health education programs based character education through active intervention in the school curriculum
Implementer Fund Source Programs implemented
School Local And National Government Fund for school development
The allocation of state funds schools and local governments for the development of integrated school health curriculum preparation in all aspects of education in schools
Higher education institution and Director General of Higher Education
Local And National Government Fund for higher education
Changes and the establishment of common basic subjects, as well as the addition of health science and behavioral competence in basic competencies prospective educators in Indonesia
Academics (students / Universities) R&D fund from the government
Training and applying of curriculum making integrated with health education based on character building.
Research Institutes R&D fund from the government
Doing research methods of character education and role models appropriate health
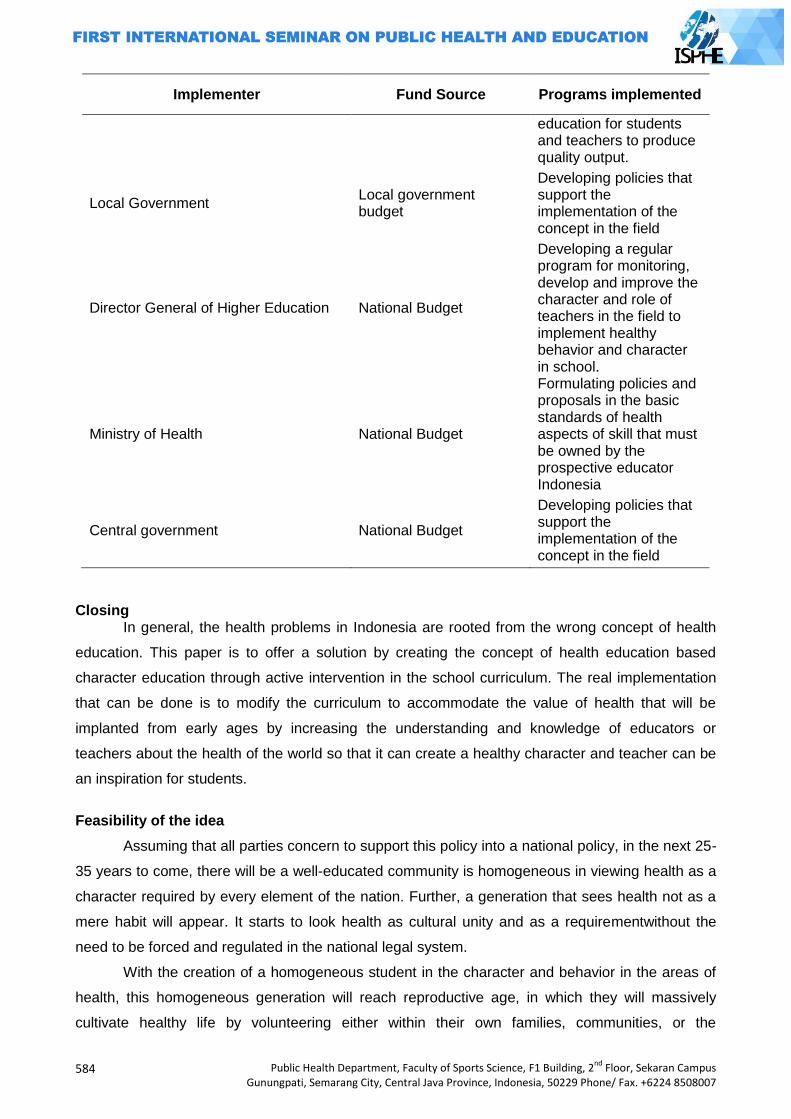
584
Public Health Department, Faculty of Sports Science, F1 Building, 2nd
Floor, Sekaran Campus Gunungpati, Semarang City, Central Java Province, Indonesia, 50229 Phone/ Fax. +6224 8508007
Implementer Fund Source Programs implemented
education for students and teachers to produce quality output.
Local Government Local government budget
Developing policies that support the implementation of the concept in the field
Director General of Higher Education National Budget
Developing a regular program for monitoring, develop and improve the character and role of teachers in the field to implement healthy behavior and character in school.
Ministry of Health National Budget
Formulating policies and proposals in the basic standards of health aspects of skill that must be owned by the prospective educator Indonesia
Central government National Budget
Developing policies that support the implementation of the concept in the field
Closing In general, the health problems in Indonesia are rooted from the wrong concept of health
education. This paper is to offer a solution by creating the concept of health education based
character education through active intervention in the school curriculum. The real implementation
that can be done is to modify the curriculum to accommodate the value of health that will be
implanted from early ages by increasing the understanding and knowledge of educators or
teachers about the health of the world so that it can create a healthy character and teacher can be
an inspiration for students.
Feasibility of the idea
Assuming that all parties concern to support this policy into a national policy, in the next 25-
35 years to come, there will be a well-educated community is homogeneous in viewing health as a
character required by every element of the nation. Further, a generation that sees health not as a
mere habit will appear. It starts to look health as cultural unity and as a requirementwithout the
need to be forced and regulated in the national legal system.
With the creation of a homogeneous student in the character and behavior in the areas of
health, this homogeneous generation will reach reproductive age, in which they will massively
cultivate healthy life by volunteering either within their own families, communities, or the
Public Health Department, Faculty of Sports Science, F1 Building, 2nd
Floor, Sekaran Campus Gunungpati, Semarang City, Central Java Province, Indonesia, 50229 Phone/ Fax. +6224 8508007
585
government as part of a golden generation national policy makers. In the end, the target of the
Indonesian nation health improvement will be achieved by itself.
References
Microsoft , 2007, Microsoft Encarta Reference Library, Microsoft,America. Nugroho Riant,2008,Kebijakan Pendidikan Yang Unggul,Pustaka Pelajar, Yogyakarta. Becker, M.H.,1979;Psychosocial Aspects of Health Related Behavior, dalam H.E., Freeman dan S.
Levine (eds.,), Handbook of Medical Sociology, PrenticeHall, Englewood Cliffs, New Jersey Blum, H.L. 1974. Planning For Health, Development And Application Of Social Change Theory.
New York: Human Science Press. Depkes RI (2010), Pedoman Pembinaan dan Pengembangan Usaha Kesehatan Sekolah,Jakarta Arikunto Suharsimi,Cepi Safruddin Abdul Jabar,2009,Evaluasi Program Pendidikan,Bumi
Aksara,Jakarta. Lickhona, Thomas, 1992. Educating for Character, New York: Bantam Books. Bakshi Trilochan S dan Naveh Zeh,1978,Environmental Education Principal Method And
Application,Plenum Press, New York and London. Cahaya,A,2009,Pendidikan Lingkungan Hidup, Pusat Pengembangan dan Pemberdayaan Dan
Tenaga Pendidikan Pertanian, Cianjur. Departemen Pendidikan dan Kebudayaan Direktorat Jendral Pendidikan Dasar dan Menengah
Direktorat Pendidikan Menengah Umum,1999,Panduan Manajemen Sekolah,Dikmenum, Jakarta.
Gandhi HW,Teguh Wangsa, 2011,Filsafat Pendidikan Mazhab Mazhab Filsafat Pendidikan,Ar-Russ Media,Jakarta.
Kementerian lingkungan hidup,2010,Panduan Adiwiyata,Asdep Urusan Penguatan Inisiatif Masyarakat,Jakarta.
Mudyahardjo Redjo,2010,Filsafat Ilmu Pendidikan,PT Remaja Rosdakarya, Bandung. Puskurbuk,2011,Pedoman Pelaksanaan Pendidikan Karakter,Jakarta. Raka,Gede et.al,2011,Pendidikan Karakter Di Sekolah,PT Elex Media Komputindo,Jakarta. Syafaruddin,2008,Efektivitas Kebijakan Pendidikan, Penerbit Rineka Cipta, Jakarta. Tilaar H.A.R dan Nugroho Riant,2009,Kebijakan Pendidikan,Pustaka Pelajar,Yogyakarta. Murtilaksono et.al, “Secondary and Higher Education for Development of in Indonesia”,Journal of
Development in Sustainable Agricultural, 2011,6:35-44 Tatemono Yoshikazu,”Environmental Education at Sakado Senior High School, University of
Tsukuba”, Journal of Development in Sustainable Agricultural,2011,6:136-139 http://www.republika.co.id/berita/104656/indonesia-dilanda-6632-bencana-selama- 1997-2009.
586
Public Health Department, Faculty of Sports Science, F1 Building, 2nd
Floor, Sekaran Campus Gunungpati, Semarang City, Central Java Province, Indonesia, 50229 Phone/ Fax. +6224 8508007
OUTDOOR ACTIVITY'S MANNER SURVEY TO TEACHER THE NEED ELEMENTARY SCHOOL AT YEAR SEMARANG CITY 2013
Ipang Setiawan
Semarang State University, Indonesia
Corresponding Author: [email protected]
Abstract Introduction: About problem basic in healths carnal learning and recreation sport at level its Elementary School its minim infrastructure who is equal to and its minim manner / outdoor aktivity's type and pretty much finances which greatly to learning operational. That base assumption recreations sporting learning back up growth and student developing via afektif's aspect, kognitif, and psikomotorik. But on the other hand as tiered as school, supplyng lents fund, learning time, availibility of past master, and a variety reason kind becomes its performed resistor factor outdoor aktivity's learning divides student at schooled. Base that thing therefore aim of this research is subject to be know needed outdoor aktivity phisical education manner for child power developing year elementary school 2012. Methods: In this research population which is utilized as object of research is elementary school that is at semarang city 30 schools. Samples taking tech in observational it is proportional sampling by toss. Population in observational it consisting of son student and examinee daughter schoolgirl with instrumental essays that different, division sample for son student and daughter schoolgirl at divides balance ala (proportional). Data collecting method is done at Elementary School one city of semarang by use of method survey. Results: Base observational result therefore gets to be known that outdoor activity's activity at semarang city as a whole available activity outdoor activity that at likes by children/society with proof prosentase as almost smooth. Its manner for example camp activity, activity roams, water game, jeram's ford, outbond and Mountaineering activity. With prosentase the most Water game is hankered, and Mountaineering activity that at least is hankered. Key Word: Survey, outdoor aktivity's manner
Introduction
Elementary education constitutes foundation for further education and national development.
Nation asset not only lays in abundant natural resources but lays in qualified man resource.
Indonesian human resource step-up as wealth that everlasting and inventasi to reach nation
progress, elementary education upgrade applies comprehensive, including in it is physical
education.
Penjasorkes constitutes integral part of education process as a whole, whereabouts area
studi Penjasorkes at schooled have unique role to be appealed studi's area any other, there is role
even unique that amongst those: (1) laid base character which strengths via internalisasi assesses
in physical education; (2) build strong personality base, attitude loves peace, social attitude,
tolerance in the context culture pluralism, ethnical and religion; (3) develop sportsmanship, on the
level, discipline, account for, collaboration, self-confident, and democratic; (4) develop power skill
and tech skill and game sort strategies and sport, developmental activity, gymnastic, ritmik's
activity, aquatic (water activity), schooled outer education (outdoor education); (5) know and
Public Health Department, Faculty of Sports Science, F1 Building, 2nd
Floor, Sekaran Campus Gunungpati, Semarang City, Central Java Province, Indonesia, 50229 Phone/ Fax. +6224 8508007
587
understand carnal activity concepts as information to reach healths, fitness, and healthy life
pattern. To render to the effect Penjasorkes upon, therefore Penjasorkes's learning environment
shall at accurate ala rule to increase growth and domains exhaustive developing, bodily,
psikomotor, kognitif, and afektif each poised ala student (Samsudin 2008:2 - 3).
For the moment still feels its reducing attention will recreation activity at deep environmental
schooled, that thing is seeming by gets a lot of student which utilize leeway with planless activities
that most leads and good aim so begets things that don't be expected. That thing is reverential
because still reducing it information and savvy will function and recreation benefit as an activity that
contain education element.
Recreation activity for children has a lot of function. One of recreation activity function which
is to recover body and fatigue situation that often been felt afters in full day working or learned.
Recreation for Elementary School student, get role for energy excess channelizing which is via
activity plays. Therefore, recreation for children identically by plays. It as one interposed by filusuf
Huizinga that human as creature that likes to play, meaning plays in mean for recreation activity
which is plays that no nonsense and intent positive for bodily growth and spritual. There are many
game kind that often been done by children as game traditional, electronics game, artistry and
outbound.
Outbound is activity altogether recreation training one that is done at the site or more the
number of times at exposed nature, one that consisting of one series of game( gamete ) and daring
( challenge ). Each game has specific-purpose. To the effect objective of this activity among those
helps to increase character intrapersonal and interpersonal, creativity, collaborate, communication
and leadership, and creates delight atmosphere and self-motivated. So is expected can develop
and meningkakan is student power skill in penjasorkes's activity.
Stirred skill is ability to do movement effectively and efficient. Skill stirredding to constitute
realization of coordination and control quality on body part that engages in movement. Analogously
at the height body measure and increases it physical ability, therefore becoming increases too
competence stirred child. Through acquired stirred skill process studies, which is by understands
movement and do movement again and again that is espoused wittingly fikir will be right or not it is
stirred already been done. According to Khomsin (2001:58) in available stirred learned process
three step study that have to be passed through by student for can reach perfect skill zoom
(automatic) which is: 1 ) kognitif, 2 ) asosiatif / fixations, and 3) automatic. To reach given skill
zoom, the duration time which at gets each different individual. There is that just require laconic
time, and there is that require time that adequately despite long time procedures and its studying
intensity with, it is caused because talent factor. Each individual have talent that variably, there is
that have sport talent and there is that don't. Scarred individual sporting will can gain control power
skill in the period of that more laconic.
588
Public Health Department, Faculty of Sports Science, F1 Building, 2nd
Floor, Sekaran Campus Gunungpati, Semarang City, Central Java Province, Indonesia, 50229 Phone/ Fax. +6224 8508007
Outdoor aktivity's essence
Out Bound is ala history is originate because mark sense integrated with day-to-day living
behalf. Out Bound Training constituting activity altogether recreation training one that is done
at exposed nature, one that consisting of one series of game( gamete ) and daring( challenge ).
Each game has specific-purpose. Outbound training or is known even with terminology outbound
training gone upon on method: Experiental Learning, Quantum Learning, Process Oriented,
Participatory Approach, Observation & Processing (Debrief). To the effect objective of this training
among those helps to increase character intrapersonal and interpersonal, creativity, collaborate,
communication, and leadership, and creates delight atmosphere and self-motivated.
Outbound will only effective if executed with every consideration, namely can give peak
adventure to participants it. Outdoor training can become tool that for SDM'S development e.g.
employee interest provided that is worked aright, namely contains program series that nicely.
Outbound training that no joke at the site. Outdoor education is education, are not simply for fun.
Lovely outbound program has to range high impact activities. Someone interest can thru increase
science development, skill and attitude / character of pertinent one. Outbound training aims to dig
up and increases skill and character / individual attitude. To usufruct lovely one, that outbound's
activity minimal three-day, facility outbound shall be equal to and drove by experienced instructor.
One that essential, outbound's program in focus on result, are not on its activity that own.
To can result peak adventure, activities in outbound shall can issue participant from comfort
their zoning. But, reminded, peak adventure any one different so instructor outbound may not force
participant that don't brave to do particular activities. Instructor can help by persuasi and adjoins
participant outbound that don't brave. Out bound basically bridges among interest and risk. No until
its risk overestimate so on the contrary become missadventure. Peak adventure is reached if risk
and interest proportional. Remember becoming mushrooms it outbound's promoter now, firm
needs neglectless. We shall a good hand at choose outbound provider that its lovely reputation,
having tall security default and instructor that qualified. Besides place outbound in point will back
up fruitfulness one outbound's activity. So can assign value positive as developmental as SDM. (
www. outboundprovider. com )
Developing elementary school age child
In every someone learning learns must have grasp about participant teaches it, it is meant to
make easy a teacher in make learning plan that will be passed on to its protege and applies
method who will be utilized for teaching. On student characteristic brazes v old elementary school
around 10–12 year can be clasified of severally viewpoint as follows:
Physical ability and power developing
Depdiknas (2001:42 - 46) in line with physical growth where excelsior child and the greater,
therefore physical ability even increases. Severally physical ability which adequately real
Public Health Department, Faculty of Sports Science, F1 Building, 2nd
Floor, Sekaran Campus Gunungpati, Semarang City, Central Java Province, Indonesia, 50229 Phone/ Fax. +6224 8508007
589
perkembanganya on child term outgrows on big age with aged 10 12 years usually on class v as
follows:
(1) Developing tries a fall
Force is yielding muscle job that as ability to lift, menjinjing, bate, throw, push, or pulls
charges. The greater penampang is muscle athwart the greater too vim which is resulted from that
muscle job. The difference brawn on boy and female on perbedaanya's big child progressively is
clear where stronger boy, the difference the greater on adolesensi's term.
(2) Flexibility developing
Flexibility is stirred facility about joint, on each body part no interkorelasi that its mean if
someone has good flexibility on one of body part on sectioned body which another was obviously
good also its flexibility.
(3) Balance developing
Balance can be clasified as two kinds which is balance statik constitutes ability keep given
body positions for doesn't get to wiggle or overthrow, and balance dynamic constitute ability to
keep body for unfelled at the moment doing movement.
(4) Stirred coordination developing
Stirred coordination is ability to control body movement. Child that its good coordination will
can do movement efficiently, so in a general way can do ativitas physical power with every
consideration. Result observationaling to boy and female in term ability in common until age more
or less 11 year still counterbalanced or haven't a lot of distinctive but later beginning available
distinctive, boy experiences step-up that progressively quick (Depdiknas 2001:53).
(5) Base stirred mastery developing
Analogously at the height body measure and increases it physical ability, therefore becoming
increases too competence stirred child. Depdiknas (2001:53) a variety base power ability already
begins can be done on childhood progressively being gained control, stirred ability step-up gets
diidentifikasikan in forms: movement can be done by mekanika body that progressively efesien,
progressively smooth and controlled, movement form / pattern progressively varies, and movement
gets vigorous. Severally movement kind that can children do while get chance is movement walk,
run, climb up, hop, berjengkat, jump string, kick up, throw, catch, memantulkan serves a ball, hit,
and swimming.
(6) Stirred skill studying
Stirred skill is ability to do movement effectively and efficient. Skill stirredding to constitute
realization of coordination and control quality on body part that engages in movement. In available
stirred learned process three step who shall be passed by student for can reach perfect or auto
skill which is phase kognitif, asosiatif /'s phase fixation and automatic phase.
Through acquired stirred skill process studies, which is by understands movement and does
movement again and again that is espoused wittingly fikir will be right or not it is stirred already
been done. According to Khomsin (2001:58) in available stirred learned process three step study
590
Public Health Department, Faculty of Sports Science, F1 Building, 2nd
Floor, Sekaran Campus Gunungpati, Semarang City, Central Java Province, Indonesia, 50229 Phone/ Fax. +6224 8508007
that have to be passed through by student for can reach perfect skill zoom (automatic) which is: 1 )
kognitif, 2 ) asosiatif / fixations, and 3) automatic. To reach given skill zoom, the duration time
which at gets each different individual. There is that just require laconic time, and there is that
require time that adequately despite long time procedures and its studying intensity with, it is
caused because talent factor. Each individual have talent that variably, there is that have sport
talent and there is that don't. Scarred individual sporting will can gain control power skill in the
period of that more laconic.
According to Samsudin (2008:26 - 27) about stirred concept teaching in Penjasorkes's
learning was progressively is of important and have become tren at forward states. Stirred concept
terminology in refer to idea kognitif who has to assess transfer, stirred concept in Penjasorkes can
as one tag or name a group respond power, as catches, throw or migration( lokomotor) .
Along with age step-up, criteria and becoming ripe it earthly concern functions, student will
also get ability developing in motorik's skill. Even a large part behaviour constitutes to usufruct
studying, need remembered that maturity factor so ascendant and will draw the line skill type that
can be studied and one how much skill which can be studied. Efficiency in motorik's skill really
been regarded by carnal developing zoom child.
Skill and consciousness to henpecked power children, bit by bit will get to get better its
accuration and also its adaptation ability. Childs social developing have role as inner as process “
fix power ”, notably base skill forms required just for play games that time be popular. Up to
specific step, multiform governable base skill with every consideration by children and will
continually get better. Children also beginning can do basic power in various variation and complex
situation, or in kecabangan's sporting game.
Process was formed by it power not happens automatically, but constituting accumulated of
learning and training process, which is by understands movement and do movement again and
again that espoused by awareness of correctness or not it movement that is done. Therefore
power skill is ability do movement efficiently and effective. Chance application studies power via
carnal activity that adequately on childhood to look after and develops condition self transcendent
essential, since will behoof for normal skill developing coming after adult, so also for healthy
mental developing.
Needful activity elementary school child
Needful activity by elementary school age childs which is; a ) activity utilizes kerampilan to
reach specific-purpose, b ) beregu's ala activity or shoal, which is children given by chance for
plays ball with its friend in do activity to build togetherness between them, c ) activity try, d. )
activity to increase physical ability and braving in shaped individual's activity or group game,
particularly which involve force and robustness
(1) Aspect developing memory
Public Health Department, Faculty of Sports Science, F1 Building, 2nd
Floor, Sekaran Campus Gunungpati, Semarang City, Central Java Province, Indonesia, 50229 Phone/ Fax. +6224 8508007
591
Up to this period, childs short-range memory was effloresce with every consideration. But
then, longterm memory don't happen a lot of step-up by espoused marks sense keterbatasan–
keterbatasan. To reduce that limitation, child tries to utilize memory strategy( memory strategy ),
which is constitute intentional behaviour that is utilized to increase memory, so with basketball
game modification that easy and delicate at plays this is which beget quick and edge out know this
game;
(2) Creativity developing
In this phase, children has ability as to establish something new. This developing really been
regarded by environmentally, particularly environmental schooled. With this developing back up
child for over active and pleasingly do activity a new one and pulling;
(3) Subjective developing with family
In this case, oldster feels pengontrolan her to their child behaviour decreases from time to
time as compared to previous period, since on a par child whiles away it at schooled. Interaction
learns and coeval friend at schooled gives a big opportunity for children to develop kognitif's ability
and social skill;
(4) Developing relationship with coeval friend
Get interaction with comate coeval constitute there are many activity confiscates time.
Generally they meluangkan time is more than 40% to get interactions with comate coeval and
sometimes available two or groups / groups. Nevermore child pleased plays alone at house, it
because child has kenginan;
(5) Communication aspect
Children beginninging to point out the better grasp developing, which is they tend to notice
while one instruction fall short in an activity and tend discontinue activity or see faced problem.
They are more responsive to look for tofu while they don't understand something or get woolly
information (Papalia 1986: 258).
Methods
In this research population which is utilized as object of research is elementary school that is
at semarang city 30 schools. Samples taking tech in observational it is proportional sampling by
toss. Population in observational it consisting of son student and examinee daughter schoolgirl with
instrumental essays that different, therefore division sample for son student and daughter
schoolgirl at divides balance ala (proportional). Trick that is utilized in this research for
merandomisasi utilizes to make the point toss. Toss trick.
Data collecting method
Data collecting method also constitute important factor deep one research because in direct
corollation to data which at gets, to get data suitably therefore in this research utilize survai's
method that corresponds to tech essay.
Data analysis method
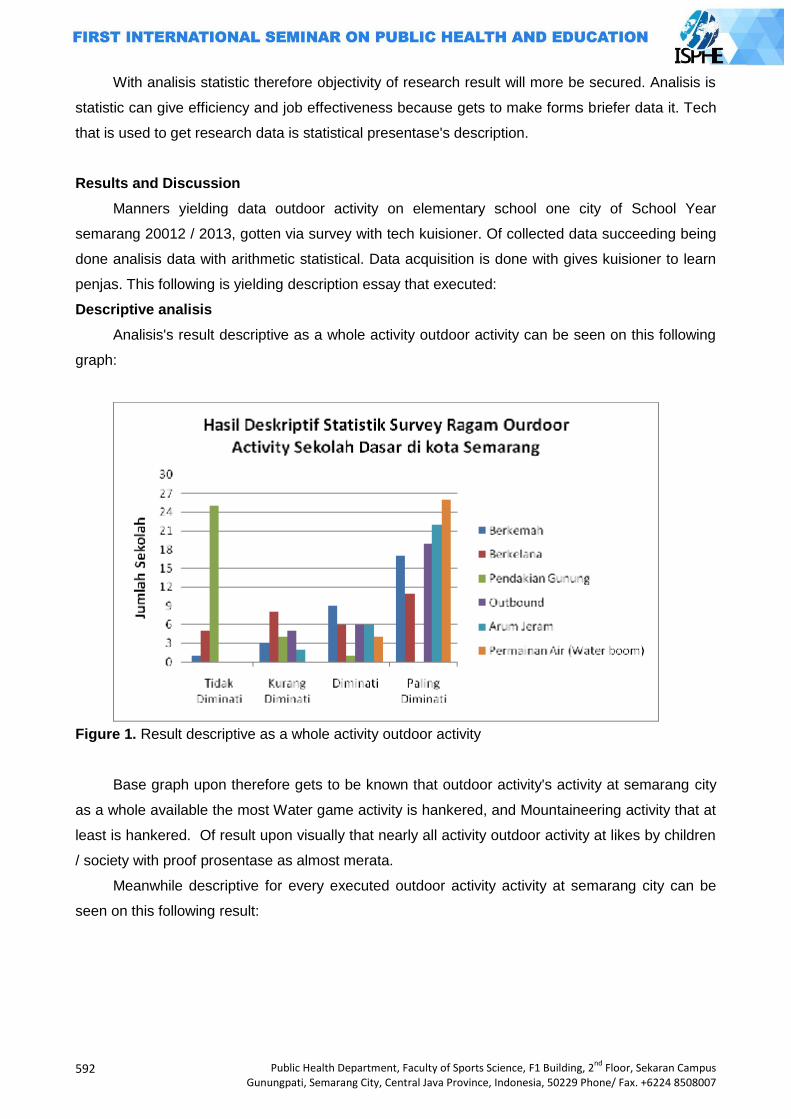
592
Public Health Department, Faculty of Sports Science, F1 Building, 2nd
Floor, Sekaran Campus Gunungpati, Semarang City, Central Java Province, Indonesia, 50229 Phone/ Fax. +6224 8508007
With analisis statistic therefore objectivity of research result will more be secured. Analisis is
statistic can give efficiency and job effectiveness because gets to make forms briefer data it. Tech
that is used to get research data is statistical presentase's description.
Results and Discussion
Manners yielding data outdoor activity on elementary school one city of School Year
semarang 20012 / 2013, gotten via survey with tech kuisioner. Of collected data succeeding being
done analisis data with arithmetic statistical. Data acquisition is done with gives kuisioner to learn
penjas. This following is yielding description essay that executed:
Descriptive analisis
Analisis's result descriptive as a whole activity outdoor activity can be seen on this following
graph:
Figure 1. Result descriptive as a whole activity outdoor activity
Base graph upon therefore gets to be known that outdoor activity's activity at semarang city
as a whole available the most Water game activity is hankered, and Mountaineering activity that at
least is hankered. Of result upon visually that nearly all activity outdoor activity at likes by children
/ society with proof prosentase as almost merata.
Meanwhile descriptive for every executed outdoor activity activity at semarang city can be
seen on this following result:
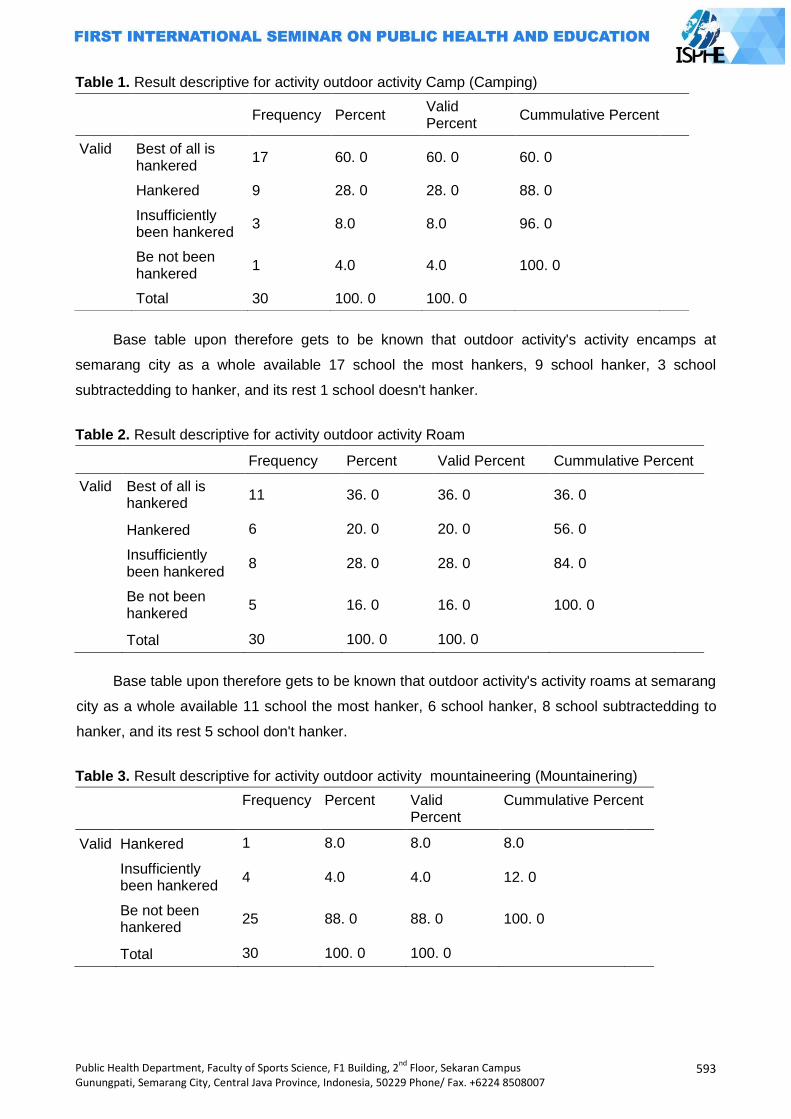
Public Health Department, Faculty of Sports Science, F1 Building, 2nd
Floor, Sekaran Campus Gunungpati, Semarang City, Central Java Province, Indonesia, 50229 Phone/ Fax. +6224 8508007
593
Table 1. Result descriptive for activity outdoor activity Camp (Camping)
Base table upon therefore gets to be known that outdoor activity's activity encamps at
semarang city as a whole available 17 school the most hankers, 9 school hanker, 3 school
subtractedding to hanker, and its rest 1 school doesn't hanker.
Table 2. Result descriptive for activity outdoor activity Roam
Frequency Percent Valid Percent Cummulative Percent
Valid Best of all is hankered
11 36. 0 36. 0 36. 0
Hankered 6 20. 0 20. 0 56. 0
Insufficiently been hankered
8 28. 0 28. 0 84. 0
Be not been hankered
5 16. 0 16. 0 100. 0
Total 30 100. 0 100. 0
Base table upon therefore gets to be known that outdoor activity's activity roams at semarang
city as a whole available 11 school the most hanker, 6 school hanker, 8 school subtractedding to
hanker, and its rest 5 school don't hanker.
Table 3. Result descriptive for activity outdoor activity mountaineering (Mountainering)
Frequency Percent Valid Percent
Cummulative Percent
Valid Hankered 1 8.0 8.0 8.0
Insufficiently been hankered
4 4.0 4.0 12. 0
Be not been hankered
25 88. 0 88. 0 100. 0
Total 30 100. 0 100. 0
Frequency Percent Valid Percent
Cummulative Percent
Valid Best of all is hankered
17 60. 0 60. 0 60. 0
Hankered 9 28. 0 28. 0 88. 0
Insufficiently been hankered
3 8.0 8.0 96. 0
Be not been hankered
1 4.0 4.0 100. 0
Total 30 100. 0 100. 0
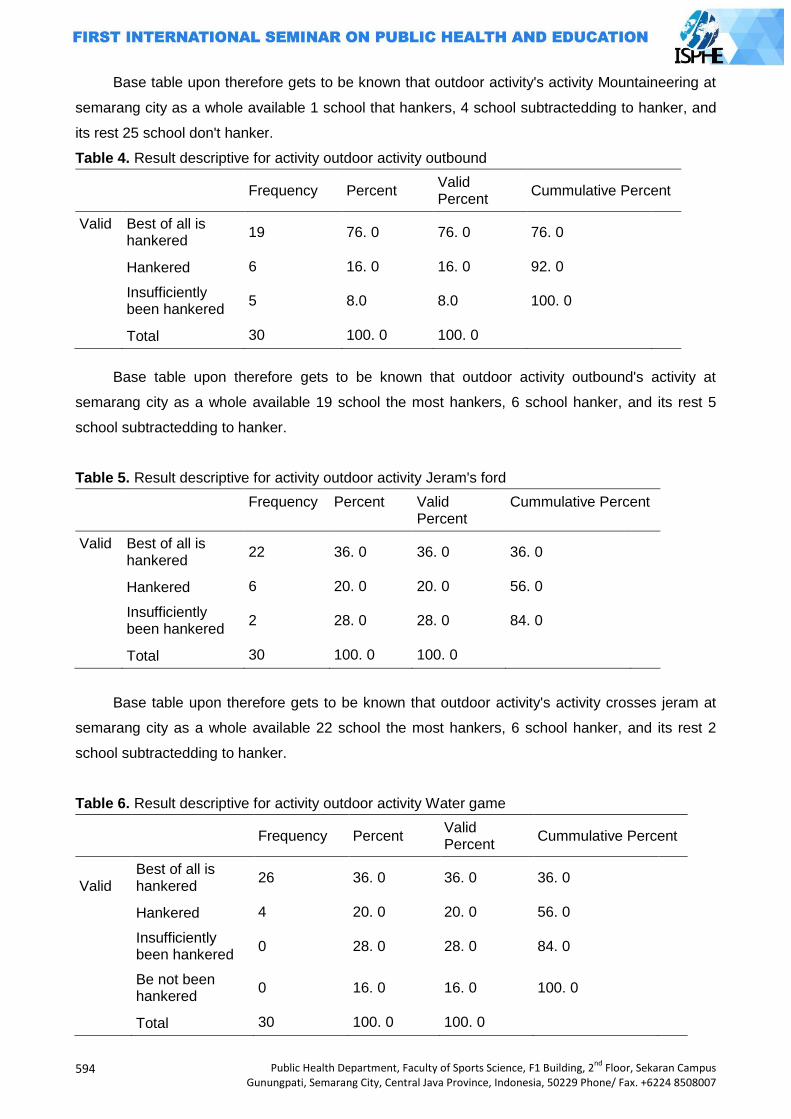
594
Public Health Department, Faculty of Sports Science, F1 Building, 2nd
Floor, Sekaran Campus Gunungpati, Semarang City, Central Java Province, Indonesia, 50229 Phone/ Fax. +6224 8508007
Base table upon therefore gets to be known that outdoor activity's activity Mountaineering at
semarang city as a whole available 1 school that hankers, 4 school subtractedding to hanker, and
its rest 25 school don't hanker.
Table 4. Result descriptive for activity outdoor activity outbound
Frequency Percent Valid Percent
Cummulative Percent
Valid Best of all is hankered
19 76. 0 76. 0 76. 0
Hankered 6 16. 0 16. 0 92. 0
Insufficiently been hankered
5 8.0 8.0 100. 0
Total 30 100. 0 100. 0
Base table upon therefore gets to be known that outdoor activity outbound's activity at
semarang city as a whole available 19 school the most hankers, 6 school hanker, and its rest 5
school subtractedding to hanker.
Table 5. Result descriptive for activity outdoor activity Jeram's ford
Frequency Percent Valid Percent
Cummulative Percent
Valid Best of all is hankered
22 36. 0 36. 0 36. 0
Hankered 6 20. 0 20. 0 56. 0
Insufficiently been hankered
2 28. 0 28. 0 84. 0
Total 30 100. 0 100. 0
Base table upon therefore gets to be known that outdoor activity's activity crosses jeram at
semarang city as a whole available 22 school the most hankers, 6 school hanker, and its rest 2
school subtractedding to hanker.
Table 6. Result descriptive for activity outdoor activity Water game
Frequency Percent Valid Percent
Cummulative Percent
Valid Best of all is hankered
26 36. 0 36. 0 36. 0
Hankered 4 20. 0 20. 0 56. 0
Insufficiently been hankered
0 28. 0 28. 0 84. 0
Be not been hankered
0 16. 0 16. 0 100. 0
Total 30 100. 0 100. 0
Public Health Department, Faculty of Sports Science, F1 Building, 2nd
Floor, Sekaran Campus Gunungpati, Semarang City, Central Java Province, Indonesia, 50229 Phone/ Fax. +6224 8508007
595
Base table upon therefore gets to be known that outdoor activity's activity water game at
semarang city as a whole available 26 school the most hankers, and its rest 4 school hanker.
Of research result is known that wholly average elementary school at semarang city most
hanker Outdoor Aktivity's activity water game activity, adequately at hankers jeram's ford,
insufficiently hanker activity roams, and doesn't hanker Mountaineering activity. Severally factor
which regard that result among those:
(1) Jeopardy factor
School is organisational container the one only in education activity construction recreation at
schooled, since recreation education constitute integral part of education effort. Headmaster is
responsible organisational lead about education activity program recreation at schooled. Teachers
and clerks and student are peopled one perform to carry the ball that gave by organization lead
after be reached intent organisational. outdoor aktivity's activity form a part of recreation and
responsibility activity usually been turned over to learn penjas elementary school. penjas's teacher
have judgment in determine recreation activity especially outdoor activity especially protege safety
problem it. Therefore, largely schooled at city semarang not hanker mountaineering activity
because reputed have tall jeopardy and gets to be said perilous for elementary school student.
(2) Joy factor
(3) Cost factor
(4) Living custom factor
(5) Environmental factor
Environmentally used to mean as place where that someone stays behind in the period of
which long time. Environmentally it covers physical environment, and economic social
environment. It can be begun from milieu, environmentally talks shop, lingkugnan is temapat's
region stays, etcetera. Good lingkugnan situation will prop good life too. That human thus shall can
anticipate and manjaga environmentally good degnan so most dodge of environmental disease
sort. Environmentally also used to mean as a number object on and off and all aught condition in
spatial our one stays. Environmentally does ever run around man of time is borne until its
deceased, so among environment and man exists interrelationship in artian environmentally regard
man and man regards environment. So too in process looks after human body condition,
environmentally constitute there are many source ascendant in physical condition custody
someone and environmentally which well expected will increase carnal freshness zoom someone.
Nearly gets to be said that environment at schooled and outer schooled really back up carnal
freshness zoom student. At student school is given a variety extracurricular activity kind in talent
and yen area whereas outdoor school or at student society environment also active ala follow
activity that evened out by society in sporting area.
596
Public Health Department, Faculty of Sports Science, F1 Building, 2nd
Floor, Sekaran Campus Gunungpati, Semarang City, Central Java Province, Indonesia, 50229 Phone/ Fax. +6224 8508007
Closing
Base graph upon therefore gets to be known that outdoor activity's activity at semarang city
as a whole available the most Water game activity is hankered, and Mountaineering activity that at
least is hankered. Of result upon visually that nearly all activity outdoor activity at likes by children
/ society with proof prosentase as almost merata. Base table upon therefore gets to be known that
outdoor activity permainin's activity water at semarang city as a whole available 26 school the most
hankers, 1 school doesn't hanker. Of research result is known that wholly average elementary
school at semarang city most hankers Outdoor Aktivity water game activity, adequately at hankers
jeram's ford, insufficiently hanker activity roams, and doesn't hanker Mountaineering activity.
Writers communicable tips be at adds volume for promotion recreation place, at fixs / at
increases access to go to that recreation place, at fixs more medium props to the better recreation
place, at adds more service is equal to.
References
Agus Mahendra, M.A. (2003) Physical Education philosophy. Directorates National education
department Elementary Education General And Tremendous Education directorate
Intermediate. A part Carnal health Education Project Tremendous Education
Djoko Shrieks Irianto. (2000). Fitness Training guidance ( One that Effective and Safe ).
Yogyakarta: Lukman is Offset.
Rolf p Lyton and Udai Pareek. (1998). Training and Labour Development. PT. Binaman's library
Jakarta
http://kaboa training. com / outdoor. htm
www. outboundprovider. com
Sejahtera's Indonesian foundation: ( 1990), play, menghayati and studying, Solo, PPSDM
Santosa, slamet: ( 1992) , Agglomerate dynamics, Letter Of The Alphabet earth, Jakarta
Suherman.2000's ambush. Penjaskes's basics. Depdiknas
Arsyad Azhar.2009. Learning media. Jakarta. Rajawali is Mass Media
Depdiknas,2006. ”Permendiknas is Number 23 Years 2006 about Graduated Interest Defaults
Elementary Educations and Intermediates ”. Jakarta: Depdiknas.
Depdiknas. 2006. ”Permendiknas is Number 22 / 2006 about Content Default for Satuan
Depdiknas. 2001. Training material Learns SD /'S Physical Education and health Builder and
Sporting Club Trainer SD's Early Age. Jakarta:Qualities Developmental center Carnal
Depdiknas. 2004. Pengkajian is Development's Sport Index (SDI). Jakarta: Sporting General
directorate and Lemlit UNESA.
Hernowo. 2005. As Teacher Which Wants and Can Teach Agreeable ala. Bandung: Mizan
Learning Center.
http://kaboa training. com / outdoor. htm (diunduh 20th March 2012)
www. outboundprovider. com (diunduh 20th March 2012)
Khomsin. 2001 .Paradigms scientific opus New Physical Education at Indonesian deep Reform era
.Jakarta
Masnur Muslich.2008.KTSP, Understanding basic and Developmental .Jakarta. PT Earths Letter
Of The Alphabet
Sadoso, Sumosardjuno. 1985. Know Earthly Concern freshness Zoom You. Jakarta: PT. Letter Of
The Alphabet earth

Public Health Department, Faculty of Sports Science, F1 Building, 2nd
Floor, Sekaran Campus Gunungpati, Semarang City, Central Java Province, Indonesia, 50229 Phone/ Fax. +6224 8508007
597
Samsudin. 2008. Sporting Physical Education learning and SD /'S health Mi. Jakarta. PT. Break of
day Son Grafika
Soepartono . 2000. Medium and Prasarana Olaharaga. Jakarta: Education department and
culture.
Suharsini Arikunto . 2002. Observational procedure An Editions Practical Approaching Revise VI.
Jakarta: Diversity Composes.
Wibowo Eddy m, dkk. 2008. Opuses Inscriptive guidance Scientific. Semarang. Unnes Press
Www. g excess. com / ” child developing ” (diunduh is date 15th March 2012)
598
Public Health Department, Faculty of Sports Science, F1 Building, 2nd
Floor, Sekaran Campus Gunungpati, Semarang City, Central Java Province, Indonesia, 50229 Phone/ Fax. +6224 8508007
THE LEADERSHIP OF A SPORTS COACH
Devi Tirtawirya
State University of Yogyakarta, Indonesia
Corresponding Author: [email protected]
Abstract
Coach is a professional in his field, in this case sports achievements. Coach is a professional coach who is carrying out his duties which has three essential elements that must be owned. Among others are experts in their fields, duties and responsibilities towards his institution or in official main organization. The coach has the task to help enhancing the existing potential in athletes to be more optimal and hoping to become champion. To be able to carry out these tasks, a coach must has leadership qualities in leading a training process. The leadership of a coach is absolutely necessary in a team or an ongoing training camp. It is important because the training process will not run well and is able to reach the target without sufficient leadership of a coach. A coach must be able to position themselves as a leader who can act in accordance with the training requirements. Leadership style of a coach must be adapted to the current conditions and situation of the field; a coach cannot just use one style of leadership to lead the team, or a process of main training. Running coaching process does take a lot of time, a coach must be able to lead and act according to the urgent situation. Therefore, there is no absolute required domination that the democratic style of leadership, authoritarian or casual must be used. However, a coach must know when an authoritarian role must be used, when to cooperate and when to be casual, so the emphasis and exercise goals will be achieved. Key Words: Coach, leadership Introduction
Today, sport is an activity that is quite a favorite in the community. Public awareness toward
the importance of exercise is high enough, it is proved by the many people engaging in sports
activities, both in the field and in the clubs official. The purpose of society in exercising are diverse,
starting from simply for recreation, health, therapy, body building until more serious one for
achievement.
The way society exercise varies according to their personal desire. Some of them think that
doing sports is merely moving your body, but many people also do exercise with the help of an
instructor. Sports that use an instructor or a coach is often referred as exercise. Exercise is also
offering variety of objectives, from one who just want to be able to get achievement or who want to
get more benefit from exercise. According to (Rainer, 2004), physical exercise is a special workout
routines or steps performed by athletes for the purpose of improving performance.
Exercise is important to improve the ability of the athlete to achieve the highest performance,
(Bompa, 1999: 54). According to (Pate, 1993) training is a systematic role while the final goal in
training is to improve the performance of athletes. However, others argue that the practice is a
systematic process which is done repeatedly day by day increased the number of training load
(http. Maafjiwaku). The term exercise comes from English language that can contain multiple
Public Health Department, Faculty of Sports Science, F1 Building, 2nd
Floor, Sekaran Campus Gunungpati, Semarang City, Central Java Province, Indonesia, 50229 Phone/ Fax. +6224 8508007
599
meanings such as: practice, exercise, and training. However, if those three words are translated
into Indonesian, they have different meanings.
Discussion
The process of an exercise could not happen immediately, it needs the intervention from a
good and serious coach. The success of an athlete to get the title cannot be separated from the
coach's leadership in managing the training process. A coach must have a lot of ways to be able to
increase the ability of the athlete and ultimately make him a success in the game. The role of the
coach's leadership has a sizeable percentage in terms of training process, even in putting the
athletes play in the field. Because of that fact, the leadership of a coach is very importantso that
the training process always runs well and as expected.
Coach Leadership Style
A coach's leadership style is different, and the characters are usually carried while doing the
task in training the athletes. A coach must have the ability to lead the exercise bothin team and
individual sports. In addition, the leadership style of a coach on the field needs to be adjusted to its
conditions. The process of training in the field will be colored with some leadership styles of a
coach, and is usually divided into three types of leadership styles, such as authoritarian,
democratic and casual.
Authoritarian
An authoritarian style of leadership that is often encountered in the field focuses on the
achievement or the final result. Authoritarian leadership style is usually found in martial sports
where coach always has absolute power on the members. It happens because in martial arts,
especially taekwondo, the belt levels will determine seniority.
Coach who embracing authoritarian leadership usually has the following characteristics: 1)
the communication that occurs is always forcing or commanding, 2) the main target is the victory,
3) the process is not the main concerned, the important one is end result, 4) difficult when he is
given some input or suggestion, 5) everything is centered on the coach. The characteristics of this
kind of leadership are not always bad, but there are times when this style is needed in the training
process. Authoritarian leadership qualities are necessary in the process of training, especially
when applied to martial arts, though not all exercise process should be with authoritarian style.
Democratic
Democratic is a word that in glimpse is very soothing when it heard. Democratic leadership is
often becomes the main reference that a coach should be like that. Democratic leadership
emphasizes on the harmonious relationship between members within the scope of training in one
sport branch. Democratic coaches‟ attitudes and behavior can make the environment situation
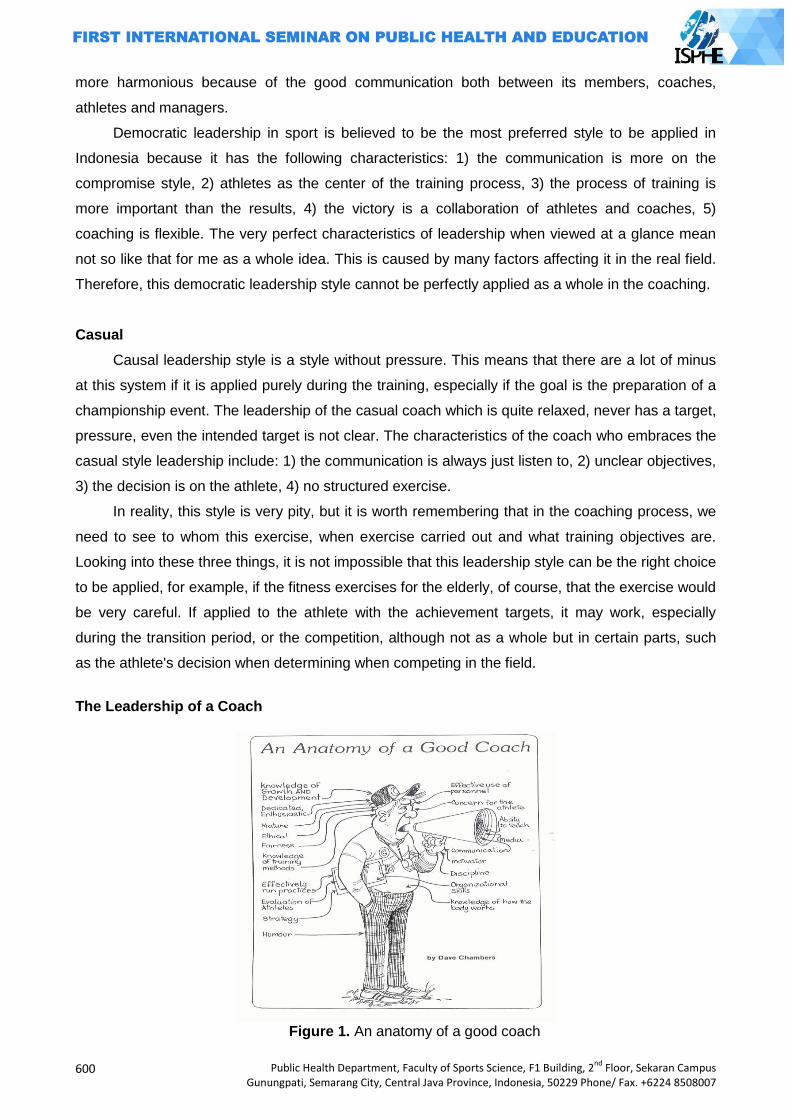
600
Public Health Department, Faculty of Sports Science, F1 Building, 2nd
Floor, Sekaran Campus Gunungpati, Semarang City, Central Java Province, Indonesia, 50229 Phone/ Fax. +6224 8508007
more harmonious because of the good communication both between its members, coaches,
athletes and managers.
Democratic leadership in sport is believed to be the most preferred style to be applied in
Indonesia because it has the following characteristics: 1) the communication is more on the
compromise style, 2) athletes as the center of the training process, 3) the process of training is
more important than the results, 4) the victory is a collaboration of athletes and coaches, 5)
coaching is flexible. The very perfect characteristics of leadership when viewed at a glance mean
not so like that for me as a whole idea. This is caused by many factors affecting it in the real field.
Therefore, this democratic leadership style cannot be perfectly applied as a whole in the coaching.
Casual
Causal leadership style is a style without pressure. This means that there are a lot of minus
at this system if it is applied purely during the training, especially if the goal is the preparation of a
championship event. The leadership of the casual coach which is quite relaxed, never has a target,
pressure, even the intended target is not clear. The characteristics of the coach who embraces the
casual style leadership include: 1) the communication is always just listen to, 2) unclear objectives,
3) the decision is on the athlete, 4) no structured exercise.
In reality, this style is very pity, but it is worth remembering that in the coaching process, we
need to see to whom this exercise, when exercise carried out and what training objectives are.
Looking into these three things, it is not impossible that this leadership style can be the right choice
to be applied, for example, if the fitness exercises for the elderly, of course, that the exercise would
be very careful. If applied to the athlete with the achievement targets, it may work, especially
during the transition period, or the competition, although not as a whole but in certain parts, such
as the athlete's decision when determining when competing in the field.
The Leadership of a Coach
Figure 1. An anatomy of a good coach
Public Health Department, Faculty of Sports Science, F1 Building, 2nd
Floor, Sekaran Campus Gunungpati, Semarang City, Central Java Province, Indonesia, 50229 Phone/ Fax. +6224 8508007
601
The Leadership is a coach means the coach's leadership when dealing with athletes who
facing certain events, both team and individual sports. Coaches who are dealing with a process of
training prior to certain events need a strong attitude and careful planning, in order to obtain
optimal results. Good preparation other than understanding the above illustration is on how to
manageboth good practice material, athlete, training schedules and exercise programs. Conducive
or not of a process is determined by the expertise of a coach in managing them, meaning whether
the exercise will be run in accordance with the training plan or not.
Sports coaching achievement often ignore things that seem important, such as the emphasis
of the coach on certain aspects ofthe athletes, such as giving punishment, or even setting a aside
something of a compromise with the athletes. Little things that seem not important in the coaching
process actually sometimes be a determinant of whether or not a good exercise process is
running. A great training will be happned if exercise is understood and followed by high awareness
of the athletes, other than that it is better if the coach can play a role both technically and
psychologically. This means that a coach should be able to be a leader who can put himself well in
position, when to not compromise, can compromise or what it is.
One way in order to the collective achievementwhich can be improved is through the
coaching process which refers to the coaches' belief that they have the ability to contribute to the
training and the performance of members (Feltz et al., 1999 in Mark r. Beauchamp and Mark A.
Eys; 2007). Looking atFeltzeta‟sl opinion, a good coach should have high confidence and ability to
contribute to the training process, especially in leading the ongoing process.
Good coach is if he is someone who can be flexible portraying himself into a different figure
in every situation and period that they have been. The attitude of authoritarian leadership of a
coach must be there and must be applied in the training process, especially if the physical exercise
or important exercise that is to be done by the athlete. It is important for coaches to implement this
authoritarian leadership style, for example, when physical exercise that emphasizes endurance,
athletes are usually lazy or even having reason to reject the practice, well at this time, an absolute
authoritarian leadership is really needed by a coach. In such conditions the cooperative and casual
leadership is inappropriately used.
Cooperative leadership will be very good to use for a coach when planning an exercise
program, corrective exercise techniques, tactics and strategies, certain physical and mental,
although one in a time, the authoritarian leadership style should also be applied. The cooperative
leadership style is suitable for the practice, because of the cooperative nature which can be
compromise to train it. For example rectification technique, a coach must communicate with
athletes, why can such a technique, the athletes, by knowing the reason of the athlete then the
coach can analyze and give the therapy exercise for the right one . Not only that, the program
training session that day could change with the communication between coaches and athletes, for
example, if the athletes today are ill or exhausted to travel long distances, it can change the
practice session in order to remain useful.
602
Public Health Department, Faculty of Sports Science, F1 Building, 2nd
Floor, Sekaran Campus Gunungpati, Semarang City, Central Java Province, Indonesia, 50229 Phone/ Fax. +6224 8508007
Casual leadership of a coach is in fact has just a little portion applied in practice, because it
is not having clear goals, no emphasis, and tend not to have clear goals. Nevertheless, in the
process of training, there is a part named period which called as transition time. At this time, an
athlete is currently having some rest after joining a championship. In transition period, the coach
cannot give any pressure to the athlete. The willingness of the athlete must be heard even though
he still need to have certain limitation so that the athlete is not being as what he want or even harm
the coach.
Conclusion
Leadership of a coach determinesthe success or failure of a team or athlete who is facing a
championship. The coach will be the one who guard the athlete from the prior championship until
the event takes place.Therefore knowledge, leadership and leadership are very important. The
leadership of the coach can bring a team into success both on the process until the game, if the
coach is able to playhis role to when acting as authoritarian, being cooperative and of course,
being casual. If the coach has been able to play these expected role, we hope that the optimal
achievement can be achieved.
References
Bompa, Tudor O. (1999). Periodization: Theory and Methodology of Training. (4th edition). Dubuque, Lowa: Kendal/Hunt Publishing Company.
Mark R. Beauchamp and Mark A. Eys. (2007). Group Dynamics in Exercise and Sport Psychology. Contemporary themes. Routledge taylor and Francis group London and New York
Pate. Russell R dkk. (1993) Dasar-DasarIlmiahKepelatihan. (Terjemahan): IKIP Semarang Press. Rainer Martens. (2004). Successful Coaching, (3rd):Human Kinetic
Public Health Department, Faculty of Sports Science, F1 Building, 2nd
Floor, Sekaran Campus Gunungpati, Semarang City, Central Java Province, Indonesia, 50229 Phone/ Fax. +6224 8508007
603
MODEL DEVELOPMENT OF PROBLEM-BASED LEARNING CURRICULUM MANAGEMENT FOR PUBLIC HEALTH STUDENT
Nurjazuli1, Onny Setiani1 , Maman Rachman2, Haryono2
1Diponegoro University, Semarang Indonesia 2Semarang State University, Indonesia
Corresponding Author: [email protected]
Abstract Intoduction: Public Health Faculty of Diponegoro University had implemented problem-based learning curriculum (PBLC). Few problems appeared may be related to PBLC management that had been implemented. This research aimed to develop Problem Based Learning Curriculum Management Modell that is effective for public health student. Methods: This study used a research and development approac (R&D). The subjects are manager, facilitators, and students. It was initiated by analyzing of the existing PBLC, PBLC modell development, and testing the modell. Testing the modell was conducted by expert and limited experiment through applied learning. The collected data would be analyzed descriptively and statistical test using analysis of variance and paired t-test at α=0,05. Results: This research showed that the existing PBLC was not giving chance to students gaining experience in solving the real public health problem in the community. The learning modell should be implemented consist of problematization, problem investigation, problem solving, and critical reflection. Validation test and limited experiment showed that hypothetical modell of PBLC was proved effective for public health students and there was significantly difference of effectiveness compared to factual modell (p-value<0,001). Conclusion, the hypothetical modell of PBLC could increase the effectiveness in problem-based learning for public health students. Keywords: Problem-based learning, public health student Introduction
Recently, education quality was still low in Indonesia. This condition was indicated by
indicators i.e: unable to compete in international level, many higher education institutions couldn‟t
get high position among universities in the world, low competitiveness to get labour market. And
the most important thing that the graduation was unable to be responsible person, It was not met
to national educational goals (Hasbullah, 2006). Other indicator was that the Indonesian Human
development Index (HDI) just reached 107th rank in the world. This level was lower compared to
Malaysia (Sudibyo, 2009).
Strategis goals of national education year of 2010 -2014 (related to the higher education)
were the available of educational sevice and Its quality, relevancy, had a high copetitivenes in
international level, and equity in all province. While the future educational policy focused on 3 pilar:
1) quality and relevancy, 2) equity and acces, and 3) public awaweness (Hasbullah, 2006).
Therefor each higher education institution alway mush increase quality in learning in othe to
produce profesional graduate and had high copetitiveness spirit.
In the year of 2009, Faculty of Public Health Diponegoro University had implemented PBLC
Problem-Based Learning or PBLC (Suwondo, 2009). Some problems appeared after implementing
it. Based on information gathered that It was less efective. This information indicated that the
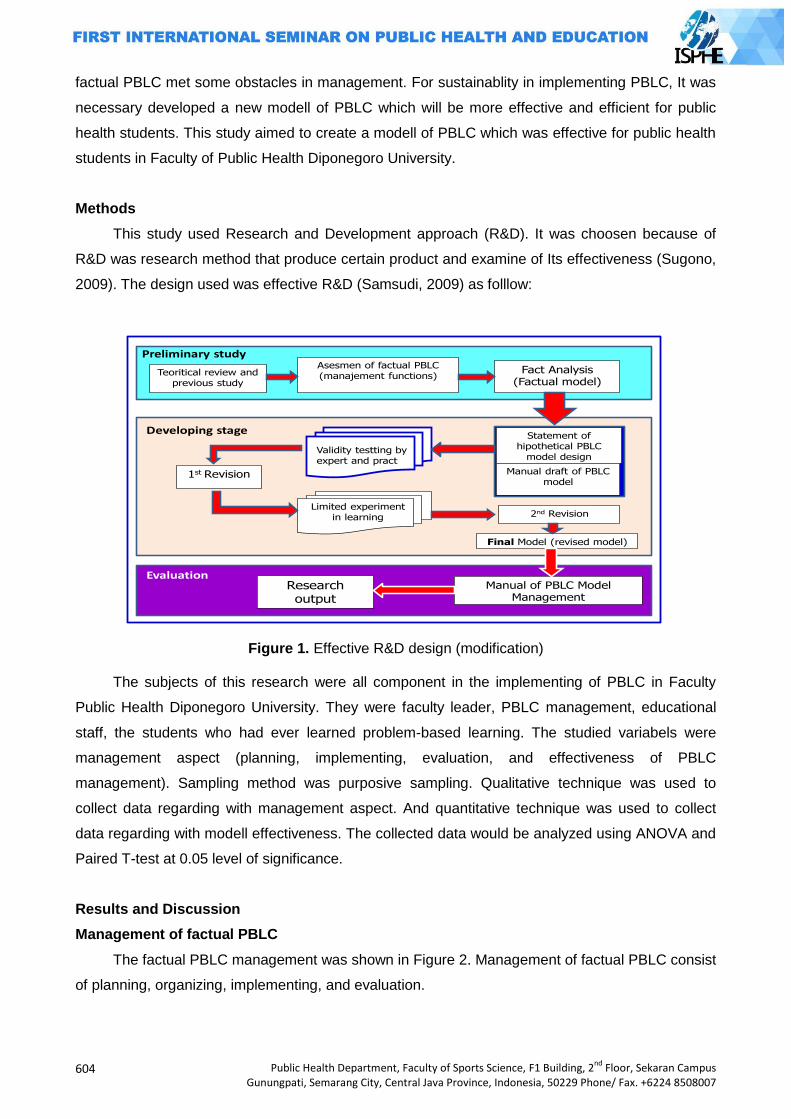
604
Public Health Department, Faculty of Sports Science, F1 Building, 2nd
Floor, Sekaran Campus Gunungpati, Semarang City, Central Java Province, Indonesia, 50229 Phone/ Fax. +6224 8508007
factual PBLC met some obstacles in management. For sustainablity in implementing PBLC, It was
necessary developed a new modell of PBLC which will be more effective and efficient for public
health students. This study aimed to create a modell of PBLC which was effective for public health
students in Faculty of Public Health Diponegoro University.
Methods
This study used Research and Development approach (R&D). It was choosen because of
R&D was research method that produce certain product and examine of Its effectiveness (Sugono,
2009). The design used was effective R&D (Samsudi, 2009) as folllow:
Teoritical review andprevious study
Asesmen of factual PBLC
(manajement functions)Fact Analysis
(Factual model)
1st Revision
2nd Revision
Final Model (revised model)
Manual of PBLC ModelManagement
Research output
Statement of
hipothetical PBLC
model design
Manual draft of PBLC
model
Validity testting by
expert and pract
Limited experiment
in learning
Preliminary study
Developing stage
Evaluation
Figure 1. Effective R&D design (modification)
The subjects of this research were all component in the implementing of PBLC in Faculty
Public Health Diponegoro University. They were faculty leader, PBLC management, educational
staff, the students who had ever learned problem-based learning. The studied variabels were
management aspect (planning, implementing, evaluation, and effectiveness of PBLC
management). Sampling method was purposive sampling. Qualitative technique was used to
collect data regarding with management aspect. And quantitative technique was used to collect
data regarding with modell effectiveness. The collected data would be analyzed using ANOVA and
Paired T-test at 0.05 level of significance.
Results and Discussion
Management of factual PBLC
The factual PBLC management was shown in Figure 2. Management of factual PBLC consist
of planning, organizing, implementing, and evaluation.
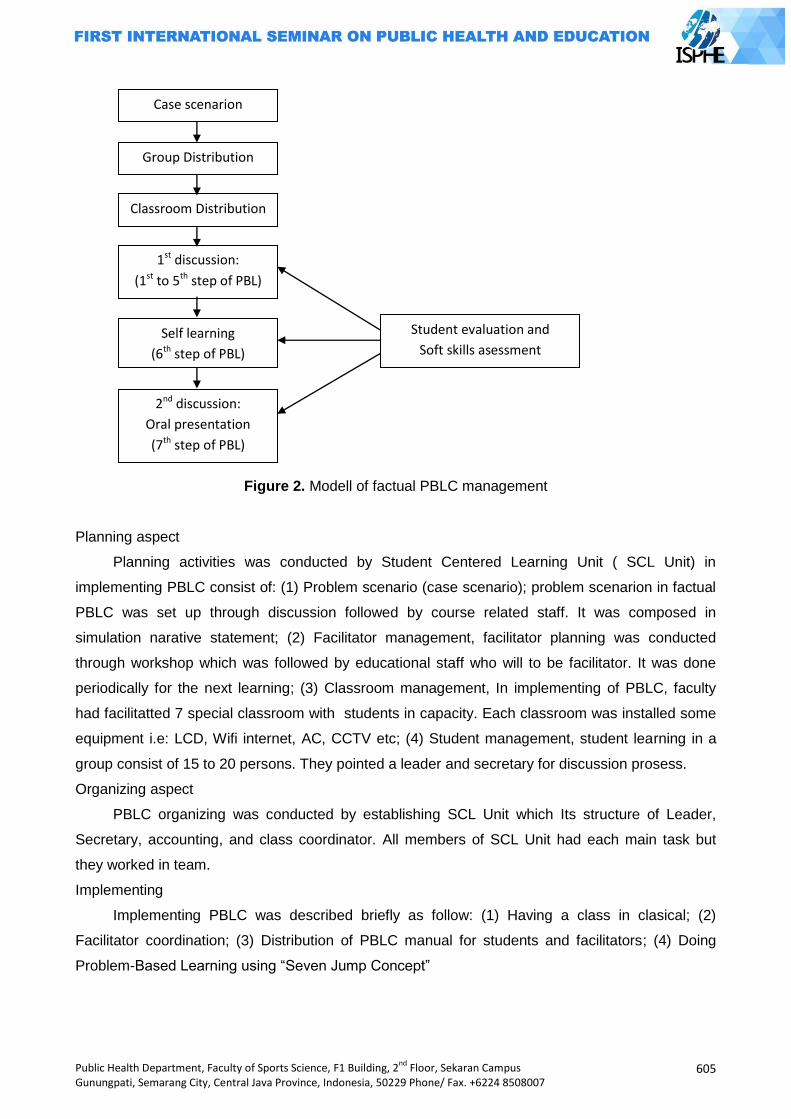
Public Health Department, Faculty of Sports Science, F1 Building, 2nd
Floor, Sekaran Campus Gunungpati, Semarang City, Central Java Province, Indonesia, 50229 Phone/ Fax. +6224 8508007
605
Figure 2. Modell of factual PBLC management
Planning aspect
Planning activities was conducted by Student Centered Learning Unit ( SCL Unit) in
implementing PBLC consist of: (1) Problem scenario (case scenario); problem scenarion in factual
PBLC was set up through discussion followed by course related staff. It was composed in
simulation narative statement; (2) Facilitator management, facilitator planning was conducted
through workshop which was followed by educational staff who will to be facilitator. It was done
periodically for the next learning; (3) Classroom management, In implementing of PBLC, faculty
had facilitatted 7 special classroom with students in capacity. Each classroom was installed some
equipment i.e: LCD, Wifi internet, AC, CCTV etc; (4) Student management, student learning in a
group consist of 15 to 20 persons. They pointed a leader and secretary for discussion prosess.
Organizing aspect
PBLC organizing was conducted by establishing SCL Unit which Its structure of Leader,
Secretary, accounting, and class coordinator. All members of SCL Unit had each main task but
they worked in team.
Implementing
Implementing PBLC was described briefly as follow: (1) Having a class in clasical; (2)
Facilitator coordination; (3) Distribution of PBLC manual for students and facilitators; (4) Doing
Problem-Based Learning using “Seven Jump Concept”
Case scenarion
Group Distribution
Classroom Distribution
1st discussion:
(1st to 5th step of PBL)
Self learning
(6th step of PBL)
2nd discussion:
Oral presentation
(7th step of PBL)
Student evaluation and
Soft skills asessment
606
Public Health Department, Faculty of Sports Science, F1 Building, 2nd
Floor, Sekaran Campus Gunungpati, Semarang City, Central Java Province, Indonesia, 50229 Phone/ Fax. +6224 8508007
Evaluation
Learning assessment in PBLC was conducted by facilitator in 3 form: paper & pencil test,
process assessment, and oral oratation. Evaluator are staff and student also evaluate th.em each
other. Evaluation in PBLC emphasized process than outcome.
The effectiveness of factual PBLC
There were 6 aspects measured to asses the effectiveness of problem-based learning. They
were good teaching (GT), appropriate assessment (AA), clear goal (CG), generic skill ( GS),
appropriate workloading (AW), and independency (IN). The results of assessment was described
in table 1.
The assessment results of PBLC showed that most students stated the quality of learning in
PBLC was not different if compared to other method. The students‟ satisfaction about learning
quality of PBLC was still same as before with everage score of 2.87. This level of satisfaction was
to be over all indicator of PBLC management. Although few aspect of PBLC had increased
student‟s competencies.
Table 1. The everage score of factual PBLC effectiveness
No. Aspect of PBLC measured Everage score
1 Good teaching (GT) 2.90
2 Appropriate Assessment (AA) 2.82
3 Clear goal and standart (CG) 2.87
4 Generic skill (GS) 3.78
5 Appropriate workloading (AW) 3.46
6 Independency (IN) 3.03
7 Overall satisfaction 2.87
Good teaching (GT) aspect of factual PBLC did not indicate a good score yet (2.9). A good
learning process was determined by some factors. Interaction between staf and students, the
easiness in accesing learning resource were to be the main key for the dinamic of learning process
in other to create a good teaching. Educational staff as facilitator had to be able to do their role in
implementing PBLC. Their roles were how to motivate students for learning, give understanding to
the problem, can explain well, and give feedbeck of learning achievement.
Not all facilitator did their role at maximum level in motivating students. This fact was
indicated with scor of activity in motivating students (score 3.1). They did not use the available time
yet to motivate the students (score 2.98). It happened because of the high load of other learning
activities. So, they could not facilitate PBL process in full time.
The role of facilitator to make the PBL proces as a good teaching to be a key for the
effectiveness of PBLC management. It met to Barrows (1992) who stated that tutor had two main
roles in the implementing of PBLC, namely: facilitating the studeny in thinking how to solve the
problem thinking critcally how to learn in order to be self directing learning. Maudsley also stated
that the effectiveness of tutorial process was to be a key of the succesness for PBLC activities
Public Health Department, Faculty of Sports Science, F1 Building, 2nd
Floor, Sekaran Campus Gunungpati, Semarang City, Central Java Province, Indonesia, 50229 Phone/ Fax. +6224 8508007
607
(Hung W, no year). Sometimes, facilitator had to shift their role in reconseptualizing in learning.
Other role that facilitator could do haw to make learning as a good teaching was varies: 1) faclitate
for students‟ team work, 2) the role of model, 3) give feedback, 4) give information, and 5) to force
in developing profesionalism (Aguiar, 2000).
A good teaching condition was also depend on the students‟ anctivity and creativity. They
had to be inisiator of learnig themselves, analyze and solve the problem during the learning
process, and not to long as receiver of information. The student not only redetermine their role in
learning but they had to change their habit in learning (Hung W, no year). The students had to
argue actively over the learning process would create learning environment condusively. They also
had to participate actively a long PBLC process although they felt uncomfort and concious in early
step. This situation (uncomfot and uncertainness level) would decrease significantly in the of the
PBLC process (Schults-Rose and Kaine, 1999).
Issues in students‟ assessment of PBLC process had to be a concern. This research showed
that facilitator gave score of learning achivement was relatively low (2.82). Facilitator gave
asseemnet just only in a grede or sign, i.e: active, less active, and no active. This approach was
felt not so suit by students. Because of students had learned hard in various activities during PBLC
process. They leraned how to understand the problem initially, till syntesize of knowledge from
themselves directed learning.
Unproportional assessment could lower students‟motivation to increase thei knowledge and
skills in the process of learning. Assessment during PBLC cyle could be conducted by students
themselves (self assessment = SA), peer assessmnet (PA), and facilitator/tutor assessment (TA).
What competencies had to be assessed in PBLC management consisted of two aspect: 1) skills
how to discuss, 2) skills how to solve the problem.
Machado (2008) had reported his study in the using of SA, PA, and TA in PBLC process.
The results showed that no significantly difference in median score between SA and PA. On the
other hand, ther was significantly difference of median score between TA and SA. Machado stated
that TA gave score consistenly lower compared to both SA and PA.
The use of PA also gave positive effect on student learning. It indicated that PA caused the
students heard in maximum concern on tutorial process (4.06 + 0.70) at 5 ponts of Likert Scale,
and they became active in supporting group activities (4.06 + 0.76). Overall, students satated that
PA was usefull (3.79 + 0.78, encourage their reponsiility and involvement for work group with the
score of 3.94 + 0.70 (Hodgson Y and Young R, no year).
The only one aspect of PBLC implementing in Faculty of Public Health Diponegoro University
that indicated good score was generic skills (3,78). This indicated that the PBLC process had to be
able increasing students‟ skills. Those skills include: skills in analyze and solve the problem, skills
in tean work, and increase their confidence in solving the problems that they did not know before.
The factual PBLC cycle was less effective although it could increase the skill in problem solving
(besed on students‟ perception). Problem solving activities in factual PBLC was only conceptual
608
Public Health Department, Faculty of Sports Science, F1 Building, 2nd
Floor, Sekaran Campus Gunungpati, Semarang City, Central Java Province, Indonesia, 50229 Phone/ Fax. +6224 8508007
study. The students just only compose problem solving alternative conceptually. No chance for
students to solve the real problem in the community. The concep of problem solving should be
based on fact that student identificated from real world (community). Those fact was determinant
factors that studennts were being studied. It was very important because of problem solving skills o
one the competency that would be achieved in PBLC management. Hung W. Stated that PBLC
had indicated the positive impact on students‟ ability in aplicating their basic knowledge science
and using it to solve the real life problem in the community.
In increasing students‟ skills had to be oriented on the real life problem and they had to be
posed the problem periodically. This concept would give chance for students to increase their skill
in communication, team work (group member, community member, and related institution), and
skills in problem solving. Solving the problem in the community directly would be usefull for their
work in the future. It was met to the competencies belongs to public helath graduate, namely:
knowledge, skills, ecperince, and attitude value (Laaser U, 2010).
The developed of PBLC management model
This PBLC management modell would be implemented clasically (indoor) and learning in the
community (outdoor). It consists of three component: (1) Planning, the first step in this PBLC
management was making a learning plan. It included management components especially material
component (book manual, learning facilities, reference source, log book), man (student and
facilitator), and problem scenario that the students would study. The main charracteristic of this
modell was the use of real life problem as the topic of study. To set this scenario up was making
colaboration with Health Service Center (HSC) or Health District Office (HDO); (2) Implementing,
the second step was learning organizing through coordinating for all component involved in PBLC
management (SCL Unit and facilitators). This activity aimed to get perception equally about task
and function for staf and facilitator, how to implement PBLC cycle, assessment tasks during the
process.
The important thing had to be a concern in implementing PBLC cycle was facilitators had to
explain learning standards that students had to achieve in PBLC. Those standards as follow: (1)
Be able to understand the essensial problem they study; (2) Be able to identify risk factors
supposed related to problem in the community; (3) Be able to set the health problem solving
altervatives; (3) Be able to so solve the health problem in the community directly; (4) Be able to
communcate and build team work in problem solving; (5) Be able to evaluate their activities.
Evaluation
The las task of Unit SCL di PBLC management was to evaluate the learning process overall.
Evaluation was based on the results of the assessments during PBLC cycle was going. They were
conducted by SA, PA, and TA.
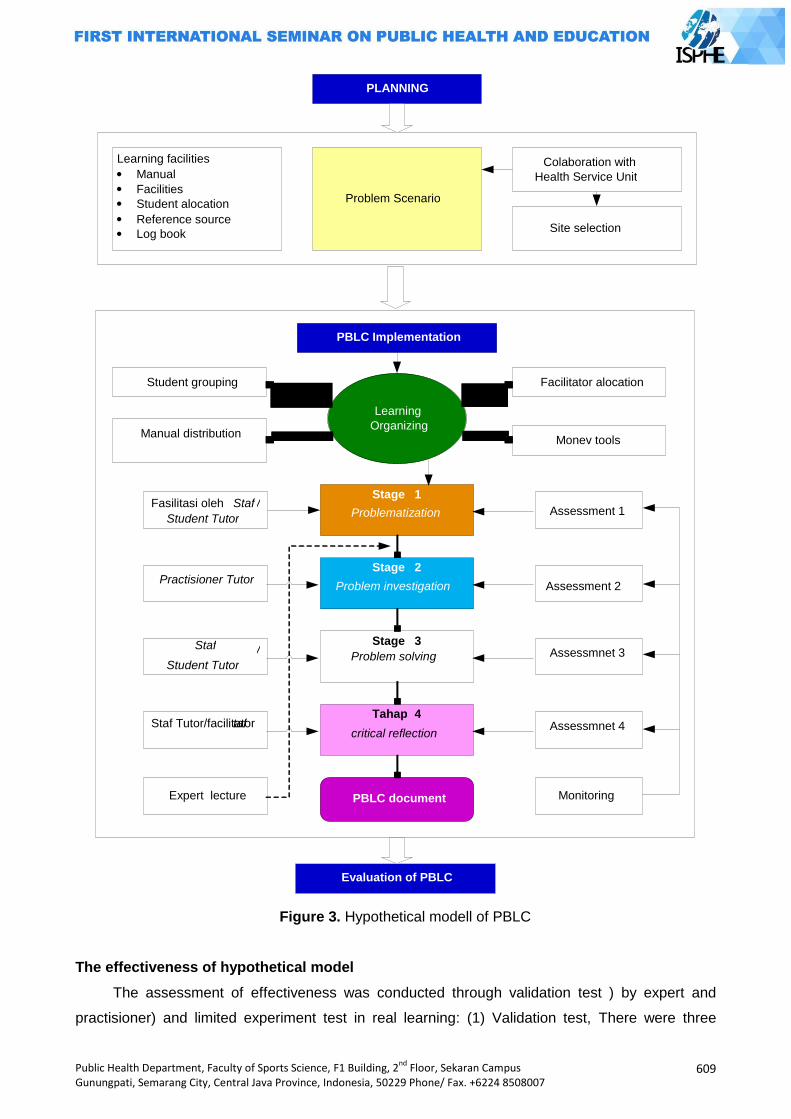
Public Health Department, Faculty of Sports Science, F1 Building, 2nd
Floor, Sekaran Campus Gunungpati, Semarang City, Central Java Province, Indonesia, 50229 Phone/ Fax. +6224 8508007
609
Figure 3. Hypothetical modell of PBLC
The effectiveness of hypothetical model
The assessment of effectiveness was conducted through validation test ) by expert and
practisioner) and limited experiment test in real learning: (1) Validation test, There were three
Learning facilities Manual Facilities Student alocation Reference source Log book
Problem Scenario
Colaboration with Health Service Unit
Site selection
PLANNING
PBLC Implementation
Learning Organizing
Facilitator alocation
Monev tools
Student grouping
Manual distribution
Stage 1
Problematization
Stage 2
Problem investigation
Stage 3
Problem solving
Tahap 4
critical reflection
PBLC document
Assessment 1
Assessment 2
Assessmnet 3
Assessmnet 4
Monitoring
Fasilitasi oleh Staf / Student Tutor
Practisioner Tutor
Staf / Student Tutor
Staf Tutor/facilitator taf
Expert lecture
Evaluation of PBLC
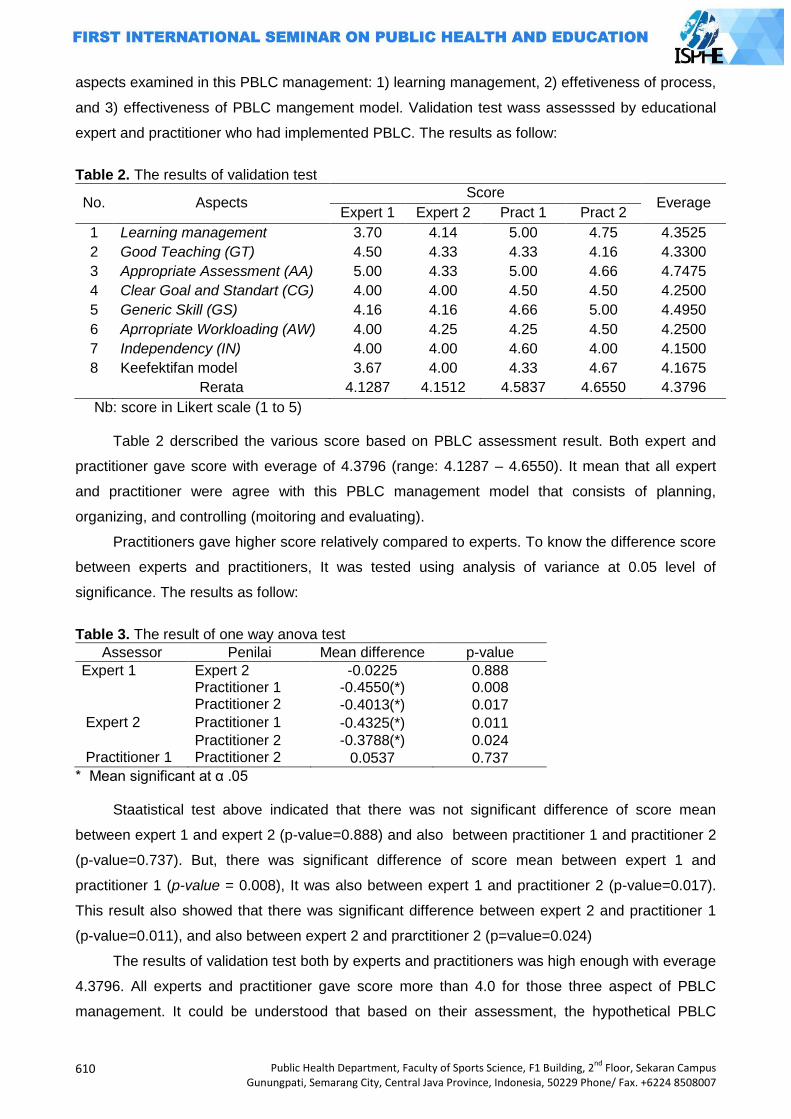
610
Public Health Department, Faculty of Sports Science, F1 Building, 2nd
Floor, Sekaran Campus Gunungpati, Semarang City, Central Java Province, Indonesia, 50229 Phone/ Fax. +6224 8508007
aspects examined in this PBLC management: 1) learning management, 2) effetiveness of process,
and 3) effectiveness of PBLC mangement model. Validation test wass assesssed by educational
expert and practitioner who had implemented PBLC. The results as follow:
Table 2. The results of validation test
No. Aspects Score
Everage Expert 1 Expert 2 Pract 1 Pract 2
1 Learning management 3.70 4.14 5.00 4.75 4.3525
2 Good Teaching (GT) 4.50 4.33 4.33 4.16 4.3300
3 Appropriate Assessment (AA) 5.00 4.33 5.00 4.66 4.7475
4 Clear Goal and Standart (CG) 4.00 4.00 4.50 4.50 4.2500
5 Generic Skill (GS) 4.16 4.16 4.66 5.00 4.4950
6 Aprropriate Workloading (AW) 4.00 4.25 4.25 4.50 4.2500
7 Independency (IN) 4.00 4.00 4.60 4.00 4.1500
8 Keefektifan model 3.67 4.00 4.33 4.67 4.1675
Rerata 4.1287 4.1512 4.5837 4.6550 4.3796
Nb: score in Likert scale (1 to 5)
Table 2 derscribed the various score based on PBLC assessment result. Both expert and
practitioner gave score with everage of 4.3796 (range: 4.1287 – 4.6550). It mean that all expert
and practitioner were agree with this PBLC management model that consists of planning,
organizing, and controlling (moitoring and evaluating).
Practitioners gave higher score relatively compared to experts. To know the difference score
between experts and practitioners, It was tested using analysis of variance at 0.05 level of
significance. The results as follow:
Table 3. The result of one way anova test
Assessor Penilai Mean difference p-value
Expert 1 Expert 2 -0.0225 0.888 Practitioner 1 -0.4550(*) 0.008 Practitioner 2 -0.4013(*) 0.017
Expert 2 Practitioner 1 -0.4325(*) 0.011
Practitioner 2 -0.3788(*) 0.024 Practitioner 1 Practitioner 2 0.0537 0.737
* Mean significant at α .05 Staatistical test above indicated that there was not significant difference of score mean
between expert 1 and expert 2 (p-value=0.888) and also between practitioner 1 and practitioner 2
(p-value=0.737). But, there was significant difference of score mean between expert 1 and
practitioner 1 (p-value = 0.008), It was also between expert 1 and practitioner 2 (p-value=0.017).
This result also showed that there was significant difference between expert 2 and practitioner 1
(p-value=0.011), and also between expert 2 and prarctitioner 2 (p=value=0.024)
The results of validation test both by experts and practitioners was high enough with everage
4.3796. All experts and practitioner gave score more than 4.0 for those three aspect of PBLC
management. It could be understood that based on their assessment, the hypothetical PBLC
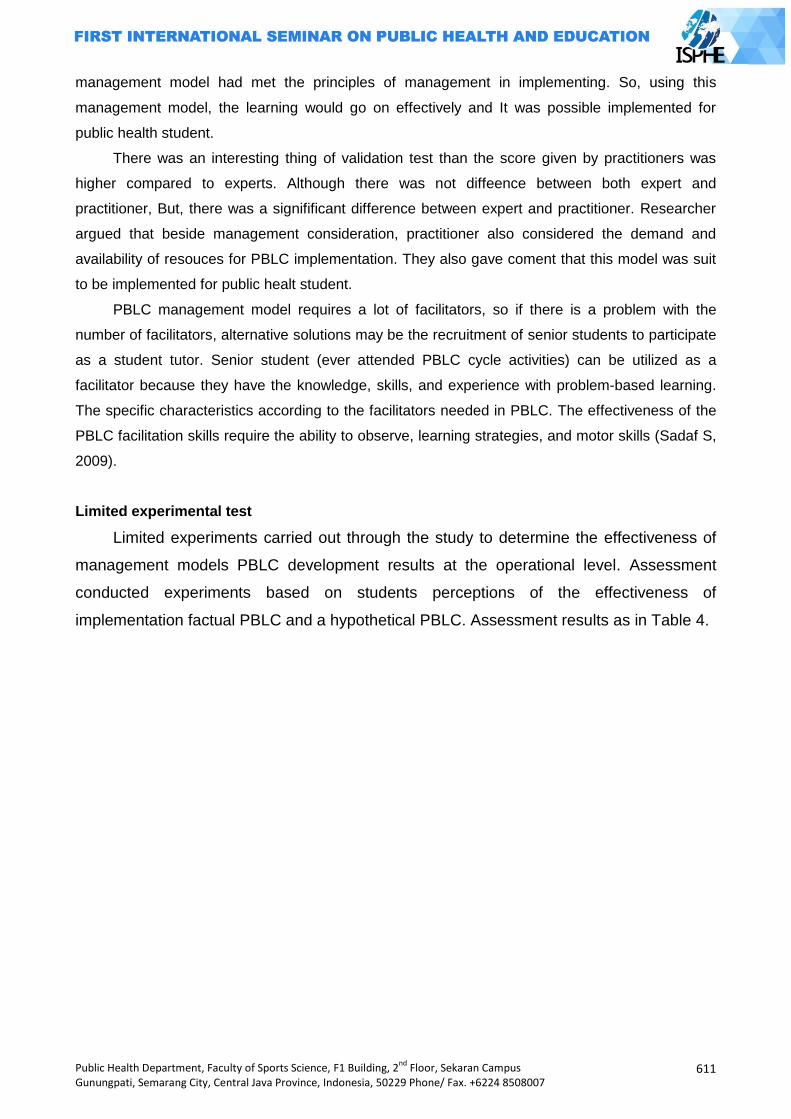
Public Health Department, Faculty of Sports Science, F1 Building, 2nd
Floor, Sekaran Campus Gunungpati, Semarang City, Central Java Province, Indonesia, 50229 Phone/ Fax. +6224 8508007
611
management model had met the principles of management in implementing. So, using this
management model, the learning would go on effectively and It was possible implemented for
public health student.
There was an interesting thing of validation test than the score given by practitioners was
higher compared to experts. Although there was not diffeence between both expert and
practitioner, But, there was a signifificant difference between expert and practitioner. Researcher
argued that beside management consideration, practitioner also considered the demand and
availability of resouces for PBLC implementation. They also gave coment that this model was suit
to be implemented for public healt student.
PBLC management model requires a lot of facilitators, so if there is a problem with the
number of facilitators, alternative solutions may be the recruitment of senior students to participate
as a student tutor. Senior student (ever attended PBLC cycle activities) can be utilized as a
facilitator because they have the knowledge, skills, and experience with problem-based learning.
The specific characteristics according to the facilitators needed in PBLC. The effectiveness of the
PBLC facilitation skills require the ability to observe, learning strategies, and motor skills (Sadaf S,
2009).
Limited experimental test
Limited experiments carried out through the study to determine the effectiveness of
management models PBLC development results at the operational level. Assessment
conducted experiments based on students perceptions of the effectiveness of
implementation factual PBLC and a hypothetical PBLC. Assessment results as in Table 4.
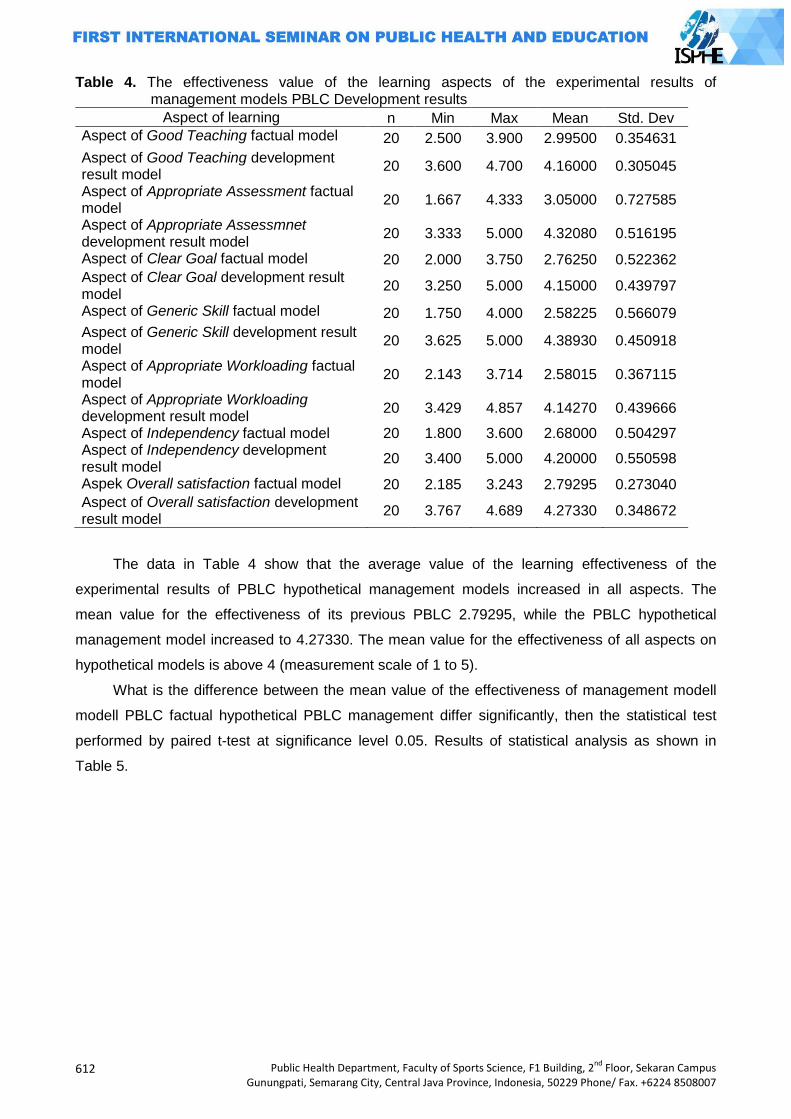
612
Public Health Department, Faculty of Sports Science, F1 Building, 2nd
Floor, Sekaran Campus Gunungpati, Semarang City, Central Java Province, Indonesia, 50229 Phone/ Fax. +6224 8508007
Table 4. The effectiveness value of the learning aspects of the experimental results of management models PBLC Development results
Aspect of learning n Min Max Mean Std. Dev
Aspect of Good Teaching factual model 20 2.500 3.900 2.99500 0.354631
Aspect of Good Teaching development result model
20 3.600 4.700 4.16000 0.305045
Aspect of Appropriate Assessment factual model
20 1.667 4.333 3.05000 0.727585
Aspect of Appropriate Assessmnet development result model
20 3.333 5.000 4.32080 0.516195
Aspect of Clear Goal factual model 20 2.000 3.750 2.76250 0.522362
Aspect of Clear Goal development result model
20 3.250 5.000 4.15000 0.439797
Aspect of Generic Skill factual model 20 1.750 4.000 2.58225 0.566079
Aspect of Generic Skill development result model
20 3.625 5.000 4.38930 0.450918
Aspect of Appropriate Workloading factual model
20 2.143 3.714 2.58015 0.367115
Aspect of Appropriate Workloading development result model
20 3.429 4.857 4.14270 0.439666
Aspect of Independency factual model 20 1.800 3.600 2.68000 0.504297 Aspect of Independency development result model
20 3.400 5.000 4.20000 0.550598
Aspek Overall satisfaction factual model 20 2.185 3.243 2.79295 0.273040
Aspect of Overall satisfaction development result model
20 3.767 4.689 4.27330 0.348672
The data in Table 4 show that the average value of the learning effectiveness of the
experimental results of PBLC hypothetical management models increased in all aspects. The
mean value for the effectiveness of its previous PBLC 2.79295, while the PBLC hypothetical
management model increased to 4.27330. The mean value for the effectiveness of all aspects on
hypothetical models is above 4 (measurement scale of 1 to 5).
What is the difference between the mean value of the effectiveness of management modell
modell PBLC factual hypothetical PBLC management differ significantly, then the statistical test
performed by paired t-test at significance level 0.05. Results of statistical analysis as shown in
Table 5.
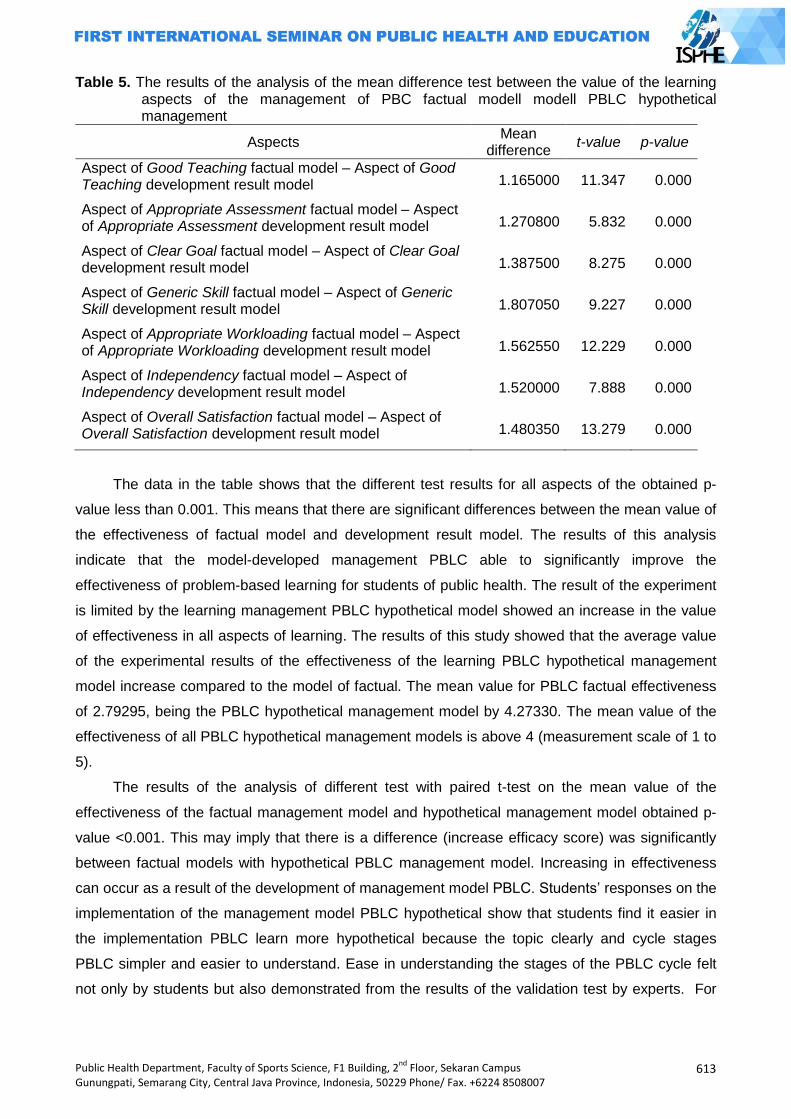
Public Health Department, Faculty of Sports Science, F1 Building, 2nd
Floor, Sekaran Campus Gunungpati, Semarang City, Central Java Province, Indonesia, 50229 Phone/ Fax. +6224 8508007
613
Table 5. The results of the analysis of the mean difference test between the value of the learning aspects of the management of PBC factual modell modell PBLC hypothetical management
Aspects Mean
difference t-value p-value
Aspect of Good Teaching factual model – Aspect of Good Teaching development result model 1.165000 11.347 0.000
Aspect of Appropriate Assessment factual model – Aspect of Appropriate Assessment development result model 1.270800 5.832 0.000
Aspect of Clear Goal factual model – Aspect of Clear Goal development result model 1.387500 8.275 0.000
Aspect of Generic Skill factual model – Aspect of Generic Skill development result model 1.807050 9.227 0.000
Aspect of Appropriate Workloading factual model – Aspect of Appropriate Workloading development result model 1.562550 12.229 0.000
Aspect of Independency factual model – Aspect of Independency development result model 1.520000 7.888 0.000
Aspect of Overall Satisfaction factual model – Aspect of Overall Satisfaction development result model 1.480350 13.279 0.000
The data in the table shows that the different test results for all aspects of the obtained p-
value less than 0.001. This means that there are significant differences between the mean value of
the effectiveness of factual model and development result model. The results of this analysis
indicate that the model-developed management PBLC able to significantly improve the
effectiveness of problem-based learning for students of public health. The result of the experiment
is limited by the learning management PBLC hypothetical model showed an increase in the value
of effectiveness in all aspects of learning. The results of this study showed that the average value
of the experimental results of the effectiveness of the learning PBLC hypothetical management
model increase compared to the model of factual. The mean value for PBLC factual effectiveness
of 2.79295, being the PBLC hypothetical management model by 4.27330. The mean value of the
effectiveness of all PBLC hypothetical management models is above 4 (measurement scale of 1 to
5).
The results of the analysis of different test with paired t-test on the mean value of the
effectiveness of the factual management model and hypothetical management model obtained p-
value <0.001. This may imply that there is a difference (increase efficacy score) was significantly
between factual models with hypothetical PBLC management model. Increasing in effectiveness
can occur as a result of the development of management model PBLC. Students‟ responses on the
implementation of the management model PBLC hypothetical show that students find it easier in
the implementation PBLC learn more hypothetical because the topic clearly and cycle stages
PBLC simpler and easier to understand. Ease in understanding the stages of the PBLC cycle felt
not only by students but also demonstrated from the results of the validation test by experts. For
614
Public Health Department, Faculty of Sports Science, F1 Building, 2nd
Floor, Sekaran Campus Gunungpati, Semarang City, Central Java Province, Indonesia, 50229 Phone/ Fax. +6224 8508007
example, the use of certain types of diseases as a real life problem gives students easy to
understand the problem (in the problematization stage).
Assessment of learning outcomes of the easiest is to provide a test that is indicated by a
value. However, it can not describe the actual performance of the results of a study. The most
pragmatic approach in the evaluation of adult education is to focus on students' perceptions of their
experiences during the learning program, and this approach has been widely used in various
studies. The most realistic indicators to measure the success of adult learning programs is the
perception held by students on their own learning or the students’ own perception of their learning
(Sybille K. Lechner, 2001).
The aspect of appropriate assessment in this PBLC management model to obtain a high
value (up to 5). Assessment of learning in this hypothetical model using 3 assessors (self
assessment, peer assessment, dan tutor assessment) with different weights. The concept of
assessment in this model observe the principles of justice, so that the validator says with the sort
of assessment is appropriate for problem-based learning. The assessment was conducted more
emphasis on the process of learning activities undertaken by students during the running cycle
PBLC, rather than on the achievement of knowledge. This is consistent with the suggestion that
the teaching model based on learning focus problem is not the acquisition of declarative
knowledge. Assessment and evaluation techniques appropriate to the problem based learning
model is to assess the students' work produced is the result of their investigation, as observed
above discussion capabilities, the ability to use prior knowledge, the ability to formulate problems,
ability to work in groups, and observation of student participation in action in solving real problems
(Trianto, 2007).
Students also gain new experiences on the implementation of management modell PBLC
hypothetical. Students stated that the modell hypothetical Cycle PBLC able to provide insights to
participants in PBLC hypothetical PBLC because not only learn theory but also discover facts on
the ground (the community). This activity gives students an opportunity to match the cause of the
disease based on the theory and the fact that there is in the community. Participants also felt
hypothetical cycle PBLC not suppose to solve problems but can intervene based on real facts
found in the community.
Closing
This research concluded that the developed PBLC management model was effective for
public helath student (score 4.1675). It consist of management function: planning, organizing, and
evaluation. Learning was conducted indoor and outdor activities with four steps, namely
problematization, problem investigation, problem solving, dan critical reflection. Paired T-test
showed that the new model of PBLC was more effective compared to factual model (p-
value<0.05). It was hoped that the developed PBLC management model caould increase the
effectivity of learning for public health student.
Public Health Department, Faculty of Sports Science, F1 Building, 2nd
Floor, Sekaran Campus Gunungpati, Semarang City, Central Java Province, Indonesia, 50229 Phone/ Fax. +6224 8508007
615
References
Aguiar, A.C. 2000. Consequences for faculty of changes in Medical Education: The experience of tutoring a course about the patient-doctor relationship. Boston, Harvard University.
Hasbullah. 2006. Otonomi Pendidikan: Kebijakan Otonomi Daerah dan Implikasnya terhadap Penyelenggaraan Pendidikan. Jakarta: PT. Raja Grafindo Persada.
Hodgson, Y., Young R. no year. Peer and self-assessmnet of peer-led tutorials to promome student angagement. School of Biomedical Sciences, Faculty of Medicine, Nursing and Health Sciences, Monash University, [email protected].
Hung, W, no year. Problem-based learning, Chapter 38. University of Arizona South, Sierra Vista, Arizona.
Laaser, U. 2010. Public Health Competencies and Performance Standards. World Federation of Public Health Associations. Presented in: 11th National Congress of the Indonesia Public Health Association, Bandung August 3-5.
Lechner, S.K. 2001. Evaluation of Teaching and Learning Strategy. Med Educ Online (serial online), 6 (4) : 1-5. Available from URL http://www.med-ed-online.org.
Machado, J.L.M, et al. 2008. Self-and peer assessment may not be an accurate measure of PBL tutorial process. BMC Medical Education, 8 (55) : 1-6.
Sadaf, S., Ali, S.K., Zuberi, R.W. 2009. Problem_based Learning: Enhanching Tutor‟s Facilitation Skills Using Structured Small Group Experiental Learning. Education for Health, 22 (1) : 1-7.
Samsudi. 2009. Disain Penelitian Pendidikan. Cetakan kedua. Semarang: UNNES PRESS. Schultz-Rose, R.A., Kline A.E. 1999. Using problem-based learning to teach forensic psychiatry.
Acad. Psychiatry : 37-41.
Sudibyo, B. 2009. Problematika dan Arah Kebijakan Pendidikan Nasional 2010-2014. Disampaikan pada seminar Persatuan Guru Republik Indonesia. Semarang, 9 Juli 2009.
Sugiyono. 2009. Metode Penelitian Pendidikan: Pendekatan Kuantitatif, Kualitatif, dan R&D. Bandung: Penerbit Alfabeta.
Suwondo, A, dkk. 2009. Pedoman Akademik Fakultas Kesehatan Masyarakat Universitas Diponegoro 2009-2010.
Trianto. 2007. Modell-Modell Pembelajaran Inovatif Berorientasi Konstruksivistik: Konsep, Landasan Teoritis – Praktis, dan Implemtasinya. Jakarta: Prestasi Pustaka.

616
Public Health Department, Faculty of Sports Science, F1 Building, 2nd
Floor, Sekaran Campus Gunungpati, Semarang City, Central Java Province, Indonesia, 50229 Phone/ Fax. +6224 8508007
Public Health Department, Faculty of Sports Science, F1 Building, 2nd
Floor, Sekaran Campus Gunungpati, Semarang City, Central Java Province, Indonesia, 50229 Phone/ Fax. +6224 8508007
617
IMPROVING HEALTH, CHILDCARE AND
QUALITY OF MOTHER PAPERS

618
Public Health Department, Faculty of Sports Science, F1 Building, 2nd
Floor, Sekaran Campus Gunungpati, Semarang City, Central Java Province, Indonesia, 50229 Phone/ Fax. +6224 8508007
Public Health Department, Faculty of Sports Science, F1 Building, 2nd
Floor, Sekaran Campus Gunungpati, Semarang City, Central Java Province, Indonesia, 50229 Phone/ Fax. +6224 8508007
619
COMMUNITY EMPOWERMENT PLANNING IN THE EXCLUSIVE BREAST FEEDING BY INTERVENTION MAPPING
(Case Studies in Kota Wilayah Selatan Public Health Center of Kediri)
Nurnaningsih Herya Ulfah
Malang State University, Indonesia
Corresponding Author: [email protected]
Abstract Introduction: Kota Wilayah Selatan Public Health Center of Kediri is a public health center that had less performance achievement in the community empowerment activities of the exclusive breastfeeding, in 2010 was 67% and in 2011 was 35% of the target ≥ 80%. Methods: The objective of this study was to arrange a recommendation the community empowerment activities planning of the exclusive breastfeeding by intervention mapping in Kota Wilayah Selatan Public Health Center of Kediri. This research was a descriptive study with cross-sectional design. The variables were the evaluation of community empowerment and the PRECEDE model as the community needs approach. Results: The study results showed the evaluation in the community empowerment of the exclusive breastfeeding that the community participation, the social functioning, the institutional development, the increased capacity and the social capital level were in the low category. Intervention mapping steps resulted detail of activities in the community empowerment program of the exclusive breastfeeding. They were the socialization of the importance of exclusive breastfeeding, the policy advocacy of increased breastfeeding in the region of city, the reactivation team of exclusive breastfeeding support network in the region of Kediri city, the increased capacity of health workers and the implementation of early breastfeeding initiation. Key Word: Community empowernment, Exclusive Breast Feeding, Intervention mapping. Introduction
One of the community‟s health indicators is the Infant Mortality Rate (IMR). IMR can be
caused by many factors, namely the level of family education, family socioeconomic
circumstances, value systems and customs, hygiene and environmental health, and health
services are available, in addition to the factor of infant mortality is also influenced by problems of
delivery, breastfeeding (breast milk) and additional food and immunization. One of the goals of
Millennium Development Goals (MDGs) 2015 is decreasing in the infant mortality rate (IMR) and
kids under five with 23 targets per1.000 live births in 2015 One of the factors that can lower IMR is
exclusive breastfeeding.
Breast milk is the first food, main, and best for the baby, which is natural. Breast milk
contains nutrients that are needed in the process of growth and development of infants. Related to
that, there is a thing that needs to be unfortunate, which is the lack of understanding mothers,
families, and communities about the importance of breastfeeding for the baby. As a result,
exclusive breastfeeding program does not take place in optimally (Prasetyono, 2009). In addition to
reducing mortality among infants and toddlers, breastfeeding can reduce the risk of bleeding that is
a major cause of maternal mortality. Exclusive breastfeeding is also one method of preventing an
increase in births. This shows the effect of breastfeeding on the mother's health which is the goal
of the MDGs (Dinkes Jatim, 2012).
Indonesian data show that breastfeeding not meet the national target of 80%. Based on
demographic and health survey of Indonesia 2007-2010, only 48% of mothers who exclusively
breastfed. In Indonesia, most of the mothers give only 2 months of exclusive breastfeeding, while
formula feeding increased three times more than before. According to the data of Bappenas in
620
Public Health Department, Faculty of Sports Science, F1 Building, 2nd
Floor, Sekaran Campus Gunungpati, Semarang City, Central Java Province, Indonesia, 50229 Phone/ Fax. +6224 8508007
2010, stated that only 31% of infants in Indonesia get exclusive breastfeeding until 6months. And
according to the latest data from Health Research (Riskesdas) 2013, breastfeeding in infants aged
6 months just reached 30.2%. in case, Kota Wilayah Selatan Public Health Center of Kediri is a
public health center that had less performance achievement in the community empowerment
activities of the exclusive breastfeeding, in 2010 was 67% and in 2011 was 35% of the target ≥
80%.
Construct
Based on Government Regulation (PP) of the Republic of Indonesia Number 33 of 2012 on
exclusive breastfeeding, breast milk, Exclusive breast feeding is breast milk given to the baby since
birth for 6 (six) months, without adding and/or replacing with food or other beverages.
Breastfeeding a baby can bring benefits for infants, mothers, families, communities, and countries.
As the most perfect baby food, breast milk is easily digested and absorbed as they contain
digestive enzymes.
During this period, ASI exclusive increased by conduct Early breasfeeding initiation and ASI
exclusive program. There are three activities in this program that is observation of the situation,
dissemination of the observation result, and activities intervention. However, this program in fact
is not capable yet in increasing community participation in ASI exclusive because the target groups
is only as program‟s object so they don‟t feel to have any attachment to ASI exclusive program,
and also no evaluation planning in this program so evaluation of program implementation is not
noticed to be important.
Indonesia Government's efforts in increasing ASI Exclusive in addition to the program is the
Peraturan Pemerintah Nomor 33 Tahun 2012 tentang pemberian ASI Eksklusif. In PP No 33
Tahun 2012 are explained about the responsibility of the Central Government to the regions as
well as solutions to face the obstacles of ASI Exclusive that is Donors breast-fed (donors ASI), the
use of formula milk and administrative sanctions provided to health workers and health services
facilities organizers if they were not support ASI Exclusive. However, this regulations was
apparently not thoroughly socialized so both health workers and the community have not been
aware of any of these regulations
Qualitative study of the promotion of exclusive breastfeeding were performed by Abba in
2009, showed similar results with a study of 900 mothers around Jabodetabek in 2002, that
mothers and families were lack of information about exclusive breastfeeding from health workers
so there needs to be an increase in promotional activity by health workers professional and regular
supervision by the relevant institutions in an effort to increase exclusive breastfeeding.
According to Siregar (2004), there are various reasons put forward by the mother who does
not exclusively breast feed their babies; mothers feel less milk production, difficulty in sucking
infants, working mothers, the desire for so-called modern and the influence of
advertising/promotion of breast milk substitutes. Meanwhile, the Ministry of Women's
Empowerment (2007), a major problem in Indonesia is low breastfeeding is socio-cultural factors,
lack of knowledge of the importance of breastfeeding and the promotion of infant formula.
By studying the shortcomings of previous programmes therefore the approaches that can be
used to succeed ASI exclusive program is by used bottom up approach that is involving the
community not just as objects of the program but also included them in the determination of
activities that will be done to succeed ASI exclusive. This approach will use the actual intervention
mapping method that has been widely used by other countries to address health problems that
emerge.
Intervention Mapping (IM) is based on the health promotion approach, encourages the use of
theory and evidence, based on an ecological approach, encourages participation of stakeholders in
planning; and it acknowledges that intervention planning is not a static but rather an iterative
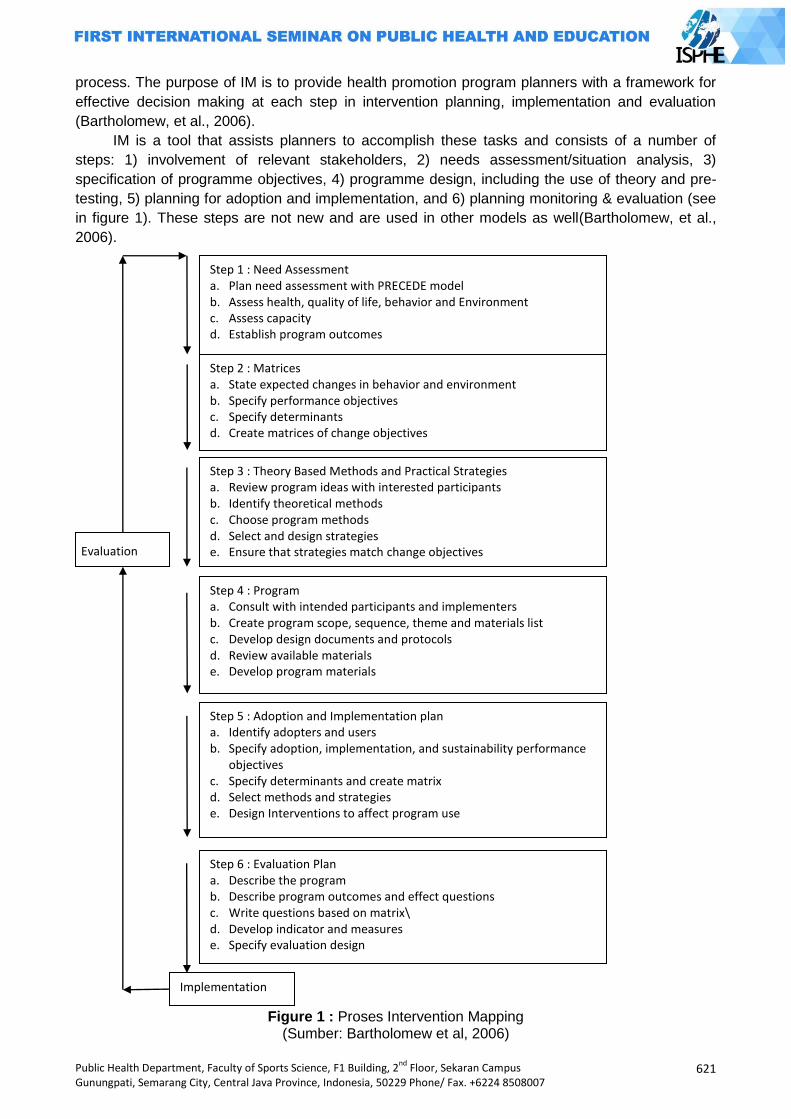
Public Health Department, Faculty of Sports Science, F1 Building, 2nd
Floor, Sekaran Campus Gunungpati, Semarang City, Central Java Province, Indonesia, 50229 Phone/ Fax. +6224 8508007
621
process. The purpose of IM is to provide health promotion program planners with a framework for
effective decision making at each step in intervention planning, implementation and evaluation
(Bartholomew, et al., 2006).
IM is a tool that assists planners to accomplish these tasks and consists of a number of
steps: 1) involvement of relevant stakeholders, 2) needs assessment/situation analysis, 3)
specification of programme objectives, 4) programme design, including the use of theory and pre-
testing, 5) planning for adoption and implementation, and 6) planning monitoring & evaluation (see
in figure 1). These steps are not new and are used in other models as well(Bartholomew, et al.,
2006).
Figure 1 : Proses Intervention Mapping
(Sumber: Bartholomew et al, 2006)
Step 1 : Need Assessment a. Plan need assessment with PRECEDE model b. Assess health, quality of life, behavior and Environment c. Assess capacity d. Establish program outcomes
Step 2 : Matrices a. State expected changes in behavior and environment b. Specify performance objectives c. Specify determinants d. Create matrices of change objectives
Step 3 : Theory Based Methods and Practical Strategies a. Review program ideas with interested participants b. Identify theoretical methods c. Choose program methods d. Select and design strategies e. Ensure that strategies match change objectives
Step 4 : Program a. Consult with intended participants and implementers b. Create program scope, sequence, theme and materials list c. Develop design documents and protocols d. Review available materials e. Develop program materials
Step 5 : Adoption and Implementation plan a. Identify adopters and users b. Specify adoption, implementation, and sustainability performance
objectives c. Specify determinants and create matrix d. Select methods and strategies e. Design Interventions to affect program use
Step 6 : Evaluation Plan a. Describe the program b. Describe program outcomes and effect questions c. Write questions based on matrix\ d. Develop indicator and measures e. Specify evaluation design
Implementation
Evaluation
622
Public Health Department, Faculty of Sports Science, F1 Building, 2nd
Floor, Sekaran Campus Gunungpati, Semarang City, Central Java Province, Indonesia, 50229 Phone/ Fax. +6224 8508007
IM starts with an analysis of the needs, problems, capacities and opportunities among the
target population, and the wider community (IM Step 1). This analysis addresses people‟s quality
of life, health concerns, behavioural and environmental factors and determinants. And it also
explores the capacity within a community and among the target population that are potentially
useful in improving people‟s health (Bartholomew, et al., 2006).
Step 2 in IM addresses the specification of the general program objectives into specific
change objectives that explicate who and what will change as a result of the intervention. Change
objectives specify what individuals need to learn or what must be changed in the organisational or
community environment. They may refer to individual level change, organisational level change, or
community level change (Bartholomew, et al., 2006).
The next step in IM is to select theoretically based intervention methods that may be effective
in achieving the objectives and to decide upon practical strategies to operationalise these methods.
For instance, a theoretical method that describes how to enhance self-efficacy is modelling. A
practical strategy for this method could be role-playing and/or watching models on a video.
Theoretical intervention methods can be derived from the scientific literature and information about
the feasibility and effectiveness of practical strategies can be derived from needs assessments,
contacts with other health promoters, collaboration with program implementers and users, and
from small-scale pilots (Bartholomew, et al., 2006).
Step 4 in IM is Program. This step involves organising the strategies into a deliverable
program with components that are comprehensible and acceptable to program implementers and
participants. IM can help developers to specify the scope and sequence of program components,
the channels of delivery of intervention strategies, and how each program component will reach
program participants (Bartholomew, et al., 2006).
IM step 5 describes how programme planners can set objectives for programme adoption,
implementation and maintenance and link these objectives to theoretical methods and practical
strategies for promoting adoption and implementation. Thus interventions are required, not only to
change individual behaviour, but also to facilitate program adoption and implementation. In
addition, programme planning can address the sustainability of the program to encourage
institutionalisation of the program to ensure programme impact over an extended period of time.
Finally, IM step 6 focuses on evaluation. Programme planners develop instruments to
evaluate the impact of the intervention on behavioural determinants and behaviour. They also
specify the time frame appropriate for expected outcomes. These tasks generate a monitoring and
evaluation plan (Bartholomew, et al., 2006).
Methods
This research was a descriptive study with cross-sectional design. The variables in this study
were the community empowerment and the steps of intervention mapping. The community
empowerment were : a) the community participation, b) the social functioning, c) the institutional
development d) the increased capacity; e) the social capital level. The steps of mapping
intervention were: a) the need assessment, b) the definition of the change objectives matrix, c) the
selection of methods and strategies, d) the program planning, e) the adoption and implementation
planning, f) the evaluation planning.
Results and Discussion
The results of this study represented the evaluation in the community empowerments of the
exclusive breastfeeding was low because the community participation, the social functioning, the
institutional development, the increased capacity and the social capital level were in the low
category. The first step of intervention mapping was the need assessment, based on PRECEDE
model suggested that in the exclusive breastfeeding the public needed belief, the community
Public Health Department, Faculty of Sports Science, F1 Building, 2nd
Floor, Sekaran Campus Gunungpati, Semarang City, Central Java Province, Indonesia, 50229 Phone/ Fax. +6224 8508007
623
support, the health workers support and the media support, regulations and budget of exclusive
breastfeeding program.
The second step of intervention mapping was the objectives matrix in the community
empowerment program of the exclusive breastfeeding that resulted performance objectives. They
were the community participation, the social functioning, the institutional development, the
increased capacity, the social capital level and the determinants of change that were belief, the
community support, the health workers support and the media support.
The third step was methods and strategies in community empowerment program of exclusive
breastfeeding. Increased belief of exclusive breastfeeding as the determinant of change was used
social modelling method, public support in the community empowerment of exclusive breastfeeding
program used the advocacy method, health workers support in community empowerment of
exclusive breastfeeding used goal setting method and media support in community empowerment
of exclusive breastfeeding was media advocacy.
The fourth and fifth steps were program planning, and adoption and implementation planning
in community empowerment program of exclusive breastfeeding. They were the socialization of the
importance of exclusive breastfeeding, the policy advocacy of increased breastfeeding in the
region of city, the reactivation team of exclusive breastfeeding support network in the region of
Kediri city, the increased capacity of health workers, the implementation of Early Breastfeeding
Initiation.
The sixth step was the evaluation planning in the community empowerment program of the
exclusive breastfeeding that include the output evaluation plannings and the process evaluation
plannings. The output evaluation plannings were the determinant of community participation, the
social functioning, the institutional development, the increased capacity and the social capital level.
The process evaluation plannings were the socialization of the importance of exclusive
breastfeeding, the policy advocacy of increased breastfeeding in the region of city, the reactivation
team of exclusive breastfeeding support network in the region of Kediri city, the increased capacity
of health workers, the implementation of Early Breastfeeding Initiation.
Closing
Intervention mapping is a method that seems to have not been widely used in Indonesia, and
if been used is only limited to research interest. This planning method can be used to increase
community participation in health program, one of them is ASI exclusive. ASI exclusive can not
increase only by Counseling and consultation during pregnancy examination. The target of this
program is not only mother and family but also health workers who help childbirth.
ASI exclusive program often considered to be successful because during pregnancy
examination mother has already given information regarding ASI (breast fed),, but This step is
less successful because in the fifth month, a baby has received food besides ASI, by reason of
limited amount of ASI.
Intervention mapping planning method emphasize the importance of need assessment as
the basis of a program that will be conducted . in this Intervention mapping, health workers does
not determine the activities of the program but all the approved activities should have derived from
the target groups. The involvement of the targets in every stage can bring up a sense of belonging
of the program so that the success of programs can be achieved.
A recommendation of this study was a document of the community empowerment activities
planning of exclusive breastfeeding by intervention mapping approach in Kowilsel Public Health
Center of Kediri. It included detail of activities in the community empowerment program of
exclusive breastfeeding that were the socialization of the importance of exclusive breastfeeding,
the policy advocacy of increased breastfeeding in the region of city, the reactivation team of
exclusive breastfeeding support network in the region of Kediri city, the increased capacity of
health workers, the implementation of early breastfeeding initiation.
624
Public Health Department, Faculty of Sports Science, F1 Building, 2nd
Floor, Sekaran Campus Gunungpati, Semarang City, Central Java Province, Indonesia, 50229 Phone/ Fax. +6224 8508007
References
Allen, J. & Meyer, I., 1990. The Measurement and Antecedents of Affective,Continuance and Normative Commitment to the Organization. Journal of Occupational Psychology, pp. 1-18.
Azwar, A., 1996. Pengantar Administrasi Kesehatan. Jakarta: Sinar Harapan. Bartholomew, L. K., Parcel, G. S., Kok, G. & Gottlied, N. H., 2006. Planning Health Promotion : An
Intervention Mapping Approach 2nd edition. 2 ed. san francisco: Jossey-Bass. Bartle, P., 2010. Community Empowerment, How Do We Assist Communities to Become
Stronger?, s.l.: http://cec.vcn.bc.ca/cmp/modules/emp-int.htm. Bernadin, J., 2003. Human Resource Management, an Experimental Aproach. Boston: Mc. Graw-
Hill. Depkes, RI., 2004a. Keputusan Menteri Kesehatan RI Nomor 128/MENKES/SK/II/2004 ttg
Kebijakan Dasar Pusat Kesehatan Masyarakat, Jakarta: Depkes RI. Depkes, RI., 2004b. Keputusan Menteri Kesehatan Republik Indonesia nomor
1193/MENKES/SK/X/2004 tentang Kebijakan Nasional Promosi Kesehatan, Jakarta: Depkes RI
Depkes, RI., 2005. Keputusan Menteri Kesehatan Nomor 114/Menkes/SK/VII/2005 tentang Pedoman Pelaksanaan Promosi Kesehatan di Daerah. Jakarta: Depkes RI
Depkes, RI., 2007. Keputusan Menteri Kesehatan Republik Indonesia nomor: 585/MENKES/SK/V/2007 Tentang Pedoman Pelaksanaan Promosi Kesehatan di Puskesmas. Jakarta: Depkes RI.
Depkes, RI., 2009. Pedoman Penilaian Kinerja Puskesmas. Jakarta: Depkes RI Dinkes Jatim, 2012. Pekan Asi Sedunia (WBW) 2012 Dan Realisasinya Di Dinas Kesehatan
Provinsi Jawa Timur. http://dinkes.jatimprov.go.id/userimage/WBW%202012%20dan%20Realisasi%20di%20Dinas%20Kesehatan%20Provinsi%20Jawa%20Timur.pdf [diakses 5 februari 2013]
Fahrudin, A., 2010. Pemberdayaan, Partisipasi dan Penguatan Kapasitas Masyarakat. Bandung: Humaniora Utama Press.
Fetterman, D. & Wandersman, A., 2007. Empowerment Evaluation Yesterday, Today and Tomorrow. American Journal of Evaluation 28, 2, pp. 179 - 198.
Gibson, Ivancevich, James, L., John M., D., & Jr, J. H., 1995. Organisasi dan Manajemen (alih bahasa). Jakarta: Erlangga.
Gilmore & Campbell, 1996. Need assessment strategies for health education and health promotion. 2nd ed. Madison WI: Brown & Benchmark.
Goodman, R., Speers, McLeroy, Fawcett, Kegler, & Parker, 1998. Identifying and defining the dimensions of community capacity to provide a basis for measurement. Health Education and Behaviour, Issue 25, pp. 258-278.
Green & Kreuter, 2005. Health Planning Program: An educational and ecological approach. 4 ed. New York: McGraw-Hill.
Kepmenkes RI , 2011. Peraturan Menteri Kesehatan Republik Indonesia Nomor: 2269/MENKES/PER/XI/2011 Tentang Pedoman Pembinaan Perilaku Hidup Bersih Dan Sehat (PHBS). Jakarta: Kementerian Kesehatan RI
Krieger, Allen, C., Cheadle, Ciske, S., Schier, & Senturia, K., 2002. Using Community- based participatory research to address social determinants of health: Lessons learned from seattle Partners for Healthy Communities. Health education and Behaviour, Issue 29, pp. 361-382.
Allen, J. & Meyer, I., 1990. The Measurement and Antecedents of Affective,Continuance and Normative Commitment to the Organization. Journal of Occupational Psychology, pp. 1-18.
Laverack, G., 1999. Adressing the contradiction between Discourse and Practice in Health Promotion, Melbourne Australia: Deakin University.
Mahmudi, 2007. Manajemen Kinerja Sektor Publik edisi revisi. Jakarta: STIM YKPN. Nazir, M., 2011. Metode Penelitian. Bogor: Ghalia Indonesia. Parsons, Ruth, J., James, J. & Santos, H. H., 1994. The Integration of Social Work Practice.
California: Wadsworth Inc. Peraturan Pemerintah nomor 33 tahun 2012 tentang Pemberian Air Susu Ibu Eksklusif Prasetyono, Dwi, Sunar. 2009. ASI Ekslusif. Jogjakarta: Diva Press. Roesli, Utami, 2005. Panduan Praktis Menyusui. Jakarta: Puspa Swara.
Public Health Department, Faculty of Sports Science, F1 Building, 2nd
Floor, Sekaran Campus Gunungpati, Semarang City, Central Java Province, Indonesia, 50229 Phone/ Fax. +6224 8508007
625
DESCRIPTION OF EATING BEHAVIOR AND THE OCCURANCE OF DIGESTION DISORDERS OF STREET CHILDREN IN SEMARANG
Intan Apriliyani1, Widya Hary Cahyati1, Sofwan Indarjo1
Semarang State University, Indonesia
Corresponding Author: [email protected]
Abstract
Introduction: Street children is one of the problems children welfare which still happens in Indonesia. Street children has low and irregular income, resulting both low and irregular consumption. Eating behaviour and hygiene personal of street children which risk to caused disorder of gastrointestinal tract. The purpose of this research analyzed eating behaviour and digestive disorders cases of street children in Semarang. Methods: This study was descriptive quantitative research with survey methode. Technique sampling used accidental sampling. Samples were 41 street children. Location of this research conducted in Semarang include Tugu Muda area, Johar Market, Simpang Lima, Gayamsari Market, and Tlogosari‟s Traffic Lights. Results: The results showed that 73,17% of street children don‟t eat regularly, 92,68 % have poor hand washing habits, 41,46 % consuming alcohol, and 24,40 % consuming more 3 cups coffee a day. Incidende of digestive system disorders include anorexia 68,29 %, dysphagia 34,15 %, heartburn 39,02 %, nausea 70,73 %, vomiting 58,54 %, epigastric pain 17,07 %, abdominal pain 24,39 %, diarrhea 7073 %, and constipation 41,46 %. Disorders gastrointestinal were caused by diet, lifestyle, infection, and disorder of organs.
Key Words : Eating behavior; digestive disorders; street children Introduction
The problem of children welfare still becomes a major concern of the world. It begins with
child labor, child abuse, child exploitation, children in conflict with the law, to street children. One of
the children welfare issues that are still many occurred is a matter of street children. Street child is
any boy or girl who lived on the streets, doing the activity in the streets, and making a living on the
streets with no protection, supervision, and guidance of a responsible adult (International Labor
Organization (ILO), 2008 : 15).
Based on the data of United Nation (UN) in 2005 the number of street children in the world
reached 150 million. This means that 1 of 60 people who live in the world are street children
(Berezina E, 2005: 1). The number of street children increased follows the increasing of the
number of population in the world for a period in excess 30% from 5.2 billion in 1989 to 6.8 billion
in 2009 (Thomas de BS 2011: 4). Ministry of Social Affairs of RI mentioned the number of the
street children in Indonesia in 2010 reached 94 356 children. In 2011, the number increased to 135
983 children, increasing 44.12%. In 2012 the numbers are expected to rise back up to 230,000
children.
According to the data of Central Java Social Service, the number of street children in Central
Java in 2010 was 5.311 children, in 2011 the number of street children increased by 6.084 children
or 0,07% of the total population aged 5-18 years (8.517.295 children). In 2012, the number
626
Public Health Department, Faculty of Sports Science, F1 Building, 2nd
Floor, Sekaran Campus Gunungpati, Semarang City, Central Java Province, Indonesia, 50229 Phone/ Fax. +6224 8508007
increased by 5,030 children or 0.06% of the population aged 5-18 years (8,474,854 children). It
shows that there is a decline of the number of the street children from 2011 to 2012 of 0.01%. In
2013, the number of street children in Central Java recorded 5,030, there were no increasing or
decreasing from 2012. Semarang which is the capital city of Central Java province cannot be
separated from the problem of street children. The recapitulation data obtained in Social Welfare
Department of Central Java government is that the street children of Semarang in 2010 were 806
children. By the year 2011, 2012, and 2013, the number of street children becomes 216 street
children in detail 158 male and 58 female children.
Street children have a low and irregular income, so that it has consequences to the lower
and also irregular food consumption (Kultum. J, 2010). The style of consumption and risky hygienic
behavior such as stale food consumption, unclean food consumption, the habit of eating in
outdoors or on the road, as well as the habit of washing hands before eating causing the health
problems for street children. The data description of the habit consumption and hygienic behavior
of 33 street children in three shelters in Yogyakarta showed 18% of street children eat spoiled food
every day, 6% eat unhygienic food, 9% do not have the habit of washing hands before eating, 76%
often eat on the side of the road, and 18% never eat at road side (Tommy. S.A., 2012). This
behavior causes disorders in many organs and body systems including the digestive system of the
child.
Disorders of the digestive system are the most health problems experienced by street
children. According to data from the Child Protection Agency (LPA) in West Java in 2004
mentioned that the health problems / diseases are the most common for street children is
diarrhea that is equal to 34.72% of the number of street children studied (Prista SS, 2007: 2). In
Central Java, particularly in the Semarang city has been no research on the occurrence of
digestive system disorders in street children. Digestive or gastrointestinal system disorders include
a large number of diseases that causes patients looking for medical attention and the main causal
of hospitalization cases. Although the gastrointestinal disorders indirectly cause a death as well as
cardiovascular disorders, but it is one of the five major causal of the death.
There are so many efforts of the government that have been made to solve the problem of
street children. In line with MDG‟s in 2015, the central government targeted decreasing the number
of street children in Indonesia at least half of the amount in present. Some of these efforts include
conducting the raids of street children, the provision of job skills, to the provision of capital
assistance for street children and the parents of street children. However, until now the issue of
street children has not been resolved yet. It can be seen by the increasing number of street
children every year. This study is aimed to find out the eating behavior and the occurrence of
digestion disorders in street children in Semarang
Public Health Department, Faculty of Sports Science, F1 Building, 2nd
Floor, Sekaran Campus Gunungpati, Semarang City, Central Java Province, Indonesia, 50229 Phone/ Fax. +6224 8508007
627
Methods
Type of the research was a descriptive study. Descriptive research is a research method
conducted with the main objective to create a picture or description of a situation objectively
(Notoatmodjo S, 2005: 138). The type of the method used was a survey method. The sample of
the study was chosen by using accidental sampling. Accidental sampling is done by taking a case
or respondent accidentally available (Notoatmodjo S., 2002: 89). The population was 216 street
children in Semarang in five areas, they are Tugu Muda area, Johar market, Simpang Lima,
Gayamsari Market, and in the traffic light of Tlogosari. The number of samples is 41 street children.
The data were collected by using interviews, observations, and documentation, and
interview sheet as instrument (questionnaires). The data analysis technique used was the
univariate analysis. Univariate analysis is the analysis that is used toward each variable on the
results of the study which includes the distribution, frequency, and percentage of each research
variable (Notoatmodjo, S, 2002: 188).
Results and Discussion
The characteristic of street children
The results of the research of 41 street children in Semarang based on the age levels
showed that most of respondents were aged 14 years, as many as 8 respondents (19.51%), then
in the age of 11 years there are 5 respondents, and at least in the age of 7 years as many as 1
respondent (2.44%).
The age of street children can be affected to the eating style. Aged 14-19 years which is
adolescent group is the group who are in the puberty. It makes them having uncertain behavior. It
can also make them more picky in eating or eating irregularly. Aged 10-13 years who is in the
children group who has regular eating habits because this group is still under parental supervision,
in addition they are more frequent in eating snack while working.
Besides had an effect on eating behavior, the age can be also affected to the hygiene
behavior of street children. Another study carried out by Prista, S Sheizi, (2007) about the
relationship of age and personal hygiene behavior of street children in shelters of YMS Bandung
mentioned that there was a significance behavior between the street children of school age and the
street children of adolescence. It is in line with L.Green theory which states that the age factor will
affect someone‟s behavior. School-age children usually have a high dependence on the
environment. They still need a lot of attention to be able to fit the existing norms. But if their
educational status is low, of course, the child will be influenced by the environment, and did as the
greatest effect that they feel.
The results of the research showed that most of street children are male, as many as 34
respondents (82.93%) and female street children, as many as 7 respondents (17.07%). The
dominance of these boys is caused that the boys have a more rebellious nature, easily affected by
the environment and relatively indifferent, so that it is easy to be influenced by his friends to live
628
Public Health Department, Faculty of Sports Science, F1 Building, 2nd
Floor, Sekaran Campus Gunungpati, Semarang City, Central Java Province, Indonesia, 50229 Phone/ Fax. +6224 8508007
and work on the streets. Most of female street children who are still actively working on the streets
are under the age of 15 years. This is because the female street children in the aged of 16-18
years who have been no longer in the streets because of embarrassment that prefer to work in a
factory (Suhartini T, 2008: 11). The results of this study supports to the results of the study in
Semarang which states that 74.51% of male street children in Semarang and 25.49% of female
street children (LPPM USM, 2008: 42).
Related to the sex, men need more energy than women so when they do any activity more
energy released. It is a little bit more influence on boys‟ food consumption style. However, boys
tend to not be able to manage a regular eating style so that it could have an impact on their health,
especially the health of the digestive system.
Last education of street children, namely, elementary school (SD) are 23 respondents
(56.9%), junior high school (SMP) are 6 respondents (11.76%), those who do not study at school
as many as 12 respondents (29.27%), and there is no respondents from high school education.
From the 23 street children of primary school education, there are two respondents who are still
active at school, while from 6 children of junior education, 1 child completed education up to
graduation and the rest do not.
The last education of street children are, elementary school as many as 23 respondent
(56,9%), Junior High School as many as 6 respondent (11,76%), uneducated as many as 12
respondent (29,27%), and there is no respondent that the last education is in Senior high school.
Of the 23 street children who attend elementary school, there are 2 respondents who are still
active in the school, while 6 children attend the Junior High School, a child completed the
education up to graduation and the rest do not.
The low level of education of street children is caused by economic background, in which
most of the street children come from poor families that cannot afford the school fees. It is also
expressed by the respondents who claimed not to continue / out of school because of the lack of
the cost. In addition, unwillingness factor in learning from the street children themselves also cause
them decided to quite from school and prefer to work on the road, such as the recognition of one of
the respondents who said that he decided to quit from the school because they are not capable of
learning, but parents can afford to pay him in the school. It is not much different from the research
conducted by Rosdalina (2007: 99) which states that the street children who are generally the most
poorly educated are most of them dropping outs of the school than graduated from elementary
school. In Semarang, the educational level of the population is at most in elementary school (328
144 inhabitants), graduated from high school (302 856 inhabitants), and graduated from junior high
(291 066 inhabitants).
Someone‟s education level will help the person to more easily grasp and understand a new
knowledge or information. A person who has lower education may make him slow in adopting a
new knowledge and applying it in daily behavior. Low levels of education lead the street children
not to have the knowledge and skills to get a better job unless working on the road (Rosdalina,
Public Health Department, Faculty of Sports Science, F1 Building, 2nd
Floor, Sekaran Campus Gunungpati, Semarang City, Central Java Province, Indonesia, 50229 Phone/ Fax. +6224 8508007
629
2007: 99). In addition, the low level of education of street children will have much effect on the
understanding and awareness of street children toward negative behaviors that they should avoid,
such as irregular eating style, poor hygiene sanitation, alcohol consumption, as well as other
behaviors that could lead to digestion system disorders.
Street children work as street singers (53.65%), and others (46.35%) include: beggar
(21.95%), the mass media seller (12.20%), parking (4.88%), scavengers (4.88%), and street
vendors (2.44%). Singing in the street is the most be done because it is faster to make money in
easier way and simple capital in which the street children just need to sing with the help of a simple
instrument such as kentrung / small guitar. There is no special skill needed, the capital and energy
to earn money, such as parking, newspaper vendors, scavengers, and others. The results of the
study in Makasar also showed a similar case, where the most work done by street children is street
singer (44.8%) and business services (25.3%) (Isbach, et al., 2013: 3).
Street children who mostly work as street singers have an average income of Rp 23800.00 /
day. At least, the income is USD 4000.00 / day and the maximum income is Rp 70.000,00 / day.
The average income is mostly between Rp 11000.00 to 20000.00. This is consistent with the
research by Rosdalina (2007: 72) which states that the daily income of street children is in
Rp15000.00 to 20000.00.
In the study, street children are classified into having a low income. By using their low
income, street children spend their money for their daily needs such as foods, buy snacks,
cigarettes / drink, given to parents, and saved. Street children spend the money earned from their
work to eat, but because of their low income, so they do not measure the content and benefits of
the food itself. They had to eat only to satisfy the appetite and eliminate their hunger, they do not
pay attention to the type of food, regularity of eating, and food hygiene. The results of the study
Purwanto (2010: 24) stated that street children use their own income to spend their secondary
needs, such as snacks, drinks, and cigarettes. According to Purwanto, street children become
more consumptive because they are accustomed to work and earn their own money. However,
based on the results of this study, although street children spend the money earned for their own
needs, but most of them still give the money earned to their parents / families and saved.
Street children have the varied amount of income per day. The average of the income per
day is Rp 23.800.00. At least, the income is Rp4.000.00 / day and the maximum number is Rp
70.000,00 / day.
Street children have very low and irregular income, so it have consequences to the lower
eating consumption and irregularly (Kulstum. J, 2010). In the study, street children classified as
having a low income. With such a low income, street children spend their money for daily needs
such as food, buy snacks, cigarettes / drink, given to parents, and saved. Street children spend the
money earned from their work to eat, but because of their low income, so they do not measure the
content and benefits of the food itself. They had to eat only to satisfy the appetite and eliminate
their hunger, they do not pay attention to the type of food, regularity of eating, and food hygiene.
630
Public Health Department, Faculty of Sports Science, F1 Building, 2nd
Floor, Sekaran Campus Gunungpati, Semarang City, Central Java Province, Indonesia, 50229 Phone/ Fax. +6224 8508007
The results of the study Purwanto (2010: 24) who stated that street children use their own income
to spending their secondary needs, such as snacks, drinks, and cigarettes. According to Purwanto,
street children become more consumptive because they are accustomed to work and earn their
own money. However, based on the results of this study, although street children spend the money
earned for their own needs, but most of them still give the money earned to their parents / families
and saved.
Eating behavior of street children
Table 1: Eating behavior of street children
Table 1 show that the distribution of street children in Semarang City who have irregular
eating is higher than street children who have regular eating, it is shown by 30 respondents
(73,17%). They get food from buying (51,22%). Their practice of hand washing is bad (92,68%).
Around 17 respondents (41,46%) of street children consuming alcohol. Then, 28 respondents
(68,29%) of street children who are already researched had a habit of drinking coffee.
In general, the factor of the irregular eating comes from multi factor. One of the frequent
factors that caused irregular eating is the change of street children‟ eating habit which following the
working hours. The uncertain working hours of street children, and also the nomadic working place
will make the street children to avoid the eating regularity. Except of working hours, the change of
eating habit also influenced by economic factor or income which is got by working at the street.
Irregular eating will trigger the cause of many diseases because of the imbalance body. This
irregularity is related to eating time. Usually, he/she is in the condition which he/she really starving
but rarely feeling full. Thus, the stomach and the digestion system be disrupted (Hidayah, 2012). It
Eating Behavior Frequency Percentage (%)
Eating Regularity Regular (score 18-24) 11 26,83 Irregular (score 6-17) Food Hygiene Cooking Buying Cooking + Buying Rest
30
13 21 2 5
73,17
31,71 51,22 4,88 12,19
Hand Washing Habits Good (washing hands with soap and
water before eating, before handling food, after defecation, after work or play)
3 7,32
Bad 38 92,68 Alcohol Consumption Yes 17 41,46 No 24 58,54 Coffee Consumption Heavy coffee drinkers (>3 cup/day) 10 24,40 Light coffee drinkers (≤ 3 cup/day) 18 43,90 Not coffee drinkers 13 31,70

Public Health Department, Faculty of Sports Science, F1 Building, 2nd
Floor, Sekaran Campus Gunungpati, Semarang City, Central Java Province, Indonesia, 50229 Phone/ Fax. +6224 8508007
631
is same with the research conducted by Fitri, et al (2013) which showed that having irregular
eating will influence gastritis disease.
According to the result of that study, it shows that the food which gets from buying is less of
cleanliness because the place and its surrounding also less of cleanliness. Most of the food sellers
tend to gain benefit rather than the use and or food safety. The food sellers often use textile dyes,
excessive flavoring, unhealthy cooking oil/cooking oil used, chemical additives, artificial
sweeteners which are generally potential in producing health problem in the future if we consume
continuously for a long time. In the other hand, food buying which is unhygienic will be risked by
wastewater and dirt from the dirty hands, but not all of the food which is sold by food seller is lack
of cleanliness. Differ from cooking, the food cleanliness is well guaranteed. As stated by Sus
Widayani, et al (1998) in the research of eating habit in family fishing in Pantura, Central Java
show that the cleanliness of elementary school children‟ eating habit is generally low. This term is
caused by consuming food from buying which is unhygienic.
Hands washing with soap for most of the society now become daily activity, but for the other
society, this activity does not yet become routine activity especially for the children. Hands washing
could clean up the virus and bacteria which become the causes of disease, such as a disease that
attack the digestive tract; diarrhea. Washing hands is the effective way to defend the spread of
diarrhea. Soap is a cleaner and disinfectant which could be used to kill the pathogen bacteria in
our hands and tools.
Small alcohol consumption will trigger the production of gastric acid, decrease the appetite,
and nauseous. Those are the symptoms of digestion disorder. Furthermore, consuming alcohol in
large portion will ruin the gastric mucosa.
The results of this study find that there is digestion disorder towards the street children who
consuming coffee. From 28 street children, there are 10 children who consuming coffee a lot, and
18 children who consuming coffee rarely. In the case of the street children who consuming coffee a
lot, there are 8 children who have nausea. And 13 children who rarely consuming alcohol, they
have nausea. As stated before, caffeine could make gastric acid quickly, and make puffy stomach.
And if we consume coffee excessively, it could make nausea in our stomach
Digestion disorder
There are many complaints which are submitted by a person who has digestion disorder.
The digestion disorder could be caused by eating habit, living habit, infection, and or internal
organs disturbance. The health disturbance and digestion disorder are heterogeneous, but they
usually have the same symptom then directly refer to one disease. In the other hand, the
symptoms in stomach are not always connected with the digestion disorder. To determine the
health disturbance caused by digestion disorder which is endured by a person, we have to do
anamnesis. Anamnesis is started by the main symptom; the symptom which is endured by a
person. Digestion disorder clinical symptom could be varying such as diarrhea, nauseous,
vomiting, anorexia, epigastria pain, etc. Diarrhea is the most digestion disorder which is endured
632
Public Health Department, Faculty of Sports Science, F1 Building, 2nd
Floor, Sekaran Campus Gunungpati, Semarang City, Central Java Province, Indonesia, 50229 Phone/ Fax. +6224 8508007
by the street children. Based on the result of the study, the street children who have diarrhea are
29 respondents (70,73%). Diarrhea is one of diseases which have tight relation with eating habit.
Most of the street children have bad eating habit which consists of less hygiene food, and bad
hands washing habit. This term will make the diarrhea bacteria contamination and cause diarrhea
towards the street children.
Furthermore, nauseous is also one of the digestion disorder complaints that are endured by
the street children. Based on the result of the study, 29 respondents (70,73%) of the street children
have nauseous. Nauseous and vomiting are the basic symptom; they are not specific disease.
Nauseous is a feeling to throw up, and vomiting is the action of throw up. This term is caused by
the street children‟ irregularity eating habit, drinking coffee, and also consuming alcohol which can
increase gastric acid, then it will produce nausea in the street children‟ digestive tract.
Moreover, anorexia is one of the symptom which the patient has severe eating disorder.
According to the result of the research towards the street children, there are 28 (68,29%) of the
street children who have anorexia within 30 days lately. In the other hand, there are 31,71% of
street children do not have any anorexia in 30 days. Decreasing appetite is caused by consuming
alcohol. Consuming alcohol in little portion will trigger the production of gastric acid and decrease
the appetite, and also cause nauseous.
Dysphagia is a symptom caused by esofogus abnormality; the difficulties in swallowing food
or water. The result of this study show that 14 respondents (34,15%) have dysphagia, and for the
rest do not have dysphagia within 30 days.
Then, Heartburn is one of digestion disorder which the patients feel burnt in their chest.
There are 16 of the street children who have heartburn in 30 days lately.
Nausea is feeling of queasy which usually caused by stimulus. In the other hand, vomiting is
the condition which the patient throwing up their food through mouth. From 41 respondents, there
are 29 respondents who have nausea and 24 respondents have vomiting.
Epigastric pain is feeling of soreness in epigastrum (pain in upper abdomen). Based on the
result, it is found that 17,07% respondents have epigastric pain in the last 30 days and 82,93% do
not have epigastric pain. In addition, there are only 10 respondents (24,39%) who have stomach
pain only.
Constipation is a symptom of difficult in defecation. Hence, they cannot do defecation freely
and regularly. In the normal situation, we clear out our colon every 24 hours periodically. We can
call it constipation if we cannot do defecation for two days or more. According to the research
result, there are 17 respondents who admit that they have constipation in the last 30 days.
Closing
According to the result of this study above, it can be found that 73,17% of the street children
in Semarang City have irregular eating habit, amount 51,22% of the street children get food from
buying. Their hand washing habit is bad (92,68%), amount 58,54% of the street children do not
Public Health Department, Faculty of Sports Science, F1 Building, 2nd
Floor, Sekaran Campus Gunungpati, Semarang City, Central Java Province, Indonesia, 50229 Phone/ Fax. +6224 8508007
633
consume alcohol, most of them (68,28%) are coffee drinkers with the light category ≤ 3 cups per
day. Then, the most digestion disorder that they have is nauseous, and for diarrhea is 29
respondents (70,73%).
I hope for the street children foundation in Semarang City could make better approach and
try to arrange endeavors to overcome the digestion disorder for the street children. For example,
by giving them the understanding about how to wash hands clearly and correctly. We also have to
give them the meaning of eating regularly, and the dangerous of consuming alcohol. Beside that,
the street children can be guided to eat together in shelter every time to take care of their eating
regularity and also their food hygiene.
Acknowledgement
Our thanks to Is Shofa Foundation, Mr. Ibrahim Ch as the chief of Is Shofa Foundation, Miss
Puji and Mr. Wahyu as the companion of the street children in Is Shofa Foundation, all of the street
children in IS Shofa Foundation, and also all of the street children in Simpang Lima area, Tugu
Muda, Johar Market, Gayamsari Market, and traffic light area in Tlogosari who were already
available as the respondents in this study. Last, my family, and my friends who gave me motivation
in finishing this study.
References
Berezina E, 2005, Street Children: Victimization and Abuse of Street Children Worldwide. Youth Advocate Program International Resource Paper, Tahun 2005. Hal. 1.
Fitri, Rahmaningrum, dan Murjayanah, 2013, Deskripsi Pola Makan Penderita Maag pada Mahasiswa Jurusan Kesejahteraan Keluarga Fakultas Teknik Universitas Negeri Padang, Jurnal Universitas Negeri Padang Vol. 2 No. 1. (Online), ejournal.unp.ac.id, Diakses 22 April 2013.
Hidayah, 2012, Kesalahan-kesalahan Pola Makan Pemicu Seabrek Penyakit Mematikan, Buku Biru : Jogjakarta.
Kultum J, 2010, Status Gizi dan Kebiasaan Makan Anak Jalanan Binaan Rumah Perlindungan Sosial Anak (RPSA) Gratama Semarag. Skripsi : Universitas Diponegoro.
International Labour Organization, 2008, Panduan tentang Pelaksanaan Pemantauan dan Pelaporan Penerima Manfaat Langsung, ILO, Jakarta.
Isbach, IDD, Ridwan A, Jumriani A. 2013. Gambaran Status Gizi Anak Jalanan di Kota Makassar. Universitas Hasanuddin. Makassar.
Lembaga Penelitian dan Pengabdian pada Masyarakat Universitas Semarang, 2008, Studi Karaktersitik Anak Jalanan dalam Upaya Penyusunan Program Penanggulangannya Kajian Empirik di Kota Semarang, Riptek, Vol. I, No.2, Tahun 2008, Hal.: 41-45, Diakses tanggal 7 April 2012.
Notoatmojo S, 2005, Promosi Kesehatan Teori dan Aplikasinya, Rineka Cipta, Jakarta. Thomas de Benitez. S., 2011, State of the World’s Street Children: Research. Consortium for
street children, The Oasis Centre: London. (online). Diakses tanggal 10 Oktober 2013, (www.aviva.com%2Fmedia%2Fupload%2FState_of_the_Worlds_Street_Children_Research_final_PDF_online.pdf&ei=9Q0AU_qWHqnpiAeMgYHQCw&usg=AFQjCNEPuGoV_99NzFB0kTGeD1FPnh_PkA&bvm=bv.61535280,d.aGc.)
Tommy. S.A., 2012, Profil Reaksi Widal pada Anak Jalanan Terhadap Pola Kunsumsi dan Periaku Hidup Sehat. (Online), Volume 8 No. 9 (2012), Diakses tanggal 5 Oktober 2013, (http://publikasi.umy.ac.id/index.php/penddokter/article/view/4272/3606)

634
Public Health Department, Faculty of Sports Science, F1 Building, 2nd
Floor, Sekaran Campus Gunungpati, Semarang City, Central Java Province, Indonesia, 50229 Phone/ Fax. +6224 8508007
Prista, S Sheizi, 2007, Hubungan Predisposisi dengan Perilaku Personal Higiene Anak Jalanan Bimbingan Rumah Singgah TMS Bandung.Skripsi, Universitas Padjadjaran.
Suhartini, Tina dan Panjaitan NK, 2008, Strategi Bertahan Hidup Anak Jalanan. Skripsi, Institut Pertanian Bogor, Bogor.
Rosdalina, 2007, Aspek Keperdataan Perlindungan Hukum Terhadap Anak Jalanan, Jurnal Anak Jalanan, 4 (1): 71-72.
Public Health Department, Faculty of Sports Science, F1 Building, 2nd
Floor, Sekaran Campus Gunungpati, Semarang City, Central Java Province, Indonesia, 50229 Phone/ Fax. +6224 8508007
635
ELIMINATING HIV/AIDS, MALARIA AND
OTHER DISEASES PAPERS

636
Public Health Department, Faculty of Sports Science, F1 Building, 2nd
Floor, Sekaran Campus Gunungpati, Semarang City, Central Java Province, Indonesia, 50229 Phone/ Fax. +6224 8508007
Public Health Department, Faculty of Sports Science, F1 Building, 2nd
Floor, Sekaran Campus Gunungpati, Semarang City, Central Java Province, Indonesia, 50229 Phone/ Fax. +6224 8508007
637
MULTIVARIATE ADAPTIVE REGRESSION SPLINES MODELING TO PREDICT THE NUMBER OF HIV/AIDS CASES
Herlina Jusuf
Gorontalo State University, Indonesia
Corresponding Author: [email protected]
Abstract
Introduction: HIV/AIDS case data series prediction is often used in ARIMA modeling. This is done if the behaviors of the data series are not too complex and the initial conditions (assumptions) are met well. If the conditions are not met, Multivariate Adaptive Regression Spline (MARS) modeling is used so that the general purpose of this research is to develop MARS model for accurate prediction of the number of HIV/AIDS cases. Methods: This is non-reactive study with secondary data as analysis source. The data source is the number of HIV/AIDS cases from East Java Province Health Department. Results: The results showed that MARS is the best model with the number of BF = 20, MI = 3, MO = 1 criteria and smallest GCV value of 707 794. The best model was determined based on the smallest MSE and RMSE from the data in the sample. MSE and RMSE values of MARS model are consecutively 707.79 and 26.60, while the ARIMA values are 2035.00 and 45.11. The empirical results proved that MARS is the best model because it has smallest MSE and RMSE values in predicting the number of HIV/AIDS cases compared with ARIMA model. The flexibility of MARS approach provided better performance compared with the ARIMA performance in predicting the number of HIV/AIDS cases, but the changes were still relatively small, so it is necessary to do more research about modeling based of other functions.
Key Words: MARS, ARIMA, MSE, RMSE Introduction
Data series modeling, usually on the data condition with stationary and linear fluctuations,
are sufficient to apply Autoregressive Integrated Moving Average (ARIMA) method for prediction
(Arsyad, 1999). This method is very effective and will obtain model with high level of concordance
when two prerequisites are met. If the condition does not meet the prerequisites, the model
obtained becomes incomplete in describing system behavior patterns that are less appropriate to
be used for forecasting. Series modeling problems are often associated with the process of
forecasting certain characteristic value in the upcoming period and to control a process or system
for recognizing patterns of behavior (Otok, 2008).
In the development of nonlinear series modeling, several methods are introduced to be quite
flexible in various fields of applications. One of which is Multivariate Adaptive Regression Splines
(MARS) (Friedman, 1991). MARS is proposed as a new approach that is better than the stochastic
model to obtain data series and the value of upcoming period from data with nonlinear fluctuating
conditions (Buja, Duffy, Hastie, Tibshirani, 2001).
HIV/AIDS (Human Immunodeficiency Virus - Acquired Immune Deficiency Syndrome) is a
serious current and future global health issues because the number of patients are increasing and
there is no drug and vaccine for prevention. PLWHA value (People Living with HIV and AIDS)
(Depkes RI, 2010) is the number of people in Indonesia who are physically no different from
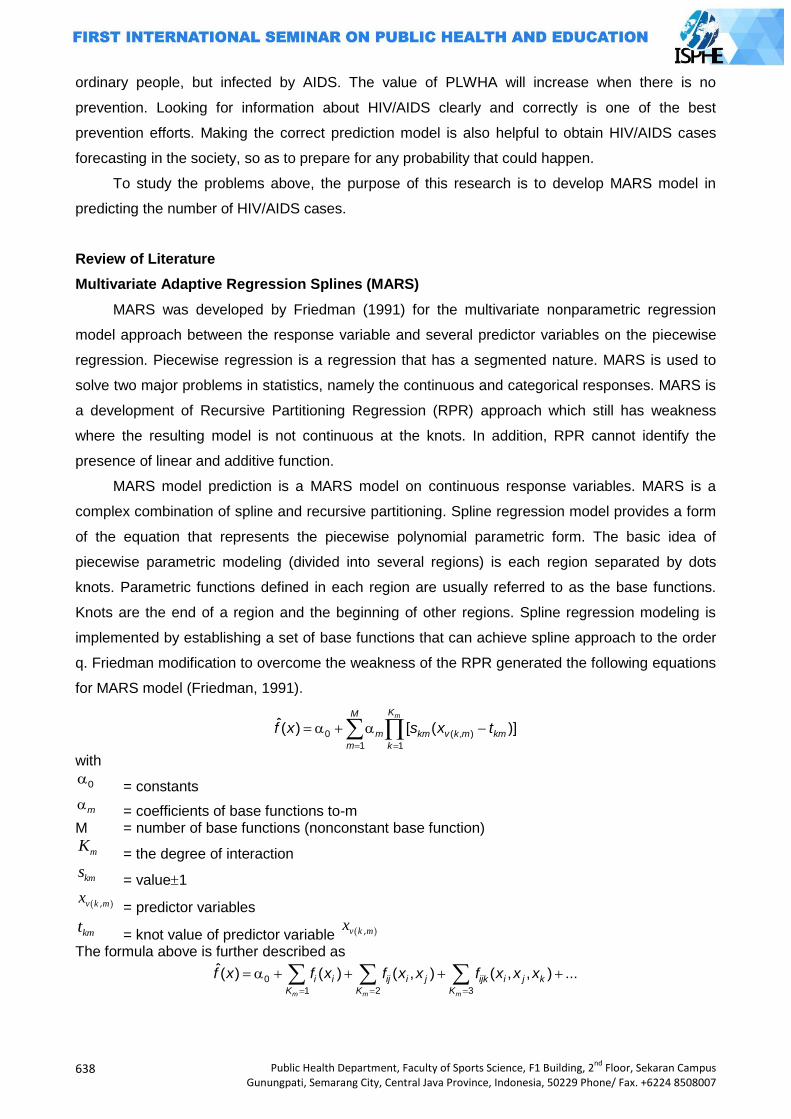
638
Public Health Department, Faculty of Sports Science, F1 Building, 2nd
Floor, Sekaran Campus Gunungpati, Semarang City, Central Java Province, Indonesia, 50229 Phone/ Fax. +6224 8508007
ordinary people, but infected by AIDS. The value of PLWHA will increase when there is no
prevention. Looking for information about HIV/AIDS clearly and correctly is one of the best
prevention efforts. Making the correct prediction model is also helpful to obtain HIV/AIDS cases
forecasting in the society, so as to prepare for any probability that could happen.
To study the problems above, the purpose of this research is to develop MARS model in
predicting the number of HIV/AIDS cases.
Review of Literature
Multivariate Adaptive Regression Splines (MARS)
MARS was developed by Friedman (1991) for the multivariate nonparametric regression
model approach between the response variable and several predictor variables on the piecewise
regression. Piecewise regression is a regression that has a segmented nature. MARS is used to
solve two major problems in statistics, namely the continuous and categorical responses. MARS is
a development of Recursive Partitioning Regression (RPR) approach which still has weakness
where the resulting model is not continuous at the knots. In addition, RPR cannot identify the
presence of linear and additive function.
MARS model prediction is a MARS model on continuous response variables. MARS is a
complex combination of spline and recursive partitioning. Spline regression model provides a form
of the equation that represents the piecewise polynomial parametric form. The basic idea of
piecewise parametric modeling (divided into several regions) is each region separated by dots
knots. Parametric functions defined in each region are usually referred to as the base functions.
Knots are the end of a region and the beginning of other regions. Spline regression modeling is
implemented by establishing a set of base functions that can achieve spline approach to the order
q. Friedman modification to overcome the weakness of the RPR generated the following equations
for MARS model (Friedman, 1991).
0 ( , )
1 1
ˆ( ) [ ( )]mKM
m km v k m km
m k
f x s x t
with
0 = constants
m = coefficients of base functions to-m M = number of base functions (nonconstant base function)
mK = the degree of interaction
kms = value1
( , )v k mx = predictor variables
kmt = knot value of predictor variable ( , )v k mx
The formula above is further described as
0
1 2 3
ˆ( ) ( ) ( , ) ( , , ) ...
m m m
i i ij i j ijk i j k
K K K
f x f x f x x f x x x
Public Health Department, Faculty of Sports Science, F1 Building, 2nd
Floor, Sekaran Campus Gunungpati, Semarang City, Central Java Province, Indonesia, 50229 Phone/ Fax. +6224 8508007
639
This formula is known as the ANOVA decomposition of the sum (regrouping) of additive functions.
Interpretation of MARS model via ANOVA decomposition is to represent variables included in the
model, whether for one variable or interaction between variables.
In MARS model building, the first step is to determine the changing of data behavior pattern
called knots point. The selection of knots in the MARS uses forward and backward algorithm.
MARS algorithms, especially forward step are used to obtain sub regions in order to determine the
base functions. Determining knots point and coefficients is very important in order to get the best
model. To meet parsimony concept (simple model), a backward step is performed to eliminate
models (base functions) which have small contribution to the alleged value of the response.
MARS is used to reduce the outlier effects on the last model. A few things to note in the
MARS model according to Nash and Bradford (2001) are knots and base functions. When a
regression line cannot explain the entire data, then some regression lines are used to describe all
existing data from the independent variables. Where patterns are changing are called knots. Knots
are the end of a regression line (region) and the beginning of a regression line to another.
Continuity of functions is expected at every point of knots between the base regions with another
region.
Testing is used to control the number of free degrees for knots optimizing. The amount of
free degrees can be determined by using cross validation or sample independence test. Base
function is a function that is used to describe the relationship between the response variable and
the predictor variable. This base function is parametric function defined for each region. In general,
the base functions chosen are in polynomial form with continuous derivatives at each knots point.
Friedman (1991) suggests a maximum number of base functions as 2 to 4 times the number of
predictor variables. Maximum interaction 1, 2, or 3 with a consideration if more than 3 will result in
a very complex model. The minimum distances between the knots or the minimum observation
between knots are as much as 0, 1, 2, 3, 5 and 10.
Time Series Analysis
Analytical model has provided a simple method of forecasting that is able to describe the
pattern and trend of data series. However, the model will have a high level of fitness when the
series data behavior is not too complex and the initial conditions (assumptions) are met well. For
such data series condition, modeling can be done with exponential smoothing, trend with the
smallest residual squares, ARIMA model, and so forth (Makridakis, Wheelright, McGee, 1999).
In the method of series, estimating the future is based on past values of a variable and/or
past error (disturbance factor). This method focuses on the data pattern, data pattern changes, and
disturbance factors caused by random effects. The purpose of series forecasting method like this is
to find patterns in data series and extrapolate this pattern into the future (Lewis, 1991).
Iterative procedures in selecting the model
Selection of an appropriate model for a data series by using Box-Jenkins method is done in
several stages, namely identification, estimation, diagnostic checking (verification), and
640
Public Health Department, Faculty of Sports Science, F1 Building, 2nd
Floor, Sekaran Campus Gunungpati, Semarang City, Central Java Province, Indonesia, 50229 Phone/ Fax. +6224 8508007
forecasting. Identification phase is done by observing the estimation pattern of ACF and PACF
obtained from the data which then be used to obtain a model that suits alleged pattern of data.
Once the provisional estimation model is obtained, the next step is to estimate the
parameters. After that, statistical tests are performed to verify whether the assumptions of the
models that have been estimated are in accordance with the series data. If the result of the
verification determines the model is not appropriate, the test should provide clues to how the model
should be changed. Identification step, estimation, and diagnostic check over and over again until
finally the most suitable model is obtained and can be used for forecasting
From some models, provisional estimation is obtained that the appropriate models are more
than one model to be investigated. Once the model is well investigated, several different models
may be summed up as the appropriate model. Statistical principles "parsimony” is then
subsequently used, which states that more economical models involving fewer parameters is more
favored than models with many parameters.
HIV/AIDS
Acquired immunodeficiency syndrome (AIDS) is a syndrome caused by a deficiency of
cellular immunity without other known cause, characterized by opportunistic infections that can be
fatal. The emergence of this syndrome is closely related to the decreasing of immune substances
whose process is not instantaneous, but about 5-10 years after a person is infected by HIV/AIDS
(Musoke, 2007).
HIV/AIDS has windows period viral characteristic and asymptomatic phase (without
symptoms) that relatively long in the course of the disease (Ong'ech and Maranga, 2007). The
cause and way of handling this disease makes HIV/AIDS difficult to detect. Some specific sub-
populations is very difficult to reach and there is still a stigma in the society on HIV/AIDS (Richard
and Peter, 2009) that resulted in many cases may not be counted. Moreover, the survey results
cannot reflect the magnitude of the problem of HIV/AIDS in the society, so that the conditions
above led the development pattern to be an iceberg phenomenon.
AIDS patients in the society are classified into two categories (Nasronudin, 2012), namely:
patients with HIV and have shown clinical symptoms (AIDS patients), and patients with HIV but not
yet showing clinical symptoms (HIV). The incubation period of this disease, the start of the infection
to the onset of the disease, is very long (up to 5 years or more). As HIV infection is considered as
lifetime disease, risk of the disease will continue during the life of people infected with HIV virus
(Ong'ech and Maranga, 2007).
Methods
Research design
This is a non-reactive research which uses secondary data analysis as an analysis source.
Non-reactive research is: "an observation in which the people being observed not aware that they
are part of the research, because the observation does not interfere with the individual and the
Public Health Department, Faculty of Sports Science, F1 Building, 2nd
Floor, Sekaran Campus Gunungpati, Semarang City, Central Java Province, Indonesia, 50229 Phone/ Fax. +6224 8508007
641
individual does not feel disturbed, as well as the information involved are obtained from him in the
past which is currently recorded in the secondary data (Kuntoro, 2009).
Source of data
The study uses secondary data. Data are retrieved from East Java Province Health
Department and East Java Province AIDS Prevention Commission. The numbers of cases of
HIV/AIDS are obtained from January 2000 to December 2011 (about 132 months).
Methods of data analysis
The data were obtained through observation/survey and furthermore being analyzed by
these steps:
(1)Pre-Processing;
(2)Dividing the result of pre-processing data (for each method) into two parts: the data out-
sample and the data in-sample: (a) In-sample data are data used to acquire/develop the best
MARS model (the data are the number of AIDS cases from 2000 to 2010); (b)Out-sample
data are data used to validate/test best model obtained from in-sample data (the data are the
number of cases of HIV/AIDS in 2011);
(3)Developing MARS Model: (a)Defining the response variable, namely the number of HIV/AIDS
cases (b)Obtaining the best MARS models, performed by means of simulation by combining
the amount of BF, MI and MO. Determining the maximum base function (max-BF), which is 2
to 4 times the number of predictors to be used. Determining the maximum amount of
interaction (MI), which is 1 to 3, with the assumption that MI > 3 will produce more complex
models. Determining the minimum number of observations of each knots (MO), namely 0, 1,
2, 3, 5 and 10. Establishing the best model based on the criteria of a minimum GCV value,
R2 and MSE
Results and Discussion
MARS modeling involves the response variable and the predictor variable. Response
variable is the number of HIV/AIDS cases, while the predictor variables is the number of HIV/AIDS
cases in the previous period.
Determining optimal input
The number of HIV/AIDS cases data is a data series. ACF and PACF Plot are used as input
for further modeling. The ACF and PACF data plots on the number of cases of HIV/AIDS
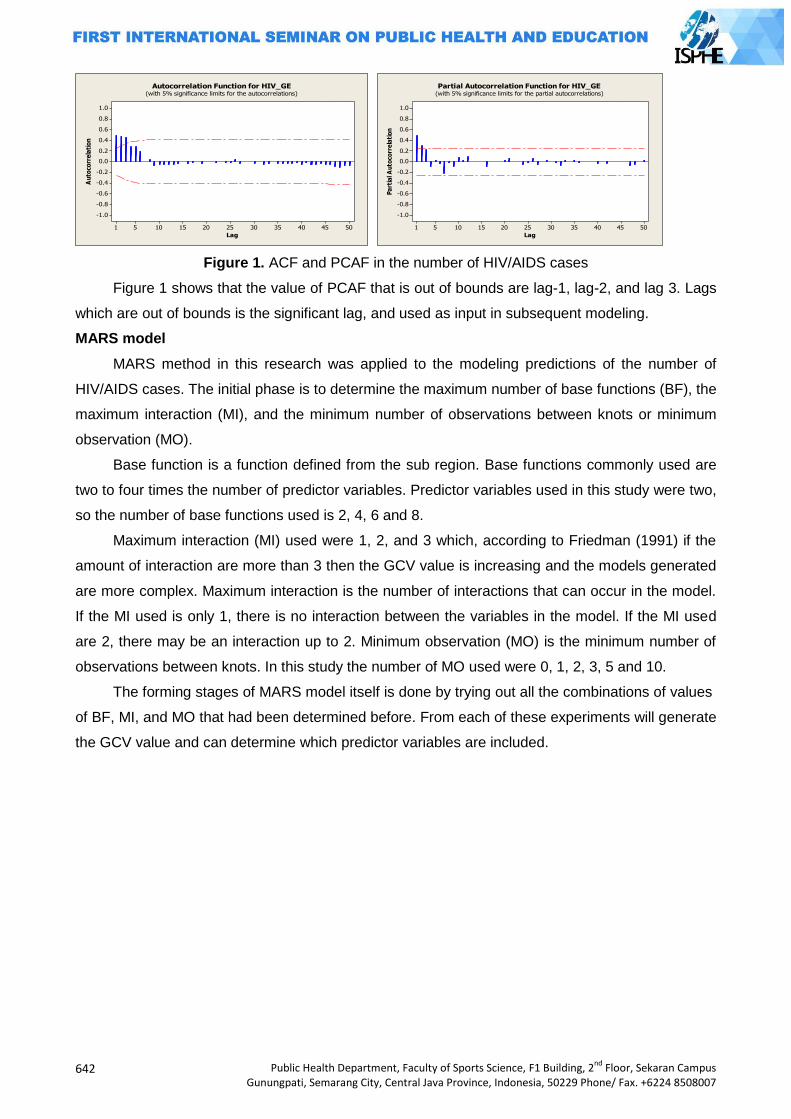
642
Public Health Department, Faculty of Sports Science, F1 Building, 2nd
Floor, Sekaran Campus Gunungpati, Semarang City, Central Java Province, Indonesia, 50229 Phone/ Fax. +6224 8508007
Figure 1. ACF and PCAF in the number of HIV/AIDS cases
Figure 1 shows that the value of PCAF that is out of bounds are lag-1, lag-2, and lag 3. Lags
which are out of bounds is the significant lag, and used as input in subsequent modeling.
MARS model
MARS method in this research was applied to the modeling predictions of the number of
HIV/AIDS cases. The initial phase is to determine the maximum number of base functions (BF), the
maximum interaction (MI), and the minimum number of observations between knots or minimum
observation (MO).
Base function is a function defined from the sub region. Base functions commonly used are
two to four times the number of predictor variables. Predictor variables used in this study were two,
so the number of base functions used is 2, 4, 6 and 8.
Maximum interaction (MI) used were 1, 2, and 3 which, according to Friedman (1991) if the
amount of interaction are more than 3 then the GCV value is increasing and the models generated
are more complex. Maximum interaction is the number of interactions that can occur in the model.
If the MI used is only 1, there is no interaction between the variables in the model. If the MI used
are 2, there may be an interaction up to 2. Minimum observation (MO) is the minimum number of
observations between knots. In this study the number of MO used were 0, 1, 2, 3, 5 and 10.
The forming stages of MARS model itself is done by trying out all the combinations of values
of BF, MI, and MO that had been determined before. From each of these experiments will generate
the GCV value and can determine which predictor variables are included.
50454035302520151051
1.0
0.8
0.6
0.4
0.2
0.0
-0.2
-0.4
-0.6
-0.8
-1.0
Lag
Au
toco
rre
lati
on
Autocorrelation Function for HIV_GE(with 5% significance limits for the autocorrelations)
50454035302520151051
1.0
0.8
0.6
0.4
0.2
0.0
-0.2
-0.4
-0.6
-0.8
-1.0
Lag
Pa
rtia
l A
uto
corr
ela
tio
n
Partial Autocorrelation Function for HIV_GE(with 5% significance limits for the partial autocorrelations)
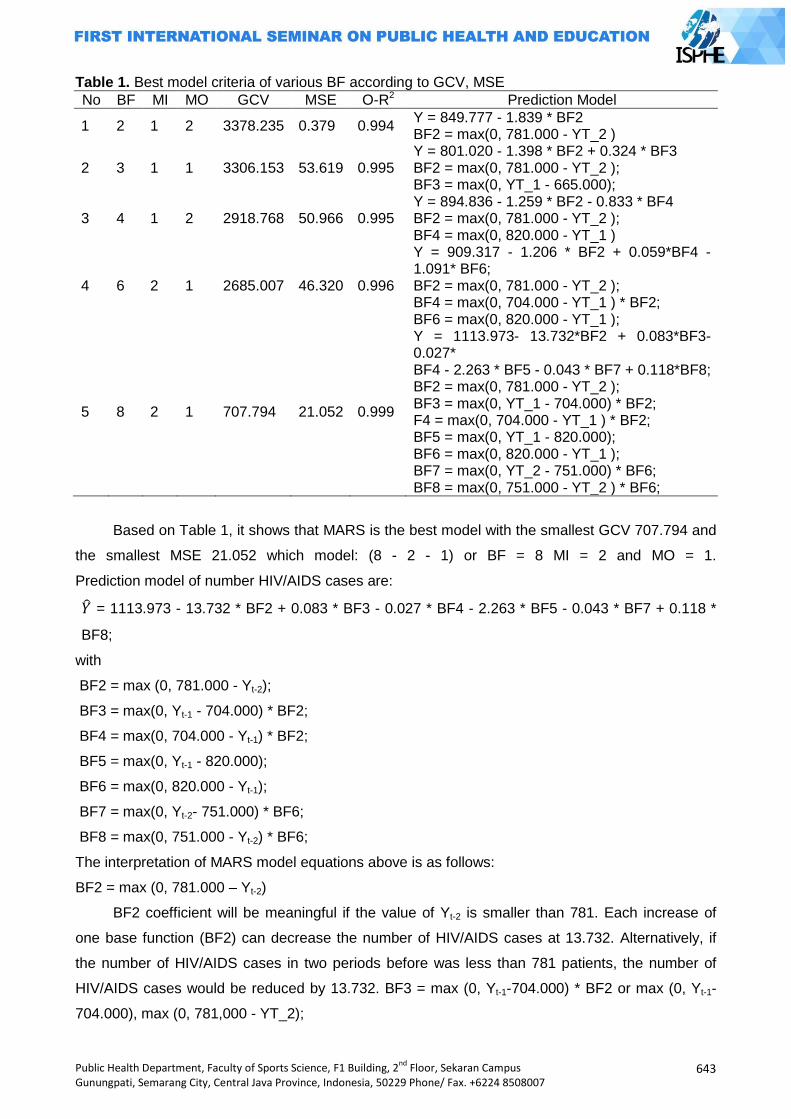
Public Health Department, Faculty of Sports Science, F1 Building, 2nd
Floor, Sekaran Campus Gunungpati, Semarang City, Central Java Province, Indonesia, 50229 Phone/ Fax. +6224 8508007
643
Table 1. Best model criteria of various BF according to GCV, MSE
No BF MI MO GCV MSE O-R2 Prediction Model
1 2 1 2 3378.235 0.379 0.994 Y = 849.777 - 1.839 * BF2 BF2 = max(0, 781.000 - YT_2 )
2 3 1 1 3306.153 53.619 0.995 Y = 801.020 - 1.398 * BF2 + 0.324 * BF3 BF2 = max(0, 781.000 - YT_2 ); BF3 = max(0, YT_1 - 665.000);
3 4 1 2 2918.768 50.966 0.995 Y = 894.836 - 1.259 * BF2 - 0.833 * BF4 BF2 = max(0, 781.000 - YT_2 ); BF4 = max(0, 820.000 - YT_1 )
4 6 2 1 2685.007 46.320 0.996
Y = 909.317 - 1.206 * BF2 + 0.059*BF4 - 1.091* BF6; BF2 = max(0, 781.000 - YT_2 ); BF4 = max(0, 704.000 - YT_1 ) * BF2; BF6 = max(0, 820.000 - YT_1 );
5 8 2 1 707.794 21.052 0.999
Y = 1113.973- 13.732*BF2 + 0.083*BF3- 0.027* BF4 - 2.263 * BF5 - 0.043 * BF7 + 0.118*BF8; BF2 = max(0, 781.000 - YT_2 ); BF3 = max(0, YT_1 - 704.000) * BF2; F4 = max(0, 704.000 - YT_1 ) * BF2; BF5 = max(0, YT_1 - 820.000); BF6 = max(0, 820.000 - YT_1 ); BF7 = max(0, YT_2 - 751.000) * BF6; BF8 = max(0, 751.000 - YT_2 ) * BF6;
Based on Table 1, it shows that MARS is the best model with the smallest GCV 707.794 and
the smallest MSE 21.052 which model: (8 - 2 - 1) or BF = 8 MI = 2 and MO = 1.
Prediction model of number HIV/AIDS cases are:
̂ = 1113.973 - 13.732 * BF2 + 0.083 * BF3 - 0.027 * BF4 - 2.263 * BF5 - 0.043 * BF7 + 0.118 *
BF8;
with
BF2 = max (0, 781.000 - Yt-2);
BF3 = max(0, Yt-1 - 704.000) * BF2;
BF4 = max(0, 704.000 - Yt-1) * BF2;
BF5 = max(0, Yt-1 - 820.000);
BF6 = max(0, 820.000 - Yt-1);
BF7 = max(0, Yt-2- 751.000) * BF6;
BF8 = max(0, 751.000 - Yt-2) * BF6;
The interpretation of MARS model equations above is as follows:
BF2 = max (0, 781.000 – Yt-2)
BF2 coefficient will be meaningful if the value of Yt-2 is smaller than 781. Each increase of
one base function (BF2) can decrease the number of HIV/AIDS cases at 13.732. Alternatively, if
the number of HIV/AIDS cases in two periods before was less than 781 patients, the number of
HIV/AIDS cases would be reduced by 13.732. BF3 = max (0, Yt-1-704.000) * BF2 or max (0, Yt-1-
704.000), max (0, 781,000 - YT_2);
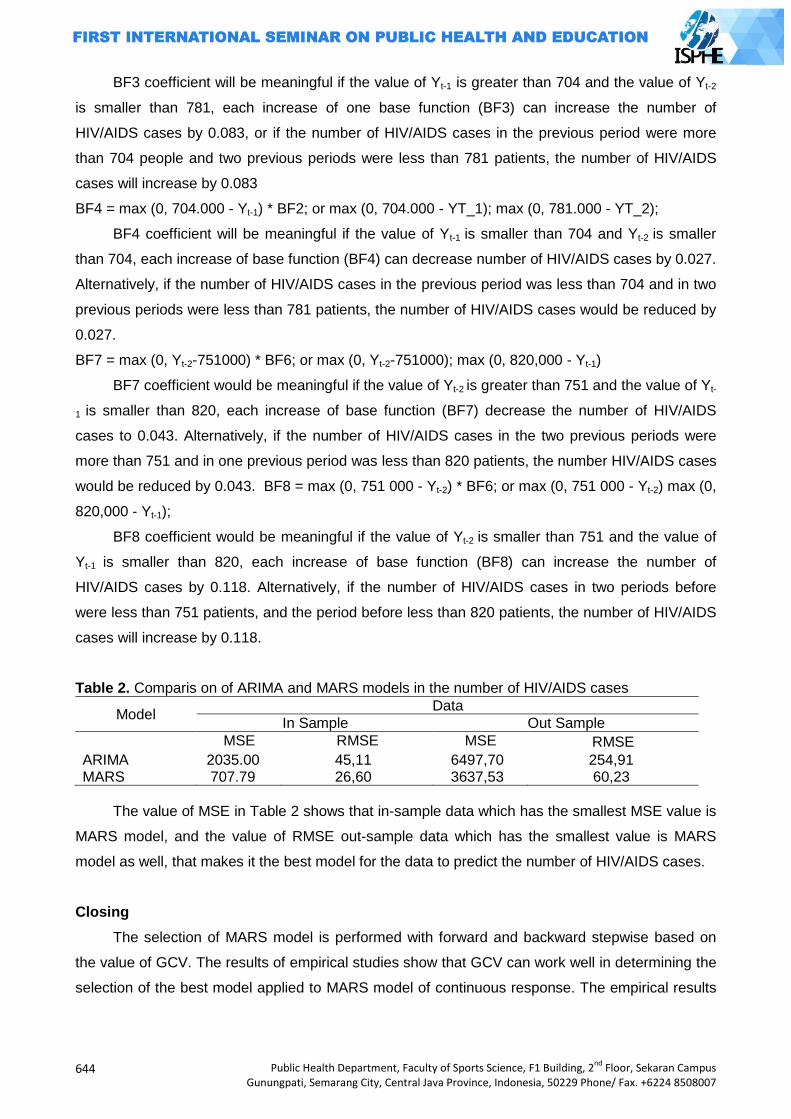
644
Public Health Department, Faculty of Sports Science, F1 Building, 2nd
Floor, Sekaran Campus Gunungpati, Semarang City, Central Java Province, Indonesia, 50229 Phone/ Fax. +6224 8508007
BF3 coefficient will be meaningful if the value of Yt-1 is greater than 704 and the value of Yt-2
is smaller than 781, each increase of one base function (BF3) can increase the number of
HIV/AIDS cases by 0.083, or if the number of HIV/AIDS cases in the previous period were more
than 704 people and two previous periods were less than 781 patients, the number of HIV/AIDS
cases will increase by 0.083
BF4 = max (0, 704.000 - Yt-1) * BF2; or max (0, 704.000 - YT_1); max (0, 781.000 - YT_2);
BF4 coefficient will be meaningful if the value of Yt-1 is smaller than 704 and Yt-2 is smaller
than 704, each increase of base function (BF4) can decrease number of HIV/AIDS cases by 0.027.
Alternatively, if the number of HIV/AIDS cases in the previous period was less than 704 and in two
previous periods were less than 781 patients, the number of HIV/AIDS cases would be reduced by
0.027.
BF7 = max (0, Yt-2-751000) * BF6; or max (0, Yt-2-751000); max (0, 820,000 - Yt-1)
BF7 coefficient would be meaningful if the value of Yt-2 is greater than 751 and the value of Yt-
1 is smaller than 820, each increase of base function (BF7) decrease the number of HIV/AIDS
cases to 0.043. Alternatively, if the number of HIV/AIDS cases in the two previous periods were
more than 751 and in one previous period was less than 820 patients, the number HIV/AIDS cases
would be reduced by 0.043. BF8 = max (0, 751 000 - Yt-2) * BF6; or max (0, 751 000 - Yt-2) max (0,
820,000 - Yt-1);
BF8 coefficient would be meaningful if the value of Yt-2 is smaller than 751 and the value of
Yt-1 is smaller than 820, each increase of base function (BF8) can increase the number of
HIV/AIDS cases by 0.118. Alternatively, if the number of HIV/AIDS cases in two periods before
were less than 751 patients, and the period before less than 820 patients, the number of HIV/AIDS
cases will increase by 0.118.
Table 2. Comparis on of ARIMA and MARS models in the number of HIV/AIDS cases
Model Data
In Sample Out Sample
MSE RMSE MSE RMSE
ARIMA 2035.00 45,11 6497,70 254,91 MARS 707.79 26,60 3637,53 60,23
The value of MSE in Table 2 shows that in-sample data which has the smallest MSE value is
MARS model, and the value of RMSE out-sample data which has the smallest value is MARS
model as well, that makes it the best model for the data to predict the number of HIV/AIDS cases.
Closing
The selection of MARS model is performed with forward and backward stepwise based on
the value of GCV. The results of empirical studies show that GCV can work well in determining the
selection of the best model applied to MARS model of continuous response. The empirical results
Public Health Department, Faculty of Sports Science, F1 Building, 2nd
Floor, Sekaran Campus Gunungpati, Semarang City, Central Java Province, Indonesia, 50229 Phone/ Fax. +6224 8508007
645
related to the comparison between the prediction accuracy of the MARS model and other
multivariate models indicate that there is a tendency that the MARS model gives better results.
According to empirical studies of the initial processing of data effect about interactions, many
observations and the minimum number of base functions, and the selection of base functions
which, if properly selected can improve the accuracy of prediction.
The best MARS model with the smallest GCV, 707.794 and the smallest MSE, 21.052 is the
model: (8 – 2 - 1) or BF = 8, MI = 2 and MO = 1. The prediction model of HIV/AIDS cases is:
̂ = 1113.973 - 13.732*BF2 + 0.083 * BF3 - 0.027 * BF4 - 2.263 * BF5 - 0.043 * BF7 + 0.118 * BF8;
The flexibility of MARS approach gives better performance compared to the performance of
ARIMA in predicting the number of HIV / AIDS cases but the changes are still relatively small. Thus
it needs modeling studies using other base functions and time series MARS modeling.
Determining MARS model estimation by using other base functions (e.g. truncated spline, B-
spline and wavelet) can be inferred from the applied study where the B-spline approach gives
better results than MARS on certain functions. Therefore, when MARS modeling are combined
with B-Spline base functions, it may give better results.
References
Arsyad, L. (1999), Peramalam Bisnis. Edisi Pertama BPFE : Jogyakarta Buja, A., Duffy, D., Hastie, T. and Tibshirani, R. (2001), Multivariate Adaptive Regression Splines
(with discussion). Breiman, L. (1991), Discussion of “Multivariate Adaptive Regression Splines”, by J.H. Freidman,
Annals of Statistics, Vol. 19, 82-90. Chattfield, C. (1997), Time Series, Theory and Pratice and Forecasting, Chapman Hall, London. Cryer, J.D., (1986), Time Series Analysis, Boston : Publishing Company. Depkes RI. (2010), Pedoman Nasional Perawatan, Dukungan dan Pengobatan bagi ODHA. Buku
Pedoman untuk Petugas Kesehatan dan Petugas lainnya. Ditjen PPM & PL Depkes : Jakarta Friedman, J.H. (1990), Multivariate Adaptive Regression Splines, Tech Report 102
Rev,Departement of Statistics Stanford University : California. Friedman,J.H. (1991), Multivariate Adaptive Regression Splines (with discussion). Ann. Statist. 19:
1 – 141. Johnson, N. And Wichern, D. (2002), Applied Multivariate Statistical Analysis, 5th Edition. New
Jersey: Prentice Hall, Englewood Cliffs. Kuntoro, (2009), Dasar Filosofis Metodologi Penelitian. Pustaka Melati Surabaya Lewis, P.A.W ; J.G. Stevens. (1991),” Nonlinier Modeling of time Series Using Multivariate
Adaptive Regression Splines (MARS)”. Journal of the American Statistical Assosation, 86, No. 416.(Dec.,1991), pp.864-877.
Lewis, P.A.W ; Bonnie. K.Ray (1997), “Modeling Long-Range Dependence, Nonlinearty, and Periodic Phenomena in sea Surface Temperatures Using TSMARS”. Journal of the American Statistical Assosation, Vol. 92, No. 439.(Sep.,1997), pp.881-893.
Makridakis, Whellrigt, dan McGee (1999), Ciputat, Tangerang : Bina Rupa Aksara Publiser. Hal : 385- 390
Musoke, R (2007), HIV/AIDS in Children. African Medical Research Foundation (AMREF) Allan and Nesta Ferguson Trust : Kenya
Nash. M.S., and Bradford. D. F (2001), Parametric And Non Parametric logistic Regression For Prediction Of Precence Absence Of An Amphibian. Las Vegas : Nevada
Nasronudin. (2012), HIV & AIDS, Pendekatan Biologi Molokuler, Klinis dan Sosial. Airlangga University Press : Surabaya . Hal 20 - 21
Ong‟ech. J and Maranga, O ( 2007), Integrated HIV/AIDS Prevention, Treatment And Care. Kenya: African Medical Research Foundation (AMREF)

646
Public Health Department, Faculty of Sports Science, F1 Building, 2nd
Floor, Sekaran Campus Gunungpati, Semarang City, Central Java Province, Indonesia, 50229 Phone/ Fax. +6224 8508007
Otok, B. W (2008), Pendekatan Bootstrap pada Model Multivariate Adaptive Regression Splines (MARS), Disertasi, Universitas Gadjah Mada, Yogyakarta.
Richard, P and Peter Aggleton (2009), HIV and AIDS-related stigma and discrimination: a Conceptual Framework and Implications for Action Social Science & Medicine, Volume 57, Issue 1, Pages 13-24
Wahba, G, (1990), “Spline Models for Observational Data, Society for Industrial and Applied Mathematics”. Philadelphia. Pennsylvania.
Wei, W.S William. (1990), Univariate and Multivariate Methods. California. Addison Wesley Publishing Company
Public Health Department, Faculty of Sports Science, F1 Building, 2nd
Floor, Sekaran Campus Gunungpati, Semarang City, Central Java Province, Indonesia, 50229 Phone/ Fax. +6224 8508007
647
STUDY OF ENVIRONMENTAL FACTORS ON DENGUE HAEMORRHAGIC FEVER (DHF) CASES
Lintje Boekoesoe
Gorontalo State University, Indonesia
Corresponding Author: [email protected]
Abstract Introduction: The research is conducted in Gorontalo city. The objectives of the research are to study about; correlation between physical environmental factors and DHF cases in Gorontalo city; correlation between Larvae Free Index and DHF cases; correlation between the spread of DHF cases and distance index and DHF infection; correlation between environmental sanitation factors with DHF cases; correlation between risk factors of DHF incidence with PSP in Gorontalo city. Methods: This research is a survey using spatial and ecological approach, and quantitative descriptive methods. Data analyzing use statistical analysis such as frequency distribution, linear regression, multiple regression and Chi-Quadrate. Results: The results research are; In DHF cases, there are a negative correlation to temperature factor as much as 61%, and a positive correlation to humadity factorequal to 60,3% with significant in the real level of 0,05%. While the rainfall factor has no significant correlation to DHF cases, and free larva numbers in Gorontalo city is still under the national standard of 95%; There is a correlation between environmental sanitation factors and DHF cases; The knowledge, behavior and participation factors in DHF control also has significant correlation to DHF cases, and the significant value is showed by p<0.05. Key Words: Physical environment,social-culture, Dengue Hemorrhagic Fever
Introduction
Dengue Haemorrhagic Fever (DHF) is a disease caused by the dengue virus that attacks the
main part of the transport system in the human body, namely blood. As a result of virus attack, the
number of platelets in the blood will decrease, if the attack rate is high and it is handled slowly, it
may result in fatal consequence, death. DHF is caused by the bite of mosquitos named Aedes
aegypti and or Aedes albopictus. The bites of the two mosquito types cause a virus that enters the
human body. This is what causes human suffering from DHF. The symptoms experienced by
patients who suffer from DHF include headaches, high body temperature and high fever. In
addition, dengue is categorized as a disease that potentially can be an outbreak. Dengue
hemorrhagic fever of which has not been found the cure is highly related to environmental
sanitation. Moreover, such condition happens because the vectors of this disease are Aedes
aegypti and Aedes albopictus which live and breed around the settlements. (Hamzah, 2004)
DHF is still one of the diseases that should receive major attention both from government and the
society. In 2009, the provinces with the mortality rate (MR) from the highest to the lowest are
Bangka Belitung (4.58%), Bengkulu (3.08%) and Gorontalo (2.2%) while the provinces with the
lowest mortality rate are West Sulawesi (0 %), Jakarta (0.11%), and Bali (0.15%). Mortality Rate
has managed to achieve the national target that is below 1%, but most of the provinces (61.3%)
have high MR which is still above 1% (Ministry of Health, 2009). It should be the concern to
648
Public Health Department, Faculty of Sports Science, F1 Building, 2nd
Floor, Sekaran Campus Gunungpati, Semarang City, Central Java Province, Indonesia, 50229 Phone/ Fax. +6224 8508007
Gorontalo province who has not reached the target in order to increase the efforts that can
decrease the MR. The efforts that can be done are such as conducting training on the case
management for the officer, providing facilities and infrastructure for early detection, and proper
and quick handling for the DHF case.
Gorontalo city as the administrative center of the Gorontalo province has the development of
various aspects such as in economic, social, cultural, agricultural, and industrial, as well as the
high mobility of the population. These conditions certainly have an impact on the environment and
the public health, such as changes in residential environment that supports the development of
disease vectors as well as the decrease in population health status.
The development of Aedes albopictus and Aedes aegypti as the vector of DHF is closely related to
environmental factors. It includes altitude, rainfall, air temperature, air humidity, density of
settlements and population density.
Although various endeavors have been made to control the vectors of DHF disease, but The
DHF cases is getting even higher from year to year. According to Boewono DT., et. al. (2012),
"Some problems in the prevention efforts may be because of a possibility of DHF cases without
symptoms (asymptomatic), the trans-ovarian transmission (virus passed on to the offspring through
the ovum), the occurrence of the Ae. Aegypti resistance vector to insecticides, and the people‟s
unhealthy behavior that supports the existence of mosquitoe habitats ".
Methods
Research procedures
Research procedure consists of preparation of thematic maps used in the study, and the
classification and the criteria determination of environmental and social factors.
Preparation of thematic maps used in the study
Preparing thematic maps used in the study includes: Isohiet maps, temperature maps,
humidity maps, altitude maps, population density maps, and residential density map.
Classification and criteria of environmental and social factors
From both the measurement of the field data and the results of the interpolation of the maps
used as research parameters, it is carried out the classification and criteria determination.
Classification method used in the study is by determining the class interval as proposed by Bintarto
(1989). The formula is as follows.
Class Interval = ∑ ∑
∑
Analysis of the relation between physical environmental factors and DHF cases.
The relation between climatic factors, which consists of precipitation, air temperature, and
humidity, and DHF cases in the Gorontalo city is analyzed by simple and multiple regression
analysis. In which the climatic factor is the independent variables (X) and the DHF case is the
dependent variable (Y).
Public Health Department, Faculty of Sports Science, F1 Building, 2nd
Floor, Sekaran Campus Gunungpati, Semarang City, Central Java Province, Indonesia, 50229 Phone/ Fax. +6224 8508007
649
Analysis and relation between environmental sanitation factors and DHF cases
The relation between environmental sanitation (clean water, sanitation, environmental
hygiene, and drainage) and DHF cases in the Gorontalo city is analyzed in the form of cross-
tabulation with Chi-squares with a significant probability of 0.05.
Analysis of the relation between factors KAP (Knowledge, Attitude / behavior, and
Participation) and DHF Case
The relation between the respondents‟ knowledge, the respondent‟s behavior, and
community participation in DHF control and DHF cases in Gorontalo city is analyzed in the form of
cross-tabulations with Chi-squares with a significant probability of 0.05, it can be concluded that
there is a relation.
Results and Discussion
Geographic location, border, and area of the study
Gorontalo city is one of the six regions located in Gorontalo province, which borders
Gorontalo and Bone Bolango regency. Geographically, it has 64.79 km2 in width or 0.58 percent of
the Gorontalo province. Astronomically, Gorontalo city is located between 00o 28 '17' - 00o 35 '56'
of North Latitude and between 122o59 '44' '- 123o 05' 59 'of east longitude. Based on its
geographical position, Gorontalo City has boundaries which are in the Northern part is Tapa district
in Bone Bolango district. The southern part is bordered by Tomini Bay. Western part is bordered by
Telaga and Batudaa district of Gorontalo regency. The eastern part is bordered by Kabi;a district,
Bone Bolango regency. The distance between the capital city of Gorontalo to the districts and all-
regions, namely: (1) To the Districts: Gorontalo-Kota Barat (4,00 km), Gorontalo-Kota Selatan
(0,40 km), Gorontalo-Kota Utara (4,00 km), Gorontalo-Kota Timur (3,00 km), dan Gorontalo-
Dungingi (5,00 km); (2) To-Regions: Gorontalo-Limboto (16.00 km), Gorontalo-Kotamobagu
(251.09 km), Manado-Gorontalo (442.81 km), Gorontalo-Tondano via Tomohon (474.07 km),
Gorontalo-Tahuna (992.81 km), and Gorontalo-Bitung (484.20 km).
Gorontalo city is divided into six (6) districts and it consists of 49 villages. These districts
include Kota Barat District, Dungingi, Kota Selatan district, Kota Timur district, Kota Utara district,
and Kota Tengah district. The largest district is Kota Bara with area of 15.16 ha or 23.40 percent.
The width of the smallest district, the Dungingi District, covers 4.10 ha or 6.33 percent.
Number and population density
The number of population in 2010 decreased by 1734 people. The decrease in population
occurred in four districts namely Kota Barat, Kota Selatan, Kota Timur and Dungingi. Kota Selatan
District is the district where the decrease of the population is the highest, 2289 people. On the
other hand, the district which has the least decrease of population is Dungingi district which is 384
people.
Population density describes the ratio of the number of population per unit area of the region
presented by measuring number of people/km2. Based on the results of data analysis of
650
Public Health Department, Faculty of Sports Science, F1 Building, 2nd
Floor, Sekaran Campus Gunungpati, Semarang City, Central Java Province, Indonesia, 50229 Phone/ Fax. +6224 8508007
population density and associated with the number of people suffer from DHF in 2010, it is
concluded that there is no relationship between the population density with the number of DHF
sufferers. Districts based on the population density from the highest one to the lowest are Kota
Tengah District, Dungingi District, Kota Timur district, Kota Selatan district, Kota Utara district, and
Kota Barat district with the number of cases of each are 35, 60, 26, 45, 20, and 19 people.
Types of population’s profession
Types of work done by Gorontalo citizens include Civil Service, Army, Police, Teacher,
Lecturer, Doctor, Midwife/Nurse, Legislative Members, Students and Student Colleges, private
Employees, Entrepreneurs, Farmers, Fishermen, breeders, labors, servants, and not yet working
or jobless.
The relationship between employment with DHF is more about over the activities of a person
/ worker outside the house. It means there is an opportunity to be exposed to the bite of the Aedes
aegypti both inside and outside the house. The relationship between people‟s activity, in which the
higher the activity, the more fatigue the condition of the body. Thus, the condition where the body
is unhealthy (fatigue), it is easy for the virus to transmit through the bite of Aedes aegypti mosquito.
And it can cause people sick.
Health facilities
The number of health facilities in 2010 such as public hospitals, health centers, sub health,
yandu Post, and others, has not changed much. In 2010, there were only 1 public hospital, 3
private hospitals, 2 maternity hospitals, and 7 health centers, 33 auxiliary health centers and 132
health posts. The number of health facilities is very important in helpin the treatment of DHF
disease. Based on the data of Gorontalo City Health Department, almost every district in Gorontalo
has a health center. In Kota Baru, there are two of it. In Gorontalo city, there is also an auxiliary
health center located in each village. In addition, the highest number of auxiliary health centers is
located in Kota Selatan. On the other hand, in Kota Tengah and Dungingi districts, there are only
four auxiliary health centers. Referring to the availability of health centers in every district, it is easy
for the immediate treatment of DHF disease.
The spreading of DHF cases in year 2003-2010
DHF disease is a disease caused by factors such as people's behavior and the environment
where people live. The secondary data obtained showed that the number DHF sufferers in
Gorontalo City increased from year to year. This is even found in each district. At the district level,
DHF surveillance generated data in the form of number of DHF sufferers which fluctuated from
year to year. In 2003, there were 20 DHF sufferers in Kota Tengah, Kota Selatan and Kota Timur
districts with two of them were passed away. In 2004, there were two cases without death toll in
Kota Selatan and Kota Timur districts. In 2005, the number of the sufferers has increased
drastically. There are 184 cases with the death toll 5 occurred in five districts. In the 2006 to 2010
DHF cases have been found in all the districts in Gorontalo city. In 2006, the number of the
sufferers is 170 with 2 death cases. In 2007, there were 124 cases of DHF with 3 death cases. In
Public Health Department, Faculty of Sports Science, F1 Building, 2nd
Floor, Sekaran Campus Gunungpati, Semarang City, Central Java Province, Indonesia, 50229 Phone/ Fax. +6224 8508007
651
2008, there were 99 cases. In 2009, there were 86 cases and in 2010, there was an increase of
DHF cases that is by 205 patients. From the data between 2003-2010, since it was found the DHF
cases, there is an increase of the DHF cases from three to five years.
DHF vector conditions
Larva Free Numeric Data (LFND) which is obtained from the health centers in six District in
Gorontalo City showed that Aedes aegypti population is quite high in each district.
The value of LFND in Dungingi 61%, Kota Tengah 78%, Kota Utara 79%, Kota Selatan 74% and
Kota Barat (Buladu 82% and Pilolodaa 95%) (see Table 4.9). Based on the data above, the value
is still far below the national standard which is 95%. Low LFND illustrates the lack of community
participation in eradicating mosquitoes. Thus, it triggers the increase of the population of Aedes
aegypti mosquitoes and this is what causes DHF transmitted.
The increasing population of Aedes aegypti is caused by the lack of public participation in
doing the mosquito larvae eradication (MLE), as well as the use of insecticide which less effective.
The fact that there are insecticides used in Gorontalo city since the finding of DHF, from 2003 until
now it uses the insecticide called Malation. This causes Aedes aegypti become resistant. "The use
of insecticides in the control of Aedes aegypti mosquitoes needs to be replaced with the alternative
insecticide." (Boewono, DT, et.al, 2012).
Physical environmental conditions
The discussion of the physical environmental conditions in the study includes climate factor
namely rainfall, air temperature, air humidity, altitude, and environmental sanitation.
Climate
Climatic factors affect the growth of Aedes aegypti mosquito larvae that causes dengue
transmission. There are three namely dengue virus, the presence of the vector (as an
intermediary) and the third is human factor. Dengue virus transmits to the human body through the
bite of its mosquito vector that is Aedes aegypti. Climatic factors, especially in the rainy season
and the availability of container that can hold rainwater, it means that there are potential places for
reproduction (habitat) of the Aedes aegypti.
Temperature
Temperature is a measure of the relative thermal conditions possessed by an object. Air
temperature or temperature data are generally hard to obtain because not all the rainfall stations
have the data of temperature. The temperature data is obtained from secondary data by means of
interpolation of five temperature recording stations located around the Gorontalo city, which
includes Tapa, Kabila Suwawa, Taludaa and BGM Jalaludin stations.
The rainy and the dry seasons have an influence on the level of temperature on the environment.
This influence tends to be local to a particular time period only. This is due to the more complex
temperature and humidity levels and also influenced by global phenomenon, regional and
topography as well as the vegetation. When it is season changes from rainy season to dry season,
652
Public Health Department, Faculty of Sports Science, F1 Building, 2nd
Floor, Sekaran Campus Gunungpati, Semarang City, Central Java Province, Indonesia, 50229 Phone/ Fax. +6224 8508007
air temperature ranges between 23°C-31°C, it means this is the optimum temperature range for
breeding mosquitoes (24 ° C -28 ° C).
Air humidity
Air humidity tells the number of air humidity of water vapor in the air. The water vapor in the
air is a small part of the whole atmosphere and air components which are are very important in
terms of weather and climate. Water vapor is not constant, varying from 0% to 5%. The greater the
amount of water vapors in the air, the greater the amount of latent potential energy available in the
atmosphere. This is the source/origin of storm. The minimum average range of air humidity is
72.05%-74.34 and the air temperature 27,380C-27,560C on September it was found 2 cases of
DHF.
Altitude
Altitude is one of the environmental factors that influence the growth of the Aedes aegypti as
the DHF vector. The process of making a height map as the base map is from a contour map of
Gorontalo city with the scale 1: 50,000. The height map can be used to determine the spreading of
altitude according to the administration area. Therefore, village or district as a potential habitat for
the mosquito Aedes aegypti can be recognized through the DHF sufferers.
Residential Density Conditions
Density settlements, settlement increase, the management of the urban environment that is
not optimal and not supported by the climatic conditions, will accelerate the spread of DHF. This
raises the major issues that must be solved. The unavailability of the determination on the
appropriate level of vulnerability of the region to the breeding of Aedes aegypti and Aedes
albopictus mosquitoes makes the efforts to eradicate those DHF vectors harder. It also costs more
and will take a long time to make it.
The residential density is the distance of home buildings that indicates the condition of the air
circulation and comfort to reside. High density settlements show the limited distance between the
buildings, so that the air circulation cannot be going well. The bad air circulation will make the
settlements dump, and it becomes a good medium for the proliferation of disease-carrying viruses
and bacteria.
Sanitation conditions
The condition of environmental sanitation from the result of field observations include
population density, waste management, water canal conditions, water containers, environment
hygiene, land use, density of settlement, and settlement patterns in each district is as follows (the
results of the field survey is presented in appendix on survey data field). The basic sanitation
efforts include the provision of clean water, latrines (human waste disposal), waste management
and drainage (canal) of liquid waste disposal.
Public Health Department, Faculty of Sports Science, F1 Building, 2nd
Floor, Sekaran Campus Gunungpati, Semarang City, Central Java Province, Indonesia, 50229 Phone/ Fax. +6224 8508007
653
Water Supply
Based on the Regulation of the Minister of Health, 416/Min. of Health/Per/IX/1990, clean
water "is water that is used for everyday purposes that qualifies the quality of health and it is
drinkable when it is already boiled. Air is one of the human needs to meet the standards of a
healthy human life ".
Water sanitation is the infrastructure along with its tools and equipment that produce, supply
and distribute clean water to the community. Types of clean water in Gorontalo city include dug
wells, hand pump shallow wells, rain water reservoirs, springs storage, and piping. Water
circulation, water utilization, and the nature of water allow the water effect on health. "In particular,
the influence of water on health can be direct or indirect" (Soemirat, 2002).
Latrine
Latrine is a facility to dispose of human waste. Human waste is all objects or substances
which are not used anymore by the body and must be removed. Substances that are removed
from the body are feces, urine and CO2 as a result of breathing process. "Disposal of human
waste in the environmental health sciences are aimed for feces and urine, but generally called
latrines, privy or toilets" (Notoatmodjo, 2003).
Waste management
In general, the waste management Gorontalo city is actually good enough. It is proved by the
city of Gorontalo as the five year Adipura achiever. Waste management facilities Gorontalo city are
namely the availability of permanent waste disposal sites while temporary waste disposal site is
place in a public place such as school, market, bus stations, harbor, on the side of the road and the
residential units, especially in the housing complex. Household level waste management is still
limited to the collection and subsequently burned or transported to the permanent waste disposal
site by a janitor.
Environmental hygiene which is fairly considered by the resident of household waste from
each house was collected to the temporary waste disposal sites either supplied by each household
or those provided by the Cleanliness city agency from the department of environment. Thus, it is
then transported by car as a routine janitor to permanent waste disposal sites.
Knowledge, attitude / behavior and participation (KAP)
Age
Nadesul, (2007) suggests that "DHF is actually a disease that attacks children only.
However, in the last few years this disease also affects adults". The range age suffering from DHF
survey and the field data in Gorontalo city ranged from age 0 year to > 60 years. The youngest age
range of the respondents who suffer from is 10, while the oldest is 64 years old.
Results of interviews shows that 58.05% (15-59 years) of DHF patients were in the
productive age, the second highest was 41.46% which is in the range between 0-14 years old and
the least is the only one person whose age is 60 years old.
654
Public Health Department, Faculty of Sports Science, F1 Building, 2nd
Floor, Sekaran Campus Gunungpati, Semarang City, Central Java Province, Indonesia, 50229 Phone/ Fax. +6224 8508007
The characteristics of respondents (age) is the highest is from the productive age (119
people). This result is different from the situation nationally, that based on the report of the
extraordinary occurrence in sub directorate of the Ministry of Health (2009), "there was a shift in
DHF cases by age group in period 1993 to 2009.”
Sex
DHF is a disease that continues throughout the year in Indonesia, hence such disease is
called as an endemic. "This shows that this disease can attack both men and women alike with no
exception" (Misnadiarly, 2009). The characteristics of the respondents viewed from results
obtained 104 (50.73%) of the respondents were male and 101 were female respondents (49
274%). Based on Table 4.13 and Figure 4.12 in Gorontalo city there is no difference between the
number of cases of men and women. This is differed from Soemirat (2005) who says that "there is
a difference of various diseases attacking between men and women, as well as the risk will be
higher to women compared with men ".
Education
Education increases the knowledge and understanding of health. It increases the awareness
of the concept of healthy and sick. Thus, it affects the point of view of one's way of life and efforts
to improve health status. The eradication of Aedes aegypti should be an immediate need and the
result of it should be preserved so that the attempt to nourish themselves and their surroundings
will be carried out spontaneously. This eventually will become a habit, attitude and behavior of a
person to live a healthy life.
Characteristics of respondents by educational level show that there is no the never finish
primary school or never school people, 102 (49.8%) high school graduate respondents, 25
(12,2,8%) primary school respondents, 26 (12.7) junior high school graduate respondents, and 39
(19.0%) college graduate respondents.
Job
The characteristics of respondents by occupation in Gorontalo city show that most of
Gorontalo citizens did not work which were counted to be 75 (36.59%) of them. Those who are
working in the service sector 7 (3.41%), merchant with 12 (5.85%) people self-employed with 19
(9.27% ) people, private employees with 19 (9.27%) people, civil servants with 25 (7.32%) people
and in other fields are 52 (25.37%) people. Based on the data analysis of the type of work of the
Gorontalo citizens, it is obtained that the highest number of the not working are children. It shows
the everyone with every type of job is vulnerable to DHF disease.
Behavior Society
Human behavior is essentially a human activity done on their own. Behavior is a reflection of
a variety of psychiatric symptoms, such as knowledge, desire, will, interest, motivation, perception,
attitude, and so on. Meanwhile, psychiatric symptoms are also influenced by the experience,
confidence, facilities and socio-cultural factors that exist in the environment (Notoatmodjo, 1993).
"Behavior is the result of all kinds of human experiences and interaction with the environment
Public Health Department, Faculty of Sports Science, F1 Building, 2nd
Floor, Sekaran Campus Gunungpati, Semarang City, Central Java Province, Indonesia, 50229 Phone/ Fax. +6224 8508007
655
which is manifested in the form of knowledge, attitudes and actions" (Sarwono, 1993: 1). According
to Notoatmodjo (1993), "health behavior is basically a response to stimuli associated with illness
and disease, health care systems, food and environment". In addition, health behavior according to
Becker (in Notoatmodjo, 1997: 124) is "activities done relating to one's actions in maintaining and
improving health ".
Society‟s knowledge
The assessment of knowledge about DHF was measured by 14 questions covering
knowledge about DHF, DHF source of information, DHF symptoms, DHF transmission, DHF that
can be contagious, kinds of insect causes DHF, the breeding places of DHF-causing mosquitoes,
DHF vectors‟ activity, the risk to be infected by DHF, and DHF can be prevented.
Notoatmodjo (2003) states, "Knowledge is the result of knowing. It is created after sensing a
certain object by the human senses". The knowledge of the respondents regarding the DHF and its
vectors as well as the factors that influence the presence of Aedes aegypti is needed to prevent
and suppress the growth and the transmission of DHF and its vectors.
Knowledge about DHF
From the result of collecting 205 respondents‟ knowledge, it is obtained the frequency
analysis results shows that the respondents who have ever heard about DHF are 79 (38.5%) of the
respondents, and those who had never heard of DHF are 126 (61.5%) of the respondents.
This can be one of the further efforts to improve education and dissemination of information to the
public about dengue.
Source of Information about Dengue Hemorrhagic Fever (DHF)
The sources of information about dengue can be obtained from the cadres and health
workers as well as electronic media (TV / Radio) and newspapers. Health cadres are those who
were recruited by the Department of Health who then trained to become facilitators for health
workers as well as assigned to include in helping the public health centers. Cadres of health are
those from housewives who joined the Family Welfare Movement (FWM) group who had been
trained by health workers to deal with the symptoms, prevent DHF. On the other hand, health
workers are civil servants. The sources of information about DHF include cadres of health, health
workers, electronic media (TV / Radio), and newspapers.
DHF Symptoms
Symptoms of DHF illness is not typical and specific in nature. It means that the "signs and
symptoms can vary for each patient based on the degree they experienced" (Hamzah, 2004). The
knowledge of the respondents about the signs or symptoms of people suffering from DHF, from the
questions asked that the signs and symptoms of people affected by DHF are headache, bone pain,
fever, and those are all true. Based on Table 4:19, 79 people or 38.5% of respondents knew about
the signs or symptoms when someone is suffering from DHF, such as high fever, headache, bone
pain and fever. However, 99 people (48.3%) of respondents knew that the symptoms are only the
656
Public Health Department, Faculty of Sports Science, F1 Building, 2nd
Floor, Sekaran Campus Gunungpati, Semarang City, Central Java Province, Indonesia, 50229 Phone/ Fax. +6224 8508007
high temperature. Those who knew fever are 22 people (10.7%), and headache and bone pain are
5 (2.4%) people.
Ways of DHF to transmit
Society plays an important role in the efforts to eradicate DHF. For example, the role of the
community in surveillance of DHF, where people can recognize the early signs of DHF that may
attack one of the family members or their neighbors, so they can be hospitalized immediately in the
nearest health care facility. "Surveillance activity is a series of activities that are regularly and
continuously, actively or passively observing, collecting, analyzing, and interpreting a phenomenon
on human health / particular community and the result is used to take action against these health
occurrences" (Directorate of Health and Nutrition society, 2006).
Knowledge about dengue
Misnadiarly, (2009) mengemuakan that "Dengue hemorrhagic fever is an infectious disease
caused by the dengue virus and transmitted by the bite of Aedes aegypti" .Pengetahuan about
whether dengue is contagious or not, of the 205 respondents that as many as 50 people or 24.4%
figure that dengue is an infectious disease, dengue is not transmitted 118 people (57.6%), a highly
contagious 1 person (0.5%) and did not know 36 people (17.6%).
Type of Insects
People‟s knowledge about the insect causing DHF which is mosquito Aedes aegypti is still
low. There are 131 (63.9%) of the respondents who do not know the Aedes aegypti mosquito
causing DHF. This indicates that most respondents do not know the Aedes aegypti mosquito is the
cause of DHF.
Breeding place for Aedes aegypti
Breeding places for mosquitoes are the stagnant water and water reservoirs. 35 (17.1%) of
the respondents said that they know the breeding places for mosquitoes which is the stagnant
water and 154 (75.1%) of the respondents said it is in the water reservoirs, while the remaining 16
people knowing where the breeding place for Aedes aegypti is in the bathroom tub and landfills.
This is in accordance with the opinion of Sigit and Hadi (2006), that: "The breeding places for
Aedes Aegepti mosquitoes are in shelters that are not paved soil such as the tub, jars, drums,
flower vases, and used items that can collect rain water".
Time biting mosquito Aedes aegypti
Aedes aegypti, the mosquito's biting activity is during the day, morning and in the afternoon
(Sigit and Hadi, 2006). Knowledge of respondents regarding when a mosquito bites an analysis of
the results obtained indicated that the results of 46 people have said that it is the morning and
evening, or it is the 22.4 percent of the respondents. A total of 5 people declare mosquito bites
occur at night or 2.4 percent, while those who state the whole day are just 142 people, or 69.3
percent.
Public Health Department, Faculty of Sports Science, F1 Building, 2nd
Floor, Sekaran Campus Gunungpati, Semarang City, Central Java Province, Indonesia, 50229 Phone/ Fax. +6224 8508007
657
DHF can be prevented
Respondents‟ knowledge about the symptoms, signs and causes of DHF is fairly good. They
also has well know about the breeding places for mosquitoes as well as anyone who commonly
can be infected and DHF actually can be prevented respondent. The level of knowledge of the
population is strongly influenced by the information obtained either directly or from the results of
learning. If the information is not delivered right on target, it is due to the delivery of information or
transfer information from health workers to the health cadres at the lower levels. Besides, it is also
influenced by the "media to deliver information through counseling, electronic media, practice,
leaflets and banners" (Notoatmodjo, 2003).
Community action
Components society actions captured by the questions about dengue symptoms of dengue
fever include how to handle DHF symptoms, efforts to avoid the bites, usig the temefos, cleaning
up efforts with voluntary work, counseling and organizing outreach activities about DHF.
Notoatmodjo (2003) suggested that "action is the manifestation of attitudes into real action".
The provision of information is critical for handling DHF case and it is where one can directly
receive information from health professionals about the mosquito causing DHF. Rogers in
Notoatmodjo (2003) states that before adopting new behavior, there happens the following process
inside one‟s self: (1) Awarenes in which one recognizes in term of knowing about the stimuli or
object.; (2) Interest for the stimuli or the object. In this case, subject‟s attitude starts to appear. ; (3)
Evaluation on either it is good or not about the stimuli for him. This means that the respondents‟
attitude is getting better; (4) Trial, where the subject starts to try to do something according to what
is desired by the stimulus and; (5) Adaption, where the subject has recently behaved in
accordance with the knowledge, awareness, and attitude toward the stimulus.
The Relationship of Physical Environmental Factors on Dengue Cases
DHF is a vector-based disease that becomes a major cause of death in many tropical
countries. The increase of DHF cases is influenced by several factors. One of which is the lack of
attention on the climatic factors. The least attention on climatic factors in DHF prevention program
resulted in the prevention and control of DHF less than the maximum. If what becomes the concern
is only the DHF sufferers, outbreak of concern are patients, however, the efforts to anticipate the
causing will be still lacking.
Relationship between Rainfall on DHF cases in Gorontalo city
DHF cases always occur in every rainy season (before, in the middle, and after the season).
Rainy season becomes the factor causing DHF due environmental factors that support the growt of
larvae of Aedes aegypti. This is according to McMichael (2006) in one epidemiological bulletin
(2010) states that "climate change causes changes in rainfall, temperature, humidity, air direction
so that it also affects the terrestrial and marine ecosystems as well as affecting health, especially
the proliferation of disease vectors such as mosquitoes Aedes, malaria and such before and after
the monsoon season ".
658
Public Health Department, Faculty of Sports Science, F1 Building, 2nd
Floor, Sekaran Campus Gunungpati, Semarang City, Central Java Province, Indonesia, 50229 Phone/ Fax. +6224 8508007
The analysis of the relationships between rainfalls with dengue cases uses statistical
analysis with SPSS 16.0. Based on the results of the correlation coefficient in attachment 9, it can
be known that the relationship between rainfall and dengue cases showed no association with (R =
0.47). The coefficient of determination (R2) is 0.223, meaning that the regression line equation can
explain that variation which is 22.3% of dengue cases based rainfall factors as the determinant of
dengue cases in Gorontalo city in 2010. In addition, 77.7% of dengue cases variation is explained
by other factors. Next, from the analysis of variance (F test), the value of F (count) is 2.874 with a
probability of 0.121, which is much larger than 0.05. It can be said that the relationship was not
significant / non-significant with a constant value (a value) is -12.996 and the value of b = 0.222 so
the regression equation: Y = a + bx, so the DHF cases = -12 996 + 0.222 (Rainfall).
Temperature relationship with DHF cases in the city of Gorontalo
The rainy and dry seasons have an influence on the level of temperature of the environment.
The effect of temperatures tends to be local to a particular time period, this is due to the more
complex temperature and humidity levels and also influenced by global phenomenon, regional and
topography and vegetation. The changes of season from rainy season to dry season make the
conditions of temperature ranging between 23°C-31°C. Aedes aegypti mosquito usually lives at
low temperature with decreased metabolism, and even stops when the temperature drops to below
the critical temperature. Meanwhile, temperatures which is higher than 35 ° C can affect
physiologic process, the optimum temperature for mosquito growth is 25 ° C -30 ° C (WHO, 2003).
The Relationship between Air Humidity with DHF case in Gorontalo city
Air humidity becomes one of the environmental factors that determine the development of
Aedes aegypti mosquito larvae. Air humidity monthly average ranged between 72%-83.5%. Lowest
humidity occurs in September (72.05%) and the highest is in January (83.49%). The ideal humidity
for the growth or breeding of the Aedes aegypti mosquito is 60-80%. Humidity affects the Aedes
aegypti mosquito breeding cycle. If it is less of dumpness, the eggs can hatch in a long time, and it
can reach three months. If it is more than three months, the eggs will decrease its fecundity (no
longer able to hatch). Although, it is only a week, if the humidity is quite high (> 70%) embryos can
still grow in its eggshell.
The relationship between Altitude with dengue cases in the city of Gorontalo
DHF is a health problem in the tropical region. This is an endemic disease. This disease
spreads over most parts of Indonesia, and repeatedly raises Extraordinary Events (KLB) which
followed by the death of many of its sufferers . The disease is transmitted by the mosquito Aedes
aegypti and i is influenced by various factors, including the altitude factor.
The relationship Index of Larva Free with DHF cases in the city of Gorontalo
DHF is a public health problem. An area is said to be free is when the index of larva free is ≥
95%, and no free larvae <95%. By analysis of variance, the value of F (count) of 29 166 with a
probability of 0.003, which is much smaller than 0.05, the linear regression model Y = 161.98 -
1.68X can be used to predict the DHF patients, or in other words, it has nothing to do with the
Public Health Department, Faculty of Sports Science, F1 Building, 2nd
Floor, Sekaran Campus Gunungpati, Semarang City, Central Java Province, Indonesia, 50229 Phone/ Fax. +6224 8508007
659
increase in the index of larva free decline in the growth of DHF mosquito larvae resulting in a
decrease in the number of DHF. The regression of the larva free index coefficient of 1.68 explains
that each decrease of 1% larva free index can contribute to the decline in mosquito larvae which
causes a decrease in DHF cases around 1.68 people (rounded 2).
The Index of Distance and spreading of DHF Cases
Gorontalo city is a city that is DHF endemic, because of DHF cases increased year by year.
In 2010, the number of DHF cases are 205, after conducting the distance index, indicating that the
distance between the case for all districts in the city of Gorontalo is located between 0-50 meters.
The buffer zone showed that the location of the house between dengue cases in the city of
Gorontalo is relatively adjacent which are 50 meters. This could potentially be a source of
transmission of DHF. The transmission of DHF in Gorontalo city is largely determined by the
behavior of the mosquito vector Aedes aegypti (<100 m). The results of this study support the
claim of Boewono DT, et. al. 2012 that states that: "The transmission distance of DHF is 100
meters in accordance with the flying range (flight range) of the mosquitoes Aedes aegypti".
The Relationship between Environmental Sanitation with DHF Cases in Gorontalo city.
Environmental sanitation is a factor to determine whether or not the condition of a good
environmental sanitation. The components include settlements, provision of clean water, latrines,
sanitation, and waste disposal management. In general, the condition of the environment in
Gorontalo city is good enough, it is supported by the availability of water and clean water supply
systems, waste management and waste management facilities in the city of Gorontalo as well as
the residential density.
The Relationship between KAP (Knowledge, Attitude / behavior and participation) with DHF
cases in Gorontalo City
Socio-cultural factors were analyzed further is the level of knowledge, the behavior of the
respondent, and the respondent's participation in the control of DHF and DHF cases occurs in the
city of Gorontalo is described below.
The relationship between Knowledge with DHF Case
"Knowledge is the cognitive process of a person or individuals to give meaning to the
environment, so that each individual will give their own meaning to stimuli even if the stimuli
received is the same", (Winardi, 1992). "Knowledge is the result of the sensing of an object.
Sensing is largely derived from the vision and hearing ", (Notoatmodjo, 1993).
The relationship between Respondent’s Behavior with DHF Cases
Human behavior is essentially an activity done by himself. "Behavior is a reflection of a
variety of psychiatric symptoms, such as knowledge, desire, will, interest, motivation, perception,
attitude, and so on. Meanwhile, that psychiatric symptoms are also influenced by the experience,
confidence, facilities and socio-cultural factors that exist in their environment "(Notoatmodjo,
1993)." Behavior is the result of all kinds of human experiences and interaction with the
660
Public Health Department, Faculty of Sports Science, F1 Building, 2nd
Floor, Sekaran Campus Gunungpati, Semarang City, Central Java Province, Indonesia, 50229 Phone/ Fax. +6224 8508007
environment that is manifested in the form of knowledge, attitudes and actions ". (Sarwono,
1993:1).
Relations Community Participation in Dengue Control
Participation is an effort for someone to be involved in the control of DHF in Gorontalo city.
Participation is a process where all relevant parties (stakeholders) are actively involved in the
activities, starting from planning to implementation. "Involvement of all groups does not necessarily
mean physically involved, but the important thing is to ensure the involvement of all stakeholders
procedure can represent all interests" (Sambroek and Eger , 1996). Furthermore, Bryant (1983) in
Slamet (1993), argued that: "In a community, participation activities are influenced by the benefits
received, costs spent, and the risk that must be faced in the implementation of activities".
Closing
Based on the analysis and discussion described in Chapter IV, it can be concluded that the
DHF cases in the city of Gorontalo related to some physical environmental factors, environmental
sanitation and the KAP factor (knowledge, attitudes / behaviors, participation). In general, there
obtained some conclusions as follows: (1) The physical environmental factors in Gorontalo city
including rainfall, air temperature, air humidity, and altitude have a relationship with DHF cases. In
conditions of high rainfall (158.63), the number of cases is 96. When temperature > 270C, the
number of cases is 197. With the humidity <80, the number of cases is 134, and with altitude <50
m above sea level, it occured 115 cases, with the height of above sea level 50 -> 100 m, the
number of cases is 90 case; (2) Free Larva Index has a relationship with DHF cases. The average
of Free Larva Index in 2010 in the city of Gorontalo is still below the national standard (95%), the
public participation needs to be improved; (3) The spreading of DHF cases in Gorontalo city is
clustered, with an index of 50 meters and transmission caused by the Aedes aegypti mosquito
behavior; (4) Environmental sanitation factors have a relationship with DHF cases. Poor sanitation
conditions are reflected with larva free index <95% and the number cases occurred in 2010 was
205 cases; (5) KAP community factors including the level of knowledge, behavior and participation
in DHF control has a relationship with DHF cases in each region of districts in the city of Gorontalo.
The higher the knowledge, the lower the respondents' possibility of DHF transmission. The better
the behavior, then the smaller the number of DHF patients. The higher the participation, the lower
the DHF cases in the city of Gorontalo.
References Hamzah, M. 2004. Bionomik Aedes Aegypti. Jurnal Kedokteran Kesehatan. 36. (4) : 96-901 Sumarmo, Purwo Soedarma, “Demam Berdarah Dengue”, Majalah Medika No. 10 Th XXI,
Oktober 1995 Soemirat, Juli. 2005. Kesehatan Lingkungan. Gadjah Mada University Press, Yogyakarta Soemirat, Juli. 2011. Kesehatan Lingkungan (Revisi). Gadjah Mada University Press,
Yogyakarta. Boewono, D.T,Widiarti,Widyastuti, U., Mujiono., Lasmiati., 2006. Deteksi virus dengue pada
Ae.aegypti dibeberapa daerah endemis di Jawa Tengah. Seminar sehari strategi
Public Health Department, Faculty of Sports Science, F1 Building, 2nd
Floor, Sekaran Campus Gunungpati, Semarang City, Central Java Province, Indonesia, 50229 Phone/ Fax. +6224 8508007
661
pengendalian vektor dan reservoir penyakit pada kedaruratan bencana alam diera desentralisasi, 20 September 2006, Salatiga, Jawa Tengah .
Wardhana, W,A. 2004. Dampak Pencemaran Lingkungan, Andi Offset, Yogyakarta. Notoatmodjo, S. 2007. Ilmu Kesehatan Masyarakat. Rineka Cipta : Jakarta Notoatmodjo, S. 1993. Pengantar Pendidikan Kesehatan dan Ilmu Perilaku Kesehatan. Yogyakarta
: Andi Offset. Notoatmodjo, S.. 2003. Pengantar Pendidikan Kesehatan dan Ilmu Perilaku Kesehatan.
Yogyakarta. Andi Offset. Nadesul, Hendrawan. 2007. Cara Mudah Mengalahkan Demam Berdarah. Penerbit Buku Kompas
: Jakarta Misnadiarly. 2009. Demam Berdarah Dengue (DBD). Pustaka Populer Obor : Jakarta Sarwono, Solita, 1993. Sosiologi Kesehatan: Beberapa Konsep Beserta Aplikasinya. Gadjah Mada
University Press, Yogyakarta Sigit, H. Singgih dan Upik K. Hadi. 2006. Hama Pemukiman Indonesia. Unit Kajian Pengendalian
Hama Pemukiman. Fakultas Kedokteran Hewan. IPB. Bogor Direktorat Kesehatan dan Gizi Masyarakat 2006. Laporan Kajian Kebijakan Penanggulangan
(Wabah) Penyakit Menular (Studi Kasus Dbd) . Jakarta: Badan Perencanaan Pembangunan Nasional .
Nurma, Yussanti, M. Salamah dan Heri Kuswanto. 2010. Pemodelan Wabah Demam Berdarah Dengue (DBD) di Jawa Timur Berdasarkan Faktor Iklim dan Sosio Ekonomi dengan Pendekatan Regreasi Panel Semi Parametrik. Fakultas Statistik. Institut Teknologi Surabaya.

662
Public Health Department, Faculty of Sports Science, F1 Building, 2nd
Floor, Sekaran Campus Gunungpati, Semarang City, Central Java Province, Indonesia, 50229 Phone/ Fax. +6224 8508007
Public Health Department, Faculty of Sports Science, F1 Building, 2nd
Floor, Sekaran Campus Gunungpati, Semarang City, Central Java Province, Indonesia, 50229 Phone/ Fax. +6224 8508007
663
ENSURE ENVIRONMENTAL SUSTAINABILITY
AND HEALTH IN PUBLIC DEVELOPMENT
PAPERS

664
Public Health Department, Faculty of Sports Science, F1 Building, 2nd
Floor, Sekaran Campus Gunungpati, Semarang City, Central Java Province, Indonesia, 50229 Phone/ Fax. +6224 8508007
Public Health Department, Faculty of Sports Science, F1 Building, 2nd
Floor, Sekaran Campus Gunungpati, Semarang City, Central Java Province, Indonesia, 50229 Phone/ Fax. +6224 8508007
665
MODEL OF FISHING COMMUNITIES WELFARE IN COASTAL AREA IN GORONTALO UTARA DISTRICT
Rama Hiola1, Herlina Jusuf1, Yuniarti Koniyo1
Gorontalo State University, Indonesia
Corresponding Author : [email protected]
Abstract Introduction: The aim of this study is to develop indicators of coastal development on the welfare of fishing communities by environmental factors and economy adaptation in Gorontalo Utara district with Spatial Bayesian SEM and Machine Learning. Specific targets to be achieved is the existence of the development design so that the equalization of poor households in coastal area in Indonesia, especially in Gorontalo Utara district. Methods: Methods of data analysis used in this study are (1) descriptive and identification of data, (2) develop the coastal area development indicators, environment, economy adaptation, fishing communities walfare with Bayesian CFA methods, and obtaining structural models with Spatial Bayesian SEM to obtain the factors that influence the welfare of fishing communities in coastal area, (3) evaluate the welfare of fishing communities in coastal area by classification accuracy using CART, MARS, Bagging CART and MARS methods, (4) evaluate the classification accuracy of fishing communities in coastal area for out sample data using Bagging CART and MARS methods, (5) compare poor households models with Bagging CART and MARS models to obtain the best model. Results: The result of this study showed that fishers welfare indicators are ship and fishing tools ownership, housing, income, electricity bills, health, savings, and education. Keywords: Poverty, CART, MARS, bagging CART
Introduction
Poverty in this era is still a complex problem to solve. Not infrequently the problem of poverty
being a reason to evaluate the performance of the government and could even bring down the
government because it is considered not being able to improve the lives of people. During poverty
are more likely to be associated with economic factors, this is due to the more easily measured,
observed and compared. But other factors need to be considered in terms of poverty are social
factors, cultural, social, political, environmental, health, education and character. At the community
level, infrastructure is a major determinant of poverty. Infrastructure development indicators that
are often used in econometric modeling, such as the availability of health facilities, availability of
schools, lack of access to electricity, the distance to the center of administration / capital city
(World Bank Institute, 2002).
In this time, the Indonesian government efforts aimed at realizing a society that is just and
prosperous through development activities, which have been outlined in a strategy called the
"Triple Track srategy" to improve people's welfare, namely: Pro-Job: Job creation; Pro-poor growth:
economic growth and stability; and Pro-poor: poverty reduction; and within the framework of the
Pro-Environment: Handling of climate change (Alisjahbana, 2010). Various government programs
to improve the well-being especially coastal communities, made for this percentage is still very
small in the amount of 0.02%, which credit institutions and government program focuses on the
666
Public Health Department, Faculty of Sports Science, F1 Building, 2nd
Floor, Sekaran Campus Gunungpati, Semarang City, Central Java Province, Indonesia, 50229 Phone/ Fax. +6224 8508007
development on the mainland, while the maritime sector to be neglected (General Directorate of
fisheries , 2010)
Several studies related to the welfare conducted by Santoso & Otok (2009), examines the
factors that influence exclusive breastfeeding in poor households with MARS approach.
Wahyuningrum (2008) also examined the accuracy of the classification of rural / poor villages in
East Kalimantan with MARS approach. In 1995 Faturokhman and Molo examine the characteristics
of poor households in Yogyakarta. Rahmawati (1999), examines employment of the poor in
Jakarta. Then BPS works closely with Word Bank Institute (2002) developed the basics of the
analysis of poverty. Gönner, Chayat, and Haung (2007) examines poverty and household welfare,
the result is a guide for the West Kutai, then Suryadarma, et al (2005) examines a family's welfare
objective for targeting poverty with PCA (Principal Component Analysis). Furthermore Een & Otok
(2009), doing household welfare classification with CART approach.
Results of research conducted by Sjafi'i, Bengen and Gunawan (2001) states that the
amount of pressure the population with socio-economic dynamics, as well as the magnitude of the
demands of local governments to obtain funding sources for increased the acceleration of
development, it has an impact that is less favorable for environmental and natural resources
sustainability into capital construction of the present and future. Don Chernichovsky and Oey Astra
Meesok (1985) in Masfufah (2000), examines poor households characteristics in Indonesia are:
number of household members with a lot of the household head as the backbone of the family, the
education level of the household head and members mean low average, frequent job changes and
some of them willing to accept another additional job if its offered, most expenditures to consume
foods with a percentage of expenditures for most major carbohydrates, mostly main income comes
from agriculture and land tenure is still marginal, the house is still very poor condition in the case of
water and electricity for lighting. Rusastra and Togar (2007), the general characteristics of the poor
are mostly staying in the village, working in the agricultural sector, the informal nature of the job is
the job status as well as family workers in pay. Otok, Suhartono, Sutikno, Purhadi and Santi
(2012), developed indicators of poor households in the 3 dimension factors of poverty, namely
human resources, economics and health. Therefore this study will develop indicators of coastal
development on the welfare of fishing communities through environmental and economic
adaptation factors in Gorontalo Utara district with spatial Bayesian SEM and machine learning
approach.
Research on poverty and welfare described above indicated that many factors that affect
poor households in a region. So it is necessary to identify the factors that most affect the poor
households in a coastal region of, particularly in Gorontalo Utara District, to be used as a
development planning so that development will be more focused on the reduction of poor fishing
communities.
SEM is an appropriate tool to measure the research variables unmeasured (latent). The
latent variables can be indirectly measured by an indicator variable. SEM can also describe the
Public Health Department, Faculty of Sports Science, F1 Building, 2nd
Floor, Sekaran Campus Gunungpati, Semarang City, Central Java Province, Indonesia, 50229 Phone/ Fax. +6224 8508007
667
causal relationship between variables that can not be described in ordinary regression analysis, so
that it can be seen how well an indicator variable determining the latent variables.
Based on the problems mentioned above, and the opportunity of further research related to
the modeling of poor households still open breadthly, so in this study the focus issues to be
investigated by researchers is How to model the welfare of fishing communities of an area based
on the development of coastal areas, environmental and economic adaptation factors by spatial
Bayesian SEM-based?
BPS (2009) defines the poverty line as the value of rupiahs to be issued in one month in
order to meet the basic needs of the calorie intake of 2100 kcal / day per capita (food poverty line)
plus a minimum non-food needs is someone needs, ie clothing, schools, transportation and other
basic needs of the individual household (non-food poverty line).
In explaining the relationship between the response variable with the predictor variables can
be used regression curve. Regression curve approach that is often used is a parametric regression
approach, which assumed the form of the regression curve (such as linear, quadratic, cubic) based
on the theory that can provide connection and error is normally distributed information (Draper and
Smith, 1992). However, not all patterns of relationship can be approximated by a parametric
approach, in the absence of any information about the relationship shape of the predictor variables
and the response variable. If the parametric model assumptions are not met then the regression
curve can be predicted using nonparametric regression model approach. Whereas, if not met the
normality assumption used bootstrap approach.
Structural Equation Modeling (SEM) is a multivariate technique that combines aspects of the
factor analysis and multiple regression analysis that allows researchers to simulate a series of
dependent relationships between the measured variables and latent constructs as well as between
latent constructs (Hair et al., 2006).
Methods
The study design
Operational definition and measurement of research variables that used in his study are:
Coastal area development.
Coastal area development is the construction carried out in the coastal area which is located
in the Gorontalo Utara district. Operational variables of this coastal area development which will be
the measurements are: Infrastructure in coastal development, indicator used to measure the
infrastructure in coastal area development are: infrastructure, trade area construction, and the port;
fishing community income generation programs; capacity and capability building programs. It is to
see the results that have been achieved in the development of coastal areas that provide benefits
to fishing communities.
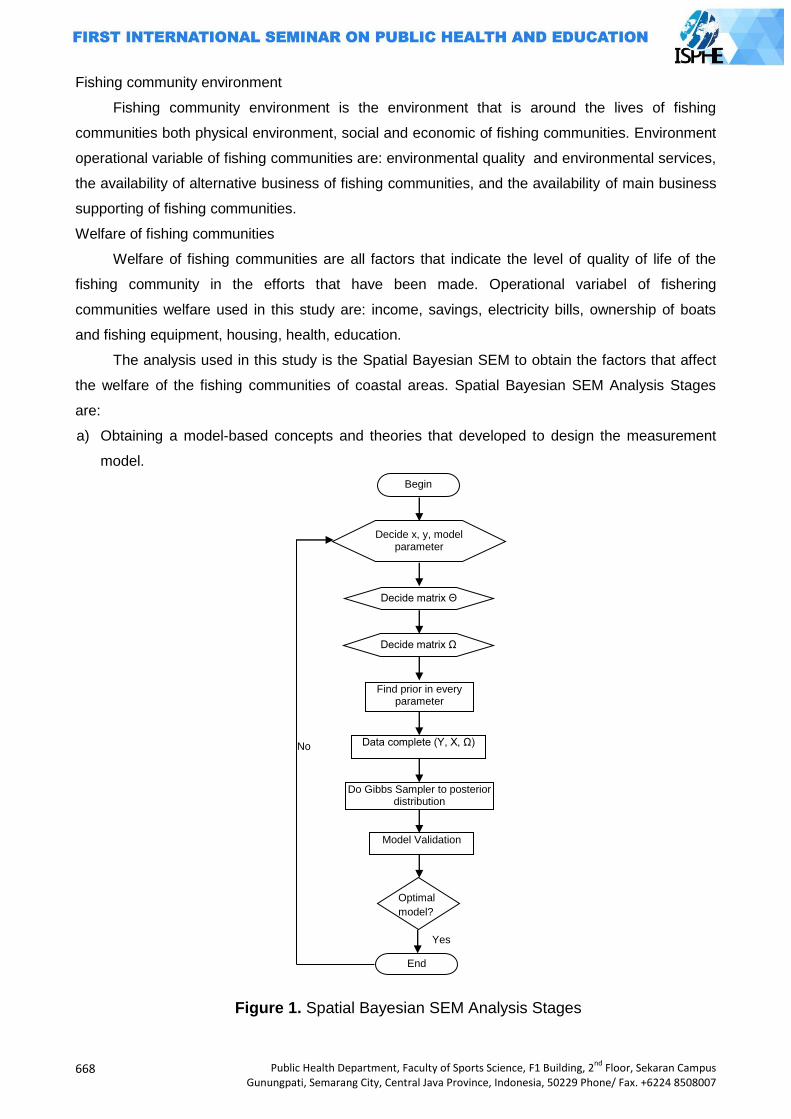
668
Public Health Department, Faculty of Sports Science, F1 Building, 2nd
Floor, Sekaran Campus Gunungpati, Semarang City, Central Java Province, Indonesia, 50229 Phone/ Fax. +6224 8508007
Fishing community environment
Fishing community environment is the environment that is around the lives of fishing
communities both physical environment, social and economic of fishing communities. Environment
operational variable of fishing communities are: environmental quality and environmental services,
the availability of alternative business of fishing communities, and the availability of main business
supporting of fishing communities.
Welfare of fishing communities
Welfare of fishing communities are all factors that indicate the level of quality of life of the
fishing community in the efforts that have been made. Operational variabel of fishering
communities welfare used in this study are: income, savings, electricity bills, ownership of boats
and fishing equipment, housing, health, education.
The analysis used in this study is the Spatial Bayesian SEM to obtain the factors that affect
the welfare of the fishing communities of coastal areas. Spatial Bayesian SEM Analysis Stages
are:
a) Obtaining a model-based concepts and theories that developed to design the measurement
model.
Figure 1. Spatial Bayesian SEM Analysis Stages
Begin
Decide x, y, model parameter
Decide matrix Θ
Decide matrix Ω
Find prior in every parameter
Data complete (Y, X, Ω)
Do Gibbs Sampler to posterior distribution
Model Validation
Optimal
model?
End
Yes
No
Public Health Department, Faculty of Sports Science, F1 Building, 2nd
Floor, Sekaran Campus Gunungpati, Semarang City, Central Java Province, Indonesia, 50229 Phone/ Fax. +6224 8508007
669
b) Creating structural models and pathway diagrams that may explain the pattern of the
relationship between latent variable and its indicators and also involving the location effect.
c) Conversing pathway diagram into equation.
d) Estimating the parameters (weights, loading factor, pathway coefficients) and estimating the
bootstrap aggregating (bagging).
e) Testing the significance of the measurement model parameters. Testing the significance of the
structural model parameters. Determining the goodness of fit model.
Data collection techniques and data sources.
The data used in this study comes from the data collection of the National Socioeconomic
Survey (Survei Sosial Ekonomi Nasional (SUSENAS-2010)) of Gorontalo Utara district. Susenas is
a survey designed to collect social data in a very broad scope. The data collected were related to
the fields of education, health/nutrition, housing, other socio-economic, socio-cultural activities,
consumption/expenditure and household income, travel and public opinion on household welfare.
The following are the variables that are used as endogenous variables and exogenous variables.
Variables that have been used consists of three endogenous latent variables , one exogenous
latent variable , 13 manifest variables (Y) which the observation is Gorontalo Utara district.
Methods of data analysis
Furthermore, the method of data analysis performed in this study can be explained as
follows: (1) Descriptive and identification data. Descriptive aimed to determine the characteristics
of the data. Identification includes the identification of the relationship between the response
variable with the predictor variables that can be shown on the matrix plot and the value of the
correlation; (2) Develop indicators of coastal area development, environmental, economic
adaptation, welfare of fishing communities with Bayesian CFA method, and obtain the structural
model with the Spatial Bayesian SEM to obtain the factors that affect the welfare of the fishing
communities of coastal areas.
Results and Discussion
Validity test
Validity test is intended to determine whether the questions in the questionnaire is quite
representative. Validity test is done by using confirmatory factor analysis on coastal area
development variable (X1), the environment of coastal communities (Y1), the behavior of the
economic adaptation of fishing communities (Y2), and the welfare of fishing communities (Y3)
through AMOS 20 program.
Development of coastal area (X1)
Coastal area development (X1) is an exogenous latent variable measured by three (3)
variables: capability development program (X1.1), income generation program (X1.2), and the
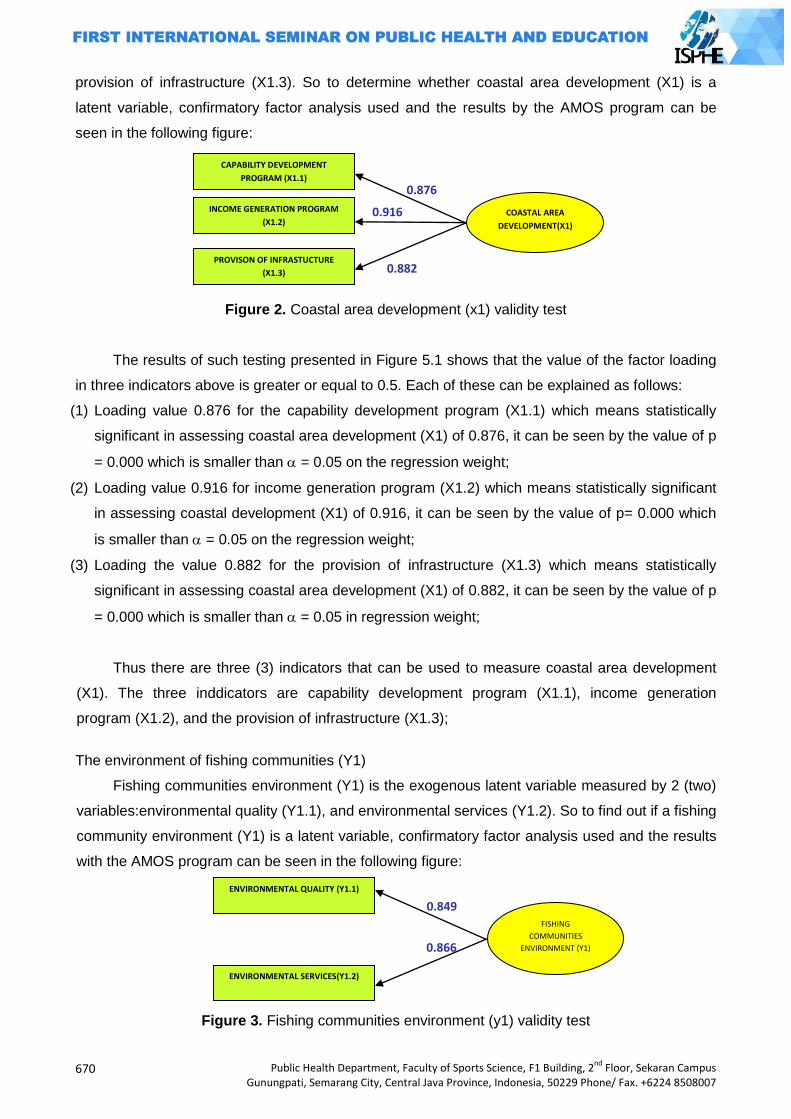
670
Public Health Department, Faculty of Sports Science, F1 Building, 2nd
Floor, Sekaran Campus Gunungpati, Semarang City, Central Java Province, Indonesia, 50229 Phone/ Fax. +6224 8508007
provision of infrastructure (X1.3). So to determine whether coastal area development (X1) is a
latent variable, confirmatory factor analysis used and the results by the AMOS program can be
seen in the following figure:
Figure 2. Coastal area development (x1) validity test
The results of such testing presented in Figure 5.1 shows that the value of the factor loading
in three indicators above is greater or equal to 0.5. Each of these can be explained as follows:
(1) Loading value 0.876 for the capability development program (X1.1) which means statistically
significant in assessing coastal area development (X1) of 0.876, it can be seen by the value of p
= 0.000 which is smaller than = 0.05 on the regression weight;
(2) Loading value 0.916 for income generation program (X1.2) which means statistically significant
in assessing coastal development (X1) of 0.916, it can be seen by the value of p= 0.000 which
is smaller than = 0.05 on the regression weight;
(3) Loading the value 0.882 for the provision of infrastructure (X1.3) which means statistically
significant in assessing coastal area development (X1) of 0.882, it can be seen by the value of p
= 0.000 which is smaller than = 0.05 in regression weight;
Thus there are three (3) indicators that can be used to measure coastal area development
(X1). The three inddicators are capability development program (X1.1), income generation
program (X1.2), and the provision of infrastructure (X1.3);
The environment of fishing communities (Y1)
Fishing communities environment (Y1) is the exogenous latent variable measured by 2 (two)
variables:environmental quality (Y1.1), and environmental services (Y1.2). So to find out if a fishing
community environment (Y1) is a latent variable, confirmatory factor analysis used and the results
with the AMOS program can be seen in the following figure:
Figure 3. Fishing communities environment (y1) validity test
FISHING
COMMUNITIES
ENVIRONMENT (Y1)
ENVIRONMENTAL QUALITY (Y1.1)
0.849
0.866
ENVIRONMENTAL SERVICES(Y1.2)
COASTAL AREA
DEVELOPMENT(X1)
CAPABILITY DEVELOPMENT
PROGRAM (X1.1)
0.876
0.916
0.882
INCOME GENERATION PROGRAM
(X1.2)
PROVISON OF INFRASTUCTURE
(X1.3)
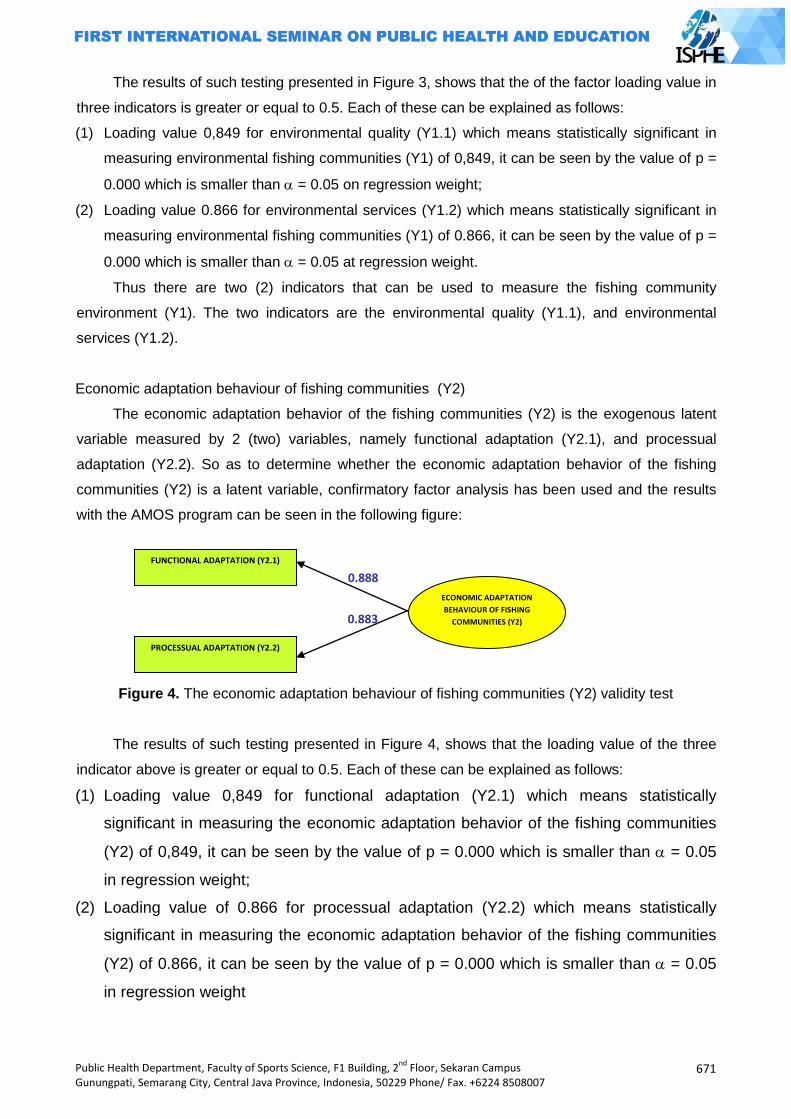
Public Health Department, Faculty of Sports Science, F1 Building, 2nd
Floor, Sekaran Campus Gunungpati, Semarang City, Central Java Province, Indonesia, 50229 Phone/ Fax. +6224 8508007
671
The results of such testing presented in Figure 3, shows that the of the factor loading value in
three indicators is greater or equal to 0.5. Each of these can be explained as follows:
(1) Loading value 0,849 for environmental quality (Y1.1) which means statistically significant in
measuring environmental fishing communities (Y1) of 0,849, it can be seen by the value of p =
0.000 which is smaller than = 0.05 on regression weight;
(2) Loading value 0.866 for environmental services (Y1.2) which means statistically significant in
measuring environmental fishing communities (Y1) of 0.866, it can be seen by the value of p =
0.000 which is smaller than = 0.05 at regression weight.
Thus there are two (2) indicators that can be used to measure the fishing community
environment (Y1). The two indicators are the environmental quality (Y1.1), and environmental
services (Y1.2).
Economic adaptation behaviour of fishing communities (Y2)
The economic adaptation behavior of the fishing communities (Y2) is the exogenous latent
variable measured by 2 (two) variables, namely functional adaptation (Y2.1), and processual
adaptation (Y2.2). So as to determine whether the economic adaptation behavior of the fishing
communities (Y2) is a latent variable, confirmatory factor analysis has been used and the results
with the AMOS program can be seen in the following figure:
Figure 4. The economic adaptation behaviour of fishing communities (Y2) validity test
The results of such testing presented in Figure 4, shows that the loading value of the three
indicator above is greater or equal to 0.5. Each of these can be explained as follows:
(1) Loading value 0,849 for functional adaptation (Y2.1) which means statistically
significant in measuring the economic adaptation behavior of the fishing communities
(Y2) of 0,849, it can be seen by the value of p = 0.000 which is smaller than = 0.05
in regression weight;
(2) Loading value of 0.866 for processual adaptation (Y2.2) which means statistically
significant in measuring the economic adaptation behavior of the fishing communities
(Y2) of 0.866, it can be seen by the value of p = 0.000 which is smaller than = 0.05
in regression weight
ECONOMIC ADAPTATION
BEHAVIOUR OF FISHING
COMMUNITIES (Y2)
FUNCTIONAL ADAPTATION (Y2.1)
0.888
0.883
PROCESSUAL ADAPTATION (Y2.2)

672
Public Health Department, Faculty of Sports Science, F1 Building, 2nd
Floor, Sekaran Campus Gunungpati, Semarang City, Central Java Province, Indonesia, 50229 Phone/ Fax. +6224 8508007
Thus there are two (2) indicators that can be used to measure the the economic adaptation
behavior of the fishing communities (Y2) are a functional adaptation (Y2.1), and processual
adaptation (Y2.2).
Fishing communities welfare (Z)
Fishing communities welfare (Z) is the exogenous latent variable are measured by the 7
(seven) such as the income (Z1), savings (Z2), the electric bill (Z3), ownership of boats and fishing
equipment (Z4), housing (Z5), education (Z6) and health (Z7). So as to know whether the fishing
communities Welfare (Z) is a latent variable, confirmatory factor analysis has been used and the
results by using the AMOS program can be seen in the following figure:
Figure 5. Fishing communities welfare (Y2) validity test
The results of such testing presented in Figure 5 shows that the loading value in seven
indicators above is the greater or equal to 0.5. Each of these can be explained as follows
(1) Loading value 0.787 for income (Z1) which means statistically significant in measuring the
fishing communities welfare (Z) of 0.787, it can be seen by the value of p = 0.000 which is
smaller than = 0.05 in regression weight;
(2) Loading value of 0.582 for savings (Z2) which means statistically significant in measuring the
fishing communities welfare (Z) of 0.582, it can be seen by the value of p = 0.000 which is
smaller than = 0.05 in regression weight;
(3) Loading value of 0.766 for loading electric bill (Z3) which means statistically significant in
measuring the fishing communities welfare (Z) of 0.766, it can be seen by the value of p =
0.000 which is smaller than = 0.05 in regression weight;
(4) Loading value of 0.828 for ownership loading boats and fishing equipment (Z4) which means
statistically significant in measuring the fishing communities welfare (Z) of 0.828, it can be
seen by the value of p = 0.000 which is smaller than = 0.05 on the regression weight
FISHING
COMMUNITIES
WELFARE (Z)
INCOME (Z1)
0.828
0.582
0.766
SAVINGS (Z2)
ELECTRIC BILL (Z3)
OWNERSHIP OF BOATS AND
FISHING EQUIPMENT (Z4)
HOUSING (Z5)
EDUCATION (Z6)
HEALTH (Z7)
0.787
0.794
0.563
0.631
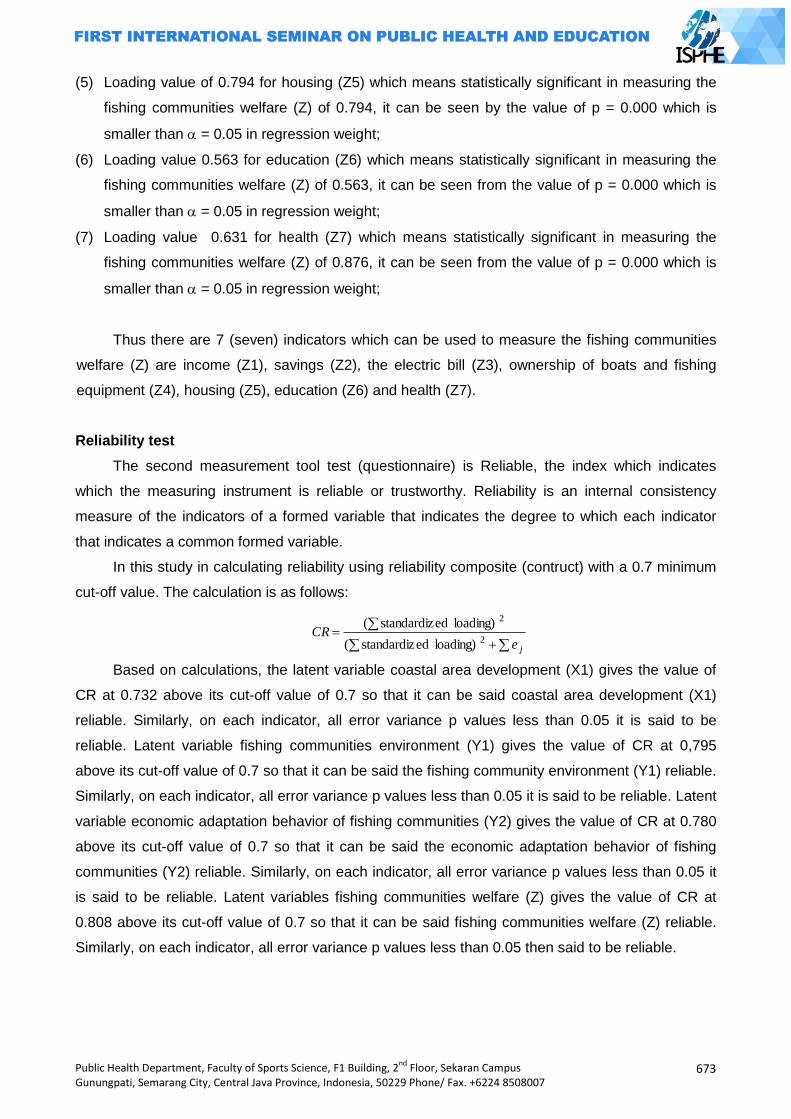
Public Health Department, Faculty of Sports Science, F1 Building, 2nd
Floor, Sekaran Campus Gunungpati, Semarang City, Central Java Province, Indonesia, 50229 Phone/ Fax. +6224 8508007
673
(5) Loading value of 0.794 for housing (Z5) which means statistically significant in measuring the
fishing communities welfare (Z) of 0.794, it can be seen by the value of p = 0.000 which is
smaller than = 0.05 in regression weight;
(6) Loading value 0.563 for education (Z6) which means statistically significant in measuring the
fishing communities welfare (Z) of 0.563, it can be seen from the value of p = 0.000 which is
smaller than = 0.05 in regression weight;
(7) Loading value 0.631 for health (Z7) which means statistically significant in measuring the
fishing communities welfare (Z) of 0.876, it can be seen from the value of p = 0.000 which is
smaller than = 0.05 in regression weight;
Thus there are 7 (seven) indicators which can be used to measure the fishing communities
welfare (Z) are income (Z1), savings (Z2), the electric bill (Z3), ownership of boats and fishing
equipment (Z4), housing (Z5), education (Z6) and health (Z7).
Reliability test
The second measurement tool test (questionnaire) is Reliable, the index which indicates
which the measuring instrument is reliable or trustworthy. Reliability is an internal consistency
measure of the indicators of a formed variable that indicates the degree to which each indicator
that indicates a common formed variable.
In this study in calculating reliability using reliability composite (contruct) with a 0.7 minimum
cut-off value. The calculation is as follows:
jeCR
2
2
loading) edstandardiz(
loading) edstandardiz(
Based on calculations, the latent variable coastal area development (X1) gives the value of
CR at 0.732 above its cut-off value of 0.7 so that it can be said coastal area development (X1)
reliable. Similarly, on each indicator, all error variance p values less than 0.05 it is said to be
reliable. Latent variable fishing communities environment (Y1) gives the value of CR at 0,795
above its cut-off value of 0.7 so that it can be said the fishing community environment (Y1) reliable.
Similarly, on each indicator, all error variance p values less than 0.05 it is said to be reliable. Latent
variable economic adaptation behavior of fishing communities (Y2) gives the value of CR at 0.780
above its cut-off value of 0.7 so that it can be said the economic adaptation behavior of fishing
communities (Y2) reliable. Similarly, on each indicator, all error variance p values less than 0.05 it
is said to be reliable. Latent variables fishing communities welfare (Z) gives the value of CR at
0.808 above its cut-off value of 0.7 so that it can be said fishing communities welfare (Z) reliable.
Similarly, on each indicator, all error variance p values less than 0.05 then said to be reliable.
674
Public Health Department, Faculty of Sports Science, F1 Building, 2nd
Floor, Sekaran Campus Gunungpati, Semarang City, Central Java Province, Indonesia, 50229 Phone/ Fax. +6224 8508007
SEM on Coastal Area Development Against the Welfare of The Fishing Communities
Through Environmental and Economic Adaptation Behavior of The Fishing community
After having validity and reliability tested on each latent variable, several prerequisites that
must be met in structural modeling is the assumption of normal multivariate, assuming the absence
of multicollinearity or singularity and outliers
Normality test
Normality of the data is one of the prerequisite for Structural Equation Modeling (SEM).
Normality testing emphasis on multivariate data by looking at the value of skewness, kurtosis, and
statistically can be seen by the value of Critical Ratio (CR). If you used a significance level of 5
percent, then the value of CR is between -1.96 to 1.96 (-1.96 1.96 CR) said normal distribution
of data, multivariate and univaariat either.
Singularity and multicollinearity test
Singularity can be seen through the determinant of the covariance matrix. Value of the
determinant is very small or close to zero indicates the singularity problem, so it can not be used
for research. The results of the study provide value Determinant of the sample covariance matrix of
0.042. This almost makes approximately value of zero so that it can be said that there is no
singularity problems in the data analyzed. Thus indirectly all latent variables no multicollinearity.
Outlier is an observation that appears to the extreme values by multivariate and uniariate
way, that arise due to the combination of its unique characteristics and looks so outlying from other
observations. If there is a outlier can be done special treatment but we have to know how the
emergence of unknown origin outlier. Outlier test results in this study presented on the
Mahalanobis distance or Mahalanobis d-squared. Mahalanobis value greater than the Chi-square
table or p1 value <0.01 is said that outlier observation. In this study, no data are outliers, it can be
said no outliers occur.
Having the validity and reliability tested of all latent variables, the results are valid and
reliable, the data is multivariate is normal, multicollinearity and outliers do not occur below 5
percent, then the latent variables can be continued in the analysis.
Effect of inter-research variables
In a structural equation with many variables and paths between variables there are effect
among the variables which include the direct effect, indirect effect and total effect. For it will be
discussed in detail each of the above-mentioned effect.
(1) Direct Impact Between Research Variables
A direct relationship between the latent exogenous variables (coastal area development (X))
with the endogenous latent variables mediating/intervening (fishing communities environmental
(Y1), economic adaptation behavior of fishing communities (Y2)) and endogenous latent variables
(fishing communities welfare (Z )). The following table presents the direct result of the direct
relationships that occur between the exogenous and endogenous latent variables:
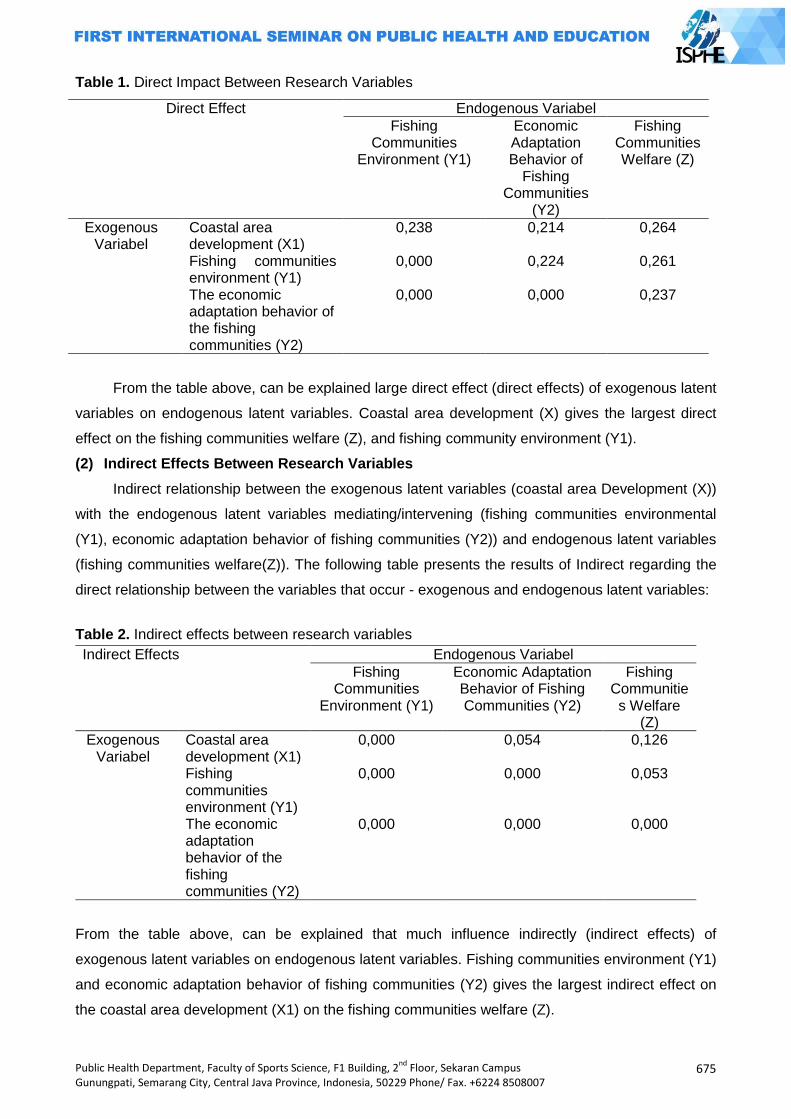
Public Health Department, Faculty of Sports Science, F1 Building, 2nd
Floor, Sekaran Campus Gunungpati, Semarang City, Central Java Province, Indonesia, 50229 Phone/ Fax. +6224 8508007
675
Table 1. Direct Impact Between Research Variables
Direct Effect Endogenous Variabel
Fishing Communities
Environment (Y1)
Economic Adaptation Behavior of
Fishing Communities
(Y2)
Fishing Communities Welfare (Z)
Exogenous Variabel
Coastal area development (X1)
0,238 0,214 0,264
Fishing communities environment (Y1)
0,000 0,224 0,261
The economic adaptation behavior of the fishing communities (Y2)
0,000 0,000 0,237
From the table above, can be explained large direct effect (direct effects) of exogenous latent
variables on endogenous latent variables. Coastal area development (X) gives the largest direct
effect on the fishing communities welfare (Z), and fishing community environment (Y1).
(2) Indirect Effects Between Research Variables
Indirect relationship between the exogenous latent variables (coastal area Development (X))
with the endogenous latent variables mediating/intervening (fishing communities environmental
(Y1), economic adaptation behavior of fishing communities (Y2)) and endogenous latent variables
(fishing communities welfare(Z)). The following table presents the results of Indirect regarding the
direct relationship between the variables that occur - exogenous and endogenous latent variables:
Table 2. Indirect effects between research variables
Indirect Effects Endogenous Variabel
Fishing Communities
Environment (Y1)
Economic Adaptation Behavior of Fishing Communities (Y2)
Fishing Communities Welfare
(Z)
Exogenous Variabel
Coastal area development (X1)
0,000 0,054 0,126
Fishing communities environment (Y1)
0,000 0,000 0,053
The economic adaptation behavior of the fishing communities (Y2)
0,000 0,000
0,000
From the table above, can be explained that much influence indirectly (indirect effects) of
exogenous latent variables on endogenous latent variables. Fishing communities environment (Y1)
and economic adaptation behavior of fishing communities (Y2) gives the largest indirect effect on
the coastal area development (X1) on the fishing communities welfare (Z).
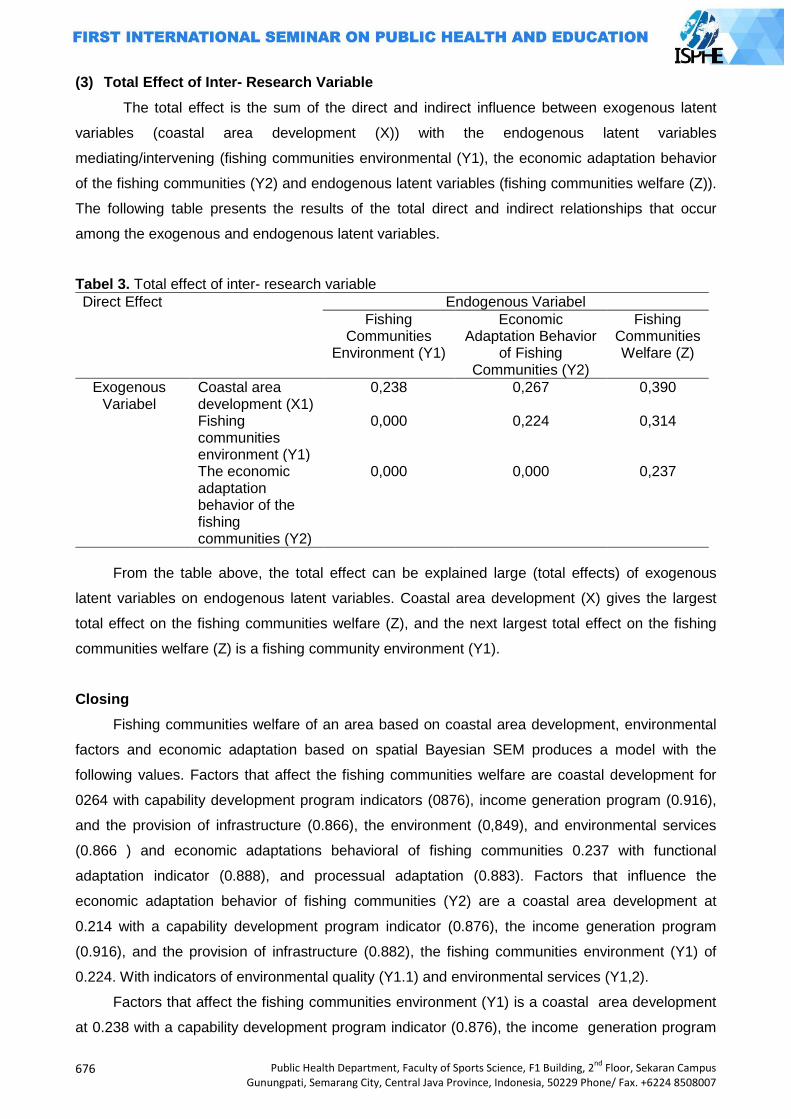
676
Public Health Department, Faculty of Sports Science, F1 Building, 2nd
Floor, Sekaran Campus Gunungpati, Semarang City, Central Java Province, Indonesia, 50229 Phone/ Fax. +6224 8508007
(3) Total Effect of Inter- Research Variable
The total effect is the sum of the direct and indirect influence between exogenous latent
variables (coastal area development (X)) with the endogenous latent variables
mediating/intervening (fishing communities environmental (Y1), the economic adaptation behavior
of the fishing communities (Y2) and endogenous latent variables (fishing communities welfare (Z)).
The following table presents the results of the total direct and indirect relationships that occur
among the exogenous and endogenous latent variables.
Tabel 3. Total effect of inter- research variable
Direct Effect Endogenous Variabel
Fishing Communities
Environment (Y1)
Economic Adaptation Behavior
of Fishing Communities (Y2)
Fishing Communities Welfare (Z)
Exogenous Variabel
Coastal area development (X1)
0,238 0,267 0,390
Fishing communities environment (Y1)
0,000 0,224 0,314
The economic adaptation behavior of the fishing communities (Y2)
0,000 0,000 0,237
From the table above, the total effect can be explained large (total effects) of exogenous
latent variables on endogenous latent variables. Coastal area development (X) gives the largest
total effect on the fishing communities welfare (Z), and the next largest total effect on the fishing
communities welfare (Z) is a fishing community environment (Y1).
Closing
Fishing communities welfare of an area based on coastal area development, environmental
factors and economic adaptation based on spatial Bayesian SEM produces a model with the
following values. Factors that affect the fishing communities welfare are coastal development for
0264 with capability development program indicators (0876), income generation program (0.916),
and the provision of infrastructure (0.866), the environment (0,849), and environmental services
(0.866 ) and economic adaptations behavioral of fishing communities 0.237 with functional
adaptation indicator (0.888), and processual adaptation (0.883). Factors that influence the
economic adaptation behavior of fishing communities (Y2) are a coastal area development at
0.214 with a capability development program indicator (0.876), the income generation program
(0.916), and the provision of infrastructure (0.882), the fishing communities environment (Y1) of
0.224. With indicators of environmental quality (Y1.1) and environmental services (Y1,2).
Factors that affect the fishing communities environment (Y1) is a coastal area development
at 0.238 with a capability development program indicator (0.876), the income generation program
Public Health Department, Faculty of Sports Science, F1 Building, 2nd
Floor, Sekaran Campus Gunungpati, Semarang City, Central Java Province, Indonesia, 50229 Phone/ Fax. +6224 8508007
677
(0.916), and the provision of infrastructure (0.882). Fishing communities environment (Y1) and
economic adaptation behavior of fishing communities (Y2) gives the largest indirect effect on
coastal area development (X) on the fishing communities welfare (Z) is equal to 0.126. Dominant
factor mempegaruhi welfare of fishermen (Z) is pemmbangunan coastal area (X) equal to 0.390
and the environment of coastal communities (Y1) of 0.314. Indicators of the welfare of fishermen
(Z) is the ownership of boats and fishing equipment (Z4) 0.828; housing (Z5) 0.794; pendapaatan
(Z1) 0.787, electric bill (Z3) 0.766, health (Z7) 0.631; savings (Z2) 0.582, and education (Z6) 0.563.
Dominant factor that effect fishing communities welfare (Z) is coastal area development (X) equal
to 0.390 and the coastal communities environment (Y1) of 0.314. Fishing communities welfare
indicators (Z) is the ownership of boats and fishing equipment (Z4) 0.828; housing (Z5) 0.794;
income (Z1) 0.787, electric bill (Z3) 0.766, health (Z7) 0.631; savings (Z2) 0.582, and education
(Z6) 0.563.
It is expected that the government of Gorontalo Utara district can consider that the dominant
factors affecting the fishing communities welfare.
References
Alisjahbana, A.S. 2010. Percepatan pembangunan ekonomi yang inklusif dan berkeadilan. Makalah Menteri Perencanaan Pembangunan Nasional/Kepala Bappenas. Paper was presented at Ikatan Sarjana Ekonomi (ISEI) Plenum Bandung, 20-22 Juli 2010.
Badan Pusat Statistik.1999, Panduan Pelatihan Tindak Lanjut Pengolahan dan Analisis Data Susenas. Jakarta: BPS dan UNFPA
Bappenas. 2010. Strategi pembangunan nasional untuk mengurangi kesenjangan antarwilayah: sinergi antara pusat dan daerah dan antardaerah (RPJMN 2010-2014). http://www.bappenas.go.id/ node/116/2698 accessed on 10 Agustus 2013
BPS, 1999, Penyempurnaan Metodologi Penghitungan Penduduk Miskin dan Profil Kemiskinan 1999, Jakarta: Badan Pusat Statistik,.
Badan Pusat Statistik. 2007. Pedoman Survei Sosial Ekonomi Nasional 2007, Jakarta: Badan Pusat Statistik.
Badan Pusat Statistik. 2008. Survei Sosial Ekonomi Nasional (SUSENAS) Tahun 2008, Jakarta:: BPS
Badan Pusat Statistik, World Bank Institute. 2002. Dasar-dasar Analisis Kemiskinan, Jakarta Direktorat Jenderal Perikanan Tangkap. 2010. Pemberdayan nelayan dalam upaya mengurangi
kemiskinan di Kalangan Nelayan Indonesia, www.google.co.id. Accessed on September, 28, 2010.
Een, Otok. 2009. Pendekatan CART ARCING Untuk Klasifikasi Kesejahteraan Rumah Tangga di Provinsi Jawa Tengah, Thesis. Surabaya: Institut Teknologi Sepuluh November Postgraduate.
Faturokhman, Molo, Marcelinus. 1995. Kemiskinan dan Kependudukan di Pedesaan Jawa: Analisis data Susenas 1992. Yogyakarta; Pusat Penelitian Kependudukan Universitas Gadjah Mada.
Gonner, C., Cahyat, A., Haug, M. 2007. Mengkaji Kemiskinan dan Kesejahteraan Rumah Tangga: Sebuah Panduan dengan Contoh dari Kutai Barat, Indonesia. Bogor: CIFOR,. 121p.
Gunawan A, et.al. 2001. Studi Penggunaan Pemulusan Spline pada Regresi Nonparametrik. Thesis. Jakarta: Universitas Indonesia Postgraduate.
Hair J.F., et.al. 2006. Multivariate Data Analysis. Sixth Edition, Pearson Education Prentice Hall, Inc.
Masfufah. 2000. Determinan dan Kebijakan Pengentasan Kemiskinan di Propinsi Bengkulu (Analisis Rumah Tangga Berdasar Data Susenas 1999). Thesis. Jakarta: Sekolah Tinggi Ilmu Statistik.

678
Public Health Department, Faculty of Sports Science, F1 Building, 2nd
Floor, Sekaran Campus Gunungpati, Semarang City, Central Java Province, Indonesia, 50229 Phone/ Fax. +6224 8508007
Otok, B.W., et.al.. 2012. Pengembangan Indikator dan Penentuan Rumahtangga Miskin di Jawa Timur Menggunakan Spatial SEM dan Machine Learning. Unseeded Research. BOPTN, Lemlit, ITS.
Rahmawati, D.I. 1999. Analisis Kesempatan Kerja Penduduk Miskin di Provinsi DKI Jakarta”. Thesis. Jakarta: Sekolah Tinggi Ilmu Statistik.
Rusastra, IW., Togar AN .2007. Karakteristik Wilayah dan Keluarga Miskin di Perdesaan: Basis Perumusan dan Intervensi Kebijakan. Bogor : Pusat Analisis Sosial Ekonomi Pertanian.
Santoso, B., Otok. 2009. Pemodelan Lama Sekolah Pada Penduduk Usia Sekolah Di Provinsi Papua dengan Pendekatan Spline Multivariabel dan MARS. Thesis. Surabaya: Institut Teknologi Sepuluh November Postgaduate.
Suryadarma, D et.al. 2005. Ukuran Obyektif Kesejahteraan Keluarga untuk Penargetan Kemiskinan: Hasil Uji Coba Sistem Pemantauan Kesejahteraan oleh Masyarakat di Indonesia. Jakarta: SMERU.
Wahyuningrum, S. 2008. Pendekatan MARS untuk Ketepatan Klasifikasi Desa/Kelurahan Miskin di Kalimantan Timur Tahun. Thesis. Surabaya: Institut Teknologi Sepuluh November Postgraduate.
Public Health Department, Faculty of Sports Science, F1 Building, 2nd
Floor, Sekaran Campus Gunungpati, Semarang City, Central Java Province, Indonesia, 50229 Phone/ Fax. +6224 8508007
679
TOHEREN LIGHTING STANDARD AND FACTORS AFFECTING FATIGUE EYE FOR THE CRAFTSMEN KARAWO IN DISTRICT GORONTALO
Reni Hiola
Gorontalo State University
Corresponding Author: [email protected]
Abstract Introduction: Lighting conditions in the work environment karawo craftsmen in Gorontalo regency extremely unhelpful to achieve optimal productivity, so most of the craftsmen karawo eyestrain. Toheren standard lighting is used in the production room to help artisans karawo karawo while working in order to avoid eye fatigue. Methods: This study aims to find the factors that influence the amount of lighting standards and standards based Toheren Flicker fusion measurements, visual acuity and Subjective Complaints for karawo craftsmen in Gorontalo regency. Observations observational probability sampling against 71 people craftsmen karawo in Gorontalo regency. Result obtained by stratified random sampling, divided into predictor variables consisted of craftsmen karawo characteristics, work space, lighting and materials or work materials. The response variable eyestrain by Flicker fusion measurements, visual acuity and Subjective Complaints. Descriptive data analysis, modeling analysis used iferensial Adaptive Regression Spline. Results: The results showed before working craftsmen karawo not experienced eye fatigue, but after working all craftsmen decreased visual acuity and the eyes become tired. Conclusion: The use of lighting intensity above 270 lux at work craftsmen karawo not cause eye becomes tired that productivity increased. Key Words: Lighting standards, toheren, eye fatigue and craftsmen karawo. Introduction
Small industry and handicrafts that are being developed in the province of Gorontalo is
karawo craft industry which is usually done by women. Karawo embroidery industry in Gorontalo
can be aligned with another craft that developed in Indonesia, so it can be a source of pride and
cultural richness of Indonesia. In addition to cultural values, karawo also has considerable potential
economic value, therefore it is necessary to empowerment through the promotion and
development of small industries.
Karawo is a traditional embroidery. It‟s a craft that has been passed down from the 17th
century around the year 1713. Karawo embroidery comes from the word Mokarawo that meant
slicing or hollow. This naming according to the manufacturing technique of karawo embroidery
where where yarns fiber embroidered on the fabric as a medium will be sliced or perforated yarn
fiber by pulling on the fabric medium to be used.
By looking at data from the Industry and Cooperatives of Gorontalo District in 2010 karawo
craftsmen has reached 67 businesses who formed the group of centers aim to facilitate the
development of karawo handicraft industry. Based on the above there are basically two main
aspects for business development in order to increase the production of the worker and the work
environment. The working environment should be handled in such a way that it becomes
conducive for workers to carry out activities in a safe and comfortable atmosphere.
680
Public Health Department, Faculty of Sports Science, F1 Building, 2nd
Floor, Sekaran Campus Gunungpati, Semarang City, Central Java Province, Indonesia, 50229 Phone/ Fax. +6224 8508007
Adequate lighting and well organized will help create a work environment that is comfortable
and enjoyable so that the work can maintain the excitement of working. Less lighting impacts are:
(1)eye fatigue, so that reduced power and efficiency;(2)soreness Complaints in the eyes and pain
around the eyes;(3)Damage of eye senses.
Observations indicate the amount of light intensity in karawo craftsmen working environment
is less than 200 lux and 400 lux highest Hiola (2000) found the workspace illumination intensity of
karawo craftsmen in Gorontalo city by 96.80%. This figure is below the standard of the Minister
Labour Regulation No. 7 of 1964 as well as a significant correlation between the intensity of
illumination and eye fatigue.
Lighting is one of the important factors in space designing (Adi, 2006). The 49.8 lux
illumination intensity using was and the highest was 223.3 lux using at the administration of PT
Indonesia Power UBP Semarang causes 86.4% of workers feel the results in eye fatigue
(Febriana, 2012). Symptoms of Computer Vision Syndrome (headache, dizziness, blurred vision,
neck pain, red eye, double vision, difficulty focusing the eyes, even fatigue) felt by workers in the
layout editor of CV "X" Tembalang Semarang caused by using light intensity of 50 lux and cause
glare when using the intensity of 2853 lux illumination (Hikmatyar, 2012). Eye fatigue due to the
use of inadequate illumination intensity is also found in the workplace of karawo craftsmen in
Gorontalo district.
The term Toheren is a combination of tohe (torch), karawo and Reni (name of researcher) as
a lighting term used in indoor of karawo production. This is an effort to determine the ideal lighting
standards in karawo production place in the district of Gorontalo based on measurement of flicker
fusion, visual acuity and subjective complaints. This Toheren standards determined by measuring
the surface area, the volume of work space, room temperature, lighting intensity, work objects,
visibility, contrast and direction of light. Ways to meet the needs described above it is necessary to
establish a Toheren lighting ideal standard in order to improve the quality of work and maintain
craftsmen eye health. By the problems above, it is necessary to examine what factors influence the
illumination of the eye fatigue and how to standardize the Toheren size for karawo craftsman. The
hypothesis of this study can be formulated as follows: "There is a standard amount of Toheren
illumination and factors affecting the eye fatigue by measuring flicker fusion, visual acuity and
subjective complaints for karawo craftsmen in Gorontalo District".
Methods
Research design
This research is observational, ie to assess Toheren Standards for craftsmen karawo in
Gorontalo district. The design of this study conducted a cross-sectional, which is conducted
through four phases: (1) Observation and study of reference regarding karawo craftsman industrial
lighting systems; (2) Research on the respondent. At this stage the results of the observation and
study of reference in the first stage used as the draft of the interview guide to determine the
Public Health Department, Faculty of Sports Science, F1 Building, 2nd
Floor, Sekaran Campus Gunungpati, Semarang City, Central Java Province, Indonesia, 50229 Phone/ Fax. +6224 8508007
681
Toheren factor variable for the karawo craftsmen in Gorontalo district; (3) Assessment of
respondents eyestrain accuracy rate using flicker fussion gauges, Snellen card, and
questionnaires; (4) Determine the Toheren lighting standards for karawo craftsmen in Gorontalo
district.
Data collection methods and data sources
Based on the results of the initial observation, the number of karawo craftsmen in Gorontalo
district totaled 503 people, then adjusted the criteria for the population to be studied, the population
of which was taken by 239 people. To determine the sample size that is deemed eligible using
Taro Yamane calculation formula:
2
Nn
N (d) 1
n = sample size
N = population size
d = Precision
I = sub-units strata
With a precision of 0.1 and a population (N) = 239, then the use of the above formula is:
Based on the above formula the sample size can be considered representative of the population
using an accuracy error of 0.10 degrees is 71 people. Sample size obtained in this study are at
least 71 karawo craftsmen.
Determination of the number of research samples using a sampling technique in probability
sampling technique is the stratified random sampling. Stratified random sampling is a sampling
technique that is based on a group of subjects and between one group with the other groups
appear to be any strata or levels. Reasons for using stratified random sampling is due to have a
not homogeneous member or element of the population. Sampling from each district: (1)District of
Telaga Biru = 100/239 x 71 = 29.70 = 30 people; (2)District of Limboto = 120/239 x 71 = 35.64 =
36 people; (3)District of Tibawa = 19/239 x 71 = 5.64 = 5 people.
Result and Discussion
Description of research variables
Research variables consist of predictor variables such as characteristic of a craftsman,
materials or work materials, lighting and work space, and the response variable that is eyestrain.
Factors affecting toheren lighting sstandards and measurement standards based flicker
fusion measurement, visus, and subjective complaints
The mapping process conducted to analyze the factors that affect the Toheren lighting
standards based parameters flicker fusion, visual acuity and subjective complaints. The results of
the mapping shows that the age factor and the intensity of illumination is a factor that affects the
eye fatigue in all three measurements, namely Flicker fusion, Visus, and Subjective Complaints.
682
Public Health Department, Faculty of Sports Science, F1 Building, 2nd
Floor, Sekaran Campus Gunungpati, Semarang City, Central Java Province, Indonesia, 50229 Phone/ Fax. +6224 8508007
Factors affecting the eye fatigue on the two measurement are work period, working time,
temperature and karawo motif.
Characteristics of respondents by age, work period, working time, visus before work, flicker
fusion before work, visibility, education level and use of glasses.
The results of a descriptive analysis of the 71 female artisans of karawo craft small industries
shows that the average age is 30 years old craftsman with a lifespan of 20-39 years. Average
karawo craftsmen working for 2 hours. The working hours are generally adjusted by the number of
orders karawo of consumers, if the number of orders increases, the craftsmen working time will
also increase and vice versa. Karawo craftsmen have visual acuity values before working an
average of 5/9 with 90% efficiency vision included in the category of near-normal vision. The
smallest value of 6/24 visual acuity with visual efficiency of 60%, does not cause serious vision
problems and the highest visual acuity 6/6 vision with 100% efficiency or also called normal vision.
Measurement of flicker fusion before working on karawo craftsmen obtained the smallest value of
0.61 Hz and 1.11 Hz largest with an average of 0.81 Hz. Based on the results of flicker fusion
measurements before working known karawo craftsmen not experience eyestrain.
Karawo craftsmen‟s eye distance to the object work while working is 15 cm to 35 cm with an
average of 26 cm. If the eye has a not equal to 25 cm near point and a not the same far point, it is
said to be infinite eye disorders (Grandjean, 1997; Hani, 2010). The distance between the eyes
with the object of work is also influenced by the size of the motif and karawo craftsmen‟s individual
vision conditions. Karawo craftsmen‟s educational level consists of 16.90% elementary school,
junior high 33.80%, 46.50% high school and 2.80% S1. Karawo craftsmen who use glasses while
working as much as 22% and that does not use glasses as much as 49%.
Characteristics of respondents according to eye fatigue measurement results using flicker
fusion measurement, visus and subjective complaints before and after work.
Flicker fusion measurements before and after the work showed a decrease of 0,216 Hz, the
test results statistically showed significance level of 0.000 which means karawo craftsman
experienced eyestrain after work as 88.73% with flicker fusion measured values below 0.6 Hz (tired
) and as much as 11.27% above 0.6 Hz (not tired). Fatigue is supported by the lighting used does
not match with the physical conditions and the working environment. Using high lighting have a
positive effect on the value of the critical flicker frequency (Hsin-Chen, 2012).
By Snellen ototype category measurement, visual acuity measurement results after working
was found as much as 87.33% artisan in almost normal vision category with visual efficiency of
about 83%; 11.27% of low vision category, eyesight efficiency was 60%; and 1.41% very low vision
category. The results of these measurements indicate that the value of decreased visual acuity
after working an average of 0.215 and statistical test results showed karawo craftsmen decreased
visual acuity after working with a significant level of 0.000.
Before working, all of karawo craftsmen not cause visible symptoms felt due to fatigue, but
after the work is found all over (100%) the average karawo craftsman feel headache, irritation of
Public Health Department, Faculty of Sports Science, F1 Building, 2nd
Floor, Sekaran Campus Gunungpati, Semarang City, Central Java Province, Indonesia, 50229 Phone/ Fax. +6224 8508007
683
the eyes, double vision and pain around the eyes. After working as much as 26% of craftsmen who
work less than 2 weeks experienced acute fatigue and 45% of workers who work more than 2
weeks of chronic eyestrain. Contact between the eyes with a small object and the work that is
continuously refined lead to karawo craftsmen‟s eye pain. These complaints will increase if the
lighting in the karawo craftsmen‟s work environment is inadequate. Subjective complaints above
have the same symptoms as the result of a study of karawo craftsmen (Reni, 2000), elementary
and secondary teachers in Hong Kong (Elaine, 2010) and call center workers in the Bank (Chih-
Yong, Yen-Hui, Wei-Hsien, and Yu-Chao, 2010).
Factors affecting toheren lightning standards and measurement standards based flicker
fusion.
ARS models indicate that the flicker fusion rate after work is influenced by the age which
above 26 years karawo craftsmen; work period over 17 years and using the light intensity above
270 lux, no glare; work time is less than 2 hours at a temperature of less than 300C workspace.
The results obtained from modeling is the amount of flicker fusion rate after work.
The results of the model Adaptive Regression Spline (ARS) shows that the best age karawo
craftsmen based flicker fusion measurements over 26 years. Work experience is an important
factor to skills in working karawo. Best work period based on the flicker fusion measurement of
Adaptive Regression models Spiline (ARS) is above 17 years, but must be coupled with the use
intensity of 270 lux illumination at the top so that the after working flicker fusion rate increases and
karawo craftsmen not experience eyestrain.
Each craftsman karawo which has a work period less than 17 years and worked more than 2
hours in glare working condition will reduce flicker fusion rate after work or karawo craftsmen will
feel the eye fatigue after work. Therefore, the ideal conditions of karawo craftsmen working time
based flicker fusion is less than 2 hours. The existence of a static posture causes muscle fatigue
on fingers when working beside the eye muscles because must always be seen the relatively small
workpiece and depends on the karawo motive to be embroidered, this workload will be even worse
when karawo craftsmen work more than 2 hours.
The intensity of illumination is very influential on all the factors that cause karawo craftsman
eyestrain. In addition, eye fatigue will easily occur with karawo craftsmen age. ARS Model showed
an increase in the value of the flicker fusion to work period in over 17 years when using the light
intensity above 270 lux. The high level of illumination will cause glare and t visual comfort affec,
and can have a negative impact not only in physiology, but also on the side of human psychology.
Deficiency or excess of light would make human eyes become tired quickly (Manurutng, 2012).
Best workspace temperature estimated by flicker fusion measurements on the model of
Adaptive Regression Spline (ARS), indicate when craftsmen who have work period over 17 years,
working with the room temperature below 300C and not having the glare then flicker fusion rate
after work will increase by 0.034 Hz. In addition, if the age of karawo craftsmen over 26 years and
684
Public Health Department, Faculty of Sports Science, F1 Building, 2nd
Floor, Sekaran Campus Gunungpati, Semarang City, Central Java Province, Indonesia, 50229 Phone/ Fax. +6224 8508007
works at room temperature under 310C can increase the flicker fusion rate after working at 0,010
Hz.
Based on the Adaptive Regression Spline (ARS) analysis model, workspace temperature
factor used karawo craftsmen, apparently interacting with the age and working period. Excessive
heat stress is an additional burden that must be considered and taken into account (Annasyiatul,
Kurniawati, Sonya, and Sri, 2008). Therefore, ideal conditions at room temperature is based on the
measurement of flicker fusion temperatures is below 300C.
Factors affecting toheren lghtning standards and measurement standards based visus.
ARS models indicate that the value of after working visus affected by karawo craftsmen age
under 29 years; working period under 13 years; working time over 1 hour; 6/24 visual acuity before
work; light intensity above 350 lux, the color pink karawo; and 2, 3, or 4 thread colors karawo
motives. The results of the model are expected obtained to maintain the 6/24 before work visus
values at the time after work to karawo artisans not experience eyestrain. ARS model is based on
the measurement of visus showed best age karawo craftsmen below 29 years. The results of
measurements of visus after working an average of 6/24 on karawo craftsmen under the age of 29
years.
Best approximation estimates obtained of the ARS model showed visus impaired when
karawo craftsmen have work period over 13 years. ARS model shows karawo craftsmen who have
6/24 value of visus before work will not cause a decrease in visus after work means karawo
craftsmen not experience eye fatigue after work. 6/24 visus included in the category of low vision
vison with was 60% efficiency vision and does not cause serious problems in vision.
ARS model is based on the measurement of visus showed that using lighting intensity above
350 lux will not cause eyestrain to karawo craftsmen. Distance between the eyes to objects of work
and light intervention from around the object resulting light is not focused on the object to be seen.
The quantity and quality of good lighting is determined from the level of reflection of light and
lighting in the room rate ratio (Chairul, 2006).
Based on the best approach estimates based ARS modeling found that the value of visus will
increase when karawo craftsmen working over 1 hour using pink color will improve the value of
visus, but visual acuity will decline when the karawo craftsman work using thread more than 2, 3 or
4 color combinations.
According to LIN, Wen-Yang, Chin-Jung, and Feng-Yi, (2008) using four bright colors (red,
blue, green and white) on lighting 20 lux and 340 lux, affect the level of eyestrain which subjects
chose to tasks under the blue and white lights than green and red. Color perception caused by a
complex interaction between the light source, the object of vision and the brain. When the color
follow the changes of light then the perception of color and eye mechanism to adapt to a new point
object will make the colors look similar to the light. Colors created by the light is a form of energy
that can affect the mind (mood) and emotion (Mahnke, H., and Frank, 1947).
Public Health Department, Faculty of Sports Science, F1 Building, 2nd
Floor, Sekaran Campus Gunungpati, Semarang City, Central Java Province, Indonesia, 50229 Phone/ Fax. +6224 8508007
685
Factors affecting toheren lightning standards and measurement standards based on
subjective complaints
ARS Model showed that after work subjective complaints is influenced by karawo craftsmen
age which more than 20 years or over 34 years; the education level of primary and secondary;
volume of the room is less than 101.7 m3; the size of the field of work less than 0.4 m2; light
intensity above 270 lux; room temperature under 32,40C; visibility more than 15 cm with 2 colors of
yarn karawo motif.
The results of subjective complaints measurements showed that age above 20 years of
craftsmen who work using the working field sizes below 0.4 m2 will increase the value of subjective
complaints but does not cause the eyes become tired after karawo craftsmen work, in which the
power of eye accommodation at the age of 20 years generally has not experienced a decline in the
ability and physiology of eye tissue degeneration has not yet occurred. While the age of craftsmen
karawo over 34 years which working have to use the intensity of 270 lux illumination so that it can
lower the value of subjective complaints that the eyes are not tired after karawo craftsmen work.
Elaine (2010) found the percentage of teacher eye fatigue at the age of 21-30 years, while only
21.1% aged over 31 years was 78.9%.
Based on the classification of the type of work and minimal lighting contained in the Decree
of the Minister of Health No. 1405 of 2002 on Industry and Office Occupational Health
Environmental Requirements, karawo embroidery included in the category of "Routine Work" with
a minimum illumination "300 Lux". While the lighting needs based on activity area according to the
United Nations Environtment (UNEP), karawo embroider included in the category of " interior
general lighting" with lighting needs "200 Lux to 1500 Lux". Seeing both of these standards can be
found illumination intensity in the karawo craftsmen workplace which do not meet the minimum
requirement of 300 lux was 90.1%, while qualified above 300 lux is only 9.9%. In fact,
approximately 43.66% illumination intensity used under 100 lux illumination was a standard for
manual labor or simple visual and not used continuously. Lighting source karawo craftsmen used
at work, namely aid of sunlight, depending on the seating position and the karawo craftsmen work
space used at work. As a result, the intensity of illumination is used unevenly. The minimum
amount of lighting intensity in the karawo workplace by 30 lux and 400 lux maximum with an
average of 149.01 lux.
Illumination intensity that appropriate the standard very influential for sustainability of karawo
craftsmen production processes at work. Effect of light intensity that below or above for karawo
craftsmen complaints can lead to eye fatigue caused by excessive contraction of the eye muscles.
ARS model based on the measurement of subjective complaints was found that by increasing 270
lux intensity of illumination has been able to provide good lighting at karawo craftsmen at work so it
does not cause eye fatigue for karawo craftsman. I Gede‟s research (2012) found a significant
increase in labor productivity amounted to 12.85% when using 282.69 lux intensity of illumination.
686
Public Health Department, Faculty of Sports Science, F1 Building, 2nd
Floor, Sekaran Campus Gunungpati, Semarang City, Central Java Province, Indonesia, 50229 Phone/ Fax. +6224 8508007
ARS model results based on measurements of subjective complaints showed temperatures
below 31,400C using light intensity above 270 lux will increase the value of subjective complaints
but does not cause eye fatigue to karawo craftsmen. According to Ilyas and Sidarta (2006) a
person difficult to see at close range when he was 40 years old, in this age, accommodation range
at the closest point is 25 cm and if using the maximum accommodation would cause the eyes tired.
The distance the eye that too near (30 cm to 50 cm) with a working object can cause visual
discomfort so that the eye muscles become tired because work continuously and be forced to see
objects in the distance is too close (Hsin-Chieh, 2012). Therefore, based on the best models
obtained ARS karawo craftsmen using eye distance of 15 cm to a 2 colors of yarn karawo motif
work object and use intensity above 270 lux illumination will improve the value of subjective
complaints and karawo craftsmen‟s eyes will not be tired.
Factors affecting toheren lightning standards and measurement standards based flicker
fusion, visus, and subjective complaints.
Based on the results description above may be specified factors that can affect the Toheren
lighting standards consists of age craftsmen, working period, working time, intensity of illumination,
the level of glare, room temperature, visual acuity before work, karawo colors, karawo motifs, and
karawo craftsmen eye visibility to work object.
Toheren lighting standard based flicker fusion measurements, visus and subjective
complaints is the use of light intensity above 270 lux. Lighting is a necessity of life that is very
important for humans. Visus at the age of 60 years need two to three times of light intensity from
the age of 20 years whereas the age of 86 years requires five times the level of illumination. Older
age generally require better contrast and greater lighting quality to get the same visual quality as
experienced people at a younger age.
Any continuous illumination intensity increase with indefinitely will always be followed by a
karawo craftsmen eyestrain decrease, but the intensity of illumination that too high is not too good
because it will cause glare so karawo craftsmen will try to see by pupil constricting which will result
in stress on the muscle accommodation.
Using 600 and 500 lux light intensity provide maximum satisfaction while working in front of a
computer screen and 400, 500 and 300 lux on document examination room (Kiattisak, Promrak,
and Kulworawanichpong, 2011). This study shows by raising the intensity of illumination can make
workers, still within the normal capacity and the risk of eye fatigue can be avoided.
Eye fatigue experienced by karawo craftsmen expected to be reduced and prevented, as
well as factors affecting fatigue must be repaired in accordance with the findings discussed above.
Ideal conditions that have been found above is expected to be implemented by all karawo
craftsmen which in Gorontalo province. The main hope the contribution of local governments to
implement and disseminate benefit ratio and ideal conditions are used at work. Law of the Republic
of Indonesia Number 36 Year 2009 on health, occupational health organized so that each worker
can work in a healthy manner without endangering himself and the people around him, in order to
Public Health Department, Faculty of Sports Science, F1 Building, 2nd
Floor, Sekaran Campus Gunungpati, Semarang City, Central Java Province, Indonesia, 50229 Phone/ Fax. +6224 8508007
687
obtain optimum work productivity, in line with the labor protection program. Occupational health
includes occupational health services, occupational disease prevention, and occupational health
requirements. Every workplace shall hold an occupational health.
If the rate of incidence of eyestrain karawo craftsman not prevented, the tired eye condition
perceived by karawo craftsman will be fatal and the risk of blindness is higher. While the benefits
are produced when applying the above ideal conditions, the health status of the karawo craftsmen
will increase and result in increase of good karawo craft productivity.
In effect the working conditions should be created with the best possible way to control all the
factors and work environment that may affect the work and efficiency of human or machine (Evi,
2009).
Closing
Based on the results of research and discussion, the Toheren standard found as follows: (1)
The age average of karawo craftsmen in Gorontalo district is 30 years old, has a work period of 13
years, the working time of 2 hours, the working distance of the eye to the object 26 cm, the majority
education level of middle and high school and by large do not use glasses; (2) All the karawo
craftsmen eyestrain at the time before and after work so that visus impaired while flicker fusion
values decreased after craftsmen do the work; (3) Factors affecting the toheren lighting standard
based on the measurement of flicker fusion were age, work period, working, intensity of
illumination, glare, and the temperature of the working space; (4) Factors affecting the toheren
lighting standard based on the measurement of visus were age, work period, intensity of
illumination, the use of fabric colors, and karawo motifs; (5) Factors affecting toheren lighting
standards based on the measurement of subjective complaints were age, education level, the
volume of the room, the size of the field work, the intensity of illumination, ambient temperature,
distance of the eye to areas of work, and karawo motive; (6) Toheren illumination standard based
flicker fusion measurements, visus and subjective complaints were using above 270-300 lux light
intensity in order to increase the productivity of karawo craftsmen.
New Findings in this study is a Toheren lighting standard for karawo craftsmen in Gorontalo
district which has aged 20 years and above, and the intensity of 270 lux illumination above tend to
reduce eye fatigue after work; (1) Toheren standard lighting is expected to serve as a guide for
entrepreneurs and karawo craftsmen in Gorontalo province; (2) Karawo craftsman expected to
conduct eye health examination at an ophthalmologist periodically; (3) Toheren lighting model
expected support from the government in order to improve the results of productivity, welfare, and
health for entrepreneurs and karawo craftsmen.
688
Public Health Department, Faculty of Sports Science, F1 Building, 2nd
Floor, Sekaran Campus Gunungpati, Semarang City, Central Java Province, Indonesia, 50229 Phone/ Fax. +6224 8508007
Reference
Adi, S., 2006. Pencahayaan pada Interior Rumah Sakit: Studi Kasus Ruang Rawat Inap Utama Gedung Lukas, Rumah Sakit Panti Rapih. Yogyakarta: Dimensi Interior, Vol.4, No.2, pp. 49-56.
Anderson, D, M., 2007. Dorland’s Illustrated Medical Dictionary. 31st ed. Philadephia: Saunders. Annasyiatul, U., Kurniawati., Sonya, H., dan Sri, R, I., 2008. Buku Pedoman Pelaksanaan
Kesehatan dan Keselamatan Kerja untuk Praktek dan Praktikum di Laboratorium Teknik Gigi Program Studi Teknik Kesehatan Gigi. Surabaya: Fakultas Kedokteran Gigi. Universitas Airlangga.
Chairul, G, I., 2006. Studi Optimasi Sistem Pencahayaan Ruang Kuliah dengan Memanfaatkan Cahaya Alam. Jetri. Vol. 5, No. 2, hal. 1-20, ISSN 1412-0372.
Depkes, R, I., 1990. Upaya Kesehatan Kerja Sektor Informal di Industri. Jakarta: Dirjen Peran Serta Masyarakat. Depkes.
Elaine, Y, L, C., 2010. Subjective Health Complaints of Teachers from Primary and Secondary Schools in Hong Kong. International Journal of Occupational Safety and Ergonomics (JOSE). Vol. 16, No. 1, pp. 23–39
Evi, W., 2009. Pengaruh Intensitas Pencahayaan Lokal. Jurnal Kesehatan Masyarakat. Semarang. KESMAS Vol. 5, No.1, hal 64-69.
Febriana, S., 2012. Faktor-Faktor yang Berkaitan dengan Kelelahan Mata pada Karyawan Bagian Administrasi di PT. Indonesia Power UBP Semarang. Jurnal Kesehatan Masyarakat, Vol. 1, No. 2, Tahun 2012, hal. 720 – 730.
Grandjean, E., 1997. Fitting the Task to the Human. Text Book of Occupational Ergonomics 5Th Ed., New York: Philadelphia.
Hani, A, R., 2010. Teori dan Aplikasinya Fisika Kesehatan. Yogyakarta: Nuha Medika. Hikmatyar R, A, M. 2012. Analisis Faktor - Faktor terhadap Kejadian Computer Vision Syndrome
(CVS) pada Pekerja Layout Editor Di CV. “X” Tembalang Kota Semarang. Jurnal Kesehatan Masyarakat. Vol. 1, No. 2, hal. 731 – 737.
Hiola, R., 2000. Pengaruh Intensitas Penerangan terhadap Kelelahan Mata pada Pengrajin Kerawang Kota Gorontalo. Thesis. Surabaya: Airlangga University Postgraduate.
Hsin-Chieh, W., 2012. Visual Fatigue and Performances for the 40-min Mixed Visual Work with a Projected Screen. The Ergonomics Open Journal, Vol. 5, pp. 10-18.
I Gede, W, A, K., 2012. Pengaruh Intensitas Cahaya Monitor terhadap Kenyamanan Mata, Beban Kerja dan Produktivitas pada Operator Komputer. Matrix of Jurnal. Vol. 2, No.3, pp. 152 – 157.
Ilyas., Sidarta., 2006. Ilmu Penyakit Mata. Cetakan ke-3. Jakarta: Balai Penerbitan FKUI. __________., 2006. Kelainan Refraksi dan Kacamata. Glosari Sinopsis. Edisi Kedua. Jakarta:
Balai Penerbitan FKUI. __________., 2008. Penuntun Ilmu Penyakit Mata. Edisi Ketiga. Jakarta: Fakultas Kedokteran
Universitas Indonesia. Keputusan Menteri Kesehatan Republik Indonesia Nomor 1405/Menkes/SK/XI/ 2002 tentang
Persyaratan Kesehatan Lingkungan Kerja Perkantoran dan Industri. Kiattisak, B., Promrak., and Kulworawanichpong, P., 2011. The Study of Appropriate Light Intensity
Levels for Office Work (Causing the Least Visual Discomfort). World Academy of Science, Engineering and Technology. Vol. 5, No. 6, pp. 266-270.
LIN, Chih-Yong, C., Wei-Hsien, H., dan Yu-Chao, L., 2010. Perceived Job Stress and Health Complaints at a Bank Call Center: Comparison between Inbound and Outbound Services. Industrial Health. Volume. 48, Pp. 349–356.
Mahnke, H., Frank., 1947. Color and Light In Man-Made Environment. Canada: John Wiley and Souns, Inc. p. 10.
Manurung.2012. Pencahayaan Alami dalam Arsitektur. Yogyakarta: Andi.
Public Health Department, Faculty of Sports Science, F1 Building, 2nd
Floor, Sekaran Campus Gunungpati, Semarang City, Central Java Province, Indonesia, 50229 Phone/ Fax. +6224 8508007
689
RELATIONSHIP OF PELVIC ROCKING WITH BALL ON THE DURATION OF PHASE BIRTHING CERVICAL DILATATION WOMEN DELIVERY IN GRIYA HAMIL SEHAT MEJASEM
2014
Adevia Maulidya Chikmah
Public Health Postgraduate Program, Semarang State University, Indonesia
Corresponding Author:[email protected]
Abstract
Introduction: When you feel pain, especially backs, many mothers feel happy to keep it moving at
the phase of cervical dilatation and some prefer to lift the pelvis and pelvic moving in the direction
of rotation during the contraction takes place (Pelvic Rock). Several others please use Birthing
Ball. Pelvic Rocking with the Birthing Ball is shaking pelvis using birth ball. At the time of the
delivery process enters phase of cervical dilatation, sit on the ball and slowly swinging and hips to
the front and rear, right side, left side, and a circular will pelvis will be more relaxed. Ball birthing
ball or known by childbirth. Sit on the ball while pushing like doing swing or make a circular motion
pelvis, can help the process of descent. Balls provide support to the perineum without much
pressure and helps keep abreast of the fetus in the pelvis. This study aims to determine the
relationship with the Birthing Implementation Pelvic Rocking Ball on the length of cervical dilatation
phase at Griya Hamil SehatMejasem 2014 by age and parity.
Method: This study uses analytical research design Quasi Experiment study design types One Shot Case Study. Data collected primary and secondary data. Obtained by observation with the 30 respondents Pregnant women giving birth in Griya Healthy Mejasem 2014 and data analysis with Chi Square test. Results: There was a relationship between the execution of pelvic rocking with birthing ball on the length of the cervix dilation phase. x count> x table (13.333> 9.488), and p value (0.01 <0.05). By doing pelvic rocking with birthing ball is able to expedite the delivery process, especially in the phase of cervical dilatation and help women experience during labor and delivery phase of normal cervical dilatation. Keywords: Pelvic rocking with the Birthing Ball, the length of the cervix dilation phase Introduction
Every minute every day, somewhere in the world, one mother dies due to childbirth
komplokasi . Most maternal deaths is a tragedy that can be prevented, avoided, and requires the
attention of the international community . (Prawirohardjo , 2009)
Meanwhile, according to the Department Data Tegal Regency, Year 2013, the maternal
mortality rate reached 42 people out of 29 520 maternal. Bleeding causes of death amounted to 4
people , Hypertension in pregnancy amounted to 12 people, others, totaling 26 people.
The most important factor in the effort penrunan AKI is a health worker, namely by improving
the Information and Education Communication ( IEC). Birth attendants, doctors and midwives can
provide quality services, supported by adequate infrastructure (Prawirohardjo , 2006)
Phase is the early stage of cervical dilatation in labor, in inpartu ( delivery ) is characterized
by lenders mixed with blood, because the cervix begin to open and flat. This is the longest stage or
stages are the longest among others in labor
690
Public Health Department, Faculty of Sports Science, F1 Building, 2nd
Floor, Sekaran Campus Gunungpati, Semarang City, Central Java Province, Indonesia, 50229 Phone/ Fax. +6224 8508007
Phase cervical dilatation appeared continuous uterine contractions regularly. Contraction is a
natural movement muscles of the uterus shrink and stretch by turns, due to the influence of the
hormone oxytocin, which increases production. Pain or pain arises from the waist, stomach and
spread up to the thigh. (Kuswandi , 2013 )
Pelvic Rocking with the Birthing Ball is shaking pelvis using birth ball. At the time of the
delivery process enters phase of cervical dilatation, sit on the ball and slowly swinging and hips to
the front and rear, right side, left side, and a circular will pelvis will be more relaxed. ( Aprilia ,
2011)
Based on a preliminary study in January to March 2014 in Griya Hamil Sehat Mejasem, has
obtained the ANC examination data of 60 pregnant women. Relief on normal birth mothers 42
maternal and handling referral inpartu with as many as 21 Mother Maternity complications. From
42 normal birth mothers who carry out pelvic rocking with birthing ball during the phase of cervical
dilatation reaches 70 %. Resulting in 42 maternal only 30 % who do not carry out Pelvic Rocking
with the Birthing Ball during the phase of cervical dilation because the mother went into labor with
cervical dilation phase or the KPD normal but is not willing because the mother is weak and has
been above the opening 7 until the contractions were already increasingly frequent and adequate
makes the mother has been unable to get out of bed or change positions.
Method This research is a quantitative analytic quasi-experimental research design using this type of
design one group of Post Test. This design also called One Shot Case Study design is a treatment
or test performed on a group without a control group. In this case the researchers wanted to know
the relationship implementation Birthing Ball Pelvic Rocking with the length of the phase of cervical
dilatation at Griya Pregnant Maternity Mother Healthy Mejasem 2014 .
The population in this study were all normal birth mothers in Griya Healthy Pregnant
Mejasem Tegal regency in April to May 2014. To estimate the population, researchers use the
interpretation of birth / day Estimated Born April to May 2014.
In this study, using non- random sampling with purposive sampling technique where the
sampling is based on the consideration of the researchers themselves. Usually researchers have
done a preliminary study, so it has known characteristics of the population to be studied (Suyanto,
2009).
Researchers estimate the sample used for this study were 20 maternal, taken from the data
Valid estimates Born in April-May, 2014.Analysis in this study was conducted to determine the
interaction or relationship of two variables. Bivariate analysis techniques were used to determine
the relationship between the implementation of the pelvic rock with birthing ball on the length of
cervical dilatation phase at Griya Hamil Sehat Mejasem 2014 is using the non-parametric method
of data analysis with statistical test Chi Square used with significance level of 5 percent or ( 0:05 ).
Bivariate analysis performed is cross tabulation between the two variables: the dependent variable
and independent variables. Bivariate analysis were used to determine the relationship
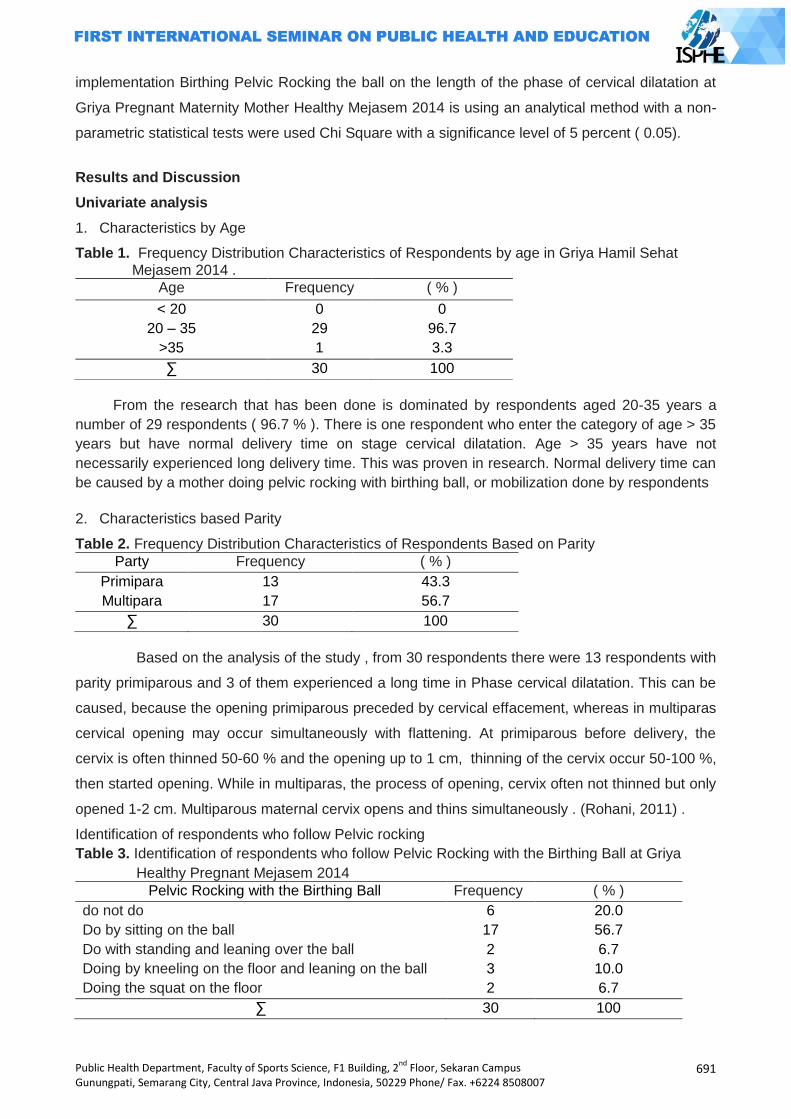
Public Health Department, Faculty of Sports Science, F1 Building, 2nd
Floor, Sekaran Campus Gunungpati, Semarang City, Central Java Province, Indonesia, 50229 Phone/ Fax. +6224 8508007
691
implementation Birthing Pelvic Rocking the ball on the length of the phase of cervical dilatation at
Griya Pregnant Maternity Mother Healthy Mejasem 2014 is using an analytical method with a non-
parametric statistical tests were used Chi Square with a significance level of 5 percent ( 0.05).
Results and Discussion
Univariate analysis
1. Characteristics by Age
Table 1. Frequency Distribution Characteristics of Respondents by age in Griya Hamil Sehat Mejasem 2014 .
Age Frequency ( % )
< 20 0 0
20 – 35 29 96.7
>35 1 3.3
∑ 30 100
From the research that has been done is dominated by respondents aged 20-35 years a
number of 29 respondents ( 96.7 % ). There is one respondent who enter the category of age > 35
years but have normal delivery time on stage cervical dilatation. Age > 35 years have not
necessarily experienced long delivery time. This was proven in research. Normal delivery time can
be caused by a mother doing pelvic rocking with birthing ball, or mobilization done by respondents
2. Characteristics based Parity
Table 2. Frequency Distribution Characteristics of Respondents Based on Parity
Party Frequency ( % )
Primipara 13 43.3
Multipara 17 56.7
∑ 30 100
Based on the analysis of the study , from 30 respondents there were 13 respondents with
parity primiparous and 3 of them experienced a long time in Phase cervical dilatation. This can be
caused, because the opening primiparous preceded by cervical effacement, whereas in multiparas
cervical opening may occur simultaneously with flattening. At primiparous before delivery, the
cervix is often thinned 50-60 % and the opening up to 1 cm, thinning of the cervix occur 50-100 %,
then started opening. While in multiparas, the process of opening, cervix often not thinned but only
opened 1-2 cm. Multiparous maternal cervix opens and thins simultaneously . (Rohani, 2011) .
Identification of respondents who follow Pelvic rocking
Table 3. Identification of respondents who follow Pelvic Rocking with the Birthing Ball at Griya
Healthy Pregnant Mejasem 2014
Pelvic Rocking with the Birthing Ball Frequency ( % )
do not do 6 20.0
Do by sitting on the ball 17 56.7
Do with standing and leaning over the ball 2 6.7
Doing by kneeling on the floor and leaning on the ball 3 10.0
Doing the squat on the floor 2 6.7
∑ 30 100
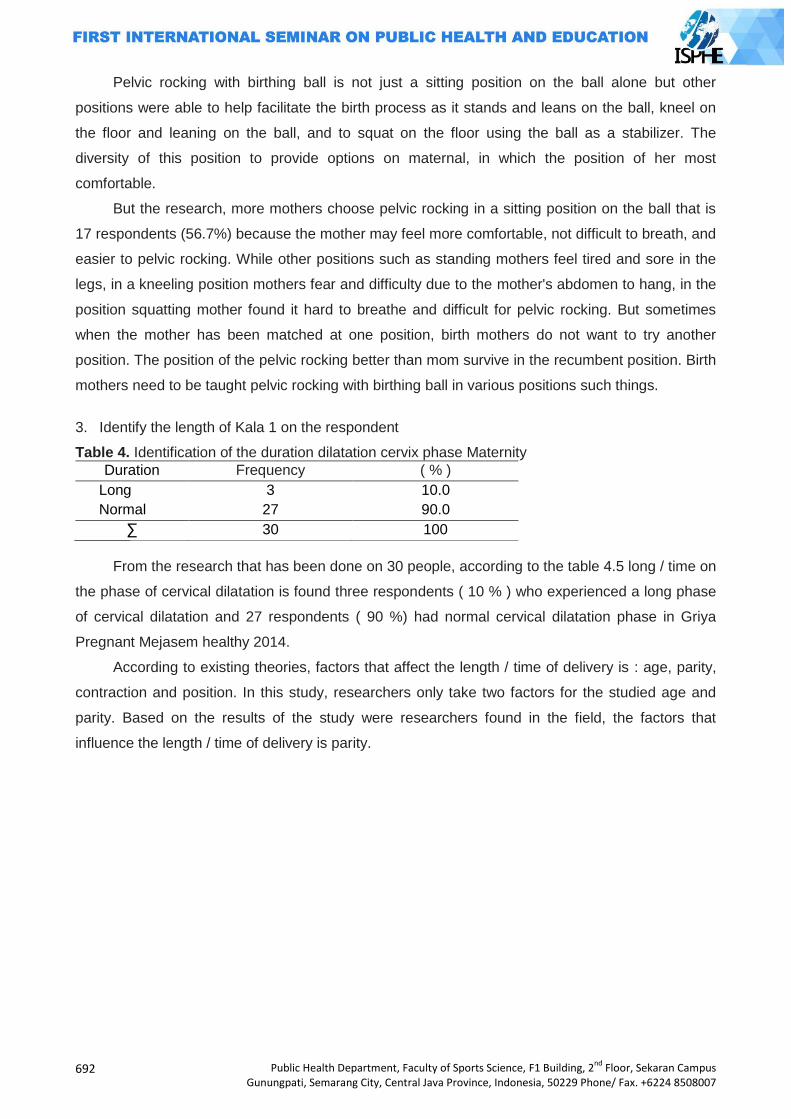
692
Public Health Department, Faculty of Sports Science, F1 Building, 2nd
Floor, Sekaran Campus Gunungpati, Semarang City, Central Java Province, Indonesia, 50229 Phone/ Fax. +6224 8508007
Pelvic rocking with birthing ball is not just a sitting position on the ball alone but other
positions were able to help facilitate the birth process as it stands and leans on the ball, kneel on
the floor and leaning on the ball, and to squat on the floor using the ball as a stabilizer. The
diversity of this position to provide options on maternal, in which the position of her most
comfortable.
But the research, more mothers choose pelvic rocking in a sitting position on the ball that is
17 respondents (56.7%) because the mother may feel more comfortable, not difficult to breath, and
easier to pelvic rocking. While other positions such as standing mothers feel tired and sore in the
legs, in a kneeling position mothers fear and difficulty due to the mother's abdomen to hang, in the
position squatting mother found it hard to breathe and difficult for pelvic rocking. But sometimes
when the mother has been matched at one position, birth mothers do not want to try another
position. The position of the pelvic rocking better than mom survive in the recumbent position. Birth
mothers need to be taught pelvic rocking with birthing ball in various positions such things.
3. Identify the length of Kala 1 on the respondent
Table 4. Identification of the duration dilatation cervix phase Maternity
Duration Frequency ( % )
Long 3 10.0
Normal 27 90.0
∑ 30 100
From the research that has been done on 30 people, according to the table 4.5 long / time on
the phase of cervical dilatation is found three respondents ( 10 % ) who experienced a long phase
of cervical dilatation and 27 respondents ( 90 %) had normal cervical dilatation phase in Griya
Pregnant Mejasem healthy 2014.
According to existing theories, factors that affect the length / time of delivery is : age, parity,
contraction and position. In this study, researchers only take two factors for the studied age and
parity. Based on the results of the study were researchers found in the field, the factors that
influence the length / time of delivery is parity.
Public Health Department, Faculty of Sports Science, F1 Building, 2nd
Floor, Sekaran Campus Gunungpati, Semarang City, Central Java Province, Indonesia, 50229 Phone/ Fax. +6224 8508007
693
Bivariate analysis Table 5. Distribution of the implementation of the pelvic Rocking with the Birthing Ball on the length
of the cervical dilatation phase
Pelvic Rocking with Birthing
Ball
Duration of the cervical
dilatation phase N % X2 V
Long Normal
N % N %
do not do 3 10 3 10 6 20 - -
Do by sitting on the ball 0 0 17 57 17 56.67 - -
Do with standing and leaning
over the ball 0 0 2 6.7 2 6.7 - -
Doing by kneeling on the floor
and leaning on the ball 0 0 3 10 3 10
Doing the squat on the floor 0 0 2 6.7 2 6.7
∑ 3 - 27 - 30 100 13,33 0,01
According to Table 4.6 it can be concluded that a prolonged labor found in maternal parity
primiparous who did Pelvic Rocking with the Birthing Ball as many as three respondents (10%).
While the normal delivery time is found in maternal parity multiparas who did Pelvic Rocking with
the Birthing ball as much as three respondents (10%) and normal delivery time is found in mothers
who do Pelvic Rocking with the Birthing Ball as many as 24 respondents (80%).
According to the results of chi square correlation test using SPSS 17 attached confidence
level of 95%, with df = 4 x table having 9.488 and p value of 0.05 (Sugiyono, 2009), whereas in the
study of 30 respondents in getting the x count 13 333, which means x count> x table (13.333>
9.488), and p value (0.01 <0.05).
Concluded that H0 is rejected and Ha accepted which means there is a relationship between
the implementation of Pelvic Rocking the duration of Phase Birthing Ball with cervical dilatation of
the mother Maternity. By doing pelvic rocking with birthing ball is able to induce labor and assist
the mother during labor and delivery experience a normal phase of cervical dilatation.
Implementation of pelvic rocking with the most preferred birthing ball is doing by sitting on the
ball as much as 17 respondents (57%) experienced a long phase of normal cervical dilatation. Sit
on the ball the most popular because it makes the respondent comfortable and the mother's pelvis
wiggle becomes easier. By sitting mother is not easy to feel tired, but the effect of sitting like a
mother standing, gravitational forces can still help decrease the baby's head but she did not feel
tired because the load-carrying belly. So that this position is able to make the capital last longer to
perform pelvic rocking than any other position.
However, other positions were still selected by respondents though a bit like in a standing
position and lean on the ball as much as 2 respondents (6.7%) had normal cervical dilatation
phase. Phase old normal cervical dilatation experienced by respondents who did pelvic rocking in a
kneeling position on the floor as much as three respondents (10%), and doing squats on the floor
as much as 2 respondents (6.7%)
694
Public Health Department, Faculty of Sports Science, F1 Building, 2nd
Floor, Sekaran Campus Gunungpati, Semarang City, Central Java Province, Indonesia, 50229 Phone/ Fax. +6224 8508007
Of the 24 respondents who made it through a phase of normal cervical dilatation has done
Pelvic Rocking with the Birthing Ball , so the theory Aprilia , 2011, which said pelvic rocking with
birthing ball can help expedite the delivery process , especially the phase of cervical dilatation as
well as the benefits of pelvic rocking the pressure of the baby's head on cervix remains kostan
when maternal positioned upright , so that dilation ( opening ) of the cervix may occur more rapidly
than that vast areas of the pelvis is wider making it easier for the baby's head down to the base of
the pelvis is in accordance with the results of the research .
From the research results it is of interest that , there is one respondent named Ny.M with
multigravida parity in the category of age > 35 years , but experience normal delivery time on stage
cervical dilatation . Meanwhile, according to the Ministry of Health , 2005 , On the maternal age >
35 years , maternal health have started to decline and the birth canal stiff , so it can lead to
prolonged labor . The research results appear inconsistent with the theory. Age > 35 years have
not necessarily experienced long delivery time . This was proven in research . Mother excited
when doing Pelvic Rocking with the Birthing Ball . Normal delivery time can be caused by a mother
doing pelvic rocking with birthing ball , or mobilization done by respondents .
Conclusion
a. Characteristics of respondents by age mostly aged 20-35 years as many as 29
respondents(96.7%), the characteristics of respondents based largely parity parity
multiparas total of 17 respondents (56.7%).
b. Mother Maternity identification that followed the birthing ball Pelvic rocking with as many as
24 respondents (80%).
c. Identification position Birthing ball Pelvic Rocking with the most desirable conduct by sitting
on the ball by 17 respondents (56.7%).
d. Characteristics of respondents by the length of time of delivery to the cervical dilatation
phase has a frequency of normal cervical dilatation phase time of 27 respondents (90%).
e. There is a relationship between the execution of pelvic rocking with birthing ball on the
length of the cervix dilation phase. x count> x table (13.333> 9.488), and p value (0.01
<0.05). By doing pelvic rocking with birthing ball is able to expedite the delivery process,
especially in the phase of cervical dilatation and help women experience during labor and
delivery phase of normal cervical dilatation.
References
Aprilia,Y.Ritchmond.2011.GentleBirthMelahirkanTanpa Rasa Sakit.Jakarta:GramediaWidiasarana
Indonesia
Cuningham, F, G, Mc. Donal Pc. Gant Nf, 2005, Obstetri William. Edisi ke 18. EGC. Jakarta
DinkesKabupaten Tegal.2013.Angka Keatian Ibu, Angka Kunjungan Kehamilan, AngkaPersalinan,
AngkaPersalinan, AngkaKunjunganNifas.KabupatenTegal:DinkesKabupatenTegal.
Public Health Department, Faculty of Sports Science, F1 Building, 2nd
Floor, Sekaran Campus Gunungpati, Semarang City, Central Java Province, Indonesia, 50229 Phone/ Fax. +6224 8508007
695
Djo.2013.Data AngkaKematianIbuHamil Menurut WHO. dalamhttp://harian-
pelita.pelitaonline.com/cetak/2013/09/30/data-angka-kematian-ibu-hamil-menurut-who.
diakses tanggal 19 Maret 2014.
Kuswandi,L.2013.KeajaibanHypno-Birthing.Jakarta.PustakaBunda
Notoatmodjo,S.2010.MetodologiPenelitianKesehatan. Jakarta: PT. RinekaCipta
Prawirohardjo,S.2009c.IlmuKebidanan.Jakarta:YayasanBinaPustakaSarwonoPrawirohardjo.
Rohani,dkk.2011.AsuhanKebidananpadaMasaPersalinan.Jakarta:Salemba Medika
Rukiyah,dkk.2009.AsuhanKebidanan II(Persalinan).Jakarta:Trans Info Media
Sumarah,dkk.2009.PerawatanIbuBersalin.Yogyakarta:Fitramaya
Suyanto,Umi.2009.RisetKebidanan.Yogyakarta:MitraCendikia Press
Wiknjosastro, Hanifa.2005.Ilmiah Kandungan.Jakarta:YBP-SP
Yanti.2009.Buku Ajar AsuhanKebidanan.Yogyakarta:PustakaRihama

696
Public Health Department, Faculty of Sports Science, F1 Building, 2nd
Floor, Sekaran Campus Gunungpati, Semarang City, Central Java Province, Indonesia, 50229 Phone/ Fax. +6224 8508007
DECREASE THE PULSE AND BLOOD PRESSURE IN ELDERLY WITH GYMNASTIC PROGRAM
Ardian Khoerul Anam, Fandy Sadewa
1. Public Health Post Graduate Program, Semarang State University, Indonesia 2. Department of Athletic Knowledge Faculty of Athletic Knowledge Semarang State
University, Indonesia
Corresponding Author: [email protected]
Abstract
Introduction: Research has been done to find out about the effects of gymnastics elderly with its
changes in blood pressure profile and pulse, special features gymnastics elderly, physical
problems that appears during the elderly due to start the declining of organ function or functional
body.
Method: The research method used was quasi experimental method. A pre - test and post - test
one group design (design 2) is used here.
Results: The results obtained indicate that the mean systolic blood pressure in the elderly before
being given a gymnastics program ( 151.33 ), and after being given the gymnastics program
average systolic pressure ( 129.67 ), and the results of pre-test and post-test showed that after a
given program seniors gymnastics experience decrease in systolic pressure ( 21.66 ). Average
diastolic blood pressure in the elderly before being given gymnastics program ( 87.33 ), and after
being given the gymnastics program average diastolic pressure ( 78.00 ), and the results of pre-
test and post-test shows that after the elderly is given the gymnastics program decreased diastolic
pressure ( 9:33 ). Average pulse before giving the elderly gymnastics program ( 78.93 ), and after
being given the gymnastics program pulse average ( 69.47 ), and the results of pre-test and post-
test shows that after the elderly given gymnastics program decreased pulse ( 9:46 ).
Keywords: Elderly gymnastic program, the pulse, blood pressure Introduction
Elderly is a part of the growing process. Humans aren‟t suddenly grow old, but grow from
babies, children, adults and eventually grow old. This is normal, with physical and behavioral
changes that can be predicted that happens to everyone when they reach a certain chronological
age developmental stage. Elderly is a natural process that is determined by the Almighty God.
Everyone will faced the process of being old and old age is a period of the last human alive. This
one's future physical deterioration, mental, and also social retreat phase. (Lilik Ma‟rifatul Azizah.
2011: 1).
According to Law No. 13 Year 1998 on the welfare of the elderly in chapter 1 section 1,
which meant elderly is someone who reaches the age of 60 years and above. Mrs. Jos Masdani;
Nugroho, 2000 reveals that the elderly is a continuation of adulthood. Maturity can be divided into 4
sections iufentus first phase, between 25 and 40 years, virilities second phase, between 40 and 50
in the third, prasenium phase between 55 and 65 years and the fourth is senium, between age 65
to die.
Public Health Department, Faculty of Sports Science, F1 Building, 2nd
Floor, Sekaran Campus Gunungpati, Semarang City, Central Java Province, Indonesia, 50229 Phone/ Fax. +6224 8508007
697
Aging process is a process of gradual dissolve of the body tissue‟s ability to self-repair /
replace and defend its normal function so that it cannot withstand from the infection and repair the
damage suffered (Constantindes, 1994; Darmojo, 2004). The process of aging is a natural
continuous process which begins since they born and usually experience by organism. (Lilik
Ma‟rifatul Azizah. 2011: 7).
Commonly, being old or aging, marked by setbacks biological seen as symptoms of physical
deterioration and the deterioration of cognitive abilities that often caused many problems. (Lilik
Ma‟rifatul Azizah. 2011 : 19).
In the elderly, generally size of heart will be a little smaller. The most decreased is left
ventricular cavity, due to the rarely in doing activity. Magnitude of the heart muscle cells is also
decreased so that it caused decline in the strength of the heart muscle. After the age 20 years old,
the strength of the heart muscle is go down with growing age. With growing age, maximum heart
rate and other functions of the heart is also gradually declining. Blood pressure in the elderly will
rise gradually. The heart‟s elasticity of the heart in people aged 70 years old is more decreased by
approximately 50% than people aged 20 years old. (Lilik Ma‟rifatul Azizah. 2011 : 25).
The degree of cardiac works can be measured from the magnitude of the cardiac output is
the amount of blood produced by the heart ventricle/ ventricular per minute. At the age of 90 years,
the cardiac output turns decreased and surely caused many effects on the functioning of other
organs, such as: muscle, lung, and kidney because of bloodstream to the organs of the body is
reduced in its function. Otherwise, the blood pressure at rest will increase in accordance with
growing age, although not so great. With the absence of physical activities, a person's blood
pressure is going up, especially in systolic pressure. In the elderly, the blood pressure is increasing
while doing activities and going up faster than young people. (Lilik Ma‟rifatul Azizah. 2011 : 26).
The rate of pulse heart also increases when a person is doing activities or physical work and
when they work optimally, the pulse reaches the maximum. However, the maximum pulse rate in
elderly turns decreased because the heart cannot reach frequencies like when they were young.
The formula for predicting a person's pulse is the maximum: (200 - age). (Lilik Ma‟rifatul Azizah.
2011 : 26).
Coronary heart disease called “jantung iskemik” is the most popular disease happened in the
elderly. In Indonesia, the current ischemic heart disease has become the third killer among other
diseases. Patients mostly aged 45 years to elderly. The changes that can be found in patients who
has an ischemic heart disease is the heart blood vessels result by the arterial sclerosis is have not
known with certainty, but the factors GCC speed up the occurrence, such as: smoking, high
cholesterol levels, diabetes mellitus, and excessive weight gain, and rare of exercise. (Lilik
Ma‟rifatul Azizah. 2011 : 26).
Commonly, being old or aging, marked by setbacks biological seen as symptoms of physical
deterioration and the deterioration of cognitive abilities that often caused many problems. (Lilik
Ma‟rifatul Azizah. 2011 : 19).
698
Public Health Department, Faculty of Sports Science, F1 Building, 2nd
Floor, Sekaran Campus Gunungpati, Semarang City, Central Java Province, Indonesia, 50229 Phone/ Fax. +6224 8508007
Sensitivity of hypertension increases with the growing age of a person. Individuals above the
age of 60 years, 50 - 60% had blood pressure greater than or equal to 140/90 mmHg. It was the
influence of degeneration that occurs in people who growing old. The definition of hypertension or
high blood pressure are varies depending on how one give a point of view at its. In general,
hypertension is a condition in which a person's blood pressure is above the limits of normal blood
pressure. Hypertension is called the silent killer, or assassin. Hypertension suddenly can kill
someone without being noticed first its indication. (Yekti Susilo dan Ari Wulandri, 2011:17).
Normal blood pressure is 120/ 80 mmHg. Blood pressure between 120/ 80 mmHg and
139/89 mmHg is called pre – hypertension and a blood pressure above 140/90 mmHg is
considered high and is called hypertension. The numbers at the beginning of a systolic blood
pressure in touch with blood pressure in the blood vessels when the heart contracts and pumps
blood forward into the existing blood vessels. While the next number is the diastolic pressure which
represents the blood pressure in the blood vessels when the heart is at rest (relax) after
contraction. Diastolic pressure reflects the lowest pressure that exist in blood vessels. (Yekti Susilo
dan Ari Wulandri, 2011:22-23).
Variety of efforts have been undertaken by government agencies, health professionals, and
work closely with the private sector and communities to reduce morbidity and death (mortalities) in
elderly. Health care, social, employment, and others have worked on many different levels, they
work at the level of individual elderly, elderly groups, families, Panti Sosial Tresna Wreda (PSTW),
Sasana Tresna Wreda (STW), the Basic Level Health Care Services (primary), Means of First
Level Referral Health Care Services (secondary) and Advanced Level Health Care Services
(tertiary) to resolve the problems that occur in the elderly.
Physical fitness in the elderly have a correlation to health of the heart, lungs, blood
circulation, muscle strength and joint flexibility. Elderly is called to be fresh or in other words have a
good physical fitness while both of the heart and blood circulation have a normal function so that
the whole body can perform its functions in a long time. Elderly cannot be avoided by any humans
as the age impact. Elderly is a part of the journey phases of human life and always be aware of its
existence. The unavailable time, place and opportunity for the elderly to do activities to spend the
rest of his life, so the elderly lose his confidence.(Sumosardjuno, 1998, in his book Siti Maryam R.,
2008).
Nowadays, in Indonesia is get going appears grows a variety of styles and motions of
Gymnastics, and Gymnastics groups is getting popular due to increased public awareness about
the benefits of exercise and cannot be separated well from the suggestion of the President that
"habituate exercises and exercises people”. Gymnastics is a sport that doesn‟t need a much cost,
can be done anywhere, not bound by time and age of a person, while its style/ motions can be
created and implemented in accordance with their desire and ability. The purpose of the
gymnastics group will not be separated from the purpose of the Gymnastics mentioned above. ( K.
Mahmudi Sholeh, 1992:3).
Public Health Department, Faculty of Sports Science, F1 Building, 2nd
Floor, Sekaran Campus Gunungpati, Semarang City, Central Java Province, Indonesia, 50229 Phone/ Fax. +6224 8508007
699
Elderly‟s Gymnastic is a series of regular motion and purposeful tone as well as planned,
followed by the elderly who performed with the aim of improving the functional ability of the body to
achieve those goals. (Santoso, 1994).
The purpose of this study was to knowing the changes in the pulse profile and blood
pressure in elderly who had given Elderly‟s Gymnastic program.
Method
Quasi – experiment method is used in this study. Experimental method is an activity to
examine an indication called exercise or treatment. The basic of using this method is experimental
activities which represented by giving treatment to the subject and concludes with a test to verify
the truth. The pattern are used a pre – test and post – test one group design (design 2). In this
study, the elderly population is at BismaUpakara Rehabilitation Unit Pemalang totaling 75 people.
The sampling technique in this study using a random sampling technique which the sample
selected in a random way. From the 75 elderly in Pemalang Rehabilitation Unit, only 30 elderly‟s
people who were sampled and still be able to follow the activities of gymnastics.
Methods of collecting data is using the test, which uses a pre – test and post - test. Early test
results of the test are the systolic pressure, diastolic pressure, and pulse. SPSS is used to analyze
the data.
Result and Discussion
The results of research on the pre-test showed the mean systolic pressure profile (pre-test)
151.33 with minimum numbers 120 and maximum numbers is 190. The standard deviation is
20.965 of 30 samples. The results of pre-test study profiles the mean diastolic pressure 87.33 with
a minimum number 70 and a maximum number is 100 with a standard deviation is 9.444 of 30
samples. The results of pre – test study of the pulse profile obtained mean 78.93 with a minimum
number is 60 and maximum number is 108. Whereas the standard deviation is 9,962 of 30
samples.
The results of research on the post – test showed the mean systolic pressure profile (post –
test) 129.67 with minimum numbers 100 and maximum numbers is 170. The standard deviation is
18.843 of 30 samples. The results of post – test study profiles the mean diastolic pressure 78.00
with a minimum number 50 and a maximum number is 90 with a standard deviation is 11.567 of 30
samples. The results of post – test study of the pulse profile obtained mean 69.47 with a minimum
number is 60 and maximum number is 84. Whereas the standard deviation is 6.601 of 30 samples.
T-test difference test is intended to determine be accepted or rejected the hypothesis which
states that gymnastic for elderly is influenced the change of the pulse profile. Here is a summary of
the different testing with t-test:
700
Public Health Department, Faculty of Sports Science, F1 Building, 2nd
Floor, Sekaran Campus Gunungpati, Semarang City, Central Java Province, Indonesia, 50229 Phone/ Fax. +6224 8508007
Table 1.Different test with t-test
Data
t-table value t-count value
Systolic
(mmHg)
Diastolic
(mmHg)
Pulse
(x/minute)
Systolic
(mmHg)
Diastolic
(mmHg)
Pulse
(x/ minute)
Pre test 2,045 2,045 2,045 8,527 3,979 7,664
By comparing the t – count value with the t – table value at the significance level of 5% and
db (N-1) = 29. T – Table value for significance level of 5% is 2,045 it can be seen that the t-test for
systolic (8,527), diastolic (3,979), and pulse rate (7,664) stronger than T – table (2,045). This
means that the hypothesis shows there are differences in pulse rate and blood pressure before
and after the elderly done the gymnastic exercise, or in other words the elderly gymnastics should
be maintained, because it has a convincing benefits. To find out the effect of gymnastic on the
elderly and the pulse profile changes in blood pressure, the results of pre – test and post – test is
necessary to be tested in mean different testing. Below is a summary of the test results mean
differences presented in the table:
Table 2. Mean differences test results of pre – test and post – test
No Mean Pre Test Mean Post Test Changes
1 Systolic pressure 151.33 129.67 21.66
2 Diastolic pressure 87.33 78.00 9.33
3 Pulse beat 78.93 69.47 9.46
The table above shows that the mean systolic blood pressure at pre-test (151.33) and post-
test (129.67), systolic pressure decreased (21.66). Diastolic blood pressure average at pre – test
(87.33) and post – test (78.00) decreased diastolic pressure (9:33). Pulse beat average on the pre
– test (78.93) and post – test (69.47) decreased pulse beat (9:46).
Based on the results of studies, it indicates that giving gymnastics elderly for 16 meetings
with the 20-30 minutes of exercise time and with a simple exercise intensity affects the pulse
profile changes and blood pressure in the elderly in the Rehabilitation Unit
PemalangUpakaraBhishma. A Systolic blood pressure average in the elderly before being given a
gymnastics program (151.33), those included in frontier hypertension. After the gymnastics
program is given the average systolic pressure (129.67), blood pressure is in normal condition.
Based on the results of pre-test and post-test shows there‟s a decrease in systolic pressure (21.66)
after the elderly are given the gymnastics program.
Diastolic blood pressure average in the elderly before being given a gymnastics program
(87.33), those included in the normal category, and after the exercise training program is given the
average diastolic pressure become (78.00), still in normal condition. Based on the results of pre-
test and post-test showed that after elderly are given the gymnastics program, the diastolic
pressure decreased (9:33).
Public Health Department, Faculty of Sports Science, F1 Building, 2nd
Floor, Sekaran Campus Gunungpati, Semarang City, Central Java Province, Indonesia, 50229 Phone/ Fax. +6224 8508007
701
Pulse average on elderly before they are given the gymnastics program (78.93), those
included in the middle category for elderly men and good category for elderly women. After the
gymnastics program is given the pulse average rate is (69.47), those included in good category for
elderly men and very good category for elderly women and based on the results of pre-test and
post-test showed that after elderly are given the gymnastics program, the pulse decreased to
(9.46).
From the following data is proven that there are changes in the pulse profile and blood
pressure in elderly who joined gymnastics program. This is because the gymnastics program have
benefits for the development of organs, maintains and improves functional ability, expedite the
process of degeneration because of aging process, and make it easier to customize the physical
health in life (adaptation).
Tera Gymnastics are consists of warm-up exercises, main exercises, and cooling down
which movements/ motions in it also has many aims to reduce anxiety, stress, and decrease levels
of depression. The decline will stimulate the autonomy nervous system, especially
parasympathetic which caused a vasodilation cross section of blood vessel will result in a decrease
in both systolic blood pressure and diastolic.
Conclusion
Based on the results of research and discussion, can be concluded that the elderly
gymnastics program was taken an effect of reducing the systolic pressure profile at
BismaUpakaraPemalang Rehabilitation Unit, the elderly gymnastics program was taken an effect
of reducing the diastolic pressure profile at BismaUpakaraPemalang Rehabilitation Unit, the elderly
gymnastics program was taken an effect of reducing the pulse profile at BismaUpakaraPemalang
Rehabilitation Unit.
References
Darmojo, B. dan M. Hadi. 2004. Geriatri : Ilmu Kesehatan Usia Lanjut. Jakarta
K. Mahmudi Sholeh.1992.Olahraga Pilihan Senam. Surakarta
Lilik Ma‟rifatul Azizah.2011. keperawatan lanjut usia. Yogyakarta
R. Siti Maryam, Mia FatmaEkasaridkk. 2008. MengenalUsialanjutdanperawatannya. Jakarta
Yekti Susilo dan Ari Wulandari. 2011.Cara Jitu Mengatasi Hipertensi. Yogyakarta
702
Public Health Department, Faculty of Sports Science, F1 Building, 2nd
Floor, Sekaran Campus Gunungpati, Semarang City, Central Java Province, Indonesia, 50229 Phone/ Fax. +6224 8508007
KNOWLEDGE LEVEL RELATIONSHIP WITH MOM INTERESTS IN BRINGING THEIR BABIES
FOR IMMUNIZATIONS IN PUSKESMAS TAYU I PATI REGENCY
Ana Zumrotun Nisak1, Titi Suherni2, Sugih Wijayati2
1. Public Health Postgraduate Program, Semarang State University, Indonesia 2. Department of Health Polytechnic Semarang, Indonesia
Corresponding Author: [email protected]
Abstract
Introduction:To reduce morbidity, mortality and disability infants and toddlers can be implemented
through the implementation of immunization programs for tuberculosis, diphtheria, Pertussis,
Tetanus, Polio, Hepatitis B and Measles.According to the Department of Health (2000) mentions
supporting components mothers perform basic immunization in infants is the ability of individuals to
use health care services based on the factors of education, knowledge, sources of income or
income and distance from the house to the immunization services. The purpose of this study was
to determine the relationship of the level of knowledge with a keen interest in the mother took the
baby for immunization.
Method: This study used quantitative research with survey method that is both analyticandcross
sectional approach.The technique of sampling withpurposive sampling counted63
people.Gathering data using questionnaires, and for processing the data using SPSS statistical
testChi Square.
Results: The results showed that the mother's level of knowledge about immunization in either
category (52.4%).Mother interest in bringing their babies for immunization as many (69.8%).At the
level of knowledge of mothers on maternal immunization with an interest in bringing their babies for
immunization, get value X ² count> X table that is equal to (5.989> 3.481) andP valueis smaller
than(0.014 <0.05), which indicates that there is a correlation between the level of knowledge with a
keen interest in the mother took the baby for immunization health centers in the region of the TayuI
Pati regency.
Keywords: Level of knowledge, interest in the mother took the baby for immunization
Introduction
One of the national health strategy is to implement a national development is vision of health,
which means that every effort should development programs have a positive contribution to the
formation of a healthy environment and healthy behavior. As a reference to the health development
refers to the concept of "Healthy Paradigm" is health development that gives priority to the
improvement of health care efforts (promotion) and disease prevention (preventive) than service
efforts cure or treatment (curative) and recovery (rehabilitative) overall integrated and continuous
(Central Java Health Office, 2005).
Within the scope of health care, preventive field is a top priority. In implementing the National
Health System (NHS), immunization is one of the forms of health interventions are highly effective
in reducing mortality rates of infants and toddlers. A decrease in the incidence of infectious
Public Health Department, Faculty of Sports Science, F1 Building, 2nd
Floor, Sekaran Campus Gunungpati, Semarang City, Central Java Province, Indonesia, 50229 Phone/ Fax. +6224 8508007
703
diseases has occurred decades ago in developed countries that have been doing with regular
immunization with extensive coverage (Ranuh, 2005).
Indicators in measuring the degree of public health which are MMR and IMR.This is because
mothers and infants are the group that has a great degree of vulnerability to disease and
death.Data show that 1.7 million Indonesian children die because they do not fully immunized.The
amount of 1.7 million is one-fifth of children under five in Indonesia.Without immunization,
approximately three out of 100 births will die of measles, two out of 100 births will die of whooping
cough, one in every 100 births will die of tetanus and of every 200,000 children, one will suffer from
polio (Ridwanamiruddin, 2007).
Based on the results of a national health survey 2005 figures complete basic immunization
coverage in Indonesia is around 60-70%. This figure is still small compared to the 80% figure
complete immunization coverage targeted by the UCI (Universal Child Imunization) (Supraptini,
2007). In Central Java province in 2004 found 107 paraplegic wilt in children aged less than 15
years. The incidence of measles found as many as 65 events with 1137 patients and three
deaths. As for diphtheria incidence of 35 districts or cities which reported the existence of
extraordinary events (KLB), diphtheria and hepatitis outbreaks attacked 49 villages (Central Java
Health Office, 2005).
Morbidity, mortality, and disability infants and toddlers can be reduced through the
implementation of the program of immunization diseases that can be prevented by immunization
(PD3I) such as tuberculosis, diphtheria, Pertussis, Tetanus, Polio, Hepatitis B and Measles. The
health department recommends that all children before their first birthday has gained immunization
complete base consisting of BCG 1 time, 3 times DPT, polio 4 times, HB 3 times, measles 1
times. To assess the completeness of basic immunization for infants are usually seen from
measles immunization coverage since the last immunization given to infants (Central Java Health
Office, 2005).
According to the MOH (2000) mentions supporting components mothers perform basic
immunization in infants among others is the ability of individuals to use health services are
estimated based on the factors of education, knowledge, sources of income or income and
distance from the house to the immunization services (Department of Health, 2000).
Mother's knowledge can be gained from education or observations and information from any
person. Knowledge can increase knowledge of a person as well as the basic processes of human
life. Through knowledge, humans can make changes so that the individual qualitative behavior
evolve. All activities undertaken in the implementation of the mothers as infant immunization is
none other than the results obtained from the study (Slamet, 1999).
A person's interest in bringing their babies for immunization appears to someone who often is
not only based on consideration of the benefits of immunization or services in immunization, but
there are other impulses that cause the person's decision to bring her baby for immunization such
704
Public Health Department, Faculty of Sports Science, F1 Building, 2nd
Floor, Sekaran Campus Gunungpati, Semarang City, Central Java Province, Indonesia, 50229 Phone/ Fax. +6224 8508007
as culture, social class, family, experience, personality, attitude, confidence, self-concept, and so
on (Pamangsah, 2008).
In Central Java in 2007 complete basic immunization coverage with the target of about
584.171 inhabitants baby with the result that BCG immunization (100.78%), DPT1 + HB1
(100.84%), DPT2 + HB2 (98.24%), polio4 (97 , 28%), HB3 (98.24%) and measles (96.50%), to
4.30% dropout rate. Whereas in Pati district immunization coverage in 2007 include BCG
(102.33%), DPT1 + HB1 (107.36%), DPT2 + HB2 (105.02%), polio4 (104.05%), HB3 (105 , 02%)
and measles (108.54%), for a dropout rate of 1.09% (Central Java Health Office, 2007).
While in PuskesmasTayu I in 2008 known number of babies around 18,276 inhabitants, with
BCG immunization coverage (106.5%), DPT-HB 1-3 (112.2%), polio 1-4 (111.9% ), HB (110.4%)
and measles (108.9%) and who had to drop out in the immunization of -4.3%. For a number of
infant morbidity of various diseases in 2008 was 694 infants, with measles as much as two babies,
and for other diseases that could be prevented by immunization was not found. Morbidity of these
infants can be overcome with the appropriate drug delivery complaints while for cases of measles
immunization given immediately after the disease is known.
Based on the preliminary survey conducted by researchers at the PuskesmasTayu I by
taking 10 mothers with infants aged 0-12 months, got three good knowledge mother, mother
knowledgeable enough 3 and 4 mothers who are less knowledgeable. While interest in the mother
carrying a baby for immunization obtained 8 mothers are interested in bringing their babies for
immunization and 2 mothers had no interest in bringing the infant for immunization. From this state
of researchers interested in conducting research in PuskesmasTayu I, because of the statement
above there are factors that affect the mother took the baby for immunization include immunization
against the mother's knowledge, there is no presumption that immunization benefits for the baby
and immunization could lead to fever and pain in her baby.
From the above background, the authors are interested in doing research with the title
Relation with the level of knowledge in the interest mothers bring their babies for immunization in
Puskesmas I TayuPati regency.
Method
This study used cross sectional research that studied the dynamics of the correlation
between independent variables with the dependent variable by way of observation or data
collection approaches simultaneously (Notoatmodjo, 2003). This research method is an analytical
survey is a survey or research that tries to explore the correlation between knowledge with
maternal interest in bringing their babies for immunization.
The population in this study were mothers who had infants aged 0-12 months in May in
Puskesmas I TayuPati regency of 420 people. The number of samples in this study were 63
respondents.How to sampling in this research is usingpurposive sampling technique is a technique
determination of sample by choosing among a sample population in accordance with the wishes or
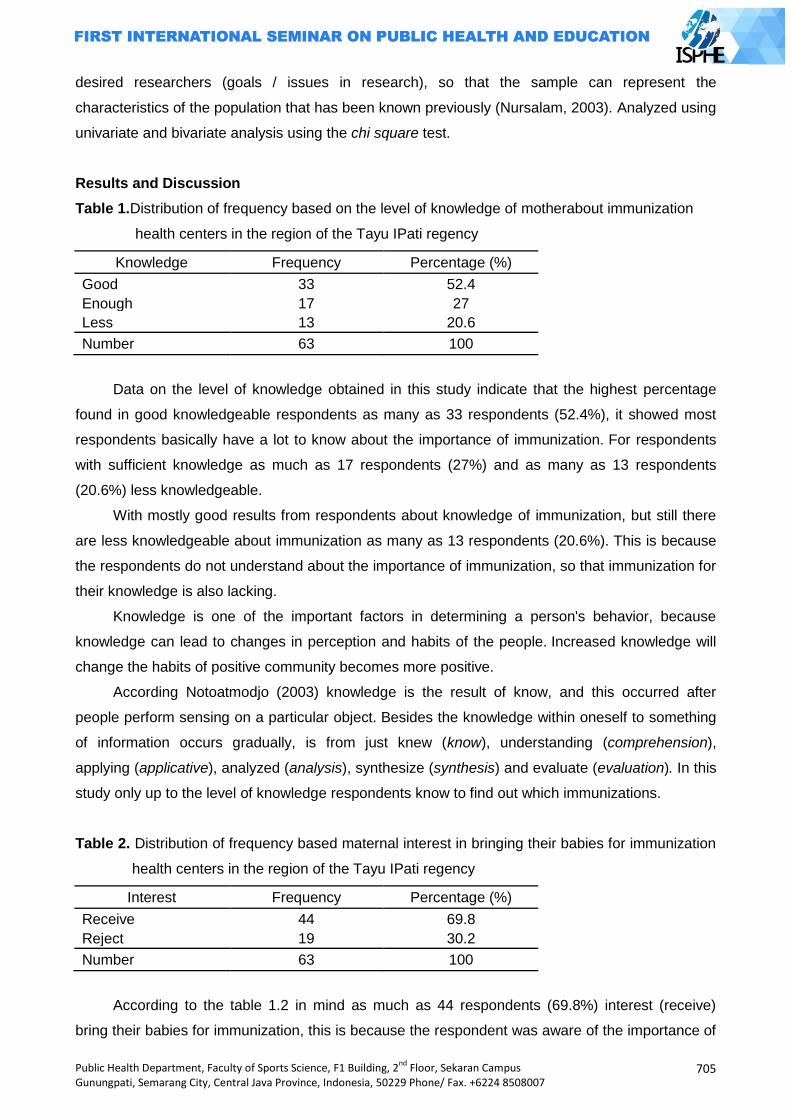
Public Health Department, Faculty of Sports Science, F1 Building, 2nd
Floor, Sekaran Campus Gunungpati, Semarang City, Central Java Province, Indonesia, 50229 Phone/ Fax. +6224 8508007
705
desired researchers (goals / issues in research), so that the sample can represent the
characteristics of the population that has been known previously (Nursalam, 2003). Analyzed using
univariate and bivariate analysis using the chi square test.
Results and Discussion
Table 1.Distribution of frequency based on the level of knowledge of motherabout immunization
health centers in the region of the Tayu IPati regency
Knowledge Frequency Percentage (%)
Good 33 52.4
Enough 17 27
Less 13 20.6
Number 63 100
Data on the level of knowledge obtained in this study indicate that the highest percentage
found in good knowledgeable respondents as many as 33 respondents (52.4%), it showed most
respondents basically have a lot to know about the importance of immunization. For respondents
with sufficient knowledge as much as 17 respondents (27%) and as many as 13 respondents
(20.6%) less knowledgeable.
With mostly good results from respondents about knowledge of immunization, but still there
are less knowledgeable about immunization as many as 13 respondents (20.6%). This is because
the respondents do not understand about the importance of immunization, so that immunization for
their knowledge is also lacking.
Knowledge is one of the important factors in determining a person's behavior, because
knowledge can lead to changes in perception and habits of the people. Increased knowledge will
change the habits of positive community becomes more positive.
According Notoatmodjo (2003) knowledge is the result of know, and this occurred after
people perform sensing on a particular object. Besides the knowledge within oneself to something
of information occurs gradually, is from just knew (know), understanding (comprehension),
applying (applicative), analyzed (analysis), synthesize (synthesis) and evaluate (evaluation). In this
study only up to the level of knowledge respondents know to find out which immunizations.
Table 2. Distribution of frequency based maternal interest in bringing their babies for immunization
health centers in the region of the Tayu IPati regency
Interest Frequency Percentage (%)
Receive 44 69.8
Reject 19 30.2
Number 63 100
According to the table 1.2 in mind as much as 44 respondents (69.8%) interest (receive)
bring their babies for immunization, this is because the respondent was aware of the importance of
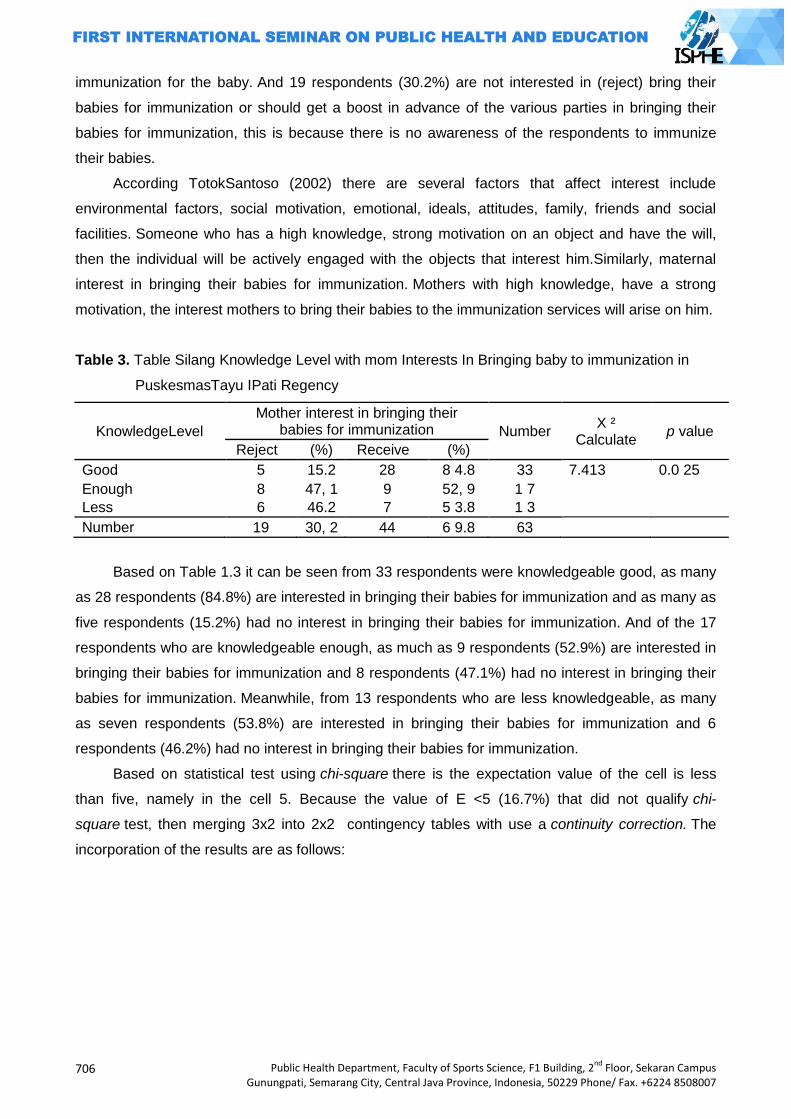
706
Public Health Department, Faculty of Sports Science, F1 Building, 2nd
Floor, Sekaran Campus Gunungpati, Semarang City, Central Java Province, Indonesia, 50229 Phone/ Fax. +6224 8508007
immunization for the baby. And 19 respondents (30.2%) are not interested in (reject) bring their
babies for immunization or should get a boost in advance of the various parties in bringing their
babies for immunization, this is because there is no awareness of the respondents to immunize
their babies.
According TotokSantoso (2002) there are several factors that affect interest include
environmental factors, social motivation, emotional, ideals, attitudes, family, friends and social
facilities. Someone who has a high knowledge, strong motivation on an object and have the will,
then the individual will be actively engaged with the objects that interest him.Similarly, maternal
interest in bringing their babies for immunization. Mothers with high knowledge, have a strong
motivation, the interest mothers to bring their babies to the immunization services will arise on him.
Table 3. Table Silang Knowledge Level with mom Interests In Bringing baby to immunization in
PuskesmasTayu IPati Regency
KnowledgeLevel
Mother interest in bringing their babies for immunization Number
X ² Calculate
p value
Reject (%) Receive (%)
Good 5 15.2 28 8 4.8 33 7.413 0.0 25
Enough 8 47, 1 9 52, 9 1 7
Less 6 46.2 7 5 3.8 1 3
Number 19 30, 2 44 6 9.8 63
Based on Table 1.3 it can be seen from 33 respondents were knowledgeable good, as many
as 28 respondents (84.8%) are interested in bringing their babies for immunization and as many as
five respondents (15.2%) had no interest in bringing their babies for immunization. And of the 17
respondents who are knowledgeable enough, as much as 9 respondents (52.9%) are interested in
bringing their babies for immunization and 8 respondents (47.1%) had no interest in bringing their
babies for immunization. Meanwhile, from 13 respondents who are less knowledgeable, as many
as seven respondents (53.8%) are interested in bringing their babies for immunization and 6
respondents (46.2%) had no interest in bringing their babies for immunization.
Based on statistical test using chi-square there is the expectation value of the cell is less
than five, namely in the cell 5. Because the value of E <5 (16.7%) that did not qualify chi-
square test, then merging 3x2 into 2x2 contingency tables with use a continuity correction. The
incorporation of the results are as follows:
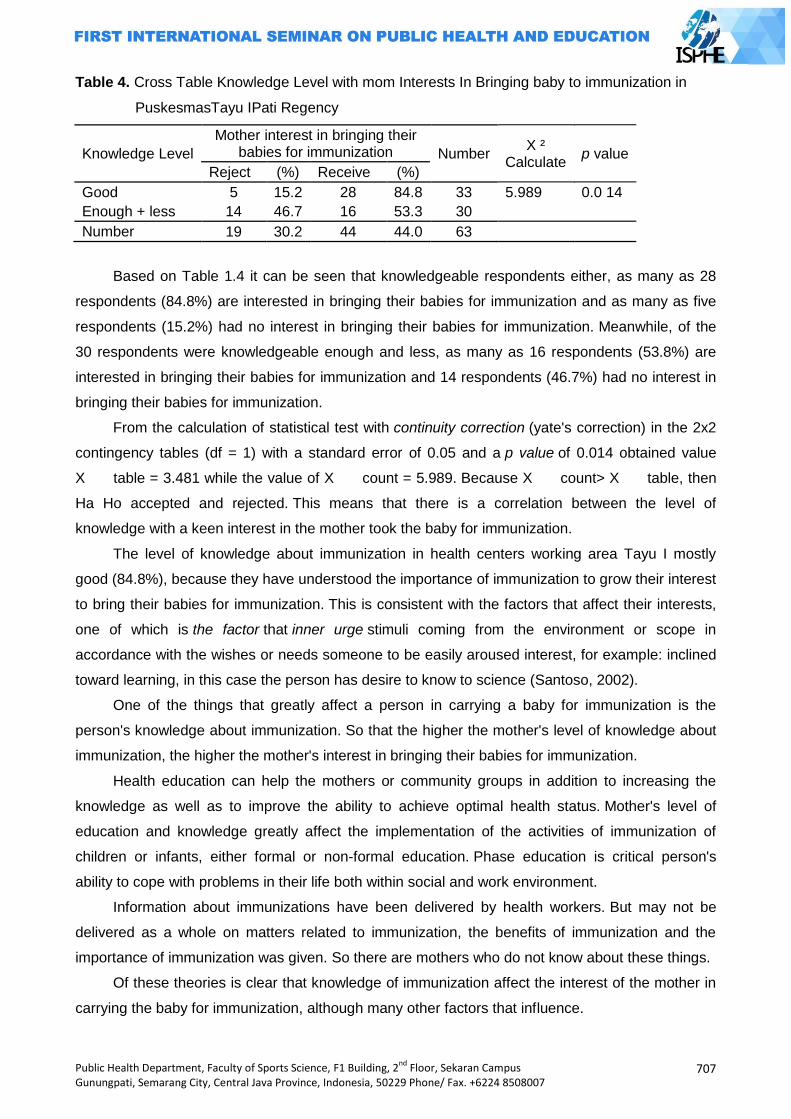
Public Health Department, Faculty of Sports Science, F1 Building, 2nd
Floor, Sekaran Campus Gunungpati, Semarang City, Central Java Province, Indonesia, 50229 Phone/ Fax. +6224 8508007
707
Table 4. Cross Table Knowledge Level with mom Interests In Bringing baby to immunization in
PuskesmasTayu IPati Regency
Knowledge Level
Mother interest in bringing their babies for immunization Number
X ² Calculate
p value
Reject (%) Receive (%)
Good 5 15.2 28 84.8 33 5.989 0.0 14
Enough + less 14 46.7 16 53.3 30
Number 19 30.2 44 44.0 63
Based on Table 1.4 it can be seen that knowledgeable respondents either, as many as 28
respondents (84.8%) are interested in bringing their babies for immunization and as many as five
respondents (15.2%) had no interest in bringing their babies for immunization. Meanwhile, of the
30 respondents were knowledgeable enough and less, as many as 16 respondents (53.8%) are
interested in bringing their babies for immunization and 14 respondents (46.7%) had no interest in
bringing their babies for immunization.
From the calculation of statistical test with continuity correction (yate's correction) in the 2x2
contingency tables (df = 1) with a standard error of 0.05 and a p value of 0.014 obtained value
X table = 3.481 while the value of X count = 5.989. Because X count> X table, then
Ha Ho accepted and rejected. This means that there is a correlation between the level of
knowledge with a keen interest in the mother took the baby for immunization.
The level of knowledge about immunization in health centers working area Tayu I mostly
good (84.8%), because they have understood the importance of immunization to grow their interest
to bring their babies for immunization. This is consistent with the factors that affect their interests,
one of which is the factor that inner urge stimuli coming from the environment or scope in
accordance with the wishes or needs someone to be easily aroused interest, for example: inclined
toward learning, in this case the person has desire to know to science (Santoso, 2002).
One of the things that greatly affect a person in carrying a baby for immunization is the
person's knowledge about immunization. So that the higher the mother's level of knowledge about
immunization, the higher the mother's interest in bringing their babies for immunization.
Health education can help the mothers or community groups in addition to increasing the
knowledge as well as to improve the ability to achieve optimal health status. Mother's level of
education and knowledge greatly affect the implementation of the activities of immunization of
children or infants, either formal or non-formal education. Phase education is critical person's
ability to cope with problems in their life both within social and work environment.
Information about immunizations have been delivered by health workers. But may not be
delivered as a whole on matters related to immunization, the benefits of immunization and the
importance of immunization was given. So there are mothers who do not know about these things.
Of these theories is clear that knowledge of immunization affect the interest of the mother in
carrying the baby for immunization, although many other factors that influence.
708
Public Health Department, Faculty of Sports Science, F1 Building, 2nd
Floor, Sekaran Campus Gunungpati, Semarang City, Central Java Province, Indonesia, 50229 Phone/ Fax. +6224 8508007
References
Alimul, AA. 2008. Pengantar Ilmu Kesehatan Anak Untuk Pendidikan Kebidanan. Jakarta :
Salemba Medika.
Anton,S.2006. PengembanganPerangkatPenilaianAfektif.
http://pengembangan.or.id/cetakartikel.php? (21 April, 2009).
Arikunto. 2006. Prosedur Penelitian Suatu Pendekatan Praktek. Jakarta : Rineka Cipta.
Depkes RI. 2006. Modul Pelatihan Tenaga Pelaksana Imunisasi Puskesmas. Jakarta : Depkes RI.
Dinkes Propinsi Jawa Tengah. 2005. Pedoman Penyelenggaraan Imunisasi. Semarang : Dinkes
Propinsi Jateng.
Dinkes Propinsi Jawa Tengah. 2007. Profil Kesehatan Jawa Tengah. Semarang : Dinkes Propinsi
Jateng.
Djaali. 2008. Psikologi Pendidikan. Jakarta : Bumi Aksara.
IDAI. 2005. Pedoman Imunisasi di Indonesia. Jakarta : Satgas Imunisasi Ikatan Dokter Anak
Indonesia.
Notoatmodjo. 2002. Metode Penelitian. Jakarta : Rineka Cipta.
----------------. 2003. Pendidikan dan Perilaku Kesehatan. Jakarta : Rineka Cipta.
Nursalam. 2003. Konsep dan Penerapan Metodologi Penelitian Ilmu Keperawatan. Jakarta :
Salemba Medika.
Pamangsah, A. 2008. Hubungan Antara Persepsi Terhadap Kualitas Produk Dengan Minat
Membeli .http://pamangsah.blogspot.com/2008/11/hubungan-antara-persepsi-
terhadap.html (28 April 2009).
Poerwadarminta, WJS. 2003. Kamus Besar Bahasa Indonesia. Jakarta : Balai Pustaka.
Putra, B.A. 2008. Penelitian Imunisasi. http://boyantoniputrastikesfortdekock
bukittinggi.blogarsive.penelitian-imunisasi/html. (21 April, 2009).
Ranuh. 2001. Buku Imunisasi di Indonesia. Jakarta : Ikatan Dokter Anak Indonesia, Edisi Pertama.
Riwidikdo, H. (2008). Statistik Kesehatan. Jogjakarta: Mitra Cendikia
Sugiyono. 2003. StatistikUntukPenelitian. Bandung :Alfabeta.
Tawi, M. 2008. Imunisasi dan Faktor Yang Mempengaruhinya. http://syehaceh.wordpress.com (16
Maret, 2009).
Untari, J. 2001. Analisis Pemanfaatan Kartu Sehat di Indonesia Kajian Survei Sosial Ekonomi
Nasional.http://Irc-kmpk.ugm.ac.id/id/UP-PDF/-working/no.4-Jati%20Untari-01-07.pdf
(17 Mei 2009).
Public Health Department, Faculty of Sports Science, F1 Building, 2nd
Floor, Sekaran Campus Gunungpati, Semarang City, Central Java Province, Indonesia, 50229 Phone/ Fax. +6224 8508007
709
DISCRIMINANT ANALYSIS THE ADEQUATE LEVEL OF FAMILY PROTEIN CONSUMPTION IN BOGOR DISTRICT
Ardiana Priharwanti
Public Health Post Graduate Program, Semarang State University, Indonesia
Abstract Background: Based on data from the Bogor City Health Department, during 2005 there were 240 children under five suffer from malnutrition, including marasmus status of 35 infants, five toddlers to marasmus kwarsiorkoran done tested positive formal nutrition. A variety of nutrition issues, as was the case-Protein Energy Malnutrition monitoring the consumption of protein has not been touched, so there is no indicator to see and determine the adequacy of protein intake. Until now there is nomeasurement that is easier to determine the adequacy of the level of protein consumption. Therefore, research on indicators of adequacy levels of protein consumption is still very necessary. Method: Research design was crosssectional, observational variables influence and be influenced to dowellat onetime. The study was conducted in Aprilto November 2006. The study was conducted in rural an Durban areas. Rural area are represented by Sukamaju Village, District Cibungbulang Bogor and urban districts represented by the Official Village District Land Like Cereal City Bogor West Java province. Data collected includes primary data and secondary data. Discriminant analysis used to classified families into groups ofless and consume enough protein basedfood consumption variables. Result:The prevalence of families with low levels of protein in take as much as 41.7%. Characteristics of families with low levels of protein consumptionis as follows: the number of family members of 5-6 people, family headage 24-70 years, 23-60 years of maternal age, education level of head of house hold 0-12 years, and maternal education level ranged between 0 up to 9 years. Keyword:Discriminant analysis, consumption adequacy level protein
Introduction
According to FAO (2005) in Indonesia there are 6% (11.600.000) people with hunger, this
means among 20 Indonesia peoplehas one person starved.Indonesia will be able to achieve the
target to lower half of people who suffer from hunger until the year of 2015 if they canreduce the
number of sufferers hunger at least 20,000 people every year.
The frequencies of food consumption in poor households are still low as cases which occur
in the Kutai district, east Kalimantan. The district where known as a rich district have many poor
people, especially at in the rural which can eat only once a day (Suhartiningsih, 2005).
Low of eat frequency correlate with malnutritionas the case happened in Bogor.Based on
data from Bogor Health Division, during the year of 2005 was recorded as many as 240 children
suffering from malnutrition, among them there are 35 children under five expose marasmus, five
children who under fiveexpose kwashiorkor marasmus and one child tested has positive severely
malnourished.It caused by the parentscould not meet the needs of food due to poverty, because
their incomes are erratic and children often eat only once a day. The cases of malnutrition would
reflect the incident of malnutrition in Indonesia itself.Since January to November2005, there are
71.815 children under five suffered malnutrition and 232 in whom died.
710
Public Health Department, Faculty of Sports Science, F1 Building, 2nd
Floor, Sekaran Campus Gunungpati, Semarang City, Central Java Province, Indonesia, 50229 Phone/ Fax. +6224 8508007
Various diseases of nutrition disturbance and malnutrition resulting from the quality of food
was not good or a quantity of food that does not conform to the body needs of each people is still
often found in various places in Indonesia.Thenutrition condition of populationIndonesia which is
measured mostly from the growth of toddlers (weight and height) apprehensive since prior of the
crisis and even has worsened over the occurrence of crises.One of disease nutrition disturbance
that still often found in our country and is a main problem of nutrition is disturbance of nutrition due
to less calories and protein program (KKP).
The parties involved has been many trying to address the problem of nutrition in Indonesia
but this condition is not too much changed in line with the progress of the development that have
been achieved from every single sector. The nutrition monitoring efforts seem have more
monitoring on energy consumption.Various nutrition problems as is the cases with less Energy-
Protein have not touched by the monitoring of protein consumption, so that there has been no
indicators to know and determine adequacy of protein consumption.Until now there no an easier
measurement to determine the adequate level of protein consumption.Hence research on
indicators the adequate level of protein consumption is still indispensable.
Method
The design of its research is the cross sectional, observation of affected the influence
variables be done at one time. The research conducted fromApril untilNovemberof year 2006.The
research was done in rural and urban areas. Rural areas was represented by Sukamaju village,
Cibungbulang sub-district and urban areas was represented by SukaResmi village, Tanah Sereal
sub-district, Bogor city,West Java. The election of districts and towns ofBogorare based on the
level of poverty which are higher than regency or village area.
The population in this research is the whole of the family in the Sukamaju village,
Cibungbulang sub-district in Bogor, and in the SukaResmi village, Tanah Sereal sub-district, Bogor
city.From the village, there was chosen in randomlyof poor families (KS-2, KS-3 dan KS-3+) and
families who not poor (KS-2, KS-3 dan KS-3+) each of them was tookabout 30 families, so the total
example is 60 families.
The data collections were primary and secondary data.Primary data was gathered
include:Socio-economi data and family demographic suah as: mother age, head of family age,
longer time spent for formal educational by both mother and head of family, the number of family
members and its composition, per capita expenditure, expenditures for food, the frequency of food.
Meanwhile, the secondary data include data that describes: demographic, agriculture, and
socio-economic.This data obtained from the village office, sub-district, regency/municipality; and
other departments related to this research.
Characteristics data example and family that had been collected, and been tabulatedwas
analyzed by descriptive method.
Public Health Department, Faculty of Sports Science, F1 Building, 2nd
Floor, Sekaran Campus Gunungpati, Semarang City, Central Java Province, Indonesia, 50229 Phone/ Fax. +6224 8508007
711
Food consumption data of families which processed was protein consumption by using
composition foodstuffs list.And then calculated the adequate level of the protein through the
comparisons between actual consumption with adequate suggested.The category of the level of
low consumption according to Ministry of Health was protein consumption if <70 % and enough
protein consumption if ≥70 %.
The qualitative measurement of food consumption was based on the frequency of the
family eat various kinds of foods by using Food Frequency method which expressed the terms of
the size of the consumption per year. Food consumption data of the family was collected by times
per day, times per week, times per month and time per year. Data processing done by
usingexcel,SPSS11.0 for windows and SAS.
Discriminant analysis of determinant factorlevel of protein consumption
Discriminat analysesused to classify the family into a group of lacking enough of protein
consumption based on consumption food variables. And then, to determine the adequatelevelof
family protein consumption according to food consumption variables which done through
discriminant analysis method as follows:
Suppose ×is a vector variables of family food consumption family sized p×1 that spreads
according to normal multivariate f1 (×) for the enough consumption of the protein which having the
same matric variance-covariance ∑1 = ∑2= ∑ and only different average vector that is usually μ1, μ2
because:
f1 (x) =[(2π)1/2 I ∑I 1/2 ]-1 exp [(-1/2)(x- μ1)‟ ∑-1 (x- μ1)]
f2 (x) =[(2π)1/2 I ∑I 1/2 ]-1 exp [(-1/2)(x- μ2)‟ ∑-1 (x- μ2)]
Because the parameter ∑, μ1, and μ2 did not knowand then these parameters each allegedly by S,
x1, x2 with note:
S = (n1-1) S1+ (n2-1) S2
Variables that were analyzed in this research according to variables of family food
consumptionobtained from full filled the table of food frequency.The frequency of food consumption
was calculated based on the average per month in food frequency. The next stage was
selectedvariables of food frequency with a purpose that the model used obtained as simple as
possible so that the application of model in field areawas being easily through the program Proc
diskrim which was available in the SAS according to one variable of foodconsumption frequency,
then two variables food consumption and the last was involved all variables the frequency of food
consumption. Discrimination model which became a candidate an indicator was the model with the
smallest misclassification level.
The decision making process done by comparing the resultsbetween the equation Y1 (X)
and Y2(X).If Y1 (X) > Y2(X), so it will be classified in family groups with low protein consumption.And
if Y1 (X) < Y2 (X), so it will be classified in family groups with enough protein consumption.
712
Public Health Department, Faculty of Sports Science, F1 Building, 2nd
Floor, Sekaran Campus Gunungpati, Semarang City, Central Java Province, Indonesia, 50229 Phone/ Fax. +6224 8508007
Results and Discussion
The level of consumption of protein was measured by comparing the actual protein
consumption with the level of consumption advisedaccording to age and weight.The level of level
protein consumption less than 70%was classified low group, while called enough is if the level over
70%(Supriasa, 2002).Based on these calculations, we can see that there are 25 categories
families have low level protein consumption.For detail information can be seen in table 1.
Table 1.Prevalence of family protein consumption
No Prevalence of family protein
consumption Number
N %
1 Low 25 41.7 2 Enough 35 61.7
100
Food consumption frequency
Family food consumption measured by food frequency method. For the differences analysis
of the average food consumption, food then grouped into six groups of food namely of cereal
grains, tubers, animal food, nuts `and processed, vegetables as well as fruit. From the data can be
analyzed the frequency and heavy food consumed in a month.The average the frequency of food
consumption on a family with the level of protein consumption that is low and enough is presented
in table 2.
Tablel 2. The average the frequency of food consumption (month)
Food Groups
Family with low consumption
(n=25)
Family with enough consumption
(n=35)
Average±Sd Average ±Sd
Rice 69.28 20.46 82.43 13.75
Noodles 16.67 13.17 17.77 16.76
Cassava 1.52 3.53 2 6.87
Tube 1.12 3.48 2.46 7.13
Potato 2.88 4.28 10.91 15.15
Meat 1.52 5.43 2.26 5.23
Chicken 12.16 22.97 10.68 14.39
egg 23.6 38.04 25 28.38
Salted fish 46.96 34.68 43.68 36.31
Fish 6.72 8.96 8.94 13.09
Oncom 10.08 7.94 13.37 16.85
Tempe 37 28.61 48.43 32.96
Tahu 25.76 25.04 36.34 31.41
Vegetables 90.84 41.78 130.08 93.99
Papaya 1.84 3.76 7.25 9.18
Banana 2.44 4.92 2.43 4.83
Melon 4 8.33 5.74 8.29
Watermelon 5.52 8.39 6 8.19
Orange 0.84 2.72 0.63 1.77
Public Health Department, Faculty of Sports Science, F1 Building, 2nd
Floor, Sekaran Campus Gunungpati, Semarang City, Central Java Province, Indonesia, 50229 Phone/ Fax. +6224 8508007
713
Based on the table 2, we see that there were differences an average on the frequency of
consumption between the family with the level of protein consumption of low and enough.The
average frequency of rice consumption in the families with the level of low protein consumption
around 69 times in a month or 2 times in a day, while in the family with the level of enough protein
consumption was 82 times in a month or about 2-3 times in a day.While the average consumption
for the noodles between the level of low and enough protein consumption have not much different,
in general they eat noodles 16 times in a month on the family with low protein consumption and 17
times a month on the family with the level of enough protein consumption.
Both on the family with the level of low and enough protein consumption is quite apparent
rarely consume tubers.The difference is very prominent in the average frequency of potato
consumption.The family with the level of enough protein consumption is quite often consume more
potato than family with the level of low protein consumption.In families with the level of enough
protein consumption, every month have potato consumed about 10-11 times, while in the family
with the level of low protein consumption only about 2-3 times.While the average frequency of
tubers and other kind consumption like cassava and yams there is no discernible difference
between the two groups of the family.
For the group of animal food consumed seen more often consumed by both families
groupare salted which consumed around 46.96 43.69 times per month respectively, it means
almost every day the family consuming salted fish.The rarest animal food consumed by both
families groupis beef.The average frequency of the consumption of beef in the familiesof low and
enough protein consumption were 1.52 and 2.26 times in a month respectively. The family with the
level of enough protein consumption is almost every month consume food of animal such as
chicken (10.69 times, eggs (25 times, fresh fish (8.94 times and salted fish (43.69 times).
In a group of nuts,oncom is the type of food that rarest consumed by both families
group.This is seen by the low frequency of oncom consumption in the average that is 10.08 and
13.37 times in a month respectively.While the average consumption of tempe and tofuin the family
with low protein consumption was around 37 times and 25 times in one month and in the family
with the level enough protein consumption was about 48 times and 36 times.
Based on table 13 above it showed that for a group of vegetables there were significant
different of the average frequency consumption in the family with the level of low and enough
protein consumption90 times and 130 times a month respectively. While for the fruits group,papaya
was more often consumed by family with the level of enough protein consumption which was 7
times a month. For the group fruits it showed that fruit was the rarestconsumed by a family with the
level of low and enough protein consumptionwas orange whish was 0.84 times and 0.63 times a
month respectively.
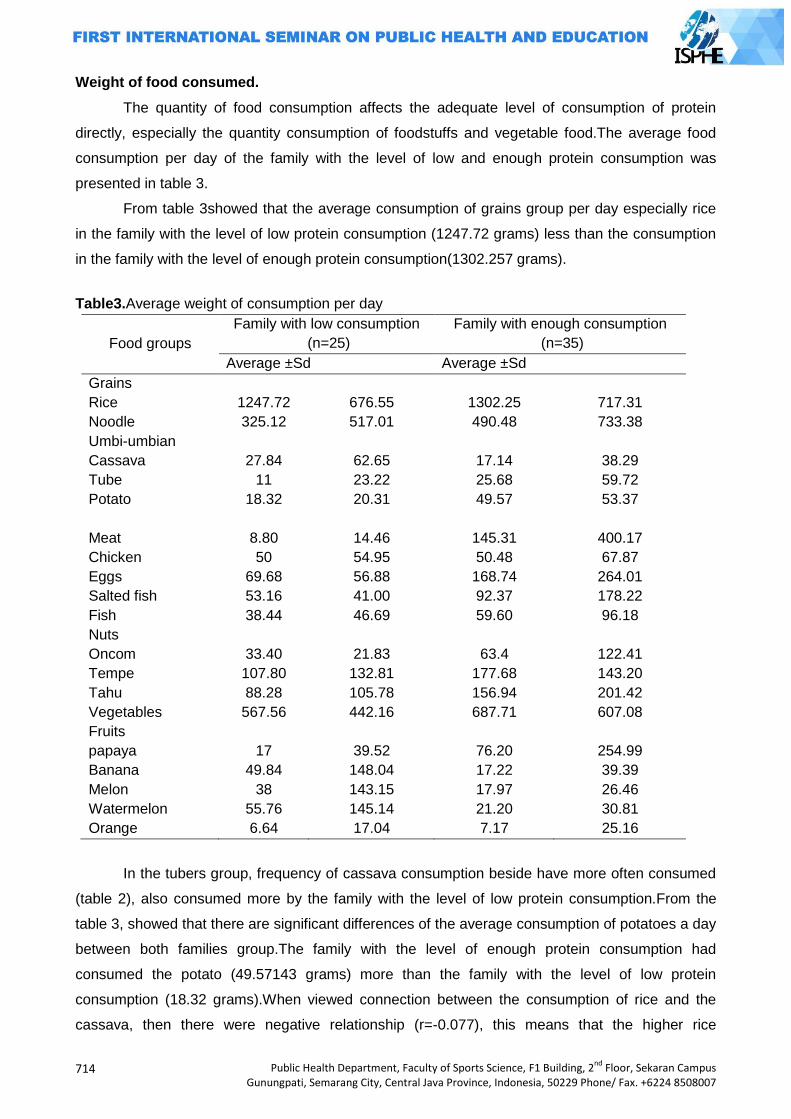
714
Public Health Department, Faculty of Sports Science, F1 Building, 2nd
Floor, Sekaran Campus Gunungpati, Semarang City, Central Java Province, Indonesia, 50229 Phone/ Fax. +6224 8508007
Weight of food consumed.
The quantity of food consumption affects the adequate level of consumption of protein
directly, especially the quantity consumption of foodstuffs and vegetable food.The average food
consumption per day of the family with the level of low and enough protein consumption was
presented in table 3.
From table 3showed that the average consumption of grains group per day especially rice
in the family with the level of low protein consumption (1247.72 grams) less than the consumption
in the family with the level of enough protein consumption(1302.257 grams).
Table3.Average weight of consumption per day
Food groups
Family with low consumption
(n=25)
Family with enough consumption
(n=35)
Average ±Sd Average ±Sd
Grains
Rice 1247.72 676.55 1302.25 717.31
Noodle 325.12 517.01 490.48 733.38
Umbi-umbian
Cassava 27.84 62.65 17.14 38.29
Tube 11 23.22 25.68 59.72
Potato 18.32 20.31 49.57 53.37
Meat 8.80 14.46 145.31 400.17
Chicken 50 54.95 50.48 67.87
Eggs 69.68 56.88 168.74 264.01
Salted fish 53.16 41.00 92.37 178.22
Fish 38.44 46.69 59.60 96.18
Nuts
Oncom 33.40 21.83 63.4 122.41
Tempe 107.80 132.81 177.68 143.20
Tahu 88.28 105.78 156.94 201.42
Vegetables 567.56 442.16 687.71 607.08
Fruits
papaya 17 39.52 76.20 254.99
Banana 49.84 148.04 17.22 39.39
Melon 38 143.15 17.97 26.46
Watermelon 55.76 145.14 21.20 30.81
Orange 6.64 17.04 7.17 25.16
In the tubers group, frequency of cassava consumption beside have more often consumed
(table 2), also consumed more by the family with the level of low protein consumption.From the
table 3, showed that there are significant differences of the average consumption of potatoes a day
between both families group.The family with the level of enough protein consumption had
consumed the potato (49.57143 grams) more than the family with the level of low protein
consumption (18.32 grams).When viewed connection between the consumption of rice and the
cassava, then there were negative relationship (r=-0.077), this means that the higher rice
Public Health Department, Faculty of Sports Science, F1 Building, 2nd
Floor, Sekaran Campus Gunungpati, Semarang City, Central Java Province, Indonesia, 50229 Phone/ Fax. +6224 8508007
715
consumption, the smaller consumption of cassava.This can also explained by the difference of
average frequency and weight of cassava consumed between both families group.Thus there is
possibly in the family with the level of low protein consumption, cassava as one of the food that
substitute rice at the time they lack of rice to be consumed.
Almost all kinds of animal food consumed by the family with the level of enough protein
consumption washigher than the family with the level of low protein consumption.Meet
consumption on the family with the level of enough protein consumption (145.3143 grams) more
than families with the level of low protein consumption (8.8 grams). The same also with egg
consumption, the family with the level of low protein consumption consumed as much as the
average 69.68 grams a day, while the family with the level of enough protein consumption had
eggs consumed as much as 168.7429 grams a day. Animal food is one of a key determinant in the
adequate level of protein consumption.For all animal foods, the average heavy animal food of
which was consumed by the family with the level of low protein consumption was smaller than the
family with the level of enough protein consumption.
In a group of nuts and the processed either on the family with the level of low and enough
protein consumption, tempe is the highestfood consumption they were 107.8 gram and 177.6857
grams respectively. Tempe consumption had no different in both families group.While for the
vegetables group revealed the balancing result between the average weights of vegetable
consumed by both families group.
The average fruits consumption per day for both families groupwere less.The average
watermelon consumption on a family with the level of low protein consumption (55.76 grams)
higher than with the family with the rate of enoughprotein consumption (21.2 grams).From table 14
showed that orange consumption was the lowest consumption in both families groups.This was
caused by the orange is the type of seasonal tropical fruit (not always available).
Discriminant analysis
Discriminant analysis used to classify the family into a group of low and enough
consumption of the proteins based on food consumption variables.Discriminant analysis was
calculated based on one variable frequency of food consumption, two variables, and 19 variables
(theoverall of food consumption frequency).
Based on the calculation using discriminant analysis one variable the frequency of food
consumption it obtained bysingle variables frequency, potato consumption is the one that can be
recommended as an indicator of protein consumption.The level of misclassification was 40% of the
families with the level of protein consumption from low to enough level and 16% of families with the
level of protein consumption from enough to low level (appendix 2).The equation discrimination of
variables frequency of potatoes was:
Y1(X) = -0.02918+0.02026 X
Y2(X) = -0.41907+0.07679 X
716
Public Health Department, Faculty of Sports Science, F1 Building, 2nd
Floor, Sekaran Campus Gunungpati, Semarang City, Central Java Province, Indonesia, 50229 Phone/ Fax. +6224 8508007
The rank of the second recommendation was single variables frequency of rice.The level of
misclassificationwas 29% of families with the level of protein consumption from low to enough level
and 36% of families with the level of protein consumption from enough to low level (appendix
2).The equation discrimination of variables frequency of rice was:
Y1(X) = -8.44631+0.24383 X
Y2(X) = -11.9567+0.29011 X
Food that became food recommendations based on the discriminant analysis were the
group of cereal grains.This may be due to the research areas were the areas with the high poverty
levels, so that there was no food found variations.Protein family needs had been met from the
consumption of foodstuff (cereal grains). As we know, the majority of community consumption of
protein obtained from food sources of carbohydrate (mainly rice).This is caused by the proportion
of a foodstuffconsumption was greater than other proportion of food consumption group especially
animal food. Data from SUSENAS(2005) showed that the composition of population food
consumed in 2005 were a group of cereal grains still dominate than other food.The group of cereal
grains in 2005 contributes as much as 61.8 % while the ideal proportion was 50% of the total
energy suggested.
Based on the analysis of two variables food frequency showedthat combination between
the frequency of consumption potatoes and vegetables were combined variables that can be
recommended as an indicator of protein consumption with discriminant function:
Y1(X)= -0.73180-0.02342 X1+0.01685 X2
F2(X)= -1.46652+0.02346 X1+0.02058 X2
The level of misclassification of the discriminant equation was 37% of the families with the
rate of protein consumption from low to enough level and 12% of the families with the rate of
protein consumption from enough to low level(appendix 3).The more variables included in the
discriminant analysis, the less value of misclassification will get.Based on combination analysis for
all variables food frequency (19 foodstuffs), it turned out that the level of misclassification obtained
17% of the families with the rate of protein consumption from low to enough level and 4% of the
families with the rate of protein consumption from enough to low (appendix 4).
Research result in the field study indicate that food recommendations was from the group
of cereal grains, this was suitable with data of SUSENAS (2005) showed that the contribution of
cereal grains was still dominate than the other food. Low of food was generally the group of food
which source from protein (either vegetable or animal) as well as vegetables and fruits were have
expensive price.
Conclusion
1. The prevalence of family with the level of low protein consumption was 41.7%.
2. The first rank of single variable frequency was can be recommended in food consumption
as an indicator of protein consumption level was potato with discriminant equation,
Public Health Department, Faculty of Sports Science, F1 Building, 2nd
Floor, Sekaran Campus Gunungpati, Semarang City, Central Java Province, Indonesia, 50229 Phone/ Fax. +6224 8508007
717
Y1(X) = -0.02918 + 0.02026 X
Y2(X) = -0.41907 + 0.07679 X
3. while the two variables frequency of food consumption was potato and vegetables, with an
discriminant equation,
Y1(X)= -0.73180 - 0.02342 X1 + 0.01685 X2
Y2(X)= -1.46652 + 0.02346 X1 + 0.02058 X2
References
Almatsier, S. 2002. Prinsip Dasar Ilmu Gizi. Gramedia Pustaka Utama, Jakarta.
__________. 2004. Penuntun Diet Edisi Baru. Gramedia Pustaka Utama, Jakarta.
Arisman. 2004. Gizi dalam Daur Kehidupan. EGC, Jakarta.
Den Hartog, Adel P. van Staveren, Wija A. dan Broower, Inge D. 1995. Manual for Social Surveys
on Food Habits and Consumpttion individu Developing Countries. Margraf Verlag,
weikersheim, Germani.
FAO. 2003. Proceedings, Measurement and Assessment of Food Devrivation and Undernutrition.
Internastional Scientific Symposium. Rome, 26-28 Juni 2002.
FAO. 2005. Indonesia Progress Reduction Hunger. Food and Agricultural Organisation.
www.fao.org.
Hardinsyah & Suhardjo. 1987. Ekonomi Gizi. Jurusan Gizi Masyarakat dan Sumberdaya
Keluarga, Fakultas Pertanian, Institut Pertanian Bogor, Bogor.
__________ & Martianto. 1988. Menaksir Kecukupan Energi dan Protein serta Penilaian Mutu
Gizi Konsumsi Pangan, diktat kuliah yang tidak dipublikasikan. Fakultas Pertanian, Institut
Pertanian Bogor, Bogor.
__________ & Martianto. 1992. Gizi Terapan. Departemen Pendidikan dan Kebudayaan,
Direktorat Jendral Pendidikan Tinggi, Pusat Antar Universitas Pangan dan Gizi, IPB, Bogor.
__________. 2002. Rencana Uji Coba Instrument Pemantauan Kelaparan. Makalah Lokakarya
Perumusan Indikator Kelaparan. Kerjasama PSKPG LP-IPB dan Proyek Koordinasi
Kelembagaan Ketahanan Pangan, BBKP Deptan. Jakarta.
Harper, L.J., B.J. Deaton, & J.A.Driskel. 1986. Pangan dan Gizi Pertanian (2nd ed.). Suhardjo,
penerjemah. UI-Press, Jakarta.
Khomsan, A. 2000. Teknik Pengukuran Pengetahuan Gizi. Jurusan Gizi Masyarakat dan
Sumberdaya Keluarga, Fakultas Pertanian, Institut Pertanian Bogor, Bogor.
Khumaidi, M. 1989. Gizi Masyarakat. Pusat Antar Universitas Pangan dan Gizi IPB Bogor.
Rejeki, A.S. 2000. Kebiasaan Makan Sayuran pada Remaja Putri di Perkotaan (SMU Suluh dan
Al-Azhar). Skripsi Sarjana Departemen Gizi Masyarakat dan Sumberdaya Keluarga,
Fakultas Pertanian, IPB, Bogor.
Singarimbun, M. & S.Effendi. 1989. Metode Penelitian Survei. Pusaka LP3ES, Jakarta.
718
Public Health Department, Faculty of Sports Science, F1 Building, 2nd
Floor, Sekaran Campus Gunungpati, Semarang City, Central Java Province, Indonesia, 50229 Phone/ Fax. +6224 8508007
Soekirman. 2000. Ilmu Gizi dan Aplikasinya untuk Keluarga dan Masyarakat. Departemen
Pendidikan Nasional, Direktorat Jendral Pendidikan Tinggi, Bogor.
_________. 2002. Komitmen Penanggulangan dan Masalah Konsep Kelaparan. Makalah
Lokakarya Perumusan Indikator Kelaparan. Kerjasama PSKPG
Suhardjo. 1989. Sosio Budaya Gizi. Pusat Antar Universitas Pangan dan Gizi IPB, Bogor.
Suhardjo dan Riyadi, H. 1990. Departemen Pendidikan dan Kebudayaan, Direktorat Jenderal
Pendidikan Tinggi, Pusat Antar Universitas Pangan dan Gizi , Institut Pertanian Bogor.
Bogor.
Suhartiningsih, W. 2005. Busung lapar dan hunger paradox. www.tonangardyanto.com
_________ 2005. Bom Waktu Kelaparan Tersembunyi. http://www.pikiran rakyat.com
Supriasa, I.D.N., Bakri, B., Fajar, I. 2001. Penilaian Status Gizi. Penerbit Buku Kedokteran EGC.
Jakarta.
Suratnih, R. 1995. Penyelenggaraan Makanan dan Tingkat Konsumsi Energi dan Zat Gizi Santri
dan Santriat di Pesantren Darut-Tafsir Bogor. Skripsi Jurusan Gizi Masyarakat dan
Sumberdaya Keluarga. Fakultas Pertanian. Institut Pertanian Bogor. Bogor.
Suryana, A. 2002. Aliansi Internasional Mengikis Kelaparan.
www.deptan.go.id/HomePageBBKP/world_food_summit.htm.
Tanziha, I. 2005. Analisis Peubah Konsumsi Pangan Dan Sosial Ekonomi Rumahtangga Untuk
Menentukan Determinan Dan Indikator Kelaparan. Disertasi yang tidak dipublikasikan.
Program Pascasarjana Institut Pertanian Bogor.
Webb, P., Coates, J. And Houser, R. 2002. callenges in defining direct measures of hunger and
food insecurity in Bangladesh: findings from on going fieldwork. Dalam Proceeding,
Measurement and Assessment of Food Derivation and Undernutrition. International
Scientific Symposium. Rome, 26-28 Juni 2002.
Public Health Department, Faculty of Sports Science, F1 Building, 2nd
Floor, Sekaran Campus Gunungpati, Semarang City, Central Java Province, Indonesia, 50229 Phone/ Fax. +6224 8508007
719
THE RELATION BETWEEN THE DURATION OF IUD USED WITH THE INFECTION RATE IN
THE IUD ACCEPTORS POST-USED IN 6 MONTHS – 5 YEARS IN JEKULO SUBDISTRICT,
KUDUS DISTRICT
Atun Wigati1, Dewi Hartinah1, Candra Dewi2
1. Public Health Post Graduate Program, Semarang State University, Indonesia 2. STIKES Muhammadiyah Kudus, Indonesia
Corresponding Author: [email protected]
Abstract
Introduction: the IUD is an intrauterine device made of a soft plastic material helical or other form
that is placed in the uterus. IUDs have a high effectiveness. Very effective 0.6-0.8 pregnancies per
100 women in the 1st year, but IUD also can lead to infection because of the length of the use of
contraceptives. The purpose of this study was to determine the relationship between duration of
use IUD with the rate of infection in post-installation IUD acceptors 6 months - 5 years in the district
of Kudus Regency Jekulo 2012.
Method: The study is an analytic correlation with cross sectional approach. The data collected is
primary and secondary data. The sample in this study were 47 people from the population with
total sampling technique. Analysis of the data used univariate and bivariate analysis using
statistical tests kendall tau.
Results: Respondents who use IUD for 3-5 years as many as 18 (38.3%) and respondents who
experienced severe infections by 20 (42.6%). Kendall tau statistical test results, obtained no
relationship between duration of use IUD with the rate of infection in post-installation IUD acceptors
6 months - 5 years in the district of Kudus Regency Jekulo (p value: 0.001 <0.05) with a value of
0,751 kendall tau. The strength of the relationship is strong.
Keywords: Duration of use IUD, infection, IUD
Introduction
Problems encountered in the field of population, in Indonesia is a large population with
relative population growth rate is still high, uneven population distribution, the young age structure,
population quality is kept still on the increase (Saifuddin, 2006).
Indonesia has some problems among the population at large is the population with the
population growth rate is still The goverment continued to depress the rate of population growth
through family planning program (KB), because if it does not increase the FP, Indonesia's
population will experience tremendous explosion. Later Indonesia will increasingly crowded by
humans (Prawirohardjo, 2007 ).
In Indonesia modern family planning began in the know in 1957. Definition of family planning
according to Law No. 1 of 2008 (concerning the purpose of family planning) is a small family
embodies a happy prosperous through birth control and population growth in Indonesia (Hartanto,
2004).
720
Public Health Department, Faculty of Sports Science, F1 Building, 2nd
Floor, Sekaran Campus Gunungpati, Semarang City, Central Java Province, Indonesia, 50229 Phone/ Fax. +6224 8508007
The threat of a population explosion in Indonesia increasingly evident. This was seen in the
past 10 years, the population in Indonesia increased by 32.5 million from 205.1 million in 2000 to
237.6 million in 2010 (BKKBN, 2010). It is estimated that the population of Indonesia in 2015
reached 255.5 million (Yashinta, 2009). Therefore the Government continues its efforts to reduce
the rate of growth with the Family Planning (KB).
Many women have difficulty in determining the choice of contraception. Various factors must
be considered, including potential adverse health effects, the consequences of failure or unwanted
pregnancies, planned a big family and partner approval (Saifuddin, 2006).
Until now has not been available a method of contraception that absolutely 100% ideal or
perfect. Experience shows that the current selection of contraceptive methods are still largely in the
form of a cafeteria or a supermarket where a candidate acceptor choose a contraceptive method
that is in want it (Hartanto, 2004).
According to the Indonesian Demographic and Health Survey (IDHS) in 2008 to 2009 the
number of participants totaled more than 20,000 family planning acceptors of WUS they use active
family planning is 60,50% syringes, pills 18%, 44%, IUD (Intra Uterine Devices) 10 %, 9.5%
implants, MOP / MOW (Medical Operative Men's / Women's Medical Operative) 7.11%, condoms
1, 52%.
Based on BKKBN Central Java, the number of new acceptors in IUD acceptors 59 702, 18
290 acceptors MOW, MOP acceptor 3925, 52 228 condoms acceptor, 89436 Implant acceptor,
acceptor 579 761 injections, pills acceptor 194 083 (BKKBN Semarang, 2010).
Based on data from the Head of the Agency for Community Empowerment, Women and
Family Planning (BPMKB) Holy District, Rachmat Budi accompanied by the Head of KB, Adi
Susmoyo explained, the number of family planning acceptors in the district of Kudus until February
2011 has reached 136 623 participants. Most birth control contraceptives is still dominated by
injecting, namely 65 265 participants (58.04%), the pill as many as 22 444 participants (20.80 %),
The rest is divided IUD 6921 participants (6.42 %), MOW 2335 participants (2,16 %), MOP 1,291
participants (1.20 %), 1,329 condoms participants (1.23 %) And implant 8229 participants (7.69 %)
(BPMKB, 2011).
Complications due to the use of contraceptives ranging from mild to severe include: nausea,
vomiting, dizziness, splotches of blood between menstrual periods, fungal infection around the
genitals, cramping and pain during menstruation and bleeding are quite serious (Manuaba , 1998).
Based on BKKBN (2009), the rate of severe complications as a result of contraceptive use
among women in Indonesia is high such as the use of IUDs in Central Java with 165 acceptors
complication rate (60%), as well as implant in Aceh about 115 acceptors (88.46 %) had
complications. In North Sumatra, the rate of complications from IUD acceptors were 12 (42.86%),
MOW 3 acceptor (10%), 13 implant acceptors (46.43%), and injecting 18 acceptors (64.29%),
while the MOP is not there are experiencing severe complications.
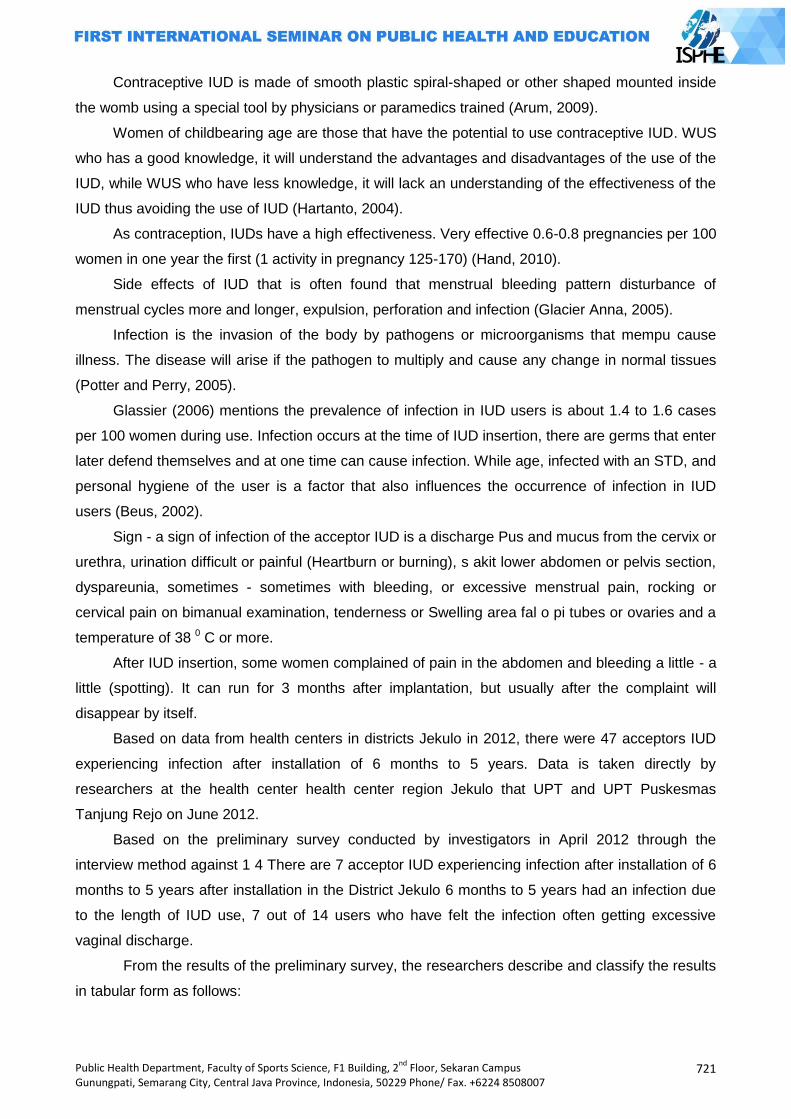
Public Health Department, Faculty of Sports Science, F1 Building, 2nd
Floor, Sekaran Campus Gunungpati, Semarang City, Central Java Province, Indonesia, 50229 Phone/ Fax. +6224 8508007
721
Contraceptive IUD is made of smooth plastic spiral-shaped or other shaped mounted inside
the womb using a special tool by physicians or paramedics trained (Arum, 2009).
Women of childbearing age are those that have the potential to use contraceptive IUD. WUS
who has a good knowledge, it will understand the advantages and disadvantages of the use of the
IUD, while WUS who have less knowledge, it will lack an understanding of the effectiveness of the
IUD thus avoiding the use of IUD (Hartanto, 2004).
As contraception, IUDs have a high effectiveness. Very effective 0.6-0.8 pregnancies per 100
women in one year the first (1 activity in pregnancy 125-170) (Hand, 2010).
Side effects of IUD that is often found that menstrual bleeding pattern disturbance of
menstrual cycles more and longer, expulsion, perforation and infection (Glacier Anna, 2005).
Infection is the invasion of the body by pathogens or microorganisms that mempu cause
illness. The disease will arise if the pathogen to multiply and cause any change in normal tissues
(Potter and Perry, 2005).
Glassier (2006) mentions the prevalence of infection in IUD users is about 1.4 to 1.6 cases
per 100 women during use. Infection occurs at the time of IUD insertion, there are germs that enter
later defend themselves and at one time can cause infection. While age, infected with an STD, and
personal hygiene of the user is a factor that also influences the occurrence of infection in IUD
users (Beus, 2002).
Sign - a sign of infection of the acceptor IUD is a discharge Pus and mucus from the cervix or
urethra, urination difficult or painful (Heartburn or burning), s akit lower abdomen or pelvis section,
dyspareunia, sometimes - sometimes with bleeding, or excessive menstrual pain, rocking or
cervical pain on bimanual examination, tenderness or Swelling area fal o pi tubes or ovaries and a
temperature of 38 0 C or more.
After IUD insertion, some women complained of pain in the abdomen and bleeding a little - a
little (spotting). It can run for 3 months after implantation, but usually after the complaint will
disappear by itself.
Based on data from health centers in districts Jekulo in 2012, there were 47 acceptors IUD
experiencing infection after installation of 6 months to 5 years. Data is taken directly by
researchers at the health center health center region Jekulo that UPT and UPT Puskesmas
Tanjung Rejo on June 2012.
Based on the preliminary survey conducted by investigators in April 2012 through the
interview method against 1 4 There are 7 acceptor IUD experiencing infection after installation of 6
months to 5 years after installation in the District Jekulo 6 months to 5 years had an infection due
to the length of IUD use, 7 out of 14 users who have felt the infection often getting excessive
vaginal discharge.
From the results of the preliminary survey, the researchers describe and classify the results
in tabular form as follows:
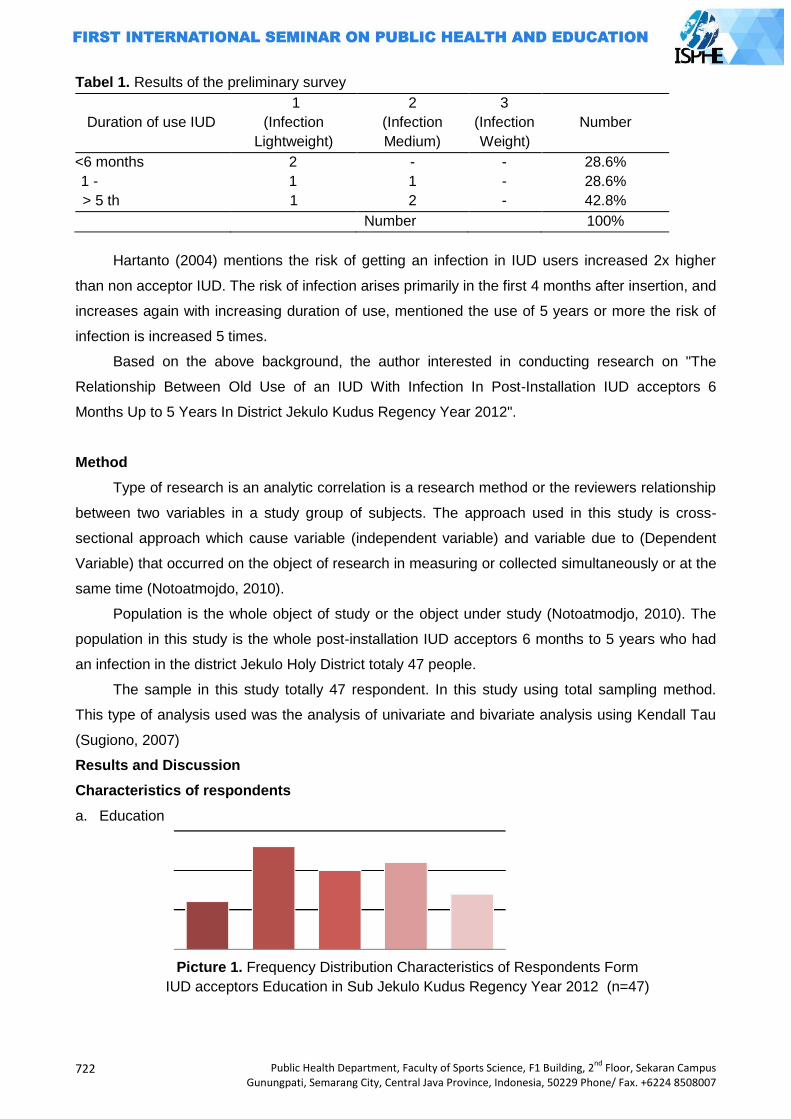
722
Public Health Department, Faculty of Sports Science, F1 Building, 2nd
Floor, Sekaran Campus Gunungpati, Semarang City, Central Java Province, Indonesia, 50229 Phone/ Fax. +6224 8508007
Tabel 1. Results of the preliminary survey
Duration of use IUD
1
(Infection
Lightweight)
2
(Infection
Medium)
3
(Infection
Weight)
Number
<6 months 2 - - 28.6%
1 - 1 1 - 28.6%
> 5 th 1 2 - 42.8%
Number 100%
Hartanto (2004) mentions the risk of getting an infection in IUD users increased 2x higher
than non acceptor IUD. The risk of infection arises primarily in the first 4 months after insertion, and
increases again with increasing duration of use, mentioned the use of 5 years or more the risk of
infection is increased 5 times.
Based on the above background, the author interested in conducting research on "The
Relationship Between Old Use of an IUD With Infection In Post-Installation IUD acceptors 6
Months Up to 5 Years In District Jekulo Kudus Regency Year 2012".
Method
Type of research is an analytic correlation is a research method or the reviewers relationship
between two variables in a study group of subjects. The approach used in this study is cross-
sectional approach which cause variable (independent variable) and variable due to (Dependent
Variable) that occurred on the object of research in measuring or collected simultaneously or at the
same time (Notoatmojdo, 2010).
Population is the whole object of study or the object under study (Notoatmodjo, 2010). The
population in this study is the whole post-installation IUD acceptors 6 months to 5 years who had
an infection in the district Jekulo Holy District totaly 47 people.
The sample in this study totally 47 respondent. In this study using total sampling method.
This type of analysis used was the analysis of univariate and bivariate analysis using Kendall Tau
(Sugiono, 2007)
Results and Discussion
Characteristics of respondents
a. Education
Picture 1. Frequency Distribution Characteristics of Respondents Form
IUD acceptors Education in Sub Jekulo Kudus Regency Year 2012 (n=47)
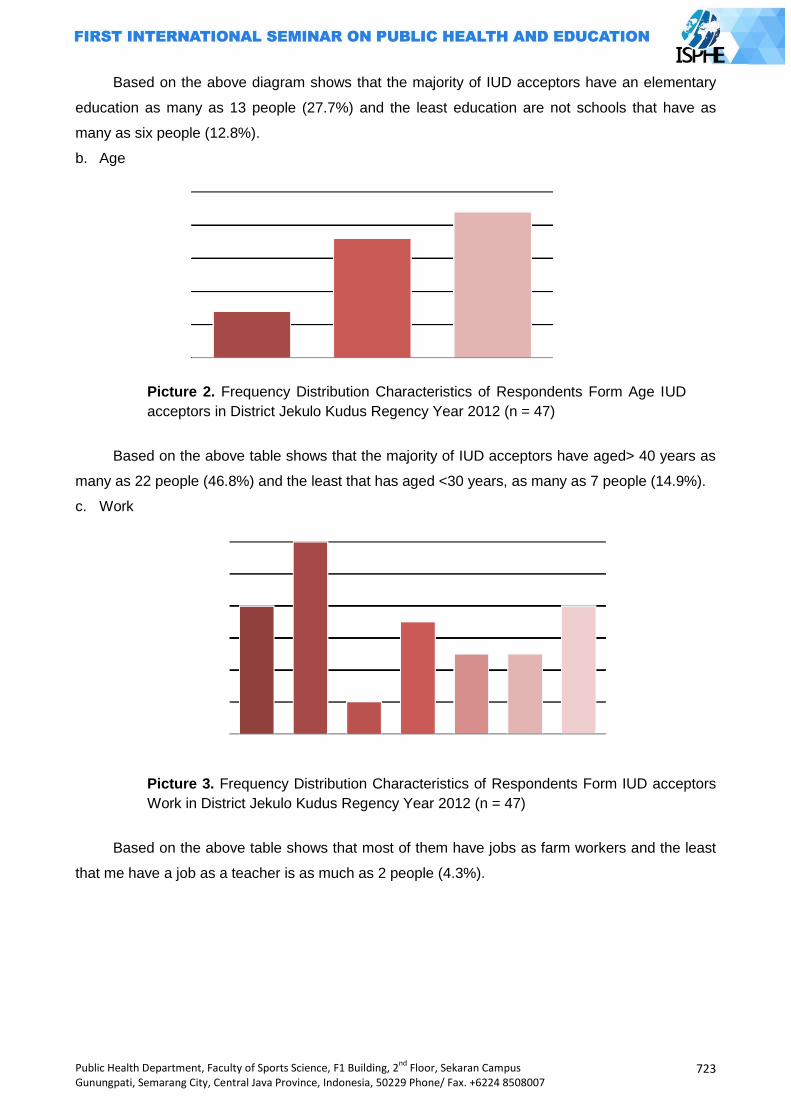
Public Health Department, Faculty of Sports Science, F1 Building, 2nd
Floor, Sekaran Campus Gunungpati, Semarang City, Central Java Province, Indonesia, 50229 Phone/ Fax. +6224 8508007
723
Based on the above diagram shows that the majority of IUD acceptors have an elementary
education as many as 13 people (27.7%) and the least education are not schools that have as
many as six people (12.8%).
b. Age
Picture 2. Frequency Distribution Characteristics of Respondents Form Age IUD
acceptors in District Jekulo Kudus Regency Year 2012 (n = 47)
Based on the above table shows that the majority of IUD acceptors have aged> 40 years as
many as 22 people (46.8%) and the least that has aged <30 years, as many as 7 people (14.9%).
c. Work
Picture 3. Frequency Distribution Characteristics of Respondents Form IUD acceptors
Work in District Jekulo Kudus Regency Year 2012 (n = 47)
Based on the above table shows that most of them have jobs as farm workers and the least
that me have a job as a teacher is as much as 2 people (4.3%).
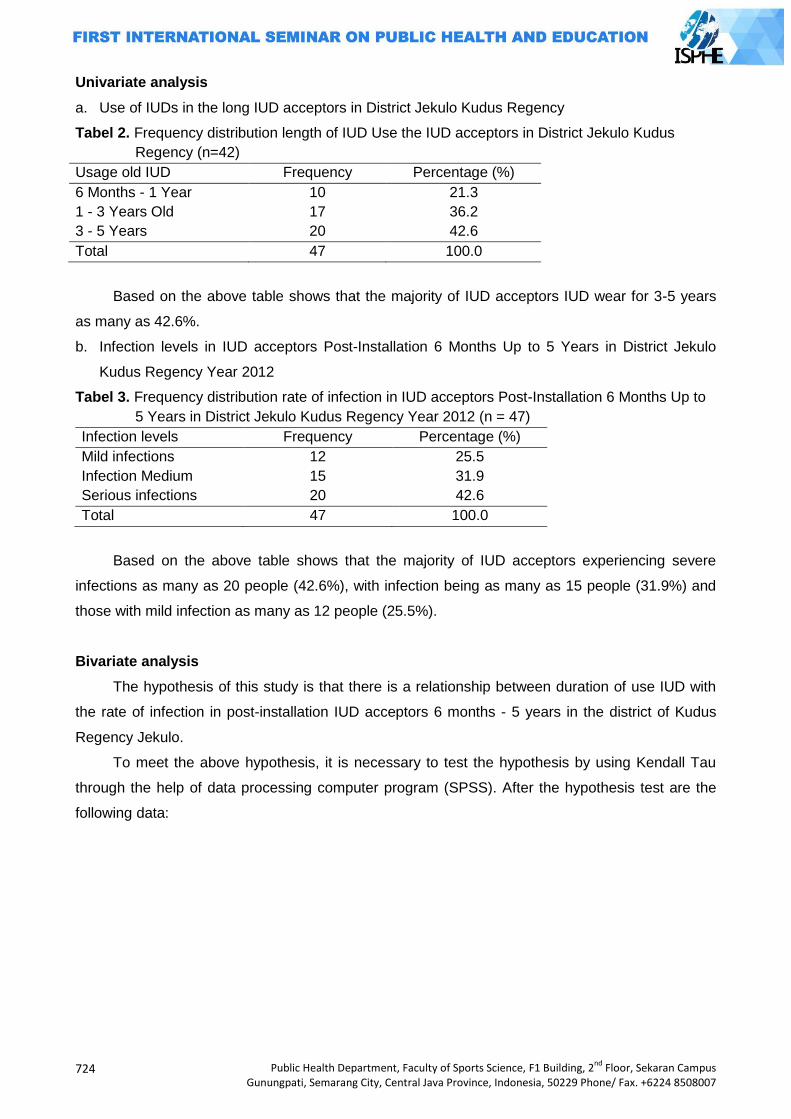
724
Public Health Department, Faculty of Sports Science, F1 Building, 2nd
Floor, Sekaran Campus Gunungpati, Semarang City, Central Java Province, Indonesia, 50229 Phone/ Fax. +6224 8508007
Univariate analysis
a. Use of IUDs in the long IUD acceptors in District Jekulo Kudus Regency
Tabel 2. Frequency distribution length of IUD Use the IUD acceptors in District Jekulo Kudus
Regency (n=42)
Usage old IUD Frequency Percentage (%)
6 Months - 1 Year 10 21.3
1 - 3 Years Old 17 36.2
3 - 5 Years 20 42.6
Total 47 100.0
Based on the above table shows that the majority of IUD acceptors IUD wear for 3-5 years
as many as 42.6%.
b. Infection levels in IUD acceptors Post-Installation 6 Months Up to 5 Years in District Jekulo
Kudus Regency Year 2012
Tabel 3. Frequency distribution rate of infection in IUD acceptors Post-Installation 6 Months Up to
5 Years in District Jekulo Kudus Regency Year 2012 (n = 47)
Infection levels Frequency Percentage (%)
Mild infections 12 25.5
Infection Medium 15 31.9
Serious infections 20 42.6
Total 47 100.0
Based on the above table shows that the majority of IUD acceptors experiencing severe
infections as many as 20 people (42.6%), with infection being as many as 15 people (31.9%) and
those with mild infection as many as 12 people (25.5%).
Bivariate analysis
The hypothesis of this study is that there is a relationship between duration of use IUD with
the rate of infection in post-installation IUD acceptors 6 months - 5 years in the district of Kudus
Regency Jekulo.
To meet the above hypothesis, it is necessary to test the hypothesis by using Kendall Tau
through the help of data processing computer program (SPSS). After the hypothesis test are the
following data:
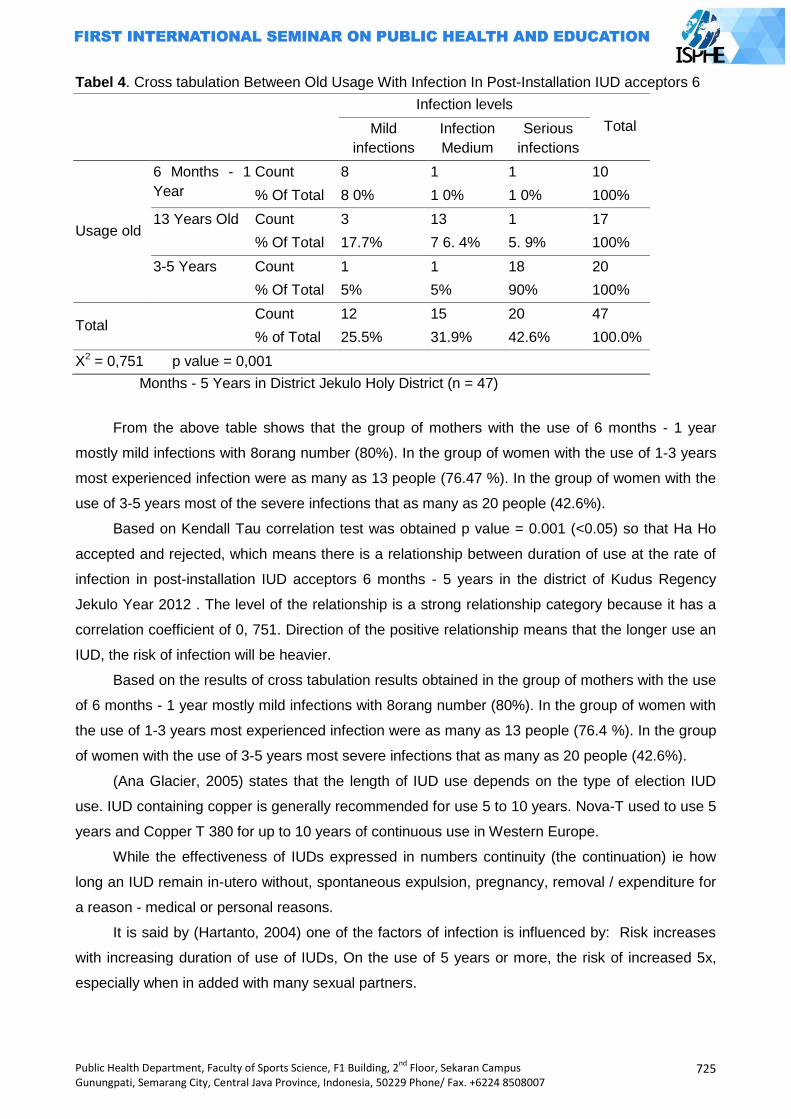
Public Health Department, Faculty of Sports Science, F1 Building, 2nd
Floor, Sekaran Campus Gunungpati, Semarang City, Central Java Province, Indonesia, 50229 Phone/ Fax. +6224 8508007
725
Tabel 4. Cross tabulation Between Old Usage With Infection In Post-Installation IUD acceptors 6
Infection levels
Total Mild
infections
Infection
Medium
Serious
infections
Usage old
6 Months - 1
Year
Count 8 1 1 10
% Of Total 8 0% 1 0% 1 0% 100%
13 Years Old Count 3 13 1 17
% Of Total 17.7% 7 6. 4% 5. 9% 100%
3-5 Years Count 1 1 18 20
% Of Total 5% 5% 90% 100%
Total Count 12 15 20 47
% of Total 25.5% 31.9% 42.6% 100.0%
X2 = 0,751 p value = 0,001
Months - 5 Years in District Jekulo Holy District (n = 47)
From the above table shows that the group of mothers with the use of 6 months - 1 year
mostly mild infections with 8orang number (80%). In the group of women with the use of 1-3 years
most experienced infection were as many as 13 people (76.47 %). In the group of women with the
use of 3-5 years most of the severe infections that as many as 20 people (42.6%).
Based on Kendall Tau correlation test was obtained p value = 0.001 (<0.05) so that Ha Ho
accepted and rejected, which means there is a relationship between duration of use at the rate of
infection in post-installation IUD acceptors 6 months - 5 years in the district of Kudus Regency
Jekulo Year 2012 . The level of the relationship is a strong relationship category because it has a
correlation coefficient of 0, 751. Direction of the positive relationship means that the longer use an
IUD, the risk of infection will be heavier.
Based on the results of cross tabulation results obtained in the group of mothers with the use
of 6 months - 1 year mostly mild infections with 8orang number (80%). In the group of women with
the use of 1-3 years most experienced infection were as many as 13 people (76.4 %). In the group
of women with the use of 3-5 years most severe infections that as many as 20 people (42.6%).
(Ana Glacier, 2005) states that the length of IUD use depends on the type of election IUD
use. IUD containing copper is generally recommended for use 5 to 10 years. Nova-T used to use 5
years and Copper T 380 for up to 10 years of continuous use in Western Europe.
While the effectiveness of IUDs expressed in numbers continuity (the continuation) ie how
long an IUD remain in-utero without, spontaneous expulsion, pregnancy, removal / expenditure for
a reason - medical or personal reasons.
It is said by (Hartanto, 2004) one of the factors of infection is influenced by: Risk increases
with increasing duration of use of IUDs, On the use of 5 years or more, the risk of increased 5x,
especially when in added with many sexual partners.
726
Public Health Department, Faculty of Sports Science, F1 Building, 2nd
Floor, Sekaran Campus Gunungpati, Semarang City, Central Java Province, Indonesia, 50229 Phone/ Fax. +6224 8508007
It states that the long use of IUD may affect the occurrence of infections. Reinforced with the
theory of (Hartanto, 2004) that increasingly duration of use, mentioned the use of 5 years or more
the risk of infection will increase 5 times higher.
Based on Kendall Tau correlation test was obtained p value = 0.001 (<0.05) so that Ha Ho
accepted and rejected, which means there is a relationship between duration of use at the rate of
infection in post-installation IUD acceptors 6 months - 5 years in the district of Kudus Regency
Jekulo Year 2012 . The level of the relationship is a strong relationship category because it has a
correlation coefficient of 0.751. Direction of the positive relationship means that the longer use an
IUD, the risk of infection will be heavier.
The results are consistent with the theory that the risk of getting an infection in IUD users
increased 2x higher than non acceptor IUD. The risk of infection arises primarily in the first 4
months after insertion, and increases again with increasing duration of use, mentioned the use of 5
years or more the risk of infection is increased 5 times (Hartanto, 2004).
References
Arikunto, Suharsini. 2010. Prosedur Penelitien Suatu Pendekatan Praktek, Ed. Revisi V. Rineka
Cipta, Jakarta.
Arum, Dyah Noviwati Setya. 2009. Panduan Lengkap Pelayana KB Terkini. Buku Kesehatan:
Jakarta.
BKKBN. 2009. Angka Pemakaian Akseptor Kb. Jakarta: BKKBN.
Bkkbn, (2011). Data Statistik Kb Kabupaten Kudus Tahun 2011.
Glasier, A. (2005). Keluarga Berencana Dan Kesehatan Reproduksi. Jakarta: EGC.
Handayani. S, (2010). Buku Ajar Keluarga Berencana, Jakart: Pustaka Rihana
Hartanto, Hanafi.2004. Keluarga Berencana Dan Kontrasepsi. Jakarta: Pustaka Sinar Harapan.
Hidayat. 2008. Riset Keperawatan Dan Teknik Kpenulisan Ilmiah. Jakarta: Salemba Medika.
Manuaba, Ibg. 2010. Ilmu Kebidanan,Penyakit Kandungan Dan Keluarga Berencana Untuk
Pendidikan Bidan. Jakarta: Buku Kedokteran EGC.
Notoatmjdo, S. 2005. Metodelogi Penelitian Kesehatan. Jakarta: Pt Rineka Cipta
Notoatmojdo, S. 2010. Metodelogi penelitian Kesehatan. Jakarta: Pt Rineka Cipta.
Nursalam. 2008. Kosep Dan Penerapan Metodelogi Penelitian Ilmu Keperawatan.
Prawiroharjo. Sarwono. 2007. Ilmu Kebidana. YBPSP. Jakarta.
Saryono dan Setiawan, A. 2010. Metodelogi Penelitian kebidana D III, DIV, S1, dan S2. Nuha
Medika: Yogyakarta.
Saryono. 2011. Metodologi Penelitian Kesehatan. Jogjakarta: Mitra Cendikia Press.
Saifudin, Abdul Bari. 2003. Buku Panduan Praktis Pelayanan Kontrasepsi:Sarwono
Sugiyono. 2010. Metode Penelitian Kuantitatif dan Kualitatif. Bandunmg: CV Alpa Beta
Public Health Department, Faculty of Sports Science, F1 Building, 2nd
Floor, Sekaran Campus Gunungpati, Semarang City, Central Java Province, Indonesia, 50229 Phone/ Fax. +6224 8508007
727
RELATIONSHIP BETWEEN ANEMIA IN PREGNANCY WITH LOW BIRTH WEIGHT
INFANTSINDr MOEWARDI HOSPITAL
Citra Resmi Lestariana Putri1, Ag Kirwanto2, Sri Wahyuni2
1. Public Health Postgraduate Program, Semarang State University, Indonesia 2. Department of Midwivery in Health Polytechnic of Surakarta, Indonesia
Corresponding Author: [email protected]
Abstract
Introduction: Infant Mortality by SDKI 2007 to 34 per 1,000 live births. All of this approximately 2-
27% of perinatal deaths arecaused by birth weight of infants born less than 2500 grams (LBW).
Results of a preliminary survey in Dr Moewardi hospital obtained some 24 infants weighing less
than 2500 grams birth mothers anemia. This study aims to determine is there a relationship
between anemia in pregnancy with the birth of LBW.
Method: This type of research is analytic observational with case control approach. The population
in this study are all mothers delivered at the Dr Moewardi hospital in January 2012 - June 2012
that a number of 1688 cases. Samples were taken using the formula Lemeshow 1997 with Simple
Random Sampling technique in 78 cases and systematic random sampling in 78 control group.
Results: Results showed that 150 cases of low birth weight standard sample obtained as many as
78 cases based on minimal sample calculation formula (Lemeshow, 1997). Then from a large
sample obtained 54 cases (69.2%) mothers who have given birth LBW history of anemia. While
pregnant women who gave birth without a history of anemia LBW were 24 cases (30.8%). In the
control sample result that mothers who have a history of anemia given birth to babies of normal
birth weight by 37 cases (37.4%). While pregnant women who gave birth without a history of
anemia BBLN by 41 cases (52.6%). In the bivariate analysis with chi square result that there is a
relationship between anemia in pregnancy with the birth of LBW with p value = 0.006, OR = 2.493.
This means that anemia in pregnancy is associated with birth weight babies of low birth weight
Keywords: anemia, low birth weight infants
Introduction
Low birth weight (LBW) infant is a newborn whose weight at birth of less than 2500 grams
(up to 2499 grams). LBW can occur if a result of prematurity (preterm labor or premature) infants or
small delivery gestational age (Manuaba, 2007).
Infant Mortality Rate (IMR) in Indonesia is still relatively high. Infant Mortality Rate by SDKI
2007 to 34 per 1,000 live births. Throughout the perinatal mortality of about 2-27% due to the birth
of low birth weight (LBW). The number of births nationally LBW was 11.5% (Riskesdas 2007) while
the percentage of infants with low birth weight in Central Java province in 2008 amounted to 1.74%
(Central Java Health Office, 2008).
One of the causes of low birth weight is a pregnancy with anemia. Most of anemia is often
found in pregnant women are iron-deficiency anemia, which means empty anemia resulting from
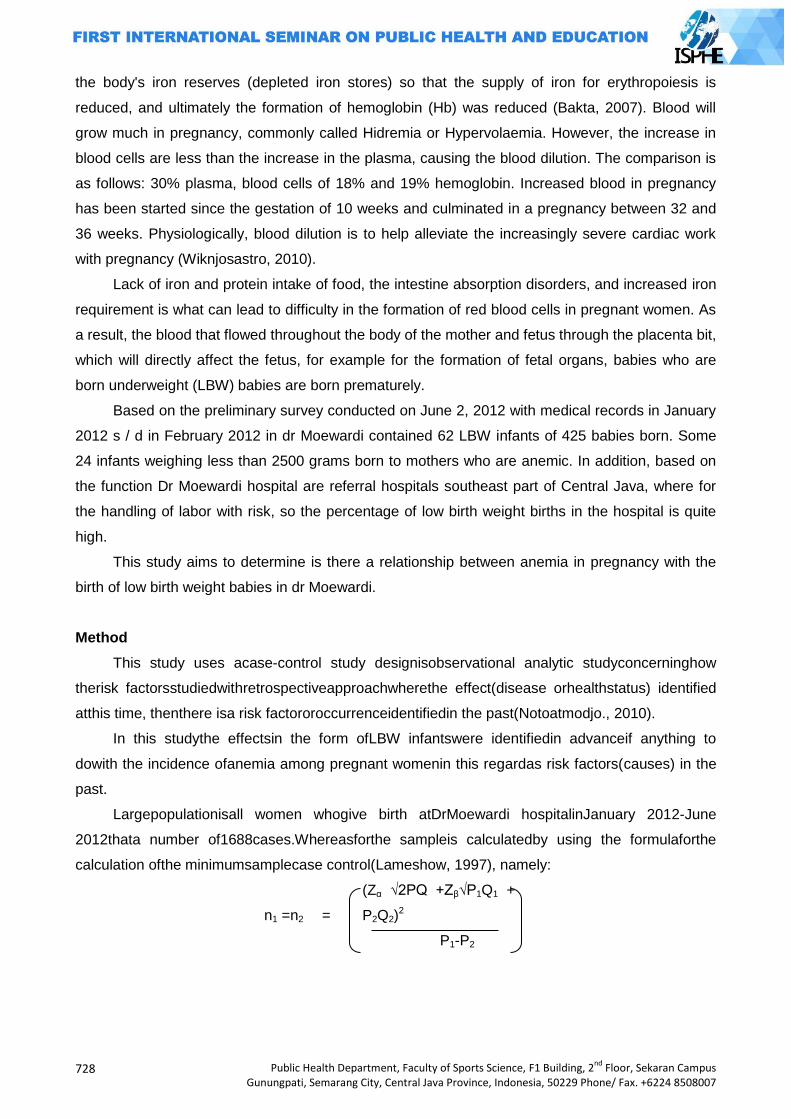
728
Public Health Department, Faculty of Sports Science, F1 Building, 2nd
Floor, Sekaran Campus Gunungpati, Semarang City, Central Java Province, Indonesia, 50229 Phone/ Fax. +6224 8508007
the body's iron reserves (depleted iron stores) so that the supply of iron for erythropoiesis is
reduced, and ultimately the formation of hemoglobin (Hb) was reduced (Bakta, 2007). Blood will
grow much in pregnancy, commonly called Hidremia or Hypervolaemia. However, the increase in
blood cells are less than the increase in the plasma, causing the blood dilution. The comparison is
as follows: 30% plasma, blood cells of 18% and 19% hemoglobin. Increased blood in pregnancy
has been started since the gestation of 10 weeks and culminated in a pregnancy between 32 and
36 weeks. Physiologically, blood dilution is to help alleviate the increasingly severe cardiac work
with pregnancy (Wiknjosastro, 2010).
Lack of iron and protein intake of food, the intestine absorption disorders, and increased iron
requirement is what can lead to difficulty in the formation of red blood cells in pregnant women. As
a result, the blood that flowed throughout the body of the mother and fetus through the placenta bit,
which will directly affect the fetus, for example for the formation of fetal organs, babies who are
born underweight (LBW) babies are born prematurely.
Based on the preliminary survey conducted on June 2, 2012 with medical records in January
2012 s / d in February 2012 in dr Moewardi contained 62 LBW infants of 425 babies born. Some
24 infants weighing less than 2500 grams born to mothers who are anemic. In addition, based on
the function Dr Moewardi hospital are referral hospitals southeast part of Central Java, where for
the handling of labor with risk, so the percentage of low birth weight births in the hospital is quite
high.
This study aims to determine is there a relationship between anemia in pregnancy with the
birth of low birth weight babies in dr Moewardi.
Method
This study uses acase-control study designisobservational analytic studyconcerninghow
therisk factorsstudiedwithretrospectiveapproachwherethe effect(disease orhealthstatus) identified
atthis time, thenthere isa risk factororoccurrenceidentifiedin the past(Notoatmodjo., 2010).
In this studythe effectsin the form ofLBW infantswere identifiedin advanceif anything to
dowith the incidence ofanemia among pregnant womenin this regardas risk factors(causes) in the
past.
Largepopulationisall women whogive birth atDrMoewardi hospitalinJanuary 2012-June
2012thata number of1688cases.Whereasforthe sampleis calculatedby using the formulaforthe
calculation ofthe minimumsamplecase control(Lameshow, 1997), namely:
n1 =n2
=
(Zα √2PQ +Zβ√P1Q1 +
P2Q2)2
P1-P2
Public Health Department, Faculty of Sports Science, F1 Building, 2nd
Floor, Sekaran Campus Gunungpati, Semarang City, Central Java Province, Indonesia, 50229 Phone/ Fax. +6224 8508007
729
The calculation of the minimum number of samples that must be met in each case and
control groups of 78. As much as 78 groups of cases (newborns with body weight <2500 grams)
and 78 samples for the control group (newborns with body weight ≥ 2500 grams ).
Sampling for the group of cases is done by simple random sampling technique that is making
members of the sample population was randomly without regard to strata that exist in this
population (Sugiyono, 2009). Of the 150 cases of LBW will be taken as many as 78 cases with
cointoss lottery system. As for the control group sample sample technique used is systematic
random sampling is the first individual who is chosen at random, while the next individual elected
according to the rules set (Watik, 2001). In this study, which acts as a control is a baby who has a
birth weight ≥ 2500 grams ie 1538 cases will be drawn at random by multiples of 5 for 78 cases.
The first step of data collection is a writer looking for data about maternal from January 2012
- June 2012 in the medical records of Dr. Moewardi hospital, then the author of separating data
between mothers who gave birth to low birth weight and the mother who gave birth to a normal
baby. After getting the mother of data research sample, then the data is included in the worksheet
list of research. The data required include medica record‟s number, mother's name (initials),
hemoglobin level, birth weight.
The independent variable in this research that anemia in pregnancy. Is defined as a situation
where maternal hemoglobin level <11 g%, Hb ≥ 11 g% for non-anemic (normal). Hb Sysmex used
to measure this variable. The birth of low birth weight baby is defined as a newborn whose weight
when the first time after birth weighed less than 2500 grams using scales.
Univariate analysis presented in the form of a frequency distribution table and the percentage
of each variable. Bivariate analysis using Chi-square. Odds Ratio can determine the size of the
strength of the relationship between the independent variable and dependent.
Results and Discussion
To describethe frequency distributionof eachindependent variableand the dependent
variableusedunivariateandcan be seenasfollows:
1. Distribution ofAnemiaPregnancy
Table 1. Distribution Anemiain Pregnancy Maternity Dr.Moewardi hospital
NO Anemia in Pregnancy
total %
1. Non-anemia 65 41,7 2. Mild anemia 78 50 3. Moderate anemia 10 6,4 4. Severe anemia 3 1,9
Total 156 100
Based on the tableabove showsthatmostcases ofanemiainpregnant womenDrMoewardi
hospital thatmildanemia(Hb 9 to 10.9%) as many as78 people(50%), while thenon-anemicas many
as65 people(41.7%).
730
Public Health Department, Faculty of Sports Science, F1 Building, 2nd
Floor, Sekaran Campus Gunungpati, Semarang City, Central Java Province, Indonesia, 50229 Phone/ Fax. +6224 8508007
2. Distribution ofBirth Weight
Toview thedistributionof weightbabies borninDrMoewardi hospitalcan be seen inthe table below:
Table 2DistributionWeightBabiesborninDrMoewardi hospital
No Birth weight total %
1. BBLR (<2500 gram) 78 50 2. BBLN (≥2500 gram) 78 50
Total 156 100
From the tableabove shows thatbabies bornatDrMoewardi hospitalas many as78
people(50%), while thenon-anemicas many as78 people(50%).
The secondrelationshipof eachindependent variableon the dependent variableusedbivariate
analysis usingChiSquaretestcan be seenin the tablesbelow:
Table 3. Relationship between Anemia in Pregnancy with Low Birth Weight Infants in Dr Moewardi
Hospital
No Anemia
Birth Weight
BBLR (<2500 gr)
BBLN (≥ 2500 gr)
P Value OR
N % N %
1. Anemia 54 69,2 37 47,4 0,006 2,493 2. No-anemia 24 30,8 41 52,6
Total 78 100 78 100
When viewed in the relationship between anemia in pregnancy with the birth of LBW turned
out there were 54 (69.2%) of respondents who have anemia in pregnancy and childbirth LBW
infants. Meanwhile, respondents who did not have anemia in pregnancy and having a baby of low
birth weight by 41 respondents (52.6%).
Results were analyzed by Chi Square test is computerized using SPSS 16 is obtained value
of p = 0.006 (p <0.05), with degrees of freedom (df) = 1. This shows that H0 is rejected it means
that there is a relationship between anemia in pregnancy with the birth of LBW The Dr Moewardi
hospital.
From the Odds Ratio calculation using SPSS 16 found that the incidence of low birth weight
are influenced history of maternal anemia in pregnancy for 2,493 with confidence intervals (95%),
which indicates that anemia in pregnancy is a risk of birth have low birth weight (LBW) of 2,493
times compared with pregnant women who are not anemic (normal pregnant women) or can also
be said that the probability of maternal anemia during pregnancy is a risk factor for LBW infants
was 66.6%.
Based on this research, it is known that babies born at the Dr Moewardi hospital in January
2012 - June 2012 with LBW many as 195 cases (11.6%) out of 1688 births. But in this study were
taken 78 cases of low birth weight (50%) using a minimum sample size formula for the case-control
study. The results of the same magnitude when compared with the number of LBW births
nationally based Riskesdas 2007. Itcan happen because the Dr Moewardi hospital is a hospital in
Public Health Department, Faculty of Sports Science, F1 Building, 2nd
Floor, Sekaran Campus Gunungpati, Semarang City, Central Java Province, Indonesia, 50229 Phone/ Fax. +6224 8508007
731
Surakarta which become a reference center in Central Java Southeast region for the handling of
labor with risk, so the percentage of low birth weight births in RS is quite high.
From the test results with chi square statistic shows that the p-value is smaller than α (0.006
<0.05), which means that Ho is rejected (Ha accepted). This shows that there is a relationship
between anemia in pregnancy with the birth of low birth weight babies. Value Odds Ratio (OR) =
2.493 showed that anemia in pregnancy is a risk of birth have low birth weight (LBW) amounting to
2,493 times compared with pregnant women who are not anemic (normal pregnant women).
This is in accordance with Bakta in 2007, that one of the causes of low birth weight is a
pregnancy with anemia. Most of anemia is often found in pregnant women are iron-deficiency
anemia, which means empty anemia resulting from the body's iron reserves (depleted iron stores)
so that the supply of iron for erythropoiesis is reduced, and ultimately the formation of hemoglobin
(Hb) is reduced.
According to the Indonesian Pediatric Association (IDAI) 2004 mentions the causes of LBW
are multifactor, among other maternal factors (diseases such as malaria, anemia, syphilis, TORCH
infections, complications during pregnancy, maternal age, maternal habits), among others, such
factors fetus preterm infants , hydramnios, twin pregnancy, chromosomal abnormalities,
environmental factors. This is consistent with research that states that there is a relationship
between a history of maternal illness during pregnancy such as anemia where Hb <11 g% with
LBW births.
According Manuaba 2004 stated that anemia in pregnancy give less influence for both the
mother during pregnancy, childbirth, and postpartum. Anaemia in pregnant women will cause
interference utero nutrition and oxygenation of the placenta that cause growth retardation of the
conceptus, thus hampered the growth and development of the fetus and the fetus was born with
low weight
Conclusion
From the research result is; (1) From 156 samples obtained anemia cases as many as 91 cases
(58.3%) the most are cases of mild anemia which 78 cases (50%) and low birth weight babies are
78 cases (50%), (2) of 91 cases of anemia found 54 cases of infants with low birth weight (LBW),
(3) Based on calculations using chi square analysis, there is a relationship between anemia in
pregnancy with the birth of low birth weight infants with p = 0.006 (p <0.05 ), while Odds Ratio
calculations show that the history of anemia in pregnancy is a risk of birth have low birth weight
(LBW) is 2,493 times compared with pregnant women who are not anemic (normal pregnant
women) or probability of maternal anemia during pregnancy is a risk factor for LBW infants was
66.6%.
732
Public Health Department, Faculty of Sports Science, F1 Building, 2nd
Floor, Sekaran Campus Gunungpati, Semarang City, Central Java Province, Indonesia, 50229 Phone/ Fax. +6224 8508007
References
(Badan Pusat Statistik (BPS)) dan Macro International. 2007. Survei Demografi dan Kesehatan
Indonesia 2007, Calverton, Maryland. USA : BPS dan Macro International
Agustini, N, S. 2008. Hubungan Anemia pada Ibu Hamil dengan Kejadian Bayi Berat Lahir Rendah
(BBLR) di Badan Pengelola Rumah Sakit Umum (BPRSU) Rantauprapat Kabupaten
Labuhan Batu Tahun 2008. [Skripsi]. Fakultas Kesehatan Masyarakat Universitas
Sumatera Utara
Azwar, S. 2011. Metode Penelitian. Yogyakarta: Pustaka Pelajar
Bakta, I.M. 2007 Hematologi Klinik Ringkas. Jakarta: EGC
Depkes RI.,2009. Profil Kesehatan Indonesia tahun 2008. Jakarta : Depkes RI
Dinkes Jateng, 2008. Profil Kesehatan Kab/Kota. Semarang: Dinas Kesehatan Jawa Tengah
Hartanti, A. 2010. Hubungan Anemia Ibu Hamil Trimester III dengan
Kejadian Bayi Berat Lahir Rendah Di RSUD Pandan Arang
Boyolali. [Karya Tulis Ilmiah]. Program Studi D IV Kebidanan FK UNS
Ikatan Dokter Anak Indonesia (IDAI). 2004. Bayi Berat Lahir Rendah. Dalam : Standar Pelayanan
Medis Kesehatan Anak. Edisi I. Jakarta
Kenneth. 2009. Obstetri Williams. Jakarta: EGC
Lemeshow S, David W, Hosmer Jr, Klar J., Lwanga SK. 1997. Besar Sampel Dalam Penelitian
Kesehatan, (Terjemahan). Yogyakarta: Gadjah Mada University Press
Manuaba, I.B.G. 2004. IlmuKebidanan, Penyakit Kandungan dan KB untuk Pendidikan Bidan.
Jakarta: EGC
Manuaba, I.B.G. 2007. Pengantar Kuliah Obstetri. Jakarta: EGC
Notoadmodjo, S. 2010. Metodologi Penelitian Kesehatan. Jakarta: PT Rineka Cipta
Prawirohardjo, S. 2006. Buku Acuan Nasional Pelayanan Kesehatan Maternal dan Neonatal.
Jakarta: EGC
Proverawati, Atikah & Siti Asfuah. 2009. Buku Ajar Gizi untuk Kebidanan. Yogyakarta: Nuha
Medika
Purwitasari, D. 2009. Gizi Dalam Kesehatan Reproduksi. Yogyakarta: Nuha Medika
Riskesdas. 2007. Laporan Nasional. Jakarta: Badan Pelatihan dan Pengembangan Kesehatan
Departemen Kesehatan
Saifudin, A.B. 2004. Buku Panduan Praktis Pelayanan Kesehatan Maternal Neonatal. Jakarta:
Yayasan Bina Pustaka Sarwono Prawirohardjo
Sastroasmoro, S. 2008. Dasar-Dasar Metodologi Penelitian Klinis Dalam Ismail S,(ed), Edisi ke-2.
Jakarta: Sagung Seto
Sugiyono. 2009. Metode Penelitian Kuantitatif Kualitatif dan R&D. Bandung: Alfabeta
Waryana. 2010. Gizi Reproduksi. Yogyakarta : Pustaka Rihama
Wiknjosastro, H,dkk. 2010. Ilmu Kebidanan. Jakarta: Yayasan Bina Pustaka Sarwono
Prawirohardjo
Public Health Department, Faculty of Sports Science, F1 Building, 2nd
Floor, Sekaran Campus Gunungpati, Semarang City, Central Java Province, Indonesia, 50229 Phone/ Fax. +6224 8508007
733
THE CORRELATION BETWEEN KNOWLEDGE AND ATTITUDE ABOUT TEENAGE PREGNANCY ON FEMALE STUDENT AT UNGARAN 2 STATE SENIOR HIGH SCHOOL IN 2014
Dwi Wirastri, Dwi Novitasari, Yuliaji Siswanto
1. Public Health Postgraduate Program, Semarang State University, Indonesia 2. Ngudi Waluyo School of Health Ungaran, Indoesia
Corresponding Author: [email protected]
Abstract Introduction: Teenage pregnancy includes as high risk pregnancy. The factors that cause teenage pregnancy are premarital sex and lack of knowledge. Information is very important thing to increase knowledge and generate a positive attitude. This study aims to find the correlation between knowledge and atittude about teenage pregnancy in the elevent grade student. Method: This was a discriptive correlative study with cross-sectional approach this study used quistionnaires. The samples in this study were 123 female student of eleven grade at ungaran 2 state senior high school by using simple random sampling technique. Data analysis used bivariate analysis of chi square. ResultsThe results of this study indicated higher proportion of respondents with good knowledge wich was 60.2% (74 respondents), while the higher proportion of respondents with positive attitude wich was 67.5% (83 respondents) . this indicated that there was a correlation between knowledge and attitude about teenage pregananct with p value of 0.001 < α (0,05). Keywords: Knowledge, attitude, teenage pregnancy
Introduction
High rates of early pregnancy in adolescents in Indonesia today can be proven from Family
Planning Coordinating Board ( BKKBN ) in 2006 , teen pregnancy in Indonesia showed unwed
raped because as much as 2.3 % , because both want as much as 8 , 5 % , and unpredictable as
much as 39 % , reaching 18.3 % of free sex . The incidence increased in 2010 is pregnant out of
wedlock because in rape 3.2 % , equally want as much as 12.9 % , and unpredictable as much as
45 % , as well as free sex reached 22.6 % ( Dian , 2012).
Pregnancy can be a desire, but it can also be a catastrophe if pregnancy experienced by
teenagers who are still young and not ready for pregnancy. According Kusmiran (2012), in the
United States, an estimated 130,000 births occur from premarital relations. The number is far
smaller than it actually happened. The problem turned out to be more prevalent in many European
and Asian countries. Pregnancy at a young age could be at risk or result in abortion (fetal death),
easy bleeding, infection. Some of the reasons why the young age pregnancy can cause uterine
risk is not yet ready to support a pregnancy, hormonal systems has not coordinated smoothly,
psychological maturity to deal with traumatic childbirth and for child care / maintain inadequate
(Kusmiran, 2012).
Based on the results of research conducted by Indonesa Family Planning Association
(IPPA), particularly sections that handle juvenile namely Information Center and Youth Services
(PILAR) Central Java, the number of cases of adolescents who experience problems conceiving at
a young age in 2012 increased compared to the previous year, namely 63 teenage girls become
734
Public Health Department, Faculty of Sports Science, F1 Building, 2nd
Floor, Sekaran Campus Gunungpati, Semarang City, Central Java Province, Indonesia, 50229 Phone/ Fax. +6224 8508007
pregnant at a young age and all were not expecting pregnancy / pregnancy are not cool (KTD) with
a highest range is the 15-19 age was 37 girls, is quite high when compared with the age group> 20
years (IPPA, 2012). Pregnancy is a young age pregnancies occur in women under the age of 20
years . Pregnancy at a young age have a high enough risk , because at a young age , reproductive
organs not yet mature enough to perform its function. Womb ( uterus ) are freshly prepared to
perform its function after the age of 20 years , because at this age hormonal function through a
period of maximum work ( Kusmiran , 2012) .
Many factors cause young teenage pregnancy has not been the age of 20 years , the
following factors could be used as a reference as the cause of the young age pregnancy , sexual
relationships, parent- adolescent relationship Loosening , low interaction in the midst of the family ,
the lack of knowledge about teenage pregnancy, taboo issues of sex and sexuality, the busyness
of parents (Surbakti, 2009).
Nature curious and try new things in adolescents included in sexual behavior without the
accompaniment of knowledge and information about the impact of sexual behavior that may result
in the occurrence of sexual activity before achieving mental and spiritual maturity. Sexual behavior
itself begins from one's attitude toward a particular object. (Syahredi, 2010).
After a preliminary study carried out by means of direct interviewing 10 students. After the
interview, 6 out of 10 students or 60% do not have knowledge about pregnancy at a young age, 4
of which, or 40% knew about the pregnancy young age, with a given beberepa questions about
pregnancy young age, and is supported also by the absence of material about pregnancy for
teenagers at a young age, and never was the incidence of pregnancy in high school students.
Attitude given by students after the interview, 5 or 50% have a negative attitude about pregnancy
young age, 5 or 50% of students have a positive attitude about pregnancy young age. One of the
students who give a negative attitude has a good knowledge, but it gives a negative attitude about
pregnancy young age. According to the theory, if someone good knowledge of the object, then the
response given attitude or good or positive anyway.
Method
The study was conducted using a descriptive study of correlation , because it will illustrate
whether there is a relationship between the dependent and independent variables , with the cross
sectional approach , considering only performed one time only to find out the events based on data
collected from respondents and all to do with the problems examined ( Sugiono , 2010) . Variables
that were examined in this study is the dependent variable is the attitude of young teens about
pregnancy and independent variables, namely knowledge about adolescent pregnancy young age.
Population in this research is class XI student of SMAN 2 Ungaran with a total population of
178, with 123 samples. Sampling technique used is sampling probablity that the sampling
techniqueprovide equal opportunities for every element ( members ) to become members of the
sample population . Sampling technique in this study is simple random sampling, which is said to
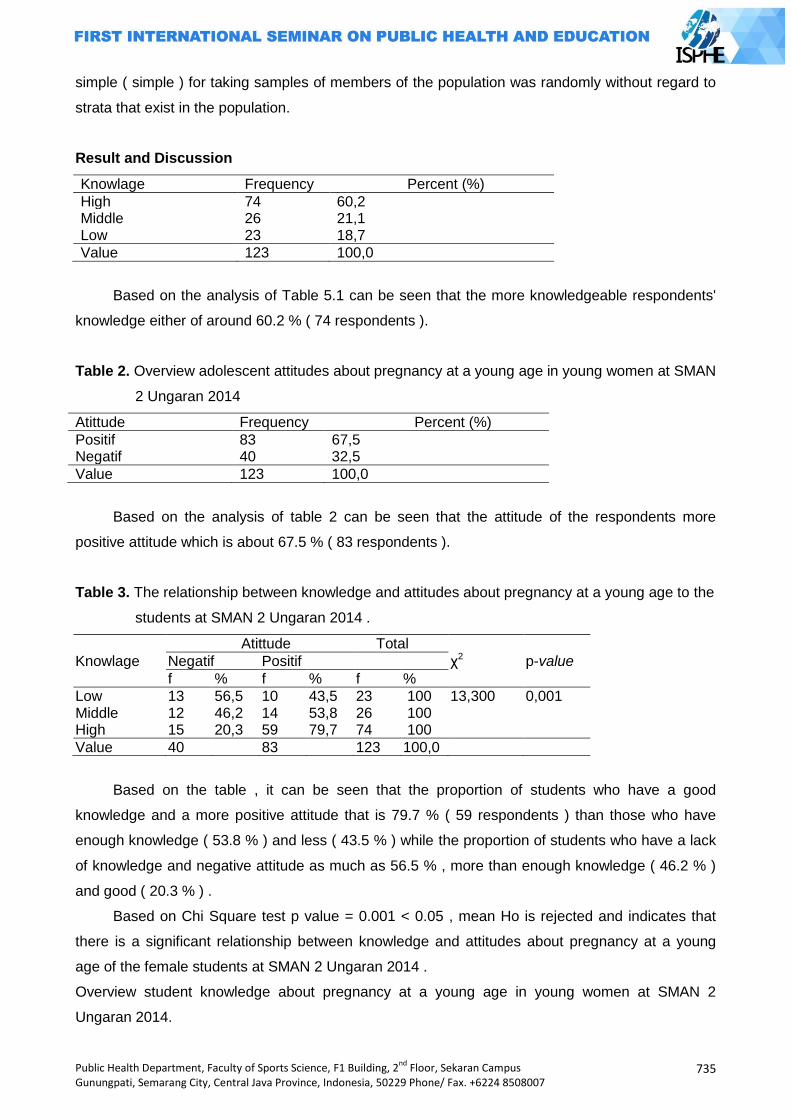
Public Health Department, Faculty of Sports Science, F1 Building, 2nd
Floor, Sekaran Campus Gunungpati, Semarang City, Central Java Province, Indonesia, 50229 Phone/ Fax. +6224 8508007
735
simple ( simple ) for taking samples of members of the population was randomly without regard to
strata that exist in the population.
Result and Discussion
Knowlage Frequency Percent (%)
High 74 60,2 Middle 26 21,1 Low 23 18,7
Value 123 100,0
Based on the analysis of Table 5.1 can be seen that the more knowledgeable respondents'
knowledge either of around 60.2 % ( 74 respondents ).
Table 2. Overview adolescent attitudes about pregnancy at a young age in young women at SMAN
2 Ungaran 2014
Atittude Frequency Percent (%)
Positif 83 67,5 Negatif 40 32,5
Value 123 100,0
Based on the analysis of table 2 can be seen that the attitude of the respondents more
positive attitude which is about 67.5 % ( 83 respondents ).
Table 3. The relationship between knowledge and attitudes about pregnancy at a young age to the
students at SMAN 2 Ungaran 2014 .
Knowlage
Atittude Total
χ2 p-value Negatif Positif
f % f % f %
Low Middle High
13 12 15
56,5 46,2 20,3
10 14 59
43,5 53,8 79,7
23 26 74
100 100 100
13,300 0,001
Value 40 83 123 100,0
Based on the table , it can be seen that the proportion of students who have a good
knowledge and a more positive attitude that is 79.7 % ( 59 respondents ) than those who have
enough knowledge ( 53.8 % ) and less ( 43.5 % ) while the proportion of students who have a lack
of knowledge and negative attitude as much as 56.5 % , more than enough knowledge ( 46.2 % )
and good ( 20.3 % ) .
Based on Chi Square test p value = 0.001 < 0.05 , mean Ho is rejected and indicates that
there is a significant relationship between knowledge and attitudes about pregnancy at a young
age of the female students at SMAN 2 Ungaran 2014 .
Overview student knowledge about pregnancy at a young age in young women at SMAN 2
Ungaran 2014.
736
Public Health Department, Faculty of Sports Science, F1 Building, 2nd
Floor, Sekaran Campus Gunungpati, Semarang City, Central Java Province, Indonesia, 50229 Phone/ Fax. +6224 8508007
Based on the results in Table 1 shows that most are still in both categories, with 74 students
(60%). The answers indicated by respondents to answer correctly largely on understanding and
reason are not allowed the young age pregnancy, pregnancy causes a young age, and as a result
of pregnancy young age. Based on the answers of respondents mentioned above that it can be
due to, among others: the location of SMAN 2 Ungaran strategic location close to the internet, and
the rapid advancement of technology as a communication tool used by students most smartphones
making it easier for students to obtain the information via smartphones, in addition to The school
also facilitates students with the ICT subjects making it easier students to search a variety of
information with the provision of these subjects, so that the knowledge possessed by respondents
in both categories. According Notoadmojo (2007), knowledge is the result of know, and this
occurred after people perform sensing on a particular object. Sensing occurs through human
senses the sense of sight, hearing, smell, taste and touch. Most of the human knowledge acquired
through the eyes and ears. According Nursalam (2003) one of the factors that influence knowledge
is information , the rapid advancement of technology will be available a variety wide mass media
can influence public knowledge about new innovations. As a means of communication, various
forms of mass media such as television, radio, newspapers, magazines, and others have great
influence on the formation of opinion and belief of people. Submission of information as their main
duty, the mass media also carry messages containing suggestions that can direct a person's
opinion. New information about something that provides the foundation for the formation of new
cognitive science to it.
Some studies indicate that the information can increase student knowledge. Research
conducted by the (2007) ties the provision of information to increase students' knowledge terntang
reproductive health in adolescents at high school Tunas Harapan Bandarlampung 2007. Further
research conducted Kusmawati (2006) at SMAN, Tulungagung, that information can provide
significant changes to knowledge.
In addition to better knowledge, there are also respondents who have sufficient knowledge
and less. The data is shown by as much as 21.1% (26 respondents) and 18.7% (23 respondents)
and less knowledgeable enough. From these results based on the questionnaire there are still
students who do not know about the permissibility of reasons not pregnant at a young age, not the
strength of faith and the declining moral values can affect adolescents in doing negative things, the
absence of parental attention will affect adolescent relationships, and as a result of pregnancy
young age.
Based on the answers of the respondents it can be due to, among others: not all of these
students have a smartphone so it is natural that there are still students who have sufficient
knowledge and less, and ICT lessons are learned in school just to learn on certain days so as not
to facilitate students in mengkases or find information easily. Therefore, the knowledge of students
about teen pregnancy is still very low.
Public Health Department, Faculty of Sports Science, F1 Building, 2nd
Floor, Sekaran Campus Gunungpati, Semarang City, Central Java Province, Indonesia, 50229 Phone/ Fax. +6224 8508007
737
Description of student attitudes about pregnancy at a young age in young women at SMAN 2
Ungaran 2014.
Based on Table 2 after being given questionnaires about pregnancy at a young age can be
seen that more respondents who have a positive attitude that is 67.5% (84 respondents). A
positive attitude shown by the students because students are getting the information through
educational institutions or from conviction students to appreciate the moral values instilled in each
sisiwi. It is proved from the schoolgirl replied statement relating to the moral norm or associated
with pregnancy at a young age is the voice of understanding pregnancy young age, maintaining
relationships and not stuck promiscuity, respect moral values and strengthening of faith can avoid
themselves from pregnancy young age, as well as opinion on the impact of pregnancy young age.
It shows a lot of things that support a person to give a positive attitude towards suatau
statement. one factor, namely the formation of the attitude of mass media, the news contained in
newspapers or radio or other communication media, the news should be delivered in an objective
factual likely to be influenced by the author, consequently influence the attitude of consumers.
Education and religion also influence a person's attitude, moral concepts and teachings of the
educational institutions and religious institutions determine the belief system it is not surprising that
in turn affects the attitude concept (Henry, 2010).
In addition there is also a positive attitude of respondents who answered statement by giving
a negative attitude that is as much as 32.5% (40 respondents). The negative attitude given by the
students can be caused by several things: free association, does not emphasize moral values or
beliefs that exist, and do not take advantage of the mass media in a positive way, but with a
negative thing, thus further encouraging students to give false statements and being negative.
This is supported also by the influence of others that are considered important in the
formation of a person's attitude. In general, people tend to choose konformir attitude or direction of
the attitudes of others that are consideredimportant. In addition to the influence of others influence
of the mass media can also affect student attitudes (Henry, 2010).
From the above statement can be concluded that good relationships will bring a good
influence, on the contrary, if the association is freely without monitoring, it will bring bad influences
anyway, so the association adolescents should be monitored to determine the development of
good relationships with fellow teenage friends, to the environment, and monitoring of the abuse of
the use of the mass media.
Analysis bivariat
1. The relationship between knowledge and attitudes about pregnancy at a young age in young
women at SMAN 2 Ungaran 2014.
Based on table , it can be seen that the respondents who have a good knowledge and have
a more positive attitude that is a 79.7% (59 respondents), as compared with the knowledge enough
738
Public Health Department, Faculty of Sports Science, F1 Building, 2nd
Floor, Sekaran Campus Gunungpati, Semarang City, Central Java Province, Indonesia, 50229 Phone/ Fax. +6224 8508007
to have a positive attitude 53.8% (14 respondents) and lack of knowledge have a positive attitude
43.5% (10 respondents),
Quadrat chi test results showed that no significant relationship between knowledge and
attitudes about pregnancy at a young age to the students at SMAN 2 Ungaran 2014. This is
evidenced by the significant value of p value = 0.05 0,001≤.
A positive attitude shown by the respondents was obtained through a good knowledge about
pregnancy young age, because as it is known someone would give attitude after having knowledge
about something. In addition it is also supported by the information and facilities provided by the
school to inculcate moral values as early as possible in order to offset between knowledge with
attitude towards something.
Knowledge is very closely linked with the attitude that is evidenced by the theory that before
a person adopts behaviors (new behavior), he must know in advance what the meaning or the
behavior benefits for himself or his family. People will do a pregnancy eradication young age when
He knew what the purpose and benefits for health or family, and what dangers, if he did it for
example that young age pregnancy. Attitude is the assessment (can be opinion) a person to a
stimulus or object (in this case, including health issues, including pregnancy young age). Once
someone knows the stimulus or object, the next process will be worth or behave toward the
stimulus or health object (Notoatmodjo, 2012). The statement proved both highly interconnected
which after a person has a good knowledge of the future is expected to be applied with a positive
attitude as well.
Attitude influenced by knowledge where knowledge of a person against an object contains
two aspects: positive and negative aspects. Both of these aspects will determine the attitude of a
person, the more positive aspects and more positive towards a particular object (Henry, 2010).
In addition to good knowledge with a positive attitude there are also respondents who have a
good knowledge but have a negative attitude that is 20.3% (15 respondents), sufficient knowledge
has a negative attitude that is 46.2% (12 respondents) and lack of knowledge 56.5% (13
respondents) have a negative attitude.
Respondents who have a good knowledge but a negative attitude, it can be because the
attitude is not only influenced by knowledge alone, but also influenced by other people or the
environment which gives effect to the individual, because there is a tendency of an individual
attempting to equal the sekelompoknya friends or her social environment. In addition to the
environmental effects of the influence of parents also determines a person's attitude, parents big
influence on their children, the attitude of the parents will be the role model for their children
(Henry, 2010). From these statements one's attitude is influenced by many factors, so it does not
rule out if someone has a good knowledge but have a negative attitude.
In addition to good knowledge with a negative attitude, but there is also sufficient knowledge and
less with a negative attitude. The negative attitude given by the respondent because the
respondent did not have knowledge of pregnancy young age, so that respondents gave a
Public Health Department, Faculty of Sports Science, F1 Building, 2nd
Floor, Sekaran Campus Gunungpati, Semarang City, Central Java Province, Indonesia, 50229 Phone/ Fax. +6224 8508007
739
statement with a negative attitude. From the above statement are reasonable if the respondents
have a negative attitude because basically the respondents did not have any knowledge of the
pregnancy young age.
The result of research that supports the relationship of knowledge to attitudes about
pregnancy young age of the study Hastutik (2011) at SMAN 2 Karanganyar, the results showed no
relationship between the level of knowledge about reproductive health with adolescent attitudes
toward premarital sex in SMAN 2 Karanganyar 2011. According to the research Setyawan (2007)
in High School Tunas Harapan Bandarlampung, the results showed a significant result between
knowledge and attitudes about sex education early on in high school teenagers Tunas Harapan
Bandarlampung 2007. Subsequent research Syahredi (2011) in a variety of high school, the results
showed that there are various factors that affect the level of knowledge and attitudes of
adolescents to reproductive health.
Conclusion
The above results show there is a correlation between knowledge and attitudes about
reproductive health of adolescents, so that the results can be concluded that there is a relationship
between knowledge and attitudes about pregnancy young age of the female students.
References
Arikunto, 2006. Prosedur Penelitian. Jakarta: PT Rineka cipta
BKKBN, 2008. Remaja. http: // Kehamilan remaja.html. Diakses November 2013
Dian, 2012. Kehamilan Remaja. http: // Pernikahan laki-laki dan wanita hamil di luar nikah .html.
Diakses November 2013.
Hidayat, A. A. 2011. Metode Penelitian Kebidanan dan Teknik Analisis Data. Jakarta: Salemba
Medika
Intan, 2013. Kesehatan reproduksi untuk mahasiswa kebidanan dan keperawatan. Jakarta:
Salemba Medika
Kusmiran, 2012. Kesehatan Reproduksi Remaja dan Wanita. Jakarta: Salemba Medika.
Notoatmodjo, 2003. Pendidikan dan perilaku kesehatan. Jakarta: PT. Rineka cipta
Notoatmodjo, 2005. Metode penelitian kesehatan. Jakarta: Rineka Cipta
Notoatmodjo, 2010. Teori Pengukuran Sikap dan Perilaku Kesehatan. Jakarta: PT. Rineka Cipta.
Notoatmodjo, 2012. Promosi Kesehatan dan Perilaku Kesehatan. Jakarta: Rineka Cipta.
Nursalam. 2003.Konsep dan Penerapan Metode Penelitian Ilmu Keperawatan Jakarta: Salemba
Medika
PKBI, 2012. Profil Kasus Kehamilan yang Tidak Diinginkan. Semarang: Pilar
Riwidikdo, H. 2008. Statistik Untuk Penelitian Kesehatan. Yogyakarta: Pustaka Rihana
Romauli, S. 2011. Kesehatan reproduksi remaja dan wanita. Jakarta: Salemba medika
Sugiyono, 2010. Statistika untuk penelitian. Bandung: Alfabeta

740
Public Health Department, Faculty of Sports Science, F1 Building, 2nd
Floor, Sekaran Campus Gunungpati, Semarang City, Central Java Province, Indonesia, 50229 Phone/ Fax. +6224 8508007
Sugiyono, 2012. Statistika untuk penelitian. Bandung: Alfabeta
Wawan, A. 2011. Teori dan pengukuran pengetahuan, sikap, dan perilaku manusia. Yogyakarta:
Nuha Medika
Zulfan, 2013. Psikologi keperawatan. Jakarta: Rajawali Pers
Public Health Department, Faculty of Sports Science, F1 Building, 2nd
Floor, Sekaran Campus Gunungpati, Semarang City, Central Java Province, Indonesia, 50229 Phone/ Fax. +6224 8508007
741
THE DESCRIPTION OF MOTHERS’ KNOWLEDGE ABOUT GIVING PACIFIER TO BABIES IN GUMILIR CILACAP OF THE YEAR 2014
Eka Mei Susanti
Public Health Post Graduate Program, Semarang State University, Indonesia
Corresponding Author: [email protected]
Abstract
Introduction: Pacifierfor babies stirs controversial amongst parents (especially new parents). Pacifier has both advantage and disadvantage. According to the 10 Successful Steps of Breastfeeding recommended by WHO, giving pacifier to babies is banned. The purpose of this research is to figure out the knowledge of mothers about the using of pacifier amongst babies in Kelurahan Gumilir Kabupaten Cilacap in 2014. Methods: This is a descriptive research with cross sectional approach, the population in this research is all mothers whose babies are age 0-12 months old of a total number of 187 mothers. Using themethod of clusterrandom sampling, 65 respondents are gained. Data are collected using question naireson „Mothers‟ Knowledge of Piving Pacifierfor Babies‟. Data analysis adopts univariateanalysis method. Result: The level of knowledge of mothers about giving pacifier to babies is; 30 respondents (46%) are categorized into good level of knowledge, 18 respondents (28%) are categorized into medium level and the rest (26%) are categorized into poor level of knowledge. This is affected by some factors as mentioned by Notoatmodjo (2010) that the knowledge they‟ve got is affected by some factors, such as; experience, age, education, occupation, and source of information. Keywords: Knowledge, pacifier.
Introduction
Pacifier for babies stirs controversial amongst parents (especially new parents). Pacifier has
both advantage and disadvantage. According to the 10 Successful Steps of Breastfeeding
recommended by WHO, giving pacifier to babies is banned.If someone gives her baby a pacifier
before trying to breastfeed the baby, she will tend to choose pacifier than to breastfeed her baby all
the times. She will hardly breastfeed her baby resulting to a troubled breast milk productivity
because the breast milk production is based on supply on demand. One of the advantages of
giving pacifier to babies is to prevent SIDS (Sudden infant death syndrome). According to a
research (conducted by Fern R. Hauck, M.D., an associate professor in family healing at the
University of Virginia Health System in Charlottesville), babies who use pacifier during their sleep
have decreasing risk of SIDS by 3 times to compare to those who do not use pacifier. It is due to
their sleeping position. Because they have pacifier in their mouths so they sleep with their faces
facing up, thus their respiratory system works smoothly (Lucy danDini, 2013).
The disadvantage of using pacifier for babies is not do they find difficulty to locate their
mothers‟ nipples but it also affects their emotional development. Although pacifier is effective to
stop babies from crying, but a research conducted by the University of Wisconsin-Madison states
that babies who use pacifier most of the times will face physical and emotional development
problem. According to a research, most of baby boys who use pacifiers face difficulty in expressing
742
Public Health Department, Faculty of Sports Science, F1 Building, 2nd
Floor, Sekaran Campus Gunungpati, Semarang City, Central Java Province, Indonesia, 50229 Phone/ Fax. +6224 8508007
themselves. While baby girls who use pacifiers have more ability in showing facial expression. The
ability to read emotion from anybody‟s facial expression can help find out what that person thinks
and feels (Marliana, 2013).
Initially, the using of pacifier gave positive effects in baby age 0-1 year and the rest of it gave
more side effects. In KabupatenCilacap especially in Cilacap Utara Community Health Centre I we
can still spot many mothers giving pacifiers to their babies with the purpose to stop their babies
when they are crying and their excuse is that their breasts do not produce milk due to their hectic
life at work, too lazy to use spoon and glass to give milk to their babies. Most mothers do not know
the advantage and the disadvantage of the using of pacifier. Based on above phenomena, the
researcher is interested to conduct a research with a title “The Description of Mothers‟ Knowledge
about Giving Pacifier to Babies in GumilirCilacap of the year 2014 “
Method
This is a descriptive research with cross sectional approach, the population in this research
is all mothers whose babies are age 0-12 months old of a total number of 187
mothers.Usingthemethod of clusterrandomsampling, 65 respondents are gained. Data are
collectedusingquestionnaireson „Mothers‟ Knowledge of PivingPacifierforBabies‟. Data
analysisadoptsunivariateanalysismethod.
Results and Discussion
Table 1. Frequency Distribution Characteristics of Respondents based on Age
No. Age Frequency (n) Percentage (%)
1. 20-35 years 51 78 2. >35 years 14 22
Total 65 100
Based on the table 1above it, the characters of the respondents based on age The majority
of respondents are between 20-35 years old, which is about 51 people (78%) and the rest is 14
people (22%) age >35 years old.
Table 2. Frequency Distribution Characteristics of Respondents based on cultural ethnic
No. Cultural ethnic Frequency (n) Persentage (%)
1. Javanese 61 94 2. Sundanese 4 6
Total 65 100
Based on the table 2 above it,it can be seen the majority of the respondents are Javanese
(94%) and Sundanese (6%).
Public Health Department, Faculty of Sports Science, F1 Building, 2nd
Floor, Sekaran Campus Gunungpati, Semarang City, Central Java Province, Indonesia, 50229 Phone/ Fax. +6224 8508007
743
Table 3. Frequency Distribution Characteristics of Respondents based on Education
No. Education Frequency (n) Persentage (%)
1. Elementary school 14 22 2. Junior High school 16 25 3. Senior high school 22 34 4. University 13 20
Total 65 100
Based on the table above 3 can be found that majority of respondents are high school
graduate, 22 people (34%), 16 junior high school graduates (25%), 14 elementary school
graduates (22%), and 13 university graduates (20%).
Table 4. Frequency Distribution Characteristics of Respondents based on Job
No. Job Frequency (n) Persentage (%)
1. Housewives 48 74 2. Self employed 7 11 3. Company employees 10 15
Total 65 100
Based on the table 4 above it can be seen that most of respondents are housewives, which
are 48 people (74 %), 10 private company employees (15 %), and 7 people are self-employed (11
%).
Table 5. Frequency Distribution Characteristics of Respondents based on Number of
children
No. Number of children Frequency (n) Percentage(%)
1. 1 33 51 2. 2-4 30 46 3. >4 2 3
Total 65 100
Based on the table 5 above it can be seen that most of respondents have 1 child, 33 people
(51%), 30 respondents (46%) with 2-4 children and 2 respondents (3%) with >4 children.
Table 6. Frequency Distribution Characteristics of Respondents based on resources.
No. Information center Frequency(n) Percentage (%)
1. Medical Staff 28 43 2. Print Media 16 25 3. Electronic Media 6 9 4. Friends or relatives 15 23
Total 65 100
Based on the table 6 above it can be seen that respondents who receive most information
about pacifier from medical staff is 28 people (43%), 16 people (25%) receive information from
print media, 15 people receive information from friends or relatives (23 %), and 6 people (9%)
receive information from electronic media.
744
Public Health Department, Faculty of Sports Science, F1 Building, 2nd
Floor, Sekaran Campus Gunungpati, Semarang City, Central Java Province, Indonesia, 50229 Phone/ Fax. +6224 8508007
Table 7. Distribution of the frequency of mothers‟ knowledge about giving pacifier to babies in
Gumilir Cilacap.
No. Knowledge Frequency (n) Percentage (%)
1. Good 18 28 2. Enough 30 46 3. Less 17 26
Total 65 100
Based onthetable1.7aboveit can be seenthat the level of knowledge of mothers about giving
pacifier to babies is; 30 respondents (46%) are categorized into good level of knowledge, 18
respondents (28%) are categorized into medium level and the rest (26%) are categorized into poor
level of knowledge.
Based on the research, it is known that mothers‟ knowledge about giving pacifier to babies in
Kelurahan Gumilir Kecamatan Cilacap Utara is mostly at medium level, from 30 respondents (46%)
of the total number of 65 respondents. According to Notoatmodjo (2010) this fact is affected by
some factors, such as; experience, age, educational background, occupation and source of
information.
Experience affects respondents on the giving of pacifier to babies. In this case, experience
can be translated as empirical reality based on findings, discovery, experiment and analysis. The
previous experience in childcare will give them analytical knowledge about giving pacifier to babies
whether it is personal experience or the experience gained through health counseling. Experience
is something that someone has gone through and it gives more knowledge to that person. In a
cross tabulation, a mother with more than one child normally has adequate experience her
previous childcare experience. While 78% of mothers with a child have good knowledge due to
other factors.
According to this research, the average ages of the respondents are between age 20 and
35 years old, (78%) and classified into productive age. This will help respondents get the access to
the information about health especially about giving pacifier to babies. Ages between 20 and 35
are considered as mature ages so this will determine respondents‟ knowledge. This has been
proved by a cross tabulation between age and experience, that mothers between age 20 and 35
years old reach the highest percentage in each category of knowledge, that 93% of mothers
between age 20 to 35 years old have good knowledge.
Education is a way to gain knowledge to make positive changes on behavior, so education
plays a great role in understanding and knowledge. Education gives impact on the respondents‟
knowledge. It is because the education concept is a learning process which means there is a
growing process, a development in maturity aspect in each person, groups, or community
(Notoatmodjo, 2010). Based on the respondents‟ education, it is known that most of the
respondents are high school graduate (34%), which means the level of education of respondents is
quite high. So this fact will affect their knowledge. It is proved by the result of the cross tabulation
between education and knowledge. 47% of those high school graduate respondents have
Public Health Department, Faculty of Sports Science, F1 Building, 2nd
Floor, Sekaran Campus Gunungpati, Semarang City, Central Java Province, Indonesia, 50229 Phone/ Fax. +6224 8508007
745
adequate knowledge. Whereas those whose education level is higher than high school show that
48% of them have good knowledge. It is in sync with Notoatmodjo (2012), education plays a great
role in a person in understanding and absorbing information, in hope that a person with high level
of education is able to understand and absorb health information especially about giving pacifier to
babies.
From this research, it is known that majority of the respondents are housewives, which is 48
out of 65 respondents or 74% of the total number of the respondents and this causes them to have
limited chances to obtain health information especially on baby pacifier thus they are categorized
into good, medium and poor level of knowledge, whereas those who are self-employed are
categorized into good and medium level. And those working respondents have best knowledge
amongst others. A job is something we need to do especially for life and family survival
(Notoatmodjo, 2012). Therefore if a mother has a job outside the house there will be chances for
her to obtain accurate information about the giving of pacifier to babies. Because occupation is
related to respondents so respondents who stay mostly at home are less potential in obtaining
information.
Mother‟s knowledge on giving pacifier to babies is also influenced by the source of
information she gets. According to the research obtained from a cross tabulation between source
of information and knowledge , the largest percentage of good and adequate levels is from
mothers who obtain information from medical staff. Knowledge is information that someone is
aware of or obtains, so if mothers obtain accurate knowledge on health about giving pacifier to
babies, hopefully they will gain more knowledge (Notoatmodjo, 2012). Because, someone with
more source of information will gain wider knowledge.
Based on the cultural ethnic, the majority of the respondents are Javanese (94%) and
Sundanese (6%) therefore, this is not sufficient to give a description on how it influences the
respondents‟ knowledge. Even though in the theory is mentioned that human behavior or a group‟s
behavior in fulfilling their needs is determined by attitude and belief.
Conclusion
According to the research and the discussion, we‟ve come to the conclusion based on the
purpose of the research; the mothers‟ knowledge on the using of pacifier amongst babies in
KelurahanGumilirKecamatanCilacap Utara is categorized into 3 levels and 30 of them (46%) have
medium level of knowledge. 18 of them (28%) have good level of knowledge and 17 of them (
26%) have poor knowledge about it. It is recommended for mothers to be active in any childcare or
baby care class andPosyandu (children healthcare unit) or in any health related activities held by
Governmental Organizations like community health center (Puskesmas) or Non-Governmental
Organizations to enrich their knowledge.
746
Public Health Department, Faculty of Sports Science, F1 Building, 2nd
Floor, Sekaran Campus Gunungpati, Semarang City, Central Java Province, Indonesia, 50229 Phone/ Fax. +6224 8508007
References
Arikunto, S. 2010. Prosedurpenelitiansuatupendekatanpraktek.RinekaCipta.Jakarta.
Doktersehat, 2013.Bahayaempengdan tips menyapihnya. Doktersehat.com. diunduhtanggal 28
desember 2013
Faridah, 2014.Apakah dot bayisungguhbaikuntukbayianda. The asian parent Indonesia.com.
diunduhtanggal 3 januari 2014.
Herdiansyah, 2010.Metodepenelitiankualitatifuntukilmu-ilmusosial.SalembaMedika. Jakarta.
JulizarPatzam, 2010. Maksudpengertian dot danempengbagibayi.Diunduhtanggal 28 Desember
2014.
Kompas.Seputarduniaanak.Empengbaikatauburuk. Seputarduniaanak.com. diunduhtanggal 28
Desember 2013
Kurniawan, LP. 2014. Dot atauempengbergunakahuntukbayi?. Tanyadokter.com. diunduhtanggal
3 januari 2014
Lucy dandini, 2013.Si Empeng yang kontroversial.www.ibudananak.com. Diunduhtanggal 28
Desember 2013
Marliana, 2013.Efeksamping dot bayi (empeng).www.ibudanbalita.com .diunduhtanggal 28 januari
2013.
Notoatmodjo, S. 2012. Metodologipenelitiankesehatan.RinekaCipta. Jakarta.
Revina, 2014.Dampakburukpenggunaan dot bayi.Bidanku.com. di unduhtanggal 3 januari 2014.
Sugiyono.(2007).Statistikauntukpenelitian.Bandung :Alfabeta.
Sugiyono. (2008). Metodepenelitiankuantitatif, kualitatifdan R&D.Bandung :Alfabeta

Public Health Department, Faculty of Sports Science, F1 Building, 2nd
Floor, Sekaran Campus Gunungpati, Semarang City, Central Java Province, Indonesia, 50229 Phone/ Fax. +6224 8508007
747
POSTER PRESENTATIONS

748
Public Health Department, Faculty of Sports Science, F1 Building, 2nd
Floor, Sekaran Campus Gunungpati, Semarang City, Central Java Province, Indonesia, 50229 Phone/ Fax. +6224 8508007
Public Health Department, Faculty of Sports Science, F1 Building, 2nd
Floor, Sekaran Campus Gunungpati, Semarang City, Central Java Province, Indonesia, 50229 Phone/ Fax. +6224 8508007
749
KNOWLEDGE LEVEL STUDENTS OF PJKR 2011 FIK UNY FORCE ON CONCEPTS AND TEACHING MATERIALS COURSE TARGET GAMES TGfU
Aris Fajar Pambudi
Yogyakarta University, Indonesia
Corresponding Author: [email protected]
Abstract Introduction: This study aims to provide of student knowledge Prodi PJKR FIK UNY class of 2011 to the concepts and teaching materials TGfU target games. Approach tactics as new innovations that enrich a variety of approaches to learning the game and sport that has been helpful as well as for teachers and prospective teachers in developing a learning model PE in school. Methods: This research is descriptive quantitative. The method used in this study is a survey method. The population in this study were all students Prodi PJKR FIK UNY class of 2011, the determination of the sample taken by proportional random sampling totaled 102 students. Data collection techniques in this study using a test of knowledge about the target concept in TGfU games. The form of the test used is included tests true-foul. Data collected from the study corrected then counted the number correctly. Furthermore, these results were statistically analyzed quantitative descriptive return to determine the amount or frequency and persentage. Results: The results showed that the knowledge students Prodi PJKR FIK UNY class of 2011 on the concept and the target game TGfU teaching materials, are in both categories with a number of 86 children, and then in the follow category is not well with the number of 11 children, and the very good category with the number 5 children . From these results the majority of students Prodi PJKR 84.3% FIK UNY Force in 2011 had a good level of knowledge. Key Words: Knowledge, target games, TgfU Introduction
Approach to learning tactics is a learning approach that emphasizes learning skills and
tactics play in the play situation. Concept-based learning tactics Teaching Games for
Understanding (TGfU) also emphasizes the involvement of the student. Students are able to
develop not only the majority of psychomotor but also the affective and cognitive well developed.
Approach tactics as new innovations that enrich a variety of approaches to learning the game and
sport that has been helpful as well as for teachers and prospective teachers in developing a
learning model PE in school. Tactic approach as a new learning model, conceived as a learning
model that is currently widely physical education experts to enhance the skills of students who play
often known as the TGfU approach.
TGfU is an approach to student learning that fosters awareness of tactics and skill learning.
This learning approach requires students to understand the tactics and strategy of playing the sport
first before learning about the techniques used. The concept of learning TGfU also put more
pressure on the student activity. Students not only develop psychomotor but also the affective and
cognitive well developed. Target games need to be packaged in the form of a game. The game
can be interpreted with two senses. First, the game is a pure play activities that seek pleasure
without looking to win or lose. Secondly, the game play is defined as an activity that is performed in
750
Public Health Department, Faculty of Sports Science, F1 Building, 2nd
Floor, Sekaran Campus Gunungpati, Semarang City, Central Java Province, Indonesia, 50229 Phone/ Fax. +6224 8508007
order to find pleasure and satisfaction, but characterized the search win-lose. The game is if the
business itself (though the mind and physical exercise) is very useful for the improvement and
development of motivation, performance, and achievements in carrying out the duties and interests
of the organization better.
The game as an activity that helps children achieve full development, physical, intellectual,
social, moral, and emotional. However, the problems that arise in the course of learning the target
games are still many students PJKR FIK UNY still wrong to interpret the concept of the target
games. For example, there are some students who take any kind of game that no target is included
in the target form games. Diverse knowledge of students can be understood as a form of
knowledge that is not the same among students, even when lectures get the same material.
Student knowledge about the target that is not the same game that is the problem in this research.
It can be seen from the experience of the researcher in the course of teaching the target games,
when asked the target concept problem games are still many students who are in the interpret it
wrong. From the above, the researcher needs to be looked at on a study of student knowledge
PJKR FIK UNY class of 2011 to the concepts and teaching materials in the target game TGfU.
Knowledge
According Jujun Suriasumantri (1993: 104), "Knowledge is essentially all of what we know
about a objects belong to it is a science". In simple terms the overall knowledge is basically
information and ideas contained in statements made about something symptoms or events that are
scientific, social or individual (The Liang Gie, 1987: 66). Knowledge is the result of a human knows,
that just answering the question "what", what is natural, what is human, and so on (Notoatmodjo,
2005). Knowledge is the result of human sensing or know someone on the results of the object
through its senses (eyes, nose, ears and so on). By itself the sensing time to generate such
knowledge is strongly influenced by the intensity of attention and perception of the object
(Notoatmodjo, 2005). According to the Ministry of Education in Indonesian Dictionary (2002: 1121)
is the knowledge of everything that is known. Knowledge is also interpreted everything that is
known with respect to (the subjects). Acquisition of knowledge is very important, because
knowledge is what makes a person would be assessed and valued intellectual. Soerjono Soekanto
(2009: 6) argues that knowledge is the impression in the minds of men as a result of the use of the
five senses, which is quite different from the beliefs, superstitions, and enlightened false
(misinformations).
Nature of physical education
Nixon and Jawett in Arma Abdoellah (1994: 5) mentions "physical education is one aspect of
the overall educational process with respect to the development and use of motor skills of
individuals who volunteer and are useful as well as directly related to the response of mental,
emotional, and social". Based on the above statement, then the overall physical education affects
Public Health Department, Faculty of Sports Science, F1 Building, 2nd
Floor, Sekaran Campus Gunungpati, Semarang City, Central Java Province, Indonesia, 50229 Phone/ Fax. +6224 8508007
751
not only the physical aspects, but the physical education a person is able to develop the overall
personality. From the above opinion could be interpreted if one will achieve what is expected
departure from the intention of the man himself, due to a change in his life came from learning to
develop all their potential. Rusli Lutan (2001: 1) physical education is a process of education
through physical activities to achieve educational goals. Moreover, in another opinion by Suherman
Adang (2000: 22) notion of physical education in the traditional view considers the Man consists of
two main components that can be sorted out, the physical and spiritual (dichotomy). Therefore,
physical education is defined as a process of education for harmony between body growth and
later development of the soul. The modern view considers humans as one unified whole (holistic).
Therefore, physical education is a process of education through physical activity and education as
well as a process for improving physical ability. Learning in physical education must be able to
arouse the child's interest to explore its potential in terms of motion, so that the child should be
encouraged to constantly explore his capabilities. Physical education lessons is one of the places
to improve children's understanding of the basic concepts of movement skills. The ability of this
understanding will be useful very useful for students and also a lot of learning in the sport when
they become adults. In fact, this ability can be transferred to other fields understand and can also
be passed on to younger siblings later.
Characteristics of Students PJKR
Faculty of Sport Sciences has three courses. sport education program (POR), sport coaching
education (PKL) and health education and recreation (PKR). While four courses (Prodi) covers
health department of physical education and recreation (PJKR), elementary school physical
education teacher (PGSD penjas), sports coaching education study program (PKO) and the
department of sport science (IKORA). Prodi PJKR and PGSD penjas into the physical education
majors (POR). From the fourth Prodi all have undergraduate level (S1). Of course the three of
them are educational programs (PJKR, PGSD penjas and PKO) and onenon-educational programs
(IKORA). Student of health physical education and recreation (Prodi PJKR) class of 2011 are
students who use the curriculum 2009 Where curriculum has been developed with the
characteristics of Common Ground. Common ground program provides the opportunity for
graduates to obtain a double degree. Students must complete 144 semester credit system (SKS)
in order to obtain a bachelor degree (S1) by taking two routes, namely through the final project
thesis (TAS) and a final project instead of a thesis (TABS). To complete the 144 credits must be
taken through the process of learning. Matakuliah- learning with subjects that have been compiled
into categories of activity theory (T) of 58.33% - 63.89%, practice (P) of 30.56% - 36.81%, and the
pitch (L) 4.17 % - 6, 94%. The subjects are grouped according to their nature, which is required to
pass, as the prerequisite courses required to pass another, and choice. Determination of the type
of activity and the nature of the course is tailored to the characteristics of each study program.
752
Public Health Department, Faculty of Sports Science, F1 Building, 2nd
Floor, Sekaran Campus Gunungpati, Semarang City, Central Java Province, Indonesia, 50229 Phone/ Fax. +6224 8508007
Concepts and teaching materials
Woodruff (in Amin, 1987) explains the concept definition into 3 namely:
The concept can be defined as an idea/ideas are relatively perfect and meaningful, The concept is
understanding of an object,
The concept is subjective product derived from how a person makes sense of the objects or
the objects through experience (after doing the perception of the object/objects). The concept is
usually used to describe the empirical world observed by researchers, both in the form of objects
or a particular social phenomenon which is abstract. Teaching materials consist of two words that
matter and teaching. According to the Ministry of Education in Indonesian Dictionary (2002)
defined the material objects; materials; everything looks. While defined by the instructions given to
the so known (be followed). Based on the meaning of the word, teaching materials defined by
something that looks as instructions given to students in the form of material that will be accepted
by learners. On the other hand, the definition of teaching materials is almost the same as the
definition of learning materials. In the Learning Materials Development Guide (MONE, 2008)
explained that the learning materials are the knowledge, skills, and attitudes that students must
master in order to meet the standards of competence specified.
Learning Teaching Games for Understanding (TGfU) Learning Teaching Games for
Understanding (TGfU) can not be separated from the concept of Tactical Games Approach in
which both play in the application of the approach to learning. In teaching the game, teachers need
to linking tactics and techniques that emphasize skill game timing precision engineering practice
and application in the context of game tactics. In the case of the teacher is necessary for
connecting the tactics of how the concept is applied to the supported technique to play sports
games. In addition, teacher materials design games using tactical issues, so that the teacher can
teach the game in accordance with the child's development. Play approach to introduce tactics and
techniques that are indispensable to the current physical education teacher. Teaching Games for
Understanding (TGfU) emphasizes tactics in achieving the objectives of physical education. Where
the approach through playing aspects, all students are exposed to the problem to solve the
problem with the tactical ability of a student. The concept of learning Teaching Games for
Understanding (TGfU) emphasizes the involvement of the student in the learning process of
physical education.
A similar opinion was expressed by Metzler mention Teaching Games for Understanding
(TGfU) is a learning model that focuses on the development of students in the ability to play the
game. A statement that can be drawn in the concept of learning Teaching Games for
Understanding (TGfU) is flexibility where students are taught according to ability in the
development of the game play. That effort because if the student has not mastered the game but
forced to play, then the consequences arising is insecurity. Disbelief that the students will be move,
and the ultimate goal of teaching physical education will not be achieved. In the model the concept
of Teaching Games for Understanding (TGfU) assume that the sport and the game will be fun,
Public Health Department, Faculty of Sports Science, F1 Building, 2nd
Floor, Sekaran Campus Gunungpati, Semarang City, Central Java Province, Indonesia, 50229 Phone/ Fax. +6224 8508007
753
educational, and challenging and can improve the health and self-satisfaction. Materials are broken
down into tactical issues not technical but does not remove the element of technique, so that
students can solve problems that are designed in such a way and students can move to solve the
problem. Teaching games for understanding is a learning model that focuses on developing
students' ability to play the game to improve performance in physical activities. TGfU involves four
categories and sub-categories are invasion games, net games/wall, striking a target games and /
fielding. Based on the four categories that can be described as follows:
(1) Target game (game targets) are of games where a player will get a score when the ball
is thrown or similar and both will hit the targets that have been determined;
(2) Invasion games (game attack) is a team of games where the score obtained when the
player is able to manipulate the ball in teams or the like to be entered into the
opponent's goal or particular stricken more than the opponent and is able to maintain
the area for not conceded by the opponent;
(3) Net game (game net) is a team or individual games or where the scores obtained when
able to give a ball or something falling on the ground so as not to bias dikembalaikan
opponent with the ball or the like skipping through the net with a certain height;
(4) Striking / fielding games (at-catch game-run) is a way to get games or the team that
scores by hitting the ball or the like to be placed on an empty area so as not to be
caught by a player is able to keep that bat and ran toward a secure area around to re-
theplaceofthe original.
Methods
Research Design This research is descriptive. In general, non-descriptive research is a
research hypothesis, so that the step does not require the research hypothesis but describe what
they are on a variable, symptoms or circumstances. The variables in this study were students Prodi
PJKR Knowledge FIK UNY class of 2011 against the target concept in TGfU games. This study
was conducted in May and June 2012, while the location or place of study on campus UNY.
Population and sample
The population in this study were all students Prodi PJKR FIK UNY class of 2011, samples
were taken by proportional random sampling. Samples were taken from five classes at PJKR Prodi
UNY class of 2011 as many as 105 students of the details of each class of 21 students is taken.
But at the time received 102 questionnaires returned, so the sample used in this study amounted
to 102 students.
Instruments and data collection techniques
Data collection techniques in this study using a test of knowledge about the target concept in
TGfU games. The tests used are the true test-foul. Data collected from the study corrected then
calculated the amount of right or wrong. Furthermore, these results were statistically analyzed
quantitative descriptive return to determine the amount or frequency and then percentage.
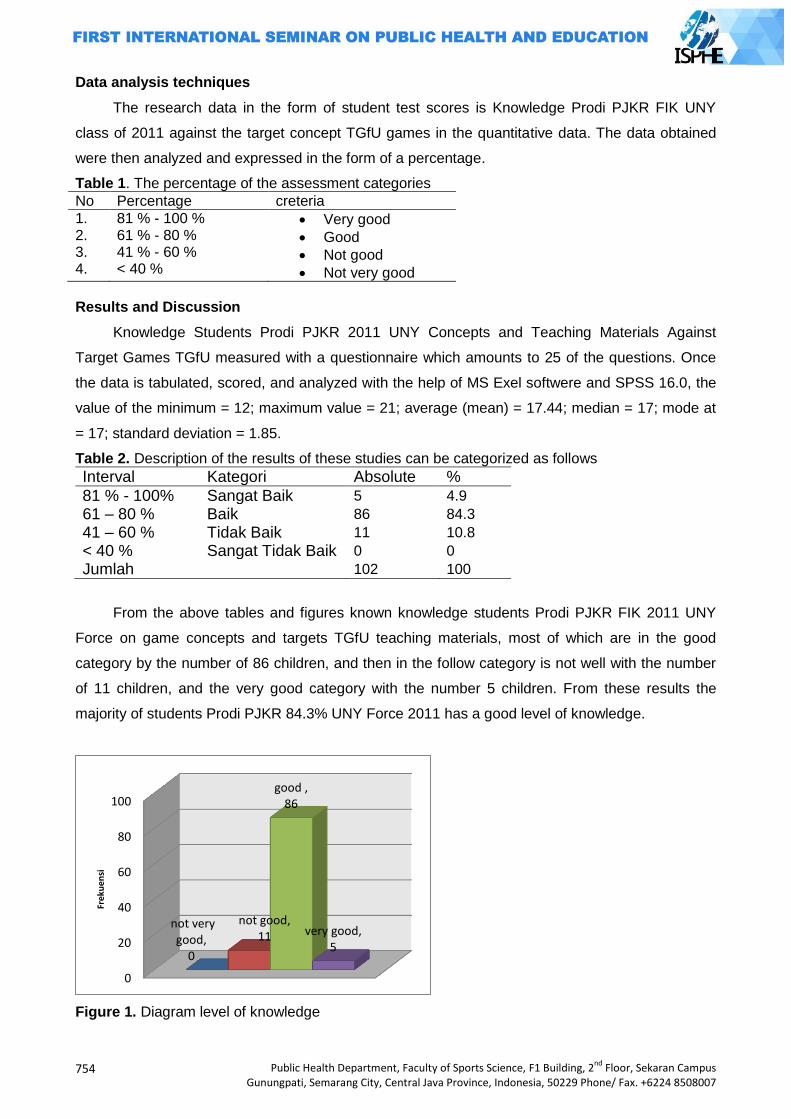
754
Public Health Department, Faculty of Sports Science, F1 Building, 2nd
Floor, Sekaran Campus Gunungpati, Semarang City, Central Java Province, Indonesia, 50229 Phone/ Fax. +6224 8508007
Data analysis techniques
The research data in the form of student test scores is Knowledge Prodi PJKR FIK UNY
class of 2011 against the target concept TGfU games in the quantitative data. The data obtained
were then analyzed and expressed in the form of a percentage.
Table 1. The percentage of the assessment categories
No Percentage creteria
1. 2. 3. 4.
81 % - 100 % 61 % - 80 % 41 % - 60 % < 40 %
Very good
Good
Not good
Not very good
Results and Discussion
Knowledge Students Prodi PJKR 2011 UNY Concepts and Teaching Materials Against
Target Games TGfU measured with a questionnaire which amounts to 25 of the questions. Once
the data is tabulated, scored, and analyzed with the help of MS Exel softwere and SPSS 16.0, the
value of the minimum = 12; maximum value = 21; average (mean) = 17.44; median = 17; mode at
= 17; standard deviation = 1.85.
Table 2. Description of the results of these studies can be categorized as follows
Interval Kategori Absolute %
81 % - 100% Sangat Baik 5 4.9
61 – 80 % Baik 86 84.3
41 – 60 % Tidak Baik 11 10.8
< 40 % Sangat Tidak Baik 0 0
Jumlah 102 100
From the above tables and figures known knowledge students Prodi PJKR FIK 2011 UNY
Force on game concepts and targets TGfU teaching materials, most of which are in the good
category by the number of 86 children, and then in the follow category is not well with the number
of 11 children, and the very good category with the number 5 children. From these results the
majority of students Prodi PJKR 84.3% UNY Force 2011 has a good level of knowledge.
Figure 1. Diagram level of knowledge
0
20
40
60
80
100
not very good,
0
not good, 11
good , 86
very good, 5
Fre
kue
nsi
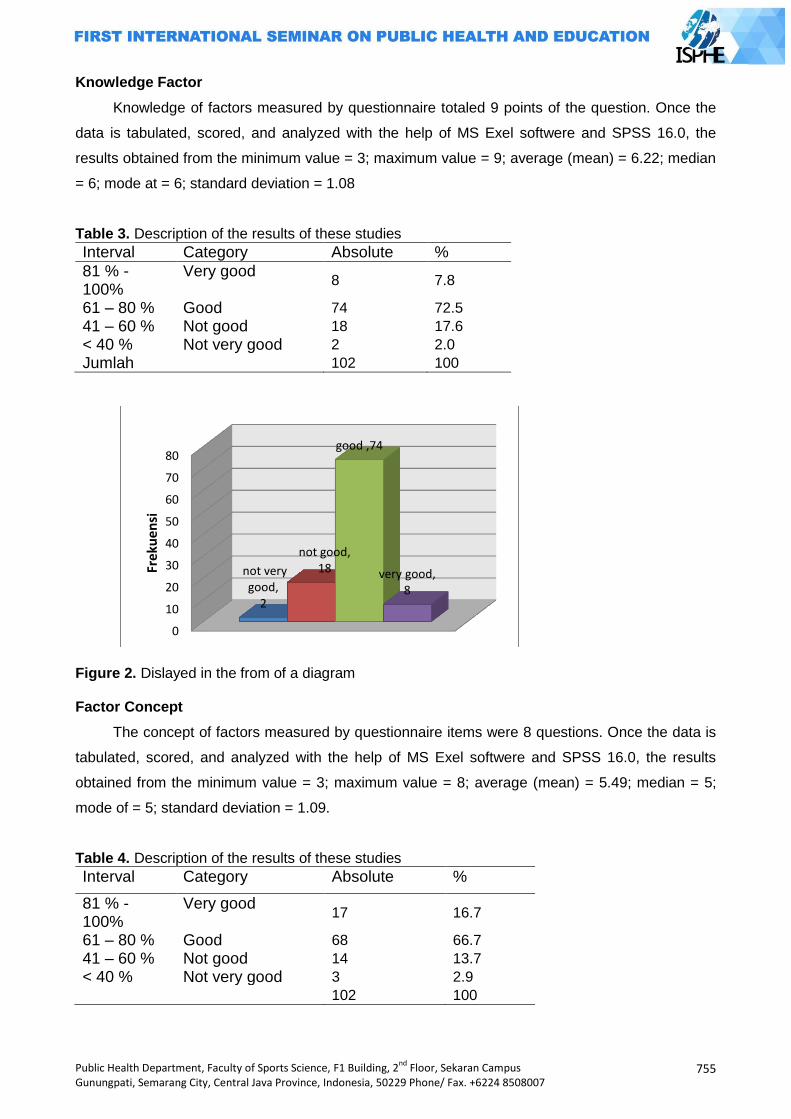
Public Health Department, Faculty of Sports Science, F1 Building, 2nd
Floor, Sekaran Campus Gunungpati, Semarang City, Central Java Province, Indonesia, 50229 Phone/ Fax. +6224 8508007
755
Knowledge Factor
Knowledge of factors measured by questionnaire totaled 9 points of the question. Once the
data is tabulated, scored, and analyzed with the help of MS Exel softwere and SPSS 16.0, the
results obtained from the minimum value = 3; maximum value = 9; average (mean) = 6.22; median
= 6; mode at = 6; standard deviation = 1.08
Table 3. Description of the results of these studies
Interval Category Absolute %
81 % - 100%
Very good 8 7.8
61 – 80 % Good 74 72.5
41 – 60 % Not good 18 17.6
< 40 % Not very good 2 2.0
Jumlah 102 100
Figure 2. Dislayed in the from of a diagram Factor Concept
The concept of factors measured by questionnaire items were 8 questions. Once the data is
tabulated, scored, and analyzed with the help of MS Exel softwere and SPSS 16.0, the results
obtained from the minimum value = 3; maximum value = 8; average (mean) = 5.49; median = 5;
mode of = 5; standard deviation = 1.09.
Table 4. Description of the results of these studies
Interval Category Absolute %
81 % - 100%
Very good 17 16.7
61 – 80 % Good 68 66.7
41 – 60 % Not good 14 13.7
< 40 % Not very good 3 2.9
102 100
0
10
20
30
40
50
60
70
80
not very good,
2
not good, 18
good ,74
very good, 8
Frek
uen
si
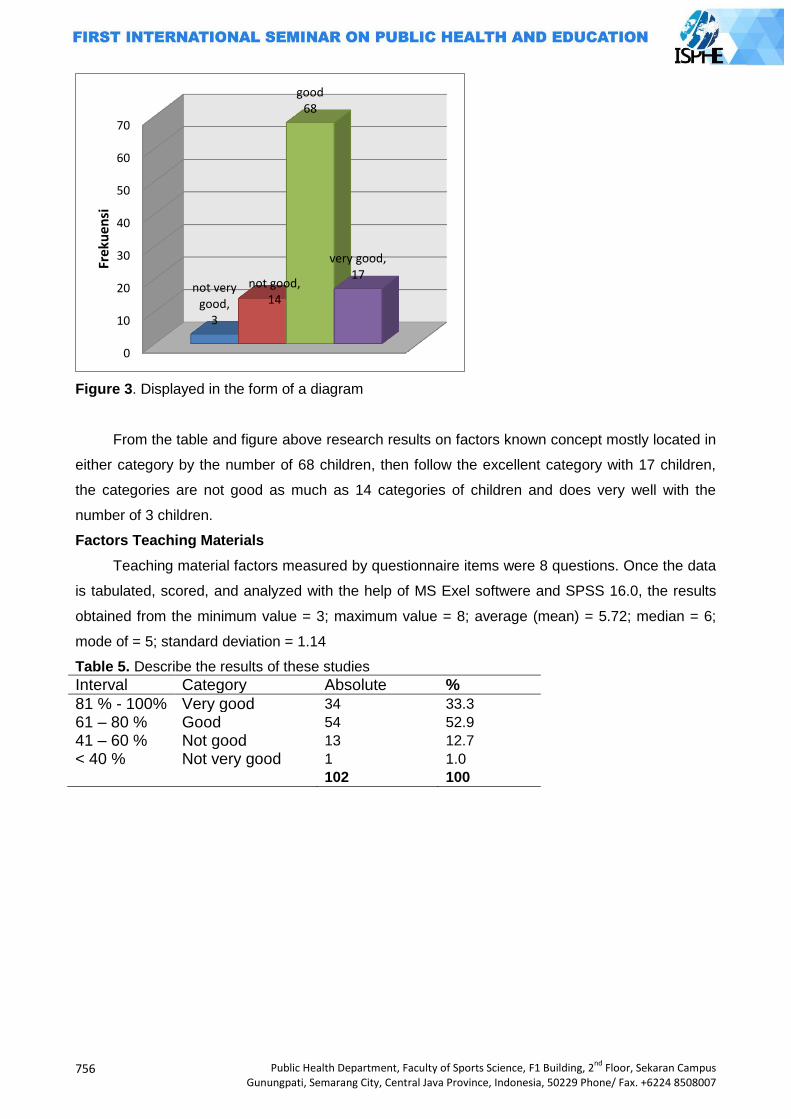
756
Public Health Department, Faculty of Sports Science, F1 Building, 2nd
Floor, Sekaran Campus Gunungpati, Semarang City, Central Java Province, Indonesia, 50229 Phone/ Fax. +6224 8508007
Figure 3. Displayed in the form of a diagram
From the table and figure above research results on factors known concept mostly located in
either category by the number of 68 children, then follow the excellent category with 17 children,
the categories are not good as much as 14 categories of children and does very well with the
number of 3 children.
Factors Teaching Materials
Teaching material factors measured by questionnaire items were 8 questions. Once the data
is tabulated, scored, and analyzed with the help of MS Exel softwere and SPSS 16.0, the results
obtained from the minimum value = 3; maximum value = 8; average (mean) = 5.72; median = 6;
mode of = 5; standard deviation = 1.14
Table 5. Describe the results of these studies
Interval Category Absolute %
81 % - 100% Very good 34 33.3
61 – 80 % Good 54 52.9
41 – 60 % Not good 13 12.7
< 40 % Not very good 1 1.0
102 100
0
10
20
30
40
50
60
70
not very good,
3
not good, 14
good 68
very good, 17
Fre
kue
nsi
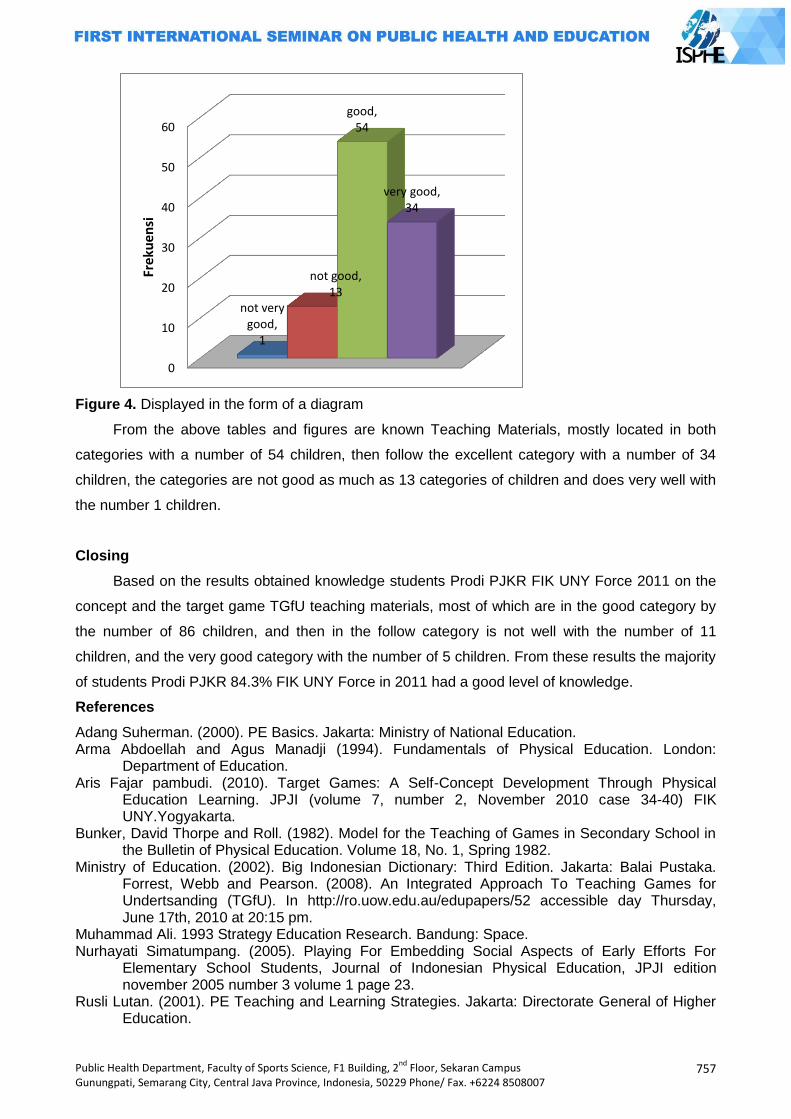
Public Health Department, Faculty of Sports Science, F1 Building, 2nd
Floor, Sekaran Campus Gunungpati, Semarang City, Central Java Province, Indonesia, 50229 Phone/ Fax. +6224 8508007
757
Figure 4. Displayed in the form of a diagram
From the above tables and figures are known Teaching Materials, mostly located in both
categories with a number of 54 children, then follow the excellent category with a number of 34
children, the categories are not good as much as 13 categories of children and does very well with
the number 1 children.
Closing
Based on the results obtained knowledge students Prodi PJKR FIK UNY Force 2011 on the
concept and the target game TGfU teaching materials, most of which are in the good category by
the number of 86 children, and then in the follow category is not well with the number of 11
children, and the very good category with the number of 5 children. From these results the majority
of students Prodi PJKR 84.3% FIK UNY Force in 2011 had a good level of knowledge.
References
Adang Suherman. (2000). PE Basics. Jakarta: Ministry of National Education. Arma Abdoellah and Agus Manadji (1994). Fundamentals of Physical Education. London:
Department of Education. Aris Fajar pambudi. (2010). Target Games: A Self-Concept Development Through Physical
Education Learning. JPJI (volume 7, number 2, November 2010 case 34-40) FIK UNY.Yogyakarta.
Bunker, David Thorpe and Roll. (1982). Model for the Teaching of Games in Secondary School in the Bulletin of Physical Education. Volume 18, No. 1, Spring 1982.
Ministry of Education. (2002). Big Indonesian Dictionary: Third Edition. Jakarta: Balai Pustaka. Forrest, Webb and Pearson. (2008). An Integrated Approach To Teaching Games for Undertsanding (TGfU). In http://ro.uow.edu.au/edupapers/52 accessible day Thursday, June 17th, 2010 at 20:15 pm.
Muhammad Ali. 1993 Strategy Education Research. Bandung: Space. Nurhayati Simatumpang. (2005). Playing For Embedding Social Aspects of Early Efforts For
Elementary School Students, Journal of Indonesian Physical Education, JPJI edition november 2005 number 3 volume 1 page 23.
Rusli Lutan. (2001). PE Teaching and Learning Strategies. Jakarta: Directorate General of Higher Education.
0
10
20
30
40
50
60
not very good,
1
not good, 13
good, 54
very good, 34
Fre
kue
nsi

758
Public Health Department, Faculty of Sports Science, F1 Building, 2nd
Floor, Sekaran Campus Gunungpati, Semarang City, Central Java Province, Indonesia, 50229 Phone/ Fax. +6224 8508007
Saryono & Soni Nopembri. (2009). The idea and concept of Basic Teaching Games for Understanding (TGfU), Indonesian Journal of Physical Education, April 2009 edition JPJI volume 6 number 1.
Soerjono Soekanto. (2009). An Introduction to Sociology. Jakarta: Rajawali Press. Sri Mawarti. (2005). Tactical Games Approach In Learning volleyball Elementary School Students
Indonesian Journal of Physical Education, JPJI November issue number 3 volume 1 page 13.
Suharsimi Arikunto. (2002). Research Procedure A Practical Approach. Jakarta: PT. Rineka Copyright
Public Health Department, Faculty of Sports Science, F1 Building, 2nd
Floor, Sekaran Campus Gunungpati, Semarang City, Central Java Province, Indonesia, 50229 Phone/ Fax. +6224 8508007
759
ROLE OF WOMEN IN WATER RESOURCES UTILIZATION EDUCATION FOR CHILDREN
Indah Prasetyawati Tri Purnama Sari
Yogyakarta State University, Indonesia
Corresponding Author: [email protected]
Abstract Water has so many benefits in everyday life. The presence of fresh water resources in some
areas might have been veryhard to find, especially in thedry season. The basis of education is from the family,the mother's role will greatly affect children's behavior. Mother and child in everyday life are mostin need of water, so children need tobe educated in the use of water. This paper aims to examine the role of mothers in educating the use of water resources to the child.
Education for the use of water resources is important to be delivered to children from an early age. Mothers have an important role in this thing. Mother and water might be seen as inseparable thing in everyday activities. Maternal behavior in the utilization of water resources will affect the day-to-day behavior.
Education utilization of water resources in the family is strongly influenced by maternal behavior. Mother is the one who likes to use water and then it will be used as a role model for her kids, so that a mother should give the right example. Wise usage of water in the family scope is a part of health education especially in the field of environmental health. Water management properly means maintaining the health and environmental sustainability. Key Words: Role, water resource utilization, education Introduction
Water resources are needed to support human life, plants and animals,therefore water
resources need to be managed well, so as to meet the needs of development. Lack of water can
lead to dry nessand the impact on the lives of living things in general, and humans in particular,
resulting in the declining health. Lack of water,in this case for human, might lead them easily
having some disease, because the human body is basically made up of water. The body needs at
least eight glasses of water in a day, to meet the needs of their body fluids, the rebyit avoids
dehydration.
The research done by National Resilience Institute of Indonesia (2013: 2-3) proved that
heachievement for the compliance of finest water quality for the Indonesian citizens reached
47.71% (in 2009) and it is targeted by 2015 should reach 68.87%. Meeting the needs of clean
water that is still acking is affected also because of rapid population growth. Water resources are
diminishing, and rapid population growth will further add to the increasing consumption of water in
the community.
Indonesiais ranked fourth in the world in population, after China (RRC), India, United States.
The population of Indonesia reaches 237 641 326, with a ratio of the percentage of the population
of menand women in 1000: 986 (Statistik.ptkpt, 2014). This great number of residents will affect
the use and consumption of water in each day as the citizens need it more.
Preservation of water resources should always be done so that the water is not on the wane.
It can be started from the family. Family is the most basic education, in addition to the family in this
760
Public Health Department, Faculty of Sports Science, F1 Building, 2nd
Floor, Sekaran Campus Gunungpati, Semarang City, Central Java Province, Indonesia, 50229 Phone/ Fax. +6224 8508007
case more women using water to meet daily needs. Starting from the mother's behavior in
exploiting and using water wisely, children will in directly mimica mother's habits. Women have
agreater role in the care of the house hold members and provide education in side the house. A
woman,in this case the mother,in culcates the habit and she becomes a role model for the kids to
manage the environment especially for water resources management. According to Dian.,et all
(2009: 5-9) in their study, 30 respondents indicate that the person who needs the most of wateris
the mother (15 respondents), for fathers and mothers (13 respondents), while the restare children
(11 respondents). Wateris used mainly for cooking, washing and cleaning the house.
Based on these results it is clear that more women using water for domestic purposes. So
many activities in which families use water course should be limited and managed, thus it saves
water resources. Management of water resources if it is clearly linked to the behavior will be
associated with the behavior of the health care environment. Thus it is clear that the behavior of
processing water resources will determine the degree of a healthy society. Water resources
management includes the use of clean water and used water utilization for other
purposes.Maternal behavior in the management of water resources is expected to encourage
habits for children to always live a healthy life, through the use offi nest water. This paper will
discuss the role of women in the educational aspect of water resources to the child.
The Role of Women
The woman is the figure that has the characteristics such as having menstruation,
pregnancy, and giving birth. On the one hand,the powers and duties of women will differ with the
task of husband. Woman gives the hard work, compassion, and care for his children. According to
Suwondo in Gurniwan (5) the duties of women in the family and society are as a function of internal
and external, among others; 1) as a wife, in order to accompany her husband as alover and friends
to get together to build a happy family. 2) as an educator and the mother of the younger
generation, so that children will be equipped with spiritual and physical strength in the face of all
the challenges of the times, and be useful for the home land. 3) as a regulator of the house hold,
the house hold that is safe and orderly place for the whole family. 4) as the labor and the
professions, working in government, private companies, politics, self-employed and so to increase
the revenue.5) as members of civil society organizations, particularly in women's organizations,
social agencies and others, to contribute to the community
Some tasks of the mother should be run as well as possible so that the family will be well
managed. Yet,the task of women is not really important as it is mentioned in point two, which is as
an educator of her children who will become the future generation. Family education is very
important because it will be the continuation of further education. In addition to being a mother, a
woman might work as maid. Women who take this job not only to take care of house hold needs,
but they also serve the care of children. This is due to the increasing emancipation of women so
that many wives have to work to meet daily needs.
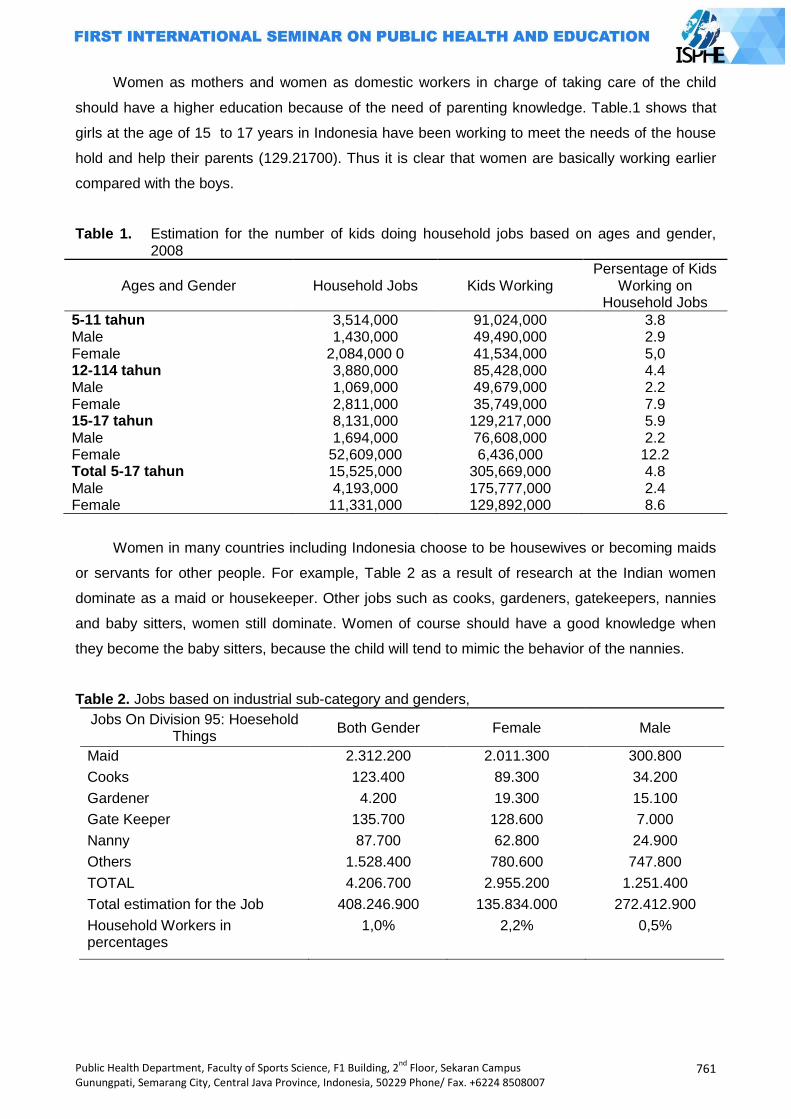
Public Health Department, Faculty of Sports Science, F1 Building, 2nd
Floor, Sekaran Campus Gunungpati, Semarang City, Central Java Province, Indonesia, 50229 Phone/ Fax. +6224 8508007
761
Women as mothers and women as domestic workers in charge of taking care of the child
should have a higher education because of the need of parenting knowledge. Table.1 shows that
girls at the age of 15 to 17 years in Indonesia have been working to meet the needs of the house
hold and help their parents (129.21700). Thus it is clear that women are basically working earlier
compared with the boys.
Table 1. Estimation for the number of kids doing household jobs based on ages and gender, 2008
Ages and Gender Household Jobs Kids Working Persentage of Kids
Working on Household Jobs
5-11 tahun 3,514,000 91,024,000 3.8 Male 1,430,000 49,490,000 2.9 Female 2,084,000 0 41,534,000 5,0 12-114 tahun 3,880,000 85,428,000 4.4 Male 1,069,000 49,679,000 2.2 Female 2,811,000 35,749,000 7.9 15-17 tahun 8,131,000 129,217,000 5.9 Male 1,694,000 76,608,000 2.2 Female 52,609,000 6,436,000 12.2 Total 5-17 tahun 15,525,000 305,669,000 4.8 Male 4,193,000 175,777,000 2.4 Female 11,331,000 129,892,000 8.6
Women in many countries including Indonesia choose to be housewives or becoming maids
or servants for other people. For example, Table 2 as a result of research at the Indian women
dominate as a maid or housekeeper. Other jobs such as cooks, gardeners, gatekeepers, nannies
and baby sitters, women still dominate. Women of course should have a good knowledge when
they become the baby sitters, because the child will tend to mimic the behavior of the nannies.
Table 2. Jobs based on industrial sub-category and genders,
Jobs On Division 95: Hoesehold Things
Both Gender Female Male
Maid 2.312.200 2.011.300 300.800
Cooks 123.400 89.300 34.200
Gardener 4.200 19.300 15.100
Gate Keeper 135.700 128.600 7.000
Nanny 87.700 62.800 24.900
Others 1.528.400 780.600 747.800
TOTAL 4.206.700 2.955.200 1.251.400
Total estimation for the Job 408.246.900 135.834.000 272.412.900
Household Workers in percentages
1,0% 2,2% 0,5%
762
Public Health Department, Faculty of Sports Science, F1 Building, 2nd
Floor, Sekaran Campus Gunungpati, Semarang City, Central Java Province, Indonesia, 50229 Phone/ Fax. +6224 8508007
Water Resources
Water is essential for human life. Humans will die faster from lack of water than lack of food.
The human body is mostly made up of water. The body of an adult, approximately consists of 55-
60% liters water per day body weight, while the children around 65%, and about 80% for the
infants. Human need for water is very complex, among others, for drinking, cooking, bathing, and
washing. According to the WHO in developed countries everyone requires between 60-120 liters of
water per day. While in developing countries, including Indonesia, each person requires between
30-60 liters of water per day. Water utilities are the main thing is for drinking (Soekidjo
Notoatmodjo, 2007:175).
Natural resource that must be properly managed is the water. The earth's surface is
composed of 71% water, but in some countries in the world, and some areas in Indonesia there is
still a case of lack of water. Water resources management in Indonesia is already set in the
legislation, so that people should be able to use it wisely. Law of the Republic of Indonesia No.7 of
2004 on water resources said that in the face of an imbalance between water availability and water
demand tends to decrease the growing, water resources must be managed with due regard to the
social function, economic and environmental harmony. Management of water resources need to be
directed to achieve synergy and harmonious integration between regions, between sectors, and
between generations, and that is in line with the spirit of democratization, decentralization, and
openness in the life of society, nation, and state, communities need to be given a role in water
resources management.
The participation of the society is of course very important for water resources management
as it aims to minimize water short ages. In chapter 23,it will be explained more about the
management of water resources. The management of water quality and water pollution control
intended to maintain and restore the quality of the existing sources of the water. Water quality
management is done by improving the water quality in water resources and water resources
infrastructure. Mean while, the water pollution control is done by preventing then try of water
pollution on water resources and water resources infrastructure. In detail,the Law of the Republic
of Indonesia No.7 of 2004 on water resources, set priorities utilization, conservation, control, ban
the destruction of water, use water permit, the obligation to pay if the damage, and also includes
the amount of penal provisions in case of violation.
Water is not only used for the house hold, but it is used for irrigation,and for the industry even
factories as well. According to Yonky.R.et al., (2013: 600) ,for the provision of clean water, water
environmental services in KSA/KPA Merapi area will also be used for irrigation and agricultural
associations who are members of Farmer Water User (P3A). Utilization of the water environmental
services should be able to take place on an on going basis. The benefit scan be felt not only now
but also for the future generations. Increased demand supply of the water must be concerned so
that it can support the needs of people in the present and future.
Public Health Department, Faculty of Sports Science, F1 Building, 2nd
Floor, Sekaran Campus Gunungpati, Semarang City, Central Java Province, Indonesia, 50229 Phone/ Fax. +6224 8508007
763
Role of women in water resources utilization educationto children
Participation of women in water resources management is very important. The control over
water resources that sustainlife are still largely out of reach of the hands of women. Women's daily
activities cannot be separated from the use of water, especially for the cleanwater. Water use in
the family is allocated for cooking, drinking, using water to clean clothes, kitchen appliances,
furniture, mopping and watering the plants.
Water resources that are managed properly will create environmental health and the health
of the use of water. Most of the water is used by human, and most widely used is the women.
According to July. S (2011: 158-159) women and children use the most water. Women using water
for daily needs, such as bathing, washing, drinking, washing clothes, cleaning the house, garden,
washing the vehicle, praying,and others.
The presence of a clean water source that can beutilized by the public,is of course,very
helpful. It simplifies and lightens the burden of the life of society in general and women in
particular. A mother in the management of water will pick, take, store, maintain, and utilize water,
indirectly and it will become a habit that is imitated by children. If the circumstances and attitudes
of his parents, especially mothers, to the environment in general and water are in particular good,
healthy, sanitary, then the children will be welling rained the habit anyway. Parents in instilling a
state of water resources management are also influenced by education attained. The higher the
education the more science and knowledge gained so that it will be easier to educate and nurture
the children.
According to Nanang M (2012: 194-195), education is an effort to pass on values, which will
be a helper and decisive in the running life of mankind, as well as to improve the lot of human
beings and civilization. Education, if it is neglected, it is believed that human at this time will not be
much different from the past generations, so it will be seen that man now are left so far behind in
terms of the quality of life and empowerment processes. The function of education as an agent of
change can be used as an educational tool for the cultivation of values in individuals, so that
individuals can change the mindset and it can provide insight on individual about things that had
not been widely known by the society.
Efforts to pass values through the education needs to be done early, starting from the family
as the first educational environment for the children. According to Schaefer, RT(2012: 50), family is
a group of people who are connected by blood, marriage or other relationship agreed, or adoption
by sharing the basic responsibility for the reproduction and maintenance of community members.
There are many factors that complicate the transition in care and home care. First, it is very few to
anticipate socialization for social roles and parenting. Second, it is only a little learning occurs
during pregnancy. Third, the transition to parenthood is too sudden. So, the duty of care cannot be
run in stages.
Environmental management is important to be implemented because it will support the life of
all living beings in the world, especially human beings. Great sustainable management will provide
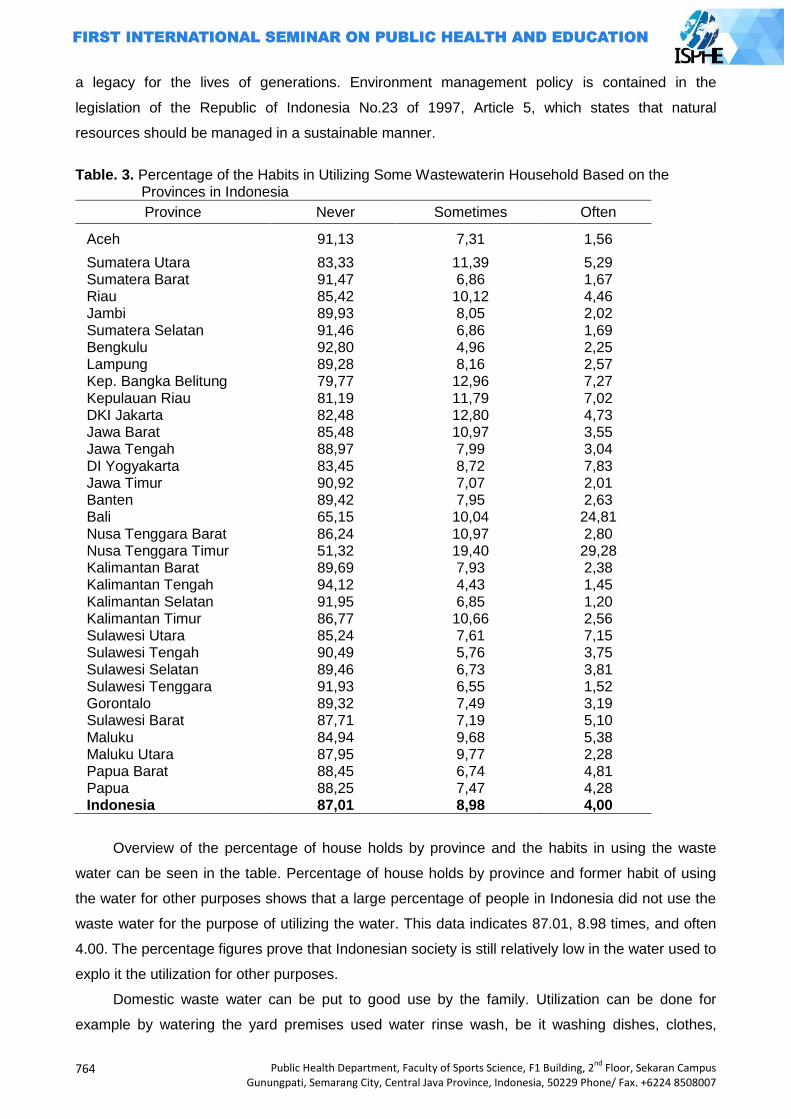
764
Public Health Department, Faculty of Sports Science, F1 Building, 2nd
Floor, Sekaran Campus Gunungpati, Semarang City, Central Java Province, Indonesia, 50229 Phone/ Fax. +6224 8508007
a legacy for the lives of generations. Environment management policy is contained in the
legislation of the Republic of Indonesia No.23 of 1997, Article 5, which states that natural
resources should be managed in a sustainable manner.
Table. 3. Percentage of the Habits in Utilizing Some Wastewaterin Household Based on the
Provinces in Indonesia
Province Never Sometimes Often
Aceh 91,13 7,31 1,56
Sumatera Utara 83,33 11,39 5,29 Sumatera Barat 91,47 6,86 1,67 Riau 85,42 10,12 4,46 Jambi 89,93 8,05 2,02 Sumatera Selatan 91,46 6,86 1,69 Bengkulu 92,80 4,96 2,25 Lampung 89,28 8,16 2,57 Kep. Bangka Belitung 79,77 12,96 7,27 Kepulauan Riau 81,19 11,79 7,02 DKI Jakarta 82,48 12,80 4,73 Jawa Barat 85,48 10,97 3,55 Jawa Tengah 88,97 7,99 3,04 DI Yogyakarta 83,45 8,72 7,83 Jawa Timur 90,92 7,07 2,01 Banten 89,42 7,95 2,63 Bali 65,15 10,04 24,81 Nusa Tenggara Barat 86,24 10,97 2,80 Nusa Tenggara Timur 51,32 19,40 29,28 Kalimantan Barat 89,69 7,93 2,38 Kalimantan Tengah 94,12 4,43 1,45 Kalimantan Selatan 91,95 6,85 1,20 Kalimantan Timur 86,77 10,66 2,56 Sulawesi Utara 85,24 7,61 7,15 Sulawesi Tengah 90,49 5,76 3,75 Sulawesi Selatan 89,46 6,73 3,81 Sulawesi Tenggara 91,93 6,55 1,52 Gorontalo 89,32 7,49 3,19 Sulawesi Barat 87,71 7,19 5,10 Maluku 84,94 9,68 5,38 Maluku Utara 87,95 9,77 2,28 Papua Barat 88,45 6,74 4,81 Papua 88,25 7,47 4,28 Indonesia 87,01 8,98 4,00
Overview of the percentage of house holds by province and the habits in using the waste
water can be seen in the table. Percentage of house holds by province and former habit of using
the water for other purposes shows that a large percentage of people in Indonesia did not use the
waste water for the purpose of utilizing the water. This data indicates 87.01, 8.98 times, and often
4.00. The percentage figures prove that Indonesian society is still relatively low in the water used to
explo it the utilization for other purposes.
Domestic waste water can be put to good use by the family. Utilization can be done for
example by watering the yard premises used water rinse wash, be it washing dishes, clothes,
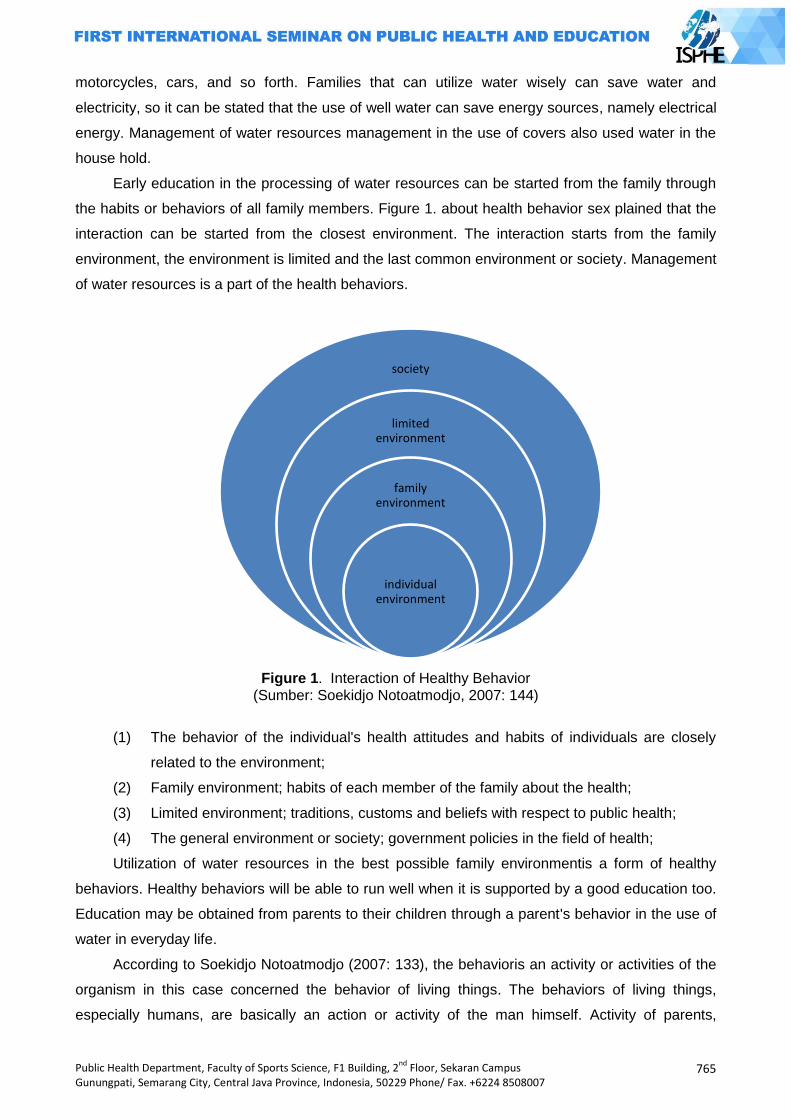
Public Health Department, Faculty of Sports Science, F1 Building, 2nd
Floor, Sekaran Campus Gunungpati, Semarang City, Central Java Province, Indonesia, 50229 Phone/ Fax. +6224 8508007
765
motorcycles, cars, and so forth. Families that can utilize water wisely can save water and
electricity, so it can be stated that the use of well water can save energy sources, namely electrical
energy. Management of water resources management in the use of covers also used water in the
house hold.
Early education in the processing of water resources can be started from the family through
the habits or behaviors of all family members. Figure 1. about health behavior sex plained that the
interaction can be started from the closest environment. The interaction starts from the family
environment, the environment is limited and the last common environment or society. Management
of water resources is a part of the health behaviors.
Figure 1. Interaction of Healthy Behavior (Sumber: Soekidjo Notoatmodjo, 2007: 144)
(1) The behavior of the individual's health attitudes and habits of individuals are closely
related to the environment;
(2) Family environment; habits of each member of the family about the health;
(3) Limited environment; traditions, customs and beliefs with respect to public health;
(4) The general environment or society; government policies in the field of health;
Utilization of water resources in the best possible family environmentis a form of healthy
behaviors. Healthy behaviors will be able to run well when it is supported by a good education too.
Education may be obtained from parents to their children through a parent's behavior in the use of
water in everyday life.
According to Soekidjo Notoatmodjo (2007: 133), the behavioris an activity or activities of the
organism in this case concerned the behavior of living things. The behaviors of living things,
especially humans, are basically an action or activity of the man himself. Activity of parents,
society
limited environment
family environment
individual environment
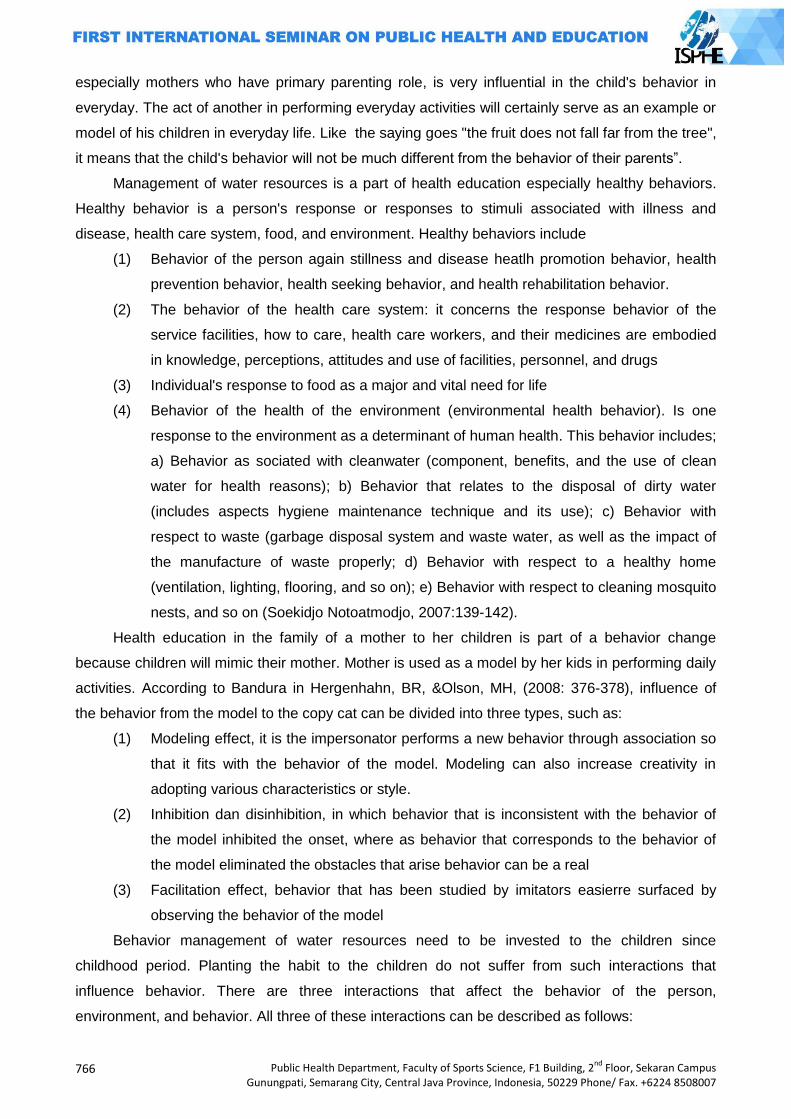
766
Public Health Department, Faculty of Sports Science, F1 Building, 2nd
Floor, Sekaran Campus Gunungpati, Semarang City, Central Java Province, Indonesia, 50229 Phone/ Fax. +6224 8508007
especially mothers who have primary parenting role, is very influential in the child's behavior in
everyday. The act of another in performing everyday activities will certainly serve as an example or
model of his children in everyday life. Like the saying goes "the fruit does not fall far from the tree",
it means that the child's behavior will not be much different from the behavior of their parents”.
Management of water resources is a part of health education especially healthy behaviors.
Healthy behavior is a person's response or responses to stimuli associated with illness and
disease, health care system, food, and environment. Healthy behaviors include
(1) Behavior of the person again stillness and disease heatlh promotion behavior, health
prevention behavior, health seeking behavior, and health rehabilitation behavior.
(2) The behavior of the health care system: it concerns the response behavior of the
service facilities, how to care, health care workers, and their medicines are embodied
in knowledge, perceptions, attitudes and use of facilities, personnel, and drugs
(3) Individual's response to food as a major and vital need for life
(4) Behavior of the health of the environment (environmental health behavior). Is one
response to the environment as a determinant of human health. This behavior includes;
a) Behavior as sociated with cleanwater (component, benefits, and the use of clean
water for health reasons); b) Behavior that relates to the disposal of dirty water
(includes aspects hygiene maintenance technique and its use); c) Behavior with
respect to waste (garbage disposal system and waste water, as well as the impact of
the manufacture of waste properly; d) Behavior with respect to a healthy home
(ventilation, lighting, flooring, and so on); e) Behavior with respect to cleaning mosquito
nests, and so on (Soekidjo Notoatmodjo, 2007:139-142).
Health education in the family of a mother to her children is part of a behavior change
because children will mimic their mother. Mother is used as a model by her kids in performing daily
activities. According to Bandura in Hergenhahn, BR, &Olson, MH, (2008: 376-378), influence of
the behavior from the model to the copy cat can be divided into three types, such as:
(1) Modeling effect, it is the impersonator performs a new behavior through association so
that it fits with the behavior of the model. Modeling can also increase creativity in
adopting various characteristics or style.
(2) Inhibition dan disinhibition, in which behavior that is inconsistent with the behavior of
the model inhibited the onset, where as behavior that corresponds to the behavior of
the model eliminated the obstacles that arise behavior can be a real
(3) Facilitation effect, behavior that has been studied by imitators easierre surfaced by
observing the behavior of the model
Behavior management of water resources need to be invested to the children since
childhood period. Planting the habit to the children do not suffer from such interactions that
influence behavior. There are three interactions that affect the behavior of the person,
environment, and behavior. All three of these interactions can be described as follows:
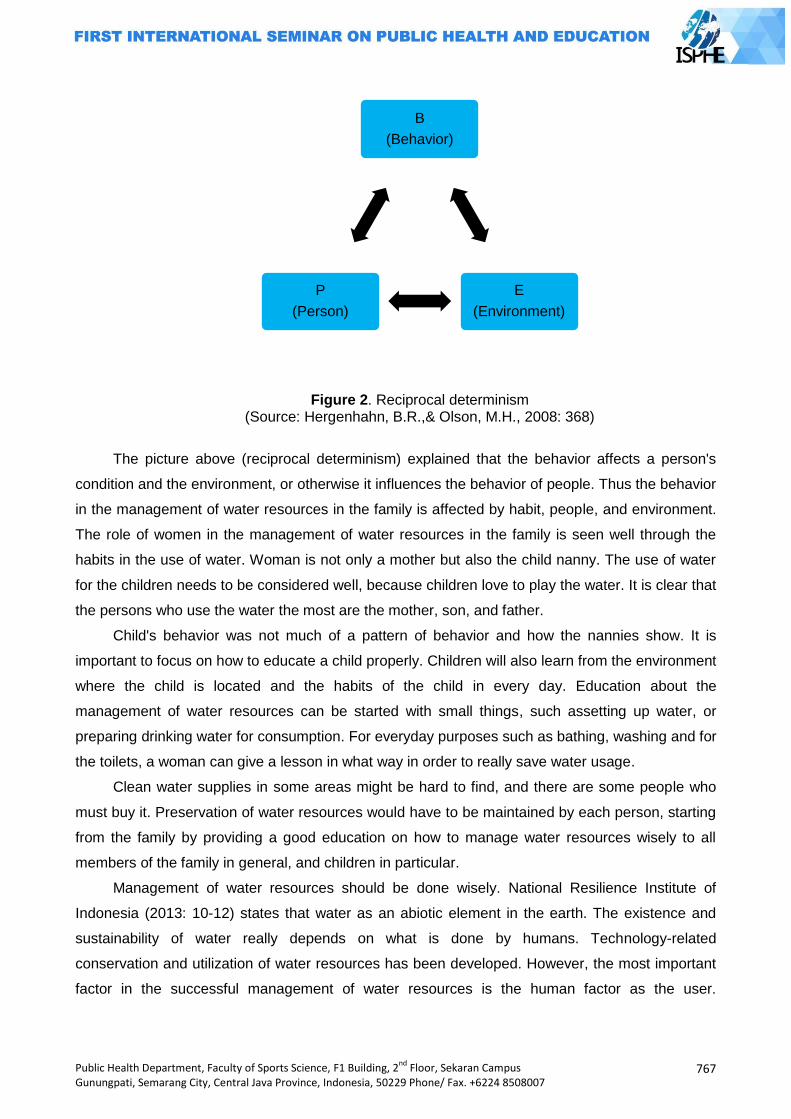
Public Health Department, Faculty of Sports Science, F1 Building, 2nd
Floor, Sekaran Campus Gunungpati, Semarang City, Central Java Province, Indonesia, 50229 Phone/ Fax. +6224 8508007
767
Figure 2. Reciprocal determinism (Source: Hergenhahn, B.R.,& Olson, M.H., 2008: 368)
The picture above (reciprocal determinism) explained that the behavior affects a person's
condition and the environment, or otherwise it influences the behavior of people. Thus the behavior
in the management of water resources in the family is affected by habit, people, and environment.
The role of women in the management of water resources in the family is seen well through the
habits in the use of water. Woman is not only a mother but also the child nanny. The use of water
for the children needs to be considered well, because children love to play the water. It is clear that
the persons who use the water the most are the mother, son, and father.
Child's behavior was not much of a pattern of behavior and how the nannies show. It is
important to focus on how to educate a child properly. Children will also learn from the environment
where the child is located and the habits of the child in every day. Education about the
management of water resources can be started with small things, such assetting up water, or
preparing drinking water for consumption. For everyday purposes such as bathing, washing and for
the toilets, a woman can give a lesson in what way in order to really save water usage.
Clean water supplies in some areas might be hard to find, and there are some people who
must buy it. Preservation of water resources would have to be maintained by each person, starting
from the family by providing a good education on how to manage water resources wisely to all
members of the family in general, and children in particular.
Management of water resources should be done wisely. National Resilience Institute of
Indonesia (2013: 10-12) states that water as an abiotic element in the earth. The existence and
sustainability of water really depends on what is done by humans. Technology-related
conservation and utilization of water resources has been developed. However, the most important
factor in the successful management of water resources is the human factor as the user.
B
(Behavior)
E
(Environment)
P
(Person)
768
Public Health Department, Faculty of Sports Science, F1 Building, 2nd
Floor, Sekaran Campus Gunungpati, Semarang City, Central Java Province, Indonesia, 50229 Phone/ Fax. +6224 8508007
Preservation of local wisdom has been entrenched for generations in the management of water
resources.
Efforts to build national-level water resistance should be a national agenda. The number of
growing population and increasing water demand, making the presence of water is increasingly
important. Water availability becomes a vital factor and simultaneously determines the success of
development of a nation. Water use should be concerned with elements of sustainability and
preservation of special areas for water.
Closing
Availability of water resources is dwindling, and the population of Indonesian people is
growing fast. It needs to manage the water resources wisely. Family as the basic education and
maternal environment as most water users should be able to utilize the water and provide water
management education to their children. Indirectly parents as models to be imitated as a child
process of knowledge transfer. Water resources management is not only individual responsibility,
but it is the responsibility of all people as well. Thus, the water resources should be maintained
continuously, and it can be passed down for generations.
References
Dian. W.,et al. 2009. Perempuan dalam Pengelolaan Sumber Daya Air di Desa Rahtawu,
Kabupaten Kudus .Jurnal Sosbud UMK. 2(2) :1-13.
Gurniwan. …… Peranan Wanita dalam Kepemimpinan dan Politik.
Hergenhahn, B.R.,& Olson, M.H., 2008. Theories of Learning. 7th. Jakarta: Kencana
International Labour Office.2014. Estimasi Pekerja Rumah Tangga Global Dan Regional.
Juli, S. 2011, Kesehatan Lingkungan. Yogyakarta: Gadjah Mada University Press.
Nanang, M. 2012. Sosiologi: Persektif Klasik, Modern, Posmodern, dan Poskolonial. Jakarta:
Rajawali Pers.
Schaefer, R.T., 2012. Sosiologi.Jakarta: Penerbit Salemba
Soekidjo, N. 2007.Promosi Kesehatan dan Ilmu Perilaku.Jakarta: Rineka Cipta
Soekidjo, N. 2007.Kesehatan Masyarakat: Ilmu dan Seni. Jakarta: Rineka Cipta.
Statistik PTKPT. Jumlah Penduduk: di Seluruh Dunia. 2014
Yonky R. et al., 2013. Identifikasi Pemanfaatan Jasa Lingkungan Air di KSA/KPA Merapi Propinsi
Sumatera Barat. Prosiding Seminar Nasional Pengelolaan Sumber Daya Alam dan
Lingkungan. 598-603
………….. 2013. Pengelolaan Sumber Daya Air Guna Mendukung Pembangunan Nasional dalam
Rangka Ketahanan Nasional. Jurnal Kajian Lemhannas RI. 15 (6):50-61
Related Documents