Is the Minimally Important Difference Really 0.50 of a Standard Deviation? Ron D. Hays, Ph.D. June 18, 2004

Is the Minimally Important Difference Really 0.50 of a Standard Deviation? Ron D. Hays, Ph.D. June 18, 2004.
Dec 28, 2015
Welcome message from author
This document is posted to help you gain knowledge. Please leave a comment to let me know what you think about it! Share it to your friends and learn new things together.
Transcript

Is the Minimally Important Difference Really 0.50 of a Standard Deviation?
Ron D. Hays, Ph.D.
June 18, 2004

2
Some Key Citations Crosby, R.D., Kolotkin, R.L., & Williams, G.R. (2003). Defining
clinically meaningful change in health-related quality of life. J Clin Epi., 56, 395-407.
Norman, G. R., Sloan, J. A., & Wyrwich, K. W. (2003). Interpretation of changes in health-related quality of life: The remarkable universality of half a standard deviation. Med Care, 41 (5), 582-592.
Farivar, S. S., Liu, H., & Hays, R. D. (in press). Another look at the half standard deviation estimate of the minimally important difference in health-related quality of life scores. Pharmacoeconomics and Outcomes Research.

3
Minimally Important Difference (MID)
One can observe a difference between two groups or within one group over time that is statistically significance, but the difference could be small.
With a large enough sample size, even a tiny difference could be statistically significant.
The MID is the smallest difference that we care about. Focus is on scale
4
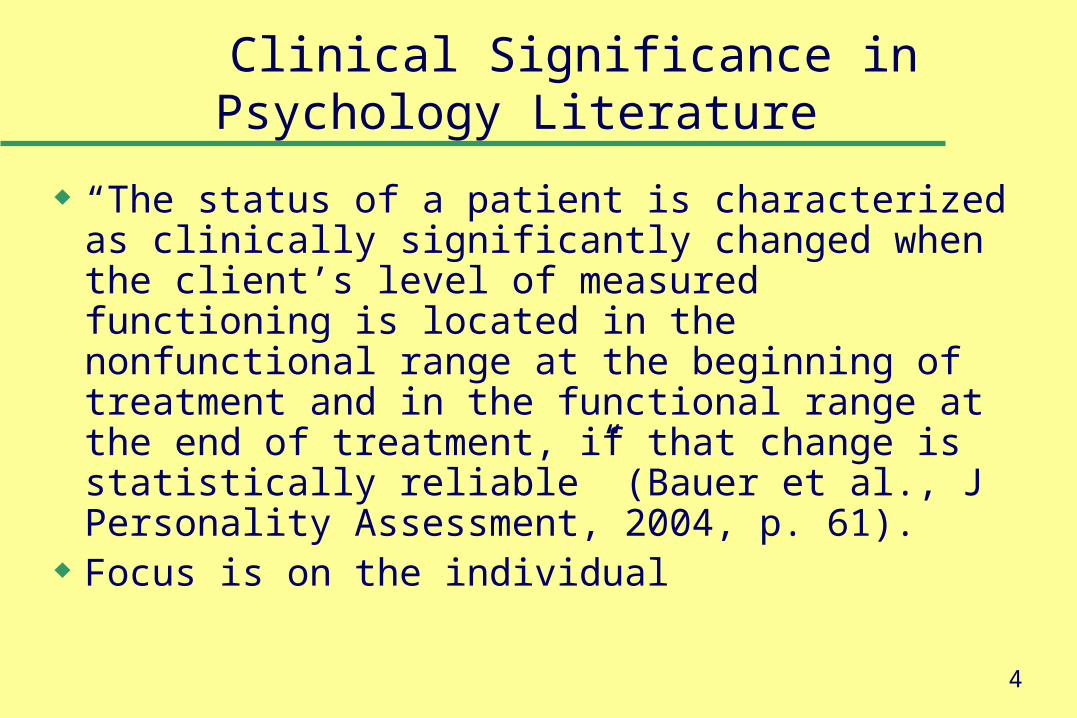
Clinical Significance in Psychology Literature
“The status of a patient is characterized as clinically significantly changed when the client’s level of measured functioning is located in the nonfunctional range at the beginning of treatment and in the functional range at the end of treatment, if that change is statistically reliable” (Bauer et al., J Personality Assessment, 2004, p. 61).
Focus is on the individual

5
Without Specific Information about Scale MID, We Rely on Effect Size Benchmarks
• Small: 0.20->0.49
• Moderate: 0.50->0.79
• Large: 0.80 or above

6
Distribution-Based “Estimation” of MID
Provides no direct information about the MID
– Effect size (ES) = D/SD– Standardized Response Mean (SRM) = D/SD†
– Guyatt responsiveness statistic (RS) = D/SD‡
D = raw score change in “changed” group;
SD = baseline SD;
SD† = SD of D;
SD‡ = SD of D among “unchanged”
7
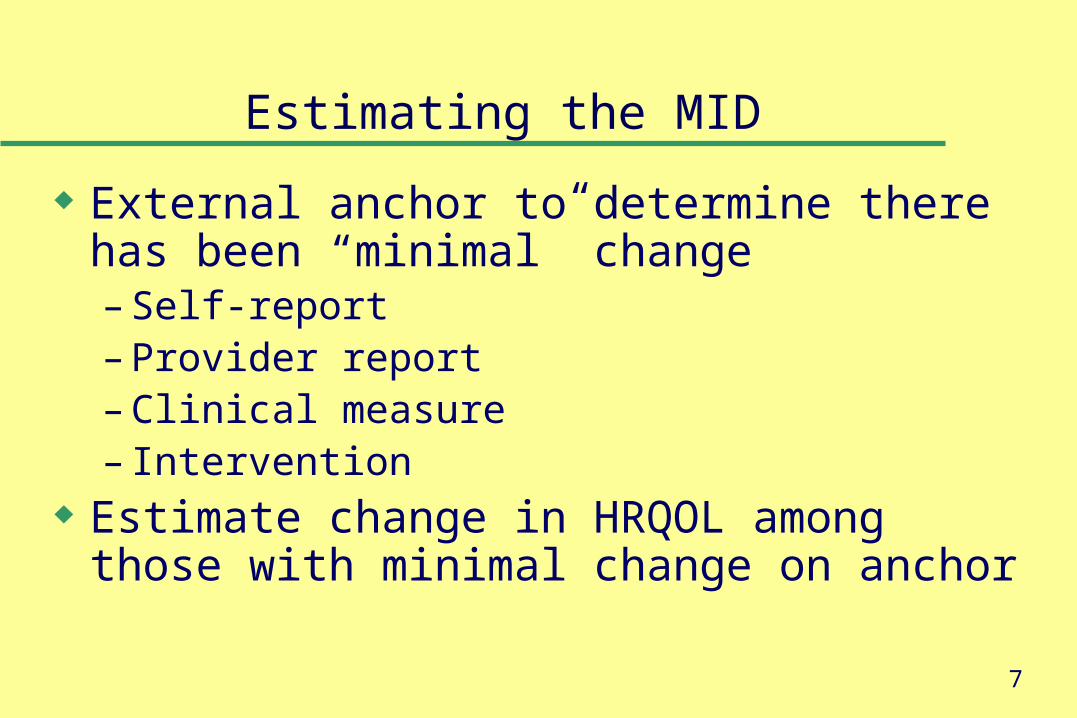
Estimating the MID
External anchor to determine there has been “minimal” change – Self-report– Provider report– Clinical measure – Intervention
Estimate change in HRQOL among those with minimal change on anchor

8
Terminology
Minimally Important Difference (MID)
-> Minimally Detectable Difference (MDD)-> Clinically Important Difference (CID)
Obviously Important Difference (OID)

9
Self-Report Anchor
People who report a “minimal” change How is your physical health now compared to 4
weeks ago? Much improved; Moderately Improved; Minimally Improved; No Change; Minimally Worse; Moderately Worse; Much Worse
10
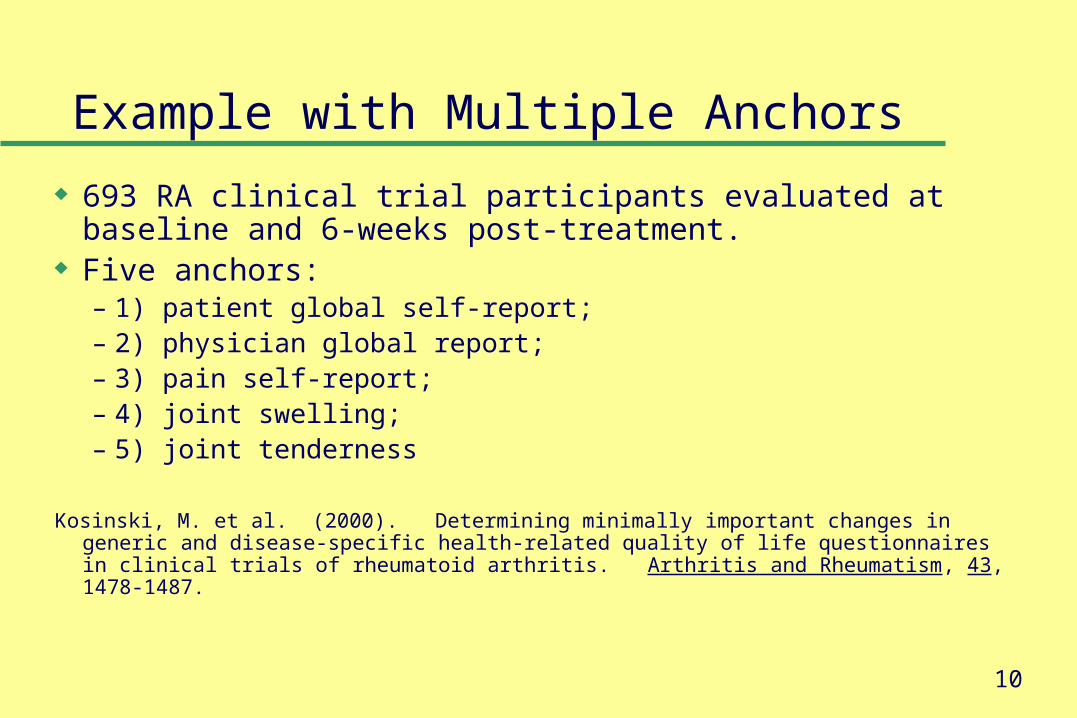
Example with Multiple Anchors
693 RA clinical trial participants evaluated at baseline and 6-weeks post-treatment.
Five anchors: – 1) patient global self-report; – 2) physician global report; – 3) pain self-report; – 4) joint swelling; – 5) joint tenderness
Kosinski, M. et al. (2000). Determining minimally important changes in generic and disease-specific health-related quality of life questionnaires in clinical trials of rheumatoid arthritis. Arthritis and Rheumatism, 43, 1478-1487.

11
Patient and Physician Global Reports How the patient is doing, considering all the ways that RA
affects him/here?Very good (asymptomatic and no limitation of normal activities)Good (mild symptoms and no limitation of normal activities)Fair (moderate symptoms and limitation of normal activities)Poor (severe symptoms and inability to carry out most normal
activities)Very poor (very severe symptoms that are intolerable and inability to
carry out normal activities)
--> Improvement of 1 level over time

12
Global Pain, Joint Swelling and Tenderness
Global Pain– 10 centimeter visual analog scale
– 0 = no pain, 10 = severe pain Number of swollen and tender joints
-> 1-20% improvement over time

13
Norman, Sloan, Wyrwich (2003)
“Interpretation of Changes in Health-related Quality of Life: The remarkable universality of half a standard deviation”Table 1 reports estimates of MIDs for 33 published articles.“For all but 6 studies, the MID estimates were close to one half a SD (mean = 0.495, SD = 0.155)” (p. 582).

14
Why not accept 0.50 SD as MID?
Based on 33 published articles. – While 33 may seem like a large number of studies, not really a
very large sample size for statistical analysis. Problems with Norman et al. paper
– Included an article based on a 6-minute walk test– Included articles with anchors that did not necessarily represent
minimal change– Selective reporting of HRQOL results– Included articles with no estimates of MID
Wide variation in estimates of MID

15
Six-minute Walk Test is not HRQOL
Studied 112 people with stable COPD. Norman et al. reported an ES of 0.43 (0.31-0.54) for 6-minute walk test based on a comparison of “about the same” versus “a little better” and “about the same” with “a little bit worse.”
Redelmeier et al. (1997)
16
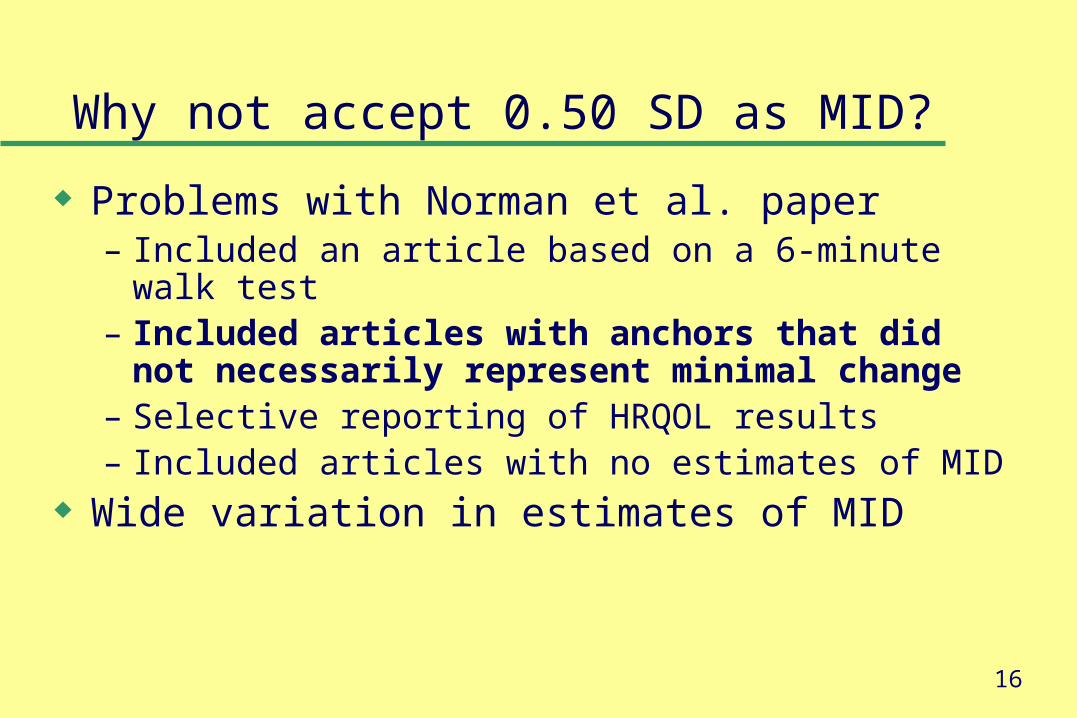
Why not accept 0.50 SD as MID?
Problems with Norman et al. paper– Included an article based on a 6-minute walk test– Included articles with anchors that did not necessarily
represent minimal change– Selective reporting of HRQOL results– Included articles with no estimates of MID
Wide variation in estimates of MID

17
Getting Hit By Bike is > MinimalGetting Hit by Rock is Closer to MID
00.5
11.5
22.5
33.5
44.5
5
Change in
Physical
Function
Size of Intervention
RockBike

18
Mean Scores of NEI RQL Scales Before and After Surgery (n = 185)
Scale
Before
After
Change
t-statistic
p-value
Effect Size
Clarity of vision
83.31
84.95
1.64
1.17
0.2431
0.11
Expectations
14.05
55.81
41.76
13.4
<.0001
1.77
Near vision
78.40
87.72
9.32
5.88
<.0001
0.45
Far vision
81.92
89.38
7.46
6.75
<.0001
0.53
Diurnal fluctuations
72.21
76.62
4.41
2.18
0.0305
0.19
Activity limitations
64.28
93.46
29.18
14.68
<.0001
1.18
Glare scale
74.73
67.09
-7.64
-3.13
0.0020
-.29
Symptoms
78.53
84.76
6.23
4.70
<.0001
0.36
Dependence on correction
26.08
83.85
57.77
29.71
<.0001
2.29
Worry
64.53
77.64
13.11
7.90
<.0001
0.62
Suboptimal correction
86.21
96.55
10.34
5.90
<.0001
0.46
Appearance
64.28
91.79
27.52
10.80
<.0001
0.90
Satisfaction with correction
56.41
82.61
26.20
11.41
<.0001
1.10

19
Anchor doesn’t represent minimal change
Looked at change on MOS-HIV and MQOL-HIV in 296 persons with AIDS who improved (better and much better)--not an estimate of MID.
Badia et al. (2000)

20
Why not accept 0.50 SD as MID?
Problems with Norman et al. paper– Included an article based on a 6-minute walk test– Included articles with anchors that did not necessarily
represent minimal change– Selective reporting of HRQOL results– Included articles with no estimates of MID
Wide variation in estimates of MID

21
Anchor Doesn’t Represent Minimal Change (Also Selective Reporting)
Estimated change in RQLQ (ES = 0.48) for 19 new rhinitis patients before and after seeing an allergist who prescribed a new medication regimen.
Don’t know magnitude of the intervention. In addition, SF-36 data not included. Average ES for SF-36 was
0.29.
Bagenstowe and Bernstein

22
Why not accept 0.50 SD as MID?
Problems with Norman et al. paper– Included an article based on a 6-minute walk test– Included articles with anchors that did not necessarily represent
minimal change– Selective reporting of HRQOL results– Included articles with no estimates of MID
Wide variation in estimates of MID

23
ES derived from assumed MID differences
Wyrwich et al. (1999) studied 605 CAD/CHF patients and Wyrwich et al. (1999) evaluated 417 COPD patients. No anchors were used in these studies. ES of 0.36 and 0.35 for the CHQ and CRQ were based on previously reported MID recommendations.ES = 0.35 for CRQ =
0.5 MID guideline/SD in sample of 417 COPD patients.

24
Why not accept 0.50 SD as MID?
Problems with Norman et al. paper– Included an article based on a 6-minute walk test– Included articles with anchors that did not necessarily represent
minimal change– Selective reporting of HRQOL results– Included articles with no estimates of MID
Wide variation in estimates of MID
25
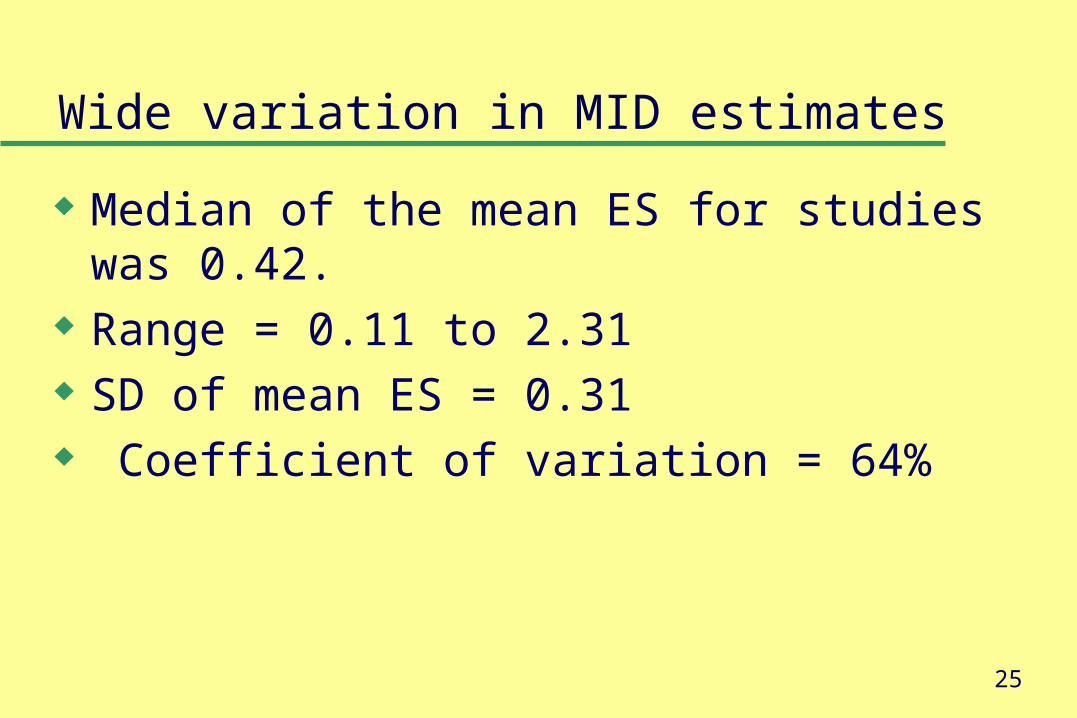
Wide variation in MID estimates
Median of the mean ES for studies was 0.42. Range = 0.11 to 2.31 SD of mean ES = 0.31 Coefficient of variation = 64%
26
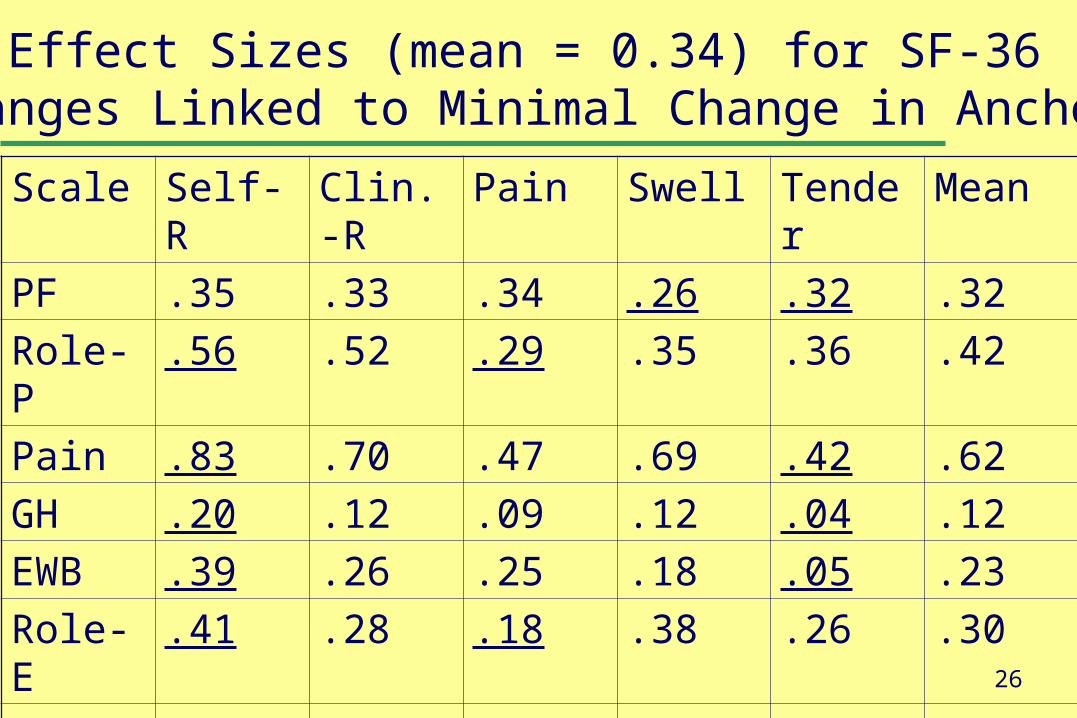
Effect Sizes (mean = 0.34) for SF-36 Changes Linked to Minimal Change in Anchors
Scale Self-R Clin.-R Pain Swell Tender Mean
PF .35 .33 .34 .26 .32 .32
Role-P .56 .52 .29 .35 .36 .42
Pain .83 .70 .47 .69 .42 .62
GH .20 .12 .09 .12 .04 .12
EWB .39 .26 .25 .18 .05 .23
Role-E .41 .28 .18 .38 .26 .30
SF .43 .34 .28 .29 .38 .34
EF .50 .47 .22 .22 .35 .35
PCS .49<- .48 .34 .29 .36 .39
MCS .42<- .27 .19 .27 .20 .27

27
Conclusions and Recommendations for Estimating the MID
It is easier to conclude that a difference is clearly or obviously important than it is to say one is always unimportant.
Best way to estimate MID– Use multiple anchors– Use anchors that represent minimum change
Because of variation in estimates of MID– Report range, inter-quartile range, and confidence intervals
around mean estimates.

28
Preparation for this presentation was supported in part by funding from the UCLA/DREW Project EXPORT, National Institutes of Health, National Center on Minority Health & Health Disparities, (P20-MD00148-01) and the UCLA Center for Health Improvement in Minority Elders / Resource Centers for Minority Aging Research, National Institutes of Health, National Institute of Aging, (AG-02-004).

29
Appendix Slides

30
Interpreting Data with Control Group: MID = ?
Change #1
Control group - 4
Intervention Group 0
31
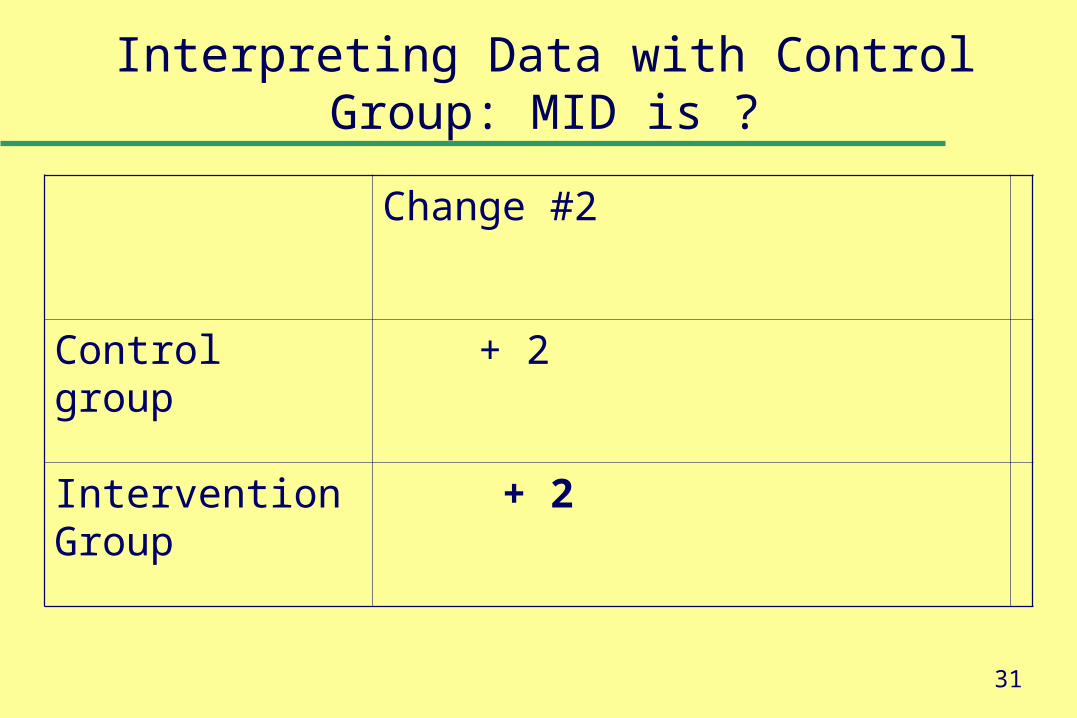
Interpreting Data with Control Group: MID is ?
Change #2
Control group + 2
Intervention Group + 2

32
Interpreting Data with Control Group: MID = 4
Change #3
Control group + 2
Intervention Group + 4

33
Summary of Interpreting Data with Control Group
Change #1 Change #2 Change #3
Control - 4 + 2 + 2
Intervention 0 + 2 + 4

34
Standard Error of Measurement
SEM = SD * SQRT (1-reliability)
1 SEM = 0.50 SD when reliability is 0.75
35
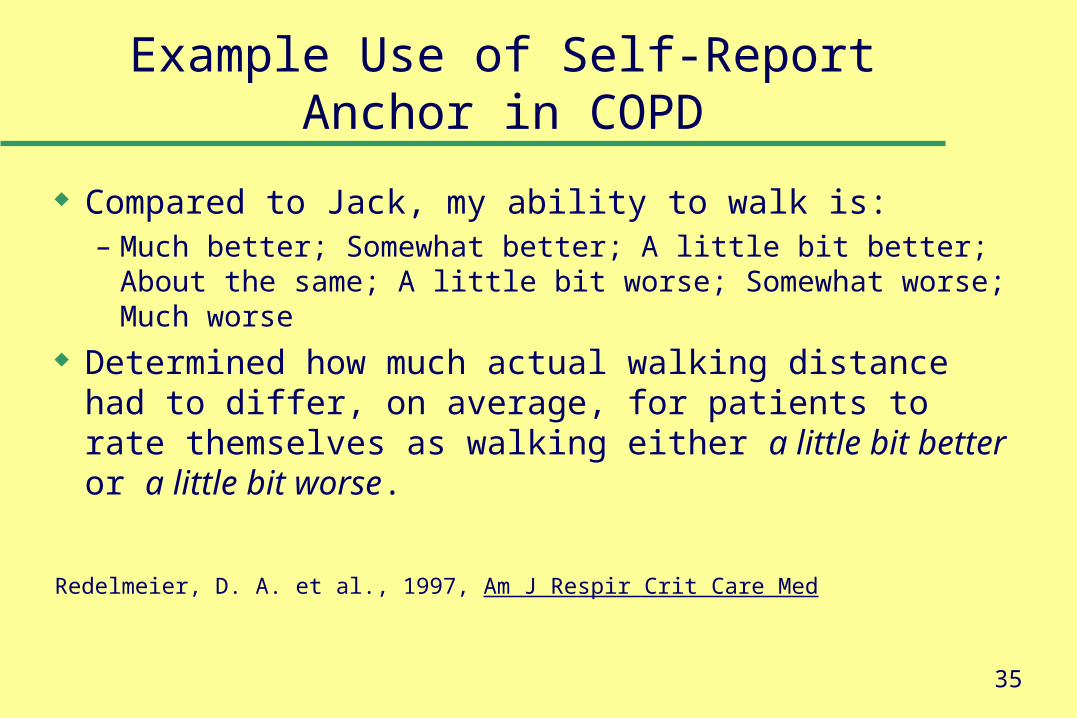
Example Use of Self-Report Anchor in COPD
Compared to Jack, my ability to walk is: – Much better; Somewhat better; A little bit better; About the
same; A little bit worse; Somewhat worse; Much worse
Determined how much actual walking distance had to differ, on average, for patients to rate themselves as walking either a little bit better or a little bit worse.
Redelmeier, D. A. et al., 1997, Am J Respir Crit Care Med
Related Documents