Is the global recovery stalling? October 2010 John Walker [email protected].
Dec 18, 2015
Welcome message from author
This document is posted to help you gain knowledge. Please leave a comment to let me know what you think about it! Share it to your friends and learn new things together.
Transcript

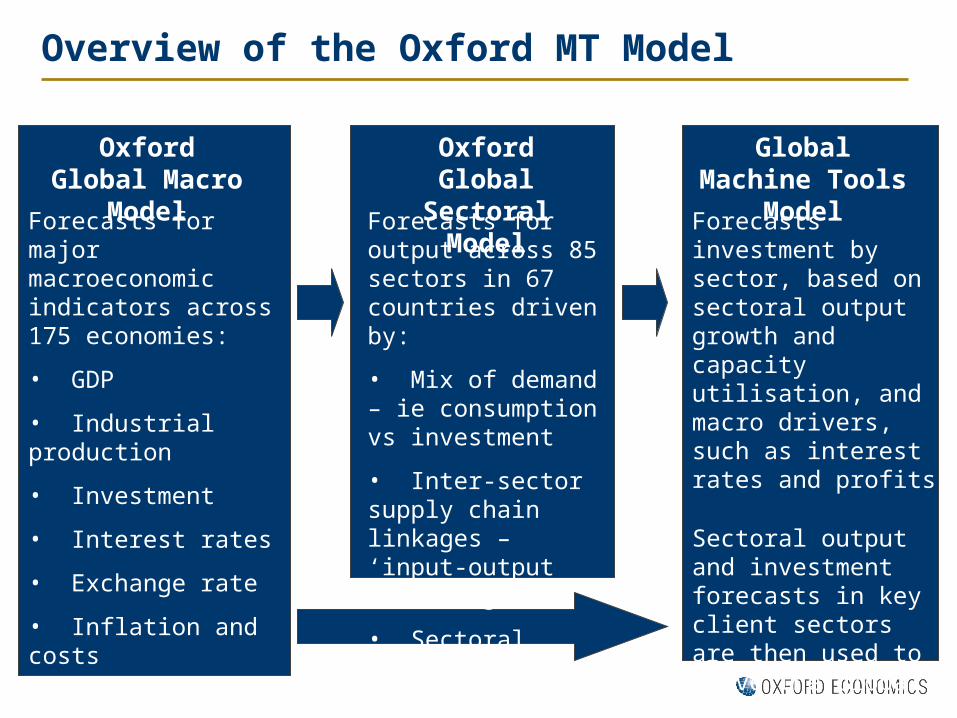
Overview of the Oxford MT Model
Oxford Global Macro Model
Oxford Global Sectoral Model
Global Machine Tools Model
Forecasts for major macroeconomic indicators across 175 economies:
• GDP
• Industrial production
• Investment
• Interest rates
• Exchange rate
• Inflation and costs
• Competitiveness
• Profitability
Forecasts for output across 85 sectors in 67 countries driven by:
• Mix of demand – ie consumption vs investment
• Inter-sector supply chain linkages – ‘input-output modelling’
• Sectoral competitiveness
Forecasts investment by sector, based on sectoral output growth and capacity utilisation, and macro drivers, such as interest rates and profits
Sectoral output and investment forecasts in key client sectors are then used to drive the global forecast for machine tools sales
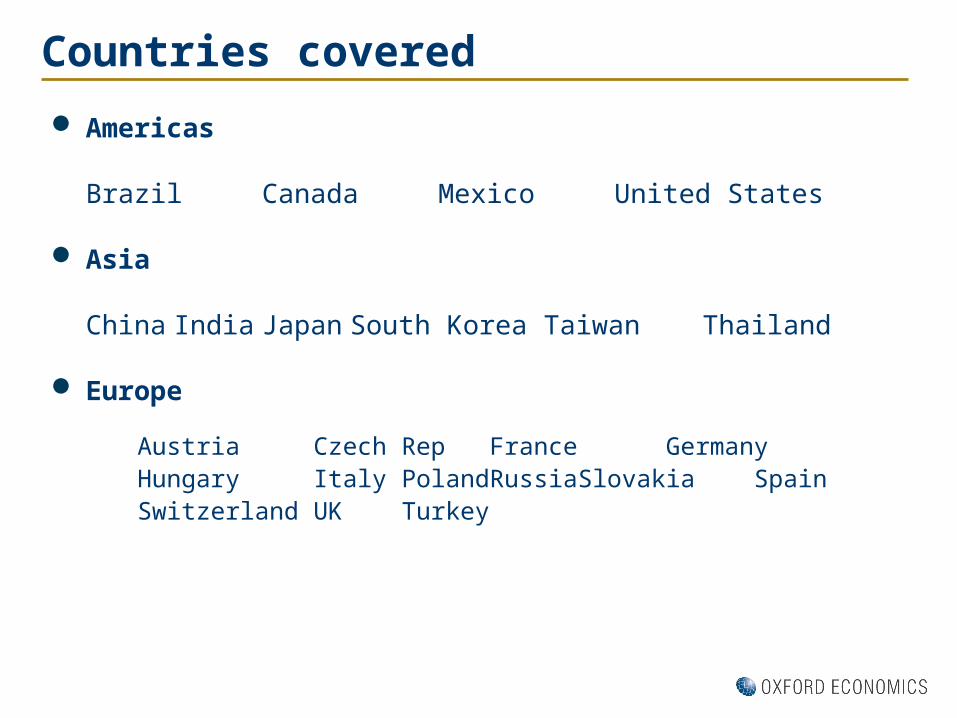
Countries covered
Americas
Brazil Canada Mexico United States
Asia
China India Japan South Korea Taiwan Thailand
Europe
Austria Czech Rep France Germany Hungary Italy Poland
Russia Slovakia SpainSwitzerland UK Turkey

Three key points
There is still a very high level of uncertainty about the outlook especially in the US and Europe: ie FEAR still rules

Bernanke on uncertainty
Statement to Senate Banking Committee, 22 July:
"Even as the Federal Reserve continues prudent planning for the ultimate withdrawal of monetary policy accommodation, we also recognise that the economic outlook remains unusually uncertain.“
Keynote speech at Jackson Hole, Wyoming, 27 August:
“…macroeconomic projections are inherently uncertain, and the economy remains vulnerable to unexpected developments.”

OXFORD ECONOMICS FORECASTING RECORD
2007-2009(average absolute forecast divergence
for real GDP growth)
USA Eurozone Japan
OEF 0.7 1.4 2.0
Note: Forecasts made in December for year ahead.

OXFORD ECONOMICS FORECASTING RECORD
2007-2009(average absolute forecast divergence
for real GDP growth)
USA Eurozone Japan
OEF 0.7 1.4 2.0
EIU
Global Ins.
IMF
OECD
Consens.
Note: Forecasts made in December for year ahead.

OXFORD ECONOMICS FORECASTING RECORD
2007-2009(average absolute forecast divergence
for real GDP growth)
USA Eurozone Japan
OEF 0.7 1.4 2.0
EIU 1.0
Global Ins. 0.7
IMF 1.6
OECD 1.1
Consens. 1.0
Note: Forecasts made in December for year ahead.
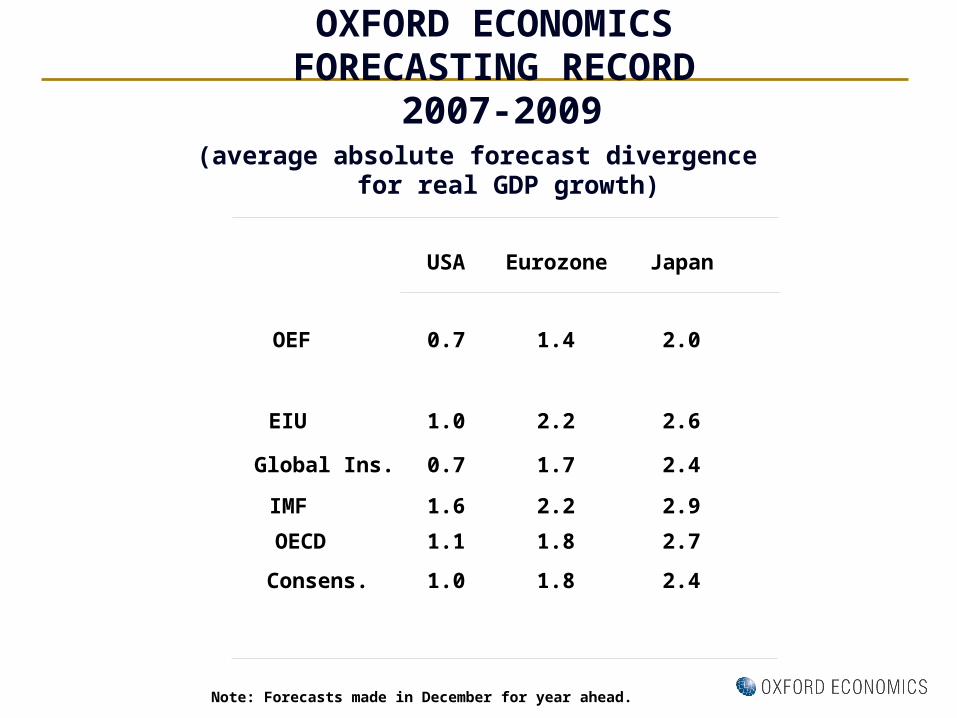
OXFORD ECONOMICS FORECASTING RECORD
2007-2009(average absolute forecast divergence
for real GDP growth)
USA Eurozone Japan
OEF 0.7 1.4 2.0
EIU 1.0 2.2 2.6
Global Ins. 0.7 1.7 2.4
IMF 1.6 2.2 2.9
OECD 1.1 1.8 2.7
Consens. 1.0 1.8 2.4
Note: Forecasts made in December for year ahead.

Three key points
There is still a very high level of uncertainty about the outlook especially in the US and Europe: ie FEAR still rules
Crisis has been in part a story of two currency unions!!
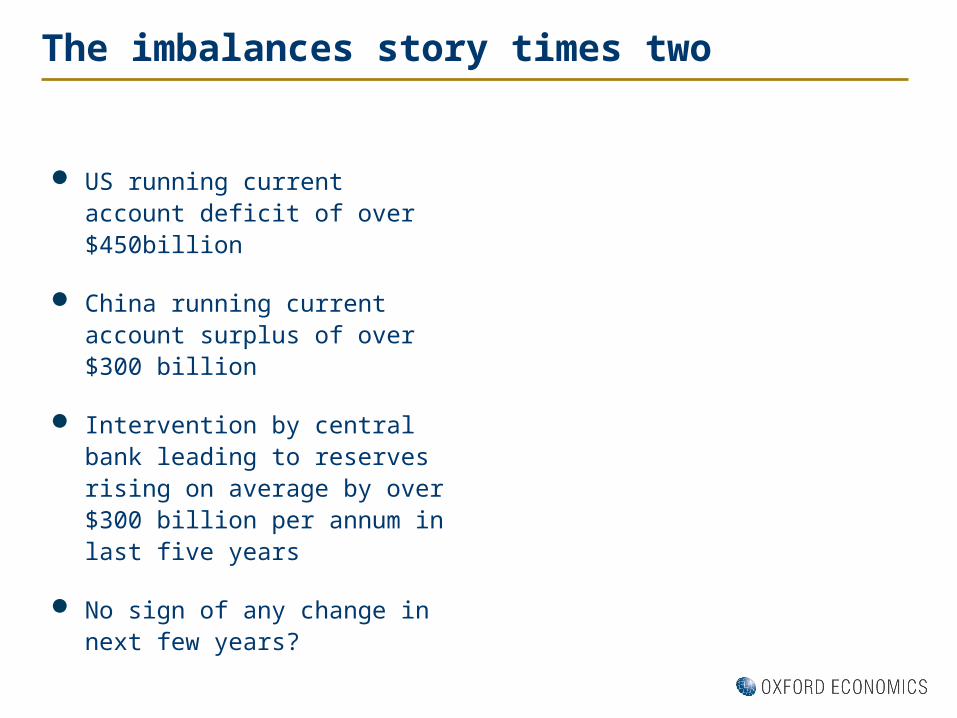
The imbalances story times two
US running current account deficit of over $450billion
China running current account surplus of over $300 billion
Intervention by central bank leading to reserves rising on average by over $300 billion per annum in last five years
No sign of any change in next few years?
France, PIGS current account deficit of over $300 billion
Germany Netherlands current account surplus of $250 billion
Banks were lending to Greek government, Spanish companies and Irish banks as offset to the above imbalances
ECB/EU governments will now fill the gap?
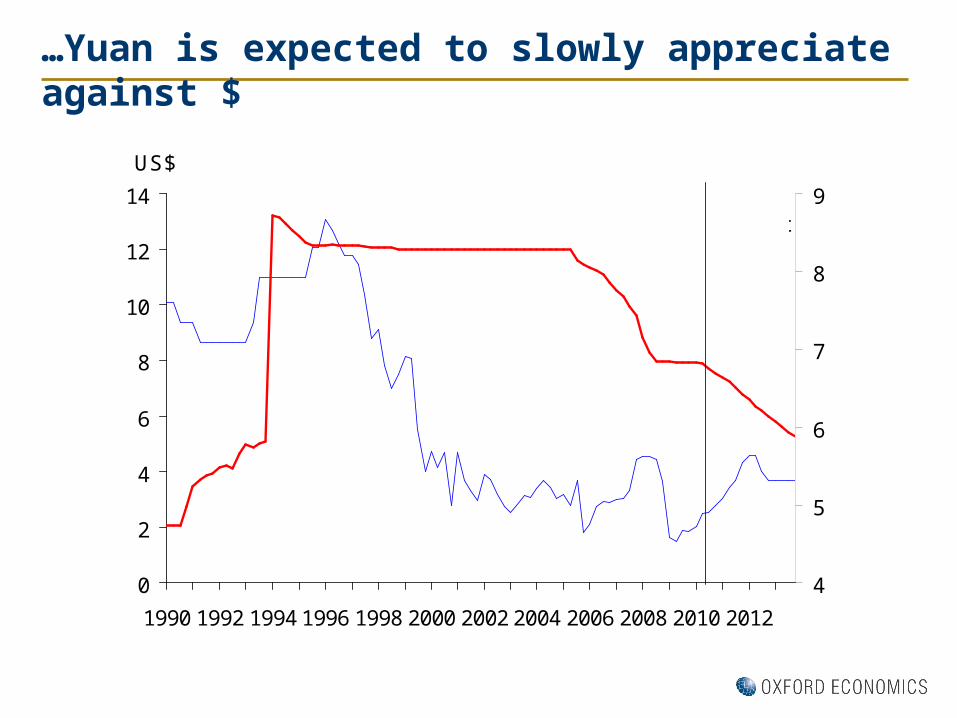
…Yuan is expected to slowly appreciate against $
0
2
4
6
8
10
12
14
1990 1992 1994 1996 1998 2000 2002 2004 2006 2008 2010 2012
4
5
6
7
8
9
US$
Loans interest rate(LHS)
Exchange rate(RHS)
Source: Oxford Economics
F'cast
China: Exchange and interest rates%

Worrying that trade imbalances widening again
-1000
-800
-600
-400
-200
0
200
400
600
1990 1994 1998 2002 2006 2010Source: Oxford Economics
$ billion
US
Japan
World: Current account imbalances
EU
Forecast
China
OPEC
Three key points
There is still a very high level of uncertainty about the outlook especially in the US and Europe: ie FEAR still rules
Crisis has been in part a story of two currency unions!!
The recession was driven by the corporate sector and the shape of the recovery will depend on how corporates react in different countries

40
50
60
70
80
90
100
110
120
130
1990 1992 1994 1996 1998 2000 2002 2004 2006 2008
US: Sectoral indebtedness% of GDP
Source : Oxford Economics/Haver Analytics
Consumer
Non financial business
Domestic financial sector
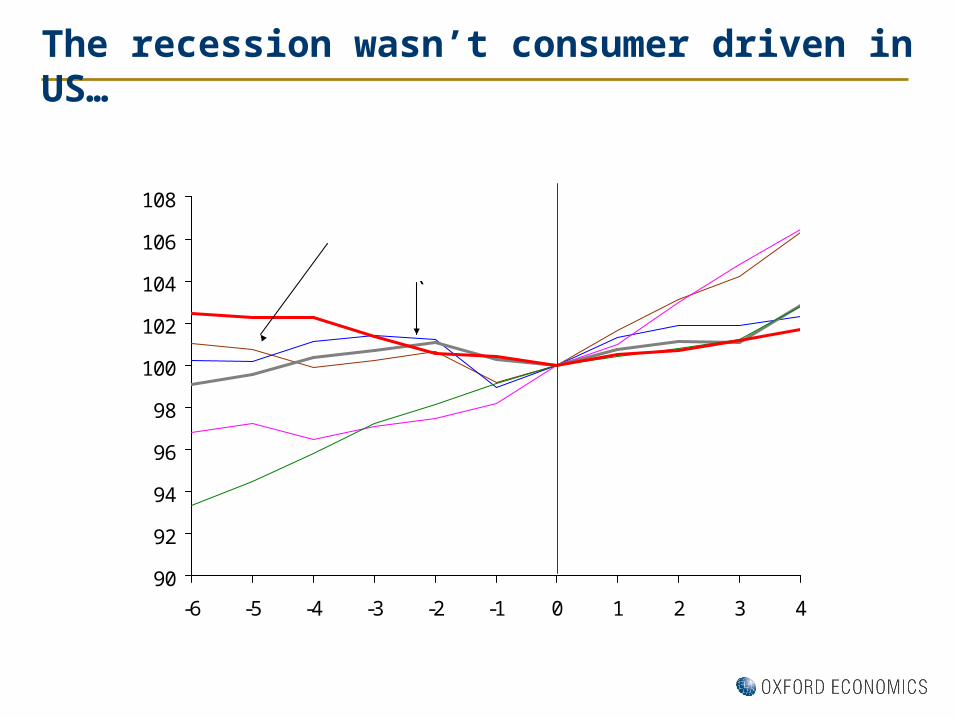
The recession wasn’t consumer driven in US…
90
92
94
96
98
100
102
104
106
108
-6 -5 -4 -3 -2 -1 0 1 2 3 4
US : Consumer spendingtrough=100
Source : Oxford Economics
1980Q3
1982Q4
1975Q1
1991Q1
Periods from trough
2009Q2
2001Q4

Nor were bank job cuts as bad as feared
-7
-6
-5
-4
-3
-2
-1
0
1
US Japan UK Germany France Italy
GovernmentOther servicesFinance/businessIndustryConstructionAgriculture
Sectoral contribution to employment lossesContribution to peak-to-trough change in employment, % pts
Source : Oxford Economics/Haver Analytics

Sharp decline in investment for the US
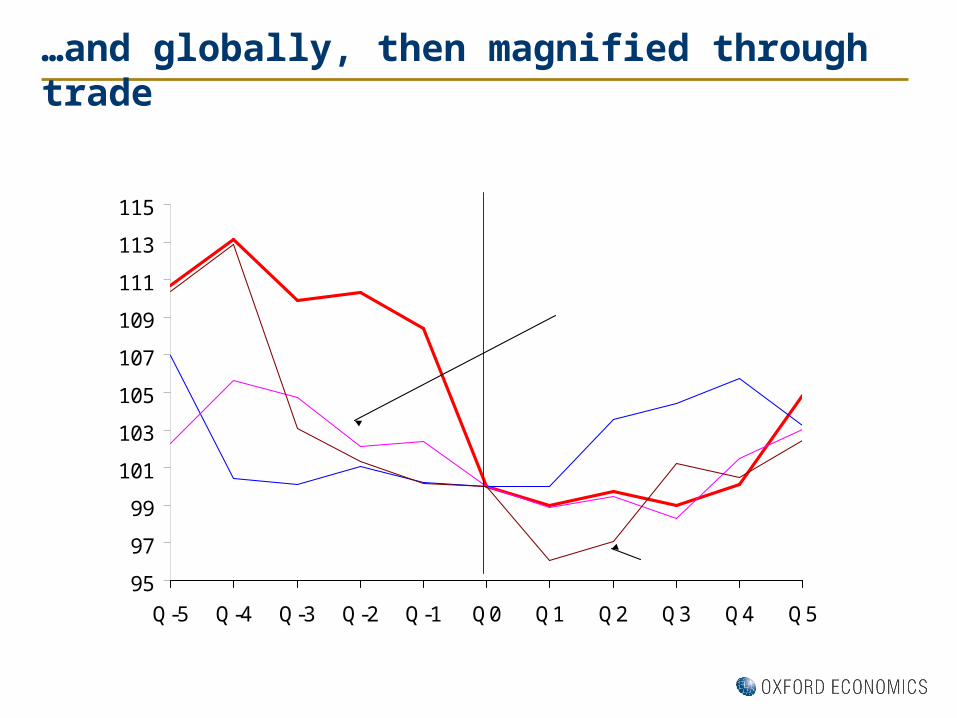
…and globally, then magnified through trade
95
97
99
101
103
105
107
109
111
113
115
Q-5 Q-4 Q-3 Q-2 Q-1 Q0 Q1 Q2 Q3 Q4 Q5
100= GDP trough
Source: Oxford Economics
Germany: Investment recoveries compared
2008-10
Early 1970s
Early 1990s
Early 1980s
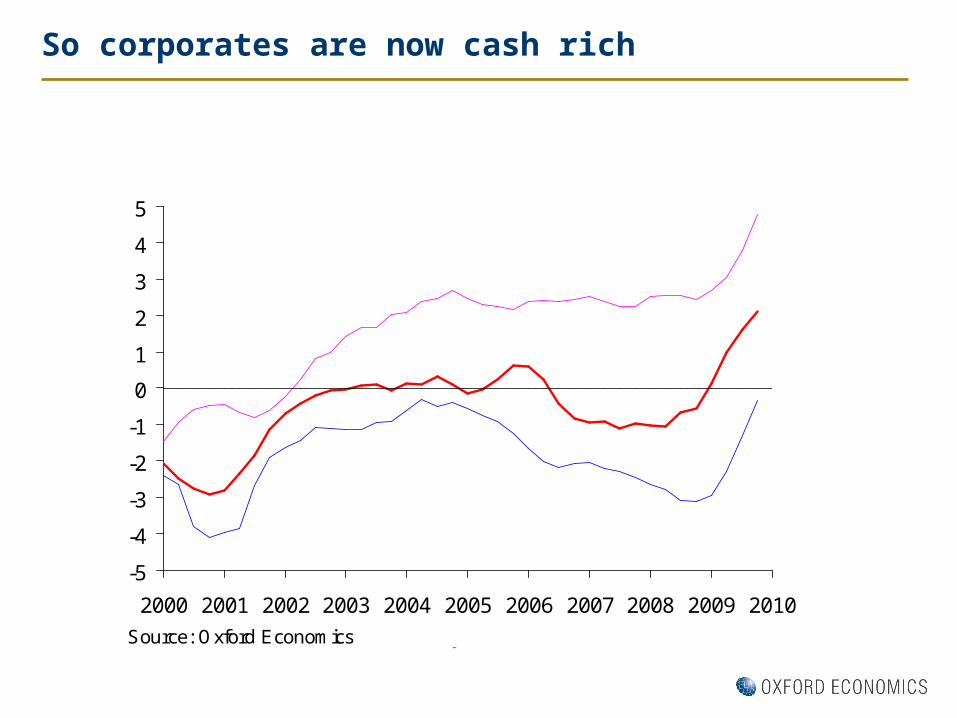
So corporates are now cash rich
-5
-4
-3
-2
-1
0
1
2
3
4
5
2000 2001 2002 2003 2004 2005 2006 2007 2008 2009 2010
Source: Oxford Economics\Haver Analytics
World: PNFC financial balances
US
Eurozone
UK
% of GDP, 4-quarter average
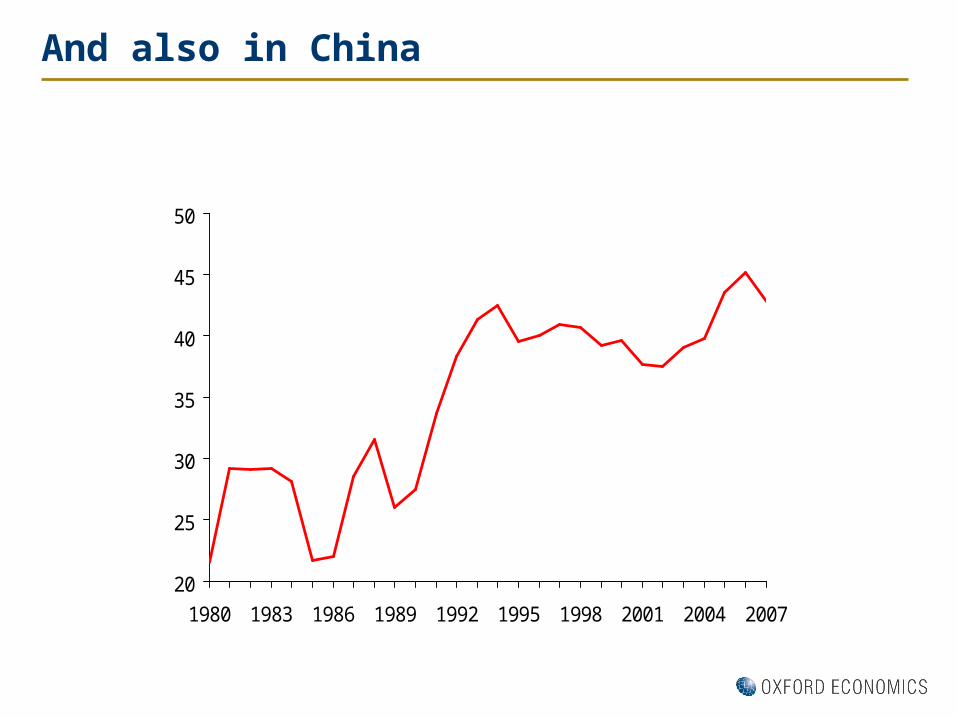
And also in China
20
25
30
35
40
45
50
1980 1983 1986 1989 1992 1995 1998 2001 2004 2007
Source: Oxford Economics
% of GDP
China : Corporate profits

Who will lead the recovery?
Governments!!
Consumers!!
Companies?
Emerging markets?

…households constrained by debt…
0
50
100
150
200
250
1995 1997 1999 2001 2003 2005 2007 2009
Household debt% of income
Source : Oxford Economics
US
UK
Eurozone
Germany
Ireland
SpainEurozone
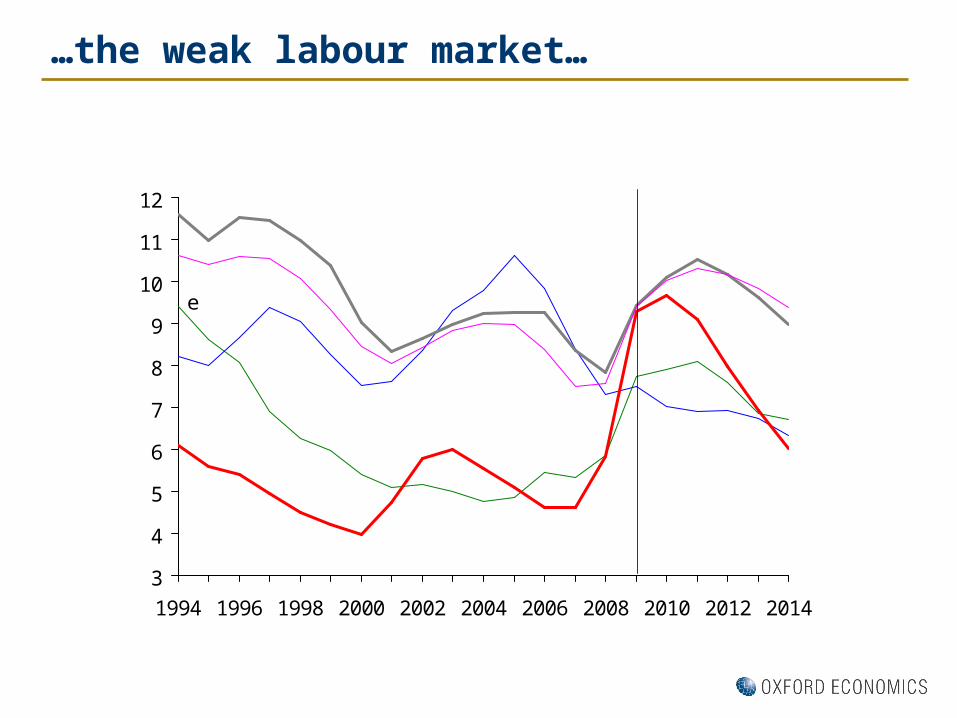
…the weak labour market…
3
4
5
6
7
8
9
10
11
12
1994 1996 1998 2000 2002 2004 2006 2008 2010 2012 2014
World: Unemployment%
Source : Oxford Economics
France
Eurozone
GermanyUK
US
Forecast
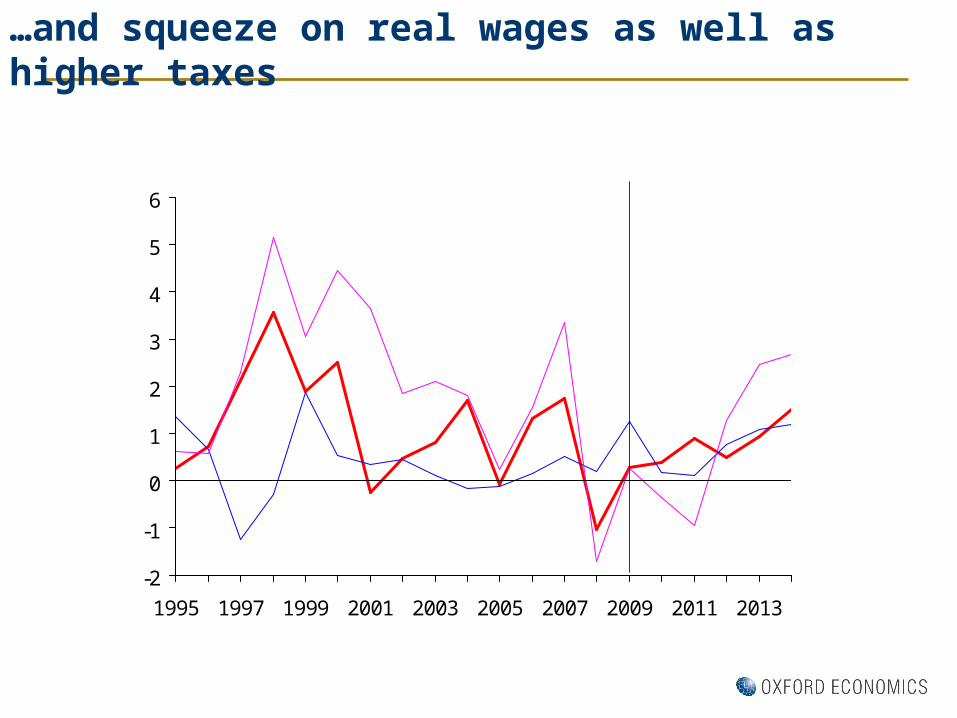
…and squeeze on real wages as well as higher taxes
-2
-1
0
1
2
3
4
5
6
1995 1997 1999 2001 2003 2005 2007 2009 2011 2013
Real wagesAnnual % change
Source : Oxford Economics
US
UK
Eurozone
Forecast
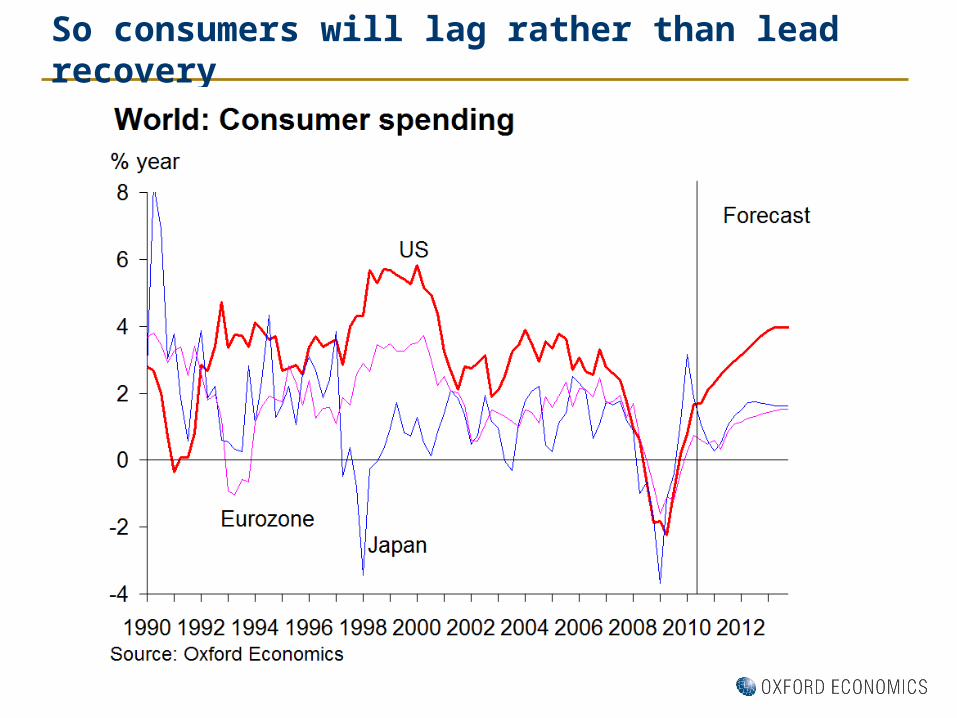
So consumers will lag rather than lead recovery
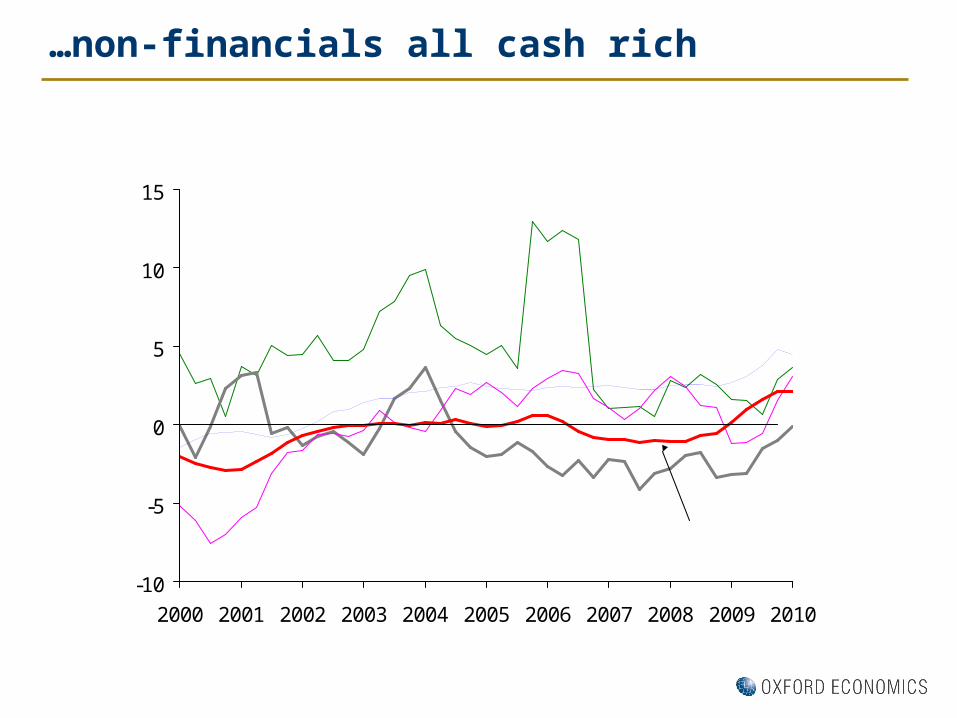
…non-financials all cash rich
-10
-5
0
5
10
15
2000 2001 2002 2003 2004 2005 2006 2007 2008 2009 2010Source: Oxford Economics
% of GDP, 4QMA
Non financial corporate balance
France
US
UK
Germany
Japan
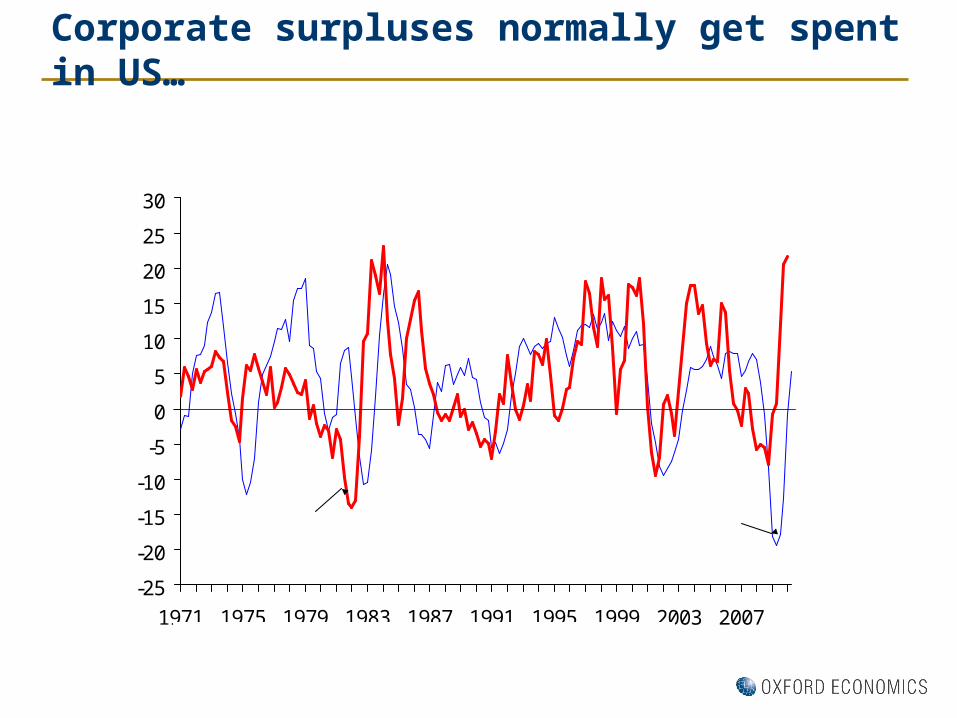
Corporate surpluses normally get spent in US…
-25
-20
-15
-10
-5
0
5
10
15
20
25
30
1971 1975 1979 1983 1987 1991 1995 1999 2003 2007
US: Investment and corporate money% year
Source : Oxford Economics/Haver Analytics
Real corporate broad money
Non-residential investment
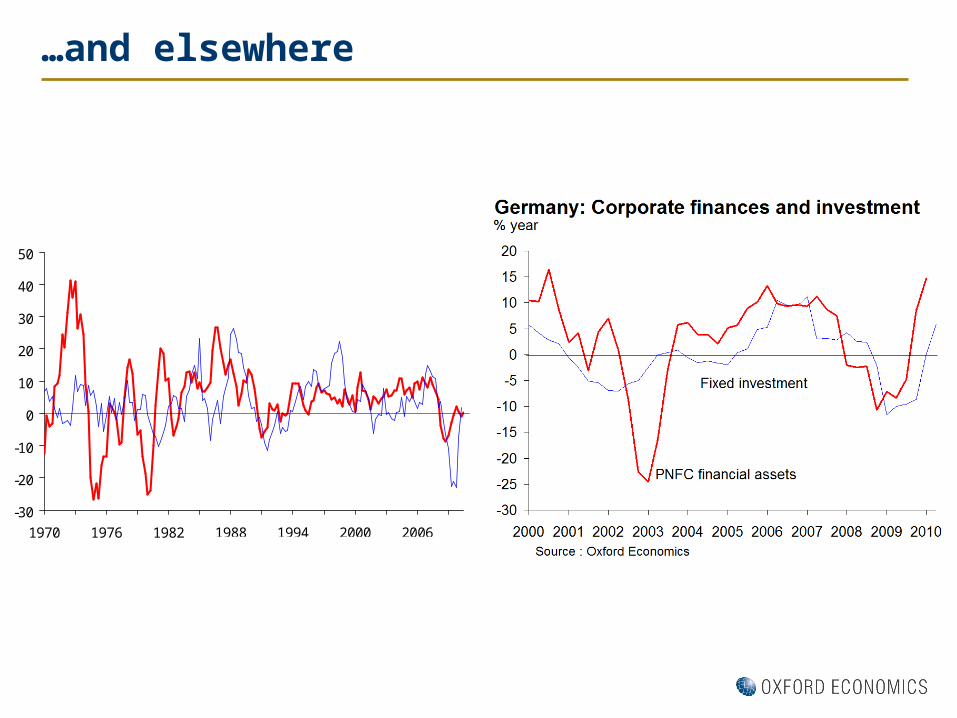
…and elsewhere
-30
-20
-10
0
10
20
30
40
50
1970 1976 1982 1988 1994 2000 2006
UK: Corporate liquidity and investment% year
Source : Oxford Economics/Haver Analytics
Business Investment
Real PNFC M4
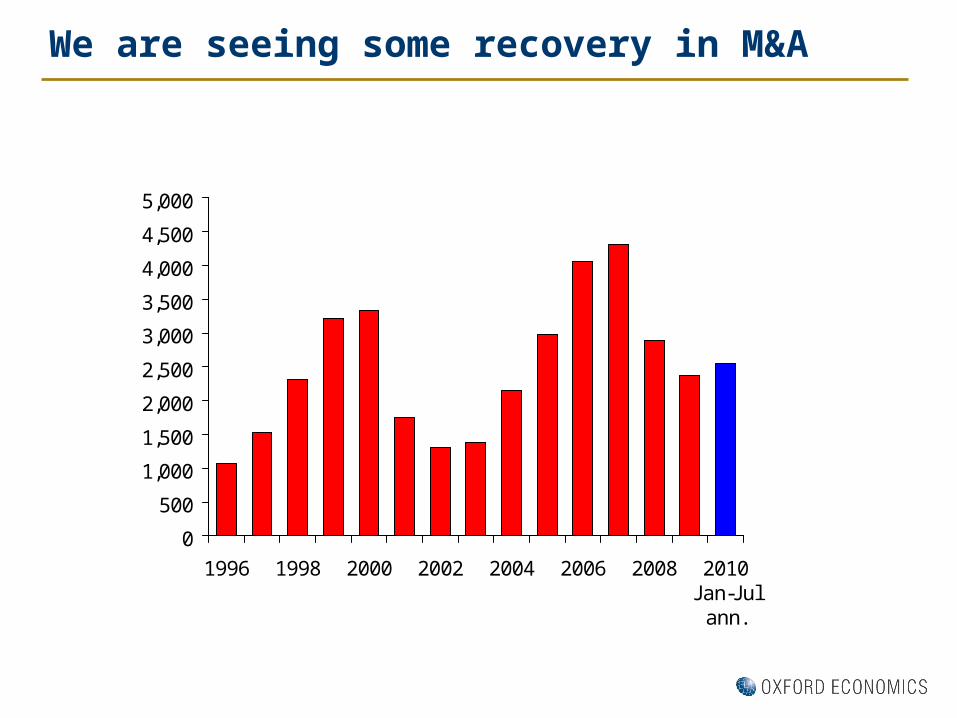
We are seeing some recovery in M&A
0
500
1,000
1,500
2,000
2,500
3,000
3,500
4,000
4,500
5,000
1996 1998 2000 2002 2004 2006 2008 2010Jan-Jul
ann.
World: M&AUS$ bn
Source : Dealogic/Thomson Reuters
What might hold companies back this time?
Unusual uncertainty
Excess capacity
Debt
Credit constraints

What might hold companies back this time?
Unusual uncertainty
Excess capacity
Debt
Credit constraints
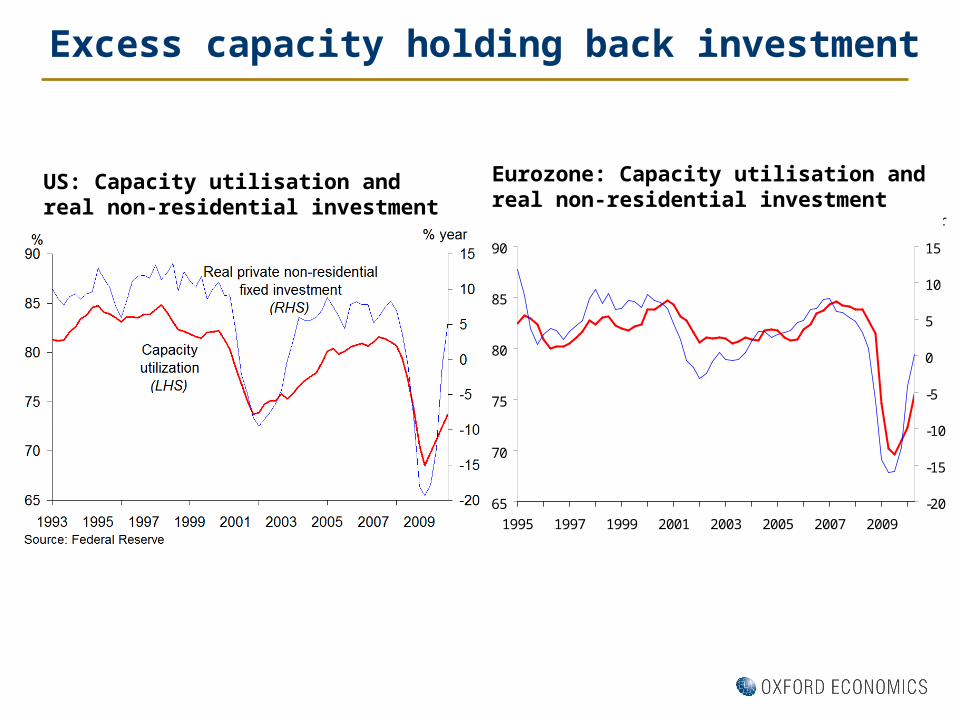
Excess capacity holding back investment
65
70
75
80
85
90
1995 1997 1999 2001 2003 2005 2007 2009
-20
-15
-10
-5
0
5
10
15
% point
Source: Oxford Economics, Haver Analytics
Low capacity discourages new investment
Capacity utilisation
(LHS)
Non residential investment
(RHS)
% year
Eurozone: Capacity utilisation and real non-residential investment
US: Capacity utilisation and real non-residential investment

What might hold companies back this time?
Unusual uncertainty
Excess capacity
Debt
Credit constraints
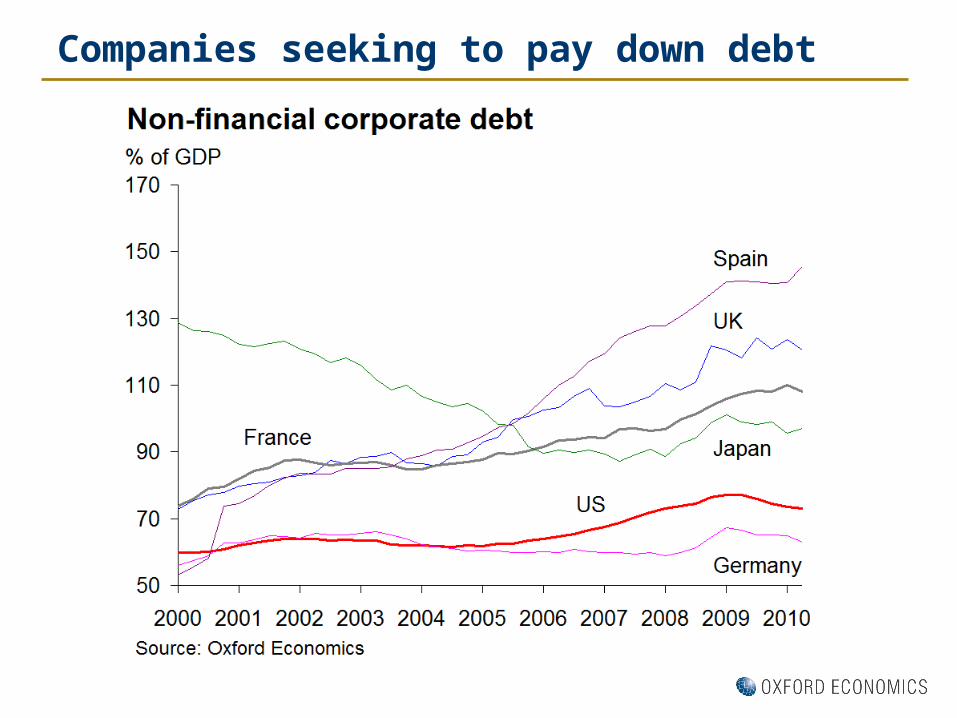
Companies seeking to pay down debt

What might hold companies back this time?
Unusual uncertainty
Excess capacity
Debt
Credit constraints

Corporate lending very weak…
-24
-20
-16
-12
-8
-4
0
4
8
12
16
20
24
28
2000 2001 2002 2003 2004 2005 2006 2007 2008 2009 2010
% year
UK
Source: Haver Analytics
World: Lending to PNFCs*
Eurozone
US
*3 month moving average

…although that is a demand as well as supply issue
-80
-70
-60
-50
-40
-30
-20
-10
0
10
20
30
2007 2008 2009 2010
World: Firms' demand for credit for investment% net balance
Source : Oxford Economics/Haver Analytics
US
Eurozone
UK
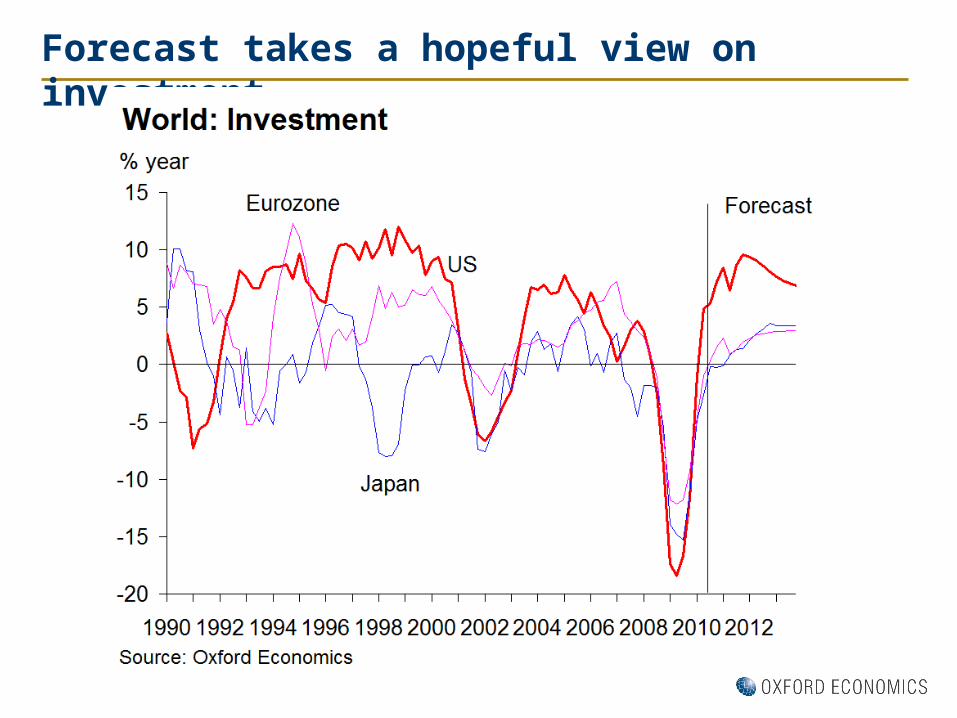
Forecast takes a hopeful view on investment

But still subdued recovery for major economies
Emerging markets leading recovery?

Emergers leading recovery despite slowing in some
-20
-15
-10
-5
0
5
10
15
20
25
2005 2006 2007 2008 2009 2010
% year
Source: Haver Analytics
BRICS: Industrial production
3 month moving average
Brazil
Russia
China
India

Emerging markets leading recovery?
Export markets slowing
But domestic demand is strong

… domestic demand generally solid
-12
-8
-4
0
4
8
12
16
20
2001 2002 2003 2004 2005 2006 2007 2008 2009 2010
% year
Brazil
Source: Haver Analytics
Brazil, Russia & China: Retail sales volumes
RussiaChina
3 month moving average

…and domestic demand is solid in the rest of Asia
-6
-3
0
3
6
9
12
15
2000 2001 2002 2003 2004 2005 2006 2007 2008 2009 2010
% year
Source: Haver Analytics
Emerging Asia: Consumer spending
Malaysia
Taiwan
Thailand
Korea
Emerging markets leading recovery?
Export markets slowing
But domestic demand is strong
Still scope for further stimulus
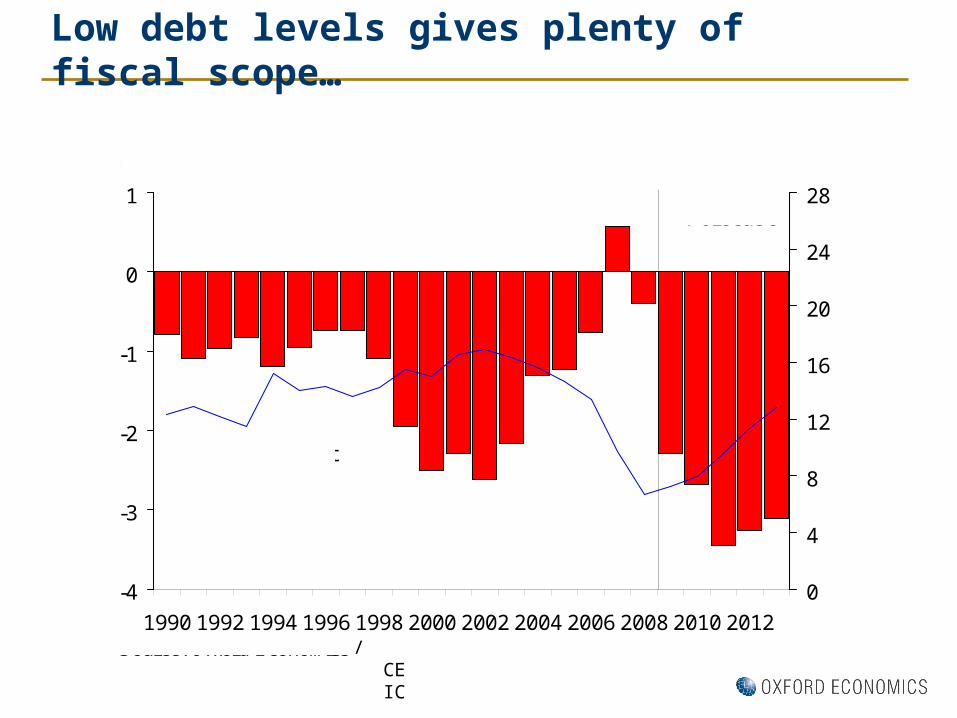
Low debt levels gives plenty of fiscal scope…
-4
-3
-2
-1
0
1
0
4
8
12
16
20
24
28
1990 1992 1994 1996 1998 2000 2002 2004 2006 2008 2010 2012
% of GDP
Government balance(LHS)
Government debt(RHS)
% of GDP
Source: Oxford Economics
Forecast
China: Government budget balance and debt
/CEIC
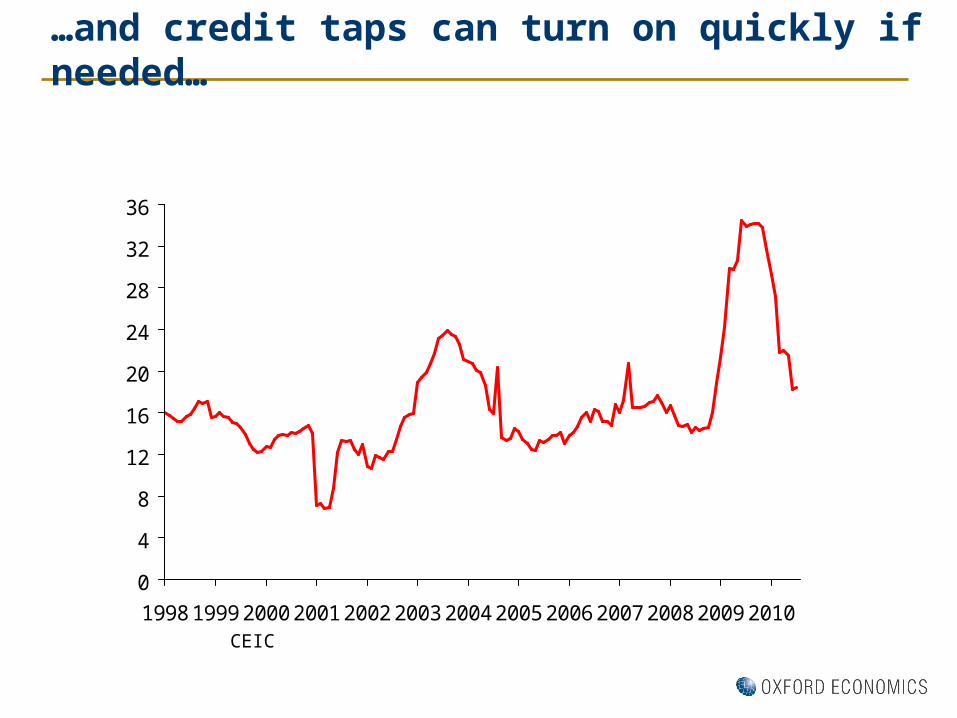
…and credit taps can turn on quickly if needed…
0
4
8
12
16
20
24
28
32
36
1998 1999 2000 2001 2002 2003 2004 2005 2006 2007 2008 2009 2010
12-month % change
Source: Haver Analytics
China: Total RMB loans
CEIC
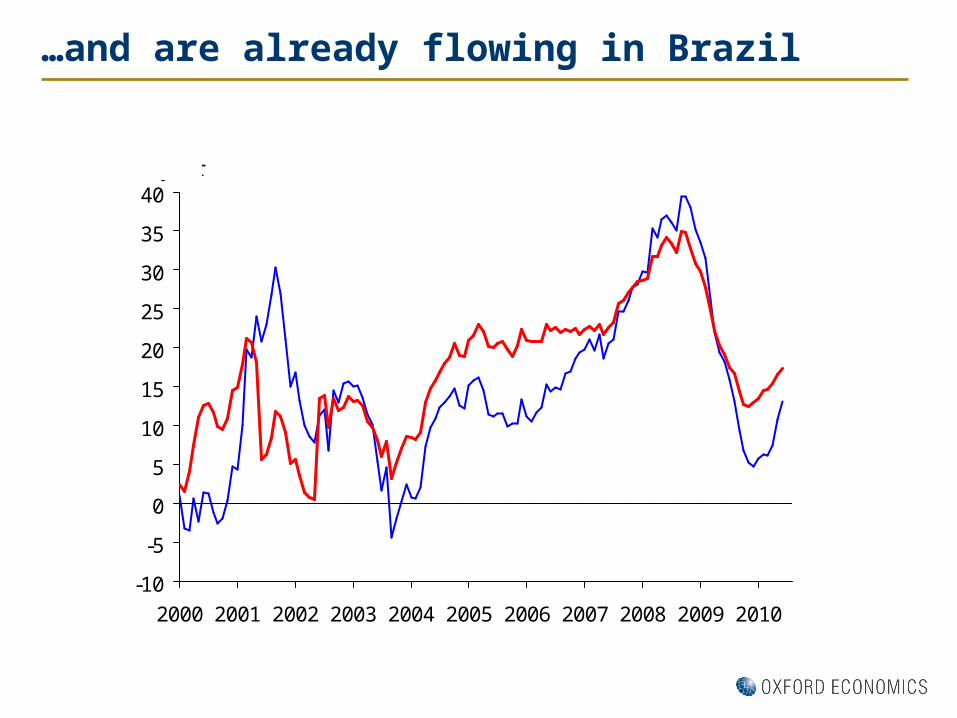
…and are already flowing in Brazil
-10
-5
0
5
10
15
20
25
30
35
40
2000 2001 2002 2003 2004 2005 2006 2007 2008 2009 2010
% year
Source: Haver Analytics
Brazil: Bank lending
Industry & commerce sectors
Total private sector
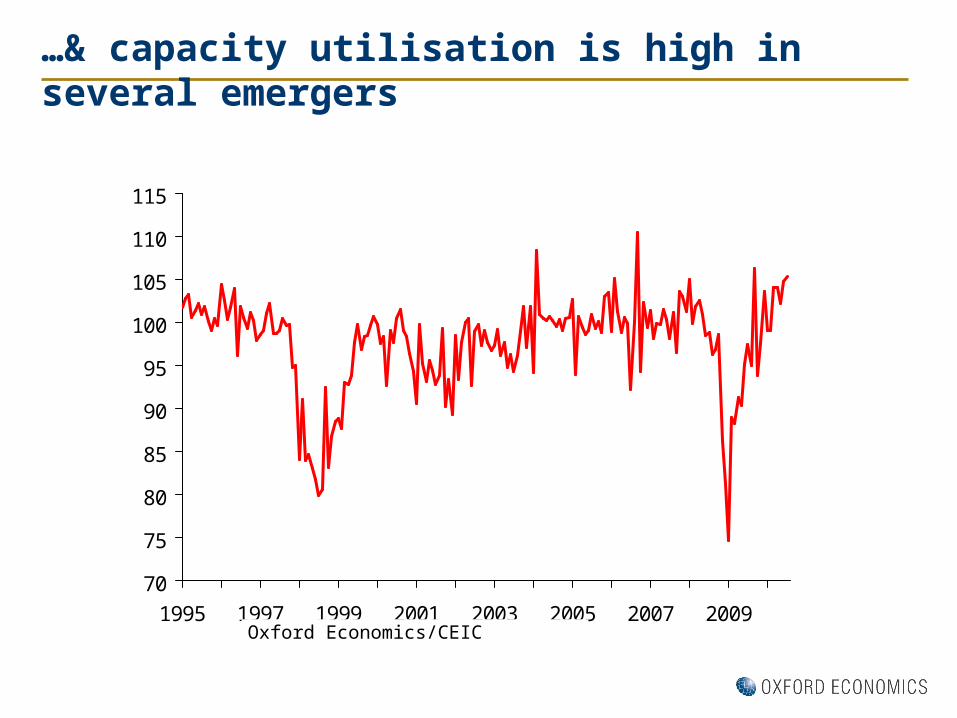
…& capacity utilisation is high in several emergers
70
75
80
85
90
95
100
105
110
115
1995 1997 1999 2001 2003 2005 2007 2009
2005=100 (seasonally adjusted)
Source: Haver Analytics
Korea: Manufacturing operating rate
Oxford Economics/CEIC
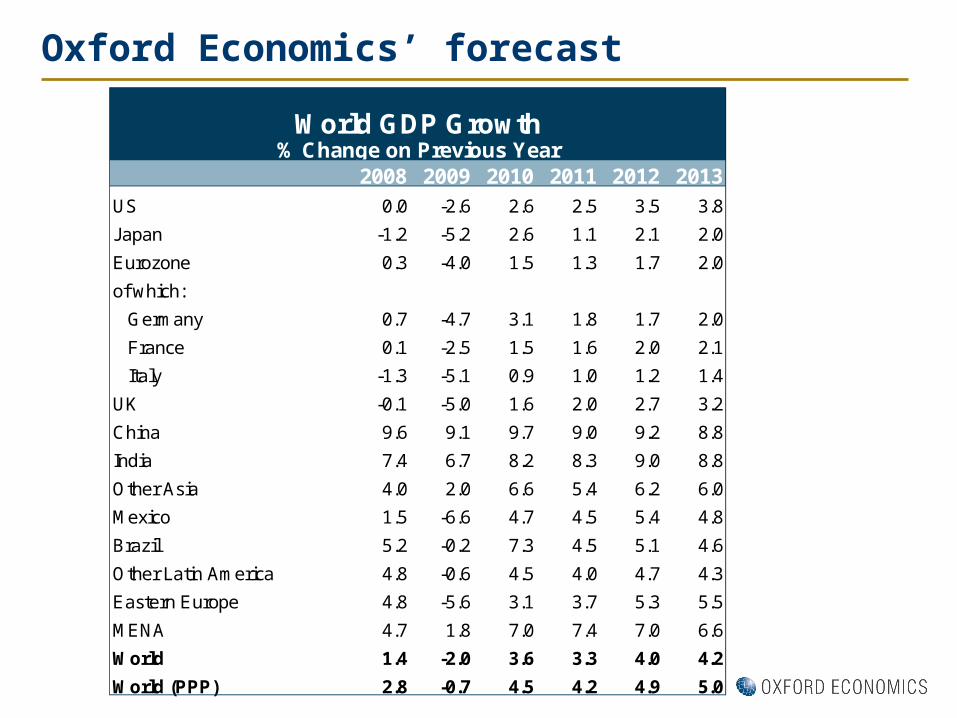
Oxford Economics’ forecast
2008 2009 2010 2011 2012 2013US 0.0 -2.6 2.6 2.5 3.5 3.8
Japan -1.2 -5.2 2.6 1.1 2.1 2.0
Eurozone 0.3 -4.0 1.5 1.3 1.7 2.0
of which:
Germany 0.7 -4.7 3.1 1.8 1.7 2.0
France 0.1 -2.5 1.5 1.6 2.0 2.1
Italy -1.3 -5.1 0.9 1.0 1.2 1.4
UK -0.1 -5.0 1.6 2.0 2.7 3.2
China 9.6 9.1 9.7 9.0 9.2 8.8
India 7.4 6.7 8.2 8.3 9.0 8.8
Other Asia 4.0 2.0 6.6 5.4 6.2 6.0
Mexico 1.5 -6.6 4.7 4.5 5.4 4.8
Brazil 5.2 -0.2 7.3 4.5 5.1 4.6
Other Latin America 4.8 -0.6 4.5 4.0 4.7 4.3
Eastern Europe 4.8 -5.6 3.1 3.7 5.3 5.5
MENA 4.7 1.8 7.0 7.4 7.0 6.6
World 1.4 -2.0 3.6 3.3 4.0 4.2
World (PPP) 2.8 -0.7 4.5 4.2 4.9 5.0
World GDP Growth% Change on Previous Year

Co
rpo
rate
rec
ove
ry
Financial sector recovery
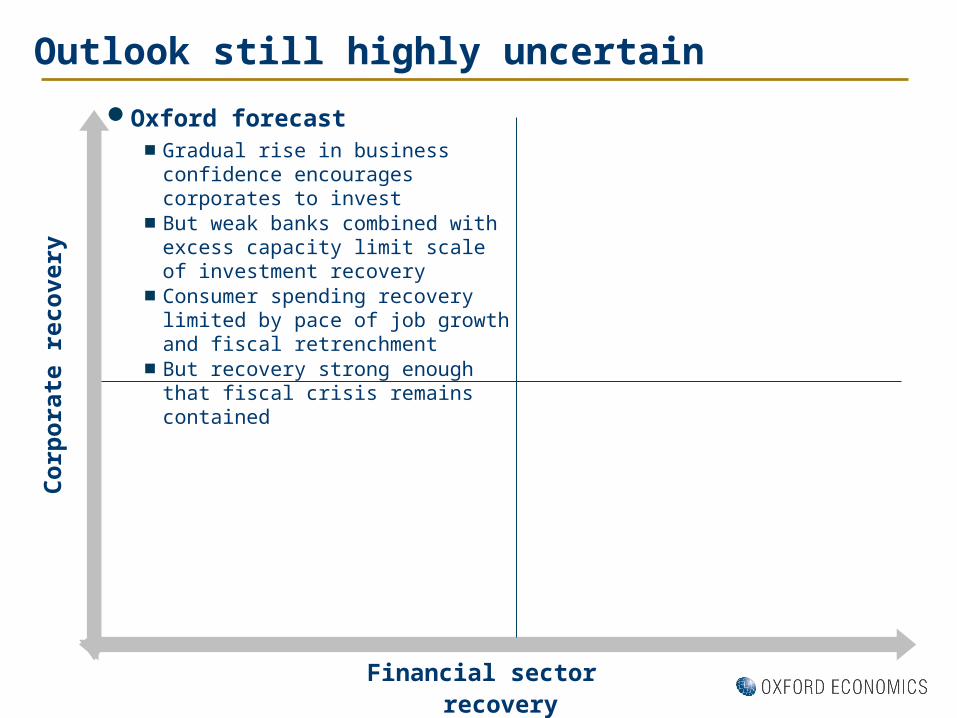
Outlook still highly uncertain
Co
rpo
rate
rec
ove
ry
Financial sector recovery
Outlook still highly uncertain
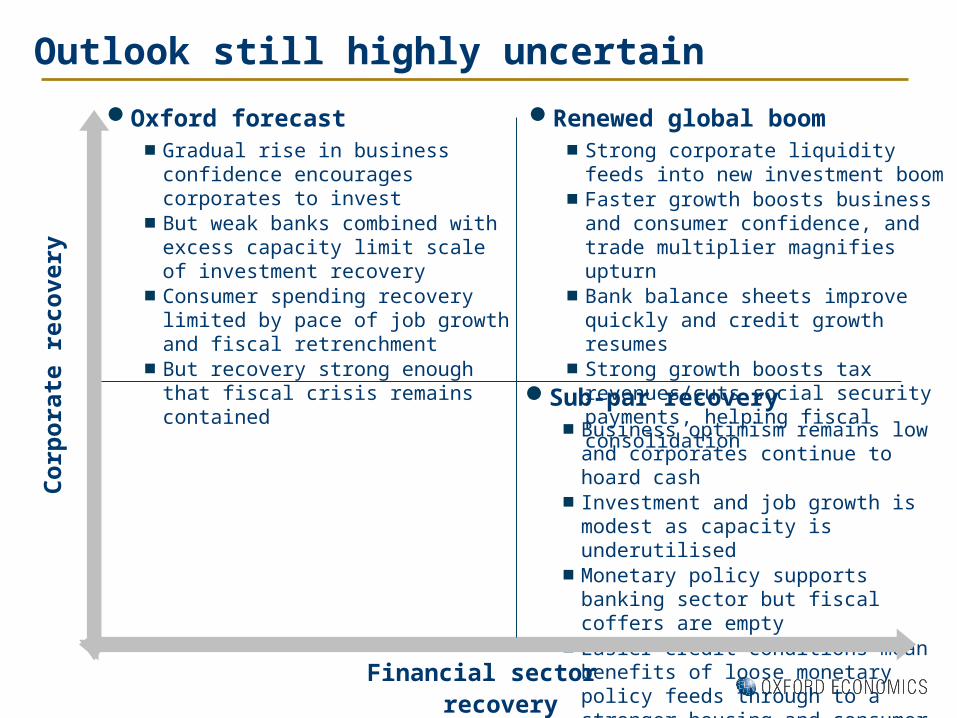
Oxford forecast■ Gradual rise in business confidence
encourages corporates to invest ■ But weak banks combined with excess
capacity limit scale of investment recovery
■ Consumer spending recovery limited by pace of job growth and fiscal retrenchment
■ But recovery strong enough that fiscal crisis remains contained

Co
rpo
rate
rec
ove
ry
Financial sector recovery
Outlook still highly uncertain
Renewed global boom■ Strong corporate liquidity feeds into new
investment boom■ Faster growth boosts business and
consumer confidence, and trade multiplier magnifies upturn
■ Bank balance sheets improve quickly and credit growth resumes
■ Strong growth boosts tax revenues/cuts social security payments, helping fiscal consolidation
Oxford forecast■ Gradual rise in business confidence
encourages corporates to invest ■ But weak banks combined with excess
capacity limit scale of investment recovery
■ Consumer spending recovery limited by pace of job growth and fiscal retrenchment
■ But recovery strong enough that fiscal crisis remains contained
Co
rpo
rate
rec
ove
ry
Sub-par recovery■ Business optimism remains low and
corporates continue to hoard cash■ Investment and job growth is modest as
capacity is underutilised■ Monetary policy supports banking sector
but fiscal coffers are empty■ Easier credit conditions mean benefits of
loose monetary policy feeds through to a stronger housing and consumer recovery
Financial sector recovery
Outlook still highly uncertain
Renewed global boom■ Strong corporate liquidity feeds into new
investment boom■ Faster growth boosts business and
consumer confidence, and trade multiplier magnifies upturn
■ Bank balance sheets improve quickly and credit growth resumes
■ Strong growth boosts tax revenues/cuts social security payments, helping fiscal consolidation
Oxford forecast■ Gradual rise in business confidence
encourages corporates to invest ■ But weak banks combined with excess
capacity limit scale of investment recovery
■ Consumer spending recovery limited by pace of job growth and fiscal retrenchment
■ But recovery strong enough that fiscal crisis remains contained

Corporates are key
200
250
300
350
400
450
500
550
600
650
2005 2006 2007 2008 2009 2010 2011 2012 2013 2014
Base
Renewed boom
Sub-par recovery
Source: Oxford Economics
$2005 billions
US: Business investment

Scenarios for the global economy
2009 2010 2011 2012
Oxford Forecast (45%)US -2.6 2.6 2.5 3.5Eurozone -4.0 1.5 1.3 1.7China 9.1 9.7 9.0 9.2World -0.7 4.5 4.2 4.9
Renewed boom (20%)US -2.6 2.8 3.7 4.2Eurozone -4.0 1.7 2.4 2.8China 9.1 10.4 10.7 10.4World -0.7 4.8 5.5 5.9
Sub-par recovery (25%)US -2.6 2.4 1.8 2.2Eurozone -4.0 1.2 0.8 0.9China 9.1 8.8 7.2 7.5World -0.7 4.1 3.3 3.7
Alternative GDP growth forecasts

Co
rpo
rate
rec
ove
ry
Sub-par recovery■ Business optimism remains low and
corporates continue to hoard cash■ Investment and job growth is modest as
capacity is underutilised■ Monetary policy supports banking sector
but fiscal coffers are empty■ Easier credit conditions mean benefits of
loose monetary policy feeds through to a stronger housing and consumer recovery
Financial sector recovery
Outlook still highly uncertain
Renewed global boom■ Strong corporate liquidity feeds into new
investment boom■ Faster growth boosts business and
consumer confidence, and trade multiplier magnifies upturn
■ Bank balance sheets improve quickly and credit growth resumes
■ Strong growth boosts tax revenues/cuts social security payments, helping fiscal consolidation
Oxford forecast■ Gradual rise in business confidence
encourages corporates to invest ■ But weak banks combined with excess
capacity limit scale of investment recovery
■ Consumer spending recovery limited by pace of job growth and fiscal retrenchment
■ But recovery strong enough that fiscal crisis remains contained

Co
rpo
rate
rec
ove
ry
Renewed crisis■ Threat of double-dip means renewed
slump in asset prices as Eurozone sovereign debt crisis re-emerges
■ Pressure to cut budget deficits rapidly in all major economies
■ Rising unemployment and business failures feed back into banking
■ Limited scope for monetary policy offset
Sub-par recovery■ Business optimism remains low and
corporates continue to hoard cash■ Investment and job growth is modest as
capacity is underutilised■ Monetary policy supports banking sector
but fiscal coffers are empty■ Easier credit conditions mean benefits of
loose monetary policy feeds through to a stronger housing and consumer recovery
Financial sector recovery
Outlook still highly uncertain
Renewed global boom■ Strong corporate liquidity feeds into new
investment boom■ Faster growth boosts business and
consumer confidence, and trade multiplier magnifies upturn
■ Bank balance sheets improve quickly and credit growth resumes
■ Strong growth boosts tax revenues/cuts social security payments, helping fiscal consolidation
Oxford forecast■ Gradual rise in business confidence
encourages corporates to invest ■ But weak banks combined with excess
capacity limit scale of investment recovery
■ Consumer spending recovery limited by pace of job growth and fiscal retrenchment
■ But recovery strong enough that fiscal crisis remains contained
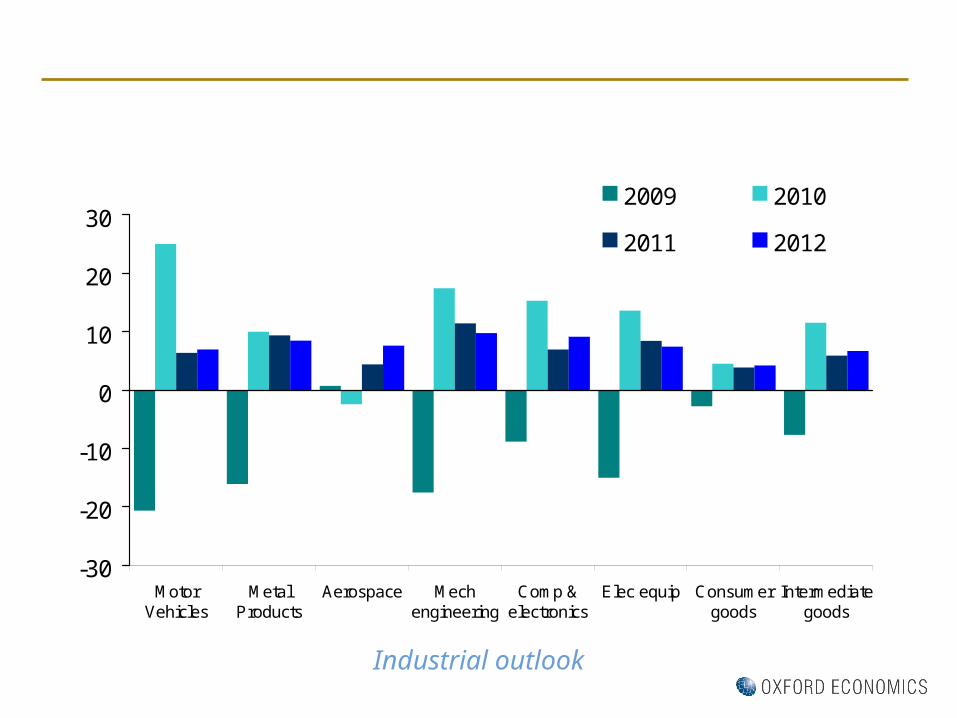
Industrial outlook
-30
-20
-10
0
10
20
30
MotorVehicles
MetalProducts
Aerospace Mechengineering
Comp &electronics
Elec equip Consumergoods
Intermediategoods
2009 2010
2011 2012
Source: Oxford Economics
Growth in industrial production of machine tools' customer sectors

…
1.2
1.4
1.6
1.8
2.0
2.2
2.4
2.6
1980 1984 1988 1992 1996 2000 2004 2008
3mth mav, mn
Production
Sales
Source: J D Power/Oxford Economics
Unit car sales & production†
† Covering the US, Western Europe & Japan

Aerospace orders now below deliveries
Investment outlook
200
600
1,000
1,400
1,800
2,200
2,600
3,000
1990 1993 1996 1999 2002 2005 2008
300
400
500
600
700
800
900
1,000
Deliveries(RHS)
Orders(LHS)
No. of aircraftNo. of aircraft
Airbus & Boeing: Orders & deliveries
Source: Company reports and forecasts

Motor Vehicle Investment
Investment outlook
Rest of Asia 13.5%
US8.3%
Germany 9.5%
Rest of Americas
8.5%
Japan 23.4%
China16.2%
Rest of Europe20.7%
Motor vehicle investment 2009
Source : Oxford Economics
-40
-30
-20
-10
0
10
20
30
2003 2004 2005 2006 2007 2008 2009 2010 2011 2012 2013Source: Oxford Economics
Motor vehicle investment
Europe
% yoy
Americas
Asia

General machinery output and investment
Investment outlook
US, 42.9%
Japan, 14.5%
China, 23.2%
Rest of Europe, 8.0%
Rest of Asia, 5.7%
Rest of Americas,
2.0%
Germany, 3.6%
General machinery investment 2009
Source : Oxford Economics
-30
-20
-10
0
10
20
30
2003 2004 2005 2006 2007 2008 2009 2010 2011 2012 2013Source: Oxford Economics
General machinery output
Europe
% yoy
Americas
Asia
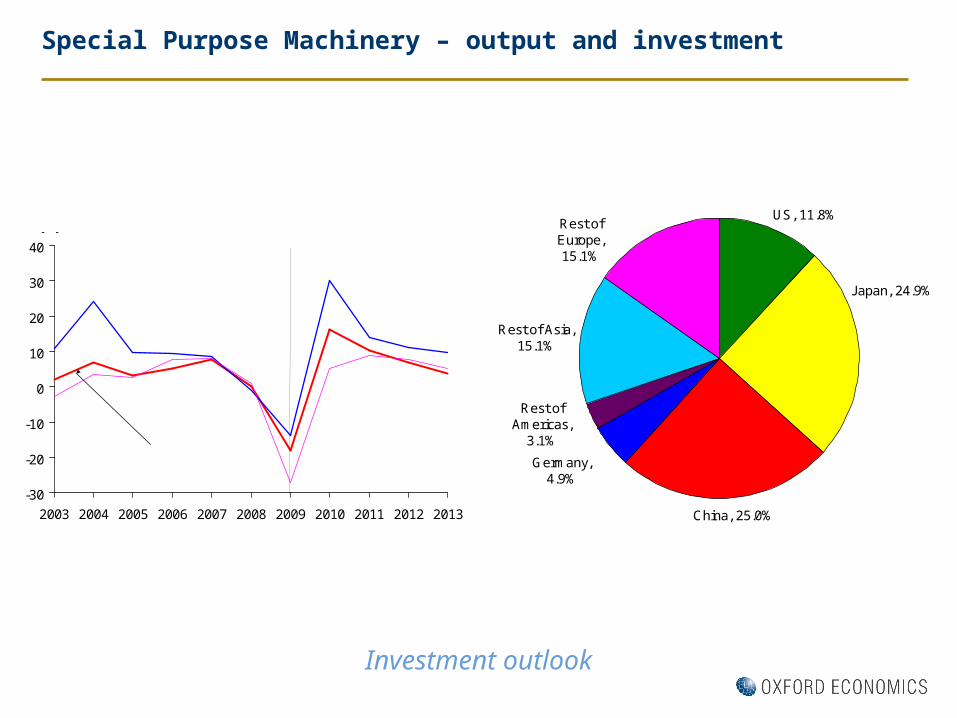
Special Purpose Machinery – output and investment
Investment outlook
US, 11.8%
China, 25.0%
Germany, 4.9%
Rest of Americas,
3.1%
Rest of Asia, 15.1%
Japan, 24.9%
Rest of Europe, 15.1%
Special purpose machinery investment 2009
Source : Oxford Economics
-30
-20
-10
0
10
20
30
40
2003 2004 2005 2006 2007 2008 2009 2010 2011 2012 2013Source: Oxford Economics
Special purpose machinery output
Europe
% yoy
Americas
Asia

Oxford Economics forecast
2009 2010 2011 2012 2013 2014
China -2.6 18.2 15.1 20.1 19.1 17.1Germany -37.4 -12.3 29.9 18.6 13.9 9.9Japan -38.5 3.6 21.5 18.0 9.2 7.2US -52.7 -0.4 36.2 25.5 12.0 10.0Italy -44.3 10.1 11.7 14.6 11.3 11.3Korea -21.0 14.8 21.9 15.4 10.5 8.5Brazil -22.4 17.2 22.7 15.3 15.3 15.3Taiwan -43.0 18.1 22.6 14.1 10.1 8.1India -33.9 15.1 25.7 30.5 22.7 15.7Russia -26.7 4.0 22.5 25.5 15.5 10.5Mexico -20.5 11.2 19.9 15.7 9.7 8.7France -46.6 0.2 19.4 17.1 14.8 9.8Switzerland -44.0 -16.4 20.7 16.1 15.4 11.8Spain -49.9 -15.6 10.4 15.9 16.9 19.9UK -34.0 -19.3 19.7 22.8 15.4 11.4
Americas -44.1 11.1 27.9 20.5 12.5 11.2Asia -15.1 17.9 17.4 19.4 16.8 14.6Europe -44.5 -0.8 21.8 18.2 14.1 11.1World -30.7 11.4 19.9 19.3 15.5 13.2
Machine Tools Sales
% change on previous year

Sharp decline followed by big rebound
US orders
-80
-70
-60
-50
-40
-30
-20
-10
0
10
20
30
40
2005 2006 2007 2008 2009 2010
US machine tools orders annual growth
% yr
Source : Oxford Economics
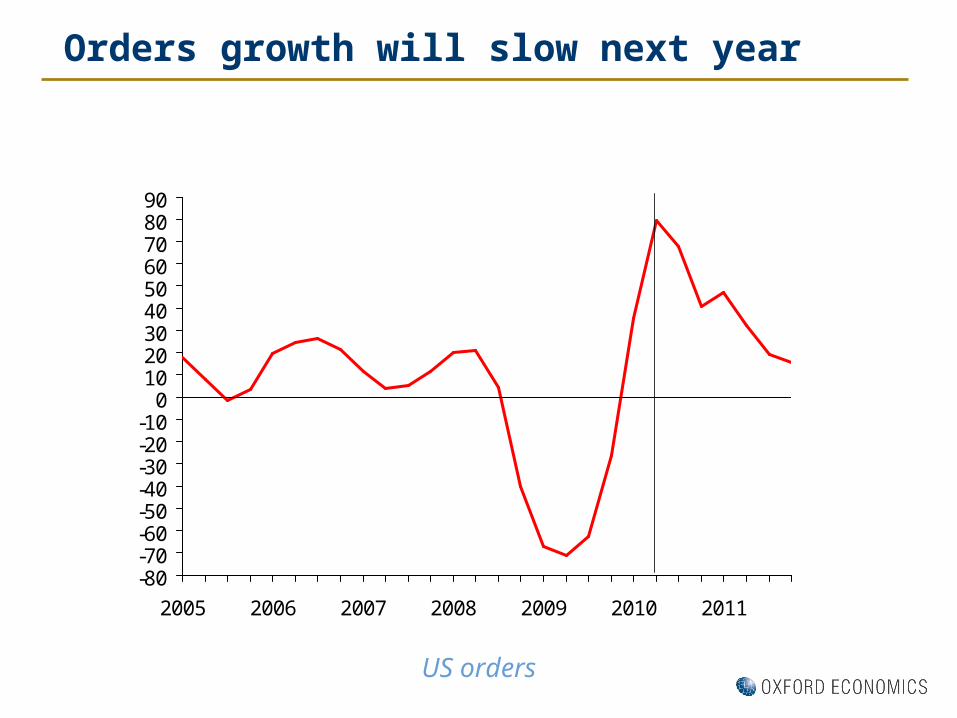
Orders growth will slow next year
US orders
-80-70-60-50-40-30-20-10
0102030405060708090
2005 2006 2007 2008 2009 2010 2011
US machine tools orders annual growth
% yr
Source : Oxford Economics
Forecast

Quarterly USMTC orders forecast…
US orders
0.025
0.045
0.065
0.085
0.105
0.125
0.145
2004 2005 2006 2007 2008 2009 2010 2011
0.3
0.4
0.5
0.6
0.7
0.8
0.9
1
1.1
1.2Forming machine tools, $bn Cutting machine tools, $bn
Forming machine tools (LHS)
Cutting machine tools (RHS)
US metalworking machine tools orders, USMTC
Forecast
Source : Oxford Economics

General regional rebound in 2010
-80%
-60%
-40%
-20%
0%
20%
40%
60%
80%
100%
2009 2010 2011
TotalNortheastSouthMidwestCentralWest
Source: Oxford Economics
Growth in value of orders for cutting machines by region
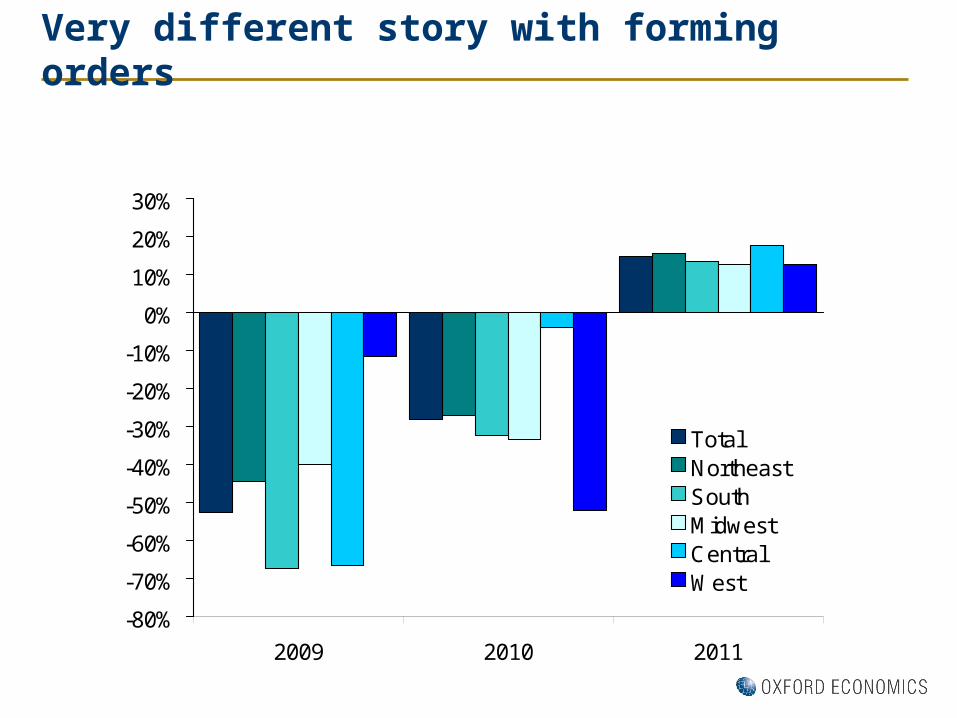
Very different story with forming orders
-80%
-70%
-60%
-50%
-40%
-30%
-20%
-10%
0%
10%
20%
30%
2009 2010 2011
TotalNortheastSouthMidwestCentralWest
Source: Oxford Economics
Growth in value of orders for forming machines by region

Conclusions
Policy stimulus, turn in inventory cycle and rebound in world trade drove strong recovery
Global economic recovery should continue but there are growing downside risks
Machine tool orders up sharply from lows. Sales have so far been more subdued but these should now start to pick up.
MT sales are forecast to rebound sharply over the next few years in both developed and emerging markets
Strong rebound in developed economy markets follows very deep recession but focus of global MT market still increasingly moving toward emerging economies
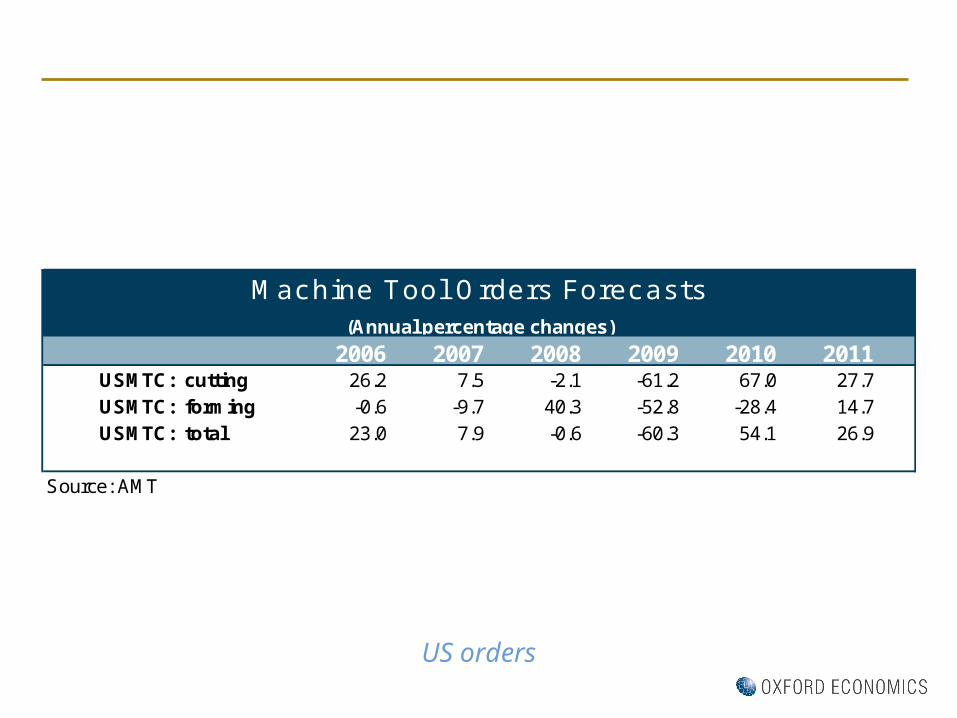
US orders
2006 2007 2008 2009 2010 2011USMTC: cutting 26.2 7.5 -2.1 -61.2 67.0 27.7USMTC: forming -0.6 -9.7 40.3 -52.8 -28.4 14.7USMTC: total 23.0 7.9 -0.6 -60.3 54.1 26.9
Source: AMT
Machine Tool Orders Forecasts(Annual percentage changes)

Related Documents