Is the Biofuels Tank Half-Full or Half- Empty? National Farm Business Management Conference June 15, 2009 St Louis, MO Ron Plain, Ph.D. D. Howard Doane Professor Dept of Agricultural Economics University of Missouri-Columbia http://web.missouri.edu/~rplain

Is the Biofuels Tank Half-Full or Half-Empty? National Farm Business Management Conference June 15, 2009St Louis, MO Ron Plain, Ph.D. D. Howard Doane Professor.
Dec 23, 2015
Welcome message from author
This document is posted to help you gain knowledge. Please leave a comment to let me know what you think about it! Share it to your friends and learn new things together.
Transcript

Is the Biofuels Tank Half-Full or Half-Empty?
National Farm Business Management ConferenceJune 15, 2009 St Louis, MO
Ron Plain, Ph.D.D. Howard Doane ProfessorDept of Agricultural EconomicsUniversity of Missouri-Columbiahttp://web.missouri.edu/~rplain
Basics of Ethanol Production
Ethanol is an alcohol made by fermenting grain and other carbohydrates
This is an old process which traditionally has been used to produce ethanol for use as a beverage
97% of U.S. ethanol is made from corn Rest: milo, wheat, brewery waste, whey, etc
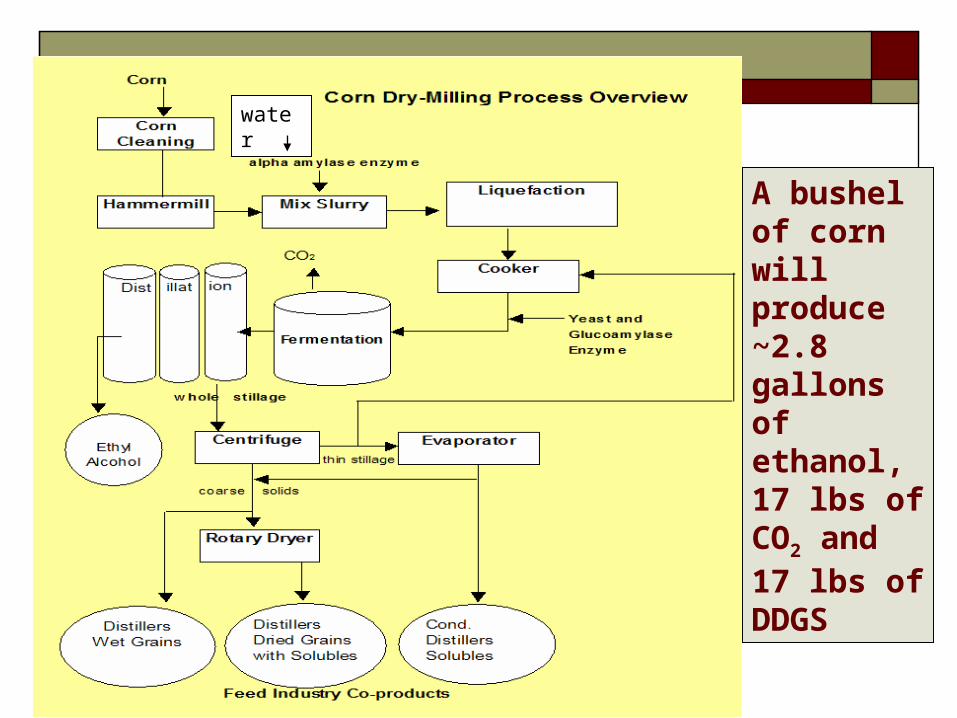
A bushel of corn will produce ~2.8 gallons of ethanol, 17 lbs of CO2 and 17 lbs of DDGS
water
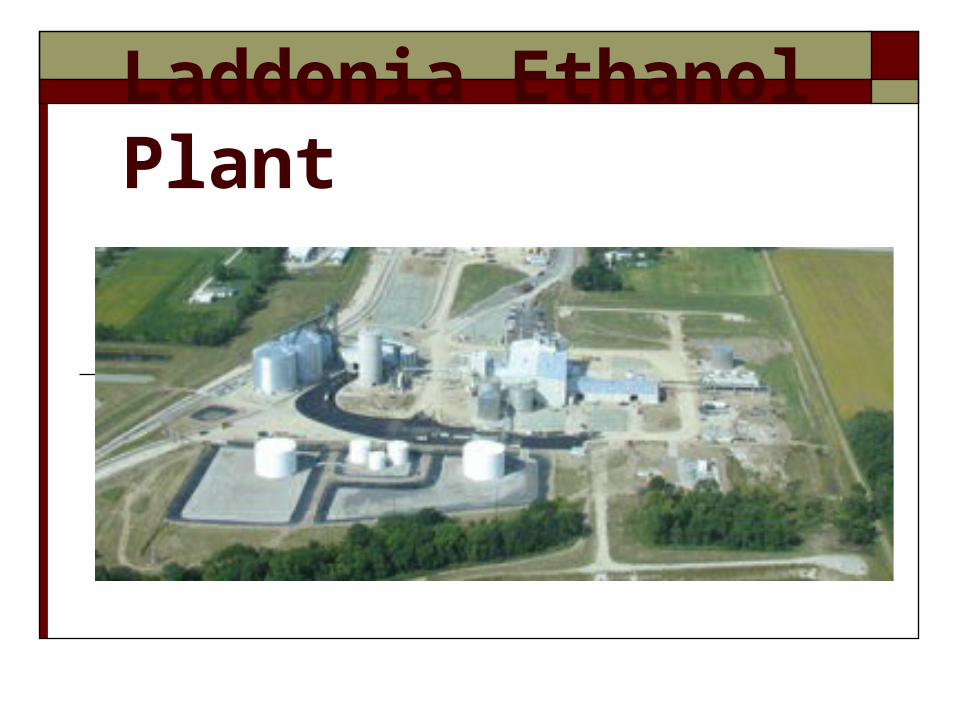
Laddonia Ethanol Plant

Ethanol Plants Were Very Profitable
In 2006, U.S. plants produced ethanol for about $1.34 per gallon. The average price of ethanol was about $2.58 per gallon.

Ethanol Capacity Growth
0
2
4
6
8
10
12
14
16
1999 2001 2003 2005 2007 2009
bil
lio
n g
all
on
s
Jan. 1 capacity Under construction
Source: Renewable Fuel Association website http://www.ethanolrfa.org/industry/statistics/#B
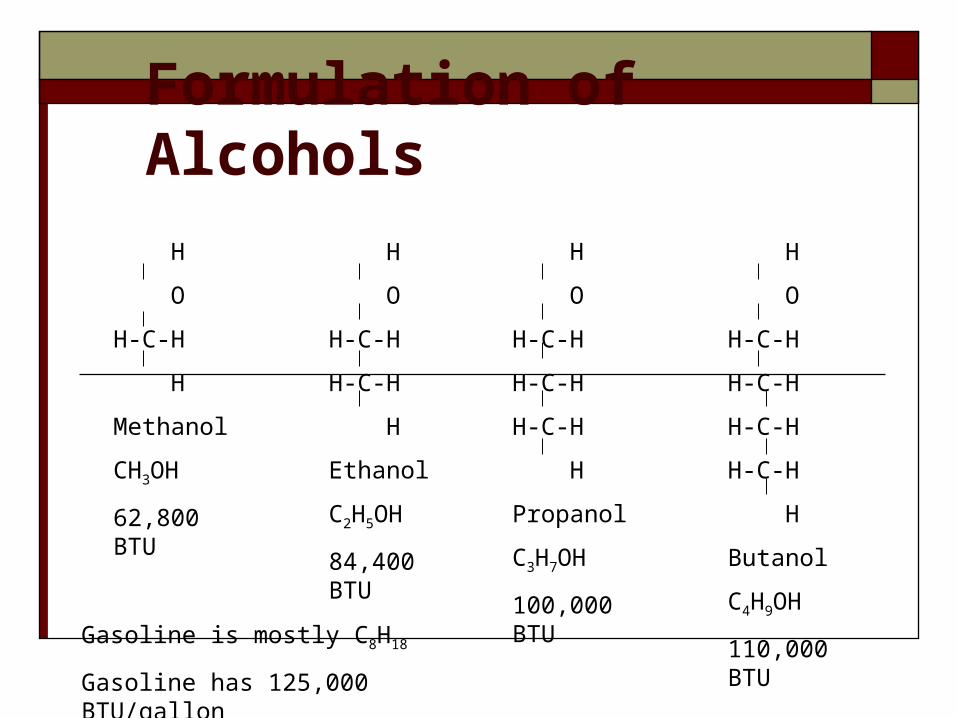
Formulation of Alcohols
H
O
H-C-H
H
Methanol
CH3OH
62,800 BTU
H
O
H-C-H
H-C-H
H
Ethanol
C2H5OH
84,400 BTU
H
O
H-C-H
H-C-H
H-C-H
H
Propanol
C3H7OH
100,000 BTU
H
O
H-C-H
H-C-H
H-C-H
H-C-H
H
Butanol
C4H9OH
110,000 BTUGasoline is mostly C8H18
Gasoline has 125,000 BTU/gallon
Biofuels Policy
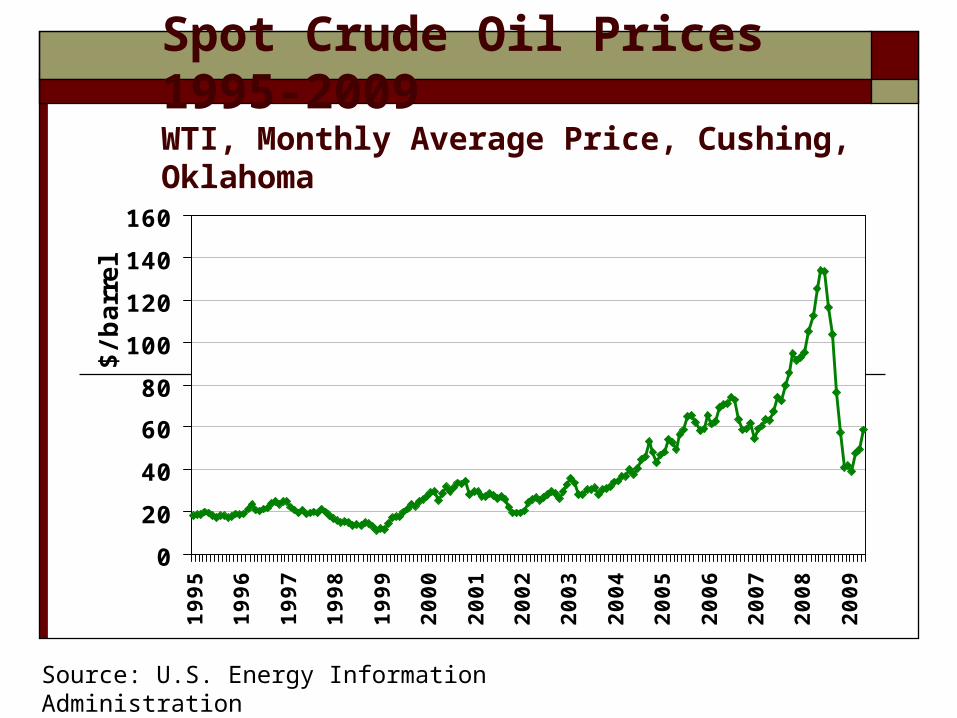
Spot Crude Oil Prices 1995-2009WTI, Monthly Average Price, Cushing, Oklahoma
0
20
40
60
80
100
120
140
1601995
1996
1997
1998
1999
2000
2001
2002
2003
2004
2005
2006
2007
2008
2009
$/barr
el
Source: U.S. Energy Information Administration
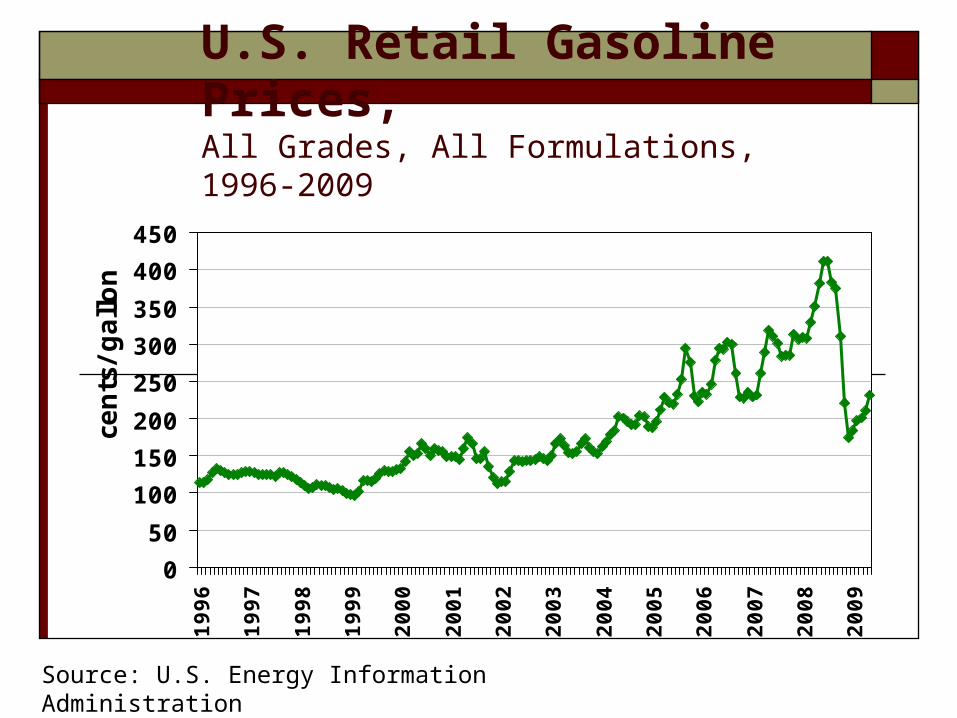
U.S. Retail Gasoline Prices, All Grades, All Formulations, 1996-2009
0
50
100
150
200
250
300
350
400
4501996
1997
1998
1999
2000
2001
2002
2003
2004
2005
2006
2007
2008
2009
cents
/gallon
Source: U.S. Energy Information Administration
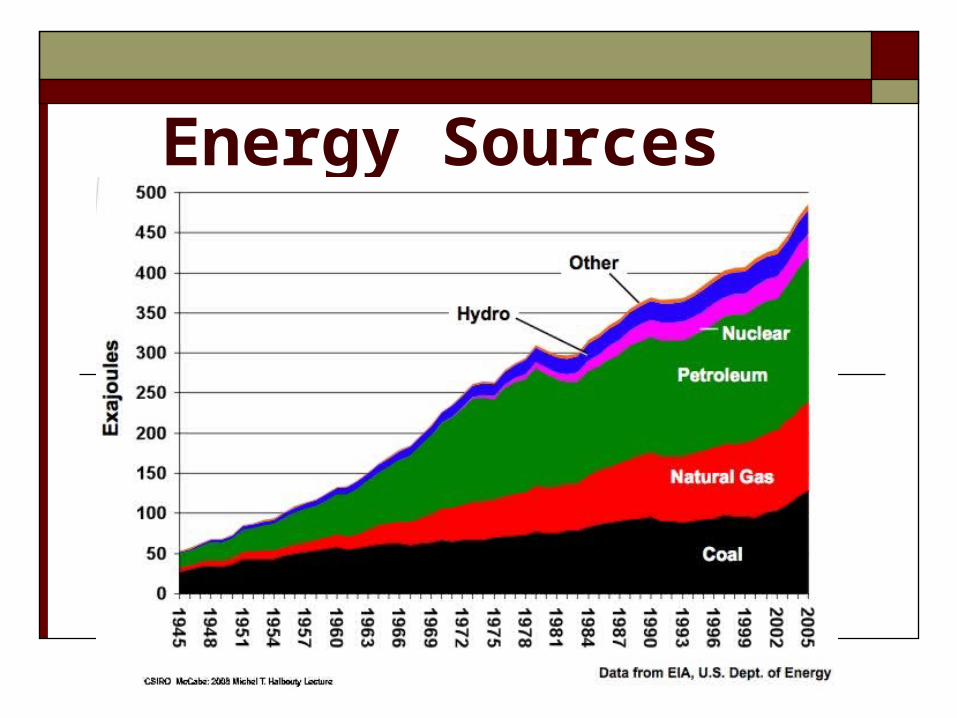
Energy Sources
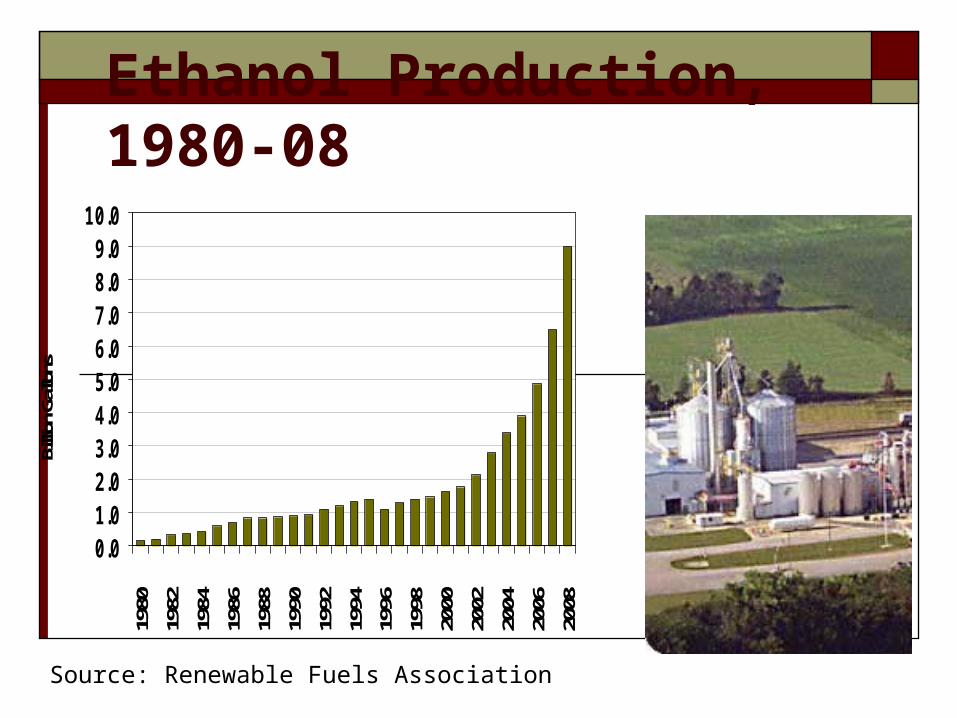
Ethanol Production, 1980-08
0.01.02.03.04.05.06.07.08.09.0
10.0
1980
1982
1984
1986
1988
1990
1992
1994
1996
1998
2000
2002
2004
2006
2008
Billio
n Gall
ons
Source: Renewable Fuels Association

2007 Renewable Fuels Mandate
05
10152025303540
2008
2009
2010
2011
2012
2013
2014
2015
2016
2017
2018
2019
2020
2021
2022
Billion G
allons
Corn ethanol Cellulosic Bio-diesel More non-grain
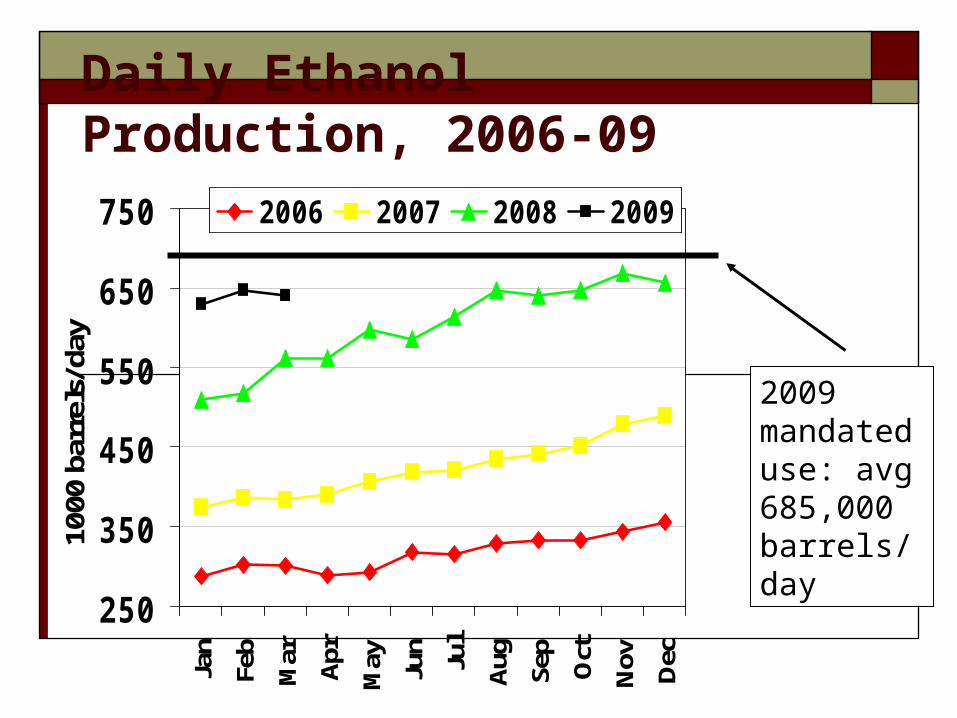
Daily Ethanol Production, 2006-09
250
350
450
550
650
750Ja
n
Feb
Mar Apr
May Jun
Jul
Aug
Sep
Oct
Nov Dec
1000
bar
rels
/day
2006 2007 2008 2009
2009 mandated use: avg 685,000 barrels/day

Ethanol Production, 1990-2016
02468
101214161820
1990
1992
1994
1996
1998
2000
2002
2004
2006
2008
2010
2012
2014
2016
Billion G
allons
mandated use
actual production
Beginning in 2015, the U.S. will annually use more corn to make ethanol than the U.S. produced in any year before 1971
Source: U.S. Energy Information Administration
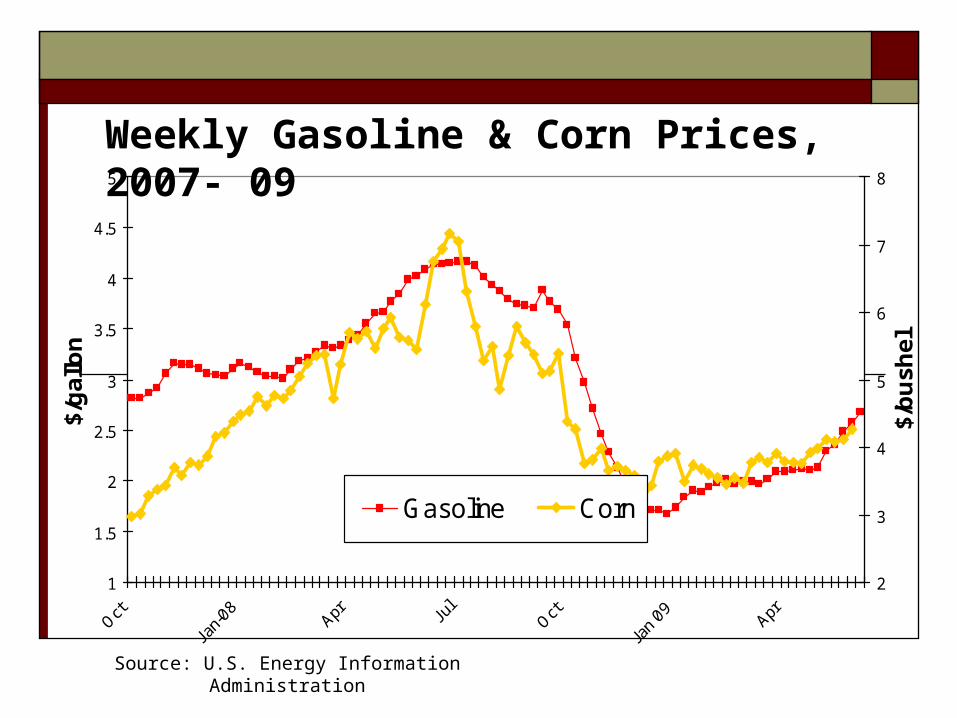
1.50
2.00
2.50
3.00
3.50
4.00
4.50$ Per Gallon
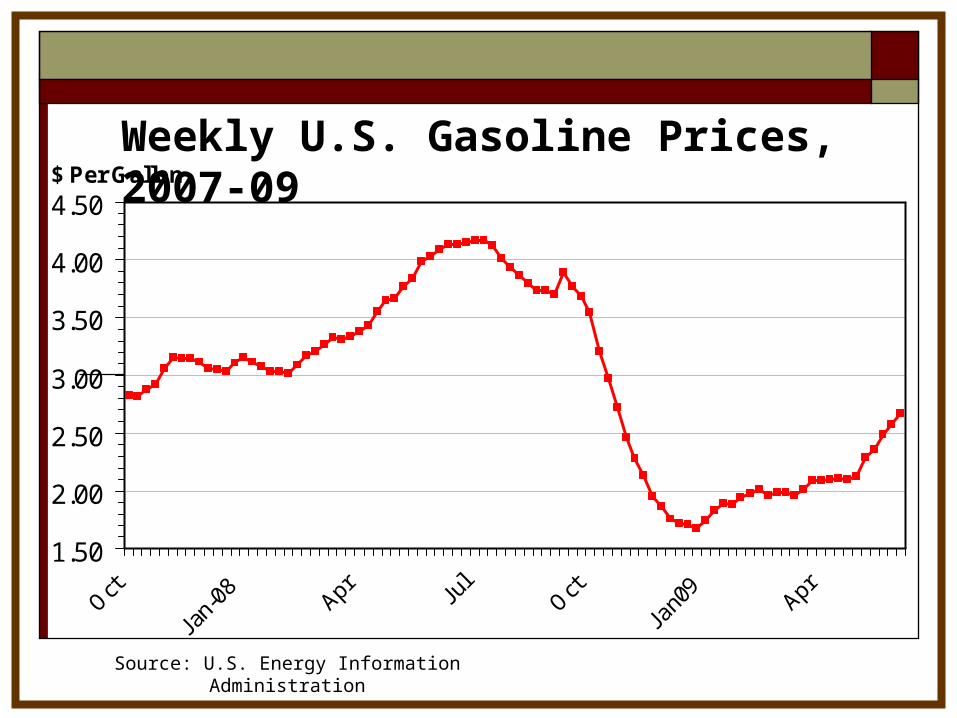
Weekly U.S. Gasoline Prices, 2007-09

Ethanol-Gasoline Price Relationship
0.00.51.01.52.02.53.03.54.04.5
0.5 1.0 1.5 2.0 2.5 3.0 3.5 4.0 4.5 5.0 5.5 6.0
Retail Gasoline $/ gal
Eth
anol $/g
al
Source: Ron Plain
Livestock Marketing Information Center
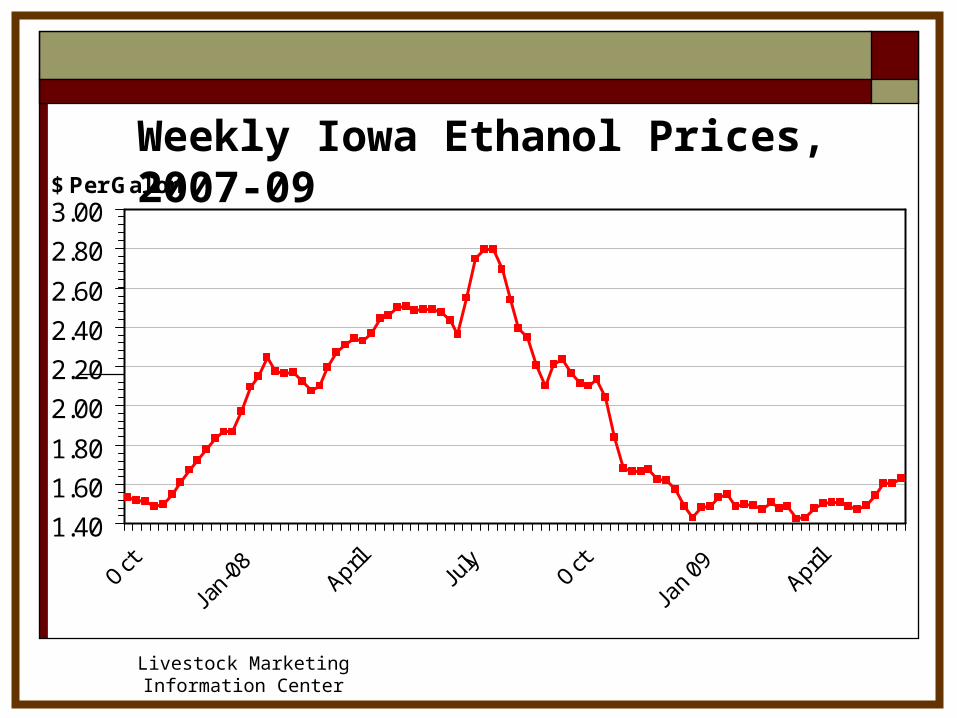
1.40
1.60
1.80
2.00
2.20
2.40
2.60
2.80
3.00$ Per Gallon
Weekly Iowa Ethanol Prices, 2007-09
Source: U.S. Energy Information Administration
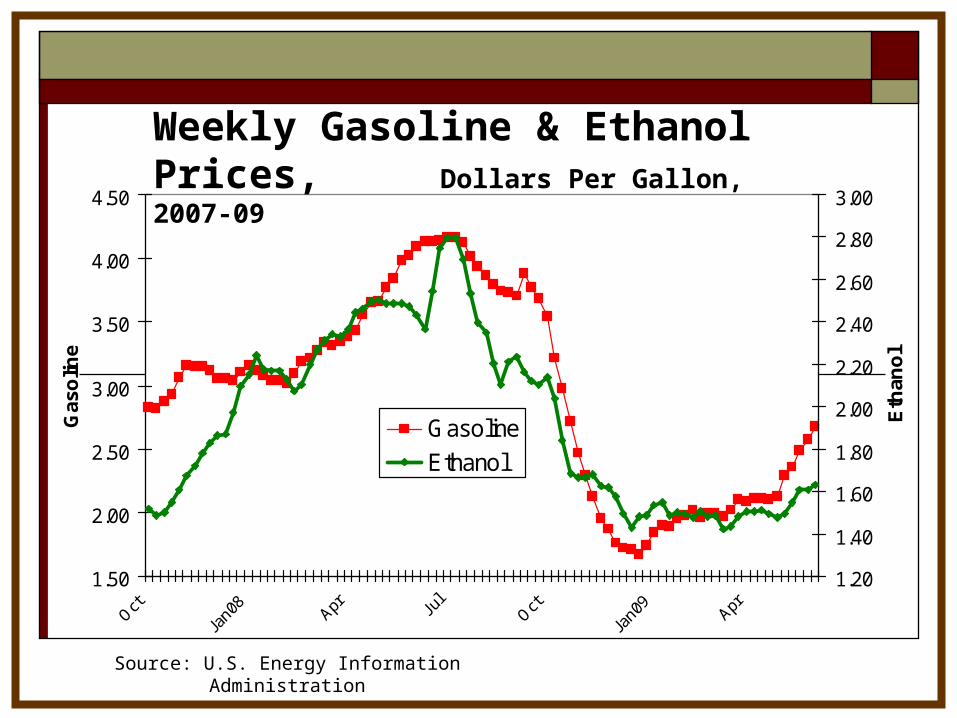
1.50
2.00
2.50
3.00
3.50
4.00
4.50
Gas
olin
e
1.20
1.40
1.60
1.80
2.00
2.20
2.40
2.60
2.80
3.00
Eth
ano
l
Gasoline
Ethanol
Weekly Gasoline & Ethanol Prices, Dollars Per Gallon, 2007-09

Ethanol-Corn Price Relationship
0.00.51.01.52.02.53.03.5
1 2 3 4 5 6 7 8 9
Corn $/ bu
Eth
anol $
/gal breakeven
Source: Ron Plain
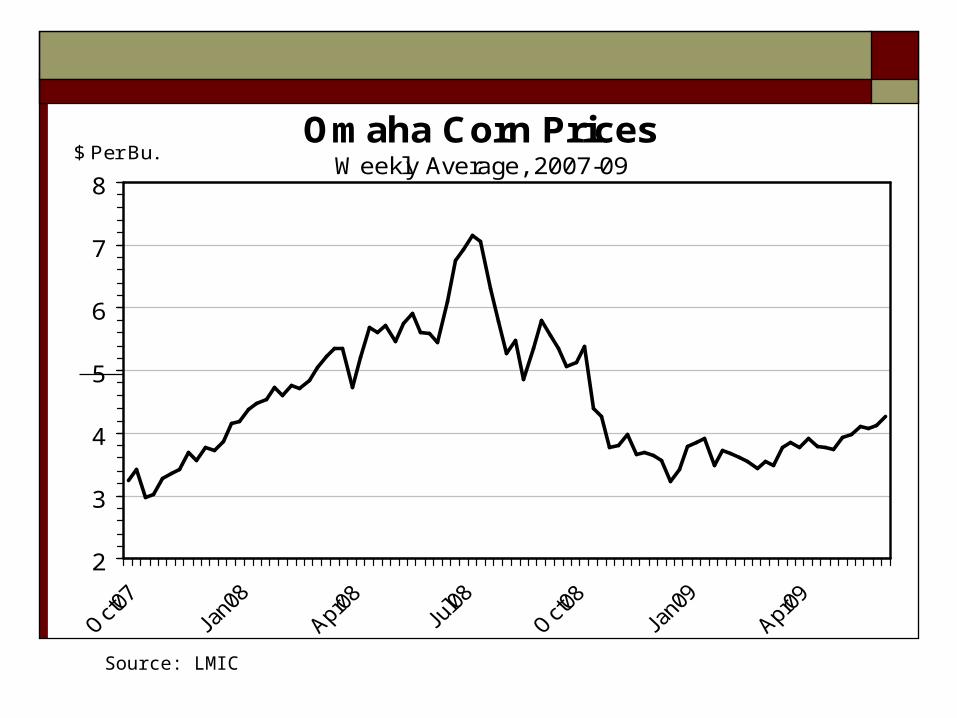
Omaha Corn PricesWeekly Average, 2007-09
2
3
4
5
6
7
8
$ Per Bu.
Source: LMIC
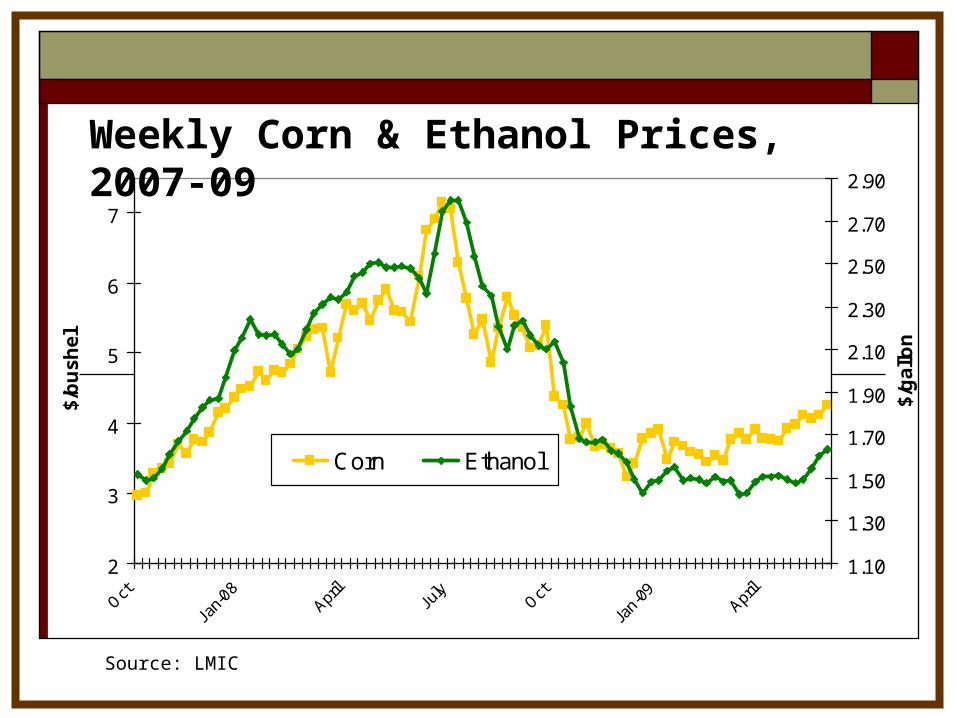
Source: LMIC
2
3
4
5
6
7
$/b
ush
el
1.10
1.30
1.50
1.70
1.90
2.10
2.30
2.50
2.70
2.90
$/g
allo
n
Corn Ethanol
Weekly Corn & Ethanol Prices, 2007-09
Source: U.S. Energy Information Administration
1
1.5
2
2.5
3
3.5
4
4.5
5
$/g
allo
n
2
3
4
5
6
7
8
$/b
ush
el
Gasoline Corn
Weekly Gasoline & Corn Prices, 2007- 09
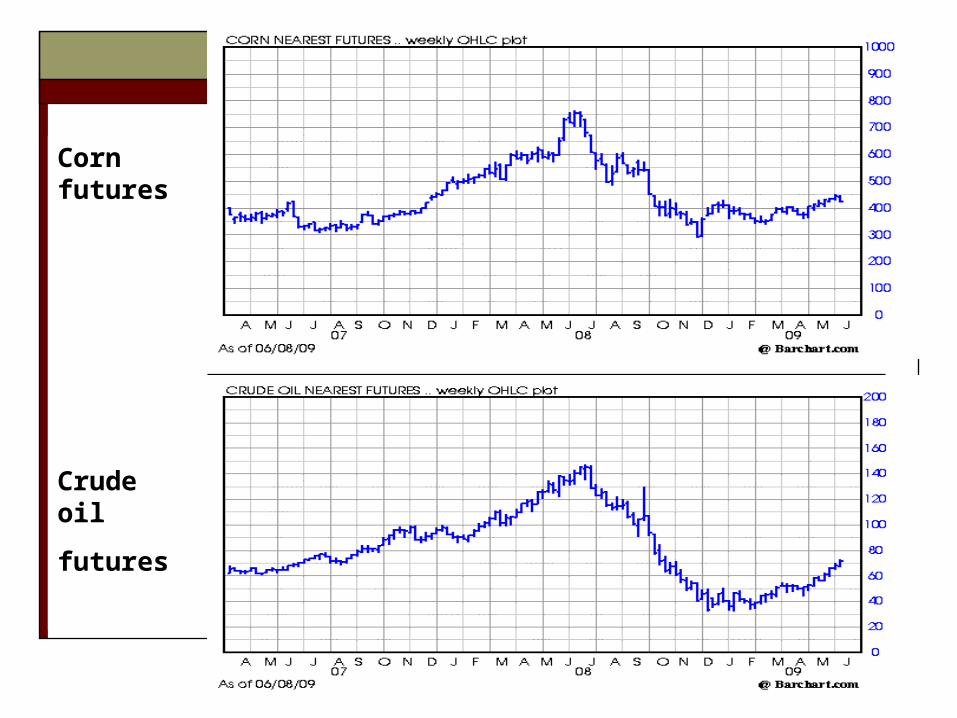
Corn futures
Crude oil
futures

Impact on feed prices
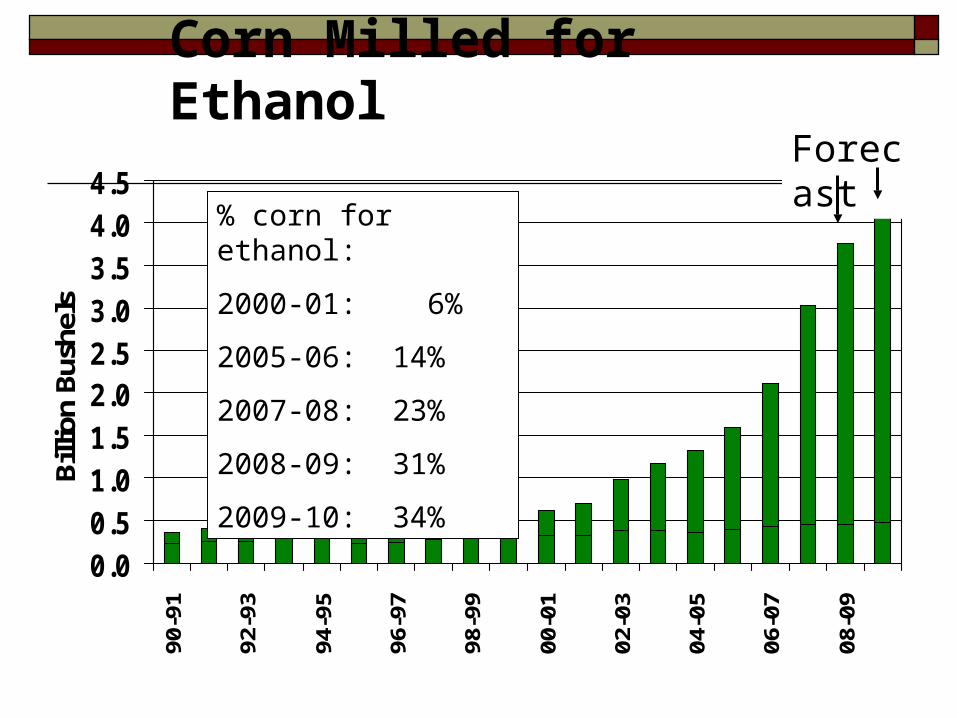
Corn Milled for Ethanol
0.00.51.01.52.02.53.03.54.04.5
90-9
1
92-9
3
94-9
5
96-9
7
98-9
9
00-0
1
02-0
3
04-0
5
06-0
7
08-0
9
Billi
on B
ushe
ls
Forecast
% corn for ethanol:
2000-01: 6%
2005-06: 14%
2007-08: 23%
2008-09: 31%
2009-10: 34%
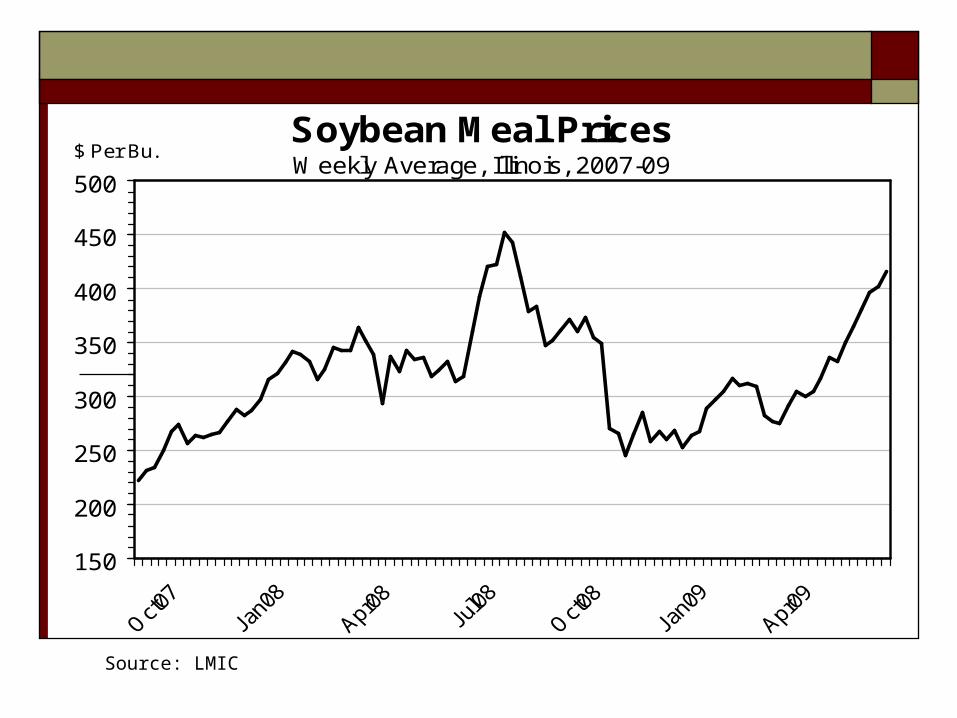
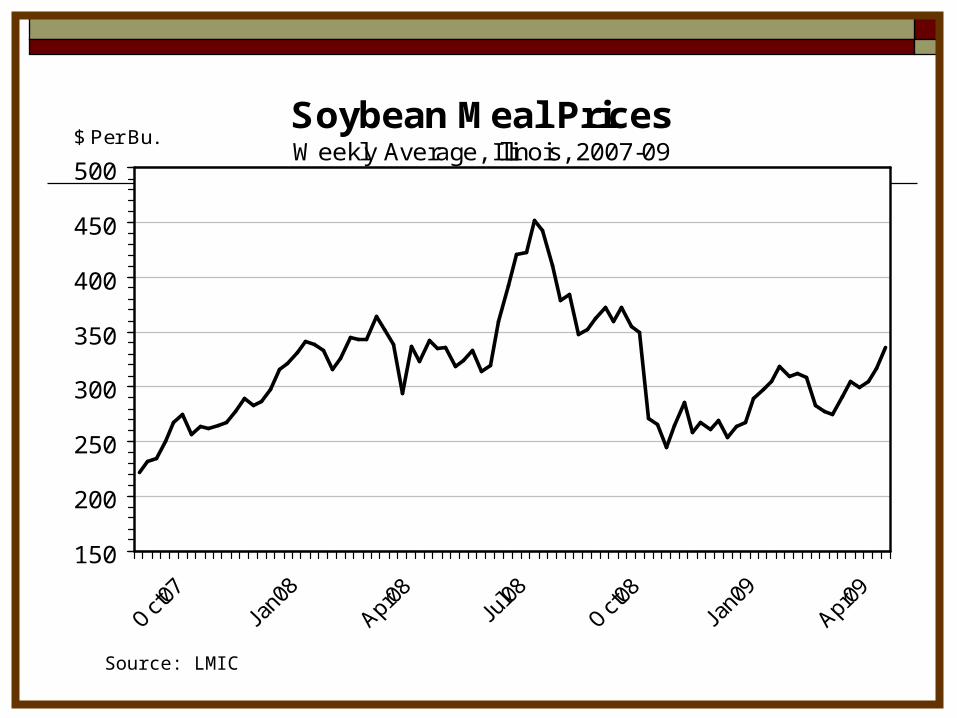
Soybean Meal PricesWeekly Average, Illinois, 2007-09
150
200
250
300
350
400
450
500
$ Per Bu.
Source: LMIC

1
2
3
4
5
6
7
8
$/b
ush
el
100
150
200
250
300
350
400
450
500
$/t
on
Corn
SB Meal
Weekly Corn & Soybean Meal Prices, 2006-09
Source: LMIC

Livestock Marketing Information Center
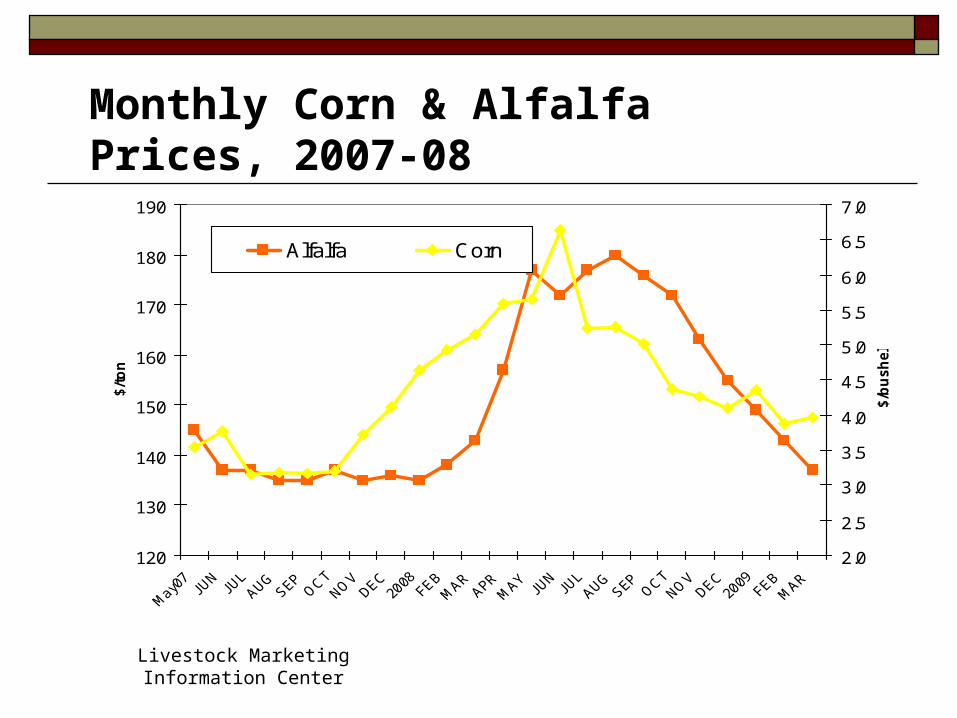
ALFALFA HAY - MONTHLY AVERAGE PRICEReceived by Farmers, U.S., Crop Year
120
130
140
150
160
170
180
190
May07 JUL SEP NOV 2008 MAR MAY JUL SEP NOV 2009 MAR
$ Per Ton
Livestock Marketing Information Center
120
130
140
150
160
170
180
190
$/t
on
2.0
2.5
3.0
3.5
4.0
4.5
5.0
5.5
6.0
6.5
7.0
$/b
ush
el
Alfalfa Corn
Monthly Corn & Alfalfa Prices, 2007-08
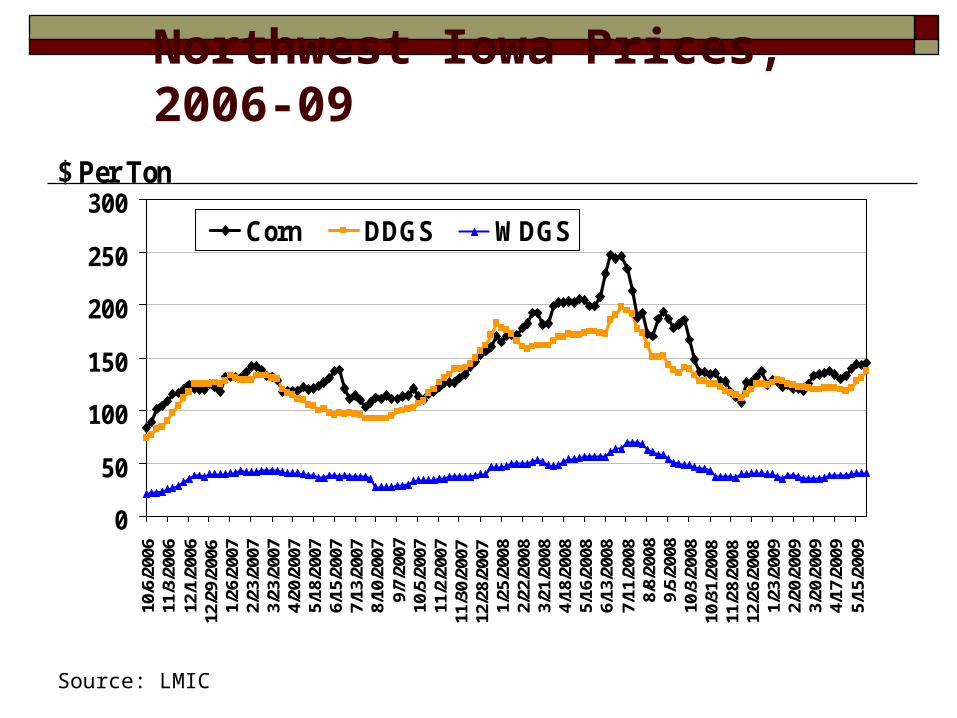
Northwest Iowa Prices, 2006-09
0
50
100
150
200
250
300
10/6
/200
611
/3/2
006
12/1
/200
612
/29/
2006
1/26
/200
72/
23/2
007
3/23
/200
74/
20/2
007
5/18
/200
76/
15/2
007
7/13
/200
78/
10/2
007
9/7/
2007
10/5
/200
711
/2/2
007
11/3
0/20
0712
/28/
2007
1/25
/200
82/
22/2
008
3/21
/200
84/
18/2
008
5/16
/200
86/
13/2
008
7/11
/200
88/
8/20
089/
5/20
0810
/3/2
008
10/3
1/20
0811
/28/
2008
12/2
6/20
081/
23/2
009
2/20
/200
93/
20/2
009
4/17
/200
95/
15/2
009
$ Per Ton
Corn DDGS WDGS
Source: LMIC
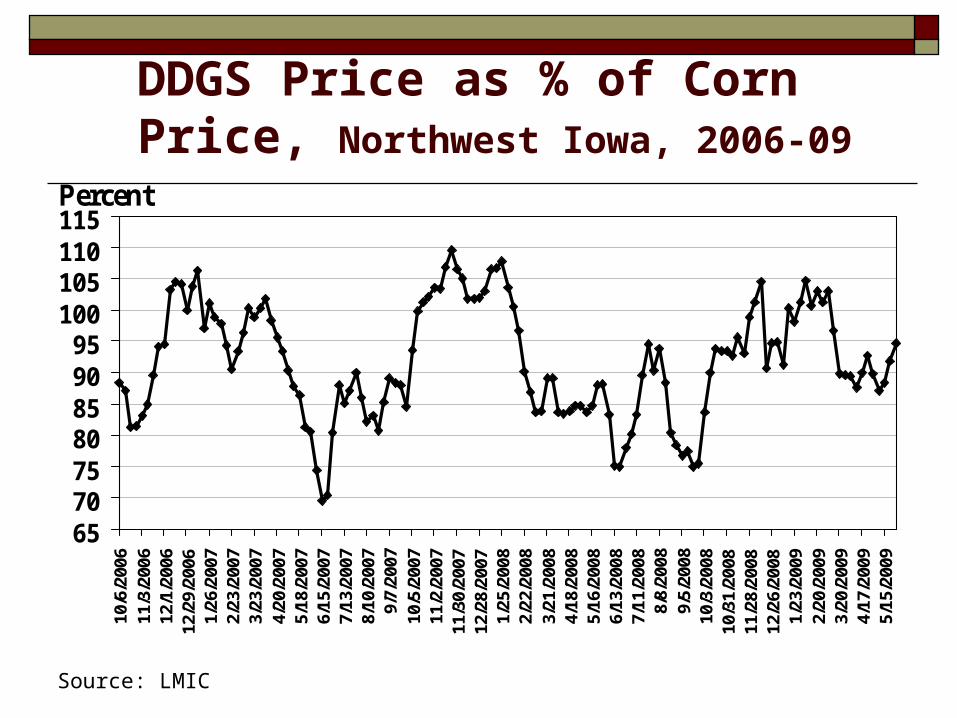
DDGS Price as % of Corn Price, Northwest Iowa, 2006-09
65707580859095
100105110115
10/6
/200
611
/3/2
006
12/1
/200
612
/29/
2006
1/26
/200
72/
23/2
007
3/23
/200
74/
20/2
007
5/18
/200
76/
15/2
007
7/13
/200
78/
10/2
007
9/7/
2007
10/5
/200
711
/2/2
007
11/3
0/20
0712
/28/
2007
1/25
/200
82/
22/2
008
3/21
/200
84/
18/2
008
5/16
/200
86/
13/2
008
7/11
/200
88/
8/20
089/
5/20
0810
/3/2
008
10/3
1/20
0811
/28/
2008
12/2
6/20
081/
23/2
009
2/20
/200
93/
20/2
009
4/17
/200
95/
15/2
009
Percent
Source: LMIC
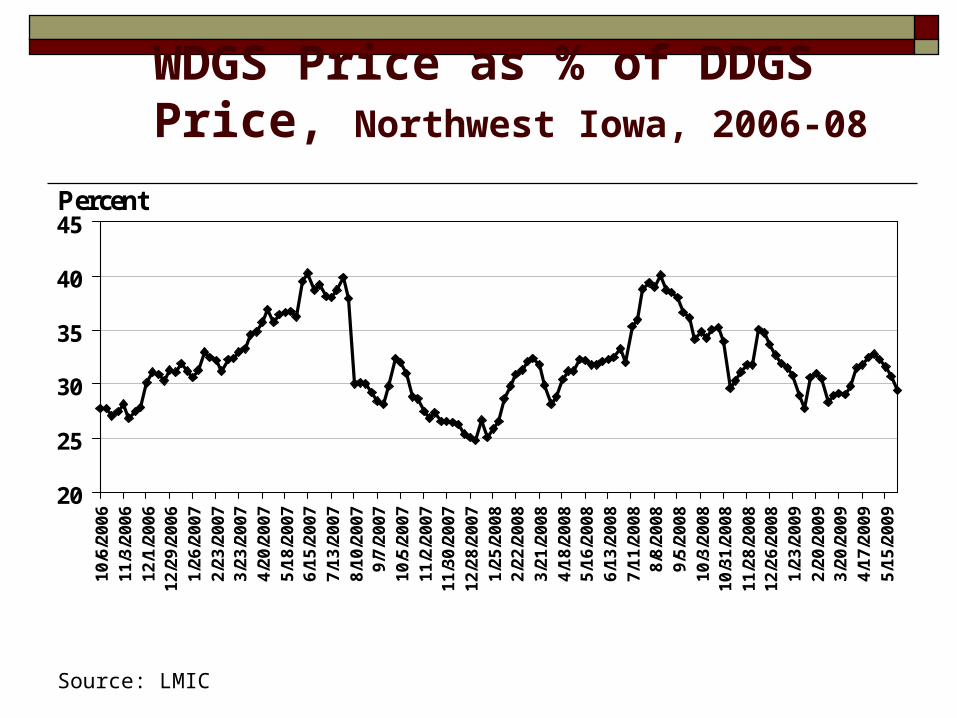
WDGS Price as % of DDGS Price, Northwest Iowa, 2006-08
20
25
30
35
40
45
10
/6/2
00
61
1/3
/20
06
12
/1/2
00
61
2/2
9/2
00
61
/26
/20
07
2/2
3/2
00
73
/23
/20
07
4/2
0/2
00
75
/18
/20
07
6/1
5/2
00
77
/13
/20
07
8/1
0/2
00
79
/7/2
00
71
0/5
/20
07
11
/2/2
00
71
1/3
0/2
00
71
2/2
8/2
00
71
/25
/20
08
2/2
2/2
00
83
/21
/20
08
4/1
8/2
00
85
/16
/20
08
6/1
3/2
00
87
/11
/20
08
8/8
/20
08
9/5
/20
08
10
/3/2
00
81
0/3
1/2
00
81
1/2
8/2
00
81
2/2
6/2
00
81
/23
/20
09
2/2
0/2
00
93
/20
/20
09
4/1
7/2
00
95
/15
/20
09
Percent
Source: LMIC
Impact on crop acres

Million Acres Planted by Crop
2006 2007 Change
Corn 78.327 93.600 + 15.273
Soybeans 75.522 64.736 - 10.786
Wheat 57.344 60.433 + 3.089
Cotton 15.274 10.827 - 4.447
Sorghum 6.522 7.718 + 1.196
Oats 4.168 3.760 - 0.408
Barley 3.452 4.020 + 0.568
18 crops 255.398 259.428 + 4.030

Million Acres Planted by Crop
2007 2008 Change
Corn 93.600 85.889 - 7.711
Soybeans 64.736 75.878 +11.142
Wheat 60.433 63.047 + 2.614
Cotton 10.827 9.414 - 1.413
Sorghum 7.718 8.327 + 0.609
Oats 3.760 3.217 - 0.340
Barley 4.020 4.234 + 0.214
18 crops 259.428 264.740 + 5.312
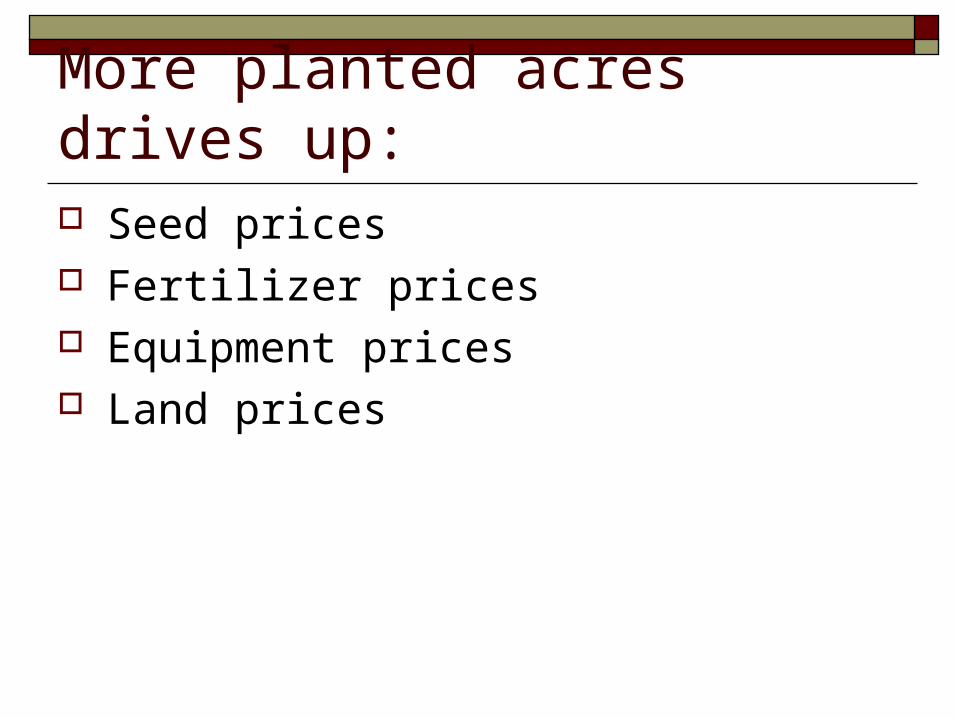
More planted acres drives up: Seed prices Fertilizer prices Equipment prices Land prices
0
500
1000
1500
2000
250050
54
58
62
66
70
74
78
82
86
90
94
98
02
06
$/acre
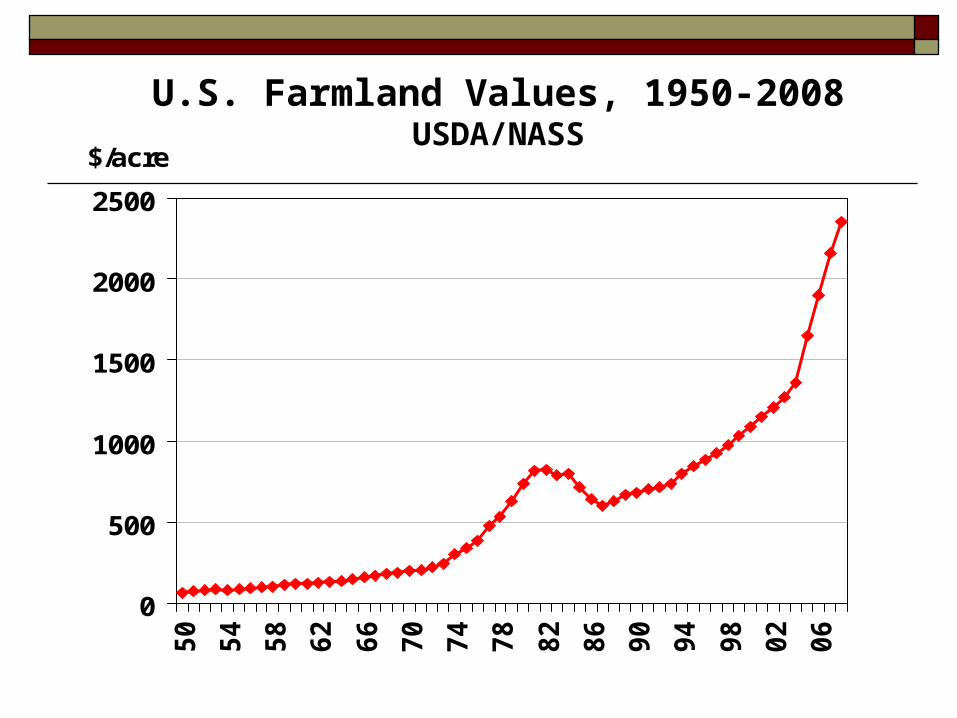
U.S. Farmland Values, 1950-2008USDA/NASS

Impact on livestock
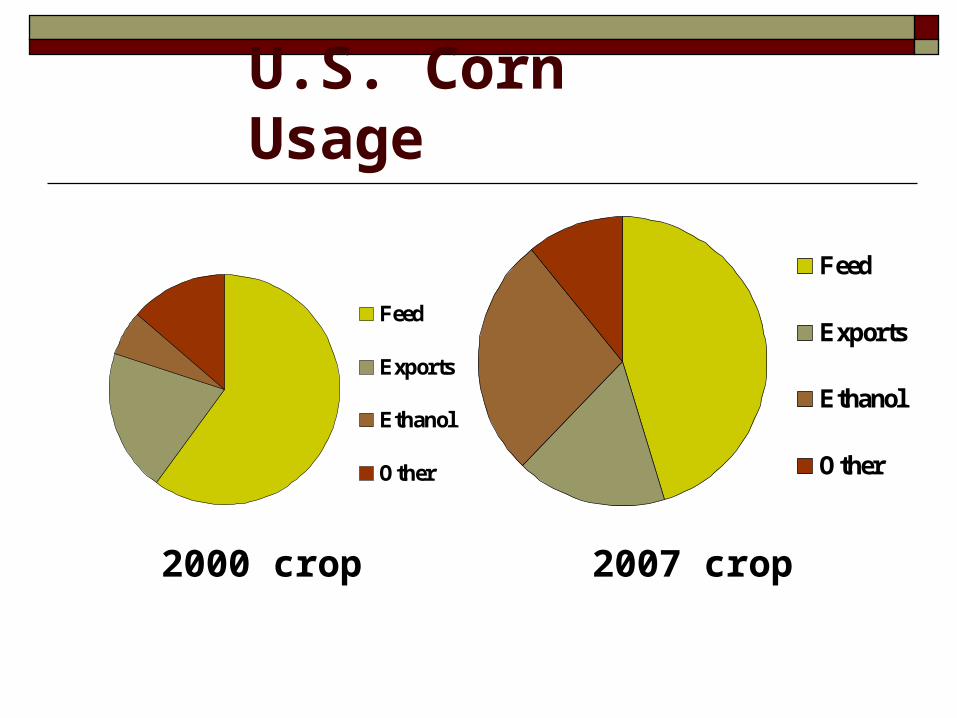
U.S. Corn Usage
Feed
Exports
Ethanol
Other
Feed
Exports
Ethanol
Other
2000 crop 2007 crop
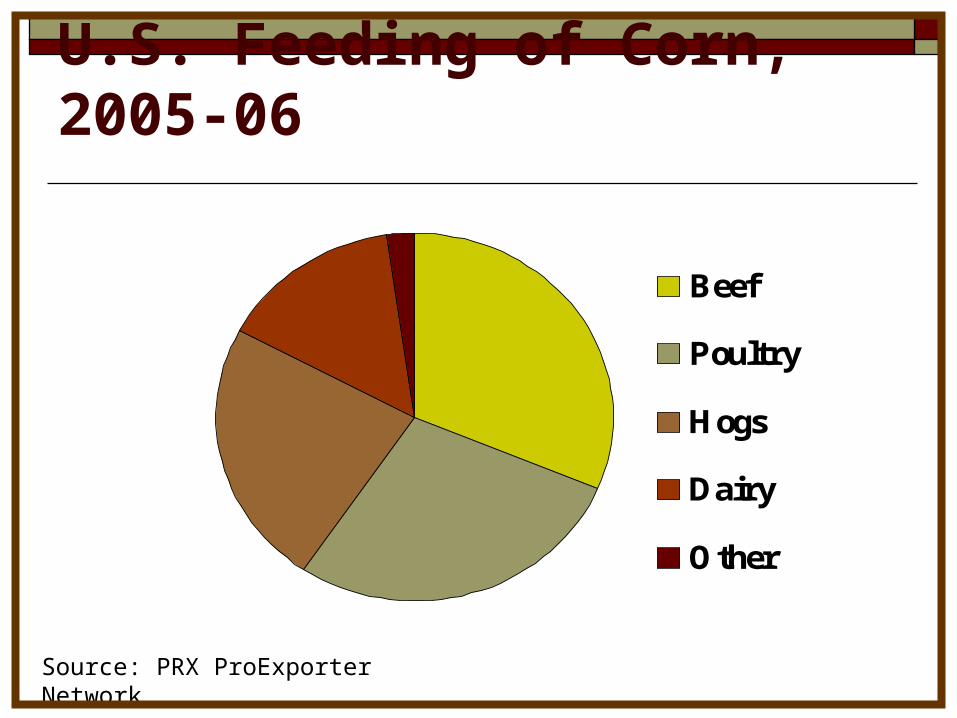
U.S. Feeding of Corn, 2005-06
Beef
Poultry
Hogs
Dairy
Other
Source: PRX ProExporter Network
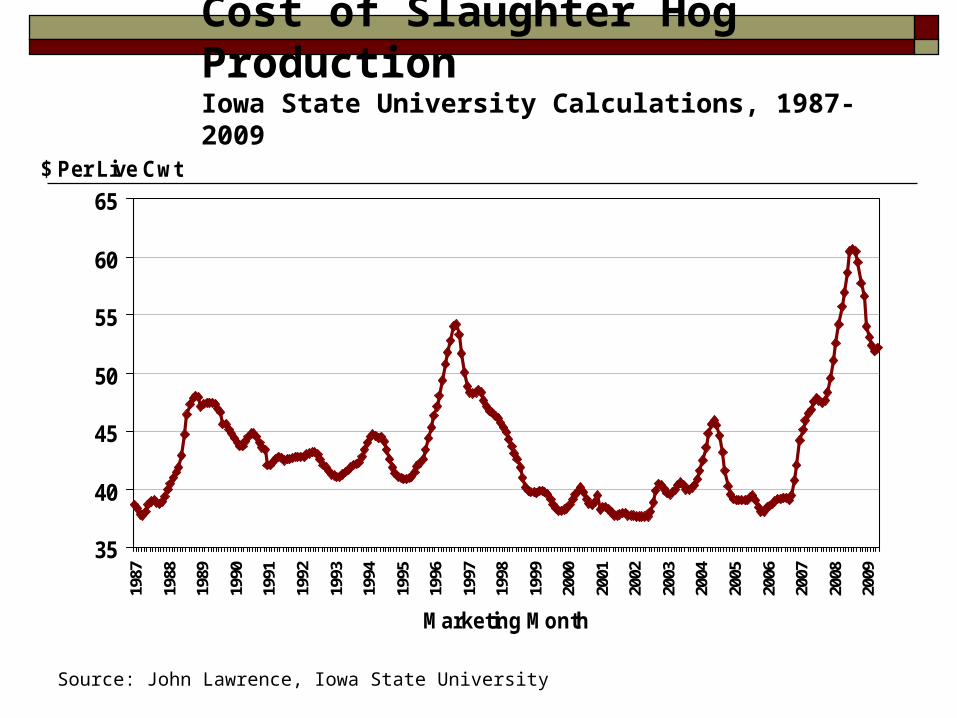
Cost of Slaughter Hog ProductionIowa State University Calculations, 1987-2009
35
40
45
50
55
60
65
1987
1988
1989
1990
1991
1992
1993
1994
1995
1996
1997
1998
1999
2000
2001
2002
2003
2004
2005
2006
2007
2008
2009
Marketing Month
$ Per Live Cwt
Source: John Lawrence, Iowa State University
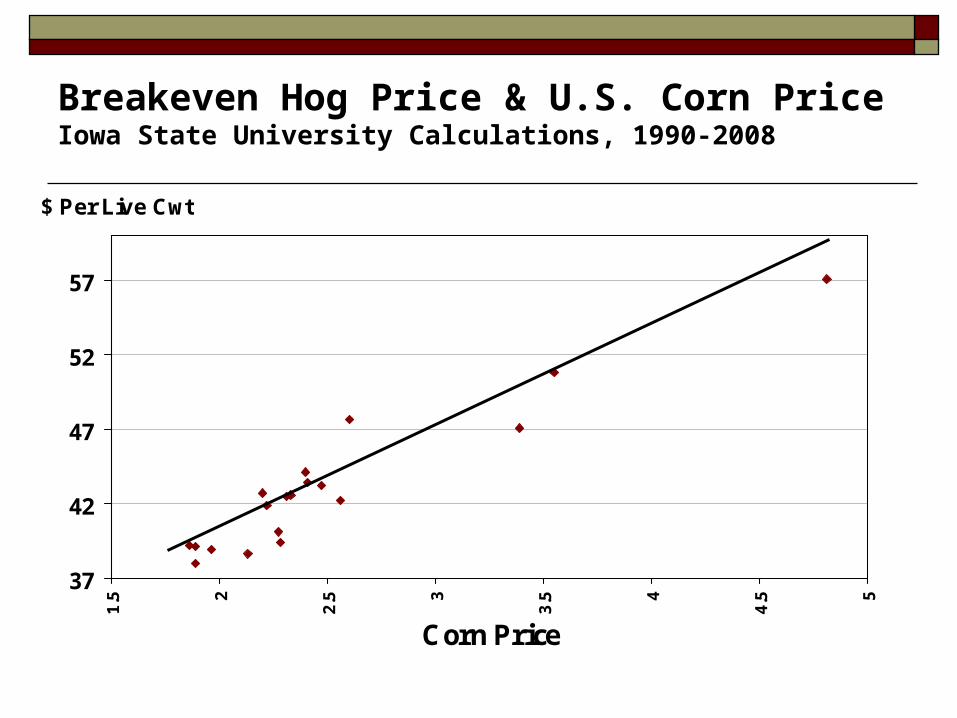
Breakeven Hog Price & U.S. Corn PriceIowa State University Calculations, 1990-2008
37
42
47
52
57
1.5 2
2.5 3
3.5 4
4.5 5
Corn Price
$ Per Live Cwt
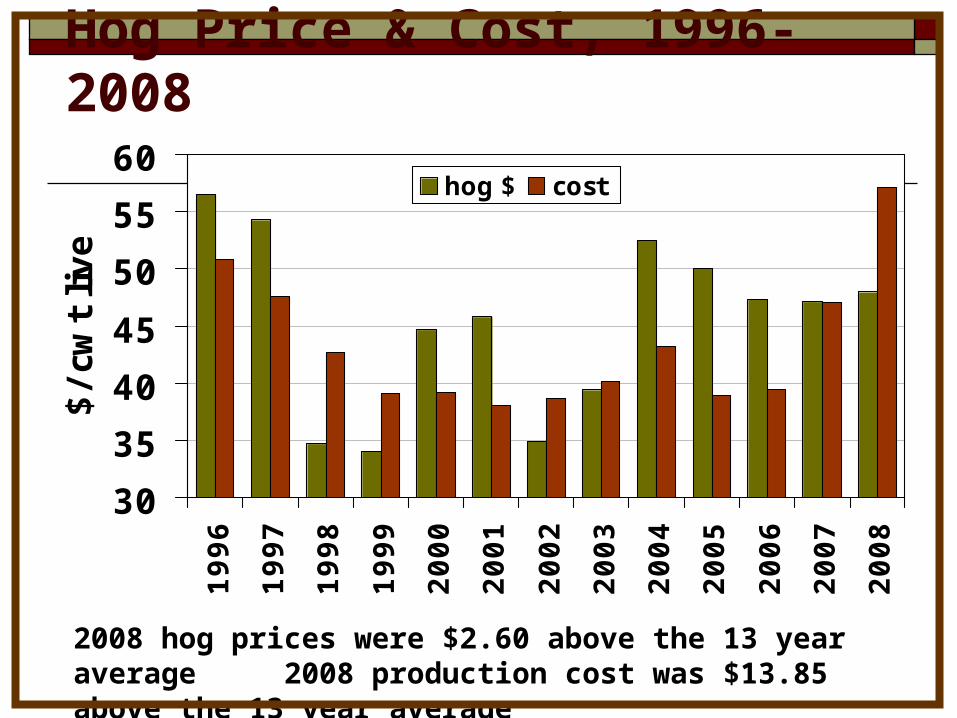
Hog Price & Cost, 1996-2008
30
35
40
45
50
55
60
1996
1997
1998
1999
2000
2001
2002
2003
2004
2005
2006
2007
2008
$/c
wt
live
hog $ cost
2008 hog prices were $2.60 above the 13 year average 2008 production cost was $13.85 above the 13 year average
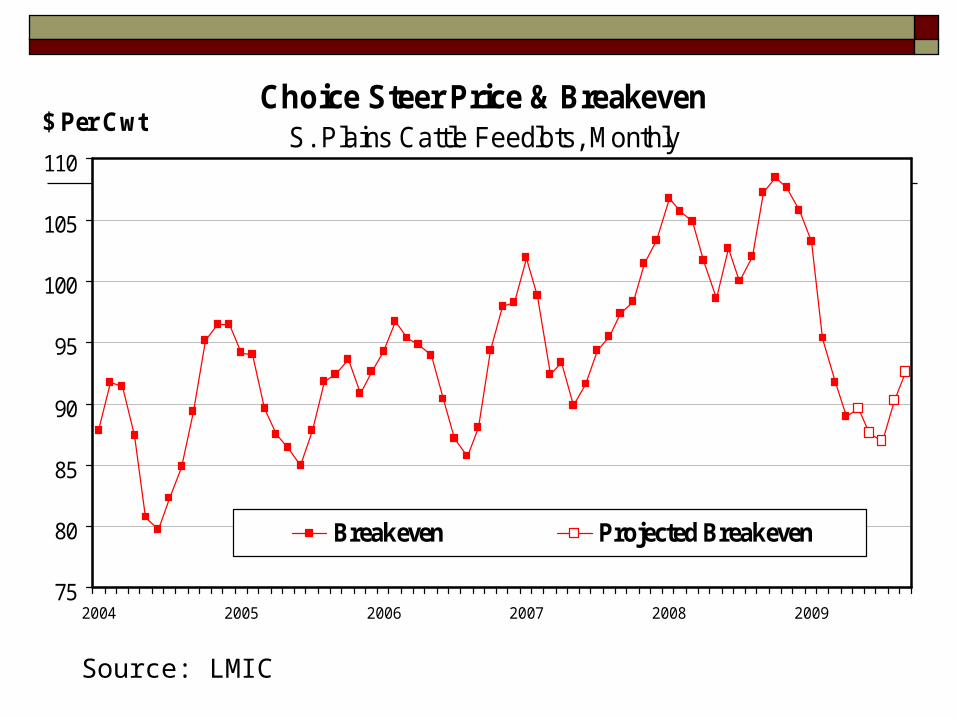
Choice Steer Price & BreakevenS. Plains Cattle Feedlots, Monthly
75
80
85
90
95
100
105
110
2004 2005 2006 2007 2008 2009
$ Per Cwt
Breakeven Projected Breakeven
Source: LMIC
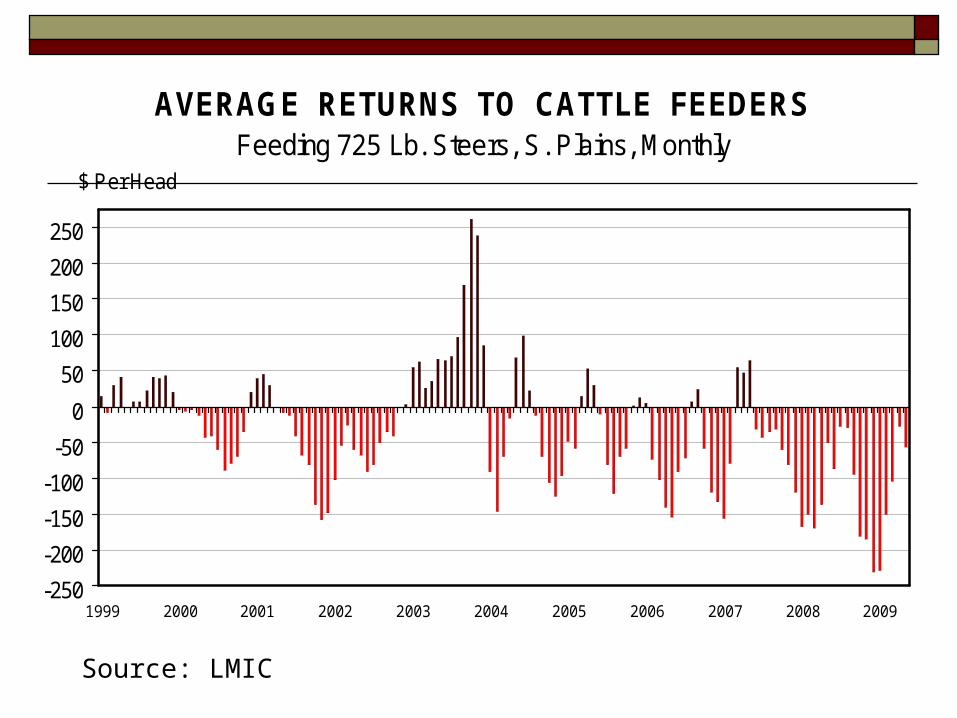
AVERAGE RETURNS TO CATTLE FEEDERSFeeding 725 Lb. Steers, S. Plains, Monthly
-250
-200
-150
-100
-50
0
50
100
150
200
250
1999 2000 2001 2002 2003 2004 2005 2006 2007 2008 2009
$ Per Head
Source: LMIC
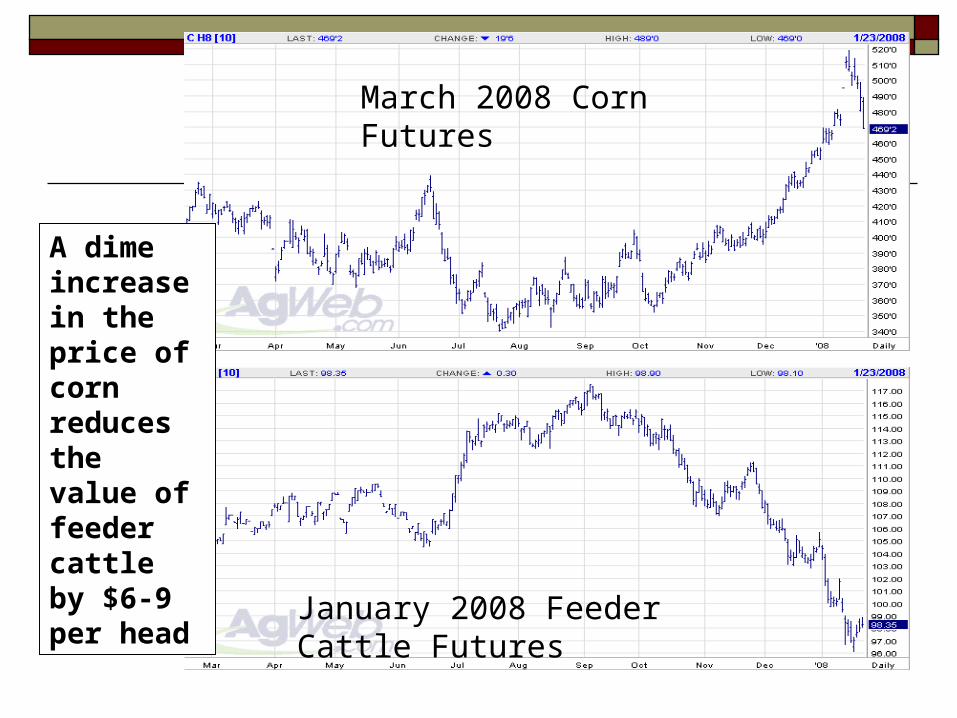
March 2008 Corn Futures
January 2008 Feeder Cattle Futures
A dime increase in the price of corn reduces the value of feeder cattle by $6-9 per head
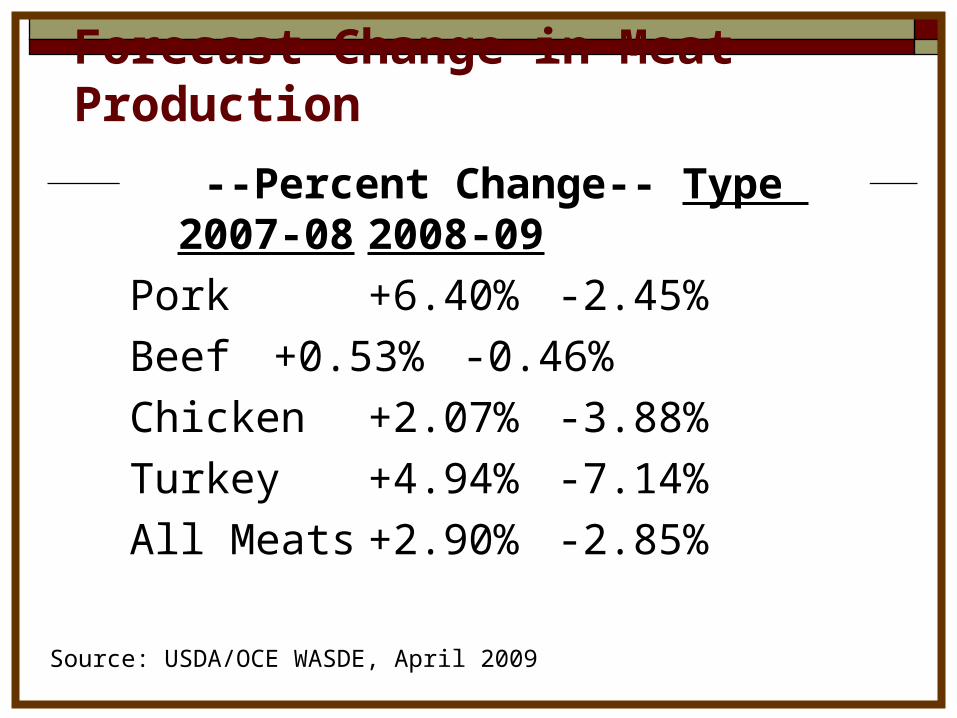
Forecast Change in Meat Production
--Percent Change-- Type 2007-08 2008-09
Pork +6.40% -2.45%
Beef +0.53% -0.46%
Chicken +2.07% -3.88%
Turkey +4.94% -7.14%
All Meats +2.90% -2.85%
Source: USDA/OCE WASDE, April 2009

Impact on Food Prices
Ethanol’s Impact on Food Prices
Less corn for livestock and more for ethanol Less food and more fuel Higher food prices and lower fuel prices
Ethanol’s Impact on Food Prices
Primary Through corn products
Secondary Through animal products
Tertiary Through competitive crops
More corn acres = fewer acres for other crops
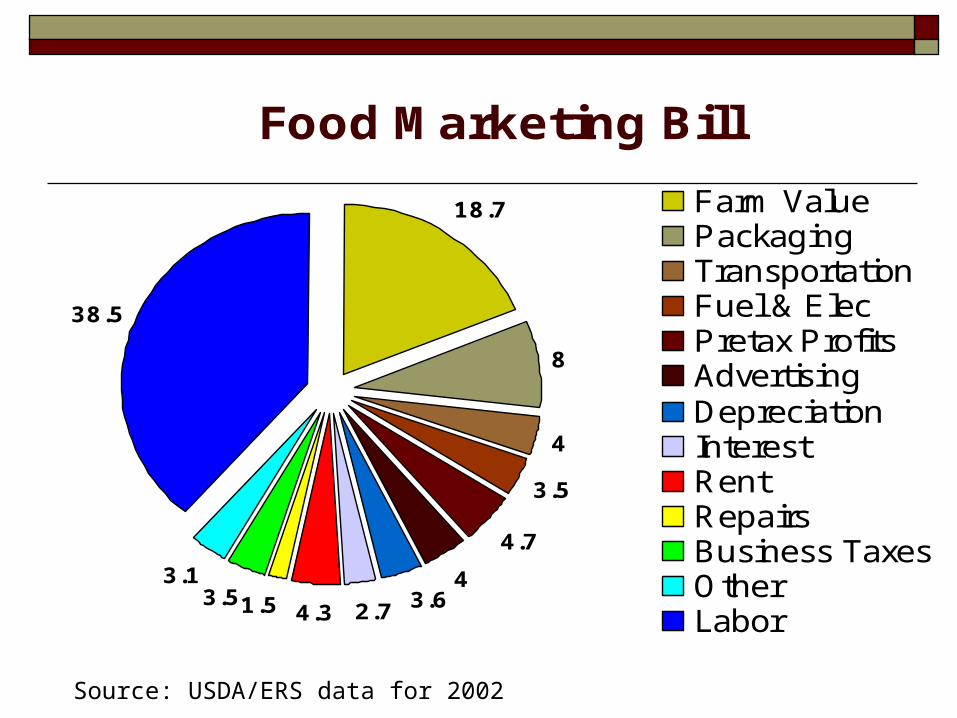
Food Marketing Bill
18.7
8
4
3.5
4.7
43.62.74.31.53.5
3.1
38.5
Farm ValuePackagingTransportationFuel & ElecPretax ProfitsAdvertisingDepreciationInterestRentRepairsBusiness TaxesOtherLabor
Source: USDA/ERS data for 2002

Impact on Food Prices
In 2002, the farm value of U.S. consumer food expenditures was 18.7%. Corn made up 11.3% of that farm value. Thus, corn, directly and mostly indirectly, accounted for 2.1% of consumer food expenditures.
Impact on Food Prices
Since corn only accounted for 2.1% of consumer food expenditures, doubling corn prices should raise the cost of food by 2.1%; tripling the price of corn should raise the cost of food by 4.2%.
Over time, the price of a commodity will equal the cost of production
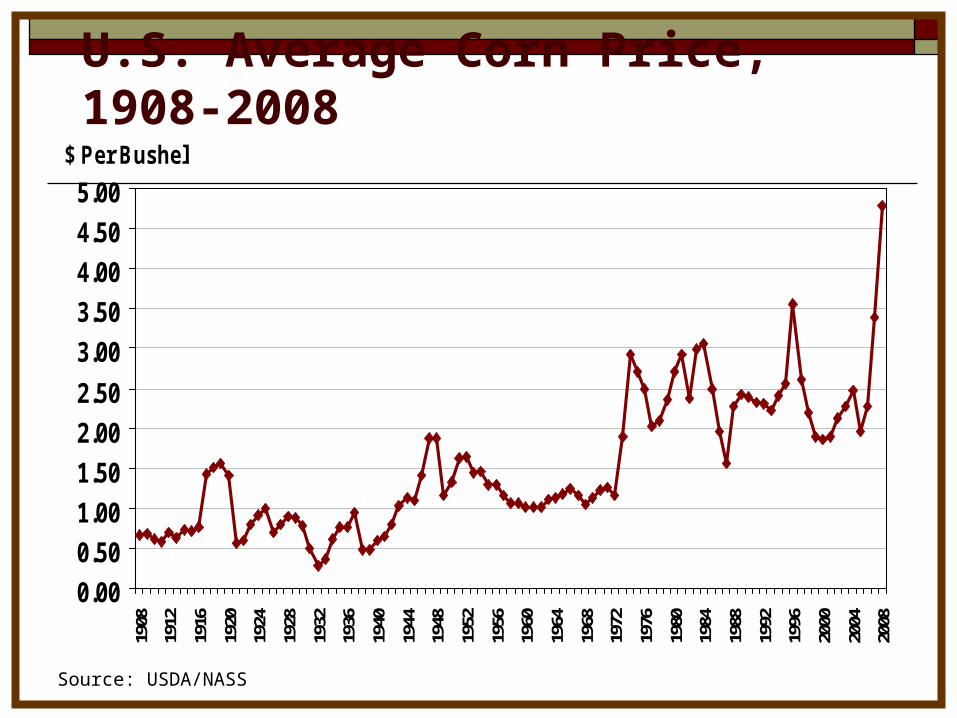
U.S. Average Corn Price, 1908-2008
0.00
0.50
1.00
1.50
2.00
2.50
3.00
3.50
4.00
4.50
5.00
1908
1912
1916
1920
1924
1928
1932
1936
1940
1944
1948
1952
1956
1960
1964
1968
1972
1976
1980
1984
1988
1992
1996
2000
2004
2008
$ Per Bushel
Source: USDA/NASS
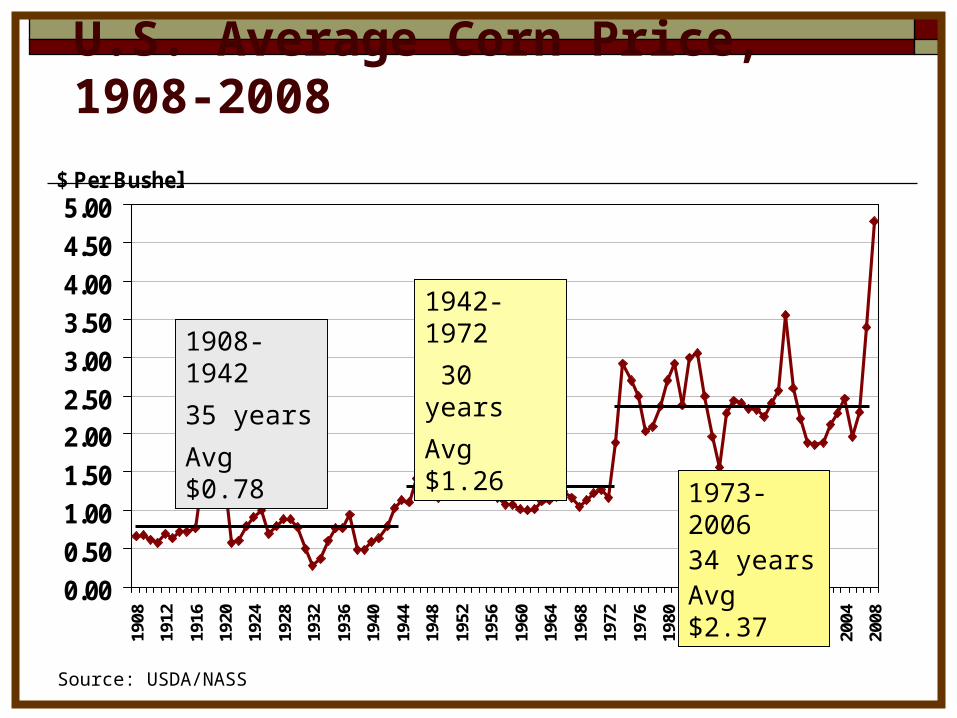
U.S. Average Corn Price, 1908-2008
0.00
0.50
1.00
1.50
2.002.50
3.00
3.50
4.00
4.50
5.00
1908
1912
1916
1920
1924
1928
1932
1936
1940
1944
1948
1952
1956
1960
1964
1968
1972
1976
1980
1984
1988
1992
1996
2000
2004
2008
$ Per Bushel
Source: USDA/NASS
1908-1942
35 years
Avg $0.78
1942-1972
30 years
Avg $1.26
1973-200634 years Avg $2.37
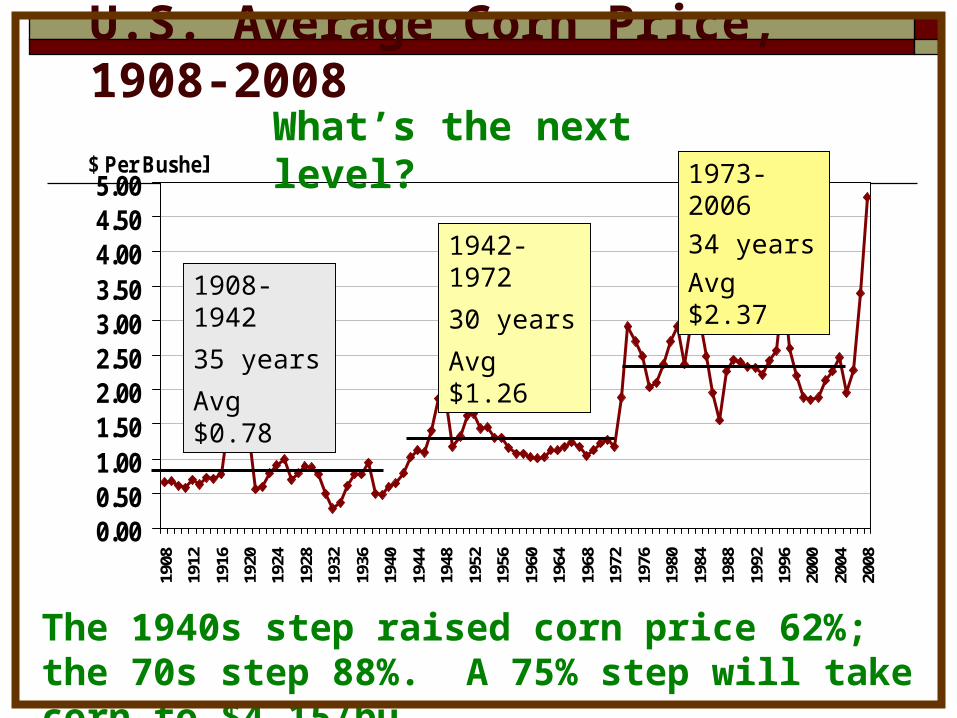
U.S. Average Corn Price, 1908-2008
0.000.501.001.502.002.503.003.504.004.505.00
1908
1912
1916
1920
1924
1928
1932
1936
1940
1944
1948
1952
1956
1960
1964
1968
1972
1976
1980
1984
1988
1992
1996
2000
2004
2008
$ Per Bushel
1908-1942
35 years
Avg $0.78
1942-1972
30 years
Avg $1.26
1973-2006
34 years
Avg $2.37
The 1940s step raised corn price 62%; the 70s step 88%. A 75% step will take corn to $4.15/bu
What’s the next level?
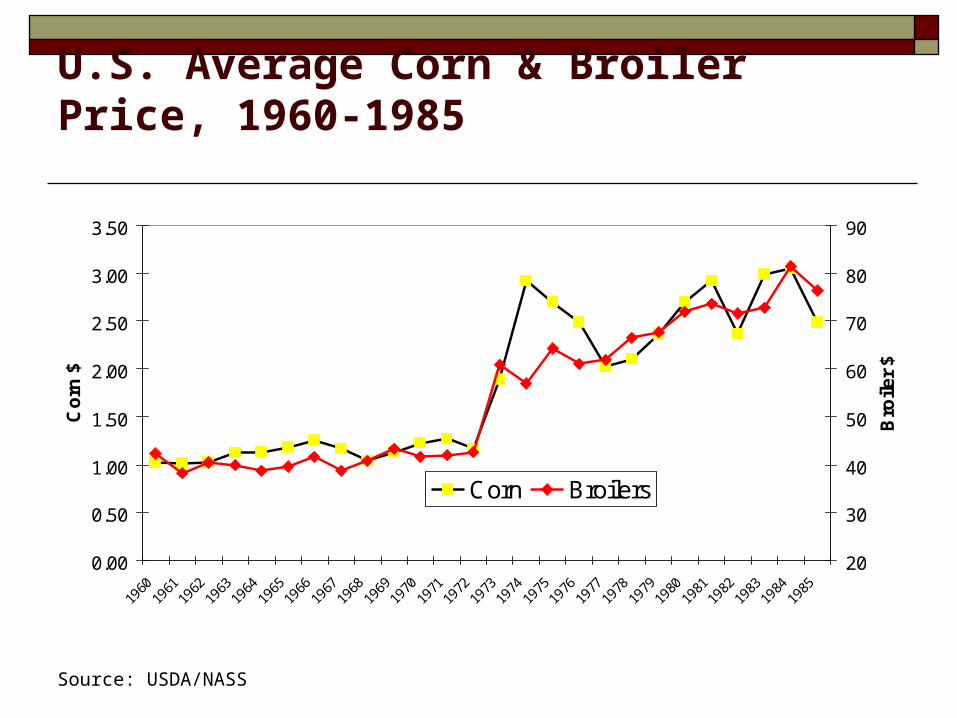
U.S. Average Corn & Broiler Price, 1960-1985
0.00
0.50
1.00
1.50
2.00
2.50
3.00
3.50
1960
1961
1962
1963
1964
1965
1966
1967
1968
1969
1970
1971
1972
1973
1974
1975
1976
1977
1978
1979
1980
1981
1982
1983
1984
1985
Co
rn $
20
30
40
50
60
70
80
90
Bro
iler
$
Corn Broilers
Source: USDA/NASS
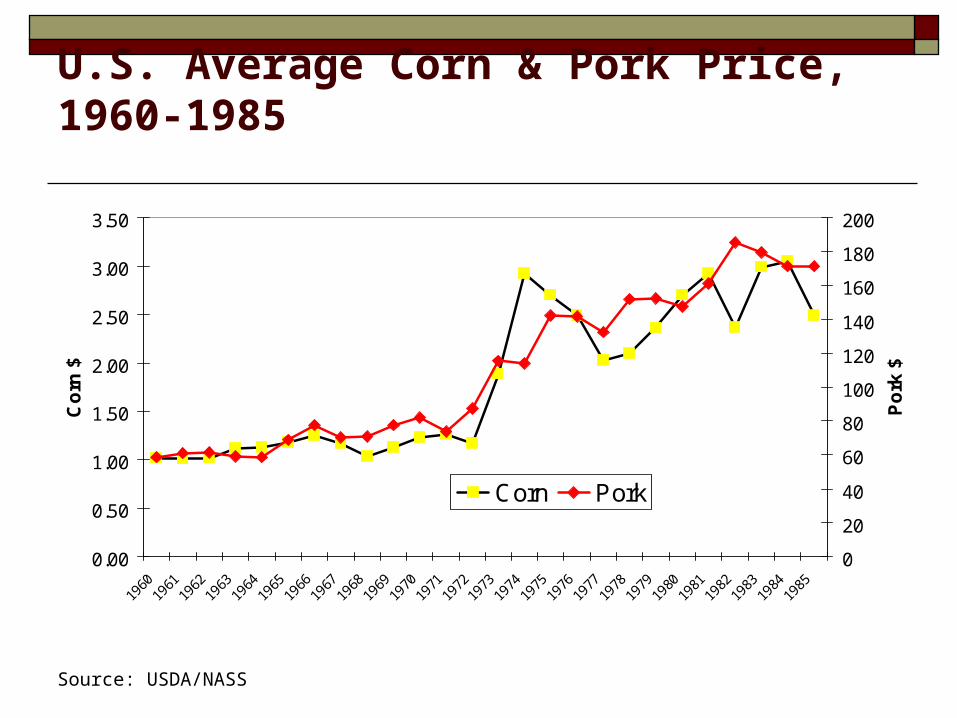
U.S. Average Corn & Pork Price, 1960-1985
0.00
0.50
1.00
1.50
2.00
2.50
3.00
3.50
1960
1961
1962
1963
1964
1965
1966
1967
1968
1969
1970
1971
1972
1973
1974
1975
1976
1977
1978
1979
1980
1981
1982
1983
1984
1985
Co
rn $
0
20
40
60
80
100
120
140
160
180
200
Po
rk $
Corn Pork
Source: USDA/NASS

U.S. Average Corn & Beef Price, 1960-1985
0.00
0.50
1.00
1.50
2.00
2.50
3.00
3.50
1960
1961
1962
1963
1964
1965
1966
1967
1968
1969
1970
1971
1972
1973
1974
1975
1976
1977
1978
1979
1980
1981
1982
1983
1984
1985
Co
rn $
0
0.5
1
1.5
2
2.5
3
Be
ef
$
Corn Beef
Source: USDA/NASS

U.S. Average Corn & Milk Price, 1960-1985
0.00
0.50
1.00
1.50
2.00
2.50
3.00
3.50
1960
1961
1962
1963
1964
1965
1966
1967
1968
1969
1970
1971
1972
1973
1974
1975
1976
1977
1978
1979
1980
1981
1982
1983
1984
1985
Co
rn $
0
2
4
6
8
10
12
14
16
Milk
$
Corn Milk
Source: USDA/NASS

Meat Consumption
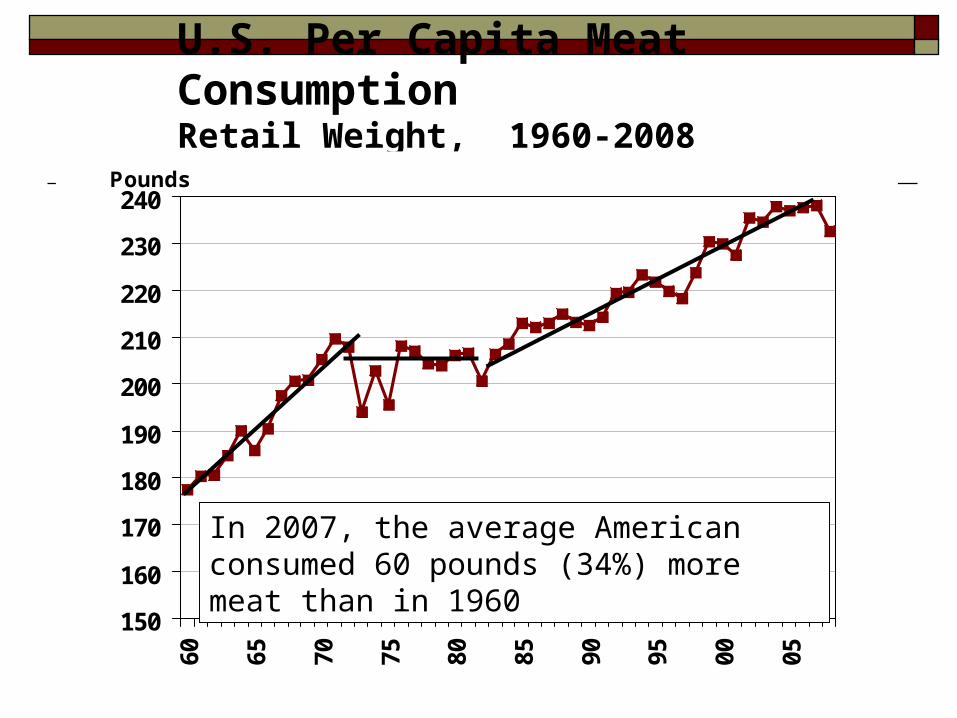
U.S. Per Capita Meat ConsumptionRetail Weight, 1960-2008
150
160
170
180
190
200
210
220
230
24060 65 70 75 80 85 90 95 00 05
Pounds
In 2007, the average American consumed 60 pounds (34%) more meat than in 1960
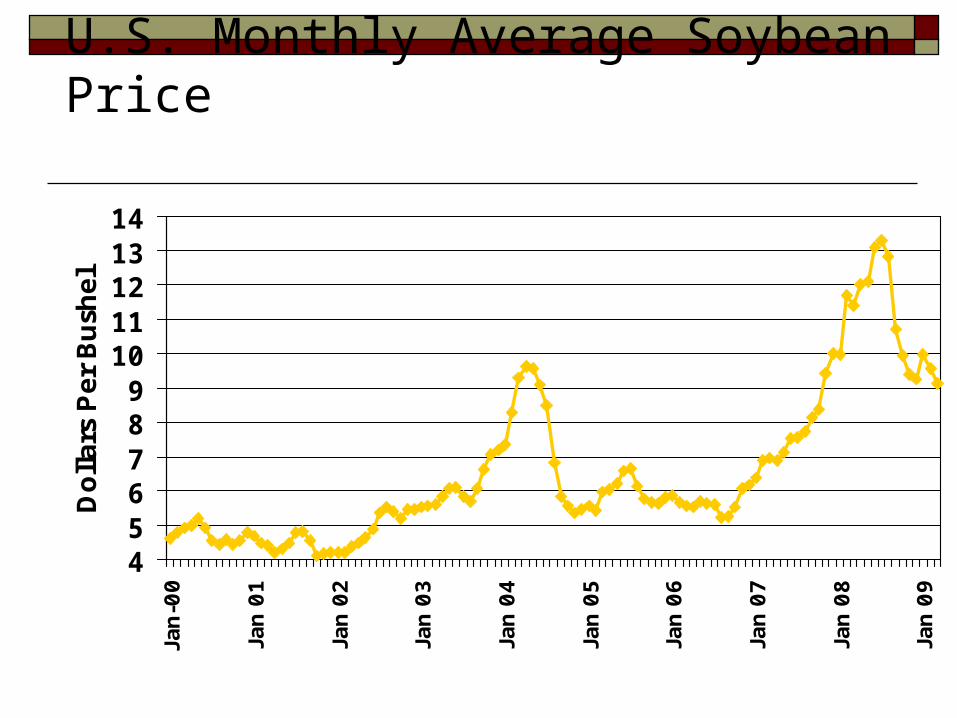
U.S. Monthly Average Soybean Price
456789
1011121314
Jan-0
0
Jan
01
Jan
02
Jan
03
Jan
04
Jan
05
Jan
06
Jan
07
Jan
08
Jan
09
Dolla
rs P
er B
ush
el
Soybean Meal PricesWeekly Average, Illinois, 2007-09
150
200
250
300
350
400
450
500
$ Per Bu.
Source: LMIC
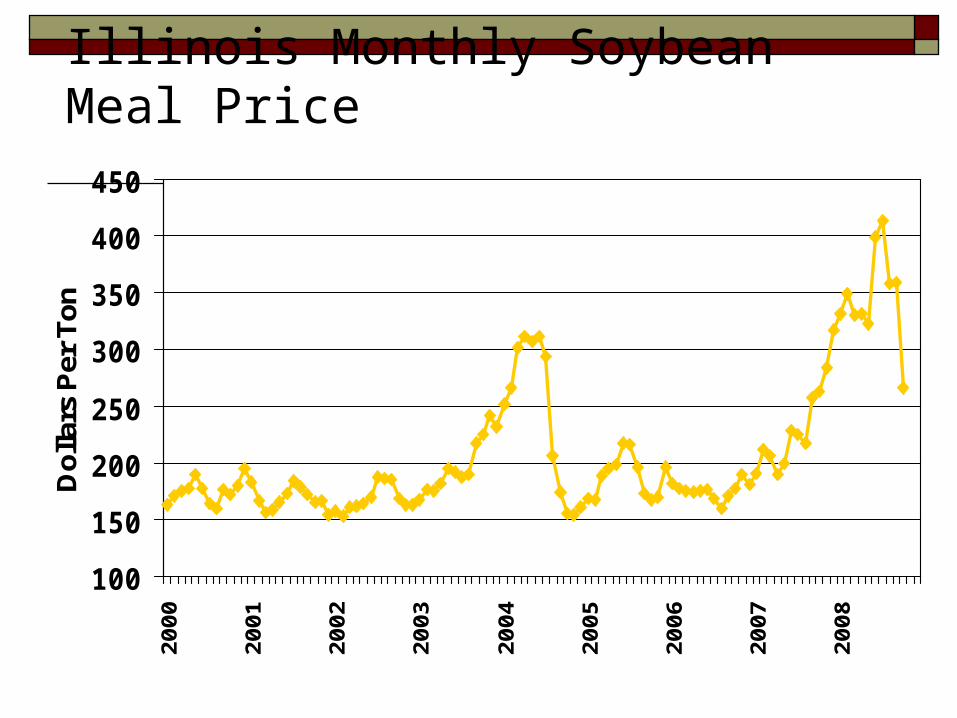
Illinois Monthly Soybean Meal Price
100
150
200
250
300
350
400
45020
00
2001
2002
2003
2004
2005
2006
2007
2008
Dol
lars
Per
Ton

Cellulosic Ethanol
Cellulosic Ethanol
Cellulosic ethanol is ethanol made from cellulose. It is the same as grain ethanol: C2H5OH. The only difference is the source material.
The interest in cellulosic ethanol comes from the huge supply of low-value source material: Wood – trees, limbs, paper, cardboard Grass - switchgrass, corn stalks, straw, fescue Distillers Grains

Cellulosic Ethanol
Producing ethanol from cellulose is something we’ve known how to do for over 100 years
Doing it in a cost-competitive manner is something we have yet to learn
However, there are many people seeking research grants who claim to be close to solving the cost problem

Cellulosic Ethanol
Challenges of cellulosic ethanol Feedstock Purity and consistency Production process By products
Feedstock for Cellulosic Ethanol
Cost competitive cellulosic ethanol plants are not likely to be small or operate part time
Other than wood, most feedstock is bulky, i.e. costly to haul and store
Harvesting is not cheap Opportunity cost, i.e. impact on soil
Nutrients Ground cover

Cellulosic Ethanol
Challenges of cellulosic ethanol Feedstock Purity and consistency Production process By products
Purity and Consistency of Feedstock
The feedstock for a cellulosic ethanol plant will not be pure cellulose collect and move a lot of non-cellulose? corn is consistently ~70% starch
Cellulosic ethanol plant not likely to work well on all potential feedstocks Is there any plentiful, uniform, year-round source
material other than wood (and distillers grain)?

Cellulosic Ethanol
Challenges of cellulosic ethanol Feedstock Purity and consistency Production process By products
Cellulosic Ethanol Production
Two production methods
Hydrolysis – breaks the cellulose chain into sugar molecules that are then fermented to produce ethanol, then distilled
Gasification – ligno-cellulose is transformed into carbon monoxide and hydrogen which are then fed to a special fermenter or a catalyst bed to produce ethanol
Cellulosic Ethanol Production
Two types hydrolysis processes Chemical Enzymatic
Cellulosic Ethanol Production
Chemical hydrolysis – Cellulose is mixed with a mild acid under a lot of
heat and pressure, or a strong acid with less heat and pressure.
Water is then added to form simple sugars. The acid is then neutralized. Sugar is separated from the residual materials. Yeast is added to ferment ethanol which is then
distilled. Acid + heat + pressure = $

Cellulosic Ethanol Production
Enzymatic hydrolysis – Following a pre-treatment process, various
enzymes are used sequentially to break cellulose into glucose molecules, a la rumen bacteria.
The sugar is separated. Yeast is added to ferment ethanol which is then
distilled. Availability and cost of the enzymes are the
primary obstacles to enzymatic hydrolysis
Cellulosic Ethanol Production
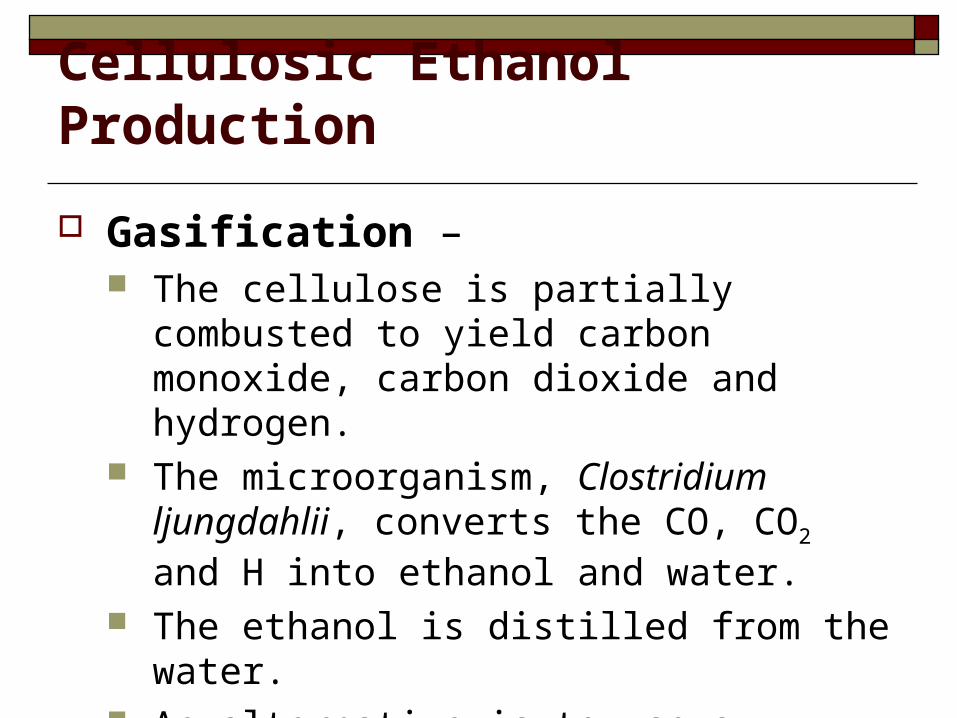
Gasification – The cellulose is partially combusted to yield
carbon monoxide, carbon dioxide and hydrogen. The microorganism, Clostridium ljungdahlii,
converts the CO, CO2 and H into ethanol and water.
The ethanol is distilled from the water. An alternative is to use a catalytic reactor to
convert the synthesis gas into alcohol.
Cellulosic Ethanol
Challenges of cellulosic ethanol Feedstock Purity and consistency Production process Byproduct

Byproduct
Corn ethanol plants produce a byproduct, DDGS, that is as valuable as the feedstock
For what price will we be able to sell the byproduct from cellulosic ethanol plants?

Biodiesel
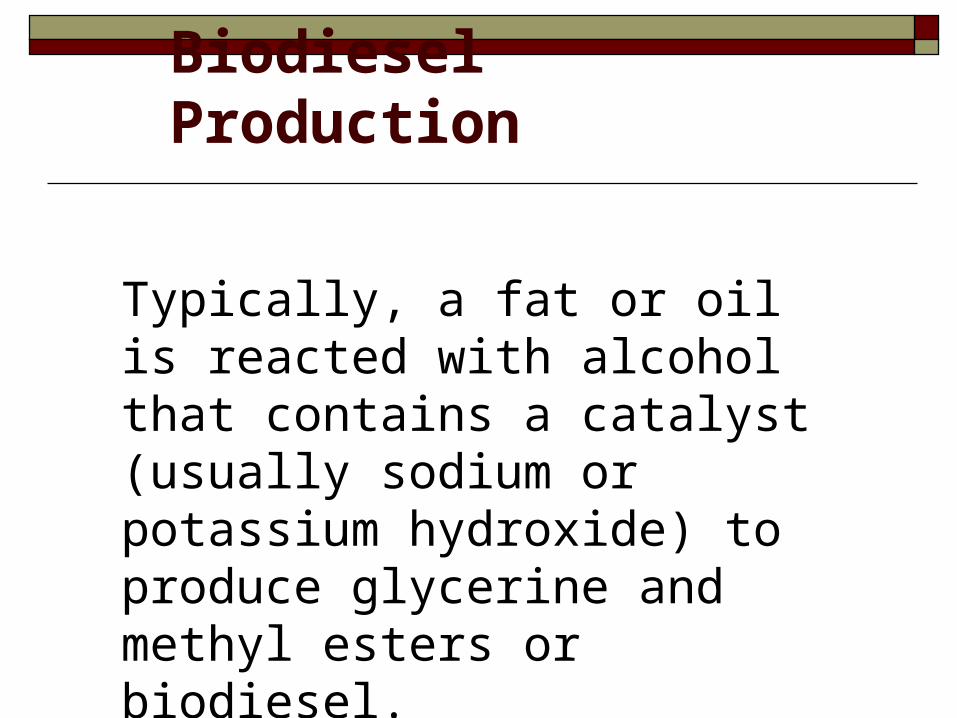
Biodiesel Production
Typically, a fat or oil is reacted with alcohol that contains a catalyst (usually sodium or potassium hydroxide) to produce glycerine and methyl esters or biodiesel.
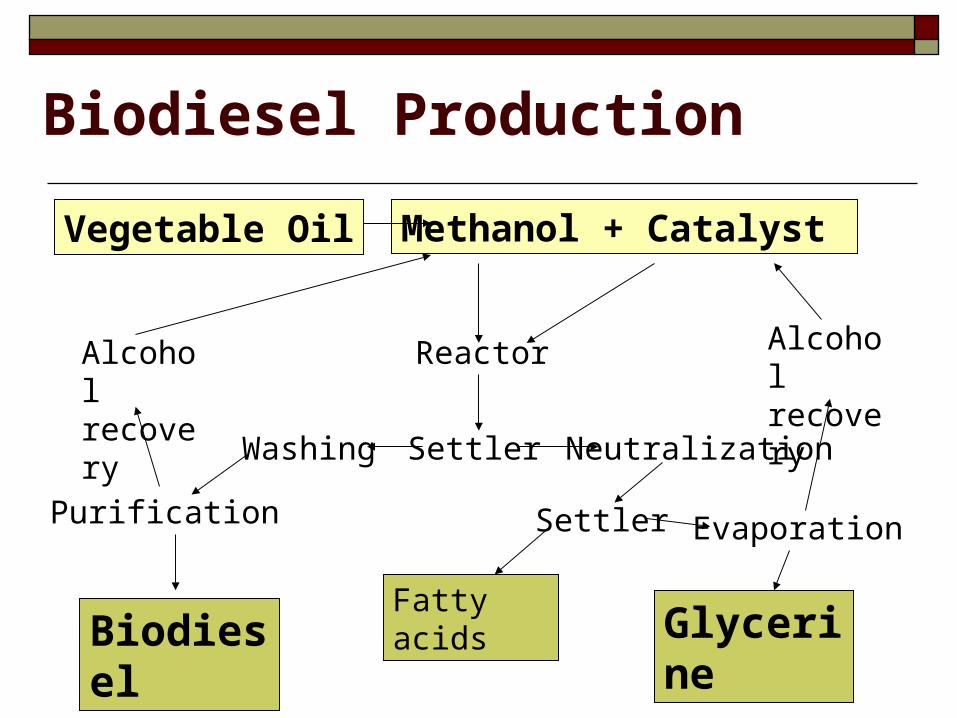
Biodiesel Production
Methanol + Catalyst
Biodiesel
Reactor
Glycerine
Vegetable Oil
SettlerWashing Neutralization
Purification
Alcohol recovery
Alcohol recovery
Settler Evaporation
Fatty acids
Soydiesel
Although soybean oil is a liquid, you should not blend it with diesel fuel.
The glycerine in soy oil will ruin a diesel engine.
Soy oil must be transesterified before blending with diesel fuel.
Economics of Soydiesel
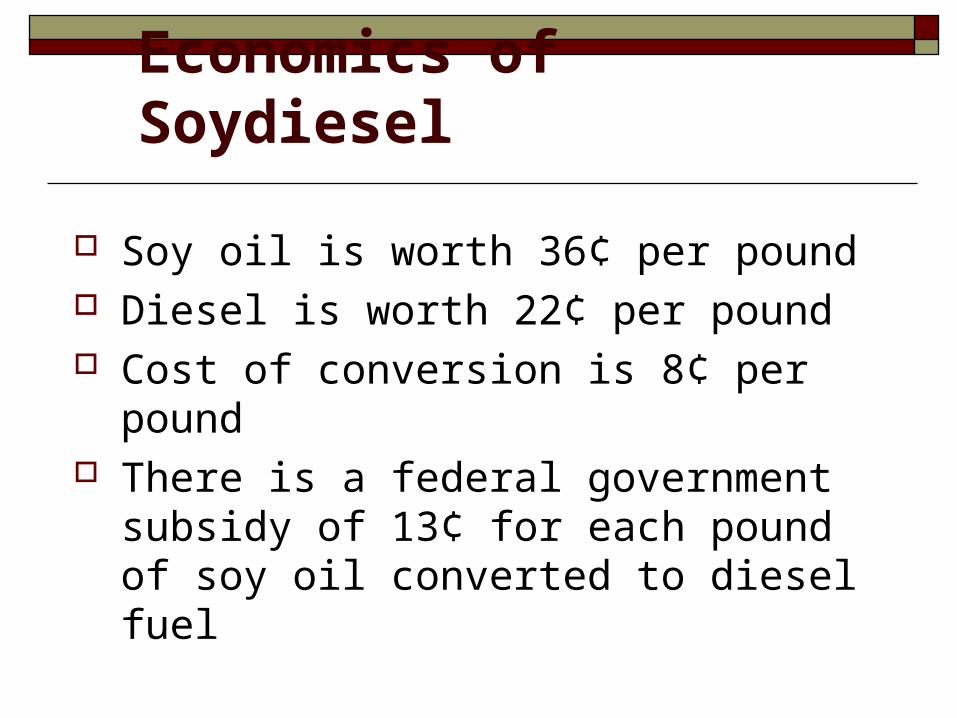
Soy oil is worth 36¢ per pound Diesel is worth 22¢ per pound Cost of conversion is 8¢ per pound There is a federal government subsidy of
13¢ for each pound of soy oil converted to diesel fuel

Soybean Oil Futures
Biodiesel
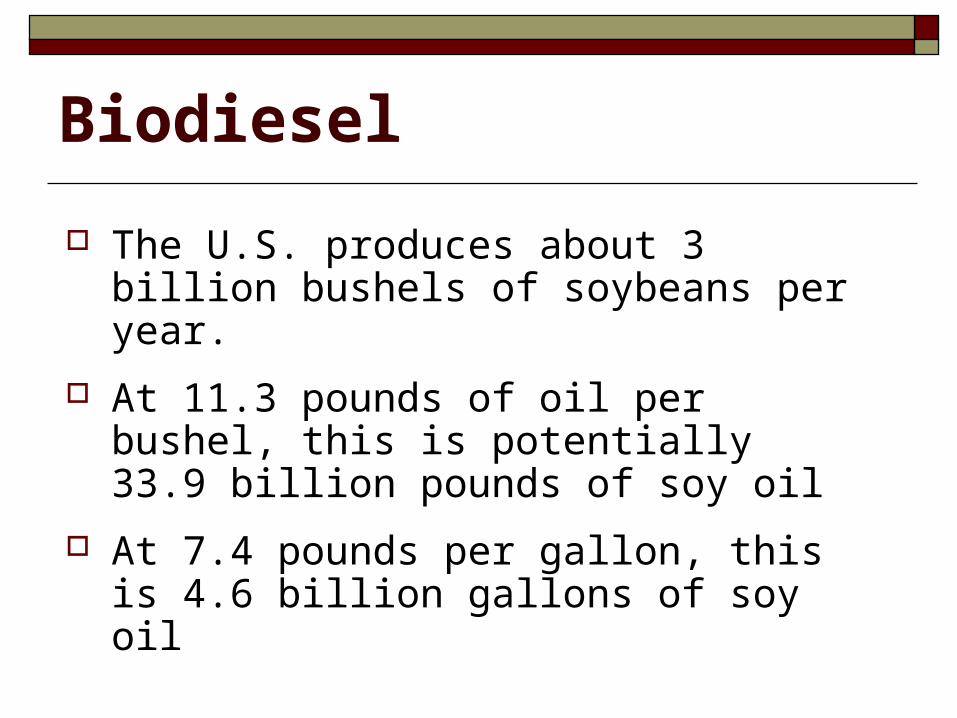
The U.S. produces about 3 billion bushels of soybeans per year.
At 11.3 pounds of oil per bushel, this is potentially 33.9 billion pounds of soy oil
At 7.4 pounds per gallon, this is 4.6 billion gallons of soy oil
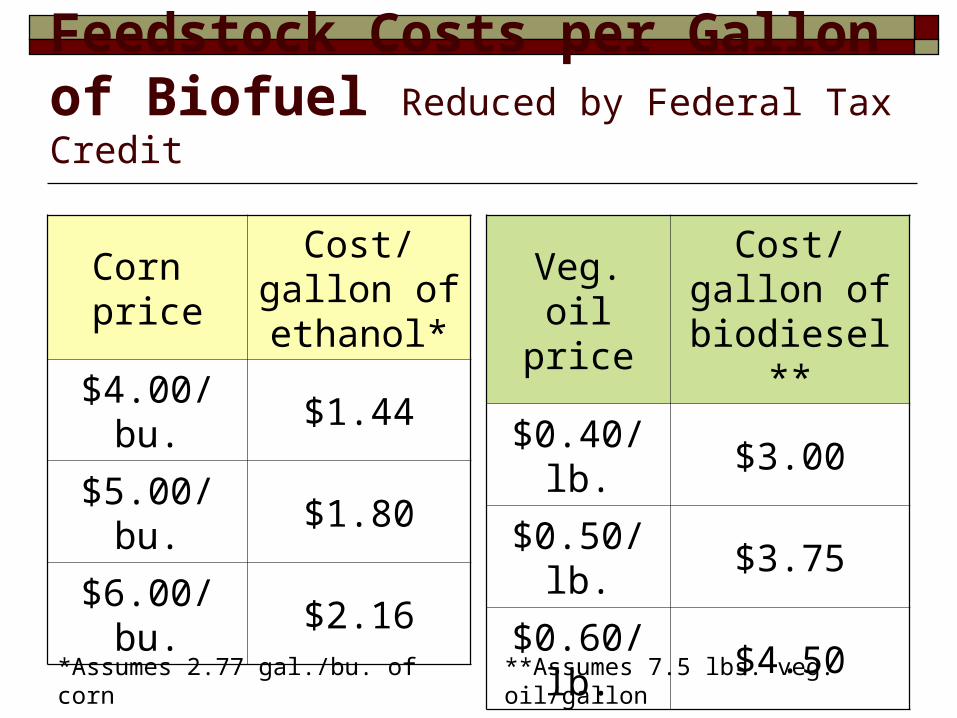
Feedstock Costs per Gallon of Biofuel Reduced by Federal Tax Credit
Corn priceCost/gallon of ethanol*
$4.00/bu. $1.44
$5.00/bu. $1.80
$6.00/bu. $2.16
Veg. oil price
Cost/gallon of biodiesel**
$0.40/lb. $3.00
$0.50/lb. $3.75
$0.60/lb. $4.50
*Assumes 2.77 gal./bu. of corn **Assumes 7.5 lbs. veg. oil/gallon
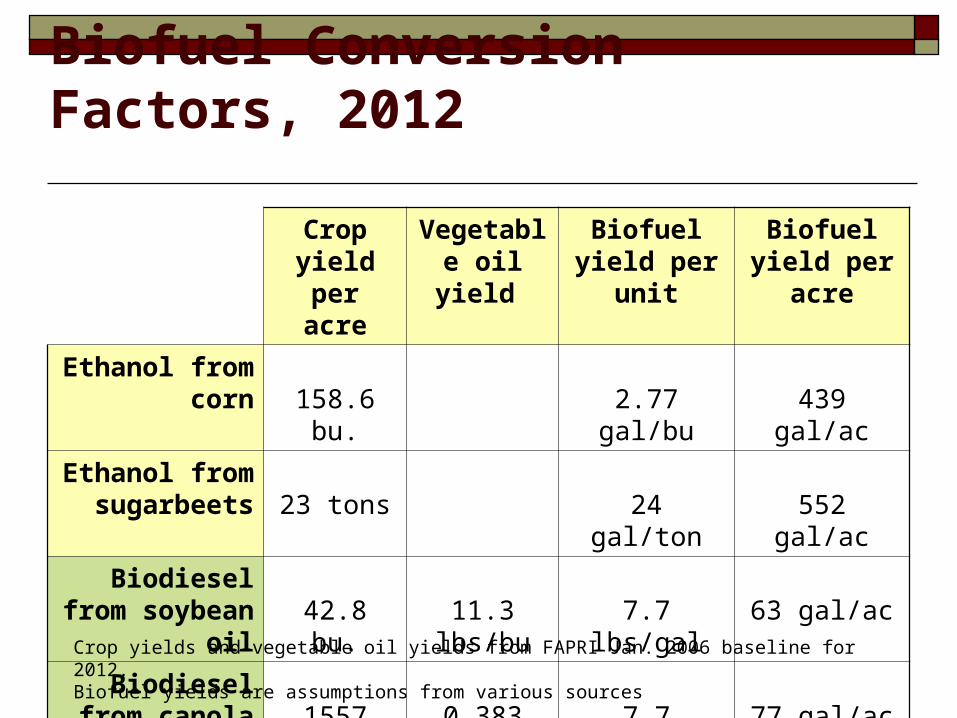
Biofuel Conversion Factors, 2012
Crop yield per acre
Vegetable oil yield
Biofuel yield per unit
Biofuel yield per acre
Ethanol from corn 158.6 bu. 2.77 gal/bu 439 gal/ac
Ethanol from sugarbeets 23 tons 24 gal/ton 552 gal/ac
Biodiesel from soybean oil 42.8 bu. 11.3 lbs/bu 7.7 lbs/gal 63 gal/ac
Biodiesel from canola oil 1557 lbs. 0.383 lbs/lb 7.7 lb/gal 77 gal/ac
Crop yields and vegetable oil yields from FAPRI Jan. 2006 baseline for 2012. Biofuel yields are assumptions from various sources
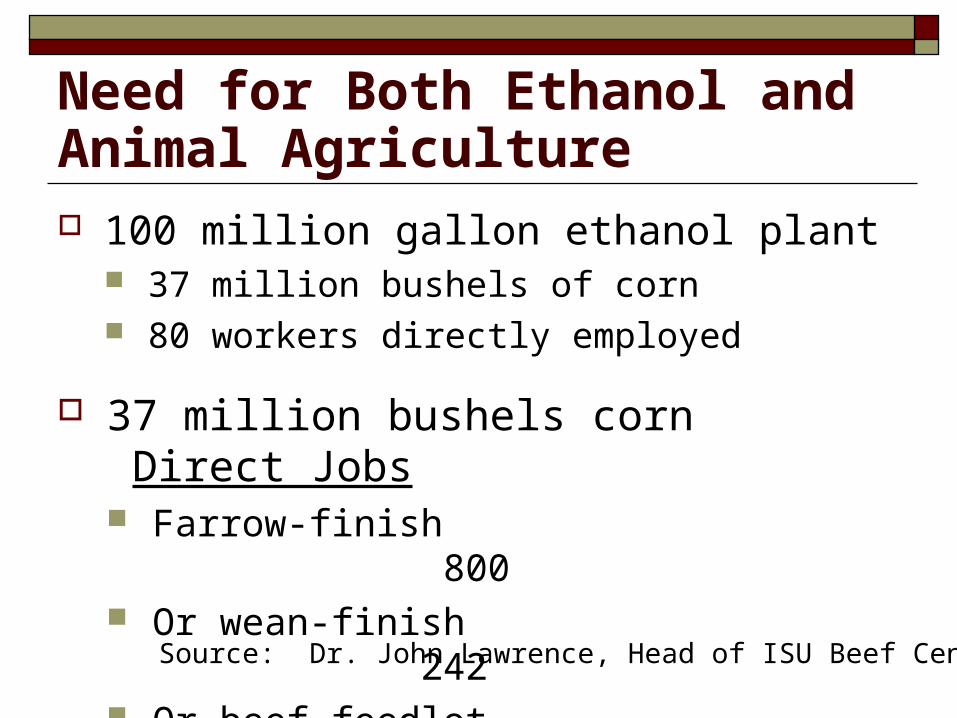
Need for Both Ethanol and Animal Agriculture 100 million gallon ethanol plant
37 million bushels of corn 80 workers directly employed
37 million bushels corn Direct Jobs Farrow-finish 800 Or wean-finish 242 Or beef feedlot 278
Source: Dr. John Lawrence, Head of ISU Beef Center

Impact of Ethanol Building lots of ethanol plants Driving up corn prices
More corn acres Fewer acres of other crops
Higher prices for other crops Record net farm income
Driving up cash rents and land prices Driving up livestock production costs
Less meat, milk and eggs being produced Lots of DDGS will benefit cattle New grain storage/shipping patterns

The New Ag Market?
Crude oil drives ethanol prices Ethanol drives corn prices Corn drives livestock production Livestock production drives meat
prices

Impact on Rural Communities

What Ethanol Plants Need
Corn Water - roughly 4 gallons of water per gallon
of ethanol Heat – usually natural gas Roads & Rails Some space
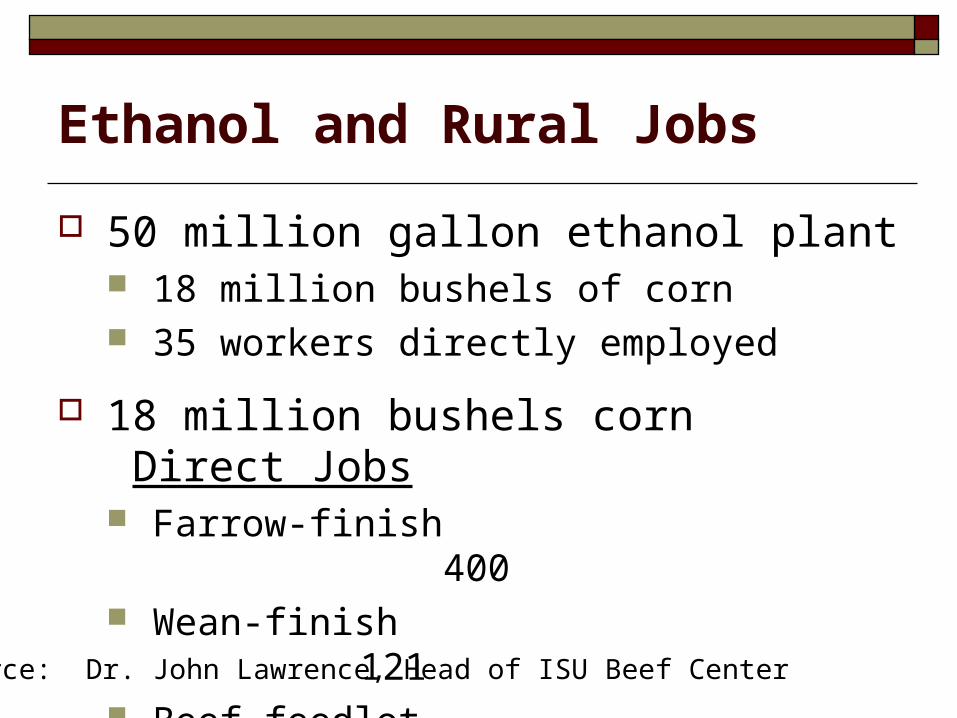
Ethanol and Rural Jobs
50 million gallon ethanol plant 18 million bushels of corn 35 workers directly employed
18 million bushels corn Direct Jobs Farrow-finish 400 Wean-finish 121 Beef feedlot 139
Source: Dr. John Lawrence, Head of ISU Beef Center

U.S. Net Farm Income 1986-2007
0102030405060708090
1001986
1988
1990
1992
1994
1996
1998
2000
2002
2004
2006
Billion $
Source: USDA/ERS
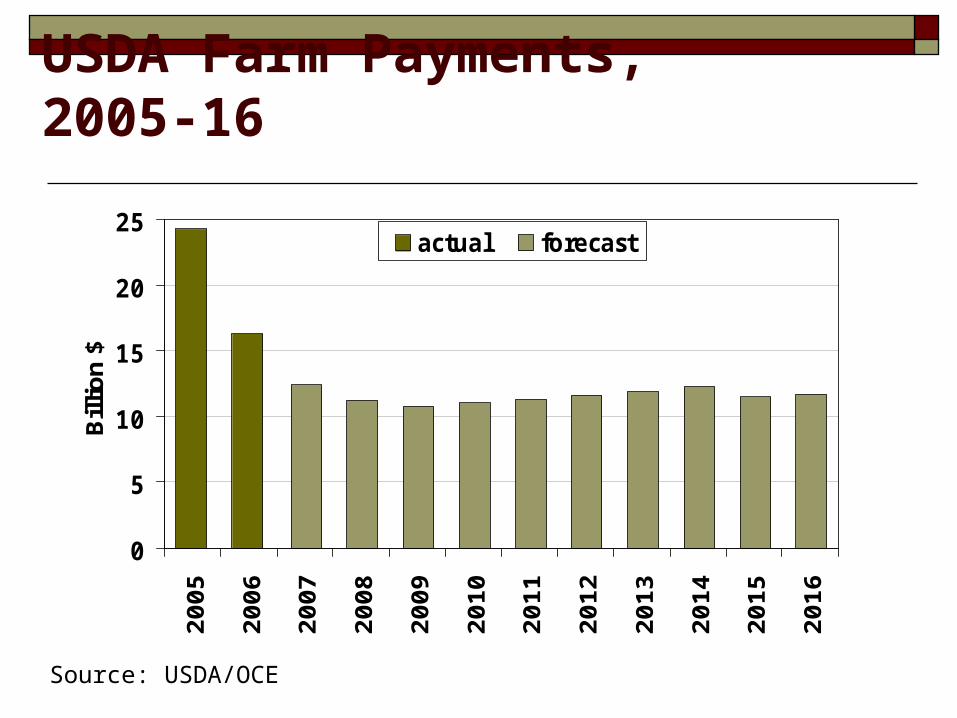
USDA Farm Payments, 2005-16
0
5
10
15
20
2520
05
2006
2007
2008
2009
2010
2011
2012
2013
2014
2015
2016
Bill
ion
$
actual forecast
Source: USDA/OCE
Impact on Environment
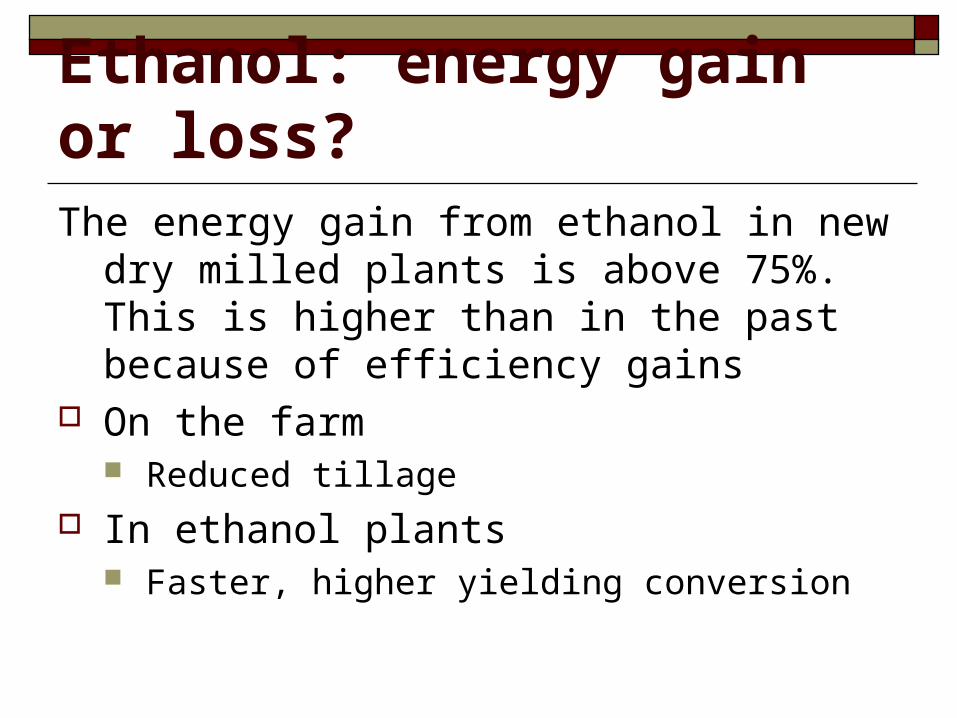
Ethanol: energy gain or loss?The energy gain from ethanol in new dry milled
plants is above 75%. This is higher than in the past because of efficiency gains
On the farm Reduced tillage
In ethanol plants Faster, higher yielding conversion
Greenhouse Gas Emissions
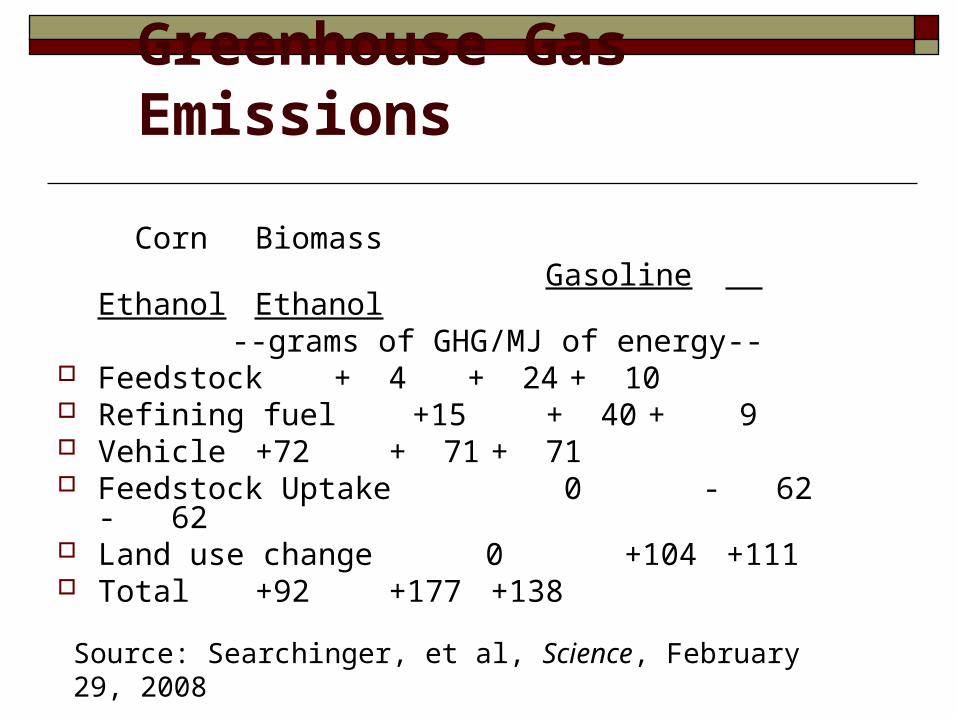
Corn Biomass Gasoline Ethanol Ethanol --grams of GHG/MJ of energy-- Feedstock + 4 + 24 + 10 Refining fuel +15 + 40 + 9 Vehicle +72 + 71 + 71 Feedstock Uptake 0 - 62 - 62 Land use change 0 +104 +111 Total +92 +177 +138
Source: Searchinger, et al, Science, February 29, 2008
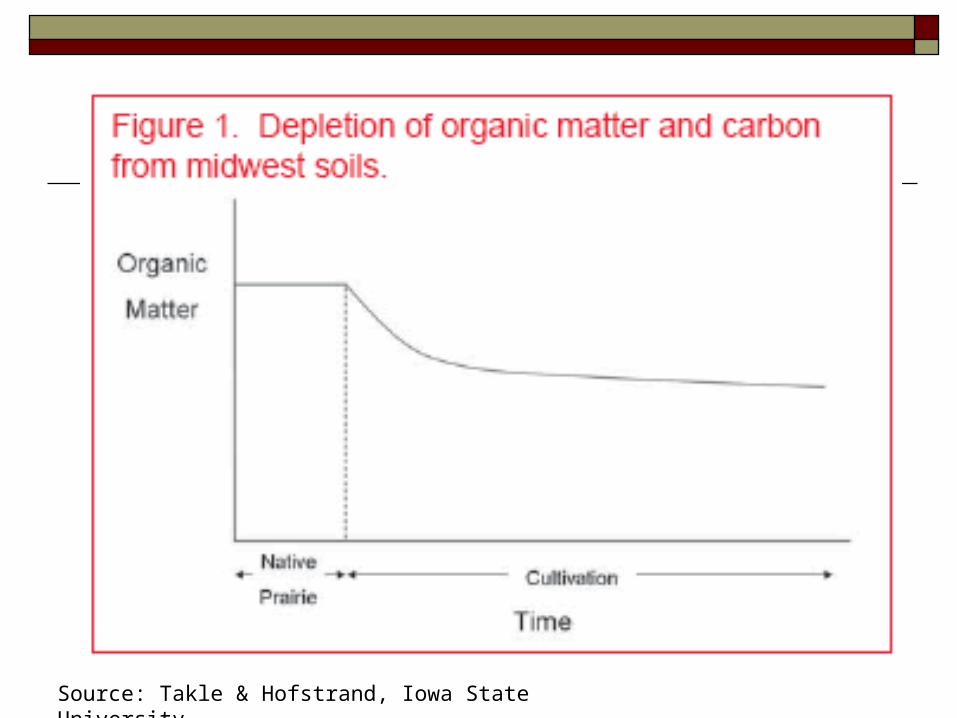
Source: Takle & Hofstrand, Iowa State University
Recent EPA Decisions
U.S. corn ethanol has a worse impact on the environment than gasoline due to land use impact, i.e. more acres being cropped
Brazilian sugarcane ethanol reduces GHG emissions by 64% compared to gasoline
Impact on Gas Prices

U.S. Gasoline Usage, 1986-07
0
20
40
60
80
100
120
140
1601986
1988
1990
1992
1994
1996
1998
2000
2002
2004
2006
Billion G
allons
Source: U.S. Energy Information Administration
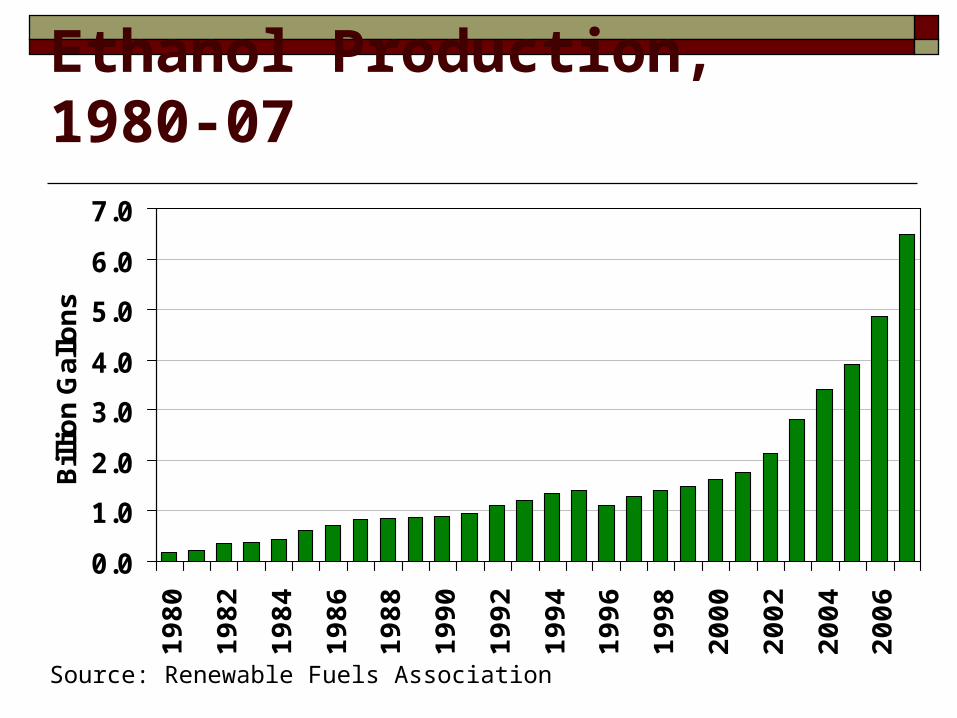
Ethanol Production, 1980-07
0.0
1.0
2.0
3.0
4.0
5.0
6.0
7.01980
1982
1984
1986
1988
1990
1992
1994
1996
1998
2000
2002
2004
2006
Bill
ion G
allo
ns
Source: Renewable Fuels Association
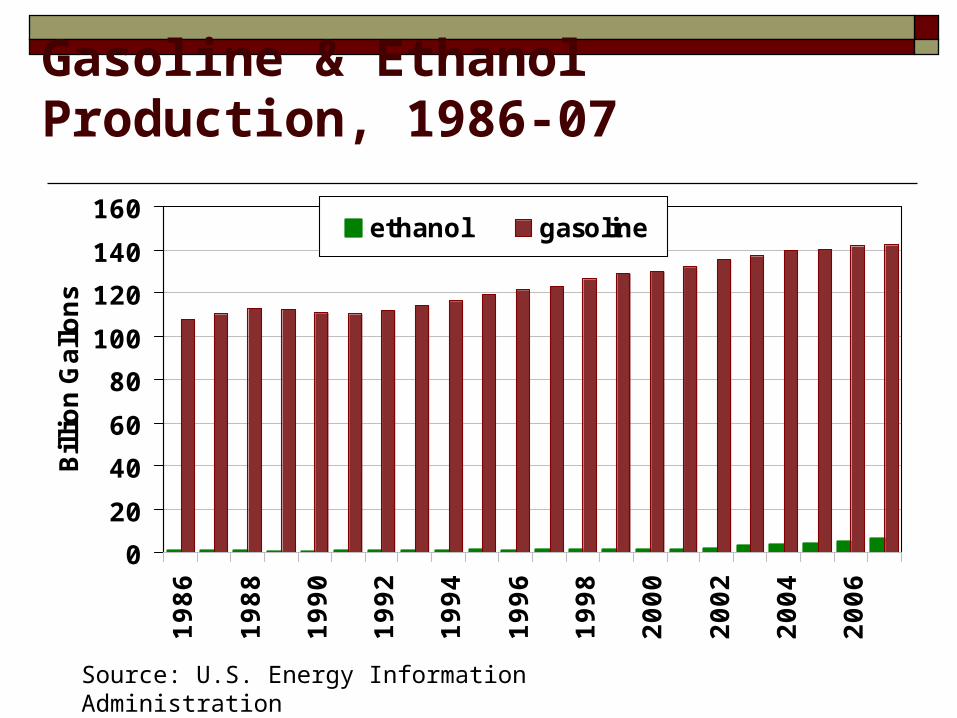
Gasoline & Ethanol Production, 1986-07
0
20
40
60
80
100
120
140
1601986
1988
1990
1992
1994
1996
1998
2000
2002
2004
2006
Billion G
allons
ethanol gasoline
Source: U.S. Energy Information Administration

U.S. Gasoline Usage
142 billion gallons gasoline used per year Mandating 10% ethanol in all gasoline would
require that nearly half of the U.S. corn crop be processed into ethanol
If all U.S. corn were made into ethanol, it would produce 33 billion gallons per year
To replace all U.S. gasoline would require 78 billion bushels of corn annually
78 Billion Bushels of Corn
Record U.S. corn yield is 160 bu/acre 78 billion bushels at 160 bu/acre would
require 488 million harvested acres of corn Equals 164% of 2007 U.S. harvested acreage
of corn, soybeans, wheat, sorghum, cotton, rice, sunflowers, barley, oats, rye, peanuts, tobacco, canola, sugar beets, sugarcane, potatoes, dry edible beans, proso millet and hay combined.

Questions?
Related Documents