Is Relationship Lending Special? Evidence from Credit-File Data in Germany * Ralf Elsas and Jan Pieter Krahnen** This draft: February 24, 1998 Abstract The German financial market is often characterized as a bank-based system with strong bank-customer relationships. The corresponding notion of a housebank is closely related to the theoretical idea of relation- ship lending. It is the objective of this paper to provide a direct comparison between housebanks and „normal“ banks as to their credit policy. Therefore, we analyze a new data set, representing a random sam- ple of borrowers drawn from the credit portfolios of five leading German banks over a period of five years. We use credit-file data rather than industry survey data and, thus, focus the analysis on information that is directly related to actual credit decisions. In particular, we use bank-internal borrower rating data to evalu- ate borrower quality, and the bank’s own assessment of its housebank status to control for information- intensive relationships. The major results of our study support the view that housebanks are able to establish a distinct behavioral pattern consistent with the idea of long-term commitment. We find that housebanks do provide liquidity insurance in situations of unexpected deterioration of borrower ratings. With respect to loan pricing, we find no evidence for intra- or intertemporal price differentiation related to housebanking. JEL Classification: G21, C31, C33 Keywords: relationship lending, housebanks, loan price determination, credit volume ** Institut für Kapitalmarktforschung - Center For Financial Studies, Johann Wolfgang Goethe- University, Taunusanlage 6, 60329 Frankfurt (Main), Germany. Tel.: +49 - 69 242941 12, Fax +49 - 69 242941 77, email: [email protected], [email protected] * This research was part of the University of Frankfurt’s Center for Financial Studies project on Credit Management in Germany. We bene- fited a lot from comments of participants of the Conference on Credit Risk Management and Relationship Banking held in Frankfurt, Ger- many, especially by Mitchell Berlin, Luigi Guiso, Colin Mayer, Gregory Udell and Luigi Zingales. We thank all participating banks and their representatives, in particular Otto Steinmetz (Deutsche Bank), Bernd Zugenbühler (Dresdner Bank), Dr. Guido Schacht and Helmut Hampl (Bayerische Vereinsbank), Reinhard Kutscher (DG Bank) and Martin Hellendahl (West LB) for their intensive cooperation on this project. We further want to thank Ralf Ewert, Karl-Hermann Fischer, Joachim Grammig, Sabine Henke, Achim Machauer, Ulrich Rendtel, Bernd Rudolph, Gerald Schenk and Martin Weber for comments on earlier drafts of this paper. Additional research assistance was provided by Roland Rott. Of course, we are responsible for all remaining errors.

Welcome message from author
This document is posted to help you gain knowledge. Please leave a comment to let me know what you think about it! Share it to your friends and learn new things together.
Transcript

Is Relationship Lending Special?
Evidence from Credit-File Data in Germany*
Ralf Elsas and Jan Pieter Krahnen**
This draft: February 24, 1998
Abstract
The German financial market is often characterized as a bank-based system with strong bank-customerrelationships. The corresponding notion of a housebank is closely related to the theoretical idea of relation-ship lending. It is the objective of this paper to provide a direct comparison between housebanks and„normal“ banks as to their credit policy. Therefore, we analyze a new data set, representing a random sam-ple of borrowers drawn from the credit portfolios of five leading German banks over a period of five years.We use credit-file data rather than industry survey data and, thus, focus the analysis on information that isdirectly related to actual credit decisions. In particular, we use bank-internal borrower rating data to evalu-ate borrower quality, and the bank’s own assessment of its housebank status to control for information-intensive relationships.
The major results of our study support the view that housebanks are able to establish a distinct behavioralpattern consistent with the idea of long-term commitment. We find that housebanks do provide liquidityinsurance in situations of unexpected deterioration of borrower ratings. With respect to loan pricing, we findno evidence for intra- or intertemporal price differentiation related to housebanking.
JEL Classification: G21, C31, C33
Keywords: relationship lending, housebanks, loan price determination, credit volume
** Institut für Kapitalmarktforschung - Center For Financial Studies, Johann Wolfgang Goethe-University, Taunusanlage 6, 60329 Frankfurt (Main), Germany. Tel.: +49 - 69 242941 12, Fax+49 - 69 242941 77, email: [email protected], [email protected]
* This research was part of the University of Frankfurt’s Center for Financial Studies project on Credit Management in Germany. We bene-fited a lot from comments of participants of the Conference on Credit Risk Management and Relationship Banking held in Frankfurt, Ger-many, especially by Mitchell Berlin, Luigi Guiso, Colin Mayer, Gregory Udell and Luigi Zingales. We thank all participating banks andtheir representatives, in particular Otto Steinmetz (Deutsche Bank), Bernd Zugenbühler (Dresdner Bank), Dr. Guido Schacht and HelmutHampl (Bayerische Vereinsbank), Reinhard Kutscher (DG Bank) and Martin Hellendahl (West LB) for their intensive cooperation on thisproject. We further want to thank Ralf Ewert, Karl-Hermann Fischer, Joachim Grammig, Sabine Henke, Achim Machauer, Ulrich Rendtel,Bernd Rudolph, Gerald Schenk and Martin Weber for comments on earlier drafts of this paper. Additional research assistance was providedby Roland Rott. Of course, we are responsible for all remaining errors.

2
1. Introduction
A growing body of literature, both theoretical and empirical, has focused on the role of re-
lationship lending as a determinant of corporate performance. In an early contribution, Ca-
ble (1985) relates the rapid path of industrialization and economic growth in nineteenth
century Germany to the active role of its banking system. In particular, close connections
between industry and their major banks, or housebanks, is credited with some of industriali-
zation success in the late 19th century. Tilly (1989) reports results on the contribution of
German universal banks to industrial investment in large corporations. His findings support
the view that housebanks play an important, and largely positive, role in the process of cor-
porate control, and of industry-wide merger activities.
In this literature, a housebank is regarded as the premier lender of a firm, being equipped
with more relevant, and more timely information than any „normal“, nonhousebank institu-
tion. Furthermore, a housebank is more committed to its client, enlarging their role as finan-
cier if the firm faces sudden and temporary difficulties. The importance of long-term com-
mitment in the bank-customer relationship is stressed by Mayer (1988), Hellwig (1989) and
Boot/Thakor (1994), just to name a selection of the extant relationship lending literature.
This literature usually makes no distinction between housebank relations and „normal“ bank
relations. In this sense, modern banking theory has largely focused on homogeneous bank-
ing relations. Firms have an exclusive outside financier, their housebank, and all corporate
customers of commercial banks are presumably housebank-clients. However, theoretical as
well as empirical arguments suggest that firms rather have a multitude of banks supplying
credit [von Thadden (1992)]. Thus, the case of „relationship lending“ or „housebank fi-
nancing“ is a specific implicit contractual arrangement among a broader range of financial
relations.
The objective of this paper is to provide a direct comparison between housebanks and
„normal“ banks as to their credit policy. Therefore, we analyze a new data set, representing
a random sample of borrowers drawn from the credit portfolios of five leading German
banks. The data set gives a detailed account of five years of credit history for 200 medium-
sized German firms (75 in potential distress). Additional information from a questionnaire
3
study provides an external criterion for differentiating between housebank and „normal“
credit relations.
Our data potentially offer a number of new insights into the economic analysis of relation-
ship lending. First, a data base drawn from the credit portfolios of banks in Germany is a
prime candidate for a study of housebanking, as the German financial system is typically
characterized as bank-based with strong bank-customer relationships [Allen/Gale 1995].
Second, using credit file data rather than industry survey studies focuses the analysis on
information that is directly related to actual credit decisions. In particular, we use bank-
internal borrower rating data to evaluate borrower quality. In contrast, previous studies rely
on external risk proxies, such as leverage, the monitoring frequency or the type of loan1.
Third, our data consist of a cross section of borrowers over a 5-years time horizon. This
enables us to adjust for dynamic effects of the bank-customer relationship, an aspect of spe-
cial importance in relationship lending. Fourth, and arguably most importantly, we use the
bank’s own assessment of its status, in any specific relationship, as housebank or normal
bank. The resulting attribution is expected to be more reliable than grouping methods used
previously in the literature.
The major results of our study support the view that, despite competition from „normal“
bank relationships, housebanks are able to establish a distinct behavioral pattern consistent
with the idea of long-term commitment. In particular, we find that housebanks do provide a
kind of liquidity insurance in situations of unexpected deterioration of borrower ratings. It
can be shown that liquidity insurance by housebanks is only available for small shocks to
borrower ratings. Large quality deterioration (two rating classes, or more), however, do not
trigger liquidity insurance. With respect to loan pricing, we find no evidence for intra- or
intertemporal price differentiation related to housebanking. This finding casts doubt on the
adequate use of loan pricing schemes. In particular, it remains unclear whether cost differ-
entials associated with housebanking are adequately compensated for.
Our paper is organized as follows. Section 2 discusses the recent literature dealing with
relationship lending. Section 3 describes our data set and presents a descriptive analysis.
Section 4 reports an econometric test of loan price determination in the cross section. Sec-
1 See Petersen/Rajan (1994), Blackwell/Winters (1997) and Berger/Udell (1990), respectively.

4
tion 5 extends the analysis and studies how changes in borrower quality affect the lending
behavior of the banks. Section 6 summarizes the results and raises some questions for future
research.
2. Relationship Lending: A brief survey of the literature
Recent models of the banking firm stress its role in reducing costly information asymmetries
between borrowers and lenders [see the surveys by Bhattacharya/Thakor (1993) and
Thakor(1995)]. Under certain assumptions, financial intermediaries are able to realize
economies of scale and scope concerning production, and use of information. One impor-
tant line of reasoning focuses on the structure of long-term debt contracts. As complete and
state-contingent contracts are not feasible in a world of asymmetric information, intermedi-
aries may restore efficiency through the use of relationship lending. In particular, a bank is
able to offer a technology for low cost renegotiations of debt contracts: „.... by close and
continued interaction, a firm may provide a lender with sufficient information about, and a
voice in, the firm’s affairs so as to lower the cost of and increase the availability of credit.“
(Petersen/Rajan 1995: 5). Here, private information helps to establish commitment by the
lender vis-à-vis the borrower. The resulting optimal contract allows for intertemporal ar-
rangements, lowering aggregate financing costs and reducing credit rationing [see Green-
baum/Kanatas/Venezia (1989), Sharpe (1990), Fischer (1990), Boot/Thakor (1994) and
Petersen/Rajan (1995)].
Relationship lending with long-term commitment and informational monopoly by the lender
has some similarity with the so-called housebanking principle. As pointed out by Ed-
wards/Fischer, housebanks in Germany are said to bear a special responsibility if their cus-
tomers face financial distress [Edwards/Fischer (1994), pp. 8-10, 157]. The housebank is
regarded as the premier lender of a firm, with more intensive and more timely information
production than under a comparable „normal“ debt contract. We will therefore use the
terms „housebank relation“ and „relationship lending“ interchangeably.
The main objective of our analysis is to compare housebank financing with normal bank
financing. Up to this point it is not clear what „normal“ bank financing really means.
Moreover, a large proportion of the literature implies exclusivity as a fundamental charac-
teristic of debt financing, thereby identifying bank loans a-priori with relational financing. In

5
Diamond (1984), an intermediary realizes economies of scale with respect to monitoring.
There is no direct competition from a second intermediary. In the model of Fischer (1990),
banks need an exclusive relation with their clients to support an intertemporal tradeoff be-
tween loan availability, and loan pricing. With competition between several banks that cater
for the financial needs of a firm, the special long-term relation to clients breaks down. In
this sense, modern banking theory has largely focused on homogeneous banking relations.
Firms have an exclusive outside financier, their housebank, and all corporate customers of
commercial banks are presumably housebank-clients. However, in most papers competition
is indirectly introduced by imposing a zero-profit condition for the banks.
The available evidence suggests that exclusive financing relations between banks and firms
are extremely rare. Even in the small firms-sample utilized by Berger/Udell (1995) and Pe-
tersen/Rajan (1994), the average number of bank relations at any moment in time is a func-
tion of firm size, varying between 1 and 6. In the medium firms-sample used in this paper,
the average number of bank relations is 5, varying between 1 to 21. This implies that both
banks as well as borrowers may enter into a multitude of debt contracts simultaneously, a
phenomenon which is seldom reflected in the theoretical literature.
Boot/Thakor (1997) analyze a more complete model, where banks engage in both transac-
tion-based and relationship-based banking. The model allows to study the bank’s optimal
choice of relationship financing. Nevertheless, it is partial in that the borrower does not have
a choice between different kinds of bank debt.
The information monopoly of housebanks potentially poses a risk for the borrower, since
the former has ex-post superior bargaining power. The debtor is informationally captured
and might loose future benefits of an enhanced creditworthiness [Mayer (1988) and Rajan
(1992)]. These extra-costs of lending may explain why borrowers establish relations with a
multitude of lenders. Von Thadden (1992) argues that competition from a second lender
(„duplicated monitoring“) may reduce the rents from hold-up situations. Bolton/Scharfstein
(1996) analyze the process of debt renegotiation with many lenders, and the role of collat-
eral therein. Their results are consistent with the assumptions and implications of the rela-
tionship lending literature, although the driving forces in their model are differences in prop-
erty rights on collateral.

6
In summary, relationship lending is an information-intensive type of debt financing which
can affect credit costs and credit availability in a predictable way. It is based on the idea of
an intertemporal implicit contract which is facilitated by a certain degree of (ex post) bar-
gaining power of the lender. However, in our view housebanking is not necessarily synony-
mous to exclusive financing. Firms may have a multitude of lenders, but they will have at
most a single housebank. A comprehensive model of simultaneous contracting between a
borrower, a housebank, and a number of normal lenders is still lacking.
Turning to the relevant empirical literature, one finds it largely concerned with the analysis
of bank uniqueness, rather than relationship lending. For example, James (1987), Lum-
mer/McConell (1989) and Billett/Flannery/Garfinkel (1995) provide some evidence on ab-
normal positive market returns after announcements of new bank debt, or renewal of exist-
ing bank debt. These studies do not differentiate between housebank contracts and normal
bank contracts and thus do not provide insights into the specific role of relationship lending.
Systematic attempts to analyze the implications of relationships can be found in Pe-
tersen/Rajan (1994) and Berger/Udell (1995). These papers draw on a data set from the
National Survey of Small Business Finance. They examine determinants of loan pricing in a
cross section. Blackwell/Winters (1997) use credit file data from a number of banks in the
US. Unlike the data in our study, there is no information on internal risk assessments (credit
ratings), and there is only one year of observations.
In all these papers, housebanks and normal banks are identified by the duration of the firm’s
relationship with the bank. It is implicitly assumed that duration of a relationship is a suffi-
cient statistic for information intensity. However, the suitability of duration as a relationship
lending proxy may be questioned. First, we are not aware of a theoretical argument pre-
dicting different length of time for housebank and normal bank financial relations. Though
there are models predicting housebanks to behave differently from normal banks, e.g. in
situations of financial distress, they do not predict an early discontinuation of normal bank
lending (though they may predict a tightening of credit availability). Note that the duration-
proxy captures only the length of a relationship, not its intensity. Second, recent direct em-
pirical evidence disputes the validity of duration as a proxy for relationship lending alto-
gether. In a study on the Norwegian credit market, Ongena/Smith (1997) find no significant
influence of contract duration on the likelihood of relationship termination. The authors

7
argue that this finding is inconsistent with duration being a good measure of relationship
intensity. For our own sample, we find no significant difference of mean contract duration
between the subsamples of housebanks and normal banks.
One recent attempt to control for the dynamic aspects of relationship lending is the analysis
of Berlin/Mester (1997a). Based on a data set of 600000 small business loans and an obser-
vation period of 12 years, the authors try to examine the idea of an intertemporal compen-
sating scheme. Their results do not provide evidence in support for the existence of rela-
tionship lending [Berlin/Mester (1997a), pp. 15-16]. However, the analysis does not directly
compare relationship-based and normal bank debt. Berlin/Mester estimate cost functions
and profit functions for each bank in their sample. The link to relationship lending is pro-
vided by the idea that relationship lending is reflected by loan rate smoothing, leading to
higher costs and higher profitability simultaneously. Moreover, by relying on bank loans
with contractual interest rates above the prime rate, the authors in fact use a censored sam-
ple. As argued by Gorton/Kahn (1996), banks may, under certain circumstances, charge
below-prime rates under an optimal arrangement.
Preece/Mullineaux (1996) address the issue of multi-lender relations empirically. They ex-
amine the market response to announcements of private financing with different numbers of
lenders. Abnormal returns are observed only if the number of lenders is sufficiently low, i.e.
smaller than 4. This is consistent with the idea that a small number of lenders have stronger
incentives for a close monitoring over time, and that they have lower costs of renegotiation.
Once again, their analysis does not differentiate between housebanks and normal banks.
The relationship between the number of lenders and a firm’s sensitivity to cash flow varia-
tions is analyzed by Houston/James (1996). The authors find that firms relying on a single
bank are more cash flow constrained and appear to hold larger stocks of liquid assets as a
means of liquidity insurance than firms with several banks. This finding casts doubt on the
insurance hypothesis as implied by relationship lending. However, one cannot conclude im-
mediately that firms with a single lending bank are better off by employing additional lend-
ers. The observed financing structure could well reflect an equilibrium and, thus, by in-
creasing the number of lenders, the firm’s situation might deteriorate [Houston/James
(1996), p. 21).

8
Overall, the empirical evidence for the existence of relationship lending appears to be mixed.
Due to the utilization of duration as a proxy for relationship intensity, most studies to date
have to be evaluated carefully. Only few papers control directly for the dynamic character of
the bank-borrower relationship or the number of lenders a given borrower contracts with
simultaneously.
In the remainder of this paper, we will try to provide further insight into the nature of rela-
tionship lending. In particular, we will analyze
• whether housebanks and normal banks can be differentiated in the presence of multiple
lenders,
• whether, in a dynamic setting, housebanks offer insurance-like services to their borrow-
ers, and
• whether loan pricing entails a compensation scheme for housebank services.
3. The Data Set and Descriptive Statistics
3.1 General Data Description
Our data set contains a broad list of variables taken from the credit-files of five major Ger-
man banks: Bayerische Vereinsbank, Deutsche Bank, DG Bank, Dresdner Bank, and West
LB.2 Our data is a random sample drawn from all customers with some active business at
any time between January 1992 and January 1997 meeting a number of selection criteria.3
First, firms had to be of moderate size, i.e. an annual turnover between 50m and 500m DM
(US $ 30m to 300m). In this size segment, asymmetric information was believed to be im-
portant, thus allowing our relationship banking hypotheses to be tested. Second, minimum
loan size is DM 3m (US $ 1.7m), corresponding to the regulatory imposed notification re-
quirement in § 14 KWG4. We thereby ensure a minimum level of information collection in
2 Among these institutions are the three largest German private banks, the (national) apex cooperative bank, and the largest (regional) apexsavings banks. In the list of the largest banking firms of the country at year end 1995, they comprise the ranks 1, 2, 3, 5, 8.3 For a detailed presentation of the data set, see Elsas et.al. (1997).4 §14 KWG requires each bank to report the name of each debtor with consolidated debit balance of DM 3m, or above. The Bundesbank, onbehalf of the regulatory agency (BAKred in Berlin), collects all notifications, and produces a consolidated statement per customer. Thesequarterly consolidated statements are accessible by all reporting banks.
9
the credit-files of all customers in our population. Third, to avoid special influences rooted
in the industrial restructuring of the New Bundesländer (former GDR), clients with regis-
tered seat in the former GDR were excluded from the population. Fourth, inclusion in the
population required that the respective client had at least one longer-term investment loan.
This criterion should ensure the existence of some specific information on the loan, e.g. a
stipulated payment schedule and a specified maturity. All customers fulfilling the above four
criteria are included in population „A“. Population „P“ contained those customers in the
„A“-population that, at any one point in time between 1992 and 1996, had experienced a
negative rating, i.e. were put on the watchlist.5 „P“ is thus a subsample of „A“ and com-
prises problematic, or potentially distressed, loans.
Two samples of size 25 and 15 for population „A“ and population „P“, respectively, were
drawn from each bank, yielding 125 clients in sample „A“ and 75 clients in sample „P“.6 For
each credit relationship in our sample, and for each time a credit decision is documented
(e.g. loan renewal, change in credit volume) or a new rating was produced, the full set of
variables was recorded. Thus, for example, for a credit relationship with three credit deci-
sion and one additional rating exercise, there are four observations per variable. There are
approx. 130 variables in our data set, including industry classification, balance sheet data,
rating data, information on credit volume, collateral, interest rates, and so forth.
Table I reports some descriptive statistics of our „A“-sample, while Table II does the same
for the „P“-sample.
5All internal ratings were calibrated on a 1-6 rating scale. A negative rating is defined to be a rating of below 4, i.e. 5 or 6. For details on therating systems used by the banks in our sample, see Brunner/Krahnen/Weber (in preparation).6 In a first step, the sample of the „A“-population was drawn from all cases fitting the above mentioned selection criteria. The „P“ samplewas drawn out of the remaining cases of the population, under the condition that these had experienced at least one negative rating in theobservation period.

10
Table I
Descriptive Statistics - Representative Sample A
Panel A: Cross section (according to size class, 1996 only) Panel B: Time series (according to year)
All measures in Panel A are with respect to the size class (columns, million DM). No. of banks is the mean number of active lending relation-ships, Duration measures the mean years since the initial debt contract, Action is the number of cases with distress actions divided by totalcases, Debt Share is the mean ratio of total bank debt to non-equity financing, Spread measures the average mark-up for lines of credit overthe corresponding riskless rate (FIBOR), Rating is the average rating as documented in the credit file, Limited Liability is the number ofincorporated firms divided by total firms, N is the number of observations. Calculations are based on a listwise procedure to provide compa-rability with the subsequent regression analyses, i.e. if an observation for one of the reported variables was missing for one client, the clientwas completely excluded. Values in parentheses are medians.
Panel A: Cross section (according to size class, 1996 only)
Firm size (1996
turnover)
1
< 72
2
72 - 120
3
120 - 250
4
≥ 250
No. of banks 4.1 (4.0) 5.3 (5.5) 6,4 (4.5) 9,0 (7.5)
Duration 24,5 (16.2) 23.4 (20.2) 19,9 (22.5) 35,9 (25.7)
Action 0.0 0.14 0.08 0.07
Debt share 0.38 (0.31) 0.29 (0.25) 0.43 (0.33) 0.37 (0.34)
Spread 4,3 (4.4) 4.0 (4.0) 3.9 (3.7) 3.5 (3.5)
Rating 2.8 (3.0) 3.2 (3.0) 3.1 (3.0) 2.9 (3.0)
Limited Liability 0.78 0.82 0.83 0.79
N 18 22 24 14
Panel B: Time series (according to year)
Year 1996 92 93 94 95 96
No. of banks 5.8 (5.0) 5.5 (4.0) 5.7 (5.0) 6.1 (5.0) 6.0 (5.0)
Duration 24.1 (24.1) 24.9 (25.4) 23.9 (21.4) 25.2 (22.9) 24.8 (23.9)
Action 0.07 0.04 0 0.09 0.08
Debt share 0.4 (0.27) 0.34 (0.26) 0.35 (0.25) 0.39 (0.31) 0.37 (0.3)
Spread 2.0 (2.0) 3.5 (3.5) 3.74 (3.8) 3.8 (3.7) 4.0 (3.9)
Rating 2.8 (3.0) 3.1 (3.0) 2.8 (3.0) 3.1 (3.0) 3.0 (3.0)
Limited Liability 0.83 0.78 0.81 0.82 0.81
N 71 74 79 82 78
The upper Panel A of Table I reveals that some characteristics of credit contracts depend on
firm size. The mean number of banks with which active financial relations exist increases
from 4.1 in the lowest size class to 9.0 in the highest size class. The growth in the number
of separate bank relationships may reflect the firm’s attempt to loosen relations to their
banks as they become larger. However, this emancipation hypothesis is not supported by the
share of total debt financed by the bank in our sample, where the mean shows some vari-

11
ability but no significant difference between size classes. A comparison with Panel B shows
that the number of banks, and the share of debt financed by that bank is roughly constant
over time, i.e. has no visible time trend.
The difference between the contractual (effective) interest rate and the monthly average of
the FIBOR (three-month Frankfurt-Interbank-Offered-Rate) is defined as the spread.7 It has
to cover the costs of intermediation services, including transaction costs, and standard risk
costs. Our data reveal a significant downward shift of the spread across size classes, sup-
porting the view that small firms imply higher risks, justifying a higher premium. The mean
margin decreases by 19% from 430 to 350 basis points. The downward shift is, however,
also consistent with the increased competition, and less market power, of our intermediaries
in larger size classes.
Over time (Panel B), we observe a constant increase of the average margin from 200 basis
points in 1992 to 400 basis points in 1996. This increase is even more dramatic in real terms
as over this period the annualized inflation rate has almost halved, from roughly 4 to 2 per-
centage points. A decomposition into size classes shows similar increases for all size classes.
Roughly two thirds of this increase can be attributed to the second time interval, i.e. 1993.
There is no evidence for systematic rating changes in our data. Across size classes (Panel A)
ratings are roughly similar, especially with respect to the constant median of 3 for all
classes. The pattern holds for average ratings over time (Panel B). The question of rating
dynamics is important, as ratings supposedly proxy for risk, or expected risk, of the loan
portfolio. However, for an in-depth analysis of rating dynamics we would need a larger data
set.8
Table II describes the sample of problematic loans, where a loan is classified as
„problematic“ if, during our sample period, there was at least one rating in the „junk“ cate-
gories 5 and 6. In many respects, the numbers in Table II are a scaled version of those in
Table I.
7 In what follows, interest data is solely based on observations of lines of credit to establish comparability with the regression analysis ofsection 3.8 But see Krahnen/Voßmann/Weber (in preparation).

12
Table II
Descriptive Statistics - Low-Ratings Sample PPanel A: Cross section (according to size class, 1996 only), Panel B: Time series (according to year).
All measures in Panel A are with respect to the size class (columns, million DM). No. of banks is the mean number of active lending relation-ships, Duration measures the mean years since the initial debt contract, Action is the number of cases with distress actions divided by totalcases, Debt Share is the mean ratio of total bank debt to non-equity financing, Spread measures the average mark-up for lines of credit overthe corresponding riskless rate (FIBOR), Rating is the average rating as documented in the credit file, Limited Liability is the number ofincorporated firms divided by total firms, N is the number of observations. Calculations are based on a listwise procedure to provide compa-rability with the subsequent regression analyses, i.e. if an observation for one of the reported variables was missing for one client, the clientwas completely excluded. Values in parentheses are medians.
Panel A: Cross section (according to size class, 1996 only)
Sizeclass 1996 1 < 72
272 - 120
3120 - 250
4≥ 250
No. of banks 4.1 (3.0) 7.0 (7.0) 6.7 (6.0) 5.5 (5.5)
Duration 18.8 (17.4) 29.4 (26.9) 26.4 (26.4) 21.4 (21.4)
Action 0.61 0.36 0,73 0.5
Debt share 0.73 (0.43) 0.30 (0.20) 0.26 (0.25) 0.14 (0.14)
Spread 5.8 (5.5) 4.9 (4.9) 5.2 (4.9) 4.6 (4.6)
Rating 4.7 (5.0) 4.7 (5.0) 5.0 (5.0) 5.0 (--)
Limited Liability 0.8 0.91 0.87 0,5
N 18 11 15 2
Panel B: Time series (according to year)
Dateclass 92 93 94 95 96
No. of banks 6.5 (6.0) 6.6 (6.0) 6.3 (6.0) 6.4 (6.5) 5.7 (5.0)
Duration 21.1 (17.4) 23.0 (21.4) 22.3 (21.7) 25.9 (22.9) 24.0 (26.5)
Action 0.61 0.66 0.54 0.57 0.59
Debt share 0.48 (0.35) 0.34 (0.26) 0.40 (0.25) 0.37 (0.27) 0.47 (0.29)
Spread 2.2 (2.3) 3.5 (3.5) 4.4 (4.3) 4.6 (4.5) 5.3 (4.9)
Rating 3.8 (4.0) 4.3 (5.0) 4.6 (5.0) 4.5 (5.0) 4.8 (5.0)
Limited Liability 0.73 0.70 0.82 0.80 0.85
N 41 47 56 44 46
There is an increase in the number of banks across size classes. Potentially distressed firms
seem to have a slightly (though not significant) higher number of banks with which they do
business on average, if compared to Table I.
Consider next the third row („action“). This variable averages over all problem incidences in
this subsample, where a typical problem incidence is a bankruptcy filing, a liquidation of
collateral or assets, an increase of collateral, or any other formal action undertaken by the
bank due to a borrower’s financial distress. The number reported gives the relative fre-
quency of bank action, it may vary between 0 (no loan in this subsample required bank ac-
tion) and 1 (all loans required formal action by the bank). As can be seen from Panel A,

13
there is no clear pattern of the action variable across size classes. While in Table I, formal
action is taken in less than 9% of all cases, this number reaches up to 66% in sample „P“.
This is consistent with our conceptual design of the two samples.
Spreads and Ratings are, on average, significantly higher for potentially distressed firms
than for „normal“ firms. Thus, there seems to be a clear relation between risk (as proxied by
bank ratings) and contractual interest rates. As is clear from Panel B in Table II, over time
the margin is even more dramatically increasing between 1992 and 1996 than in Table I.
With respect to both subsamples, this observed time trend in the spread may be interpreted
as a sluggish response of contractual interest rates to changes in market rates because dur-
ing our sample period, the short term interest rate (FIBOR) is steadily decreasing. A recent
study by the Deutsche Bundesbank compares the FIBOR time-series with a measure of the
average contractual rates for lines of credit of the entire German banking sector. 9 As in our
study, a steady increase of the spread from roughly 300 basis points to 500 bp is reported
[Deutsche Bundesbank (1996), p.43]. Similarly, Berger/Udell (1992) and Berlin/Mester
(1997b) report for the US that loan mark-ups respond sluggishly to changes of the interest
rate level.
With respect to the ratings, we find a size-effect nor a time pattern in either group. But in
contrast to sample A, the descriptive statistics of sample B reveal a time pattern of the aver-
age rating, indicating a deterioration of loan quality.
The next section describes the identification of housebank relations among all credit rela-
tions in the sample and provides some descriptive statistics.
3.2 Housebanks versus Nonhousebanks: Identification and Descriptive Statistics
Since the housebank status is not an objectively measurable characteristic of a lending rela-
tionship -indeed we do not know a priori whether it has any significant meaning at all- we
collected additional information. Two sources of information were used to separate our
sample into a „housebank“ and a „normal bank“ subsample (housebank dummy). The first
dummy-variable „HB_inter“ was created by relying on the self-evaluation of the credit man-
9

14
ager in charge of that particular customer. He was given a questionnaire asking for a house-
bank-attribution („Do you feel that your bank is the housebank of that particular client?“).
The respondents had to check „yes“ or „no“, and were further asked to give a brief expla-
nation in writing of their attribution. As the resulting attributions rely on the bank’s role as
perceived by the bank employees themselves, it is an internal attribution („HB_inter“).
A second variable relies on indirect evidence taken from the credit-files. Whenever a par-
ticular activity of the bank in question was related to its housebank-status or its main, or
only bank relationship (e.g. in a credit protocol, or in an aide-memoire), the variable
„HB_exter“ was assigned the value of one, and zero otherwise. The attribution was re-
corded separately for every credit event. Hence, there is a time series of „HB_exter“-
attributions in the data set. This dummy variable relies on the interpretation of the research-
ers collecting the data from the credit files, it is thus an external and somewhat subjective
attribution („HB_exter“) of the housebank characteristics.
From these two proxies for housebank relations we can construct a third, modified indicator
variable („HBM“, consolidated housebank attribution) which will be for our subsequent
regression analyses. „HBM“ attributes the value 1 and 0 to all relations that were consis-
tently grouped as either housebank or nonhousebank in both attributions, „HB_exter“ and
„HB_inter“. Inconsistent attributions are recorded in 24 cases. They are due to changing
attributions in the time series of „HB_exter“ observations. These inconsistencies could be
resolved by use of additional information contained in the written explanation given in the
questionnaire.10
After resolution of the inconsistencies, thus, 68 housebank relations, 77 non-housebank
relations, and 55 contradictory cases remained. The resulting frequency distribution over the
five banks of our sample is shown in Figure I. The overall pattern of the status attribute
distribution seems to be quite similar for all banks but bank 3. Bank 3 has a high number of
nonhousebank relationships and a very low number of contradictory cases.11
10 A detailed description combined with an analysis of the written explanations in our questionnaires is contained in Rott (1997).11 This interesting deviation is consistent with our a priori belief that bank 3 should have less housebank relationships due to its institutionalbackground.

15
Figure I
The figure shows the frequency distribution of nonhousebank relations (NHB), housebank relations (HB) and contradictory cases over thefive banks of our sample. The figure is based on the consolidated housebank attribution HBM, which is underlying all subsequent regressionanalyses.
Bank 5Bank 4Bank 3Bank 2Bank 1
Cou
nt
30
20
10
0
Housebank Status
NHB
HB
CONT
18
14
2
7
14
7
12
10
23
1615
14
28
1010

16
Table III
Descriptive Statistics - Housebank CriteriaDescriptive statistics of housebank and nonhousebank sample using non-distress sample „A“ (panel A) and potential distress sample „P“(panel B). All values are means, see Table I for definitions of variables. Different housebank attributions: HBM is the consolidated house-bank variable, where inconsistencies have been adjusted, HB_exter is the attribution according to external judgment. HB_inter is the attribu-tion according to judgment of interviewee without adjustment for inconsistencies.
Panel A: Representative Sample „A“ (1996 data)
1
HBM
Housebanks
2
HBMNormal bank
3
HBMContradictory
4
HB_exterHousebanks
5
HB_interHousebanks
No. of banks 4.8 8,5 5.3 4.5 5.1
Duration 23.1 25,3 26.8 23.1 24.2
Action 0.03 0.17 0,04 0.03 0.04
Debt share 0.46 0.26 0.36 0.48 0.41
Spread 3.9 4,0 4.0 3.9 4.0
Rating 2.8 3.3 3.2 2.8 2.9
Limited Liability 0.84 0.78 0.78 0.85 0.8
Size 169 209 185 163 180
N 32 23 23 34 51
Panel B: Low rating-Sample „P“ (1996 data)
1
HBM
Housebanks
2
HBMNormal bank
3
HBMContradictory
4
HB_exterHousebanks
5
HB_interHousebanks
No. of banks 4.2 6.6 6.6 4.8 5.3
Duration 26.6 16.6 26.5 26.6 27.0
Action 0.71 0.42 0.59 0.68 0.69
Debt share 0.69 0.17 0.34 0.67 0.60
Spread 5.5 5.5 5.1 5.5 5.3
Rating 4.5 4.9 5.1 4.6 4.9
Limited Liability 0.82 0.92 0.82 0.84 0.83
Size 63 159 122 67 94
N 17 12 17 19 29
Table III indicates that all three housebank definitions based on our data set yield similar
results. Consider column 1, 4 and 5 for a comparison. All numbers are very close across
Panel A, and also across Panel B. A comparison of columns 1 and 2 reveals quite different
mean values for most values describing housebank relations and normal bank relations. In
Panel A, housebank relations have less other bank relations (4.8 as compared to 8.5), they
have a somewhat shorter duration, and they imply a significantly higher share in the firms

17
overall debt financing. Housebank margins are fairly similar, and their rating is marginally
better. There is no striking difference as to firm size and corporate charter. For firms in po-
tential distress we find a similar pattern, though the housebank’s average share in debt fi-
nancing is even larger here. Note that for firms in potential distress, housebank relations
tend to comprise smaller firms, as their mean turnover is roughly 60% lower than for non-
housebanks.
4. Determinants of Loan Pricing
4.1 Methodology and Hypotheses
An important aspect of a housebank relationship concerns its pricing implications. Some
theoretical models predict a positive effect on effective loan spreads, where the remunera-
tion of housebank services may be relying on intra- and intertemporal transfers (Greenbaum
et al. (1989)). In this section we examine the determinants of the interest spread for a cross-
section of credit contracts, relying only on our representative sample A. The spread is de-
fined as the difference between the contractual rate for lines of credit and the prevailing 3-
months FIBOR12 rate. The methodology is related to Petersen/Rajan (1994) and
Berger/Udell (1995). Like them, we are controlling for various possible determinants of the
spread, and like them, we are eventually interested in the marginal explanatory power of our
housebank-variable. However, in contrast to both paper, our classification of housebanks
and normal banks relies on an additional information, which is exogenous to the credit data
(see section 3 for details).
There are potentially several ways for a housebank to earn extra income. First, in housebank
relations, the borrower may be paying higher interest rates in all or some periods, as com-
pared to normal bank relations (direct compensation). The theoretical literature implies,
thus, that the compensation should follow a specific intertemporal pattern, depending on the
duration of the implicit contract.13 Second, the borrower may be willing to do additional
business, besides taking credit, at unfavorable rates from his point of view (indirect compen-
12 We calculate the relevant FIBOR rate (3-month Frankfurt-Interbank-Offered-Rate) as the event month’s average. Data are from DeutscheBundesbank, (1997a)13 See e.g. Greenbaum et al. (1989) and Sharpe (1990). Note that the models of Petersen/Rajan (1995) and Boot/Thakor (1994) predict anintertemporal pattern with decreasing spreads as contract duration increases.

18
sation, e.g. brokerage services). This latter „cross-selling“- argument is often referred to
when bankers explain the merits of relationship lending. Due to lack of reliable data, how-
ever, the cross selling-hypothesis is hard to quantify empirically.
In the following, we concentrate on the direct compensation hypothesis, though we are un-
able to differentiate between compensation in any period or compensation dependent on
contract duration.
Using OLS, we estimate equation (1)
spread = a (risk) + b (structural) + g (relationship) + d (governance) (1)
where the dependent variable is the spread, defined by the interest rate charged by the bank
minus the FIBOR. We follow Berger / Udell (1995) and Blackwell/Winters (1997) in as-
suming that lines of credit is the appropriate variable to capture the „relationship-driven“
business.
There are several independent variables in the model, which we will discuss in turn. They
may be grouped into four categories, describing credit risk, relationship lending, corporate
governance, and structural aspects of the debtor or the debt contract.
Credit risk is represented by three dummies, one for each rating category between 3 and 5
(RATING3 - RATING5). Top ratings 1 and 2 serve as the reference quality. There were no
observations in the lowest rating category, rating 6. Note that ratings indicate creditworthi-
ness rather than default risk, since they are not affected by the provision of collateral.14
Relationship lending is captured by the variable HBM, the modified housebank criterion.
The HBM-dummy is 1 if the particular relationship is categorized as a housebank relation-
ship, and 0 otherwise. The variable HBUN takes on a value of one if the housebank status is
unclear and zero otherwise.15 Thus, the nonhousebank borrowers serve as the reference
group. The housebank criterion is meant to control for housebank-specific effects on an
absolute level via the intercept term. In the literature, in contrast, it is usually the duration of
the customer relationship and the number of banks catering the borrower that serve as
proxies for relationship lending (Petersen/Rajan (1994), Berger/Udell (1995)). The duration
14 In the following, we use the term „risk“ synonymously to creditworthiness. We will refer to „risk in a narrow sense“ with respect to theexposure.15 These are the 55 contradictory cases as discussed in Section 2.

19
of the lending relationship (DURAT, in years since the initial contract) is included in the re-
gression, whereas we dispense with the number of banks to avoid multicollinearity.
Furthermore there are a number of structural variables, describing systematic effects relating
to type of borrower, and type of contract. These variables include bank dummies (BANK2
to BANK5), with bank no. 1 serving as the reference.
LOGSIZE measures the natural logarithm of a firm’s sales per year. It serves as a proxy for
firm size and, possibly, market power in contract negotiations. We expect firm size to be
negatively related to credit spreads.
The variable HHI, the Hirshman-Herfindahl-Index, is a measure of competition in the local
credit market at a firm’s registered seat. We use the first three digits of the postal code for
defining a local market, the number of subsidiaries of a given bank at the local market serves
as the underlying for the HHI. High values of the HHI indicate a high degree of concentra-
tion and, thus, a low level of competition. Consequently, the spread is expected to be posi-
tively related to the HHI-value.
NONCOLLAT measures the share of the bank’s total lending to a specific customer that is
without collateral (i.e. NONCOLLAT specifies the exposure in percentage points). The value
of the collateral is taken from the credit files. Since decreasing exposure is tantamount to
decreasing risk in a narrow sense, we expect to find a positive association between
NONCOLLAT and the credit spread. This is consistent with the theoretical implication of
collateral as a signaling device (Bester (1985), Besanko /Thakor (1987)). These models
derive a positive association between the noncollateralized share and the spread. A separat-
ing equilibrium is established with the borrowers choosing from a contract menu „low inter-
est / high collateral“ and „high interest / low collateral“. However, recently there has been a
debate about the likely use of collateral in debt contract design. Bester (1994) has an in-
complete contracts model where renegotiations exist in equilibrium, and high collateraliza-
tion is implied for high risk firms (et vice versa). Thus, in contrast to the signaling models,
more collateral may be associated with higher credit spreads which would imply a negative
coefficient of our NONCOLLAT variable.
The variable FINAN2 is defined as the total amount of debt supplied by a particular bank
divided by the sum total of non-equity-financing according to balance sheet data. We use a

20
standardized measure of credit volume to allow a cross-sectional comparison between dif-
ferent firms, and banks. Following Stiglitz/Weiss (1981), we expect the effect of FINAN2 on
the spread to be ambiguous, because under credit rationing either the interest rate, or the
volume, or both can be used as reaction parameters to borrower quality in debt contract
design.16
Finally, the governance-related influences are summarized by the dummy LIMLIAB, which
takes on a value of one if the firm is incorporated and zero otherwise. As limited liability
restricts the bank’s access to private assets of the owners in distress situations, we expect to
find a positive premium.
Table IV summarizes the variables and specifies expected signs of the regression coeffi-
cients.
Table IV
Definitions of Variables and Hypotheses
Variable Definition Hypothesis
RATING3 to RATING5 Rating-Dummies, 1 is best and 6 is worst positive
HBM Dummy, „1“ if housebank positive
HBUN Dummy, „1“ if housebank status unclear no effect
DURAT length of the customer-relationship measured in years no effect
BANK2 to BANK5 Dummies, „1“ if debtor belongs to bank x (x=2 to 5) unsystematic
LOGSIZE natural logarithm of a given firm’s annual sales (size-proxy) negative
HHI Hirshman-Herfindahl-Index, measures local credit market concentra-tion
positive
NONCOLLAT share of borrower’s total credit volume which is noncollateralized positive
FINAN2 total debt supplied by the bank divided by total non-equity financingof the borrower
ambigious
4.2 Results
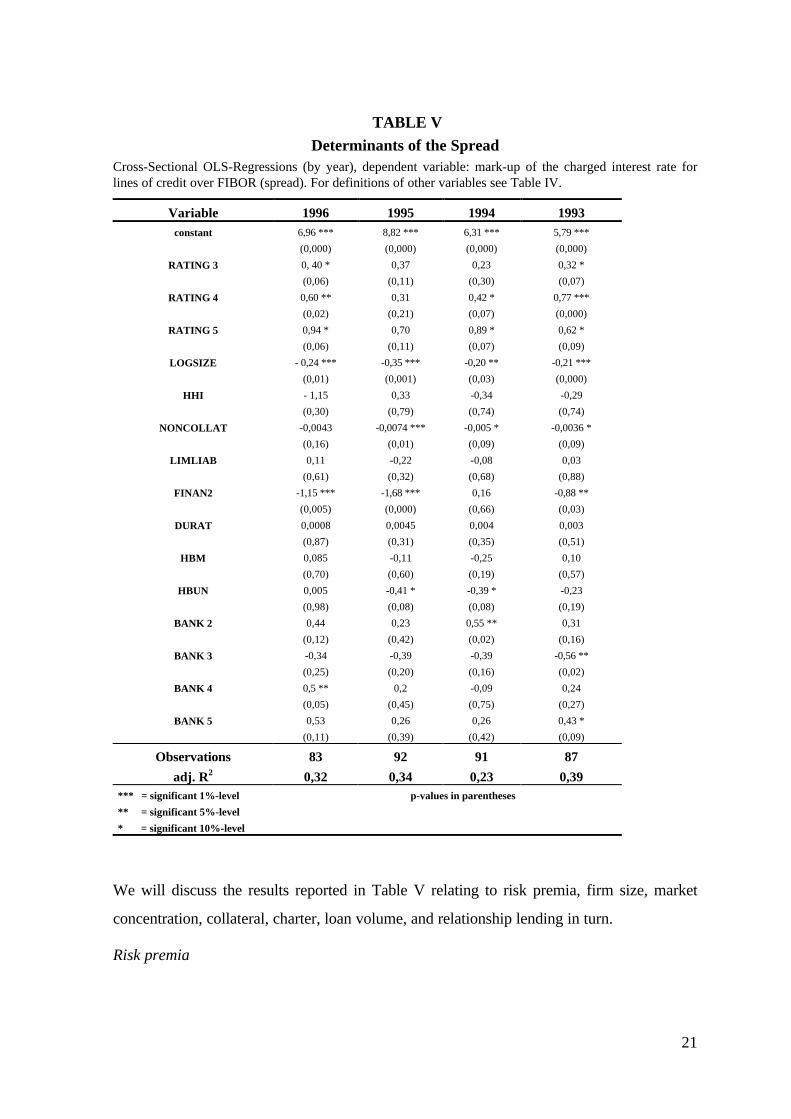
In this section we present results of a cross-sectional regression of the credit spread on the
set of explanatory variables, as explained in the previous subsection. Table V gives the co-
efficients and their p-values from four regressions, one for each year in our sample period.
16 See e.g. Boot/Thakor (1994) for a model of a long-term bank-borrower relationship under moral hazard, which determines interest rateand collateral requirement endogenously. The simultaneous determination of collateral and interest rate raises also the issue of misspecifica-tion of our empirical model, which will be discussed later.
21
TABLE V
Determinants of the SpreadCross-Sectional OLS-Regressions (by year), dependent variable: mark-up of the charged interest rate forlines of credit over FIBOR (spread). For definitions of other variables see Table IV.
Variable 1996 1995 1994 1993constant 6,96 ***
(0,000)
8,82 ***
(0,000)
6,31 ***
(0,000)
5,79 ***
(0,000)
RATING 3 0, 40 *
(0,06)
0,37
(0,11)
0,23
(0,30)
0,32 *
(0,07)
RATING 4 0,60 **
(0,02)
0,31
(0,21)
0,42 *
(0,07)
0,77 ***
(0,000)
RATING 5 0,94 *
(0,06)
0,70
(0,11)
0,89 *
(0,07)
0,62 *
(0,09)
LOGSIZE - 0,24 ***
(0,01)
-0,35 ***
(0,001)
-0,20 **
(0,03)
-0,21 ***
(0,000)
HHI - 1,15
(0,30)
0,33
(0,79)
-0,34
(0,74)
-0,29
(0,74)
NONCOLLAT -0,0043
(0,16)
-0,0074 ***
(0,01)
-0,005 *
(0,09)
-0,0036 *
(0,09)
LIMLIAB 0,11
(0,61)
-0,22
(0,32)
-0,08
(0,68)
0,03
(0,88)
FINAN2 -1,15 ***
(0,005)
-1,68 ***
(0,000)
0,16
(0,66)
-0,88 **
(0,03)
DURAT 0,0008
(0,87)
0,0045
(0,31)
0,004
(0,35)
0,003
(0,51)
HBM 0,085
(0,70)
-0,11
(0,60)
-0,25
(0,19)
0,10
(0,57)
HBUN 0,005
(0,98)
-0,41 *
(0,08)
-0,39 *
(0,08)
-0,23
(0,19)
BANK 2 0,44
(0,12)
0,23
(0,42)
0,55 **
(0,02)
0,31
(0,16)
BANK 3 -0,34
(0,25)
-0,39
(0,20)
-0,39
(0,16)
-0,56 **
(0,02)
BANK 4 0,5 **
(0,05)
0,2
(0,45)
-0,09
(0,75)
0,24
(0,27)
BANK 5 0,53
(0,11)
0,26
(0,39)
0,26
(0,42)
0,43 *
(0,09)
Observations 83 92 91 87
adj. R2 0,32 0,34 0,23 0,39*** = significant 1%-level p-values in parentheses
** = significant 5%-level
* = significant 10%-level
We will discuss the results reported in Table V relating to risk premia, firm size, market
concentration, collateral, charter, loan volume, and relationship lending in turn.
Risk premia

22
The coefficients of our rating dummies have a similar pattern for each year. They are posi-
tive and increasing in rating classes. Recall that a high rating class (i.e. 5 or 6) is associated
with a poor credit risk, whereas a low rating class, like 1 or 2, are the prime risk categories.
In particular, the coefficients of the „bad“ ratings 4 and 5 are significantly different from
zero and thus different from the reference group (rating 1 and 2). Rating classes are only
marginally significant for 1995 observations, with p-values of 11% for RATING3 and
RATING5. We interpret this result as support for the hypothesis that borrower quality sys-
tematically affects credit spreads. Though this finding is intuitively plausible, it nevertheless
contradicts findings in the recent literature. Typically, the used risk proxies for tests with
respect to nontraded debt contracts turn out to be statistically insignificant.17 Thus, in con-
trast to these studies, we find evidence in favor of the risk-premium hypothesis.
Size
When focusing on the structural variables, the variable LOGSIZE is statistically significant in
every year on at least the 10%-level. The coefficients have the predicted negative sign and
suggest an economically significant decrease in the spread of roughly 20 basis points per
„unit“ logsize. This seems to support the hypothesis that market power in credit negotia-
tions plays an important role when it comes to the determination of loan rates.
Concentration
The coefficients of the HHI-variable are negative in three out of four years, but are statisti-
cally not different from zero in any of the years. The credit spread does not seem to be in-
fluenced by local banking concentration to any significant degree.18 This observation casts
some doubt on explanations of loan pricing based on (local) monopoly power.
Collateral
The coefficient of the inverse collateral measure, NONCOLLAT, is significant at least at the
10%-level for every year, except for 1996 (where the p-value is 16%). Hence, collateraliza-
tion has a statistically significant effect on the spread, but its magnitude is small. Interest-
ingly, the sign of the NONCOLLAT-coefficients is always negative, supporting the interpre-
tation of collateral as an incentive device as in Bester (1994), rather than the more common
signaling interpretation.
17 See e.g. the results of Berger/Udell (1995), p. 366 - 367 or Blackwell/Winters (1997), p. 285.

23
Corporate Charter
The LIMLIAB coefficients do not differ significantly from zero in any year. Furthermore, the
sign does not indicate any systematic pattern, which may be due to either the absence of any
limited liability effect, or to the effect that any increase in risk associated with limited liabil-
ity is already incorporated by the rating.
Volume
Standardized credit volume, FINAN2, turns out to be highly significant in three out of four
years, with a large economic impact on the spread. In all years, the coefficients have a
negative sign, consistent with the view that both volumes and interest rates are sensitive
with respect to borrower quality. To test for a possible simultaneity bias here, we dropped
volume from the regressions in Table V. All results remain qualitatively unchanged.19
Housebanking
Having discussed the general determinants of the spread, we can now focus on the main
topic in this section, the housebank compensation scheme. Inspection of the coefficients of
HBM and HBUN reveals the absence of any systematic pattern. The HBM coefficient is not
statistically different from zero in any single year. Furthermore, its sign is indeterminate,
which is evidence against the existence of a direct compensation scheme. A possible expla-
nation for this finding is competition on the credit market, hindering the housebank to
charge a direct, and thus transparent, relationship fee.
Note that the variable DURAT may be used as an alternative proxy for relationship lending
(as in Petersen/Rajan 1994). According to Table V, this variable is insignificant in all four
regressions.20 If the housebank variables HBM and HBUN are excluded from the regres-
sions, the coefficients of DURAT remain insignificant. We interpret this observation as addi-
tional evidence against the interpretation of customer duration as a relationship proxy.
4.3 Discussion of methodology
Robustness and Model Specification
18 The same holds for each of the regressions if one includes the interaction term of HHI and LOGSIZE.19 We discuss the simultaneity problem in the next section, when discussing general aspects of methodology.20 The result still holds for all regressions if one uses the natural logarithm of DURAT.

24
We first want to check the standard OLS assumptions, i.e. normality and heteroscedastic-
ity.21 An ordinary F-test indicates the overall explanatory power of our specification. All
regressions are statistically significant on at least the 1%-level. Using the Jarque-Bera sta-
tistic we checked the assumption of normally distributed residuals. For all years the null
hypothesis of normal errors could not be rejected with a p-value of at least 20%. To test for
heteroscedasticity we used White’s test with and without cross terms. The null hypothesis
of homoscedastic variances of the error terms could not be rejected with a p-value of at
least 30%. Thus, in terms of matching the necessary OLS assumptions, our model seems
reasonably well specified.
We did not employ a panel approach (which would allow a simultaneous use of time-series
and cross-sectional observations) to test for spread determinants for the following reasons:
First, we tried to establish comparability with the existing literature. Second, the hypothesis
tested in this subsection relates to the intratemporal nature of credit spreads, recommending
a cross-sectional approach. Third, and more technically, the observations in our data set are
event-oriented, i.e. data were recorded whenever either a change in the structure of the debt
contract or a new rating was documented in the credit files.22 The advantage of this proce-
dure is to include all changes in the structure of a given debt contract in the observation
period in the data set, e.g. we know at any time in the observation period total debt out-
standing, the value of collateral, and so on, for each firm in our sample. The disadvantage of
this procedure is a non-synchronous data set, with infrequent recording of the loan rate and,
hence, the credit spread. This is because a change of the interest rate in an ongoing credit
relationship did not trigger data collection, and credit rate variability is much higher than the
variability of the fundamental („structural“) variables. These „missing“ observations (or in-
cidental truncations23) lead to problems in the application of panel models to the spread.24
A further extension of our cross sectional design would control for bank heterogeneity more
directly. In Table V, bank dummies do not show a systematic pattern over the years, or for
21 Greene (1997) provides a comprehensive discussion.22 See Elsas et al. (1997) for the details.23 See Greene (1997), p. 974.24 These problems do not carry over to „structural“ variables. However, for a pooled regression analysis of the spread, which is also based onour data set, see Machauer/Weber (1998). Their qualitative results are similar to ours.

25
a given bank, though some of them are statistically significant.25 There is, thus, some degree
of bank heterogeneity in our data, suggesting separate regressions for each of the banks
rather than pooling them. Since keeping a cross sectional design reduces the sample size
considerably, the data of all years for a given bank and regression would have to be used.
But this would cause serious methodological concerns, since then the data in the sample
would consist of repeated observations, rendering OLS methodology obsolete.
Modeling the credit decision process
What is the appropriate way to model the credit decision process? The single-equation,
standard OLS design implies a one-way causality from the regressors to the regressand. As
already noted, this is not a very plausible assumption for at least some variables included in
our regression, e.g. credit volume and loan spread. Intuition as well as theory suggest that
banks rely on both parameters to accommodate for borrower quality. In an asymmetric in-
formation framework with moral hazard (or adverse selection), the increase of the loan rate
induces risk-taking behavior by the borrower. The total effect of a rate increase on net
earnings of the lender is then indeterminate. In this case, banks may use volume rather than
loan rates to manage exposure (credit rationing). In a regression framework, these variables
become interdependent, and OLS estimates are no longer consistent. One could make a
similar argument for the collateral decision of the bank.
One way to alleviate the simultaneity problem is to use an instrumental variables approach
like Two-Stage-Least-Squares (2SLS). The sequential estimation of the reduced-form
equations and the transformed equation by OLS would yield consistent estimates of the co-
efficients.26 But the estimation of such a specification needs the relevant equations to be
identified. It follows that one needs to use variables which are closely correlated with one of
the interdependent variables but not correlated with the others.
We tried to implement a 2SLS approach to check for the robustness of our results. How-
ever, using the adequate Hausman-Specification-Test, the null hypothesis of „no simultane-
ity“ for the volume and the spread could not be rejected. We interpret this surprising result
25 Robustness tests show that in regressions without bank dummies, ratings loose their individual explanatory power. This is due to the factthat the joint explanatory power of the bank dummies is significant at the 1%-level for all years except for 1995.26 See Greene (1997), pp. 740-742.
26
as a problem of defining reasonable instruments with sufficient explanatory power. Fortu-
nately, the robustness of our cross section results to a deletion of either collateral, or credit
volume, or both as regressors minimizes the relevance of the simultaneity problem in our
data set.
5. Behavioral differences in the management of credit relationships - House-
banks versus Normal Banks
5.1 Concept and descriptive statistics
In this section we focus on the analysis of housebank relationships in comparison to normal
banks. Theoretical arguments discussed in the previous sections suggest the existence of
long term implicit contracts (housebank relationships), leading to different behavioral pat-
terns in the lending relationship. The housebank may utilize private information, facilitating
its implicit commitment vis-à-vis the client. Furthermore, a housebank’s dominant role in a
firm’s financial activities helps to reduce coordination costs in a possible future renegotia-
tion situation. From the point of view of the borrower, the implicit contract may provide an
insurance-like service. For example, if the borrower’s quality is adversely affected, as re-
flected in a negative rating change, an implicit stand-by arrangement with a housebank is a
valuable asset. We use the internal ratings of the banks as our proxy for borrower quality,
allowing a direct test of the value of housebanking, and its relation to collateral, credit vol-
ume, and loan pricing.27
Panel A in Table VI provides descriptive statistics of these variables. Using the same termi-
nology as before, DELMA measures the change in the spread, DELNONCOLLAT the change
in uncovered loans (the inverse of the degree of collateralization) and DELFI the change in
the standardized credit volume. The latter two variables are called „structural variables“ in
the following discussion. The variable DELRAT depicts the change in the rating of a given
borrower. A change of a variable, e.g. a rating change (sometimes referred to as a rating
increment), is recorded when there is a numerical change between two successive observa-
27 Due to our focus on lines of credit, the maturity structure is irrelevant for the analysis.

27
tions.28 Panel A reports the number of observed changes29, the mean and the standard de-
viation of the (incremental) variables, separately for the housebank (HB) and the normal
bank (NB) subset.
Table VI
Descriptive Statistics for Changes in Structural Variables and RatingAll results are reported separately for housebank (HB) and normal bank (NB) cases.Panel A: Number of observed changes, mean, standard deviation for successive changes of spread (DELMA), inverse degree of collaterali-
zation (DELNONCOLLAT), bank’s share in total non-equity finance (DELFIN) and rating (DELRAT).Panel B: Number of observations and median rating after change occurred for rating increments. Subsamples by intensity and direction of
change: DELR1P and DELR2P are rating enhancements between two successive observations by one or at least two categories,respectively. Similarly, DELR1N and DELR2N depict rating deterioration by one or at least two categories.
Panel C: Total number and number of unidirectional (sequential) rating changes
Panel A Variations of structural variablesSubsample DELMA DELNONCOLLAT DELFIN DELRAT
n 130 153 131 53
HB mean 0,40 1,89 2,69
std. dev. 0,91 18,17 27,91
n 206 282 261 81
NHB mean 0,47 - 2,56 - 1,35
std. dev. 0,82 20,08 17,16
Panel B Rating-ChangesSubsample delr1p delr2p delr1n delr2n
HB n 20 2 28 3
medianrating
2 1,5 3 4
NHB n 29 6 35 11
medianrating
3 2 4 5
Panel C Sequential Rating Changesn 28
HB enhancement 2
worsening 7
n 35
NB enhancement 4
worsening 8
The frequency of changes in the structural variables DELMA, DELNONCOLLAT and
DELFIN is much higher than the respective frequency of the rating changes, DELRAT. The
ratio of the number of rating changes and the mean number of changes in the structural
28 For the panel regression, the chosen interval length is 6 months.

28
variables is roughly equal for housebanks and normal banks (38,4 % versus 32,4%). The
mean value of changes in the structural variables is, for all variables, close to zero and the
associated standard deviation is fairly large.
Panel B of Table VI reports the distribution of rating increments. Rating changes are classi-
fied according to intensity and direction of the change. Columns 1 and 2 depict the number
of rating upgrades (i.e. quality improvements) with an intensity of one (DELR1P) or at least
two categories (DELR2P), respectively. Similarly, DELR1N and DELR2N depict the number
of rating downgrades (i.e. quality deterioration) with an intensity of one or at least two
categories.30 In both subsamples, HB and NB, downgrading is slightly more likely than up-
grading, and increments by one class occur significantly more often than by two or more
classes. Interestingly, there are relatively more downgrades for the normal bank subsample
as compared to the housebank group (roughly 31% versus 10%).
„Median ratings“ in Panel B depict the median rating after a particular change in the rating
class. This provides some information on the distribution of the rating changes. Note that,
for each intensity and direction of the rating change, the median rating of the housebank
subsample as compared to the normal bank group is lower by one rating class. For example,
a downgrading by one category (DELR1N) results in at most a rating of 3 in 50% of the
cases for the housebank group, while for the nonhousebank group the median is a rating of
4.
The calculations underlying panel A are simple averages, they ignore the time structure and
the individual which caused the observation. This procedure implicitly assumes a kind of
Markov-property for rating increments. The occurrence of a successive, uni-directional
change could also be an indicator for a lasting fundamental change in the borrower’s qual-
ity. Thus, a large number of (positively) autocorrelated rating increments would make the
Markov-assumption questionable.
As depicted in Panel C, 63 of the total 134 observed rating changes are successive, of which
15 (6) are unidirectional deterioration (improvements) of borrower quality.
29 In a panel analysis of changes (increments; first differences) one has to distinguish between the number of observed changes and thesample size, since a zero change is a valid observation.30 See Machauer/Weber (1998) for a related study on rating dynamics.

29
In summary, the descriptive statistics of all incremental observations indicate that
• HB and NB subsamples display a fairly homogenous pattern;
• mean changes of variables are close to zero and have a large standard deviation;
• successive and unidirectional changes exists for both subsamples, HB and NB.
These observations have implications for the specification of our statistical model in that
one must carefully control for time and individual specific effects in specifying an adequate
model structure.
For example, an analysis which is based only on the changes of the structural variables con-
ditional on an observed change in the rating would not be a suitable specification. First, the
omission of a reference group „no rating change“ could yield biased results since informa-
tion on the „normal“ variation of the relevant variables is excluded. Second, the imposed
structure would not suffice because neither time effects (like sequentiality or the business-
cycle) nor individual-specific effects are controlled for.
5.2 Methodology
The main hypothesis to be tested in this section is related to the adjustment of credit avail-
ability as a key variable of financial contracting to rating increments, i.e. borrower quality
shocks. The main distinction is between housebanks and normal banks.
With reference to the preceding section, we use a panel specification for our analysis to
impose a sufficient structure on our data, because this methodology allows to control for
both time and individual specific effects explicitly. The general setting of a panel specifica-
tion takes into account all available information simultaneously, i.e. the information con-
tained in a cross section of firms that were observed over several time intervals. Else, it
utilizes the very same tool set for statistical inference, and tests of model-specification and
robustness as the standard OLS approach.31 The basic idea of a panel analysis is to pool the
cross section and time series data, but control for the observed individuals as well as for the
time dimension by a suitable dummy-structure. In contrast to our discussion of panel meth-
odology for the analysis of spread determinants, the panel approach is suitable for the analy-
31 For a brief overview, see Greene (1997). A detailed and extensive discussion of the analysis of panel data is provided by Baltagi (1995).

30
sis of credit volume, because we focus on a structural variable which is not biased by inci-
dental truncation.
As before, the variable DELFIN is a standardized measure of the credit volume, i.e. it is de-
fined as the change of the total debt amount supplied by the particular bank divided by the
amount of non-equity-financing of the firm. We use a standardized measure rather than the
absolute change in the credit volume to allow a direct comparison of the lender’s adjustment
policy across size classes of firms.32
The main explanatory variables of interest in our analysis are the dummies for the direction
and intensity of rating increments, i.e. up- or downgrades. To separate the effects of the
housebank and nonhousebank group, we use the cross product of these variables with the
housebank dummy (HBM), i.e. interaction terms. Hence, the estimated coefficients of
HBDELR1P, HBDELR2P, HBDELR1N and HBDELR2N capture the dependence of volume
change on intensity and direction of rating increments for the housebank group in terms of
deviations from the coefficients of the normal bank cases.
Our hypothesis focuses on the impact of rating increments on credit availability. Positive
and negative increments will be treated separately. First, in the context of normal bank rela-
tionships, negative rating increments (rating deterioration, negative borrower quality
shocks) will lead to a reduction of the loan volume, consistent with the idea of credit ra-
tioning. The reduction is expected to be stronger for a more intensive negative quality shock
(meaning a negative rating increment by more than one class). A housebank relationship, in
contrast, is expected to provide a type of implicit insurance with respect to the availability
of financial resources, as implied by the theoretical concept. Thus, the housebank is ex-
pected to provide additional funds if the borrower experiences a negative quality shock.
These insurance services are likely to be confined to non-distress situations. In sum, we
expect to observe negative coefficients for the variables DELR1N and DELR2N and positive
coefficients for the variables HBDELR1N and HBDELR2N, respectively. Second, if the bor-
rower’s quality is improving, the implications for the standardized credit volume are less
obvious. Indeed, we do not expect to find any systematic pattern for both the nonhousebank
and the housebank cases.

31
Two additional variables are included in our panel analysis. The variable DELAGG measures
the change in the aggregate credit supply of the German financial system, as documented by
the Deutsche Bundesbank.33 The inclusion of this aggregate variable should control for
systematic macroeconomic effects on credit supply. Again, the cross product with HBM is
used to identify housebank-specific differences. This variable is labeled HBAGG.
We conclude this section with some general remarks on the specification of our panel
model.34 Basically, three different specifications of a panel model can be chosen. The first is
a simple pooled regression model (OLS), estimating a common intercept term and slope
coefficient for all individuals in the sample. The fixed effect (FE-) model assumes that dif-
ferences across observational units can be captured in the intercept of the regression model
by specifying a separate intercept (dummy) for each individual. Alternatively, one can con-
trol for individual-related effects by specifying a random effects (RE-) model. This approach
models individual-related effects as group specific disturbances. Both specifications control
for individual-specific effects but lead to different interpretations.35 However, our analysis is
based on variables measured as first differences. Taking first differences is in fact a kind of
mean correction. Therefore, we do not expect to find significant qualitative differences in
our results by either employing a RE- or a FE-specification. From a technical perspective, a
specification test devised by Hausman (1978) gives a criterion whether the RE-model is
applicable at all. If the individual effects are correlated with the regressors, the RE-model
may suffer from inconsistent estimates due to omitted variables. Hausman’s test is, thus, a
test on orthogonality of the random effects and the regressors [Greene (1997, p. 633]. A
Hausman-test will be used to check the RE-model. Whether our specification should control
for individual-related effects in spite of using the simple OLS-model is tested by using an F-
Test for the FE-model and the appropriate Lagrange-Multiplier-test for the RE-model, re-
spectively.
5.3 Results
32 Additionally, the property of financing share to signal a bank’s status in a borrower’s financial activities was often emphasized by practi-tioners in our discussions.33 See e.g. Deutsche Bundesbank (1997).34 The following discussion is based on Baltagi (1995), pp. 9-25 and Hsiao (1983), pp. 25-65.35 See e.g. Hsiao (1983), pp. 41-43.

32
The results of our panel analysis using a RE-model are presented in Table VII. It reports the
variables, their estimated coefficients and the correspondent p-values. The bottom rows
contain the estimates of the F-test and the LM-Test, for the FE- and the RE-specification,
respectively.36
Table VII
Panel Analysis - Standardized Credit Volume and Rating ChangesAll variables are increments/first differences. Random-Effects-Model with standardized credit volume (DELFIN) as dependent variable.HBDELRxx are cross terms of housebank dummy HBM and respective dummy for rating increment intensity (1 or at least 2) and direction(P= enhancement, N= deterioration). DELAGG measures change in the aggregate level of credit supply (medium term), HBAGG is thecorrespondent cross term with housebank dummy HBM.
Variable Coefficient
Constant -0,19 (0,72)
DELR1P 2,42 (0,34)
DELR2P -5,03 (0,45)
DELR1N -1,55 (0,56)
DELR2N -20,40 *** (0,000)
HBDELR1P 4,86 (0,23)
HBDELR2P 20,88 * (0,07)
HBDELR1N 14,46 *** (0,000)
HBDELR2N 2,53 (0,78)
DELAGG -0,036 (0,62)
HBAGG -0,078 (0,53)F-Test (OLS vs FE) 0,591 (p-value 0,99)
LM-Test (OLS vs RE) 11,07 (p-value 0,001)
Hausman-Test (RE vs FE) 1,15 (p-value 0,99)
R2 = 0,053 Observations = 1079
*** = significant 1%-level ** = significant 5%-level *= significant 10%-level, p-values in parentheses
To start the discussion we focus on the effect of rating downgrades on standardized credit
volume. Consider single class rating increments first. The coefficient of the nonhousebank
variable DELR1N is negative, as predicted, but statistically not different from zero. The co-
efficient of the correspondent housebank variable, HBDELR1N, is positive and highly sig-
nificant. Its magnitude is fairly large, implying an economically important deviation from the
36 However, all results remain unchanged under a FE-specification. The inclusion of time dummies is equivalent to a two-way-error-component model. See Baltagi (1995), pp. 27, or Hsiao (1983), p. 25. The adequacy of this specification was rejected by the appropriate F-Test.

33
corresponding normal bank parameter. Now, consider large rating increments (2 or more
classes). The coefficient of DELR2N is negative and significant, consistent with credit ra-
tioning behavior by normal banks. The coefficient of the housebank variable, in contrast, is
insignificant and close to zero (though positive).
We interpret these results as evidence supporting the idea of housebanking (or relationship
lending) as a specific implicit financial commitment. First, in case of small (or temporary)
borrower quality deterioration, housebanks increase their financing share, whereas normal
banks marginally decrease their financial commitment. This observation is consistent with
models of liquidity insurance. Second, in case of larger quality deterioration, both house-
banks and normal banks reduce their credit supply by a significant proportion. The house-
bank reaction in this latter case has to be interpreted with caution, however. As the descrip-
tive statistics in Table VII reveal, the relative frequency of a large quality shocks experi-
enced in housebank relations is only one third of the corresponding number for normal
banks. This effect is not captured by our model. Second, the number of observed changes
underlying the coefficient of HBDELR2N is fairly small. Thus, the main implication so far
has been that housebanks do provide liquidity insurance for small-sized quality shocks.
Next, we discuss the effects of rating upgrades. For both, small and large quality shocks, the
coefficients for nonhousebanks (DELR1P, DELR2P) are statistically not different from zero,
their magnitude is small, and the respective sign is changing. This supports the hypothesis
that normal bank’s credit share is not systematically affected by quality improvements. The
corresponding housebank coefficient, in contrast, is positive and statistically significant at
the 10%-level. Thus, after a strong improvement of a borrower’s quality the housebank
increases its share in total firm debt significantly. This observation may be consistent with
the hypothesis of a cross-selling compensating scheme. If the quality of a given borrower
improves persistently, a housebank may be compensated for its insurance services through
an increase in its share of the borrowers total credit supply. Again, conclusions are tentative
at this stage, as the number of observations is low.
To complete our discussion, the coefficients of the variables DELAGG and HBAGG are in-
significant, both statistically and economically. This suggests that the aggregate level of
credit supply has no systematic impact on the share of credit supplied by (house-)banks to
medium sized firms.

34
6. Conclusions
The present study has carried out an empirical test of the relationship-lending hypothesis.
This hypothesis has been proposed in several recent models on the economic role of finan-
cial intermediaries. It maintains that there are information-intensive lender-borrower rela-
tions (often called housebank relations), entailing implicit insurance by the lender. Based on
superior information, the lender stands ready to support financing needs of the borrower in
situation of financial strain. Such an insurance is not costless, giving rise to specific long-
term pricing policies. In contrast, normal lender-borrower relationships do not carry such an
implicit insurance component, thus, they are more comparable to direct market transactions.
Previous empirical research on housebanking focuses on three implications of relationship
lending models: loan pricing, credit availability, and pledging of collateral. The contribution
of the present paper is fourfold: First, we use a rich credit-file data set drawn from five
leading universal banks in Germany. Second, the data set includes bank-internal borrower
ratings, allowing a direct estimation of creditworthiness or risk, as perceived by the lender.
Third, our (dichotomous) attribution of housebank and normal bank relationships is based
on direct evidence supplied by the credit department of the respective banks. Previous re-
search has separated housebank from normal bank relationships on the basis of credit dura-
tion, which is likely to be a weak, and unreliable signal of relationship quality. Fourth, this is
the first paper to study the main implication of relationship lending, i.e. the provision of
financial flexibility, in a multi-period panel analysis.
Our findings support the existence of housebank relations with specific behavioral charac-
teristics. First, using a panel methodology, we find that housebanks provide implicit liquidity
insurance in situations characterized by rating downgrades, i.e. deteriorating borrower
quality. The financing share of housebanks increases in these situations, whereas it slightly
decreases for normal banks. There is no additional effect of relationship lending on the
credit volume if the deterioration in borrower quality is large (at least two rating classes),
implying a uniform adjustment policy across types of relationships for more serious quality
shocks. Second, relying on cross-sectional regressions for each year of data, we find that
loan pricing schemes are sensitive with respect to borrower quality, as measured by bank-
35
internal ratings. Furthermore, credit margins are largely unaffected by the nature of the bor-
rower-lender relationship. Again, loan pricing is alike for housebanks and normal banks,
leaving no room for compensatory pricing strategies.
Contradicting the prevailing theoretical paradigm of exclusivity in bank debt financing, all
pieces of evidence point into one direction: In a world where borrowers do have multiple
lenders (multiple sourcing), and lenders do have multiple borrowers (financial intermedia-
tion), we find a distinct behavioral pattern for banks engaging in relationship lending, as
compared to normal banks. This supports the view that housebanks not only exist, but also
co-exist with normal bank relations. By implication, exclusivity is not a perquisite for the
emergence of long term implicit contracts. Co-existence of these two financial arrangements
may also help to limit the hold-up risks inherent in housebank relations (von Thadden
1992).
Several follow-up questions seem to be important. One concerns the nature of informational
advantages in relationship lending. Up to now the specific source of private information is
unclear. Repeated observations over time, as well as consistent quality ratings across indus-
try may prove to be important; they have to be compatible with the co-existence of many
„normal“ lenders. By the same argument, one could ask whether the default predictions37 of
housebanks are more precise, by some common standard, or whether they have more im-
pact, in the sense of more repercussions, on corrective actions taken by the management of
the borrowing firm. Since our data base consists entirely of non-listed firms, there is no
market valuation of the firm’s equity, and thus there is no direct way to measure the impact
of relationship lending decisions on firm value. One may attempt to substitute for market
values by using balance sheet and cash flow data instead.
A second follow-up topic relates to the question of housebank compensation, which is still
unresolved. Given that special data collection and monitoring efforts necessary for relation-
ship lending trigger real costs, there has to be some compensatory remuneration rendering a
housebank relation profitable. Nevertheless, we did not find significant differences in the
pricing schemes of housebanks and normal banks. Is relationship lending thus unprofitable?
We probably have to be more specific on cross-selling attributes before settling this ques-
37 For an analysis of default determinants see Ewert/Schenk (1998).

36
tion. Note that the range of activities to be included into a decent evaluation of cross-selling
within a German universal bank is significant, extending from FX-products to M&A-
transactions, and general advisory and consultancy services.
We believe these two questions are interrelated and will prove important in answering a
basic question of the theory of financial intermediation: What are the characteristics of fi-
nancial services optimally produced and exchanged on the market, and what are the char-
acteristics of those services optimally exchanged via intermediaries? The findings of the
present paper support the general idea that the provision of financial flexibility characterizes
a key element of commercial banking, allowing its survival even on competitive capital mar-
kets.

37
References
Allen, Franklin / Gale, Douglas (1995): A welfare comparison of intermediaries and finan-cial markets in Germany and the US, in: European Economic Review 39, 179-209.
Baltagi, Badi H. (1995): Econometric Analysis of Panel Data, Chichester et al.
Berger, Allen N. / Udell, Gregory F. (1990): Collateral, loan quality, and bank risks, Journalof Monetary Economics 25, 21-42.
Berger, Allen N. / Udell, Gregory F. (1992): Some evidence on the empirical significance ofcredit rationing, Journal of Political Economy 100, 1047-1077.
Berger, Allen N. / Udell, Gregory F. (1995): Relationship lending and lines of credit in smallfirm finance, Journal of Business 68, 351-381.
Berlin, Mitchell / Mester, Loretta J. (1997a): On the profitability and cost of relationshiplending, Working Paper No. 97-3, Federal Reserve Bank of Philadelphia.
Berlin, Mitchell / Mester, Loretta J. (1997b): Why is the banking sector shrinking? Coredeposits and relationship lending, Working Paper 96-18/R, Federal Reserve Bank of Phila-delphia.
Besanko, David / Thakor, Anjan V. (1987): Collateral and rationing: Sorting equilibria inmonopolistic and competitive credit markets, International Economic Review 28, 671-690.
Bester, Helmut (1985): Screening vs. Rationing in credit markets with imperfect informa-tion, American Economic Review 57, 850-855.
Bester, Helmut (1994): The role of collateral in a model of debt renegotiation, JournalMoney, Credit and Banking 26, 72-86.
Bhattacharya, Sudipto / Thakor, Anjan. V. (1993): Contemporary Banking Theory, Journalof Financial Intermediation 3, 2-50.
Billett, Matthew T. / Flannery, Mark J. / Garfinkel, Jon A. (1995): The effect of lenderidentity on a borrowing firm’s equity return, Journal of Finance 50, 699-718.
Blackwell, David W. / Winters, Drew B. (1997): Banking relationships and the effect ofmonitoring on loan pricing, Journal of Financial Research 20, 275-289.
Bolton, Patrick / Scharfstein, David S. (1996): Optimal debt structure and the number ofcreditors, Journal of Political Economy 104, 1-25.
Boot, Arnoud W. A. / Thakor, Anjan V. (1997): Can relationship banking survive compe-tition?, Discussion Paper No. 1592, Center for Economic Policy Research, London.
Boot, Arnoud W. A. /Thakor, Anjan V. (1994): Moral hazard and secured lending in aninfinitely repeated credit market game, International Economic Review 35, 899-920.

38
Brunner, Antje / Krahnen, Jan P. / Weber, Martin (in preparation): Credit ratings versusscoring model standards: A survey of five german banks, Working Paper (forthcoming),Institut für Kapitalmarktforschung - Center for Financial Studies, University of Frankfurt.
Cable, John (1985): Capital market information and industrial performance: The role ofWest German banks, Economic Journal 95, 118-132.
Deutsche Bundesbank (1996): Reaktionen der Geldmarkt- und kurzfristigen Bankzinsen aufÄnderungen der Notenbanksätze, Monatsbericht (Monthly Reports), October, 33-48.
Deutsche Bundesbank (1997): Bankenstatistik, Statistisches Beiheft zum Monatsbericht 1,several issues.
Diamond, Douglas W. (1984): Financial intermediation and delegated monitoring, Reviewof Economic Studies 51, 393 - 414.
Edwards, Jeremy / Fischer, Klaus (1994): Banks, finance and investment in Germany, Cam-bridge.
Elsas, Ralf / Henke, Sabine / Machauer, Achim / Rott, Roland / Schenk, Gerald (1997):Empirical analysis of credit relationships in small firms financing: Sampling design and de-scriptive statistics, Working Paper (forthcoming), Institut für Kapitalmarktforschung -Center for Financial Studies, University of Frankfurt.
Ewert, Ralf / Schenk, Gerald (1998): Determinants of Bank Lending Performance, WorkingPaper (forthcoming), Institut für Kapitalmarktforschung - Center for Financial Studies, Uni-versity of Frankfurt.
Fischer, Klaus (1990): Hausbankbeziehungen als Instrument der Bindung zwischen Bankenund Unternehmen: Eine theoretische und empirische Analyse, unpublished Ph.D. thesis,University of Bonn.
Gorton, Gary / Kahn, James (1996): The design of bank loan contracts, collateral and rene-gotiation, Mimeo, University of Pennsylvania.
Greenbaum, Stewart I. / Kanatas, George / Venezia, Itzhak (1989): Equilibrium loan pricingunder the bank-client relationship, Journal of Banking and Finance 13, 221-235.
Greene, William H. (1997): Econometric Analysis, 3rd Edition, New Yersey.
Hausman, J. (1978): Specification Tests in Econometrics, Econometrica 46, 1251-1271.
Hellwig, Martin (1989): Asymmetric information, financial markets, and financial institu-tions, European Economic Review 33, 277-285.
Houston, Joel / James, Christopher (1996): Banking relationships, financial constraints andinvestment: Are bank dependent borrowers more financially constrained?, Working Paper96-08, University of Florida.

39
Hsiao, Cheng (1983): Analysis of Panel Data, Econometric Society Monograph No. 11,Cambridge et al.
James, Christopher (1987): Some evidence on the uniqueness of bank loans, Journal of Fi-nancial Economics 19, 217 - 235.
Krahnen, Jan Pieter / Voßmann, Frank / Weber, Martin (1997): Evaluating Credit Rating,Working Paper (forthcoming), Institut für Kapitalmarktfoeschung - Center for FinancialStudies, University of Frankfurt.
Lummer, Scott L. / McConnel, John J. (1989): Further evidence on the bank lending proc-ess and the capital market response to bank loan agreements, Journal of Financial Econom-ics 25, 99-122.
Machauer, Achim / Weber, Martin (1998): Bank behaviour on rating categorization andrating transition, Working Paper (forthcoming), Institut für Kapitalmarktforschung - Centerfor Financial Studies, University of Frankfurt.
Mayer, Colin (1988): New issues in corporate finance, European Economic Review 32,1167-1189.
Ongena, Steven / Smith, David C. (1997): Empirical evidence on the duration of bank rela-tionships, Working Paper 97-15, Wharton School, University of Pennsylvania.
Petersen, Mitchell A. / Rajan, Raghuram G. (1994): The benefits of lending relationships:Evidence from small business data, Journal of Finance 49, 3-37.
Petersen, Mitchell A. / Rajan, Raghuram G. (1995): The effect of credit market competitionon lending relationships, Quarterly Journal of Economics, 407-443.
Preece, Dianna / Mullineaux, Donald J. (1996): Monitoring, loan renegotiability, and firmvalue: The role of lending syndicates, Journal of Banking and Finance 20, 577-593.
Rajan, Raghuram G. (1992): Insiders and outsiders: The choice between relationship andarmslength debt, Journal of Finance 47, 1367-1400.
Rott, Roland (1997): Empirische Aspekte von Hausbankbeziehungen, unpublished diplomathesis, Institut für Kapitalmarktforschung-Center for Financial Studies, University ofFrankfurt.
Sharpe, Stephen A. (1990): Asymmetric information , bank lending, and implicit contracts:A stylized model of customer relationships, Journal of Finance 45, 1069-1087.
Stiglitz Jospeh. E. / Weiss, Andrew (1981): Credit rationing in markets with incompleteinformation, American Economic Review 71, 393-410.
von Thadden, Ernst-Ludwig (1992): The commitment of finance, duplicated monitoring, anthe investment horizon, Mimeo, University of Basel.

40
Thakor, Anjan V. (1995): Financial intermediation and the market for credit, in: Jarrow,R.et al. (Eds.), Handbooks in OR and MS, Vol. 9, 1073-1103.
Tilly, Reinhard H. (1989): Banking institutions in historical and comparative perspective:Germany, Great Britain and the United States in the nineteenth and early twentieth century,Journal of Institutional and Theoretical Economics 145, 189-209
Related Documents