Is Conservation Agriculture a Solution to Dry Land Rain-fed Farming? Experiences and Perceptions of Smallholder Farmers in Laikipia District, Kenya Daniel Mwangangi Kinyumu* Ministry of Agriculture, Laikipia District, P.O. Box 1655, 10400, Nanyuki, Kenya To improve crop production and soil moisture available to crops in dryland rain-fed conditions, such as those in Laikipia District, Kenya, land management practices that minimize soil structure damage, improve soil organic matter content, and extend the duration of soil moisture to crops must be embraced by farmers. Rainfall is inadequate in this region, and most smallholder farmers till land continuously for long periods, leading to depleted soils that are easily eroded. Conservation agriculture (CA), which incorporates the benefits of soil and water conservation, could offer a solution to these farmers. This study evaluated farmers’ perceptions of and experiences with CA adoption. Pretested questionnaires were administered to 50 smallholder farmers practicing both CA and conventional farming (CF). Basic data on farmers’ gender, age, education, duration of CA practice, and factors that affected their adoption of CA were obtained. Farm yield data for maize (Zea mays L.) and beans (Phaseolus vulgaris L.) from 10 smallholder farms cul- tivated under CF and CA were compared during the 2010, 2011, and 2012 rainy seasons. In-depth focus discussions were held to clarify farmers’ responses. The results of the yield comparison showed that grain yield for both crops doubled under CA as compared to CF. This substantial increase in yield could dramatically improve household food security. Despite the benefits of CA and deliberate efforts by the Ministry of Agriculture and stakeholders to promote CA in the district, the adoption rate among smallholder farmers is still low. This study found that, among other factors, lack of tools or equipment and a lack of technical extension staff for CA contributed to its low adoption rate. Because CA can offer increased yield, while also contributing to sustainable agriculture and environmental con- servation, CA will remain a viable option for farmers in the district. Key words: Conservation agriculture, Crop production, Land management practices, Duration of soil moisture, Sus- tainable agriculture ─────────────────────── Introduction General overview Increasing farm productivity has gained renewed emphasis from international development organiza- tions since the 2007-2008 food crisis. Africa lags behind compared with global agricultural productivity, and there is long-standing food insecurity across the continent (World Bank, 2008). The Kenya National Vision 2030 identified agriculture as one of the six key economic sectors expected to drive the economy to a projected 10% growth annually over the next two dec- ades (Government of Kenya, 2004). Biophysical and farming conditions in Laikipia District The Laikipia District of Kenya covers 972,000 ha, extending from the northeastern foot of the Aberdares to the western foot of Mt. Kenya and lying about 200 km north of Nairobi. The influence of Mt. Kenya produces a steep ecological gradient on the plateau, giving rise to several elevation-related agroecological zones ranging from subhumid (agroecological zone IV) to semi-arid (agroecological zones V and VI; Journal of Developments in Sustainable Agriculture 7: 134-147 ( 2012) Received: September 1, 2012, Accepted: November 30, 2012 * Corresponding author: Daniel M. Kinyumu, P.O. Box 6, 60300 Isiolo, Kenya. Tel: +254 726726638 or +254 734252056, E-mail: [email protected]

Welcome message from author
This document is posted to help you gain knowledge. Please leave a comment to let me know what you think about it! Share it to your friends and learn new things together.
Transcript
Is Conservation Agriculture a Solution to Dry Land Rain-fed
Farming? Experiences and Perceptions of Smallholder
Farmers in Laikipia District, Kenya
Daniel Mwangangi Kinyumu*
Ministry of Agriculture, Laikipia District, P.O. Box 1655, 10400, Nanyuki, Kenya
To improve crop production and soil moisture available to crops in dryland rain-fed conditions, such as those in
Laikipia District, Kenya, land management practices that minimize soil structure damage, improve soil organic matter
content, and extend the duration of soil moisture to crops must be embraced by farmers. Rainfall is inadequate in this
region, and most smallholder farmers till land continuously for long periods, leading to depleted soils that are easily
eroded. Conservation agriculture (CA), which incorporates the benefits of soil and water conservation, could offer a
solution to these farmers. This study evaluated farmers’ perceptions of and experiences with CA adoption. Pretested
questionnaires were administered to 50 smallholder farmers practicing both CA and conventional farming (CF). Basic
data on farmers’ gender, age, education, duration of CA practice, and factors that affected their adoption of CA were
obtained. Farm yield data for maize (Zea mays L.) and beans (Phaseolus vulgaris L.) from 10 smallholder farms cul-
tivated under CF and CA were compared during the 2010, 2011, and 2012 rainy seasons. In-depth focus discussions
were held to clarify farmers’ responses. The results of the yield comparison showed that grain yield for both crops
doubled under CA as compared to CF. This substantial increase in yield could dramatically improve household food
security. Despite the benefits of CA and deliberate efforts by the Ministry of Agriculture and stakeholders to promote
CA in the district, the adoption rate among smallholder farmers is still low. This study found that, among other
factors, lack of tools or equipment and a lack of technical extension staff for CA contributed to its low adoption rate.
Because CA can offer increased yield, while also contributing to sustainable agriculture and environmental con-
servation, CA will remain a viable option for farmers in the district.
Key words: Conservation agriculture, Crop production, Land management practices, Duration of soil moisture, Sus-
tainable agriculture
───────────────────────
Introduction
General overview
Increasing farm productivity has gained renewed
emphasis from international development organiza-
tions since the 2007-2008 food crisis. Africa lags
behind compared with global agricultural productivity,
and there is long-standing food insecurity across the
continent (World Bank, 2008). The Kenya National
Vision 2030 identified agriculture as one of the six key
economic sectors expected to drive the economy to a
projected 10% growth annually over the next two dec-
ades (Government of Kenya, 2004).
Biophysical and farming conditions in Laikipia
District
The Laikipia District of Kenya covers 972,000 ha,
extending from the northeastern foot of the Aberdares
to the western foot of Mt. Kenya and lying about 200
km north of Nairobi. The influence of Mt. Kenya
produces a steep ecological gradient on the plateau,
giving rise to several elevation-related agroecological
zones ranging from subhumid (agroecological zone
IV) to semi-arid (agroecological zones V and VI;
Journal of Developments in Sustainable Agriculture 7: 134-147 ( 2012)
Received: September 1, 2012, Accepted: November 30, 2012
*Corresponding author: Daniel M. Kinyumu, P.O. Box 6, 60300 Isiolo, Kenya.
Tel: +254 726726638 or +254 734252056, E-mail: [email protected]
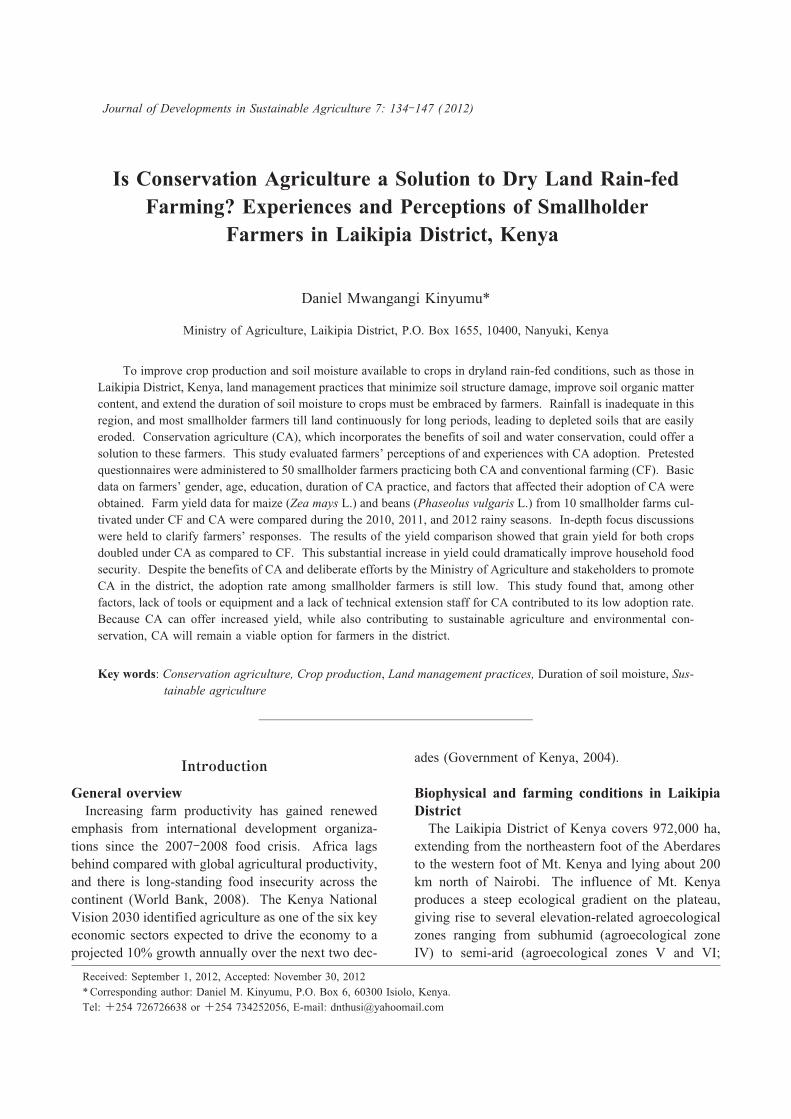
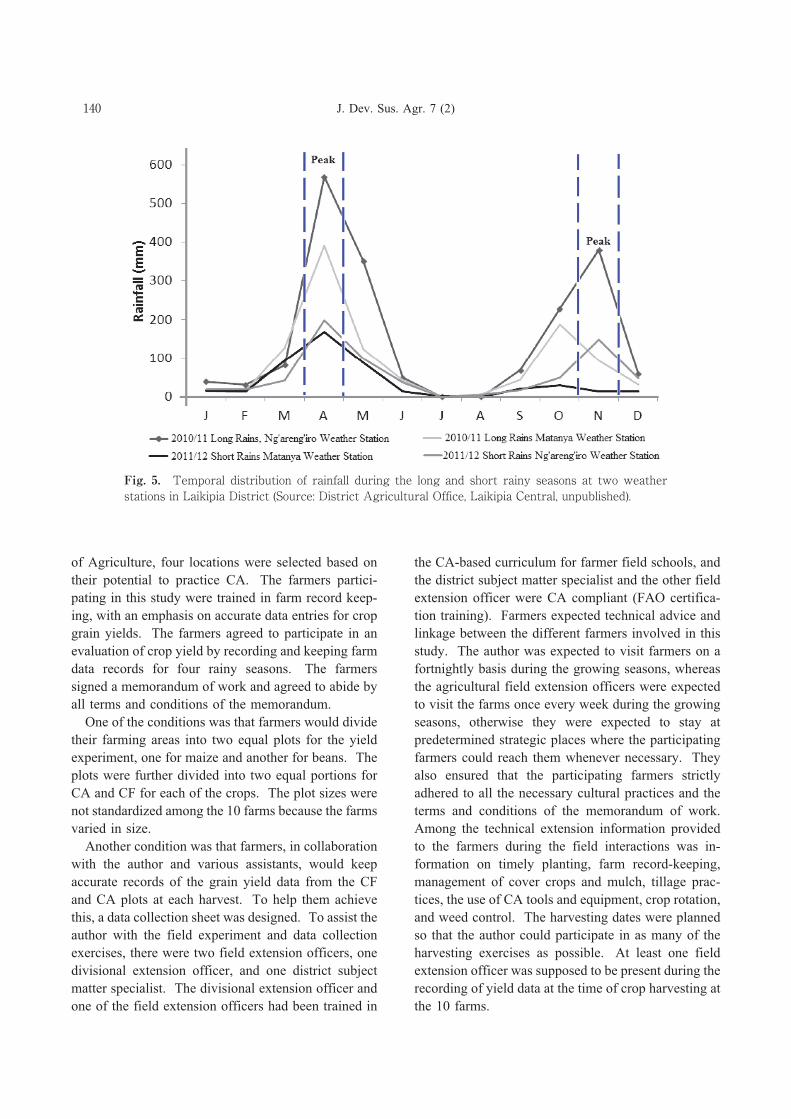
Jaetzold and Schmidt, 1983). The district has a
bimodal rainfall pattern, with peak rainfall in April and
October. Temperatures are relatively low, with mean
annual temperatures ranging from about 18 to 20℃
(Jaetzold and Schmidt, 1983). The rainfall distri-
bution in the Laikipia District is such that the south-
western part and some parts of the southeast receive
more rainfall than the northern part (Fig. 1)
The farming system in Laikipia is largely conven-
tional, involving plowing, harrowing, planting, and
weeding. Harvested crop residue is collected and
stored for livestock because pasture is in short supply
(Kaumbutho and Kienzle, 2007). Rain-fed dryland
subsistence farming is the main source of livelihood
for most households in the district. In recent years,
this livelihood strategy has been affected by climate
change, prevalent droughts, and seasonality of the rains
(C4D, 2010).
A lack of rainfall in Laikipia has led to crop failure,
low farm crop yield, and low household incomes. This
problem is compounded by the fact that over the years
farmers have used cultural practices that expose soils
to dry weather conditions, leading to great loss of
moisture (Kaumbutho and Kienzle, 2007). The con-
cept of conservation tillage aggregates a number of soil
and water management and conservation practices
under a single banner for delivery to farmers (Garcia-
Torres et al., 2003; Knowler and Bradshaw, 2007). A
lack of quality farm inputs and soil infertility have led
to low crop yield (Kiteme et al., 1998). The adoption
of sustainable agricultural practices was identified in a
government strategy paper on revitalizing agriculture
as a lasting solution to food insecurity in the arid and
semi-arid regions of the country (Government of
Kenya, 2004).
Conventional farming versus conservation agri-
culture
Conventional farming (CF) is defined as farming
approaches that have been used over a long period of
Kinyumu: Conservation Agriculture: a Solution to Rain-fed Farming in Kenya? 135
Fig. 1. Rainfall distribution pattern across Laikipia District (Source: District Surveyor, Laikipia).
time. CF is characterized by large capital investments;
monocropping; use of hybrid crops; extensive use of
pesticides, fertilizers, and external energy inputs; and
high labor efficiency (Gold, 2012).
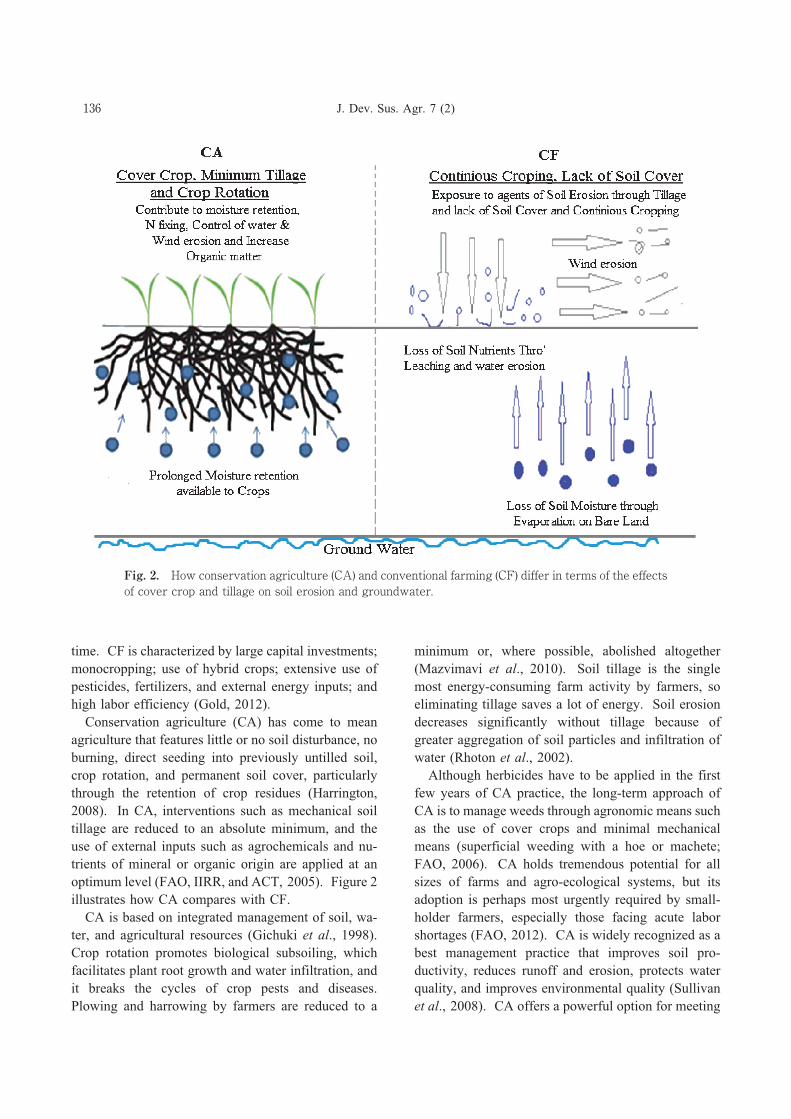
Conservation agriculture (CA) has come to mean
agriculture that features little or no soil disturbance, no
burning, direct seeding into previously untilled soil,
crop rotation, and permanent soil cover, particularly
through the retention of crop residues (Harrington,
2008). In CA, interventions such as mechanical soil
tillage are reduced to an absolute minimum, and the
use of external inputs such as agrochemicals and nu-
trients of mineral or organic origin are applied at an
optimum level (FAO, IIRR, and ACT, 2005). Figure 2
illustrates how CA compares with CF.
CA is based on integrated management of soil, wa-
ter, and agricultural resources (Gichuki et al., 1998).
Crop rotation promotes biological subsoiling, which
facilitates plant root growth and water infiltration, and
it breaks the cycles of crop pests and diseases.
Plowing and harrowing by farmers are reduced to a
minimum or, where possible, abolished altogether
(Mazvimavi et al., 2010). Soil tillage is the single
most energy-consuming farm activity by farmers, so
eliminating tillage saves a lot of energy. Soil erosion
decreases significantly without tillage because of
greater aggregation of soil particles and infiltration of
water (Rhoton et al., 2002).
Although herbicides have to be applied in the first
few years of CA practice, the long-term approach of
CA is to manage weeds through agronomic means such
as the use of cover crops and minimal mechanical
means (superficial weeding with a hoe or machete;
FAO, 2006). CA holds tremendous potential for all
sizes of farms and agro-ecological systems, but its
adoption is perhaps most urgently required by small-
holder farmers, especially those facing acute labor
shortages (FAO, 2012). CA is widely recognized as a
best management practice that improves soil pro-
ductivity, reduces runoff and erosion, protects water
quality, and improves environmental quality (Sullivan
et al., 2008). CA offers a powerful option for meeting
J. Dev. Sus. Agr. 7 (2)136
Fig. 2. How conservation agriculture (CA) and conventional farming (CF) differ in terms of the effects
of cover crop and tillage on soil erosion and groundwater.
future food demand by improving crop production
levels, while conserving resources and protecting the
environment (Huho et al., 2012).
Stages of CA development
Before analyzing the actual farm benefits of CA, it is
important that farmers understand the transition from
CF to CA, which is a gradual process that can be
divided into four theoretical phases (Fig. 3) (FAO,
2004).
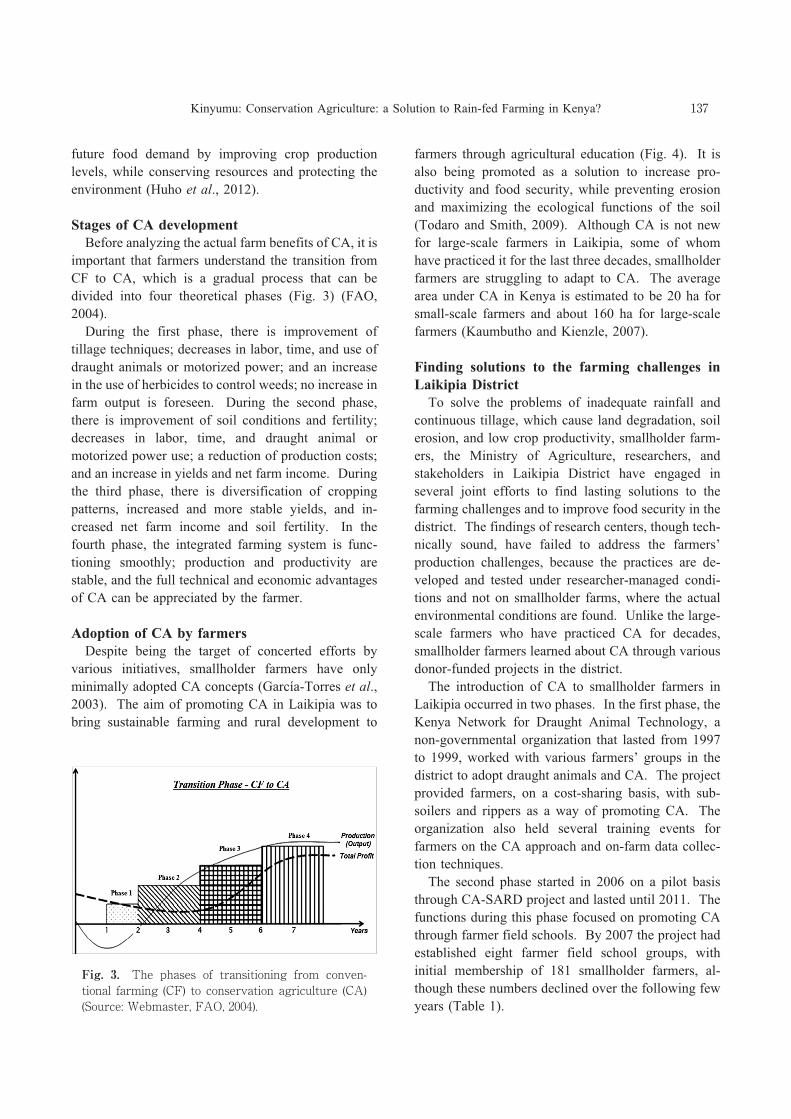
During the first phase, there is improvement of
tillage techniques; decreases in labor, time, and use of
draught animals or motorized power; and an increase
in the use of herbicides to control weeds; no increase in
farm output is foreseen. During the second phase,
there is improvement of soil conditions and fertility;
decreases in labor, time, and draught animal or
motorized power use; a reduction of production costs;
and an increase in yields and net farm income. During
the third phase, there is diversification of cropping
patterns, increased and more stable yields, and in-
creased net farm income and soil fertility. In the
fourth phase, the integrated farming system is func-
tioning smoothly; production and productivity are
stable, and the full technical and economic advantages
of CA can be appreciated by the farmer.
Adoption of CA by farmers
Despite being the target of concerted efforts by
various initiatives, smallholder farmers have only
minimally adopted CA concepts (García-Torres et al.,
2003). The aim of promoting CA in Laikipia was to
bring sustainable farming and rural development to
farmers through agricultural education (Fig. 4). It is
also being promoted as a solution to increase pro-
ductivity and food security, while preventing erosion
and maximizing the ecological functions of the soil
(Todaro and Smith, 2009). Although CA is not new
for large-scale farmers in Laikipia, some of whom
have practiced it for the last three decades, smallholder
farmers are struggling to adapt to CA. The average
area under CA in Kenya is estimated to be 20 ha for
small-scale farmers and about 160 ha for large-scale
farmers (Kaumbutho and Kienzle, 2007).
Finding solutions to the farming challenges in
Laikipia District
To solve the problems of inadequate rainfall and
continuous tillage, which cause land degradation, soil
erosion, and low crop productivity, smallholder farm-
ers, the Ministry of Agriculture, researchers, and
stakeholders in Laikipia District have engaged in
several joint efforts to find lasting solutions to the
farming challenges and to improve food security in the
district. The findings of research centers, though tech-
nically sound, have failed to address the farmers’
production challenges, because the practices are de-
veloped and tested under researcher-managed condi-
tions and not on smallholder farms, where the actual
environmental conditions are found. Unlike the large-
scale farmers who have practiced CA for decades,
smallholder farmers learned about CA through various
donor-funded projects in the district.
The introduction of CA to smallholder farmers in
Laikipia occurred in two phases. In the first phase, the
Kenya Network for Draught Animal Technology, a
non-governmental organization that lasted from 1997
to 1999, worked with various farmers’ groups in the
district to adopt draught animals and CA. The project
provided farmers, on a cost-sharing basis, with sub-
soilers and rippers as a way of promoting CA. The
organization also held several training events for
farmers on the CA approach and on-farm data collec-
tion techniques.
The second phase started in 2006 on a pilot basis
through CA-SARD project and lasted until 2011. The
functions during this phase focused on promoting CA
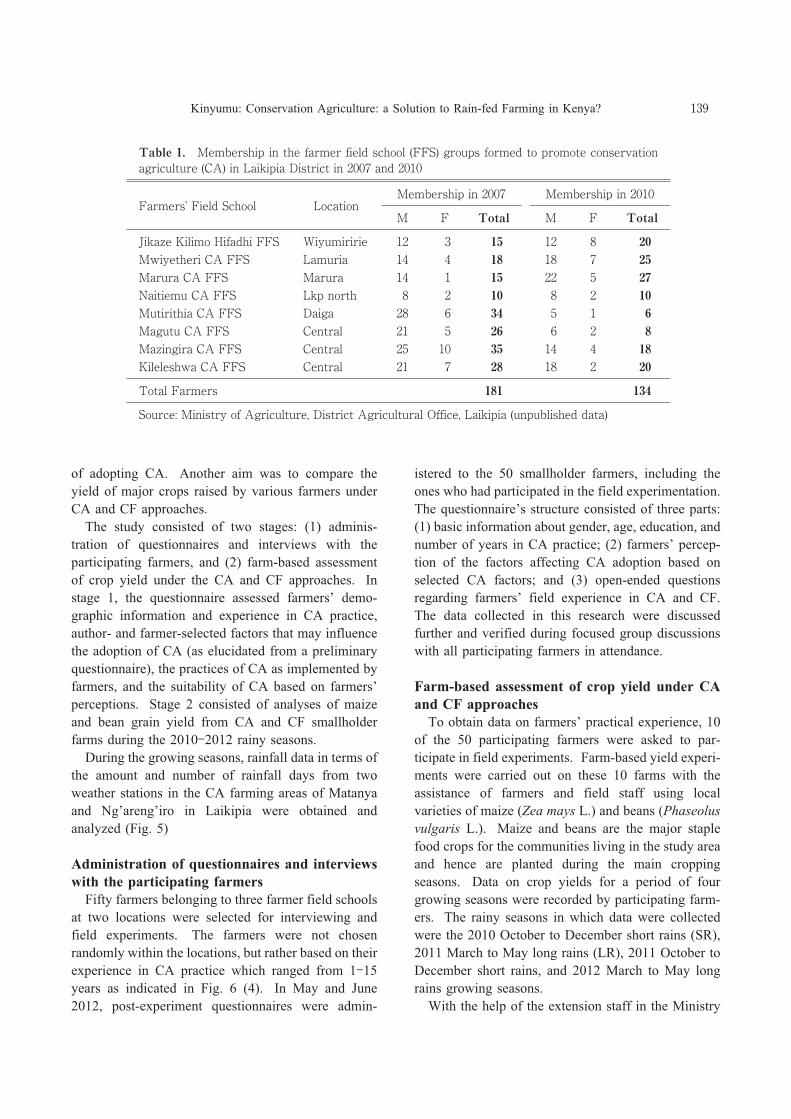
through farmer field schools. By 2007 the project had
established eight farmer field school groups, with
initial membership of 181 smallholder farmers, al-
though these numbers declined over the following few
years (Table 1).
Kinyumu: Conservation Agriculture: a Solution to Rain-fed Farming in Kenya? 137
Fig. 3. The phases of transitioning from conven-
tional farming (CF) to conservation agriculture (CA)
(Source: Webmaster, FAO, 2004).
The declining membership was found to be related
to the abandonment of CA practices by farmers
(District Agricultural Office, unpublished data). Un-
like other projects, CA-SARD engaged various stake-
holders such as policymakers and suppliers of farm
inputs, equipment, livestock, and machines. The goal
of introducing CA in the district was to encourage
alternative farming approaches that could improve
crop yields and resilience against drought, while pro-
tecting and stimulating the biological function of the
soil. Before the introduction of CA techniques in the
district, intensive cultivation resulted in the develop-
ment of hard pans that hindered plant root growth and
water infiltration into the soil. Subsequent introduc-
tion of crop rotation practices under CA promoted
biological subsoiling, which saved farmers the cost of
hiring laborers or using mechanical means. Such crop
rotation also helped in breaking crop pest and disease
cycles.
Few studies have examined farmers’ experiences
and perceptions in the adoption of the CA approach.
Crop yields in Laikipia are very low, even in good
years, and there is never enough to guarantee farmers
sufficient food and income for one growing season.
This means that farmers must put in place strategies
and practices that increase household food security or
they will be forced to perform off-farm work to
supplement farm income.
Materials and Methods
The purpose of this study was to establish in quan-
titative and qualitative terms the farmers’ perceptions
and experiences of adopting CA over CF and to ex-
amine whether farmers were positive about the benefits
J. Dev. Sus. Agr. 7 (2)138
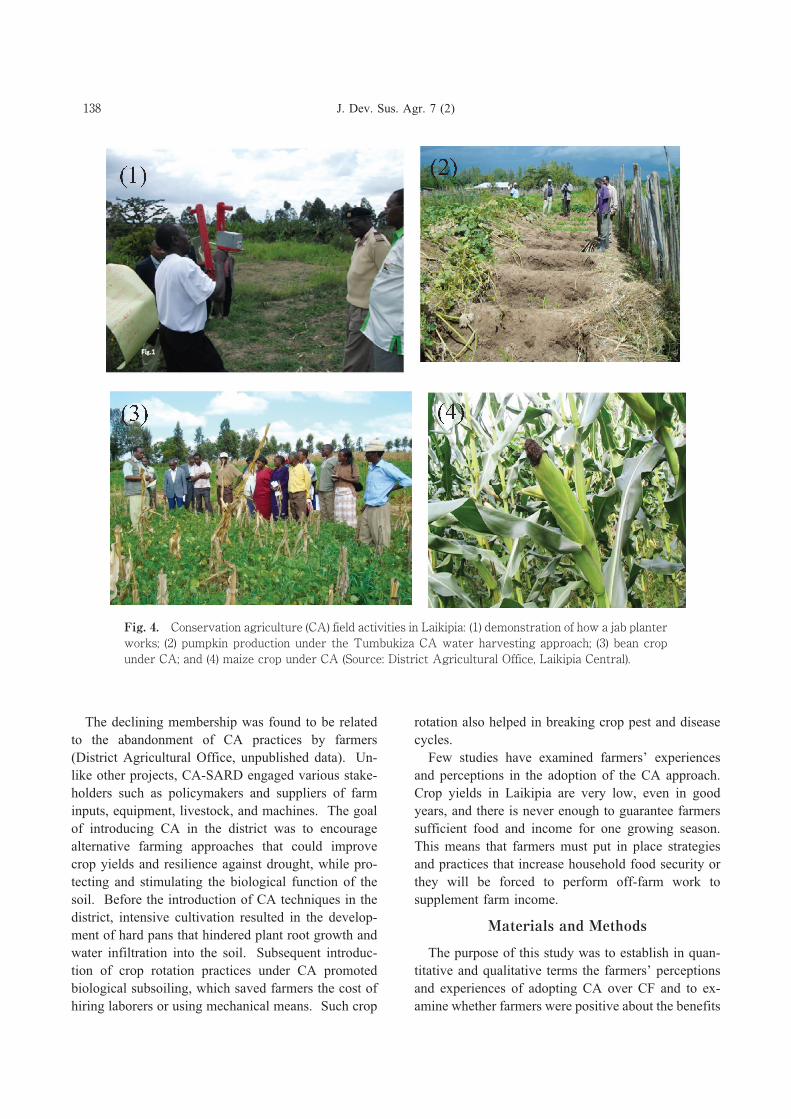
Fig. 4. Conservation agriculture (CA) field activities in Laikipia: (1) demonstration of how a jab planter
works; (2) pumpkin production under the Tumbukiza CA water harvesting approach; (3) bean crop
under CA; and (4) maize crop under CA (Source: District Agricultural Office, Laikipia Central).
of adopting CA. Another aim was to compare the
yield of major crops raised by various farmers under
CA and CF approaches.
The study consisted of two stages: (1) adminis-
tration of questionnaires and interviews with the
participating farmers, and (2) farm-based assessment
of crop yield under the CA and CF approaches. In
stage 1, the questionnaire assessed farmers’ demo-
graphic information and experience in CA practice,
author- and farmer-selected factors that may influence
the adoption of CA (as elucidated from a preliminary
questionnaire), the practices of CA as implemented by
farmers, and the suitability of CA based on farmers’
perceptions. Stage 2 consisted of analyses of maize
and bean grain yield from CA and CF smallholder
farms during the 2010-2012 rainy seasons.
During the growing seasons, rainfall data in terms of
the amount and number of rainfall days from two
weather stations in the CA farming areas of Matanya
and Ng’areng’iro in Laikipia were obtained and
analyzed (Fig. 5)
Administration of questionnaires and interviews
with the participating farmers
Fifty farmers belonging to three farmer field schools
at two locations were selected for interviewing and
field experiments. The farmers were not chosen
randomly within the locations, but rather based on their
experience in CA practice which ranged from 1-15
years as indicated in Fig. 6 (4). In May and June
2012, post-experiment questionnaires were admin-
istered to the 50 smallholder farmers, including the
ones who had participated in the field experimentation.
The questionnaire’s structure consisted of three parts:
(1) basic information about gender, age, education, and
number of years in CA practice; (2) farmers’ percep-
tion of the factors affecting CA adoption based on
selected CA factors; and (3) open-ended questions
regarding farmers’ field experience in CA and CF.
The data collected in this research were discussed
further and verified during focused group discussions
with all participating farmers in attendance.
Farm-based assessment of crop yield under CA
and CF approaches
To obtain data on farmers’ practical experience, 10
of the 50 participating farmers were asked to par-
ticipate in field experiments. Farm-based yield experi-
ments were carried out on these 10 farms with the
assistance of farmers and field staff using local
varieties of maize (Zea mays L.) and beans (Phaseolus
vulgaris L.). Maize and beans are the major staple
food crops for the communities living in the study area
and hence are planted during the main cropping
seasons. Data on crop yields for a period of four
growing seasons were recorded by participating farm-
ers. The rainy seasons in which data were collected
were the 2010 October to December short rains (SR),
2011 March to May long rains (LR), 2011 October to
December short rains, and 2012 March to May long
rains growing seasons.
With the help of the extension staff in the Ministry
Kinyumu: Conservation Agriculture: a Solution to Rain-fed Farming in Kenya? 139
815WiyumiririeJikaze Kilimo Hifadhi FFS
Source: Ministry of Agriculture, District Agricultural Office, Laikipia (unpublished data)
FLocation
Total Farmers
12
Farmers’ Field School
Table 1. Membership in the farmer field school (FFS) groups formed to promote conservation
agriculture (CA) in Laikipia District in 2007 and 2010
FM
3
181
12
Membership in 2010
414LamuriaMwiyetheri CA FFS
52215114MaruraMarura CA FFS
Membership in 2007
MTotal
28721CentralKileleshwa CA FFS
134
27
25
20
Total
71818
521CentralMagutu CA FFS
18414351025CentralMazingira CA FFS
20218
Lkp northNaitiemu CA FFS
61534628DaigaMutirithia CA FFS
82626
10281028
of Agriculture, four locations were selected based on
their potential to practice CA. The farmers partici-
pating in this study were trained in farm record keep-
ing, with an emphasis on accurate data entries for crop
grain yields. The farmers agreed to participate in an
evaluation of crop yield by recording and keeping farm
data records for four rainy seasons. The farmers
signed a memorandum of work and agreed to abide by
all terms and conditions of the memorandum.
One of the conditions was that farmers would divide
their farming areas into two equal plots for the yield
experiment, one for maize and another for beans. The
plots were further divided into two equal portions for
CA and CF for each of the crops. The plot sizes were
not standardized among the 10 farms because the farms
varied in size.
Another condition was that farmers, in collaboration
with the author and various assistants, would keep
accurate records of the grain yield data from the CF
and CA plots at each harvest. To help them achieve
this, a data collection sheet was designed. To assist the
author with the field experiment and data collection
exercises, there were two field extension officers, one
divisional extension officer, and one district subject
matter specialist. The divisional extension officer and
one of the field extension officers had been trained in
the CA-based curriculum for farmer field schools, and
the district subject matter specialist and the other field
extension officer were CA compliant (FAO certifica-
tion training). Farmers expected technical advice and
linkage between the different farmers involved in this
study. The author was expected to visit farmers on a
fortnightly basis during the growing seasons, whereas
the agricultural field extension officers were expected
to visit the farms once every week during the growing
seasons, otherwise they were expected to stay at
predetermined strategic places where the participating
farmers could reach them whenever necessary. They
also ensured that the participating farmers strictly
adhered to all the necessary cultural practices and the
terms and conditions of the memorandum of work.
Among the technical extension information provided
to the farmers during the field interactions was in-
formation on timely planting, farm record-keeping,
management of cover crops and mulch, tillage prac-
tices, the use of CA tools and equipment, crop rotation,
and weed control. The harvesting dates were planned
so that the author could participate in as many of the
harvesting exercises as possible. At least one field
extension officer was supposed to be present during the
recording of yield data at the time of crop harvesting at
the 10 farms.
J. Dev. Sus. Agr. 7 (2)140
Fig. 5. Temporal distribution of rainfall during the long and short rainy seasons at two weather
stations in Laikipia District (Source: District Agricultural Office, Laikipia Central, unpublished).
Daniel’s XL Toolbox a free, open-source add-in for
Microsoft Excel®was used to analyze and present the
quantitative and qualitative data generated in this
study.
Results and Discussion
Administration of questionnaires and interviews
with the participating farmers
Farmers’ basic information and experience in CA prac-
tice
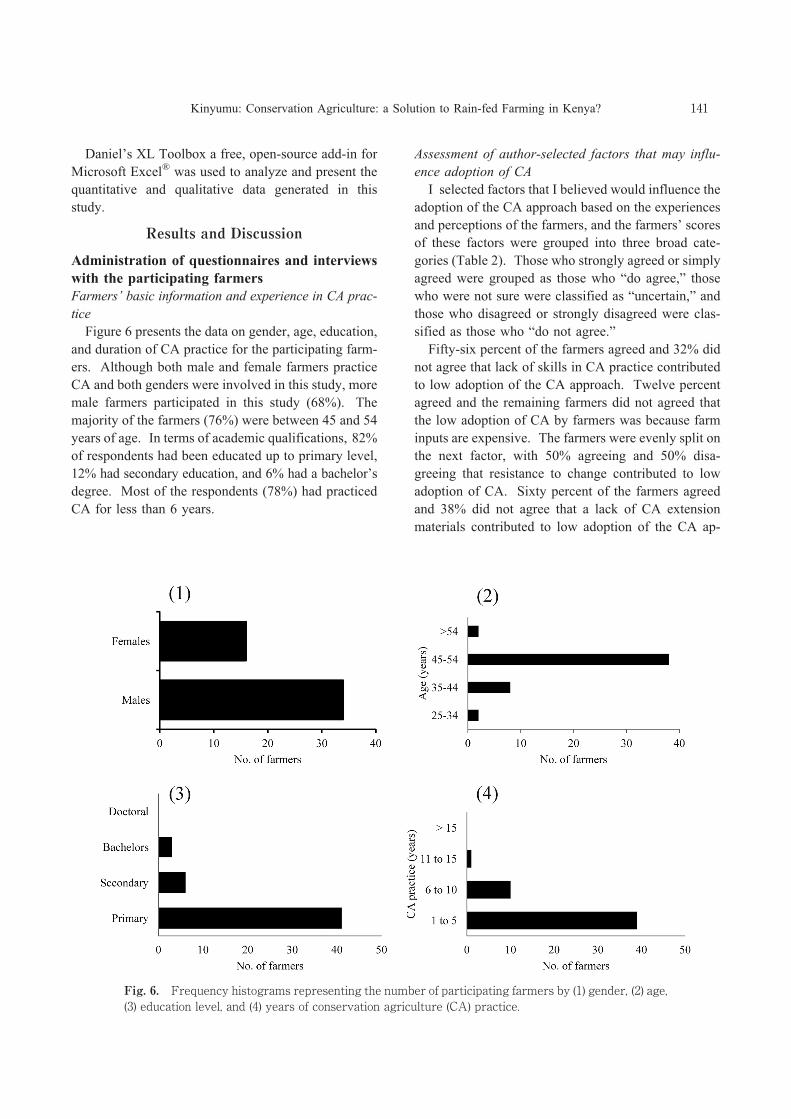
Figure 6 presents the data on gender, age, education,
and duration of CA practice for the participating farm-
ers. Although both male and female farmers practice
CA and both genders were involved in this study, more
male farmers participated in this study (68%). The
majority of the farmers (76%) were between 45 and 54
years of age. In terms of academic qualifications, 82%
of respondents had been educated up to primary level,
12% had secondary education, and 6% had a bachelor’s
degree. Most of the respondents (78%) had practiced
CA for less than 6 years.
Assessment of author-selected factors that may influ-
ence adoption of CA
I selected factors that I believed would influence the
adoption of the CA approach based on the experiences
and perceptions of the farmers, and the farmers’ scores
of these factors were grouped into three broad cate-
gories (Table 2). Those who strongly agreed or simply
agreed were grouped as those who “do agree,” those
who were not sure were classified as “uncertain,” and
those who disagreed or strongly disagreed were clas-
sified as those who “do not agree.”
Fifty-six percent of the farmers agreed and 32% did
not agree that lack of skills in CA practice contributed
to low adoption of the CA approach. Twelve percent
agreed and the remaining farmers did not agreed that
the low adoption of CA by farmers was because farm
inputs are expensive. The farmers were evenly split on
the next factor, with 50% agreeing and 50% disa-
greeing that resistance to change contributed to low
adoption of CA. Sixty percent of the farmers agreed
and 38% did not agree that a lack of CA extension
materials contributed to low adoption of the CA ap-
Kinyumu: Conservation Agriculture: a Solution to Rain-fed Farming in Kenya? 141
Fig. 6. Frequency histograms representing the number of participating farmers by (1) gender, (2) age,
(3) education level, and (4) years of conservation agriculture (CA) practice.
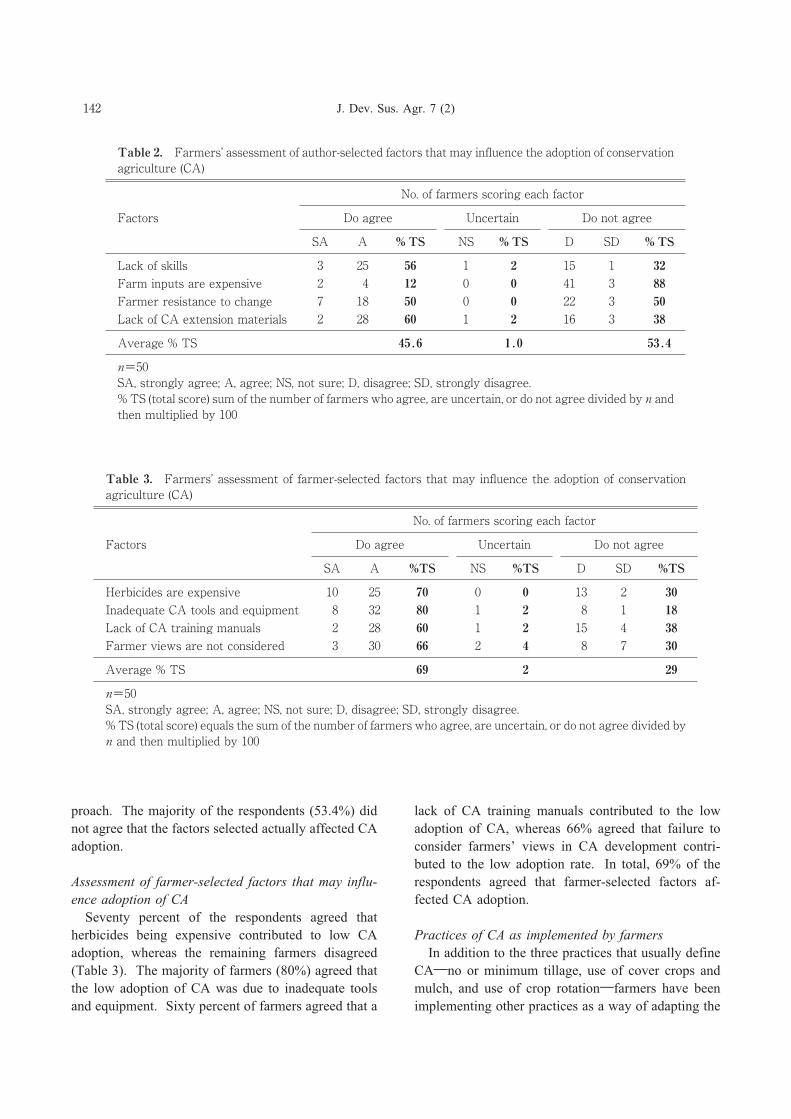
proach. The majority of the respondents (53.4%) did
not agree that the factors selected actually affected CA
adoption.
Assessment of farmer-selected factors that may influ-
ence adoption of CA
Seventy percent of the respondents agreed that
herbicides being expensive contributed to low CA
adoption, whereas the remaining farmers disagreed
(Table 3). The majority of farmers (80%) agreed that
the low adoption of CA was due to inadequate tools
and equipment. Sixty percent of farmers agreed that a
lack of CA training manuals contributed to the low
adoption of CA, whereas 66% agreed that failure to
consider farmers’ views in CA development contri-
buted to the low adoption rate. In total, 69% of the
respondents agreed that farmer-selected factors af-
fected CA adoption.
Practices of CA as implemented by farmers
In addition to the three practices that usually define
CA―no or minimum tillage, use of cover crops and
mulch, and use of crop rotation―farmers have been
implementing other practices as a way of adapting the
J. Dev. Sus. Agr. 7 (2)142
113Lack of skills
n=50
SA, strongly agree; A, agree; NS, not sure; D, disagree; SD, strongly disagree.
% TS (total score) sum of the number of farmers who agree, are uncertain, or do not agree divided by n and
then multiplied by 100
No. of farmers scoring each factor
Average % TS
Factors
Table 2. Farmers’ assessment of author-selected factors that may influence the adoption of conservation
agriculture (CA)
Do agree
1.045.6
25625
1242Farm inputs are expensive
30050187Farmer resistance to change
Uncertain
60282Lack of CA extension materials
SD%TSNS%TSASA
300
321 16
5022
8841
3215
%TSD
Do not agree
53.4
38
2010Herbicides are expensive
n=50
SA, strongly agree; A, agree; NS, not sure; D, disagree; SD, strongly disagree.
% TS (total score) equals the sum of the number of farmers who agree, are uncertain, or do not agree divided by
n and then multiplied by 100
No. of farmers scoring each factor
Average % TS
Factors
Table 3. Farmers’ assessment of farmer-selected factors that may influence the adoption of conservation
agriculture (CA)
Do agree
269
07025
80328Inadequate CA tools and equipment
42160282Lack of CA training manuals
Uncertain
66303Farmer views are not considered
SD%TSNS%TSASA
121
742 8
3815
188
3013
%TSD
Do not agree
29
30
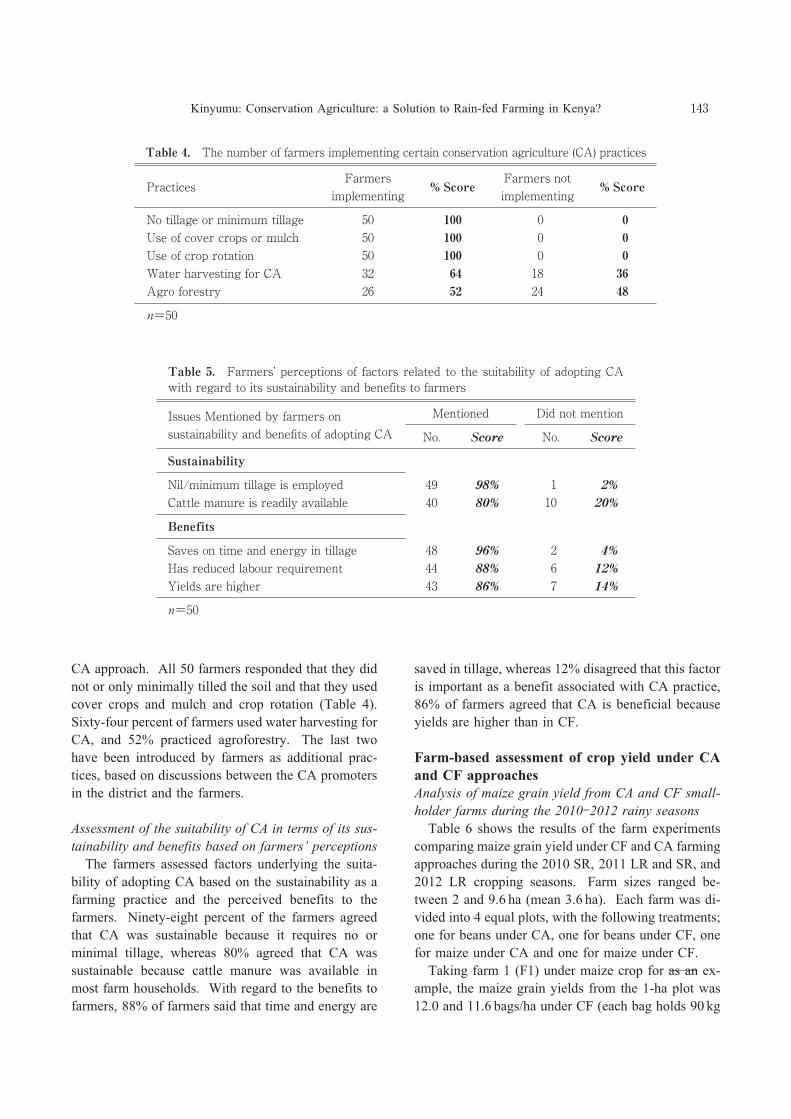
CA approach. All 50 farmers responded that they did
not or only minimally tilled the soil and that they used
cover crops and mulch and crop rotation (Table 4).
Sixty-four percent of farmers used water harvesting for
CA, and 52% practiced agroforestry. The last two
have been introduced by farmers as additional prac-
tices, based on discussions between the CA promoters
in the district and the farmers.
Assessment of the suitability of CA in terms of its sus-
tainability and benefits based on farmers’ perceptions
The farmers assessed factors underlying the suita-
bility of adopting CA based on the sustainability as a
farming practice and the perceived benefits to the
farmers. Ninety-eight percent of the farmers agreed
that CA was sustainable because it requires no or
minimal tillage, whereas 80% agreed that CA was
sustainable because cattle manure was available in
most farm households. With regard to the benefits to
farmers, 88% of farmers said that time and energy are
saved in tillage, whereas 12% disagreed that this factor
is important as a benefit associated with CA practice,
86% of farmers agreed that CA is beneficial because
yields are higher than in CF.
Farm-based assessment of crop yield under CA
and CF approaches
Analysis of maize grain yield from CA and CF small-
holder farms during the 2010-2012 rainy seasons
Table 6 shows the results of the farm experiments
comparing maize grain yield under CF and CA farming
approaches during the 2010 SR, 2011 LR and SR, and
2012 LR cropping seasons. Farm sizes ranged be-
tween 2 and 9.6 ha (mean 3.6 ha). Each farm was di-
vided into 4 equal plots, with the following treatments;
one for beans under CA, one for beans under CF, one
for maize under CA and one for maize under CF.
Taking farm 1 (F1) under maize crop for as an ex-
ample, the maize grain yields from the 1-ha plot was
12.0 and 11.6 bags/ha under CF (each bag holds 90 kg
Kinyumu: Conservation Agriculture: a Solution to Rain-fed Farming in Kenya? 143
050No tillage or minimum tillage
% Score
n=50
Farmers
implementing
Agro forestry
Practices
Table 4. The number of farmers implementing certain conservation agriculture (CA) practices
Farmers not
implementing
24
0
4852
100
26
010050Use of cover crops or mulch
0010050Use of crop rotation
% Score
36186432Water harvesting for CA
0
Sustainability
n=50
Score
Mentioned
Yields are higher
88%44
Issues Mentioned by farmers on
sustainability and benefits of adopting CA
Has reduced labour requirement
Table 5. Farmers’ perceptions of factors related to the suitability of adopting CA
with regard to its sustainability and benefits to farmers
ScoreNo.
48Saves on time and energy in tillage
Did not mention
12%
14%86% 743
6
98%49Nil/minimum tillage is employed
20%
Benefits
4%
1080%40Cattle manure is readily available
296%
No.
2%1
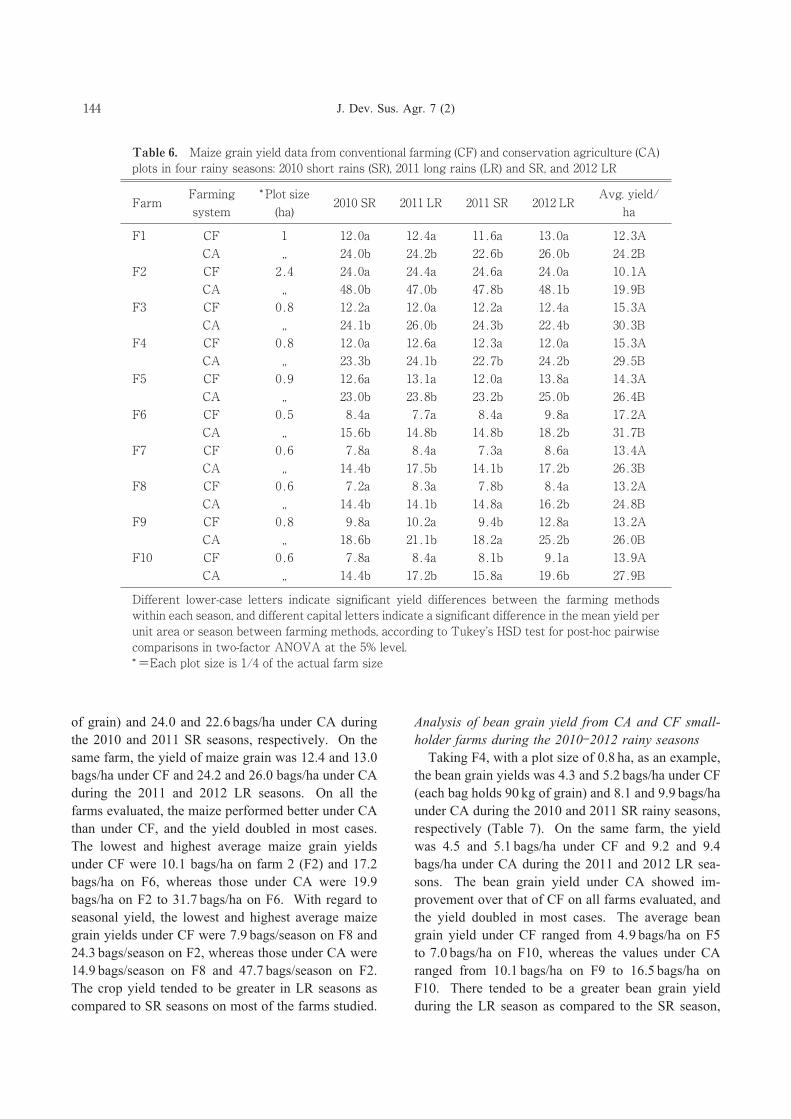
of grain) and 24.0 and 22.6 bags/ha under CA during
the 2010 and 2011 SR seasons, respectively. On the
same farm, the yield of maize grain was 12.4 and 13.0
bags/ha under CF and 24.2 and 26.0 bags/ha under CA
during the 2011 and 2012 LR seasons. On all the
farms evaluated, the maize performed better under CA
than under CF, and the yield doubled in most cases.
The lowest and highest average maize grain yields
under CF were 10.1 bags/ha on farm 2 (F2) and 17.2
bags/ha on F6, whereas those under CA were 19.9
bags/ha on F2 to 31.7 bags/ha on F6. With regard to
seasonal yield, the lowest and highest average maize
grain yields under CF were 7.9 bags/season on F8 and
24.3 bags/season on F2, whereas those under CA were
14.9 bags/season on F8 and 47.7 bags/season on F2.
The crop yield tended to be greater in LR seasons as
compared to SR seasons on most of the farms studied.
Analysis of bean grain yield from CA and CF small-
holder farms during the 2010-2012 rainy seasons
Taking F4, with a plot size of 0.8 ha, as an example,
the bean grain yields was 4.3 and 5.2 bags/ha under CF
(each bag holds 90 kg of grain) and 8.1 and 9.9 bags/ha
under CA during the 2010 and 2011 SR rainy seasons,
respectively (Table 7). On the same farm, the yield
was 4.5 and 5.1 bags/ha under CF and 9.2 and 9.4
bags/ha under CA during the 2011 and 2012 LR sea-
sons. The bean grain yield under CA showed im-
provement over that of CF on all farms evaluated, and
the yield doubled in most cases. The average bean
grain yield under CF ranged from 4.9 bags/ha on F5
to 7.0 bags/ha on F10, whereas the values under CA
ranged from 10.1 bags/ha on F9 to 16.5 bags/ha on
F10. There tended to be a greater bean grain yield
during the LR season as compared to the SR season,
J. Dev. Sus. Agr. 7 (2)144
12.3A12.4aCFF1
Avg. yield/
ha
Different lower-case letters indicate significant yield differences between the farming methods
within each season, and different capital letters indicate a significant difference in the mean yield per
unit area or season between farming methods, according to Tukey’s HSD test for post-hoc pairwise
comparisons in two-factor ANOVA at the 5% level.
*=Each plot size is 1/4 of the actual farm size
Farming
system
19.6b
13.0a
Farm
Table 6. Maize grain yield data from conventional farming (CF) and conservation agriculture (CA)
plots in four rainy seasons: 2010 short rains (SR), 2011 long rains (LR) and SR, and 2012 LR
2010 SR
15.8a14.4b
11.6a12.0a
2011 LR 2011 SR
27.9B,, 17.2b
1
CA
2012 LR
24.0b,,CA
10.1A24.0a24.6a24.4a24.0a2.4CFF2
* Plot size
(ha)
18.6b,,CA
13.9A9.1a8.1b8.4a7.8a0.6CFF10
24.2B26.0b22.6b24.2b
14.4b,,CA
13.2A12.8a9.4b10.2a9.8a0.8CFF9
26.0B25.2b18.2a21.1b
14.4b,,CA
13.2A8.4a7.8b8.3a7.2a0.6CFF8
24.8B16.2b14.8a14.1b
15.6b,,CA
13.4A8.6a7.3a8.4a7.8a0.6CFF7
26.3B17.2b14.1b17.5b
23.0b,,CA
17.2A9.8a8.4a7.7a8.4a0.5CFF6
31.7B18.2b14.8b14.8b
23.3b,,CA
14.3A13.8a12.0a13.1a12.6a0.9CFF5
26.4B25.0b23.2b23.8b
24.1b,,CA
15.3A12.0a12.3a12.6a12.0a0.8CFF4
29.5B24.2b22.7b24.1b
48.0b,,CA
15.3A12.4a12.2a12.0a12.2a0.8CFF3
30.3B22.4b24.3b26.0b
19.9B48.1b47.8b47.0b
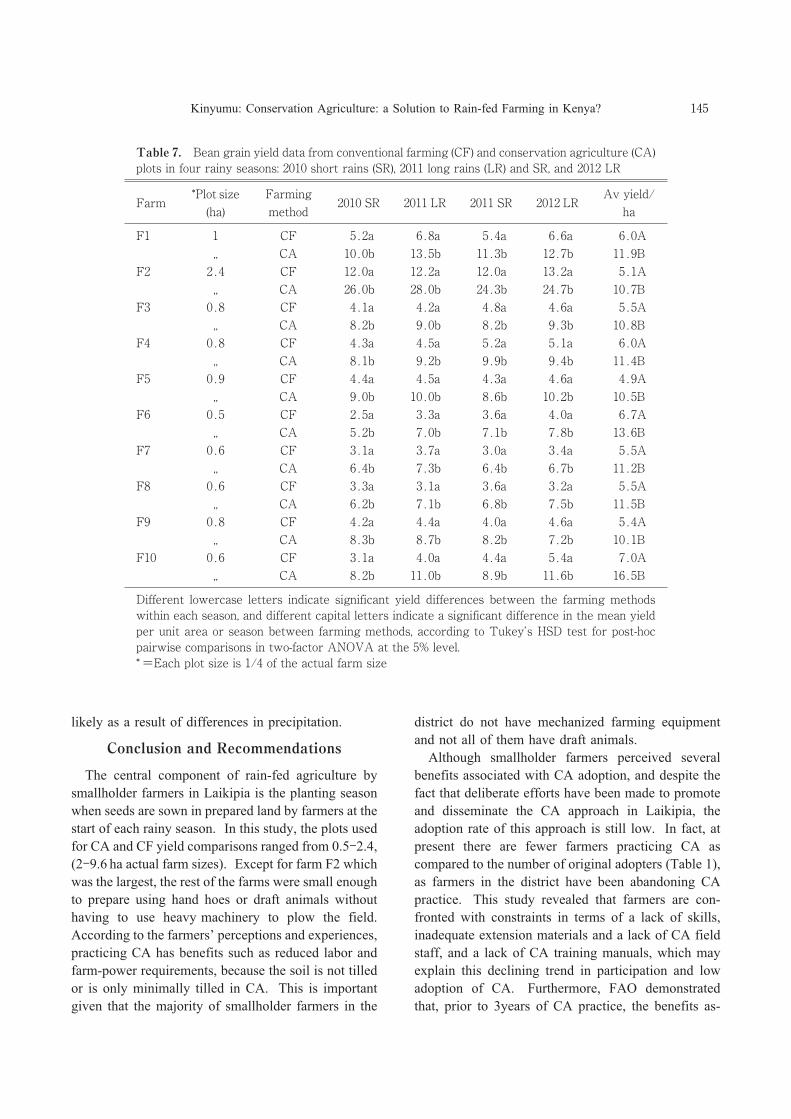
likely as a result of differences in precipitation.
Conclusion and Recommendations
The central component of rain-fed agriculture by
smallholder farmers in Laikipia is the planting season
when seeds are sown in prepared land by farmers at the
start of each rainy season. In this study, the plots used
for CA and CF yield comparisons ranged from 0.5-2.4,
(2-9.6 ha actual farm sizes). Except for farm F2 which
was the largest, the rest of the farms were small enough
to prepare using hand hoes or draft animals without
having to use heavy machinery to plow the field.
According to the farmers’ perceptions and experiences,
practicing CA has benefits such as reduced labor and
farm-power requirements, because the soil is not tilled
or is only minimally tilled in CA. This is important
given that the majority of smallholder farmers in the
district do not have mechanized farming equipment
and not all of them have draft animals.
Although smallholder farmers perceived several
benefits associated with CA adoption, and despite the
fact that deliberate efforts have been made to promote
and disseminate the CA approach in Laikipia, the
adoption rate of this approach is still low. In fact, at
present there are fewer farmers practicing CA as
compared to the number of original adopters (Table 1),
as farmers in the district have been abandoning CA
practice. This study revealed that farmers are con-
fronted with constraints in terms of a lack of skills,
inadequate extension materials and a lack of CA field
staff, and a lack of CA training manuals, which may
explain this declining trend in participation and low
adoption of CA. Furthermore, FAO demonstrated
that, prior to 3years of CA practice, the benefits as-
Kinyumu: Conservation Agriculture: a Solution to Rain-fed Farming in Kenya? 145
6.0A6.8a1F1
Av yield/
ha
Different lowercase letters indicate significant yield differences between the farming methods
within each season, and different capital letters indicate a significant difference in the mean yield
per unit area or season between farming methods, according to Tukey’s HSD test for post-hoc
pairwise comparisons in two-factor ANOVA at the 5% level.
*=Each plot size is 1/4 of the actual farm size
*Plot size
(ha)
11.6b
6.6a
Farm
Table 7. Bean grain yield data from conventional farming (CF) and conservation agriculture (CA)
plots in four rainy seasons: 2010 short rains (SR), 2011 long rains (LR) and SR, and 2012 LR
2010 SR
8.9b8.2b
5.4a5.2a
2011 LR 2011 SR
16.5BCA 11.0b
CF
,,
2012 LR
10.0bCA,,
5.1A13.2a12.0a12.2a12.0aCF2.4F2
Farming
method
8.3bCA,,
7.0A5.4a4.4a4.0a3.1aCF0.6F10
11.9B12.7b11.3b13.5b
6.2bCA,,
5.4A4.6a4.0a4.4a4.2aCF0.8F9
10.1B7.2b8.2b8.7b
6.4bCA,,
5.5A3.2a3.6a3.1a3.3aCF0.6F8
11.5B7.5b6.8b7.1b
5.2bCA,,
5.5A3.4a3.0a3.7a3.1aCF0.6F7
11.2B6.7b6.4b7.3b
9.0bCA,,
6.7A4.0a3.6a3.3a2.5aCF0.5F6
13.6B7.8b7.1b7.0b
8.1bCA,,
4.9A4.6a4.3a4.5a4.4aCF0.9F5
10.5B10.2b8.6b10.0b
8.2bCA,,
6.0A5.1a5.2a4.5a4.3aCF0.8F4
11.4B9.4b9.9b9.2b
26.0bCA,,
5.5A4.6a4.8a4.2a4.1aCF0.8F3
10.8B9.3b8.2b9.0b
10.7B24.7b24.3b28.0b
sociated with CA adoption and especially yield are not
substantial enough to convince most conventional
farmers to adopt it (Fig. 3). This is an important factor
to be considered when promoting CA among the newly
adopted farmers in the district. Farmers must therefore
understand that CA does not provide benefits im-
mediately and there is a lag period between the time a
farmer adopts CA and the time he actually gets the
benefits associated with CA practice.
This study showed that there are inadequate tools
and equipment in the district, which could be due to
a lack of local manufacturers of tools and equipment
for small-scale CA farming in nearby urban centers.
These are important concerns mentioned by farmers as
major constraints in the adoption of CA. Thus, CA
promoters must encourage the fabrication of CA im-
plements and tools among the farm input and imple-
ment shops in the district. The study also revealed that
farmers’ views and experiences are rarely taken into
consideration when introducing new technologies and
that farm inputs are expensive; farmers see these as
important factors that hinder the adoption of the CA
approach. These concerns must be addressed, and they
may determine the strategies and approaches for better
promotion and dissemination of the approach to farm-
ers in Laikipia District in the future.
Data from farm records showed that, on average, the
yield from subsistence farming in Laikipia is low.
Yields ranged from 10.1 to 17.2 bags/ha for maize and
from 4.9 to 7.0 bags/ha for beans under CF, whereas
CA improved these yields to 19.9 to 31.7 bags/ha for
maize and 10.1 to 16.5 bags/ha for beans. Thus, the
yield from CA showed a tremendous increase that, in
most cases, was double that from CF. These results
are comparable to those reported by FAO (2005). This
substantial yield increase in the region’s staple foods
would provide an important step toward household
food security and farm income. Policy-makers and re-
searchers, therefore, need to consider the findings of
this study.
This study did not investigate the causes for the
differences in yield between the CA and CF ap-
proaches. However, it is likely that this increase is due
to improved soil management practices by CA farmers
that conserve soil moisture and improve soil quality.
There is a need to carry out further research on the
effect that each CA practice has on crop yield in this
region.
Acknowledgments
I thank Mr. Muchangi Njagi, a CA-compliant train-
ed officer and a district subject matter specialist at the
District Agricultural Office, Laikipia Central, for his
participation in the field activities and for the extensive
insights he provided about CA and its promotion in
Laikipia District. Likewise I am grateful to Mr. Hutu,
the divisional agricultural extension officer in Lamuria
who also provided highly professional field assistance.
Mrs. Zipporah Mburu, the location agricultural exten-
sion officer in Marura, who provided highly pro-
fessional field assistance in conducting our on-farm
experiments as well as in the administration of ques-
tionnaires and interviews to farmers; and Mr. Mungai,
the field extension officer in Daiga, for his cooperation
and for providing useful information during this study.
I am grateful to Professor Hiroshi Gemma of the
Faculty of Life and Environmental Sciences, Univer-
sity of Tsukuba, and the entire organizing committee
of the Ag-ESD Symposium for their invitation and
facilitation to participate and present this paper during
the 2012 Ag-ESD Symposium, held at University of
Tsukuba, Last but not least, I thank my family for their
enormous support during the writing of this paper.
References
Canadian Coalition on Climate Change and Development
(C4D), Kenya, 2010. Increase Community Resilience to
Drought in Sakai Sub-location. http://www.iisd.org/climate/
vulnerability/adaptation.asp, accessed June 2012.
FAO, 2004. Conservation of Natural Resources for Sustainable
Agriculture: Training Modules. FAO Land and Water
Digital Media Series.
FAO, 2005. Conservation Agriculture: Emergency and Reha-
bilitation Programme in Southern Africa, Regional Inter-
agency Coordination Support Office (RIACSO). http:
//www.fao.org/ag/ca/doc/FLYER_Conservation_Agriculture.
pdf, accessed June 2012.
FAO, 2006. Conservation Agriculture for SARD and Food
Security in Southern and Eastern Africa (Kenya and
Tanzania). AG: GCP/RAF/390/GER (KEN/URT) Termi-
nal Report, June 2004 to August 2006. http://www.fao.org/
ag/ca/doc/CA_SARD_web.pdf, accessed July 2012.
FAO, 2012. Conservation Agriculture. Agriculture and Con-
sumer Protection Department. http://www.fao.org/ag/ca/,
accessed January 2013.
FAO, IIRR, and ACT, 2005. Conservation Agriculture for Soil
Moisture. Briefing Notes: Production Systems Manage-
ment. FAO, Rome.
Garcia-Torres et al., 2003; Knowler and Bradshaw, 2007. Con-
servation Tillage and its Impact on Land and Labor pro-
ductivity in Central Ethiopia. As quoted in http://www.
J. Dev. Sus. Agr. 7 (2)146
webmeets.com/files/papers/EAERE/2011/133/CA%20paper
%20Jan%202011.pdf
Gichuki, F.N., Liniger, H.P., MacMillan, L., Schwilch, G.,
Gikonyo, G., 1998. Scarce water: exploring resource avail-
ability, use, and improved management. In: Resources,
actors and policies-towards sustainable regional develop-
ment in the highland-lowland system of Mount Kenya.
“G” (Nairobi) 8, 15-28.
Gold, M.V., 2012. Sustainable Agriculture: Definitions and
Terms. http://www.nal.usda.gov/afsic/pubs/terms/srb9902.
shtml, accessed August 2012.
Government of Kenya, 2004. Strategy for Revitalizing Agricul-
ture, 2004-2014. Ministry of Agriculture Policy Paper.
Harrington, L.W., 2008. A Brief History of Conservation Agri-
culture in Latin America, South Asia, and Sub-Saharan
Africa. Conservation Agriculture Newsletter, Issue 2. De-
partment of Crop and Soil Sciences, Cornell University,
Ithaca, NY.
Huho, J.M., Ngaira, J.K.W., Ogindo, H.O., Masayi, N., 2012.
The changing rainfall pattern and the associated impacts on
subsistence agriculture in Laikipia East District, Kenya. J.
Geograph. Regional Planning 5 (7), 198-206.
Jaetzold, R., Schmidt, H., 1983. Farm Management Handbook
of Kenya. Vol. II/C. Ministry of Agriculture, Nairobi,
Kenya.
Kaumbutho, P., Kienzle. J., eds., 2007. Conservation Agricul-
ture as Practised in Kenya: Two Case Studies. African
Conservation Tillage Network, Centre de Coopération
Internationale de Recherche Agronomique pour le
Développement, Nairobi, and FAO, Rome. http://www.fao.
org/ag/ca/doc/Kenya_casestudy.pdf, accessed June 2012.
Kiteme B.P., Wiesmann U., Kunzi E. and Mathura J.M., 1998:
Knowledge about High-Lowland integration: A highland-
lowland system under transitional pressure: A spatio-
temporal analysis. In: Resources, Actors and Policies;
Towards Sustainable Regional Development in the High-
land lowland System of Mount Kenya, ESAGJ. Vol. No. 8.
Mazvimavi, K., Ndlovu, P.V., Nyathi, P., Minde, I.J., 2010.
Conservation Agriculture Practices and Adoption by
Smallholder Farmers in Zimbabwe. Poster presented at the
Joint 3rd African Association of Agricultural Economists
and 48th Agricultural Economists Association of South
AfricaConference, Cape Town, South Africa. http://agecon
search.umn.edu/bitstream/96822/2/130.%20Conservation%
20Agriculture%20Practices%20in%20Zimbabwe.pdf, ac-
cessed July 2012.
Rhoton, F.E., Shipitalo, M.J., Lindbo, D.L. 2002. Runoff and
soil loss from midwestern and southeastern US silt loam
soils as affected by tillage practice and soil organic matter
content. Soil Till. Res. 66, 1-10.
Sullivan, D.G., Lee, D., Beasley, J., Brown, S., Williams, E.J.,
2008. Evaluating a crop residue cover index for determin-
ing tillage regime in a cotton-corn-peanut rotation. J. Soil
Water Conserv. 60, 24-35.
Todaro, M., Smith, S., 2009. Economic Development. 10th ed.
Pearson Education, Upper Saddle River, NJ.
World Bank, 2008. World Development Report: Agriculture for
Development. http://siteresources.worldbank.org/INTWDR
2008/Resources/WDR_00_book.pdf, accessed August 2012.
Kinyumu: Conservation Agriculture: a Solution to Rain-fed Farming in Kenya? 147
Related Documents