1 Is breast the best? Evaluating the price effects of the Nestlé/Pfizer merger in the South African infant milk formula market Thembalethu Sithebe * , Katerina Barzeva ** and Liberty Mncube *** Abstract On 11 February 2013, the Competition Tribunal approved the acquisition of the South African Infant Nutrition Business of Pfizer, by Nestlé South Africa subject to conditions. The remedy imposed in the merger was a first for South African competition law, based on a transitional re-branding remedy. Using only pre-merger data, we estimate a nested logit demand model and then use the estimates to simulate the merger using a model of Bertrand competition. The model predicted prices would have increased by and 2.5-8.9% (assuming 12% of household income is used) and 1-4% (assuming 28% of household income is used to purchase infant milk).The model is further used to predict the change in consumer welfare. We find that competition authorities rightly assumed that competition concerns are “common cause” in this industry as between 2.18-4.8% of consumer welfare would have been reduced. Keywords: merger simulation, ex post merger evaluation, nested logit, infant milk formula market 1. Introduction On 11 February 2013, the Competition Tribunal (“Tribunal”) conditionally approved the merger in South Africa between Nestlé S.A. ("Nestlé") and Pfizer Inc. (“Pfizer”). The Tribunal did not find it necessary to consider whether the proposed transaction was likely to lead to substantially preventing or lessening competition in the relevant markets (which were not conclusively defined). This was because it was common cause between the Competition Commission (“Commission”) and the merging parties that the proposed merger raised significant competition concerns in South Africa, given the highly concentrated nature of the relevant markets, which required a remedy. Being a global merger, the merger was notified in 15 countries. Unconditional approvals were obtained in China, Brazil, Ireland, Italy, Portugal, Taiwan, India, Turkey and Saudi Arabia. In these countries, the merger became effective on 30 November 2012. In the remainder of the jurisdictions including South Africa, save for Pakistan, Nestlé proposed remedies were similar to those proposed in South Africa. Transitional re-branding remedies were accepted by the competition authorities in Australia, Chile, Mexico and Columbia. In Pakistan, the competition * Senior Economist, Competition Commission of South Africa; ** Economist, Competition Commission of South Africa and *** Chief Economist, Competition Commission of South Africa. The views expressed in this article are strictly ours and should not be taken as reflecting the views of the Competition Commission of South Africa.

Welcome message from author
This document is posted to help you gain knowledge. Please leave a comment to let me know what you think about it! Share it to your friends and learn new things together.
Transcript
1
Is breast the best? Evaluating the price effects of the Nestlé/Pfizer merger in the
South African infant milk formula market
Thembalethu Sithebe *, Katerina Barzeva ** and Liberty Mncube ***
Abstract
On 11 February 2013, the Competition Tribunal approved the acquisition of the South African Infant Nutrition
Business of Pfizer, by Nestlé South Africa subject to conditions. The remedy imposed in the merger was a first for
South African competition law, based on a transitional re-branding remedy. Using only pre-merger data, we estimate
a nested logit demand model and then use the estimates to simulate the merger using a model of Bertrand
competition. The model predicted prices would have increased by and 2.5-8.9% (assuming 12% of household income
is used) and 1-4% (assuming 28% of household income is used to purchase infant milk).The model is further used to
predict the change in consumer welfare. We find that competition authorities rightly assumed that competition
concerns are “common cause” in this industry as between 2.18-4.8% of consumer welfare would have been reduced.
Keywords: merger simulation, ex post merger evaluation, nested logit, infant milk formula market
1. Introduction
On 11 February 2013, the Competition Tribunal (“Tribunal”) conditionally approved the merger
in South Africa between Nestlé S.A. ("Nestlé") and Pfizer Inc. (“Pfizer”). The Tribunal did not find
it necessary to consider whether the proposed transaction was likely to lead to substantially
preventing or lessening competition in the relevant markets (which were not conclusively
defined). This was because it was common cause between the Competition Commission
(“Commission”) and the merging parties that the proposed merger raised significant competition
concerns in South Africa, given the highly concentrated nature of the relevant markets, which
required a remedy.
Being a global merger, the merger was notified in 15 countries. Unconditional approvals were
obtained in China, Brazil, Ireland, Italy, Portugal, Taiwan, India, Turkey and Saudi Arabia. In
these countries, the merger became effective on 30 November 2012. In the remainder of the
jurisdictions including South Africa, save for Pakistan, Nestlé proposed remedies were similar to
those proposed in South Africa. Transitional re-branding remedies were accepted by the
competition authorities in Australia, Chile, Mexico and Columbia. In Pakistan, the competition
* Senior Economist, Competition Commission of South Africa; ** Economist, Competition Commission of South Africa and *** Chief Economist, Competition Commission of South Africa. The views expressed in this article are strictly ours and should not be taken as reflecting the views of the Competition Commission of South Africa.

2
authority accepted Nestlé's undertaking to continue distributing the Pfizer products in that
country for a period of three years after the merger, and granted approval on that basis.
Our ex-post assessment of the merger decision has one fundamental aim, to assess whether
the common cause assumption by the Commission and the merging parties that the proposed
merger raised significant competition concerns in South Africa, which required a remedy, was
correct. A decision about a proposed merger in a defined relevant market usually contains a set
of factual assertions and logical propositions. Competition authorities use these factual
assertions and logical propositions to predict whether a proposed merger is likely to
substantially prevent or lesson competition.
Our assessment is carried out in two stages. The first stage consists of providing the industry
background, outlining the key aspects of the decision and elaborating on the datasets used in
the assessment. Our analysis uses monthly data from June 2011 to June 2012. The second
stage consists of evaluating the validity of the argument that the proposed merger raised
significant competition concerns and verifying the completeness of this argument. We use
merger simulation to provide the answers to the question of whether the proposed merger is
likely to reduce consumer welfare.
Over the last 2 decades, merger simulation assessments have become standard practice and
have provided one piece of evidence in merger evaluation by competition authorities.
Pioneering articles on merger simulation include Hausman, Leonard and Zona (1994), Werden
and Froeb (1994) and Berry, Levinsohn and Pakes (1995) and others who have developed
merger simulation as useful tool for merger analysis in differentiated product markets. Examples
of the use of merger simulation in competition policy analysis include Nevo (2000), Epstein and
Rubinfeld (2002), Pinkse and Slade (2004), Ivaldi and Verboven (2005), Ashenfelter and
Hosken (2008) and Grzybowski and Pereira (2008). For a recent survey, see Werden and Froeb
(2006), Budzinski and Ruhmer (2010) and the references therein.
We estimate a constant expenditures specification of the nested logit model. This variant of the
nested logit model generates substitution patterns where consumers allocate a constant fraction
of their budget to purchase many units of a particular product, instead of the typical assumption
used in literature where consumers limit their purchases to one good or nothing at all
(Björnerstedt and Verboven, 2012). For model sensitivity, two assumptions on the proportion of
the budget allocated to the purchase of infant milk are used. We firstly assume that consumers
3
allocate 28% of their budget to infant milk. Secondly, we assume that consumers apportion 12%
of their budget to the purchase of infant milk.
From the demand models we obtain estimates of the price elasticities of demand, and assume a
standard multi-product Bertrand Nash model which is used to derive the pre-merger marginal
costs. We use the estimates of the price elasticities of demand together with the derived
marginal costs to simulate the unilateral effects on the likely post-merger price. We find that
prices would have increased by 2.5-8.9% (assuming 12% of household income is used) and 1-
4% (assuming 28% of household income is used to purchase infant milk).The model is further
used to predict the change in consumer welfare. We find that competition authorities rightly
assumed that competition concerns are “common cause” in this industry as between 2.18-4.8%
of consumer welfare would have been reduced.
The paper is organized as follows. Section 2 discusses the industry background, including the
merger decision and the dataset. Section 3 develops the framework for merger simulation.
Section 4 discusses the empirical results for the demand model and merger simulations.
Section 5 concludes.
2. The Merger
2.1. Industry background
Figure 1 shows the value-chain for the supply of infant milk formula (“IMF”) products starting
with (i) the production level (ii) through distribution or selling channels and (iii) finally to
consumers. At the manufacturing level, various types of raw materials are used across the
different IMF stages (i.e. infant formula, follow-on milks, growing up milks and specialty milks).
Competition in the IMF market occurs at brand level and is segmented into three main stages;
of which each represent the development stages of a baby as per its age. Stage 1 infant
formula, often referred to as starter formula, is manufactured for babies’ between 0 to 6 months
old. The second stage, also known as follow-on formula, is for babies’ aged between 6 months
and 12 months, whilst stage 3 formula, commonly referred to as growing-up milk, is set for
children who are older than one year, but are less than five years old. The other remaining
category of infant milk formula is speciality milks which is designed for babies and toddlers with
special dietary requirements or special needs.

4
Figure 1: IMF industry supply chain from production to consumers
IMF brands (across the different stages of a child’s development) can be differentiated by
whether they are positioned in the mainstream or premium category. IMF products positioned in
the mainstream category are considered to be the cheapest, while the premium category is
considered to be the most expensive. Nestlé, Pfizer and Aspen each have brands that fall in
either mainstream or premium. The premium segment includes Nestlé brands such as NAN
and, Nido, Pfizer’s S-26 Gold brand, and Aspen’s Infacare Gold. Nestlé’s Lactogen, Pfizer’s
SMA and S-26 Regular brands and Aspen’s Infacare Regular brands occupy the mainstream
segment. The IMF market can also be segmented by selling channels such as retailers,
hospitals and pharmacies. The retail channel however, is the largest distribution channel for
infant milk formula.
We assume that a price increase in a particular stage will not lead a consumer to purchase
another infant formula brand in the next stage. For example, following a price increase in a
starter (stage 1) formula brand, a mother purchasing a starter (stage 1) formula brand will not
necessarily switch to purchasing a follow-on (stage 2) infant formula brand. However, the
question that remains to be tested is whether a consumer currently purchasing firm X’s
mainstream brand within a particular stage, following a price increase would switch to
purchasing a premium brand within that same stage and if so whether it would be from another
firm or within firm X’s range of brands.
5
2.2. The Merger
On 08 June 2012, Nestlé notified the Competition Commission (“Commission”) with its intention
to acquire the locally conducted infant nutrition business of Pfizer as part of a worldwide
acquisition by the Nestlé group of Pfizer’s infant nutrition interests.1 On 14 December 2012, the
Commission recommended approval of this merger to the Competition Tribunal (“Tribunal”),
subject to what was called a transitional re-branding remedy.2 The remedy recommended by the
Commission amounted to a prompt on-sale by Nestlé of the physical assets it would acquire
from Pfizer in the merger to a third party. Nestlé would simultaneously license the acquired
intellectual property to that third party. The third party would, over a period, manufacture and
distribute Pfizer’s re-branded products and establish market acceptance for them under its own
trademarks. After a ‘black-out’ period, all the rights in the trade marks included in that
intellectual property will revert, without any limitations by a license, to Nestlé.
Nestlé is involved in the production, marketing and sale of a large variety of food and beverage
products, including infant nutrition products such as infant formula, toddler milks, pre-natal and
maternal vitamins and supplements. Some of Nestlé's well-known infant formula brands include
NAN, Lactogen and Nespray. Pfizer is a global paediatric nutrition business with a portfolio of
products such as every day and specialty infant and toddler formulas. Its brands include the S-
26 range of infant formula, SMA, Infasoy and Centrum Materna, which is a range of maternal
supplements. From 2009, up until May 2011, Pfizer’s S26 range and SMA infant formula brands
were manufactured by Aspen, in terms of a licensing agreement under Pfizer, after which Pfizer
reclaimed its brands. According to the Tribunal, the Commission identified a horizontal overlap
in the activities of the merging parties in infant nutrition products, more specifically, in IMF and
maternal supplements. The Commission identified no competition concerns in regard to pre-
and post-maternal supplements.3
The first step in the Commission’s assessment process was defining the relevant market. The
Commission had regard to the different stages of development and the various needs of babies,
toddlers and young children and the various factors (such as, inter alia, recommendations
brand, cost or price, how soon the mother weans) which play a role in a mother's final decision
1 Commission case number 2012Jun0326.
2 The remedy recommended by the Commission amounted to a prompt on-sale by Nestlé of the physical assets it
would acquire from Pfizer in the merger to a third party. Nestlé would simultaneous license of the acquired intellectual property to that party. 3 See Tribunal decision in Case No: 65/LM/Jun12 (015248).

6
as to which brand to use.4 The Commission identified the following product markets: (1) Infant
formula (starter stage) for babies aged 0 – 6 months; (2) Follow-on formula for babies aged 7 –
12 months; (3) Growing-up milk ("GUM") for children between the ages of 12 months and 5
years; and (4) Specialty milks for babies and toddlers with special needs (e.g. allergies,
digestive problems and reflux).5 As for the geographic market definition, the analysis conducted
by the Commission concluded the geographic markets are national, whereas the merging
parties defined the market as national, and possibly international.
Regardless of whether the markets are defined narrowly or broadly, the South African IMF
markets are highly concentrated. There are only three significant competitors, namely Nestlé,
Pfizer and Aspen in the infant, follow-on and GUM markets. The specialty milk market has four
competitors, namely Nestlé, Pfizer, Aspen and Abbott.
According to the Commission, Nestlé has a market share consistently above 70% across all of
the markets. Aspen has an estimated 20% market share across all the markets, and Pfizer’s
market share is estimated at [0 – 10] % across all the markets, and at [0 – 10] % in the specialty
segment. Abbot has an estimated [10 – 20] % market share in the specialty segment. Given the
high market shares and levels of concentration, the Commission considered the transaction
essentially as a three-to-two merger, with the only significant competitor being Aspen.
On 11 February 2013, the Tribunal conditionally approved the merger in South Africa.6 The
remedy imposed by the Tribunal envisaged Nestlé divesting the Pfizer brands to an
independent third party through a transitional re-branding arrangement. In summary, the remedy
is based on a 10 year transitional rebranding period whereby the successful purchaser of the
divested Pfizer brands would rebrand the products, followed by a 10 year black-out period
where neither the licensee nor Nestlé can introduce the original Pfizer brands into the market.
After the blackout period, Nestlé will then be allowed to reintroduce the divested brands into the
South African market, should it wish to do so.
4 Customers of infant formula are very sensitive to product changes and are loyal to their preferred brands. The
sensitivity of infant formula thus makes re-branding a difficult and risky exercise, especially given the heritage enjoyed by the Pfizer brands. 5 The merging parties differed with Commission and defined the product markets more broadly as: (1) Infant and
follow-on milk which comprises milk formula for babies aged 0-6 months and follow-on milk for babies aged 7 – 12 months; and (2) GUM, given to children between 1 – 5 years. 6 Tribunal case number Case No: 65/LM/Jun12.
7
2.3. Dataset used in the merger simulation
We used AC Nielsen retail data obtained during the Nestlé/Pfizer merger. The product in the
dataset is defined per stage segment, by brand, pack size, manufacturer, and region7 as
identified over the 13 month period from June 2011 to June 2012. The dataset includes the
average price (Rand) per kilogram and the total volumes in kilograms sold per brand per pack
size. These variables are available across each stage of development for each firm in each
geographic region over the 13 month period. More specifically, there is an observation for each
month, t, a product, j, that had related information in terms of total sale volumes, q, and the
average price per kilogram, p, for each product j. For purposes of this paper we assume that the
brands identified by the respective manufacturers are discrete and cater for different consumers
based on their income level.8 Therefore, the classification, whether a brand is in the mainstream
or premium category, forms the base of our nests.
The product characteristics in the dataset include the number of calories per 100ml of prepared
infant formula per brand per firm, the number of different pack sizes per brand per firm and the
number of products (brands) per firm per classification (mainstream or premium).9 In addition,
we included a dummy variable to capture the importance of imports within the market, which we
instrumented to capture price effects within the market.10 A consumer’s choice of which brand
she chooses to purchase is influenced by a number of factors. For example, a mother may
decide to purchase a particular brand based on the recommendations she has received from
health care professionals, relatives and/or friends. An inherent characteristic in the infant
formula market is the significance of brand loyalty. A mother or consumer that is satisfied with a
certain infant formula brand is likely to continue using that brand throughout the different stages
of the babies development, and likely to use the same infant formula brand for their future
babies. Other factors that may influence a mothers or consumers choice may be the ingredients
used in the infant formula brand, as mothers will only want the best for their babies.
7 AC Nielsen collected and split its geographical data into these seven regional areas: (a) Gauteng, (b) Kwa-Zulu
Natal, (c) Limpopo, North West and Mpumalanga, (d) Free State and Northern Cape, (e) Western Cape, (f) Eastern Cape and (g) Total South Africa. 8 More particularly, we are of the view that mainstream brands are targeted towards lower income consumers, and
premium infant formula brands are targeted towards the higher income level consumers. 9 To capture the amount of calories (Kcal) per 100ml of prepared infant formula, we relied on a study done by Owens,
Labuschange and Lombard, published in 2012. For the infant formula brands that the study did not capture, desktop research was conducted to calculate the required information. 10
Pfizer Nutrition and Abbott import all their infant formula brands into South Africa, whilst Nestlé and Aspen manufacture their infant formula brands within South Africa, save for the speciality range of brands of Nestlé, which are imported from abroad.
8
Alternatively, packaging could influence a consumer’s choice of infant formula, in the sense of
convenience or easy-to use products.
This dataset was combined with the 2011 General Household Survey dataset (which was
conducted by Statistics South Africa (“Stats SA”). The survey includes information on the
number of children per household under the age of 5, the average monthly income of the
household, and the number of people in the household that were economically active. We have
used two separate variables to proxy for income: (1) the average monthly income of the
household and (2) the number of economically active people within the household. We are of
the view that these two variables are unique and accurate indicators of the level of income
within a household.11 For example, we expect that the higher the average monthly income within
the household the more likely that household with purchase premium branded infant formula,
given that the household has children under the age of five years old. Similarly, the more
economically active people in the household, the more likely that the household will purchase
premium branded formula, given there are children under the age of 5 in the household.
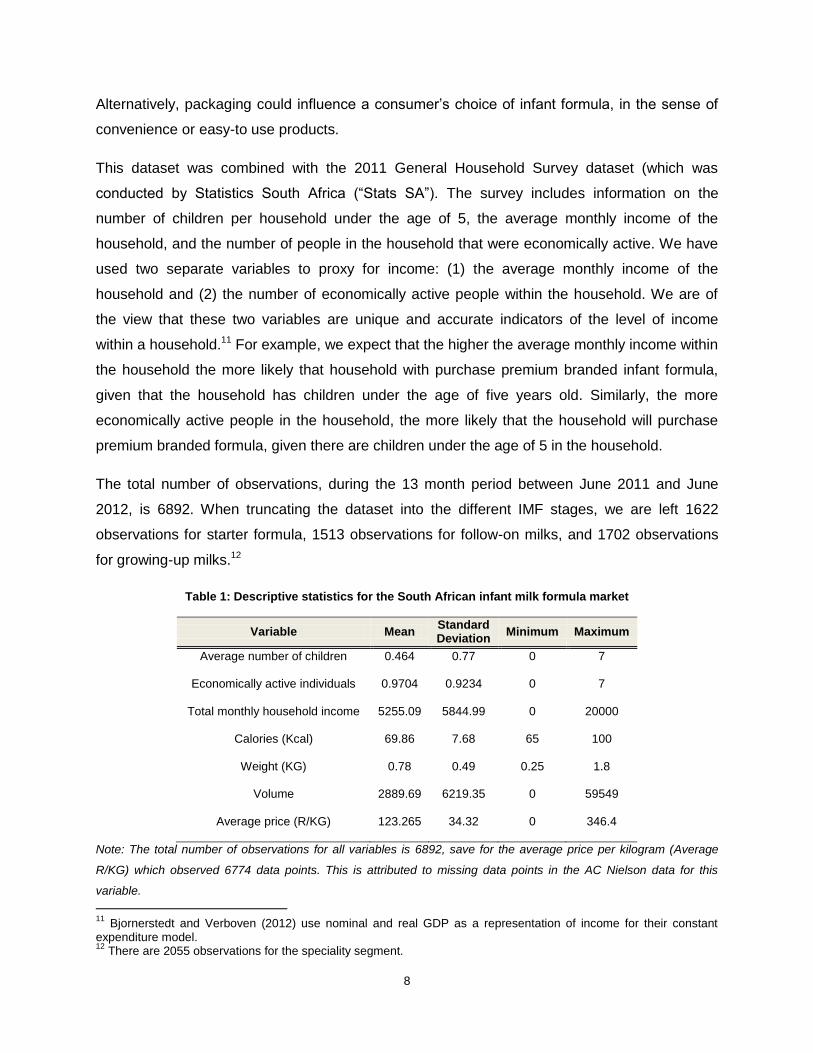
The total number of observations, during the 13 month period between June 2011 and June
2012, is 6892. When truncating the dataset into the different IMF stages, we are left 1622
observations for starter formula, 1513 observations for follow-on milks, and 1702 observations
for growing-up milks.12
Table 1: Descriptive statistics for the South African infant milk formula market
Variable Mean Standard Deviation
Minimum Maximum
Average number of children 0.464 0.77 0 7
Economically active individuals 0.9704 0.9234 0 7
Total monthly household income 5255.09 5844.99 0 20000
Calories (Kcal) 69.86 7.68 65 100
Weight (KG) 0.78 0.49 0.25 1.8
Volume 2889.69 6219.35 0 59549
Average price (R/KG) 123.265 34.32 0 346.4
Note: The total number of observations for all variables is 6892, save for the average price per kilogram (Average
R/KG) which observed 6774 data points. This is attributed to missing data points in the AC Nielson data for this
variable.
11
Bjornerstedt and Verboven (2012) use nominal and real GDP as a representation of income for their constant expenditure model. 12
There are 2055 observations for the speciality segment.

9
Given the ration between the mean and the standard deviations of the variables depicted in the
table above, there is good variation amongst the variables used in the performed estimations of
this paper. For example, the total monthly household income variable, the total number of
kilograms sold per brand per pack size (volume), and the number of children in the household
below the age of five years old have higher standard deviations than their mean, indicating there
is relatively good data variation amongst these variables. The data surrounding the remainder of
the variables, i.e. the number of calories per 100ml of prepared infant formula the pack size per
firm per brand (Weight), and the average price per kilogram sold (Average R/KG), are also good
indicators of variations within the dataset.13
3. Theoretical framework for merger simulation
Merger simulation predicts the price effects of a merger in three distinct steps. The first step in
simulating a merger is demand estimation based on assumptions regarding firm behaviour in
the market. The second step makes an assumption about the firms’ equilibrium behaviour,
typically Bertrand-Nash, to compute the products’ current profit margins and their implied
marginal costs. The third step usually assumes that marginal costs are constant, and predicts
how prices will change post-merger while accounting for increased market power and cost
efficiencies.14
3.1. Demand estimation
A one-level nested logit model is used to estimate the demand for infant milk formula. This
model partitions products into groups or nests containing similar products. The effect of this
partitioning is that substitution patterns within the groups are stronger than the substitution
patterns across the groups.15 The available IMF brands are partitioned into two segments,
namely: premium and mainstream products. The nested logit model thus accounts for possible
market segmentation and consumer heterogeneity along these segments. By using the nested
logit model, it is assumed that a price rise on one product causes consumers to switch to the
other products in relation to the products’ market shares. This is known as the irrelevant
alternatives assumption (IIA). This assumption is limiting particularly with regards the calculated
cross-price elasticities as the elasticities increase proportionally with the products’ market
shares.
13
Note that there are fewer observations for the average price per kilogram of infant formula due to the fact that there are some missing data points for this variable. 14
Bjornerstedt and Verboven (2013), p1. 15
Mncube et al (2010) p68.
10
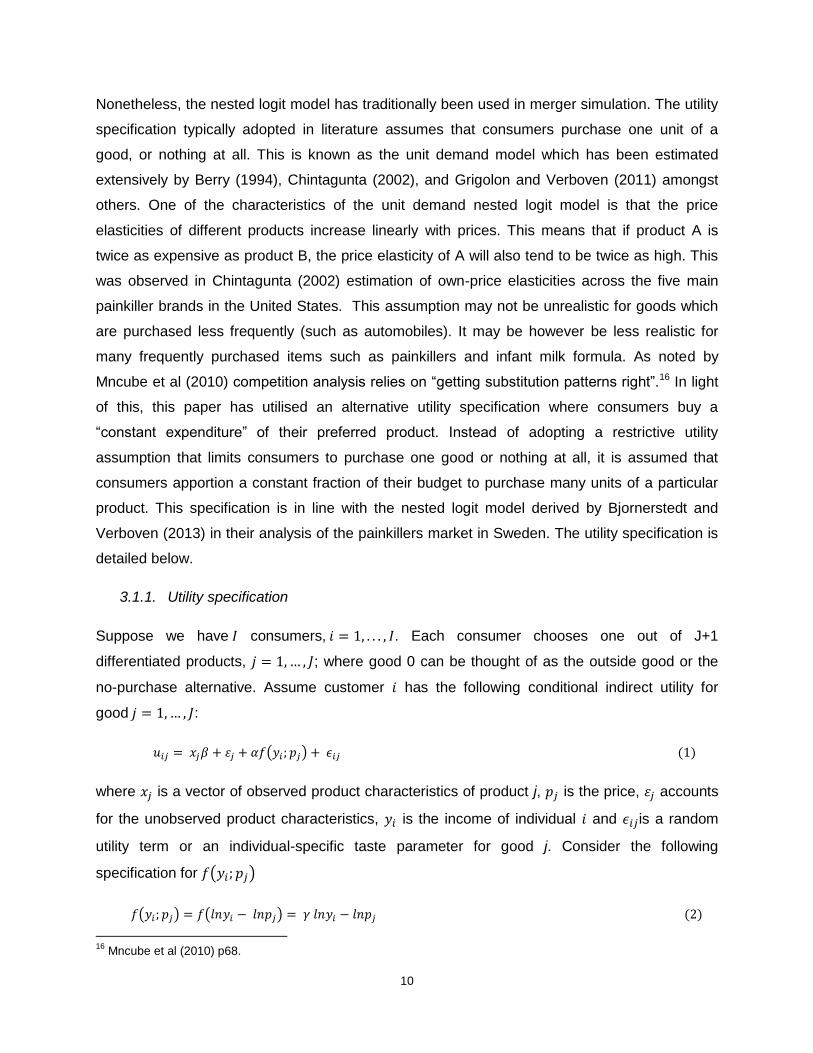
Nonetheless, the nested logit model has traditionally been used in merger simulation. The utility
specification typically adopted in literature assumes that consumers purchase one unit of a
good, or nothing at all. This is known as the unit demand model which has been estimated
extensively by Berry (1994), Chintagunta (2002), and Grigolon and Verboven (2011) amongst
others. One of the characteristics of the unit demand nested logit model is that the price
elasticities of different products increase linearly with prices. This means that if product A is
twice as expensive as product B, the price elasticity of A will also tend to be twice as high. This
was observed in Chintagunta (2002) estimation of own-price elasticities across the five main
painkiller brands in the United States. This assumption may not be unrealistic for goods which
are purchased less frequently (such as automobiles). It may be however be less realistic for
many frequently purchased items such as painkillers and infant milk formula. As noted by
Mncube et al (2010) competition analysis relies on “getting substitution patterns right”.16 In light
of this, this paper has utilised an alternative utility specification where consumers buy a
“constant expenditure” of their preferred product. Instead of adopting a restrictive utility
assumption that limits consumers to purchase one good or nothing at all, it is assumed that
consumers apportion a constant fraction of their budget to purchase many units of a particular
product. This specification is in line with the nested logit model derived by Bjornerstedt and
Verboven (2013) in their analysis of the painkillers market in Sweden. The utility specification is
detailed below.
3.1.1. Utility specification
Suppose we have consumers, . Each consumer chooses one out of J+1
differentiated products, ; where good 0 can be thought of as the outside good or the
no-purchase alternative. Assume customer has the following conditional indirect utility for
good :
( )
where is a vector of observed product characteristics of product j, is the price, accounts
for the unobserved product characteristics, is the income of individual and is a random
utility term or an individual-specific taste parameter for good j. Consider the following
specification for ( )
( ) ( )
16
Mncube et al (2010) p68.
11
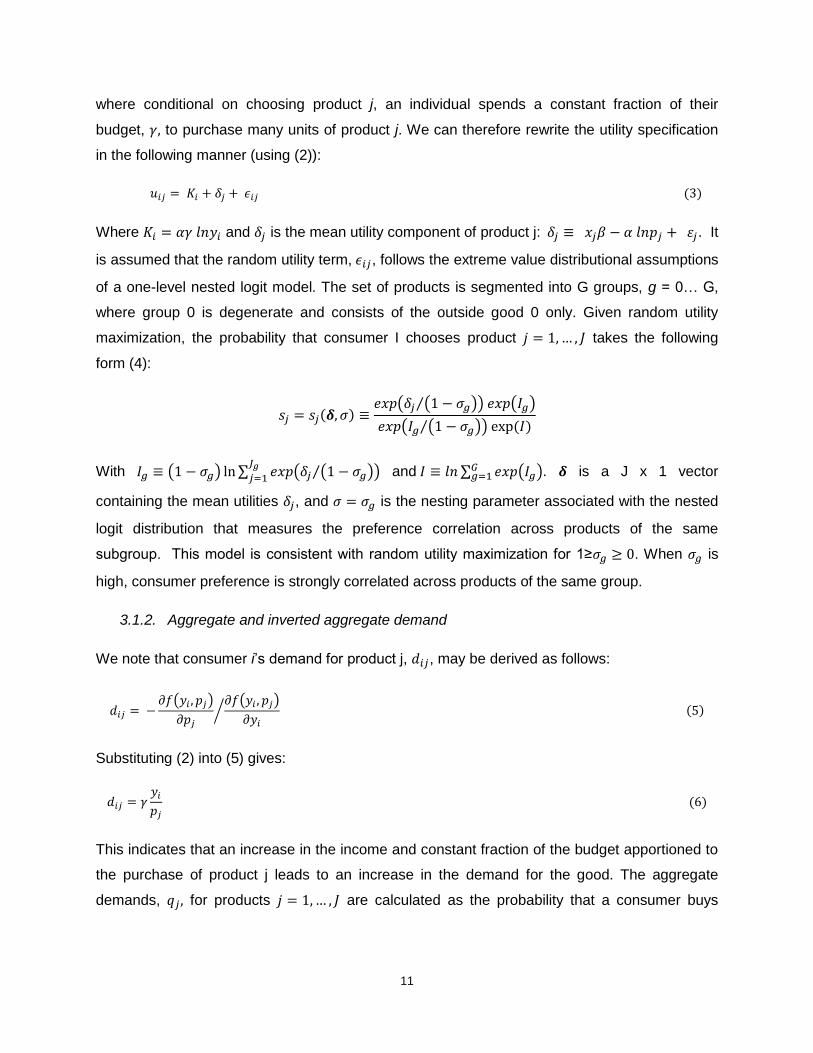
where conditional on choosing product j, an individual spends a constant fraction of their
budget, to purchase many units of product j. We can therefore rewrite the utility specification
in the following manner (using (2)):
Where and is the mean utility component of product j: . It
is assumed that the random utility term, , follows the extreme value distributional assumptions
of a one-level nested logit model. The set of products is segmented into G groups, g = 0… G,
where group 0 is degenerate and consists of the outside good 0 only. Given random utility
maximization, the probability that consumer I chooses product takes the following
form (4):
( ( )⁄ ) ( )
( ( )⁄ )
With ( ) ∑ ( ( )⁄ )
and ∑ ( ) . is a J x 1 vector
containing the mean utilities , and is the nesting parameter associated with the nested
logit distribution that measures the preference correlation across products of the same
subgroup. This model is consistent with random utility maximization for 1≥ . When is
high, consumer preference is strongly correlated across products of the same group.
3.1.2. Aggregate and inverted aggregate demand
We note that consumer i’s demand for product j, , may be derived as follows:
( )
( )
⁄
Substituting (2) into (5) gives:
This indicates that an increase in the income and constant fraction of the budget apportioned to
the purchase of product j leads to an increase in the demand for the good. The aggregate
demands, for products are calculated as the probability that a consumer buys
12
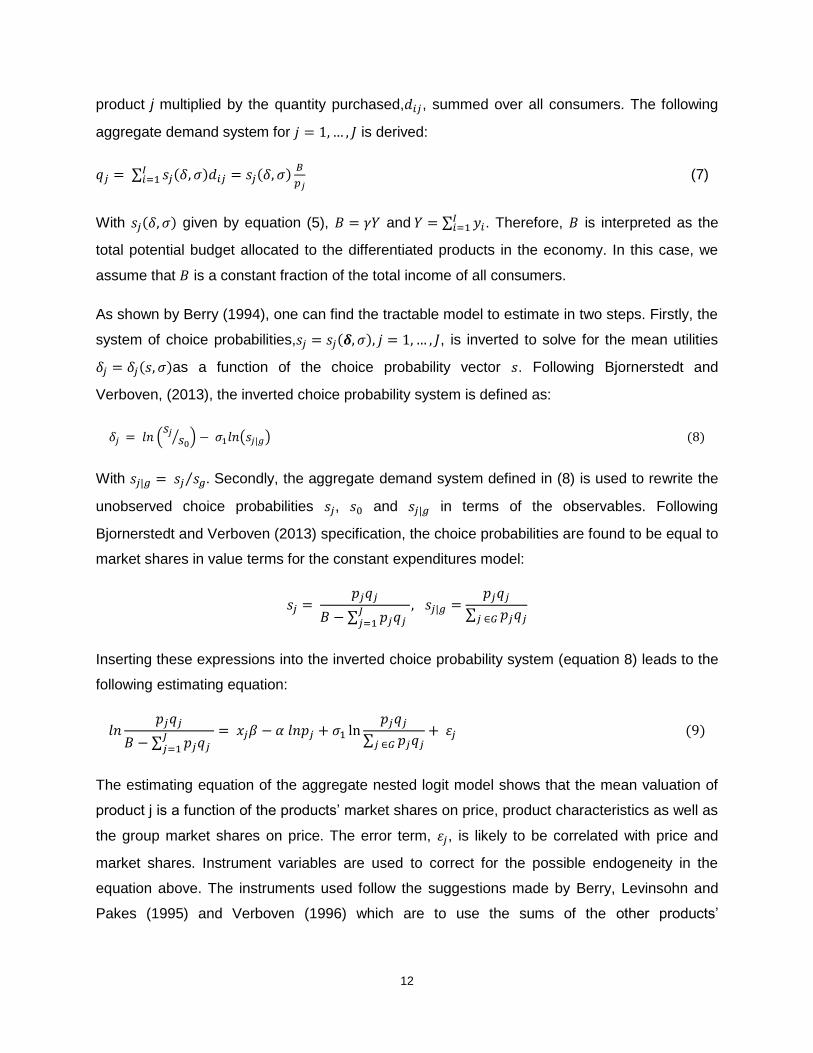
product j multiplied by the quantity purchased, , summed over all consumers. The following
aggregate demand system for is derived:
∑
(7)
With given by equation (5), and ∑ . Therefore, is interpreted as the
total potential budget allocated to the differentiated products in the economy. In this case, we
assume that is a constant fraction of the total income of all consumers.
As shown by Berry (1994), one can find the tractable model to estimate in two steps. Firstly, the
system of choice probabilities, , is inverted to solve for the mean utilities
as a function of the choice probability vector . Following Bjornerstedt and
Verboven, (2013), the inverted choice probability system is defined as:
(
⁄ ) ( )
With ⁄ Secondly, the aggregate demand system defined in (8) is used to rewrite the
unobserved choice probabilities , and in terms of the observables. Following
Bjornerstedt and Verboven (2013) specification, the choice probabilities are found to be equal to
market shares in value terms for the constant expenditures model:
∑
∑
Inserting these expressions into the inverted choice probability system (equation 8) leads to the
following estimating equation:
∑
∑
The estimating equation of the aggregate nested logit model shows that the mean valuation of
product j is a function of the products’ market shares on price, product characteristics as well as
the group market shares on price. The error term, , is likely to be correlated with price and
market shares. Instrument variables are used to correct for the possible endogeneity in the
equation above. The instruments used follow the suggestions made by Berry, Levinsohn and
Pakes (1995) and Verboven (1996) which are to use the sums of the other products’
13
characteristics (over the firm and the entire market) together with the sums of the other
products’ characteristics by product category.
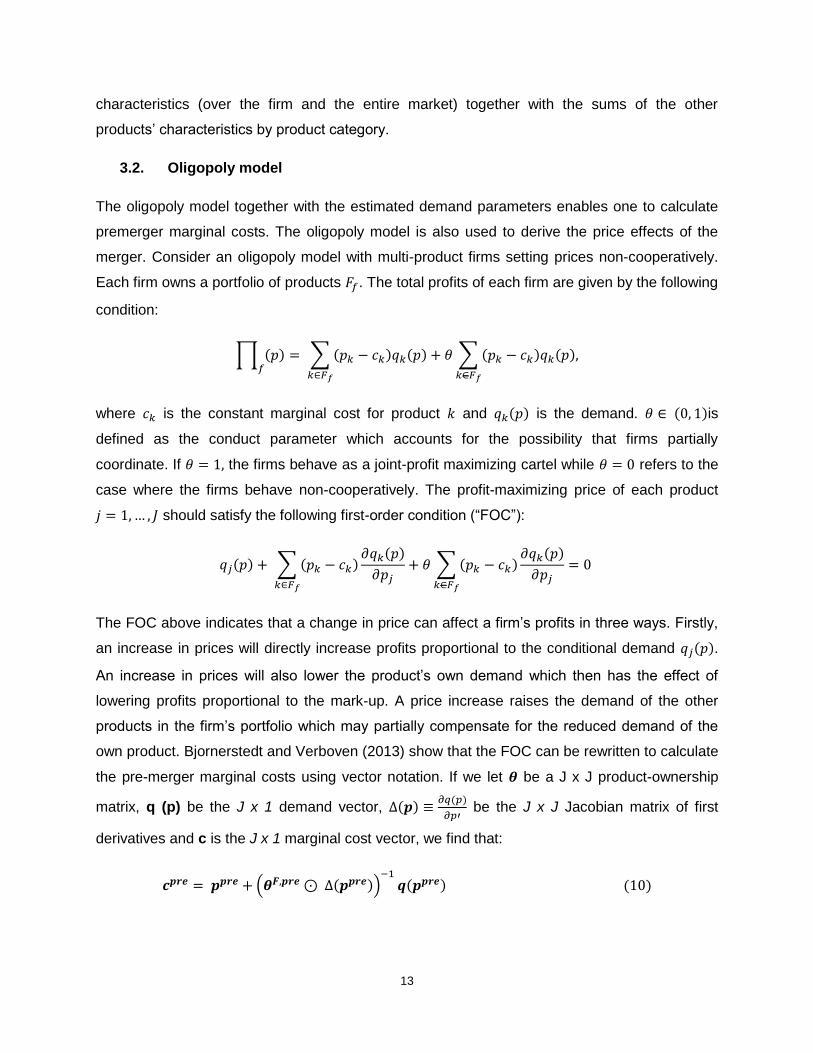
3.2. Oligopoly model
The oligopoly model together with the estimated demand parameters enables one to calculate
premerger marginal costs. The oligopoly model is also used to derive the price effects of the
merger. Consider an oligopoly model with multi-product firms setting prices non-cooperatively.
Each firm owns a portfolio of products . The total profits of each firm are given by the following
condition:
∏
∑ ∑
where is the constant marginal cost for product and is the demand. is
defined as the conduct parameter which accounts for the possibility that firms partially
coordinate. If the firms behave as a joint-profit maximizing cartel while refers to the
case where the firms behave non-cooperatively. The profit-maximizing price of each product
should satisfy the following first-order condition (“FOC”):
∑
∑
The FOC above indicates that a change in price can affect a firm’s profits in three ways. Firstly,
an increase in prices will directly increase profits proportional to the conditional demand .
An increase in prices will also lower the product’s own demand which then has the effect of
lowering profits proportional to the mark-up. A price increase raises the demand of the other
products in the firm’s portfolio which may partially compensate for the reduced demand of the
own product. Bjornerstedt and Verboven (2013) show that the FOC can be rewritten to calculate
the pre-merger marginal costs using vector notation. If we let be a J x J product-ownership
matrix, q (p) be the J x 1 demand vector,
be the J x J Jacobian matrix of first
derivatives and c is the J x 1 marginal cost vector, we find that:
( )
14
The pre-merger marginal costs as defined above are dependent on the pre-merger prices and
estimated price elasticities of demand. The FOC is also used to predict the post-merger
equilibrium taking into account partial coordinated behaviour and cost efficiencies. The following
changes are made to the product ownership matrix to and, if there are
efficiencies, a change in the marginal cost vector from to We simulate the new price
equilibrium using fixed point iteration on equation (10) above.
4. Estimated results
The results from the merger simulation are presented below together with a discussion on the
estimated demand parameters and implied price elasticities. The simulated price effects of the
merging firms are also presented under various scenarios.
4.1. Demand estimation
The constant expenditures nested logit model is estimated using the data from June 2011 to
June 2012. We assume that B is the total household income of all consumers in the sample.
The constant fraction represents an estimated portion of a consumer’s income that is used to
purchase infant formula. In the results below, we assume in Model 1 that the constant
fraction . This estimate was calculated using industry information obtained from the
case. Model 2 however is based on a mother using approximately 12% of their income to
purchase infant formula. This constant fraction of total household income is based on
purchasing two 1.8kg premium brand infant formula per month for R300 each as a percentage
of the average monthly household income, R5 255, of the sample used.
The model specified defines the nests at the product category level where firm brands are
classified as premium or mainstream. We have estimated the model assuming random effects
per product j which assumes that the individual specific effects are uncorrelated with
independent variables. We note that the price variable, and the group market share
variable,
∑ , are endogenous variables that are likely to be correlated with the error term.
This correlation with the error term leads to biased results due to the endogeneity of the
variables. To correct for this, an instrument variable estimation is conducted using the
characteristics of competitors as instruments (in addition to product characteristics). In
particular, the sums of the product characteristics of rival firms are used.
15
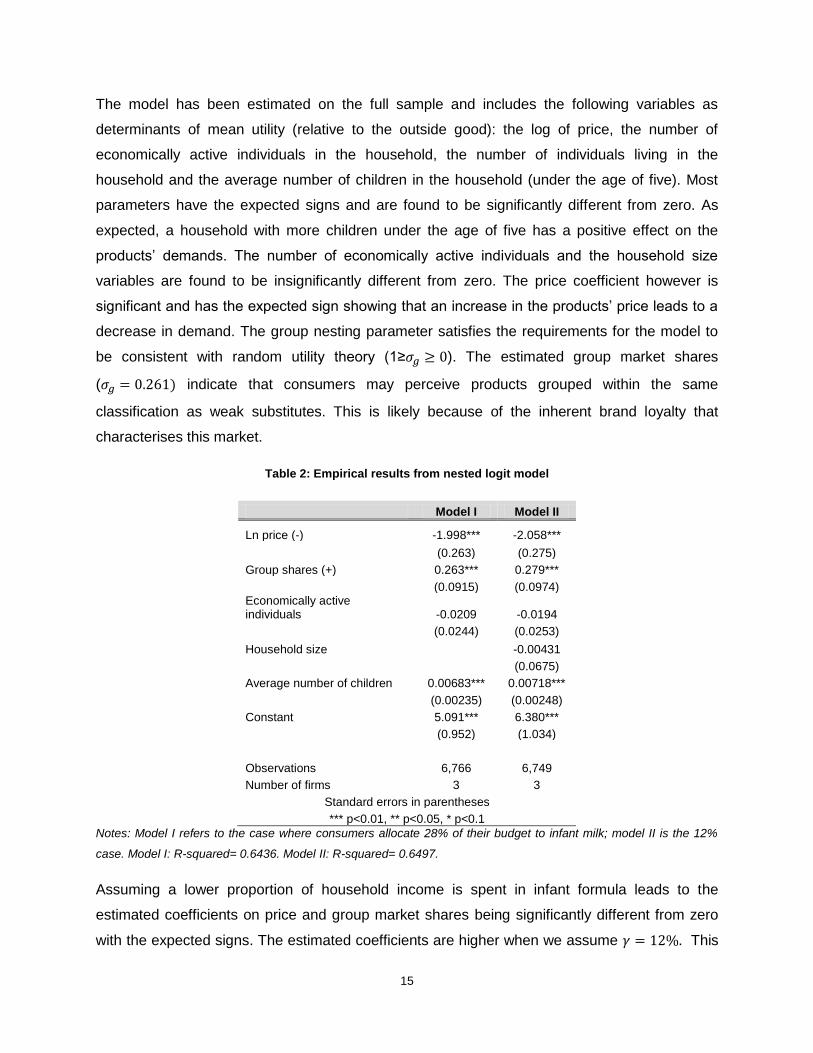
The model has been estimated on the full sample and includes the following variables as
determinants of mean utility (relative to the outside good): the log of price, the number of
economically active individuals in the household, the number of individuals living in the
household and the average number of children in the household (under the age of five). Most
parameters have the expected signs and are found to be significantly different from zero. As
expected, a household with more children under the age of five has a positive effect on the
products’ demands. The number of economically active individuals and the household size
variables are found to be insignificantly different from zero. The price coefficient however is
significant and has the expected sign showing that an increase in the products’ price leads to a
decrease in demand. The group nesting parameter satisfies the requirements for the model to
be consistent with random utility theory (1≥ ). The estimated group market shares
( indicate that consumers may perceive products grouped within the same
classification as weak substitutes. This is likely because of the inherent brand loyalty that
characterises this market.
Table 2: Empirical results from nested logit model
Model I Model II
Ln price (-) -1.998*** -2.058***
(0.263) (0.275)
Group shares (+) 0.263*** 0.279***
(0.0915) (0.0974) Economically active individuals -0.0209 -0.0194
(0.0244) (0.0253)
Household size -0.00431
(0.0675)
Average number of children 0.00683*** 0.00718***
(0.00235) (0.00248)
Constant 5.091*** 6.380***
(0.952) (1.034)
Observations 6,766 6,749
Number of firms 3 3
Standard errors in parentheses
*** p<0.01, ** p<0.05, * p<0.1
Notes: Model I refers to the case where consumers allocate 28% of their budget to infant milk; model II is the 12%
case. Model I: R-squared= 0.6436. Model II: R-squared= 0.6497.
Assuming a lower proportion of household income is spent in infant formula leads to the
estimated coefficients on price and group market shares being significantly different from zero
with the expected signs. The estimated coefficients are higher when we assume This
16
is likely due to the fact that the constant fraction, is used in the derivation of the individual and
aggregate demand for product j. Thus, as is lowered, both individual and aggregate demand is
lower leading to an upward bias in the estimation particularly the estimation of the price
coefficient.
4.2. Pre-merger market conditions
The pre-merger market conditions such as the price elasticities of demand, marginal costs and
the firm mark-ups are calculated for each development stage.
The calculated own-price and cross-price elasticities of demand are fairly constant across the
three stages. The average own-price elasticity is -2.93 in June 2012 indicating that IMF may be
considered to be a fairly elastic product. This is contrary to expectations as one would expect
that customers purchasing IMF are insensitive to price. We do however expect mothers that
purchase mainstream branded infant formula, to be more price sensitive, than mothers or
consumers who purchase premium branded infant formula. The estimated levels of price
sensitivity may be attributable to the variation in market shares of each firm across each stage
of development. As is expected, the average cross price elasticities are higher for products
within the same group (0.77) when compared with products in different groups (0.06).
Bjornerstedt and Verboven (2012) note a similar variation in elasticities in their constant
expenditures specification. They attribute this dissimilarity in elasticities to be driven by the
variation in market shares. Nonetheless, the higher cross-price elasticities of products in the
same group provide further impetus that customers perceive products within the same group as
substitutable.
On average, the industry mark-ups are 34% and 35% under Model I and Model II respectively.
This indicates that the IMF industry in South Africa is relatively profitable. The high pre-merger
mark-ups may be the product of two factors, namely: high pre-merger prices or low marginal
costs of production. The pre-merger marginal costs are derived using equation 11 above. We
find that the pre-merger marginal costs vary across firms and development stages. In fact, the
calculated marginal costs increase with each stage of development with the Stage 3 milk
exhibiting the highest marginal costs for both Aspen and Pfizer. On average, Nestle is the
lowest-cost producer with an average marginal cost (across all stages) of R71.64 using model I
and R68.46 using model II. This is expected as Nestle is the largest firm in the industry and will
therefore have sufficient scale to enable them to produce at a lower cost relative to its
competitors. Furthermore, Pfizer were noted to import their brands into the country. This would

17
necessarily increase their marginal costs of production. Aspen domestically produce all their
products across all stages, along with Nestlé, save for their (Nestlé) specialty products which
are imported from abroad, with the exception of Pelargon which is produced domestically as
well.17
Table 3: Derived pre-merger market conditions
Model 1 Own-price
elasticity
Cross-price elasticity (same group)
Cross-price elasticity (different group)
Marginal Cost
Pre-merger mark-up
Starter -2.94 0.763 0.057 74.5 34.07%
Follow-on -2.928 0.774 0.068 74.6 34.13%
GUM -2.936 0.767 0.061 83.84 33.97%
Model 2 Own-price
elasticity
Cross-price elasticity (same group)
Cross-price elasticity (different group)
Marginal Cost
Pre-merger Mark-up
Starter -2.918 0.936 0.14 73.69 34.87%
Follow-on -2.889 0.965 0.168 73.42 35.33%
GUM -2.906 0.957 0.149 83.4 34.57%
Notes: Model I refers to the case where consumers allocate 28% of their budget to infant milk; model II is the 12%
case.
4.3. Predicted price effects
The predicted price effects are reported at the firm level across all stages of development under
three scenarios, namely: (i) no cost efficiencies; (ii) 0.05% cost efficiencies for both Nestle and
Pfizer; and (iii) 1% cost efficiencies for both firms. This is presented for the two demand models
estimated.
The Tribunal did not consider any evidence on possible efficiency gains as a result of the
merger. The merger simulation results show that on average domestic prices would have
increased by 1-4% with Nestle exhibiting the largest price increase at 4% using Model I. In
Model II, the predicted price effects indicate that the price of IMF products (regardless of the
development stage) would have increased by 2.5 – 8.9%. Again, Nestle as the dominant firm is
estimated to have the highest price increase at 8.9% for its stage 1 products. The predicted
price effects show that Aspen will increase prices by a larger amount than Pfizer post-merger.
This follows from the calculated mark-ups where Aspen has a marginally higher pre-merger
markup.
17
Note that Abbott, which is Nestlé’s main competitor in the speciality segment, imports all of their brands into South Africa as well.
18
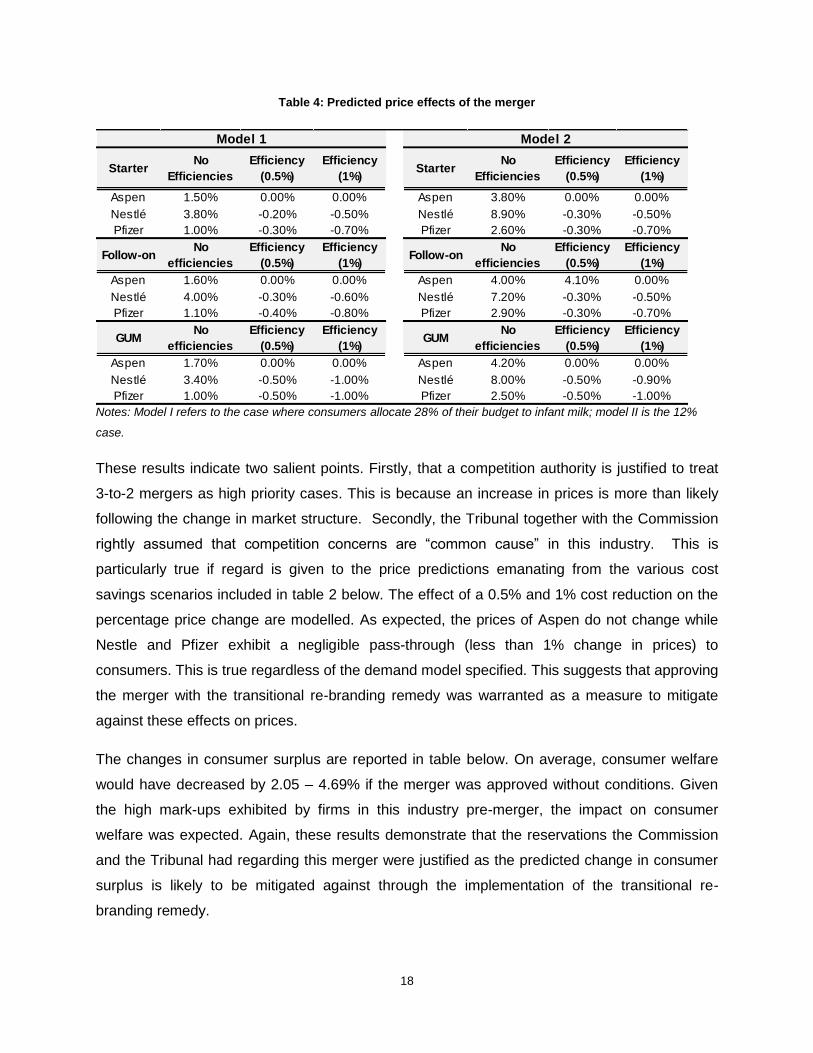
Table 4: Predicted price effects of the merger
Notes: Model I refers to the case where consumers allocate 28% of their budget to infant milk; model II is the 12%
case.
These results indicate two salient points. Firstly, that a competition authority is justified to treat
3-to-2 mergers as high priority cases. This is because an increase in prices is more than likely
following the change in market structure. Secondly, the Tribunal together with the Commission
rightly assumed that competition concerns are “common cause” in this industry. This is
particularly true if regard is given to the price predictions emanating from the various cost
savings scenarios included in table 2 below. The effect of a 0.5% and 1% cost reduction on the
percentage price change are modelled. As expected, the prices of Aspen do not change while
Nestle and Pfizer exhibit a negligible pass-through (less than 1% change in prices) to
consumers. This is true regardless of the demand model specified. This suggests that approving
the merger with the transitional re-branding remedy was warranted as a measure to mitigate
against these effects on prices.
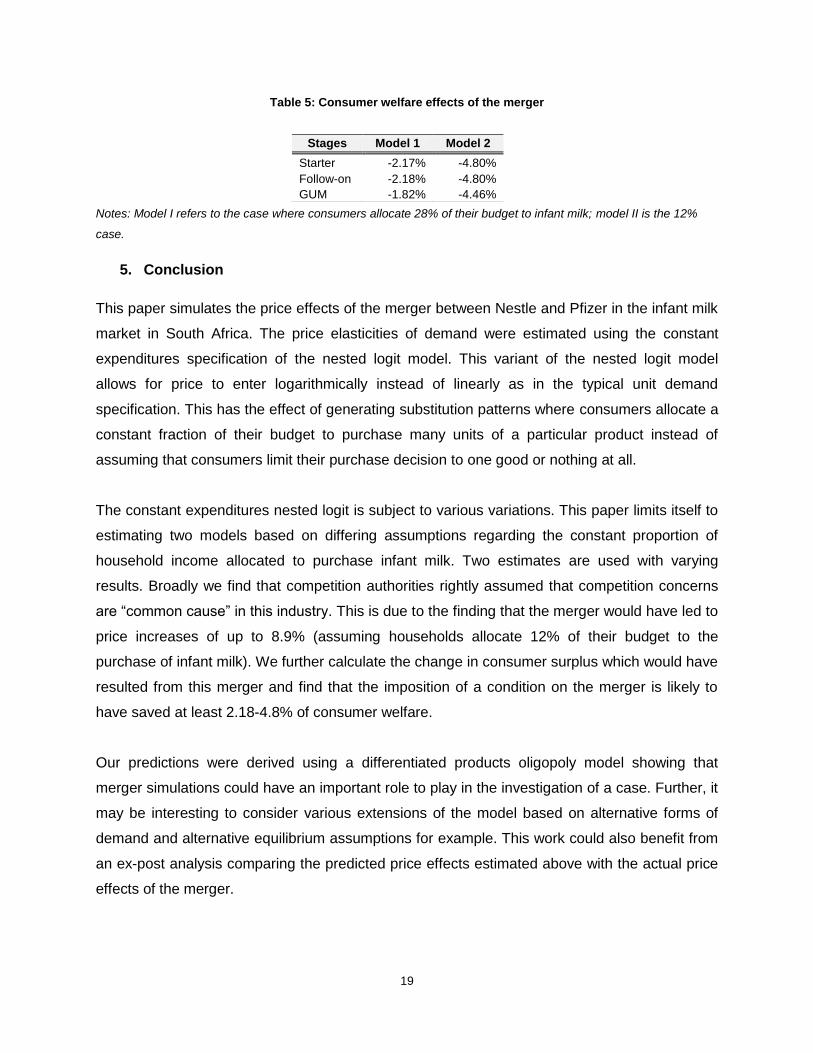
The changes in consumer surplus are reported in table below. On average, consumer welfare
would have decreased by 2.05 – 4.69% if the merger was approved without conditions. Given
the high mark-ups exhibited by firms in this industry pre-merger, the impact on consumer
welfare was expected. Again, these results demonstrate that the reservations the Commission
and the Tribunal had regarding this merger were justified as the predicted change in consumer
surplus is likely to be mitigated against through the implementation of the transitional re-
branding remedy.
StarterNo
Efficiencies
Efficiency
(0.5%)
Efficiency
(1%)Starter
No
Efficiencies
Efficiency
(0.5%)
Efficiency
(1%)
Aspen 1.50% 0.00% 0.00% Aspen 3.80% 0.00% 0.00%
Nestlé 3.80% -0.20% -0.50% Nestlé 8.90% -0.30% -0.50%
Pfizer 1.00% -0.30% -0.70% Pfizer 2.60% -0.30% -0.70%
Follow-onNo
efficiencies
Efficiency
(0.5%)
Efficiency
(1%)Follow-on
No
efficiencies
Efficiency
(0.5%)
Efficiency
(1%)
Aspen 1.60% 0.00% 0.00% Aspen 4.00% 4.10% 0.00%
Nestlé 4.00% -0.30% -0.60% Nestlé 7.20% -0.30% -0.50%
Pfizer 1.10% -0.40% -0.80% Pfizer 2.90% -0.30% -0.70%
GUMNo
efficiencies
Efficiency
(0.5%)
Efficiency
(1%)GUM
No
efficiencies
Efficiency
(0.5%)
Efficiency
(1%)
Aspen 1.70% 0.00% 0.00% Aspen 4.20% 0.00% 0.00%
Nestlé 3.40% -0.50% -1.00% Nestlé 8.00% -0.50% -0.90%
Pfizer 1.00% -0.50% -1.00% Pfizer 2.50% -0.50% -1.00%
Model 2Model 1
19
Table 5: Consumer welfare effects of the merger
Notes: Model I refers to the case where consumers allocate 28% of their budget to infant milk; model II is the 12%
case.
5. Conclusion
This paper simulates the price effects of the merger between Nestle and Pfizer in the infant milk
market in South Africa. The price elasticities of demand were estimated using the constant
expenditures specification of the nested logit model. This variant of the nested logit model
allows for price to enter logarithmically instead of linearly as in the typical unit demand
specification. This has the effect of generating substitution patterns where consumers allocate a
constant fraction of their budget to purchase many units of a particular product instead of
assuming that consumers limit their purchase decision to one good or nothing at all.
The constant expenditures nested logit is subject to various variations. This paper limits itself to
estimating two models based on differing assumptions regarding the constant proportion of
household income allocated to purchase infant milk. Two estimates are used with varying
results. Broadly we find that competition authorities rightly assumed that competition concerns
are “common cause” in this industry. This is due to the finding that the merger would have led to
price increases of up to 8.9% (assuming households allocate 12% of their budget to the
purchase of infant milk). We further calculate the change in consumer surplus which would have
resulted from this merger and find that the imposition of a condition on the merger is likely to
have saved at least 2.18-4.8% of consumer welfare.
Our predictions were derived using a differentiated products oligopoly model showing that
merger simulations could have an important role to play in the investigation of a case. Further, it
may be interesting to consider various extensions of the model based on alternative forms of
demand and alternative equilibrium assumptions for example. This work could also benefit from
an ex-post analysis comparing the predicted price effects estimated above with the actual price
effects of the merger.
Stages Model 1 Model 2
Starter -2.17% -4.80%
Follow-on -2.18% -4.80%
GUM -1.82% -4.46%

20
6. References
Ashenfelter, O., and Hosken, D., 2008. "The Effect of Mergers on Consumer Prices: Evidence from Five Selected Case Studies," NBER Working Papers 13859, National Bureau of Economic Research, Inc. Berry, S., 1994, Estimating Discrete Choice Models of Product Di¤erentiation, RAND Journal of Economics, 25, 242-262. Berry, S., Levinsohn, J., and Pakes, A., 1995. "Automobile Prices in Market Equilibrium," Econometrica, Econometric Society, vol. 63(4), pp.841-90, July. Björnerstedt, J. and Verboven, F., 2012. "Does Merger Simulation Work? A "Natural Experiment" in the Swedish Analgesics Market," CEPR Discussion Papers 9027, C.E.P.R. Discussion Papers Budzinski, O. and Ruhmer, I., 2009. "Merger Simulation in Competition Policy: A Survey," Working Papers 82/09, University of Southern Denmark, Department of Environmental and Business Economics Chintagunta, P., 2002. “Investigating Category Pricing Behavior at a Retail Chain.” Journal of Marketing Research: May 2002, Vol. 39, No. 2, pp.141 – 154. Epstein, R.J., and Rubinfeld,D.L., 2002. "Merger Simulation: A Simplified Approach with New Applications," Industrial Organization 0201002, EconWPA. Grigolon, L., and Verboven, F., 2011. "Nested logit or random coefficients logit? A comparison of alternative discrete choice models of product differentiation," CEPR Discussion Papers 8584, C.E.P.R. Discussion Papers Grzybowski, L., and Pereira, P., 2008. "The complementarity between calls and messages in mobile telephony," Information Economics and Policy, Elsevier, vol. 20(3), pp. 279-287, September Hausman, J., Leonard, G., and Zona, J., 1994. "Competitive Analysis with Differentiated Products," Annales d'Économie et de Statistique No. 34, Econometrics of Imperfect Competition (Apr. - Jun., 1994), pp. 159-180 Ivaldi, M. and Verboven, F., 2005. "Quantifying the effects from horizontal mergers in European competition policy," International Journal of Industrial Organization, Elsevier, vol. 23(9-10), pp. 669-691, December Nevo, A., 2000. "Mergers with Differentiated Products: The Case of the Ready-to-Eat Cereal Industry," RAND Journal of Economics, The RAND Corporation, vol. 31(3), pp. 395-421, Autumn. Mncube, L, Ratshisusu, H. & Dlamini, B (2010), “On Merger Simulation and its Potential Role in South African Merger Control, South African Journal of Economic and Management Sciences, 13 (1) pp 62:75
21
Pinkse, J. & Slade, M., 1996. "A Simple Test for Spatial Correlation in Probit Models," G.R.E.Q.A.M. 96a11, Universite Aix-Marseille III. Verboven, F., 1996, International Price Discrimination in the European car market, RAND Journal of Economics, 27, 240-268 Werden, G. and L. Froeb, 1994, The Effects of Mergers in Differentiated Products Industries: Logit Demand and Market Policy, 10(2), 407-26. Werden, G., & Froeb, L. (2006). Unilateral effects of horizontal mergers. In P. Buccirossi (Ed.), Handbook of antitrust economics. MIT Press.

22
Annexure
Table 6: Pre and post-merger prices
Model 1
Model 2
Starter Pre-
merger price
Post-merger price
Relative change
(%) Starter
Pre-merger price
Post-merger price
Relative change
(%)
No efficiencies No efficiencies
Aspen 117.43 118.93 1.50% Aspen 117.43 121.13 3.80%
Nestlé 106.5 110.69 3.80% Nestlé 106.5 116.33 8.90%
Pfizer 114.96 116.14 1.00% Pfizer 114.96 117.96 2.60%
efficiency 0.5% efficiency 0.5%
Aspen 117.43 117.43 0.00% Aspen 117.43 117.43 0.00%
Nestlé 106.5 106.25 -0.20% Nestlé 106.5 106.23 -0.30%
Pfizer 114.96 114.57 -0.30% Pfizer 114.96 114.56 -0.30%
efficiency 1% efficiency 1%
Aspen 117.43 117.43 0.00% Aspen 117.43 117.43 0.00%
Nestlé 106.5 106 -0.50% Nestlé 106.5 115.58 -0.50%
Pfizer 114.96 114.19 -0.70% Pfizer 114.96 116.93 -0.70%
Follow-on
Pre-merger price
Post-merger price
Price change
(%)
Follow-on
Pre-merger price
Post-merger price
Price change
(%)
No efficiencies No efficiencies
Aspen 118.3 119.91 1.70% Aspen 118.3 122.3 4.00%
Nestlé 113.02 117.4 4.00% Nestlé 113.02 121.13 7.20%
Pfizer 108.27 109.54 1.10% Pfizer 108.27 111.53 2.90%
efficiency 0.5% efficiency 0.5%
Aspen 117.43 118.93 1.70% Aspen 118.3 118.3 4.10%
Nestlé 106.5 110.23 3.60% Nestlé 113.02 112.73 -0.30%
Pfizer 114.96 115.58 0.70% Pfizer 108.27 107.89 -0.30%
efficiency 1% efficiency 1%
Aspen 117.43 118.93 1.80% Aspen 118.3 118.3 0.00%
Nestlé 106.5 109.73 2.50% Nestlé 113.02 112.43 -0.50%
Pfizer 114.96 115.02 0.00% Pfizer 108.27 107.52 -0.70%
GUM Pre-
merger price
Post-merger price
Price change
(%) GUM
Pre-merger price
Post-merger price
Price change
(%)
No efficiencies No efficiencies
Aspen 120.12 121.83 1.80% Aspen 120.12 124.27 4.20%
Nestlé 110.5 114.17 3.40% Nestlé 110.5 119.13 8.00%
Pfizer 149.84 151.18 1.00% Pfizer 149.84 153.25 2.50%
efficiency 0.5% efficiency 0.5%
Aspen 120.12 121.83 1.80% Aspen 120.12 120.12 0.00%
Nestlé 110.5 113.65 2.90% Nestlé 110.5 109.99 -0.50%
Pfizer 149.84 150.44 0.50% Pfizer 149.84 149.1 -0.50%
efficiency 1% efficiency 1%
Aspen 120.12 121.83 1.80% Aspen 120.12 120.12 0.00%
Nestlé 110.5 113.13 2.50% Nestlé 110.5 109.48 -0.90%
Pfizer 149.84 149.7 0.00% Pfizer 149.84 148.36 -1.00%
Related Documents