Irrigation of Cranberries R. Troy Peters, PhD, PE

Welcome message from author
This document is posted to help you gain knowledge. Please leave a comment to let me know what you think about it! Share it to your friends and learn new things together.
Transcript

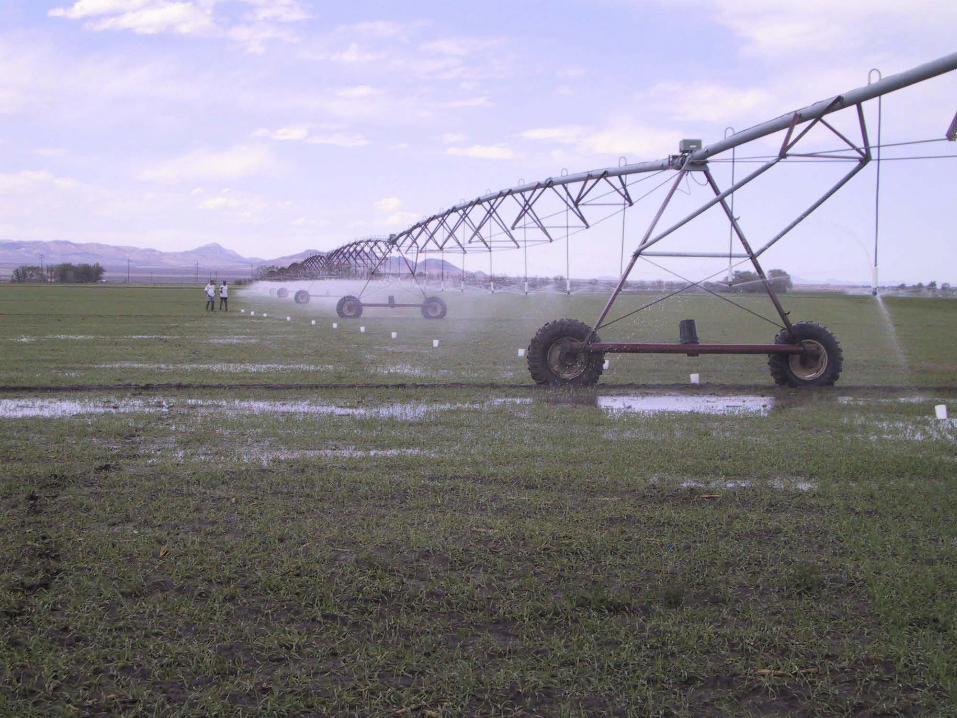
Irrigation of Cranberries
R. Troy Peters, PhD, PE

Courtesy Michael Dukes Univ. Florida

Courtesy Michael Dukes Univ. Florida

Courtesy Michael Dukes Univ. Florida


Courtesy Michael Dukes Univ. Florida


Courtesy Michael Dukes Univ. Florida
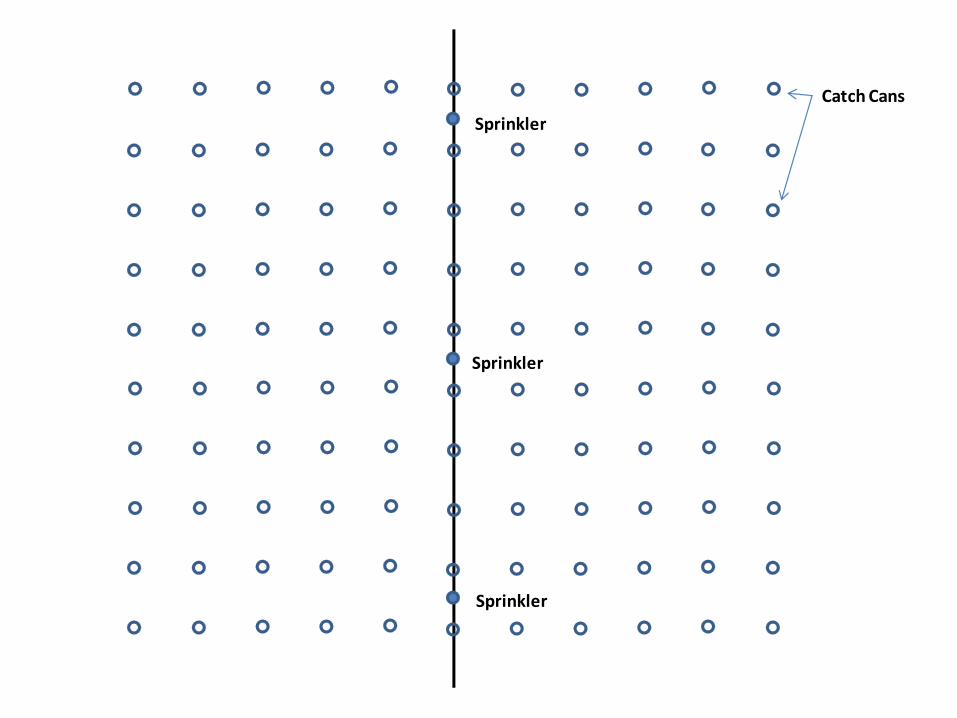
Sprinkler
Sprinkler
Sprinkler
Catch Cans


Calculation of DU
0
0.5
1
1.5
2
2.5
3
3.5
4
1 4 7 10 13 16 19 22 25 28 31 34 37 40 43 46 49 52 55Data Point
Cat
ch (i
nche
s)
AverageLow Quarter
Overall Average
AvgterAvgLowQuarDU =
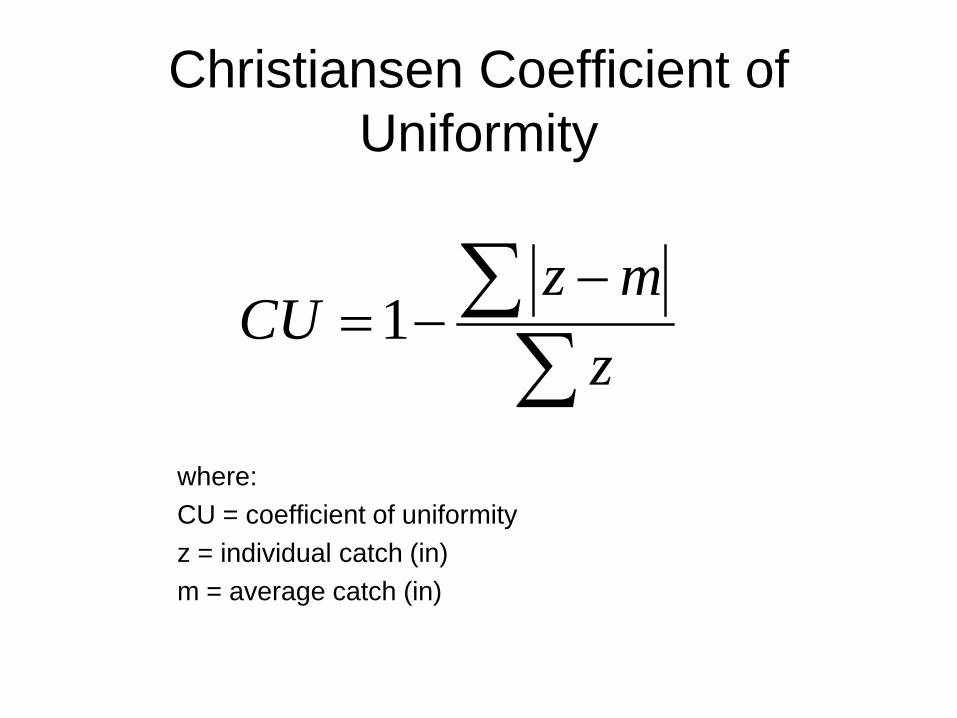
Christiansen Coefficient of Uniformity
where:CU = coefficient of uniformityz = individual catch (in)m = average catch (in)
∑∑ −
−=z
mzCU 1
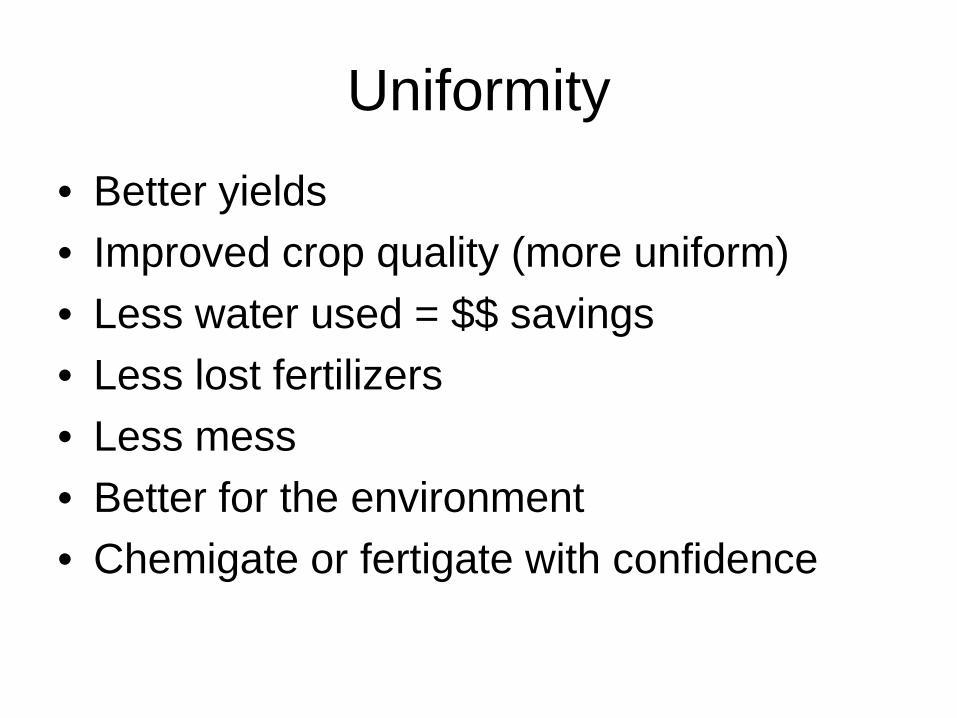
Uniformity• Better yields• Improved crop quality (more uniform)• Less water used = $$ savings• Less lost fertilizers• Less mess• Better for the environment• Chemigate or fertigate with confidence

Irrigation Efficiency

Irrigation Efficiency Defined
EfficiencyWaterBenficiallyUsed
WaterFlowingOntoField=
edWaterApplidInSoilWaterStoreynEfficiencApplicatio =

Forms of Water Loss
• Wind Drift• Droplet Evaporation• Evaporation from Foliage• Evaporation from Soil Surface• Runoff• Deep Percolation
– Overwatering– Non Uniformity


Runoff

Improve Efficiencies By:
• Get a good design• Maintain your system
– Replace worn nozzles– Fix leaky pipes
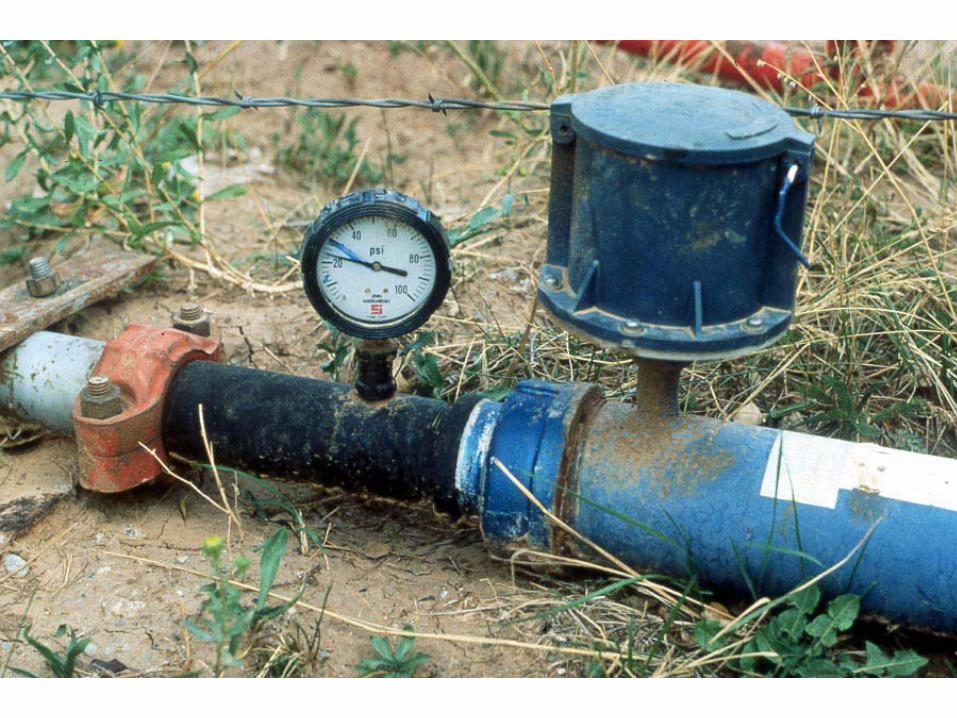
• Improve management– Irrigation Scheduling– Operate at designed pressure and flow– Irrigate on calm cool days– Increase Application Rate

Why Should I Care?
• Even if the water is free, poor irrigation management has very real costs
• Yields and quality are very stronglycorrelated with irrigation water management
• Expensive fertilizers washed out• Environmental damage

Over-Irrigating
• Increased incidence of plant diseases– Blights, molds, rots, wilts
• Reduced storability• Difficulty with harvesting and cultural
operations• Less oxygen in root zone, yield loss• Additional labor, pumping, fertilizer costs
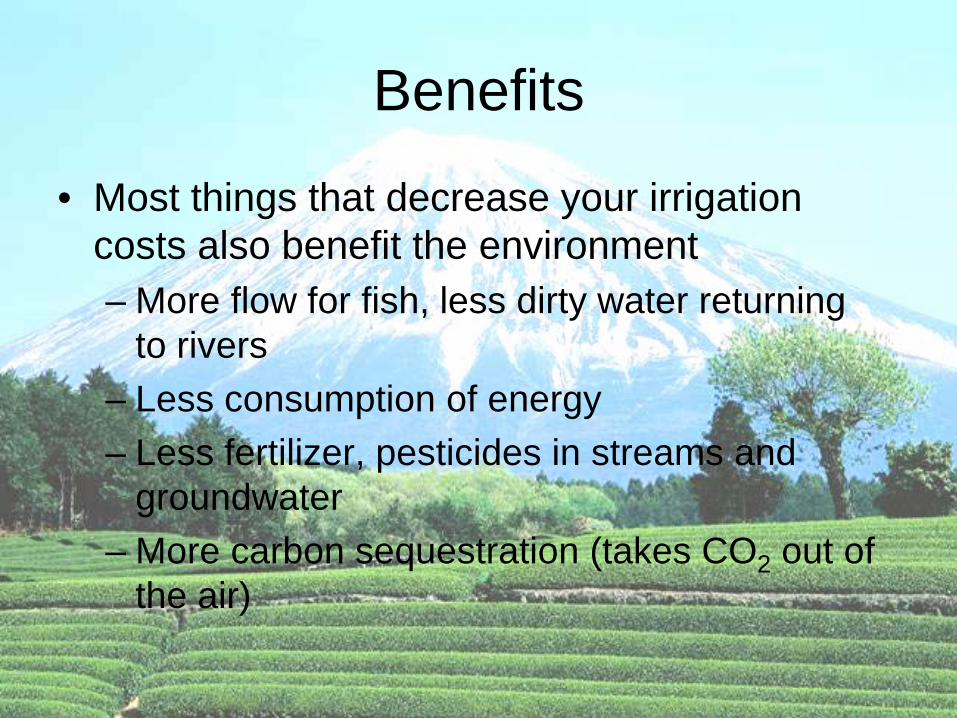
Benefits
• Most things that decrease your irrigation costs also benefit the environment– More flow for fish, less dirty water returning
to rivers– Less consumption of energy– Less fertilizer, pesticides in streams and
groundwater– More carbon sequestration (takes CO2 out of
the air)

But Make Some Real Money!
• Saving money small compared to the yield increases and crop quality improvements common from improved irrigation water management.
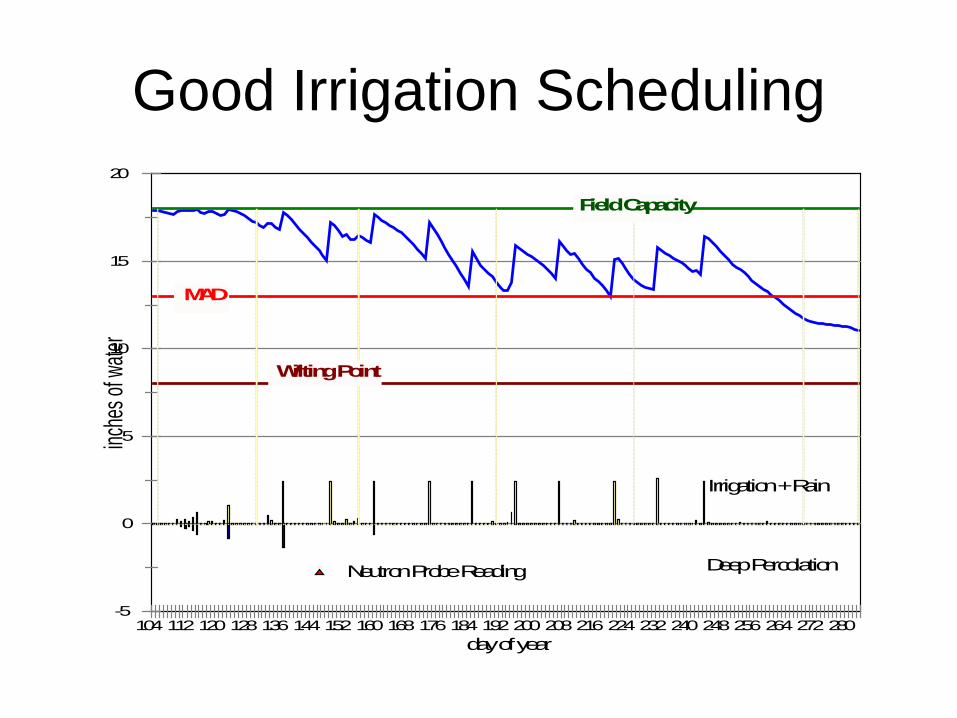
Good Irrigation Scheduling
-5
0
5
10
15
20
inche
s of w
ater
104 112 120 128 136 144 152 160 168 176 184 192 200 208 216 224 232 240 248 256 264 272 280day of year
Neutron Probe Reading
Irrigation + Rain
Deep Percolation
Field Capacity
Wilting Point
MAD

Methods Used in Washington to Determine When to Irrigate
0
2000
4000
6000
8000
10000
Con
ditio
n of
Cro
p
Feel
of S
oil
Pers
onal
Cal
enda
rD
ecid
ed b
y Irr
ig. D
ist.
Dai
ly ET
Rep
orts
Soil
Moi
stur
e Se
nsor
Wat
ch N
eigh
bors
Con
sulta
nt
Oth
erPl
ant M
oist
ure
Sens
orC
ompu
ter M
odel
s
Num
ber o
f Far
ms

Levels of Irrigation Scheduling
• Guessing / Same schedule all season• Kicking the dirt / Looking at the plants
• Look and feel method using shovel or soil probe
• Checkbook method / ET (AgWeatherNet)• Soil moisture monitoring• Neutron probe + checkbook (consultant)
especially cost effective for high value vegetable crops
Best
Worst
Pro
fitab
le g
row
ers
Less
pro
fitab
le

Questions?

Pumps and Energy

Water and Power
100/EfficiencyPressureFlowPower ×
=
Pay for power (kW) over time (hrs) = kW-hr (KWH)

Centrifugal Pumps


Simple Unit Conversion
1 in/day = 18.86 gpm/acre(use 19 to get close)
• Multiply maximum water use requirement in inches per day by 18.86 gpm/acre.
• Divide gpm/acre by 18.86 to get in/day.
Examples:0.2 in/day = 3.8 gpm/acre7.5 gpm/acre = 0.4 in/day

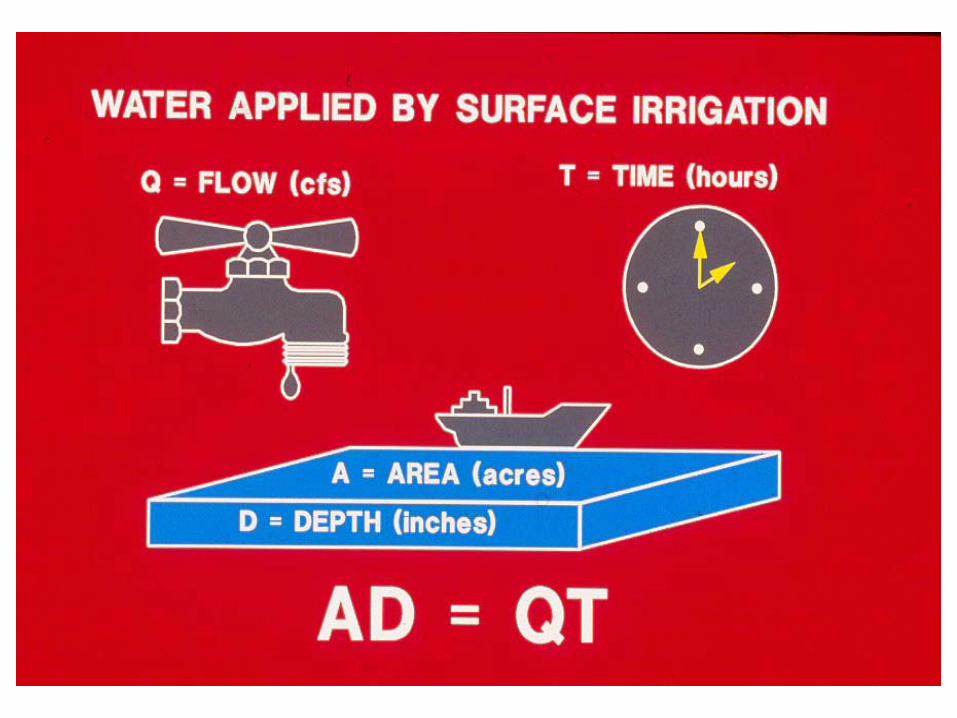
CALCULATING APPLICATION RATE
• Set Sprinklers– AR = (96.3 x Qn) / (Ss x Sl) x Eff.
• Center Pivot– AR = (96.3 x Qc) / (Ac x 43,560) x Eff.
• Drip Tubing– AR = (0.963 x Qt) / (St) x Eff.
3 phase vs. Single phase• Power is generated in 3 phase• 3 phase is ideal for electric induction motors• Higher starting torque• More efficient• Less expensive• Smaller motor• Simple and reliable (less vibration)• 3 phase motors are more efficient at higher hp• Necessary for pumps > 10 hp• Not typically supplied to residences

Variable Frequency Drives
• Changes motor spin speed. AC→DC→AC• Solid state. No moving parts. Cost ↓ Quality ↑• Works with existing motor and pump.• Can use a 3-phase motor on single phase
power source
www.joliettech.com

Variable Frequency Drives
• Power savings.– No burning up pressure across valves.– Soft starts – longer pump life
• Produce heat that must be vented. • ~ $100/hp installed• Possible cost share from power company.
(BPA)• Cost effective if flows vary widely and for
long periods of time.

Cost Sharing• EQUIP – USDA, NRCS
– Major efficiency upgrades, surface to sprinkler• Conservation districts• Bonneville Power Administration – For energy
saving projects. – Through electric utility provider. – SIS - $5/acre. Grower must get weekly report.– $0.15/KWH saved or 70% of improvement, whichever
is less.– Must verify energy savings

http://irrigation.wsu.edu

Chemigation

Chemigation
General term that includes:• Fertigation• Herbigation• Insectigation• Fungigation• Nematigation

Advantages of Chemigation• Economics• Timeliness• Reduced soil compaction and crop damage• Operator safety
Disadvantages• High management (need to know algebra)• Additional equipment required

Calculating Injection Rates
1. Batch/Bulk Applications– Drip, Hand-line, Wheel-lines, Solid set
2. Continuous Move Injections– Center pivots, Linear Moves, Travelers,
Booms3. Controlling water chemistry
– Drip (algae/bacteria growth control, root intrusion)

Batch/Bulk Applications
Timing is Key
Batch Applications
– Herbicides and Insecticides• Apply during the last few minutes (follow
the label)– Fertilizers
• Time to put the chemical in the active root zone, and so that the injection is finished before irrigation is done. Rate is less critical
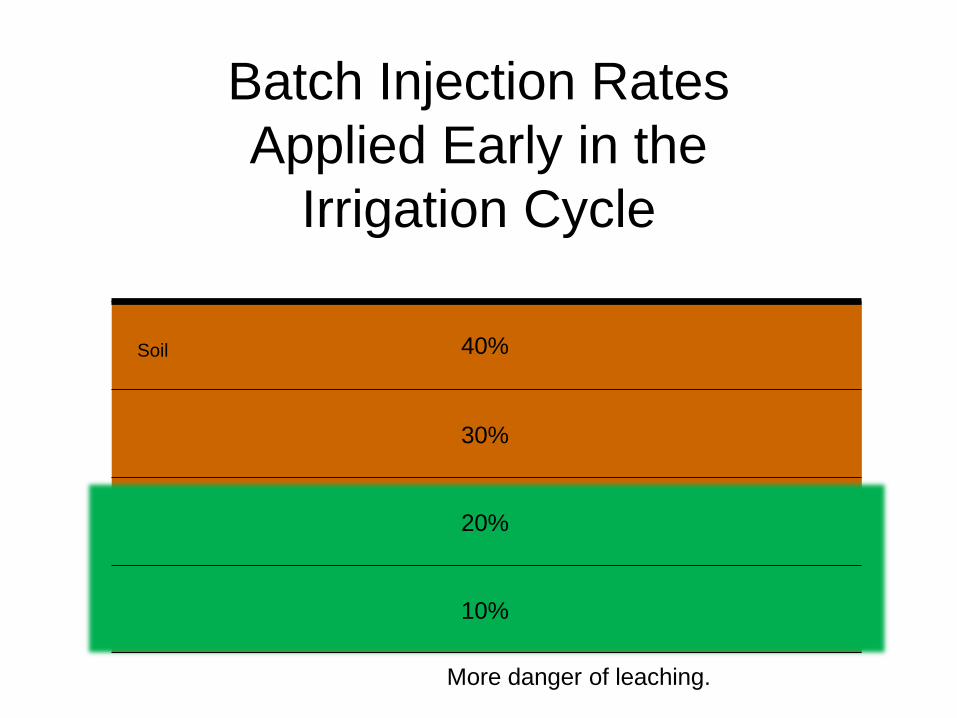
40%
30%
20%
10%
Batch Injection RatesApplied Early in the
Irrigation Cycle
Soil
More danger of leaching.

40%
30%
20%
10%
Batch Injection RatesApplied Late in the
Irrigation Cycle
Soil
Don’t leave chemicals in the lines.
Less danger of leaching.
Batch Application
• Weight Method– Mix desired amount of material in a
convenient amount of water.– Inject until it is gone.– Injection rate set to limit irrigation line
concentration and injection time.• Volume Method
– Similar except applying a set volume.

Injection Rate
TVolIc =
Ic = Injection Rate (gpm)Vol = Volume of Chemical to inject (gallons)T = Injection Time (min)

Calculate Injection Rate by Mass(given lb/acre specs)
Ic = Chemical Injection Rate (gal/min)Qw = Quantity of chemical to be applied (lb/acre)A = Area (acres)C = Concentration of injected solution (lb/gal)T = Injection Time (min)
TCAQI w
c ××
=
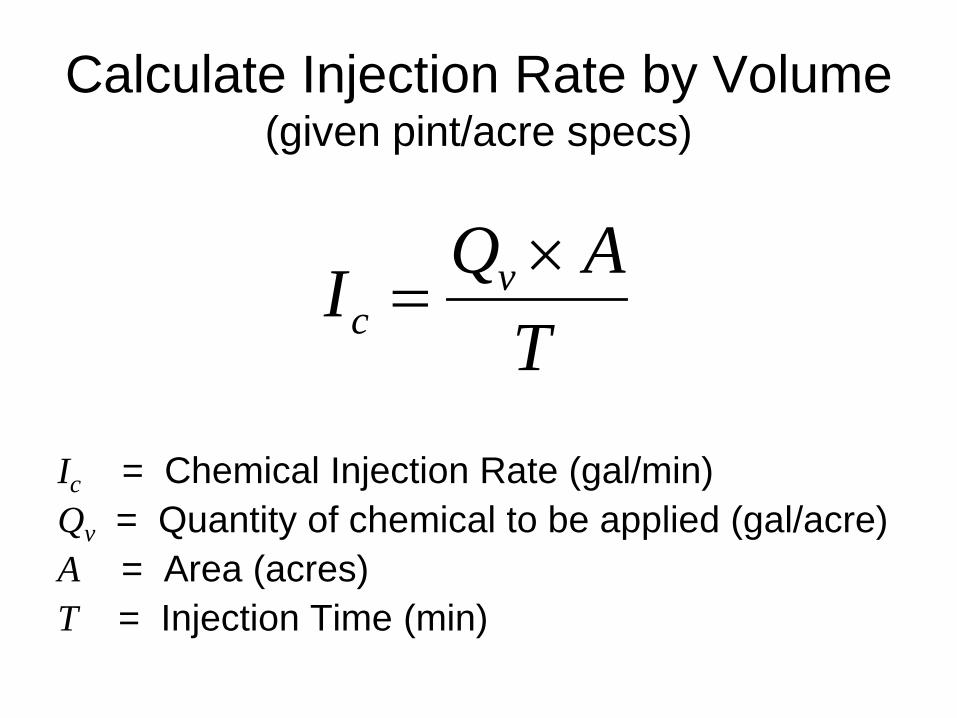
Calculate Injection Rate by Volume (given pint/acre specs)
Ic = Chemical Injection Rate (gal/min)Qv = Quantity of chemical to be applied (gal/acre)A = Area (acres)T = Injection Time (min)
TAQI v
c×
=

Venturi Valves and other proportional rate injectors
Tank mixture concentration is key
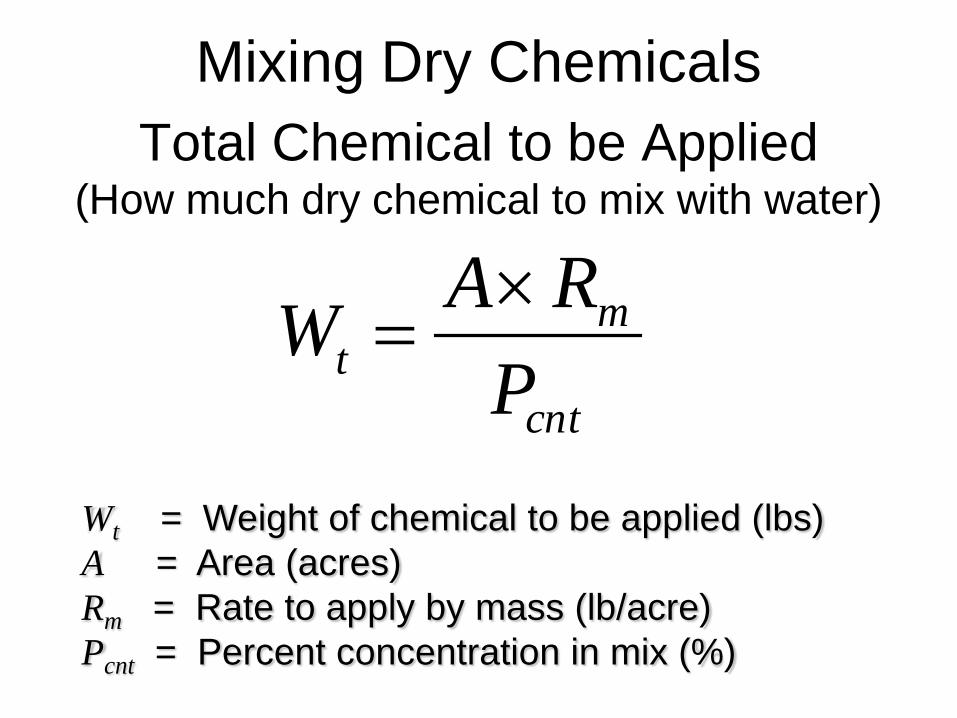
Total Chemical to be Applied(How much dry chemical to mix with water)
cnt
mt P
RAW ×=
Wt = Weight of chemical to be applied (lbs)A = Area (acres)Rm = Rate to apply by mass (lb/acre)Pcnt = Percent concentration in mix (%)
Mixing Dry Chemicals
Related Documents