Irrigation Detection by Car: Computer Vision and Sensing for the Detection and Geolocation of Irrigated and Non-irrigated Farmland Weifan Jiang Department of Computer Science Columbia University New York, NY [email protected] Vivek Kumar Department of Computer Science Columbia University New York, NY [email protected] Nikhil Mehta Department of Computer Science Columbia University New York, NY [email protected] Jack Bott Department of Electrical Engineering Columbia University New York, NY [email protected] Vijay Modi Department of Mechanical Engineering Columbia University New York, NY [email protected] Abstract—Irrigation can greatly increase the income of small- holder farmers in sub-Saharan Africa. By providing information about current irrigation utilization, or lack thereof, we seek to encourage investment in irrigation systems and their supporting infrastructure. In this paper, we describe the design, prototyping, and testing of a novel, cost-effective, and reliable computer vision system that is capable of locating irrigated plots at scale. Our system will be mounted to a vehicle and record the depth of objects in the camera’s view while the vehicle is in motion. The GPS coordinates of objects are computed based on estimated depth, vehicle coordinates, and orientation, available from included sensors. We tested our prototype on objects at various distances from the system and achieved feasible accuracy with acceptable error in the estimated depth. In the future, we hope to deploy the system in parts of sub-Saharan Africa, to detect and geolocate irrigated agricultural plots during the dry season. Then we plan to use that collected data to inform and train machine learning models that use remote sensing and satellite imagery. Index Terms—Computer Vision, Irrigation, Agriculture (SDG2), Productive Use, Clean Energy (SDG7), Economic Growth (SDG8) I. I NTRODUCTION The impetus for our system stems from the simple idea that irrigated farmland produces significantly higher crop yields. Irrigation is necessary for horticulture, and horticultural crops are more valuable. As of 2013, there were approximately 33 million smallholder farms in sub-Saharan Africa, comprising 80% of the total farms and contributing 90% of the food supply. Africa’s population continues to grow rapidly which increases the importance of these farms and their productivity throughout the year [2]. According to a 2007 report by the USDA Foreign Agricultural Service, rain-fed agricultural work Partial Support for the Senegal pilots came from OFID and partial support for the camera effort from CWP. employed 75% of the workforce in Senegal with only 5% of the available land using irrigation [3]. From pilot pro- grams done by The Quadracci Sustainable Engineering Lab at Columbia University (qSEL) in Senegal, we know anecdotally that the majority of affordable irrigation systems on the market in Senegal are inefficient gas or diesel surface pumps [4]. From visits to several different regions in Africa, members of qSEL observed that many farmers do not irrigate their crops. Pilot projects by the same lab in Senegal have shown that irrigation can add additional growing seasons, effectively doubling farmer incomes in some instances. Farmers rely on growing and selling produce to make money. To grow a steady supply of crops, farmers need steady access to water. Dry seasons last most of the year in many regions of sub-Saharan Africa, with abbreviated rainy seasons lasting only one to three months. As such rainfall collection alone cannot meet farmers’ needs. Even in regions with extended rainy seasons, it is impossible to ensure constant rainfall at the correct rate, making irrigation a boon for production there as well. Geolocating irrigated and non-irrigated farmland provides several benefits. First, pump-driven electricity demand can be mapped and overlaid on-grid power transmission lines to show off-grid consumption. This would encourage investment from utility providers to electrify rural parts of the continent. Electrification would decrease the initial capital cost of irri- gation for farmers, which in turn incentivizes more farmers to irrigate. As was found in qSEL’s pilot pumping systems in Senegal, when the cost to irrigate is low enough farmers water more, especially in dry seasons, and thereby experience greater yields. With the GDP of sub-Saharan Africa currently directly tied to agriculture, an increase in production to feed the increasingly large population can only grow the region’s world standing. Second, a visualization of areas with high

Welcome message from author
This document is posted to help you gain knowledge. Please leave a comment to let me know what you think about it! Share it to your friends and learn new things together.
Transcript

Irrigation Detection by Car: Computer Vision andSensing for the Detection and Geolocation of
Irrigated and Non-irrigated FarmlandWeifan Jiang
Department of Computer Science Columbia University
New York, [email protected]
Vivek KumarDepartment of Computer Science
Columbia UniversityNew York, NY
Nikhil MehtaDepartment of Computer Science
Columbia UniversityNew York, NY
Jack BottDepartment of Electrical Engineering
Columbia UniversityNew York, NY
Vijay ModiDepartment of Mechanical Engineering
Columbia UniversityNew York, NY
Abstract—Irrigation can greatly increase the income of small-holder farmers in sub-Saharan Africa. By providing informationabout current irrigation utilization, or lack thereof, we seek toencourage investment in irrigation systems and their supportinginfrastructure. In this paper, we describe the design, prototyping,and testing of a novel, cost-effective, and reliable computervision system that is capable of locating irrigated plots atscale. Our system will be mounted to a vehicle and record thedepth of objects in the camera’s view while the vehicle is inmotion. The GPS coordinates of objects are computed based onestimated depth, vehicle coordinates, and orientation, availablefrom included sensors. We tested our prototype on objects atvarious distances from the system and achieved feasible accuracywith acceptable error in the estimated depth. In the future,we hope to deploy the system in parts of sub-Saharan Africa,to detect and geolocate irrigated agricultural plots during thedry season. Then we plan to use that collected data to informand train machine learning models that use remote sensing andsatellite imagery.
Index Terms—Computer Vision, Irrigation, Agriculture(SDG2), Productive Use, Clean Energy (SDG7), EconomicGrowth (SDG8)
I. INTRODUCTION
The impetus for our system stems from the simple idea thatirrigated farmland produces significantly higher crop yields.Irrigation is necessary for horticulture, and horticultural cropsare more valuable. As of 2013, there were approximately 33million smallholder farms in sub-Saharan Africa, comprising80% of the total farms and contributing 90% of the foodsupply. Africa’s population continues to grow rapidly whichincreases the importance of these farms and their productivitythroughout the year [2]. According to a 2007 report by theUSDA Foreign Agricultural Service, rain-fed agricultural work
Partial Support for the Senegal pilots came from OFID and partial supportfor the camera effort from CWP.
employed 75% of the workforce in Senegal with only 5%of the available land using irrigation [3]. From pilot pro-grams done by The Quadracci Sustainable Engineering Lab atColumbia University (qSEL) in Senegal, we know anecdotallythat the majority of affordable irrigation systems on the marketin Senegal are inefficient gas or diesel surface pumps [4].
From visits to several different regions in Africa, membersof qSEL observed that many farmers do not irrigate theircrops. Pilot projects by the same lab in Senegal have shownthat irrigation can add additional growing seasons, effectivelydoubling farmer incomes in some instances. Farmers rely ongrowing and selling produce to make money. To grow a steadysupply of crops, farmers need steady access to water. Dryseasons last most of the year in many regions of sub-SaharanAfrica, with abbreviated rainy seasons lasting only one tothree months. As such rainfall collection alone cannot meetfarmers’ needs. Even in regions with extended rainy seasons,it is impossible to ensure constant rainfall at the correct rate,making irrigation a boon for production there as well.
Geolocating irrigated and non-irrigated farmland providesseveral benefits. First, pump-driven electricity demand canbe mapped and overlaid on-grid power transmission lines toshow off-grid consumption. This would encourage investmentfrom utility providers to electrify rural parts of the continent.Electrification would decrease the initial capital cost of irri-gation for farmers, which in turn incentivizes more farmersto irrigate. As was found in qSEL’s pilot pumping systemsin Senegal, when the cost to irrigate is low enough farmerswater more, especially in dry seasons, and thereby experiencegreater yields. With the GDP of sub-Saharan Africa currentlydirectly tied to agriculture, an increase in production to feedthe increasingly large population can only grow the region’sworld standing. Second, a visualization of areas with high

farming activity but little irrigation could promote investmentin irrigation systems by businesses and aid organizations inthose locations. Data is needed to motivate investment, weseek to provide appropriate data.
II. BACKGROUND
The process of detecting irrigated farmland at scale bearsseveral challenges. In Europe and the United States, farm plotsof several hundred acres are easily detectable from space.Their African counterparts are commonly just an acre or lessand are thus much harder to detect from that distance. In theUnited States, the USDA executes an Agriculture Census thatprovides a complete list of U.S. farms and ranches, small andlarge, across the country. It also provides a data query toolso this information can be swiftly processed and redirectedto other studies or pursuits [1]. The information available forour target area is much more limited and so data collectioninitiatives are vital.
To date, there are several data collection technologies thatcan be employed. Individual farmer surveys, taken in anunbiased distribution, could provide the most accuracy but cancost between $20 to $40 per farmer from our experience. Thisexpense, extended across the entire continent of Africa is outof reach with our resources and potentially unbalanced withthe benefit of such a survey. Drones could be used to capturea high detail aerial view and GPS coordinates directly abovedesired features. However, drone technology is limited by veryshort battery life, high expense per unit, and difficulty in flighttraining. This makes the process of mapping large regions ofland infeasible. There is some street view imagery availablefrom mapping services, like Google and OpenStreetCam, butit is limited in rural regions of Africa. Finally, pre-existingsatellite data on its own is not enough as irrigated farmlandplots in Africa tend to be small and exhibit many similarfeatures to say a cluster of trees when viewed from space.
Our solution is to gather GPS coordinates of irrigatedagricultural plots from a moving field vehicle as it goes aboutother duties or on dedicated scouting trips. This method canbe used as a middle ground between expensive hand-collectedsurveys and satellite imagery analysis, which is speculativewithout ground truth. We aim to lower the cost and increase theavailability of ground truth for the training of satellite imagerymachine learning models.
Fig. 1. Concept Sketch.
III. CONCEPT
Our solution for cost-effective, reliable irrigation detectionat scale is designed to be a portable multi-camera stereo visionsystem mounted to a car. As the car is moving, we want togather the GPS coordinates of each irrigated field we pass. Inorder to realize this goal, the following information is requiredat each timestamp:
• The camera system’s geolocation• The system’s orientation in relation to its GPS coordinates• The distance between our target and the camera system• The angle of the target from the camera’s capture planeFig. 1 shows how the requisite information can be used to
extrapolate the GPS coordinates of irrigated plots. Our systemis capable of collecting all the requisite information at anygiven time. The system’s GPS coordinates and orientation arecaptured by onboard sensors and are logged constantly witha corresponding timestamp. The distance between the targetobject and the camera unit is estimated by stereo vision, acomputer vision technique to extract 3D information frommultiple 2D views of a scene. By recording videos with twoadjacent cameras simultaneously the depth of objects in bothframes can be estimated. A timestamp is recorded with eachvideo frame taken.
After video capture, human taggers will manually examinethe video frames and identify the ones with irrigated plots inthe middle of the scene, to fix the angle between the objectand camera capture plane at approximately 90 degrees. Bymatching timestamps, the estimated depth of plots in taggedframes is paired with the camera system geolocation andorientation. Then the GPS coordinates of irrigated plots canbe calculated.
Note that the area of farmland is not being detected withthis method, simply the location of an irrigated piece of landwithin view of the roadside. However, the geolocation itselfis practically valuable as this tagged GPS data can then betranslated to its respective place on satellite imagery to supportthe training of a machine learning model being fed high-resolution satellite imagery. Our street view tagging serves as aquasi-ground truth that prevents satellite imagery from beingoverly speculative and allows irrigation detection to happeneffectively without having to speak to each farmer. We believeour solution has the potential to be deployed in much of thedeveloping world.
IV. PROTOTYPE
Initial prototypes were built for lab and local testing. Furtherunits are being prepared to send in small numbers to datacollection teams in Africa.
A. Hardware Architecture
The prototype units were designed to be built with all offthe shelf components for around 500 USD per system. Thisprice allows for feature detection on one side of the car andonly includes materials, not shipping or assembly. The systemconsists of an enclosure that houses power converters andenergy storage, a Raspberry Pi 3+ compute module board,

Fig. 2. Prototype Mounted to a Car.
and the requisite sensors. The Raspberry Pi is a single boardcomputer running Raspbian Linux, an offshoot of Debian forsmall ARM Broadcom processors. Two 5 megapixel fisheyecameras with OV5647 CMOS sensors are mounted on theexterior of the enclosure with a baseline distance betweenthe cameras of 200mm. The other requisite sensors include aMTK3339 GPS module to capture the location of the camerasystem and thereby the car, a Bosch BNO055 9-DOF sensorto retrieve the Euler and Quaternion vectors of our camerasystem, and a DS3231 precision RTC IC to maintain systemtime. The units can be powered with an AC/DC wall powersupply or a DC car cigarette lighter port and stores energy ina Lithium Ion battery to avoid problems presented by powerfluctuations. Fig. 2 shows our prototype mounted to a car.
V. SOFTWARE PIPELINE
In the software pipeline, we describe how we extract thegeolocation of irrigated plots from field videos.
A. Calibration
Camera calibration is the first step in the software pipeline.It is the process of estimating the parameters needed toconstruct a mathematical model of the camera system. Weuse the OpenCV implementation of the multiplane calibrationtechnique (also known as Zhang’s method) [5]. The calibrationis completed by taking pictures of a chessboard pattern frommultiple perspectives and solving the homogeneous linearsystem that is produced after matching the same points in theleft and right cameras.
The estimated camera parameters are then used to repro-ject the left and right images (also called a stereo pair) tothe same plane, making the disparity only in the horizontaldirection. This step is called rectification and is a common pre-processing practice for depth analysis using stereo vision. Anexample of rectification using our system is shown in Fig. 3.
B. Data Capture
Data capture occurs on our car-mounted prototype units.Captured information is stored on a microSD card which
Fig. 3. Before (top pair) and after (bottom pair) rectification. Note in thebottom rectified pair, distorted edges are reprojected to be straight and at thesame horizontal level (shown by red lines).
can be removed after testing for easy data transfer to acentral computing resource where additional processing andcomputations can be applied.
Before capturing data in the field, we calibrate the camerasystem to obtain necessary parameters for rectification. Whentaking stereo videos, each frame is rectified before it is writtento disk. This allows our post-processing to directly work withcoplanar stereo pairs that only have horizontal disparity.
Fig. 4. Object Tagging and Result Display in GUI.
C. Object Tagging
The next step is to tag objects of interest, such as irrigatedplots, from all video frames taken. We prepared a simplegraphical user interface to support manual tagging and thedepth estimation of tagged objects.
Upon inputting required files, the GUI allows human taggersto examine all stereo pairs in the videos selected. The humantagger then manually chooses the frame(s) where the objectof interest is present in the middle of the scene and marks theobject by clicking on the left stereo image. A red dot will bedrawn at the selected location (Fig. 4, left).
After the user selects to proceed, the next window showsthe estimated depth of all tagged objects. (Fig. 4, right)
VI. DEPTH ESTIMATION
Estimating the depth of tagged objects starts with creatinga disparity map. For a given rectified stereo pair, the disparity
map gives us the horizontal distance between a pixel in the leftframe and right frame. The intuition is that the farther an objectis from the cameras, the smaller the disparity of the objectbetween left and right images is. There are many algorithmsto compute the disparity map. We experimented with BlockMatching and Semi-global Block Matching (SGBM), both ofwhich are provided with OpenCV functionality [6]. We foundthat the SGBM algorithm gave us better results.
Next, we perform a post-filtering technique, based on theFast Guided Global Interpolation Algorithm for depth andmotion [7], to refine the quality of the disparity map byimproving consistency between the disparity map and sourceimages. This is a common practice for improving the qualityof a disparity map. We used the OpenCV functionality for thisfiltering algorithm.
Once we have a filtered disparity map, we can calculate thedistance, Z, with the following formula. [8]
Z = (f ∗ b)/d (1)
Where f is the focal length (estimated by calibration), b isthe baseline (distance between two cameras, measured from setup), and d is the disparity. We plug the disparity of the taggedobject into the formula to calculate the distance. Fig. 4, rightshows an example of displaying disparity map and estimateddepth in the GUI, the depth results can be exported to a CSV.
The estimated depth, along with vehicle GPS coordinatesand orientation (both available from sensor outputs) will beused to reconstruct the GPS coordinates of tagged objects.
VII. INTERIM RESULTS
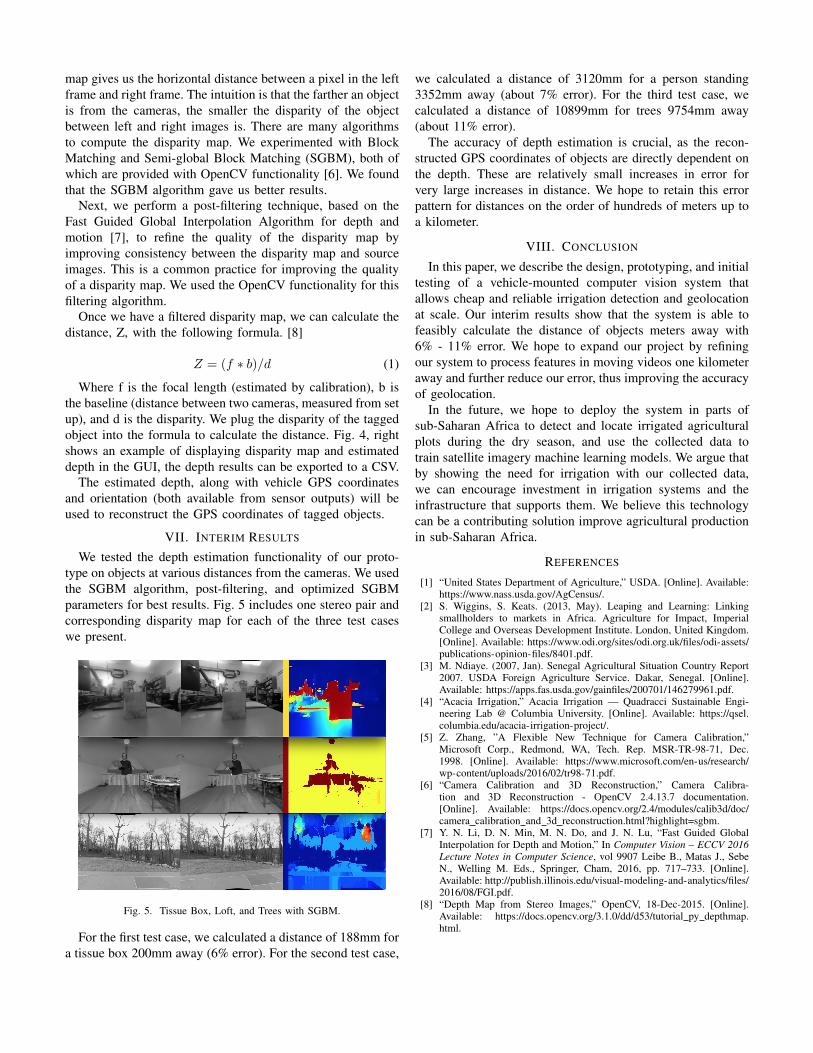
We tested the depth estimation functionality of our proto-type on objects at various distances from the cameras. We usedthe SGBM algorithm, post-filtering, and optimized SGBMparameters for best results. Fig. 5 includes one stereo pair andcorresponding disparity map for each of the three test caseswe present.
Fig. 5. Tissue Box, Loft, and Trees with SGBM.
For the first test case, we calculated a distance of 188mm fora tissue box 200mm away (6% error). For the second test case,
we calculated a distance of 3120mm for a person standing3352mm away (about 7% error). For the third test case, wecalculated a distance of 10899mm for trees 9754mm away(about 11% error).
The accuracy of depth estimation is crucial, as the recon-structed GPS coordinates of objects are directly dependent onthe depth. These are relatively small increases in error forvery large increases in distance. We hope to retain this errorpattern for distances on the order of hundreds of meters up toa kilometer.
VIII. CONCLUSION
In this paper, we describe the design, prototyping, and initialtesting of a vehicle-mounted computer vision system thatallows cheap and reliable irrigation detection and geolocationat scale. Our interim results show that the system is able tofeasibly calculate the distance of objects meters away with6% - 11% error. We hope to expand our project by refiningour system to process features in moving videos one kilometeraway and further reduce our error, thus improving the accuracyof geolocation.
In the future, we hope to deploy the system in parts ofsub-Saharan Africa to detect and locate irrigated agriculturalplots during the dry season, and use the collected data totrain satellite imagery machine learning models. We argue thatby showing the need for irrigation with our collected data,we can encourage investment in irrigation systems and theinfrastructure that supports them. We believe this technologycan be a contributing solution improve agricultural productionin sub-Saharan Africa.
REFERENCES
[1] “United States Department of Agriculture,” USDA. [Online]. Available:https://www.nass.usda.gov/AgCensus/.
[2] S. Wiggins, S. Keats. (2013, May). Leaping and Learning: Linkingsmallholders to markets in Africa. Agriculture for Impact, ImperialCollege and Overseas Development Institute. London, United Kingdom.[Online]. Available: https://www.odi.org/sites/odi.org.uk/files/odi-assets/publications-opinion-files/8401.pdf.
[3] M. Ndiaye. (2007, Jan). Senegal Agricultural Situation Country Report2007. USDA Foreign Agriculture Service. Dakar, Senegal. [Online].Available: https://apps.fas.usda.gov/gainfiles/200701/146279961.pdf.
[4] “Acacia Irrigation,” Acacia Irrigation — Quadracci Sustainable Engi-neering Lab @ Columbia University. [Online]. Available: https://qsel.columbia.edu/acacia-irrigation-project/.
[5] Z. Zhang, ”A Flexible New Technique for Camera Calibration,”Microsoft Corp., Redmond, WA, Tech. Rep. MSR-TR-98-71, Dec.1998. [Online]. Available: https://www.microsoft.com/en-us/research/wp-content/uploads/2016/02/tr98-71.pdf.
[6] “Camera Calibration and 3D Reconstruction,” Camera Calibra-tion and 3D Reconstruction - OpenCV 2.4.13.7 documentation.[Online]. Available: https://docs.opencv.org/2.4/modules/calib3d/doc/camera calibration and 3d reconstruction.html?highlight=sgbm.
[7] Y. N. Li, D. N. Min, M. N. Do, and J. N. Lu, “Fast Guided GlobalInterpolation for Depth and Motion,” In Computer Vision – ECCV 2016Lecture Notes in Computer Science, vol 9907 Leibe B., Matas J., SebeN., Welling M. Eds., Springer, Cham, 2016, pp. 717–733. [Online].Available: http://publish.illinois.edu/visual-modeling-and-analytics/files/2016/08/FGI.pdf.
[8] “Depth Map from Stereo Images,” OpenCV, 18-Dec-2015. [Online].Available: https://docs.opencv.org/3.1.0/dd/d53/tutorial py depthmap.html.
Related Documents