Chapter 1 IRREVERSIBILITY, UNCERTAINTY, AND THE ADOPTION OF TRANSGENIC CROPS: EXPERIENCES FROM APPLICATIONS TO HT SUGAR BEET, HT CORN, AND Bt CORN Sara Scatasta*, Justus Wesseler*, and Matty Demont † *Wageningen University, The Netherlands, and † Catholic University, Leuven, Belgium Abstract: This study applies a real option approach to quantify, ex-ante, the maximum incremental social tolerable amount of incremental irreversible costs (MISTIC) that would justify immediate adoption of HT and Bt corn in the European Union. The results are compared with previous ones for HT sugar beet. In total, according to our analysis, the EU gives up about i309 million on average per year due to the quasi moratorium on transgenic crops for Bt corn, HT corn and HT sugar beets alone. On the other hand, the MISTIC per household and year for Bt corn, HT corn and HT sugar beet are 0.27 euros, 0.46 euros, and 1.10 euros, respectively, or 1.83 euros for all three crops. The low MISTIC provides a strong economic argument for prohibiting the immediate introduction of the three transgenic crops. The validity of the argument will largely depend on consumer attitudes towards transgenic crops. Key words: Bt corn, HT corn, HT sugar beet, real option approach, irreversible social costs 1. INTRODUCTION Regulating the introduction of new technologies and genetically modified crops in particular requires a good understanding of the social benefits and costs of the technology (Ervin and Welsh 2005). An immediate release of a transgenic crop is expected to provide both instant and future benefits, through the positive effects on yields, product quality, production costs, ______________________________ Financial support from the VIB–Flanders Interuniversitary Institute for Biotechnology and from the European Union under the EUWAB and ECOGEN projects are gratefully acknowledged.

Welcome message from author
This document is posted to help you gain knowledge. Please leave a comment to let me know what you think about it! Share it to your friends and learn new things together.
Transcript
Chapter 1
IRREVERSIBILITY, UNCERTAINTY, AND THE ADOPTION OF TRANSGENIC CROPS: EXPERIENCES FROM APPLICATIONS TO HT SUGAR BEET, HT CORN, AND Bt CORN
Sara Scatasta*, Justus Wesseler*, and Matty Demont†
*Wageningen University, The Netherlands, and †Catholic University, Leuven, Belgium Abstract: This study applies a real option approach to quantify, ex-ante, the maximum
incremental social tolerable amount of incremental irreversible costs (MISTIC) that would justify immediate adoption of HT and Bt corn in the European Union. The results are compared with previous ones for HT sugar beet. In total, according to our analysis, the EU gives up about i309 million on average per year due to the quasi moratorium on transgenic crops for Bt corn, HT corn and HT sugar beets alone. On the other hand, the MISTIC per household and year for Bt corn, HT corn and HT sugar beet are 0.27 euros, 0.46 euros, and 1.10 euros, respectively, or 1.83 euros for all three crops. The low MISTIC provides a strong economic argument for prohibiting the immediate introduction of the three transgenic crops. The validity of the argument will largely depend on consumer attitudes towards transgenic crops.
Key words: Bt corn, HT corn, HT sugar beet, real option approach, irreversible social costs 1. INTRODUCTION Regulating the introduction of new technologies and genetically modified crops in particular requires a good understanding of the social benefits and costs of the technology (Ervin and Welsh 2005). An immediate release of a transgenic crop is expected to provide both instant and future benefits, through the positive effects on yields, product quality, production costs,
_
Ffa
_____________________________
inancial support from the VIB–Flanders Interuniversitary Institute for Biotechnology and rom the European Union under the EUWAB and ECOGEN projects are gratefully cknowledged.
2 THE ECONOMICS OF REGULATION OF AGRICULTURAL BIOTECHNOLOGIES
and/or other characteristics of the crop.1 However, an immediate release may also have negative but highly uncertain effects, notably potential environ-mental or health risks (Kendall et al. 1997). Thus, decision makers are faced with a dilemma; they can release the crop(s) and receive (part of) the bene-fits mentioned above, but at a risk of irreversibly harming human beings and the environment. Alternatively, they may delay/reject the release, thereby avoiding human and environmental risks, wait for new information but also missing out on potential benefits. The decision maker has to weigh the expected benefits from an immediate release against its potential risks, and the option of delaying the decision until a future time. Traditional ex-ante assessment of the costs and benefits of a new product of agriculture biotechnology does not take into consideration that the adop-tion of a new technology might be associated with higher risks and uncer-tainty with respect to both its costs and its benefits. Some of these costs and benefits might be irreversible in nature. Irreversible costs and benefits imply that, once the decision is taken, it is not possible to go back to the equilib-rium the economy was before such decision. Examples of irreversible costs associated with the adoption of genetically modified organisms (GMOs) are losses in biodiversity and development of pest resistance. Examples of irre-versible benefits are gains in human health due to reduced poisonings from pesticide use and gains in biodiversity from reduced pesticide use.2 In this context the option to delay the release of a (GMO) until more information on its risks becomes available may become of value to society. The value of the possibility of delaying the decision of releasing transgenic crops into the en-vironment can be explicitly taken into consideration by analysts via a real option approach (Demont, Wesseler, and Tollens 2004, Morel et al. 2003, Wesseler 2003). The real option decision criteria for releasing GMOs immediately re-quires reversible private net-benefits from GM crops, such as net-benefits accruing to farmers, to be greater than irreversible social net-costs by a fac-tor, the hurdle rate, that depends on the uncertainty associated with the adop-tion of a new technology. Following Dixit and Pindyck (1994) hurdle rates associated to GM crops can be quantified by assuming that additional private net-benefits from trans-genic crops follow a geometric Brownian process. The hurdle rate becomes then a well specified function whose parameters can be inferred from time series data on farmer gross margins and secondary literature, by assuming that GM crops constitute a normal technological change.
1 Throughout the chapter we will use the terms transgenic crops, GMOs (genetically modified organisms) or GM crops (genetically modified crops) interchangeably following the FAO glossary (Zaid et al. 2001). 2 For a detailed discussion of irreversible benefits and costs and their impact on the decision to release transgenic crops consult Demont, Wesseler, and Tollens (2004, 2005).
IRREVERSIBILITY, UNCERTAINTY, AND THE ADOPTION OF TRANSGENIC CROPS 3
As hurdle rates are always greater than one, the real option decision criteria for releasing transgenic crops immediately, differs from the tradi-tional decision criteria as it requires reversible social net-benefits to be greater than irreversible social net-costs. The traditional decision criteria for releasing GM crops immediately, requires, instead, reversible private net-benefits to be at least equal to irreversible social net-costs. Demont, Wesseler, and Tollens (2004) computed hurdle rates for herbi-cide-tolerant (Ht) sugar beet and reassess whether the 1998 moratorium of the European Union (EU) on HT sugar beet is justified from a cost-benefit perspective. The authors conclude that such moratorium would be justified if transgenic sugar beet caused annual irreversible social costs above 121 euros per hectare planted. The objective of this study is to carry out a similar assessment for pest resistant (Bt) corn and herbicide-tolerant (HT) corn to identify, ex-ante, po-tential social welfare impacts of adoption of Bt and HT corn in the EU of 15 member states (EU-15). In section 2 we present some background informa-tion on Bt and HT corn for Europe. In section 3 we describe the theoretical model. In section 4 we quantify the maximum incremental social tolerable irreversible costs. In section 5 we discuss the results in light of the current regulations on co-existence in the EU. Section 6 summarizes our findings and conclusion. 2. BACKGROUND The EU-15 produces about 3 percent of the world’s corn. The corn produc-tion is concentrated in France (40 percent), immediately followed by Italy (30 percent). The EU-15 also is a net importer of corn for human consump-tion, 6.4 percent of its consumption is imported (mainly from Argentina, 4 percent, and Hungary, 2 percent), while only 0.4 percent of domestic pro-duction is exported outside the EU-15 (FAOSTAT 2004). Corn is grown in the EU-15 mainly for animal feed (80 percent). Corn for human consumption (20 percent) is used to produce corn oil, starch and sweeteners which are common ingredients in many processed foods such as breakfast cereals and dairy goods, and only a small amount is used for direct consumption (see Essential Biosafety 2004, EUROSTAT 2004). 2.1 Corn Resistant to Pests (Bt corn) Bt corn in the EU is currently grown in Spain with an adoption rate of about 17.5 percent (0.1 million hectares), and a small amount in Germany and France (James 2004). Bt corn has been genetically engineered to contain a gene of the soil bacterium Bacillus thuringiensis (Bt). This bacterium pro-
4 THE ECONOMICS OF REGULATION OF AGRICULTURAL BIOTECHNOLOGIES
duces a crystal-like (Cry) proteins that is toxic to the European Corn Borer (ECB-Ostrinia nubilalis), a pest that can cause damage to corn plants by penetrating the stalk and excavating large tunnels into the plant. Conventional ECB pest control strategies are difficult to manage be-cause a correct timing of insecticide applications is crucial to their effective-ness. Insecticides are effective only when the ECB is in its larval status but has not yet penetrated the stalk or is migrating to neighbouring plants (Jan-sens et al. 1997). The insertion of the Bt gene into the corn plant potentially improves a farmer’s abilities to manage the ECB and other serious insect pests (Pilcher et al. 2002). Hence, Bt corn is expected to benefit farmers through reduced harvest losses due to ECB infestation. Bt corn is also ex-pected to benefit the environment through reduced insecticide use.3 In addi-tion, due to the protection of Bt varieties against physical insect damage, it has been widely reported that Bt varieties are associated with a lower inci-dence of secondary Fusarium contamination (Munkvold, Hellmich, and Rice 1999, Munkvold, Hellmich, and Showers 1997, Dowd 2000, Wu, Miller, and Casman 2004). At the same time, due to higher costs for Bt-seeds, it is not undisputed that the associated yield improvements will also translate in in-creased farmer income. The development of ECB resistance against Bt due to the commercialization of Bt corn, furthermore, can reduce the benefits of the technology (Hurley 2005, Laxminarayan and Simpson 2005) and be a problem for organic farmers who currently use this bacterium, incorporated into sprays, as a natural crop protection tool (Demont and Tollens 2004). 2.2 Herbicide-Tolerant Corn Effective weed control is more crucial to economic corn production than control of ECB. The influence of weed cover on yields is often the most important and significant, independent of other factors involved. To control weeds, conventionally a tank mix of soil active and leaf-active herbicides in pre- to early post-emergence of the crop is used. The post-emergence herbicides glyphosate and glufosinate-ammonium provide a broader spectrum of weed control than current herbicide programs, while at the same time reducing the number of active ingredients. Gly-phosate was first introduced as a herbicide in 1971. The gene that confers tolerance to glyphosate was discovered in a naturally occurring soil bacte-rium. Glufosinate-ammonium was discovered in 1981. The gene that confers tolerance to glufosinate is also derived from a naturally occurring soil bacte-rium (Dewar, May, and Pidgeon 2000). By inserting these herbicide tolerance (HT) genes into a plant’s genome, two commercial transgenic HT systems resulted: the Roundup Ready®
3 This is of lesser importance as many farmers do not control for the ECB due to the men-tioned management problems.
IRREVERSIBILITY, UNCERTAINTY, AND THE ADOPTION OF TRANSGENIC CROPS 5
system, providing tolerance to glyphosate and the Liberty Link® system, tolerant to glufosinate-ammonium. These combinations of transgenic seed combined with a post-emergence herbicide offer farmers broad-spectrum weed control, flexibility in the timing of applications and reduce the need for complex compositions of spray solutions. Glyphosate and glufosinate-am-monium have a low toxicity and are metabolised fast, without leaving soil residues, and therefore have better environmental and toxicological profiles than most of the herbicides they replace. At the social level, the impact of HT corn systems on biodiversity and human health has been questioned while at the same time positive impacts on biodiversity can be expected due to reduced use on persistent herbicides and the possibility for reduced tillage systems (Heard et al. 2003). Further-more, a net reduction in pesticide use on HT corn (and Bt corn as well) can have a positive impact on farmers’ health (Antle and Pingali 1994; Waibel and Fleischer 1998). It is important to note that the effects of pesticide use on farmers’ health and biodiversity are irreversible. If the introduced trans-genic crop results in a lower pesticide application, it provides additional ir-reversible benefits. The observations for corn are supported by the Environmental Impact Quotient (EIQ) for Bt and HT corn.4 A recent study by Nillesen, Scatasta, and Wesseler (2005) compared field rate EIQ’s for Bt-corn, HT corn and conventional practices using the data from ECOGEN field trails in Nar-bonne, France, and from the study by Gianessi, Sankula, and Reigner (2003). Results show that the environmental impact for pesticides used is 43.36 for Bt corn, and 47.26 for conventional crop management respectively. The EIQ for glufosinate-tolerant corn is 25.43. The EIQ indicates social benefits from reduced pesticide use in Bt and HT corn. Hence, the introduction of Bt and HT corn varieties can provide important private and social irreversible bene-fits due to changes in pesticide use. Including the irreversible benefits and irreversible costs in a theoretically consistent decision making framework will be done in the following section.
4 The EIQ is a simple measure to attach a numerical value and to environmental impacts of pesticides, which enables one to compare different pesticides regarding their toxicity or harm-fulness (Kovach et al. 1992). The EIQ incorporates the impacts on farm worker (application and harvest worker), the consumer and ecology (non-target organisms: fish, birds, honeybees, and other beneficial insects).
6 THE ECONOMICS OF REGULATION OF AGRICULTURAL BIOTECHNOLOGIES
3. THE REAL OPTION APPROACH 3.1 Defining the Maximum Incremental Social Tolerable Irreversible Costs (MISTIC) The decision to release transgenic crops in the EU involves both uncertainty and irreversibility. The social planner, in this case the EU, has to decide whether to release a transgenic crop immediately or to postpone the release until further information about benefits and costs of the new crop is available. The objective of the planner is assumed to be to maximise the welfare of EU citizens. Impacts of the decision on the rest of the world (ROW) are not considered. Also, benefits for the R&D sector, whether European or ROW, are not considered. Only downstream costs and benefits are of importance for the decision maker. Given this, the decision maker needs to compare the benefits of an immediate release with those from a postponed decision. Only if the benefits of an immediate release, the value of the release, outweigh those of the option to release, should the option to release be exercised. In the case of GMOs it is important to differentiate between the incre-mental reversible and irreversible benefits and costs at private as well as the public level. In general, information about potential benefits and costs from GMOs, even so they are uncertain, are available from field trials and experi-ences in other countries. Also, information about incremental irreversible benefits is available such as health and environmental benefits from changes in pesticide and fuel use. Less information is available about the irreversible costs, such as impacts on biodiversity and ecosystems in general. Under these circumstances, the real option decision criteria can be stated as the maximum incremental social tolerable irreversible costs (I*) to be no greater than the sum of the incremental irreversible social benefits (R) and reversible social net-benefits (W) from GM crops weighted by the hurdle rate ( )1β β − (Wesseler 2003):
( )
*1
WI ≤β β −
R+ (1)
with
2
2 2 2
1 1 12 2
r r r− δ − δ⎡ ⎤β = − + − + >⎢ ⎥σ σ σ⎣ ⎦
2 ,
where r is the riskless rate of return, δ the convenience yield defined as
with µ as the risk adjusted rate of return and α the drift rate of a δ = µ −α
IRREVERSIBILITY, UNCERTAINTY, AND THE ADOPTION OF TRANSGENIC CROPS 7
geometric Brownian motion,5 σ the variance rate of a geometric Brownian motion and β the positive root of the solution for a Fokker-Planck equation. Since [ , the real option decision criteria is more restrictive than the traditional decision criteria .
/( 1)] 1β β − >*I W R≤ +
The use in practice of the real option decision criteria specified in equa-tion (1) requires quantification of the following factors:
Social incremental reversible benefits from GM crops (W) Hurdle rate, /( 1)β β − Social incremental irreversible benefits, R
In the following sections the quantification of these three factors for Bt corn and HT corn will be discussed. For the quantification of these three factors for HT sugar beets we refer to the paper by Demont, Wesseler, and Tollens (2004). To simplify the use of terminology, from now on we will call the maximum incremental social tolerable irreversible costs MISTIC, the social incremental irreversible benefits SIIB, the social incremental re-versible benefits SIRB and the private incremental reversible benefits PIRB. 3.2 Defining the Social Incremental Reversible Net Benefits (SIRB) To make our results comparable with those for HT sugar beets by Demont, Wesseler, and Tollens (2004) the value of SIRB for country i over time will be given, in our case, by the present value of those benefits in 1995 terms such that , (2) ,95 0
( ) ti i iSIRB SIRB SIRB t e dt
∞ −µ= = ∫ where is the capital asset pricing model (CAPM) risk adjusted rate of return as in Demont, Wesseler, and Tollens (2004).
10.5µ =
SIRBi at time t, , will be given by the maximum amount of social incremental reversible net-benefits obtainable at time t at complete adoption,
, times the adoption rate at time t,
( )iSIRB t
, ( )i MAXSIRB t ( )tρ , such that . (3) ,( ) ( ) ( )i i MAXSIRB t SIRB t t= ρ
As we were not able to identify, based on the available literature, non-private reversible net-benefits of transgenic corn, in this study the maximum amount
5 Lognormality of the Brownian motion is not a problem, assuming technology adopters can temporarily suspend planting HT sugar beet and plant non-HT sugar beet instead, without bearing any additional costs. This follows from Dixit and Pindyck (1994 , pp. 187–189).
8 THE ECONOMICS OF REGULATION OF AGRICULTURAL BIOTECHNOLOGIES
of SIRBi obtainable at time t at complete adoption, , , and the present value of SIRB
( )i MAXSIRB ti over time only entails private reversible net-benefits,
that is SIRBi = PIRBi. To quantify the maximum amount of SIRBi obtainable at time t at com-plete adoption, , , we only consider the most relevant corn mar-ket, the market for green corn, corn used for fodder such as silage and corn-cob-mix. Based on EUROSTAT data there is no trade in the market for green corn, thus we choose a closed economy framework composed of the 15 EU member states.
( )i MAXSIRB t
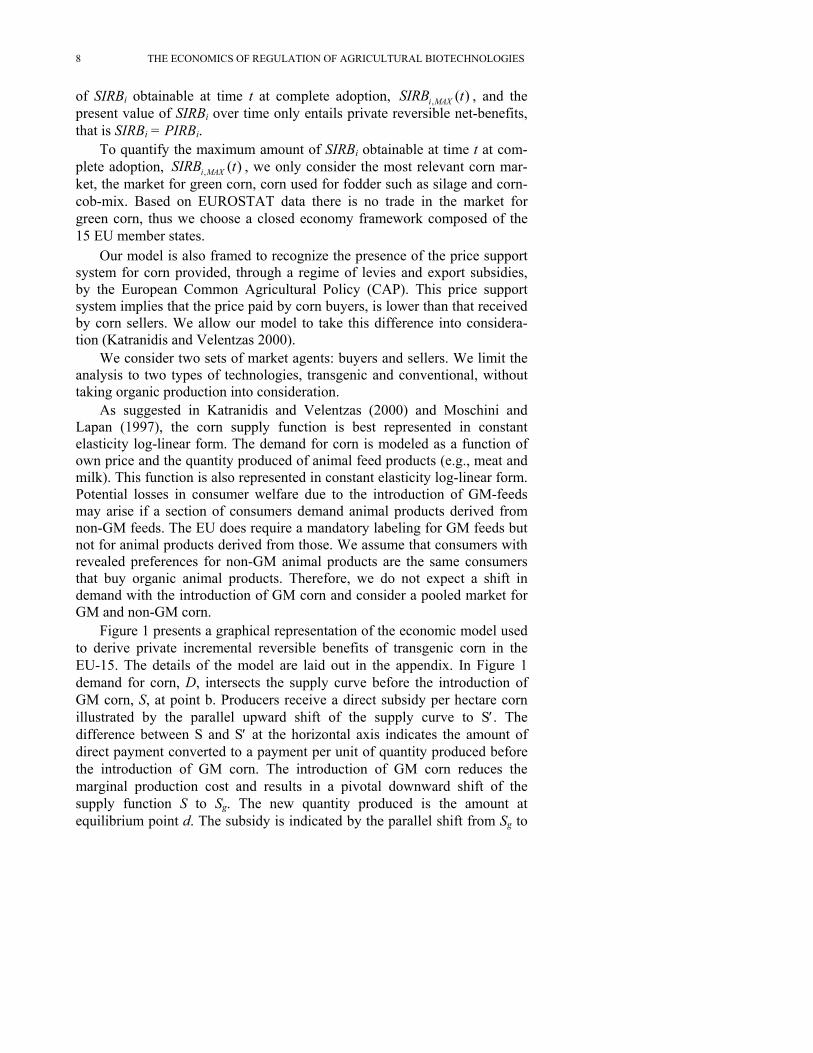
Our model is also framed to recognize the presence of the price support system for corn provided, through a regime of levies and export subsidies, by the European Common Agricultural Policy (CAP). This price support system implies that the price paid by corn buyers, is lower than that received by corn sellers. We allow our model to take this difference into considera-tion (Katranidis and Velentzas 2000). We consider two sets of market agents: buyers and sellers. We limit the analysis to two types of technologies, transgenic and conventional, without taking organic production into consideration. As suggested in Katranidis and Velentzas (2000) and Moschini and Lapan (1997), the corn supply function is best represented in constant elasticity log-linear form. The demand for corn is modeled as a function of own price and the quantity produced of animal feed products (e.g., meat and milk). This function is also represented in constant elasticity log-linear form. Potential losses in consumer welfare due to the introduction of GM-feeds may arise if a section of consumers demand animal products derived from non-GM feeds. The EU does require a mandatory labeling for GM feeds but not for animal products derived from those. We assume that consumers with revealed preferences for non-GM animal products are the same consumers that buy organic animal products. Therefore, we do not expect a shift in demand with the introduction of GM corn and consider a pooled market for GM and non-GM corn. Figure 1 presents a graphical representation of the economic model used to derive private incremental reversible benefits of transgenic corn in the EU-15. The details of the model are laid out in the appendix. In Figure 1 demand for corn, D, intersects the supply curve before the introduction of GM corn, S, at point b. Producers receive a direct subsidy per hectare corn illustrated by the parallel upward shift of the supply curve to S′. The difference between S and S′ at the horizontal axis indicates the amount of direct payment converted to a payment per unit of quantity produced before the introduction of GM corn. The introduction of GM corn reduces the marginal production cost and results in a pivotal downward shift of the supply function S to Sg. The new quantity produced is the amount at equilibrium point d. The subsidy is indicated by the parallel shift from Sg to
IRREVERSIBILITY, UNCERTAINTY, AND THE ADOPTION OF TRANSGENIC CROPS 9
i D
Figure 1. Partial Equilibrium Displacement Model for Transgenic Corn in the European Union (15) S ′g. The subsidy paid per unit of corn decreases as the yield of GM corn increases. The consumer surplus6 of the introduction of GM corn is the area PbdPg, the producer surplus is the difference between 0P′gcd and 0P′ab and the welfare gain the sum of the two. 3.3 Defining the Social Incremental Irreversible Benefits (SIIB) The SIIB per hectare, ri, of transgenic sugar beet are approximated by
, (4) i ir A n= ω∆ +ψ∆
where ∆Ai is the change in volume of pesticide active ingredients (AI) per unit of land in country i due to the switch from conventional crop protection
6 The consumer surplus is the surplus that will be distributed over the whole supply chain. As there is almost no trade in green corn, the producer and consumer surplus will remain within one farm during the early years of planting transgenic corn. Under the current CAP producer and consumer surplus from lower production costs will be kept within the agricultural sector. Over time the benefits will be distributed along the supply chain as also the agriculture policy sector will react, change policies and as observed in the EU, reduce subsidies. If final con-sumers will benefit due to lower prices will depend on the competitiveness of the downstream food processing and retailing sector. Therefore, the interpretation of the consumer surplus without considering a change in agriculture policies is as a surplus that remains within the agriculture sector.
0
e
d
c b
a P’
P’g
P
Pg
S S’g
Sg
P
S’
D
Q
10 THE ECONOMICS OF REGULATION OF AGRICULTURAL BIOTECHNOLOGIES
to transgenic corn, ω the average external social cost of pesticide use per unit of active ingredient, ∆ni the change in the number of applications per hectare, D the average diesel use per application and per unit of land, c the average CO2 emission coefficient per unit of diesel, and ψ the average external social cost per unit CO2 emission. We assume that the per hectare SIIBi function is proportional to the adoption function for the new crop:
max,
, ,
( )1 exp( )
ii i
i i
SIIB t ra b tρ ρ
ρ=
+ − −. (5)
The 1995 present value of the SIIBi, R95,i, can be written as
. (6) 95,0
( ) iti iSIIB R t e dt
∞−µ= ∫
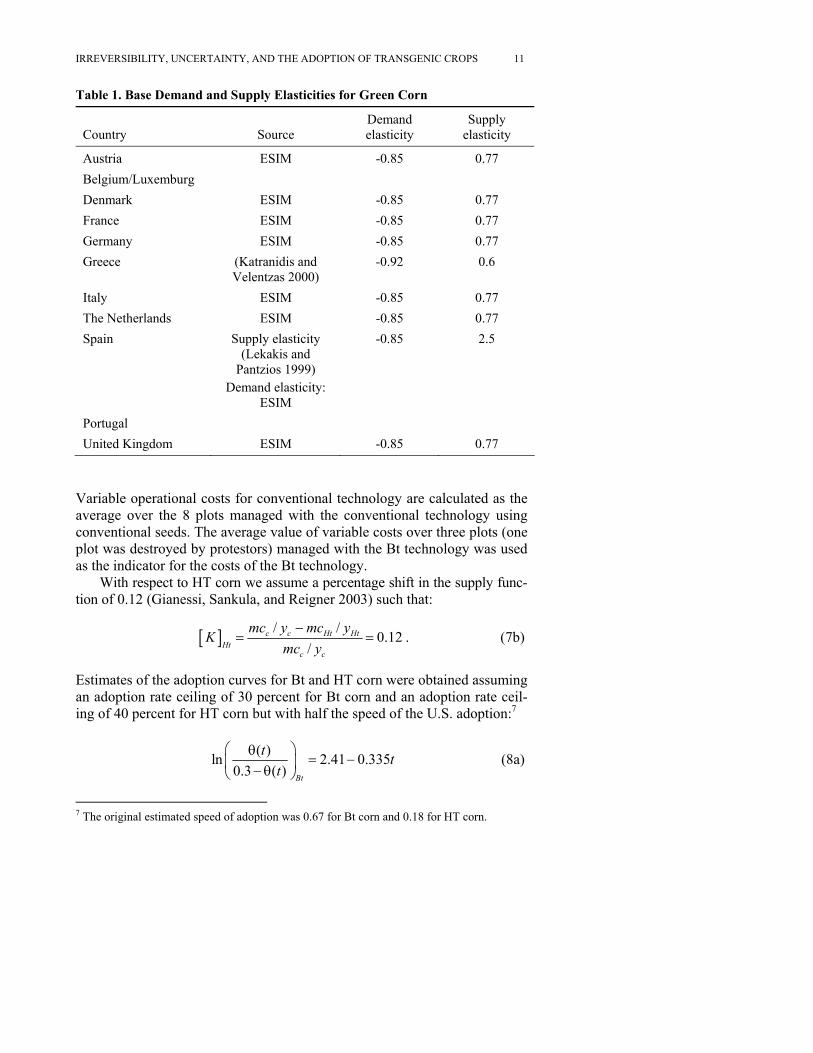
4. DATA The data used for this analysis are from EUROSTAT New Cronos database (ECD) and the FAOSTAT-Agriculture database (FAD) (EUROSTAT 2004, FAOSTAT 2004). From ECD we obtained data on produced quantities and input and output prices (with 1995 base) for green corn. Output prices received by corn sellers include subsidies to agricultural producers. From FAD we obtained produced quantities of milk and meat. Data for estimating the Bt and HT corn adoption curve was obtained from ISAAA. Data for estimating the proportionate vertical supply shift, K, in the supply function for Bt corn was obtained from field trials from the EU funded ECOGEN project in Narbonne, France. Information on the vertical supply shift for HT corn was obtained from Gianessi, Sankula, and Reigner (2003). Where no estimates were available from secondary literature, demand and supply elasticities were taken from the European Simulation Model (ESIM) derived from behavioural equations. Suggested green corn demand elasticities in ESIM range from -0.7 to -1.0, so we use the average -0.85 as base case. Suggested elasticities of land allocation to green corn are 0.77, so we approximated supply elasticities to this value in our base case outlined in Table 1 (see Banse, Grethe, and Nolte 2005). From field trials (16 plots) carried out for the ECOGEN project in Nar-bonne, France, we obtained the following information about the percentage shift in the supply function (see appendix equation A9):
/ / 729 /11.37 727 /12.4 0.0852/ 729 /11.37
c c Bt Bt
c c
mc y mc yKmc y− −
= = = . (7a)
IRREVERSIBILITY, UNCERTAINTY, AND THE ADOPTION OF TRANSGENIC CROPS 11
Table 1. Base Demand and Supply Elasticities for Green Corn
Country Source Demand elasticity
Supply elasticity
Austria ESIM -0.85 0.77 Belgium/Luxemburg Denmark ESIM -0.85 0.77 France ESIM -0.85 0.77 Germany ESIM -0.85 0.77 Greece (Katranidis and
Velentzas 2000) -0.92 0.6
Italy ESIM -0.85 0.77 The Netherlands ESIM -0.85 0.77 Spain Supply elasticity
(Lekakis and Pantzios 1999)
Demand elasticity: ESIM
-0.85 2.5
Portugal United Kingdom ESIM -0.85 0.77
Variable operational costs for conventional technology are calculated as the average over the 8 plots managed with the conventional technology using conventional seeds. The average value of variable costs over three plots (one plot was destroyed by protestors) managed with the Bt technology was used as the indicator for the costs of the Bt technology. With respect to HT corn we assume a percentage shift in the supply func-tion of 0.12 (Gianessi, Sankula, and Reigner 2003) such that:
[ ] / / 0.12/
c c Ht HtHt
c c
mc y mc yKmc y−
= = . (7b)
Estimates of the adoption curves for Bt and HT corn were obtained assuming an adoption rate ceiling of 30 percent for Bt corn and an adoption rate ceil-ing of 40 percent for HT corn but with half the speed of the U.S. adoption:7
( )ln 2.41 0.3350.3 ( ) Bt
t tt
⎛ ⎞θ= −⎜ ⎟− θ⎝ ⎠
(8a)
7 The original estimated speed of adoption was 0.67 for Bt corn and 0.18 for HT corn.
12 THE ECONOMICS OF REGULATION OF AGRICULTURAL BIOTECHNOLOGIES
( )ln 2.15 0.090.3 ( ) HT
t tt
⎛ ⎞θ= −⎜ ⎟− θ⎝ ⎠
. (8b)
Given the information in equations (7), (8a) and (8b) we computed the SIRB of Bt and HT corn as the sum of the changes for the EU-15 in producer and consumer surplus assuming no change in the buyers’ demand for corn. We also assumed that Bt corn would be adopted only in France, Italy, Portugal, Spain, and Greece, where, based on expert opinions, the ECB infestation levels would justify adoption of Bt corn. We considered that HT corn would be adopted in each country currently producing green corn. Yet, due to lack of data we could analyze only the EU-15 countries except for Finland, Ireland, and Sweden. As those two countries plant only small amount of corn leaving them out does not have a great impact on the results for the EU-15. SIRB are presented in annuities, , in million euros for the EU-15: aSIRB
95 0( ) ( ) t
aBt
SIRB SIRB PS t CS t e dt∞ −µ⎡ ⎤= µ = µ ∆ + ∆⎢ ⎥⎣ ⎦∫ (9a)
for Bt corn, and
(9b) 95 0( ) ( ) t
aHT
SIRB SIRB PS t CS t e dt∞ −µ⎡ ⎤= µ = µ ∆ + ∆⎢ ⎥⎣ ⎦∫
for HT corn. For estimating the drift rate, α, and the variance rate, σ, of the new technology, we compute the maximum likelihood estimator assuming continuous growth (Campbell, Lo, and MacKinlay 1997) We use time-series data on annual gross margin differentials in corn production from 1973 to 1995 as a proxy for estimating the drift and variance rate of future SIIB. The data are extracted from the EU/SPEL dataset (EUROSTAT 1999) for all EU-15 Member States and deflated and converted into real terms using the GDP deflators published by the World Bank (2002). The country-specific hurdle rate is calculated using the estimated drift and variance rate per country and choosing a risk-free rate of return, r, of 4.5 per cent and a risk-adjusted rate of return, µ, of 10.5 per cent for all countries. The results for individual countries differ, as the estimated drift rates, ˆ iα , and variance rates, , vary between EU member states depending on the time series for the gross margin per member state. Finally, data on areas planted to corn, numbers of corn holdings, and currency rates are extracted from the ECD, while household data are reported by the European Environment Agency (2001). The estimated and chosen parameter values are used to calculate β
ˆ iσ
i which then was used for the calculation of the MISTIC in equation (1). Country specific hurdle rates could be obtained so far only for France, Greece,
IRREVER
SIBILITY, UNCERTAINTY, AND THE ADOPTION OF TRANSGENIC CROPS 13
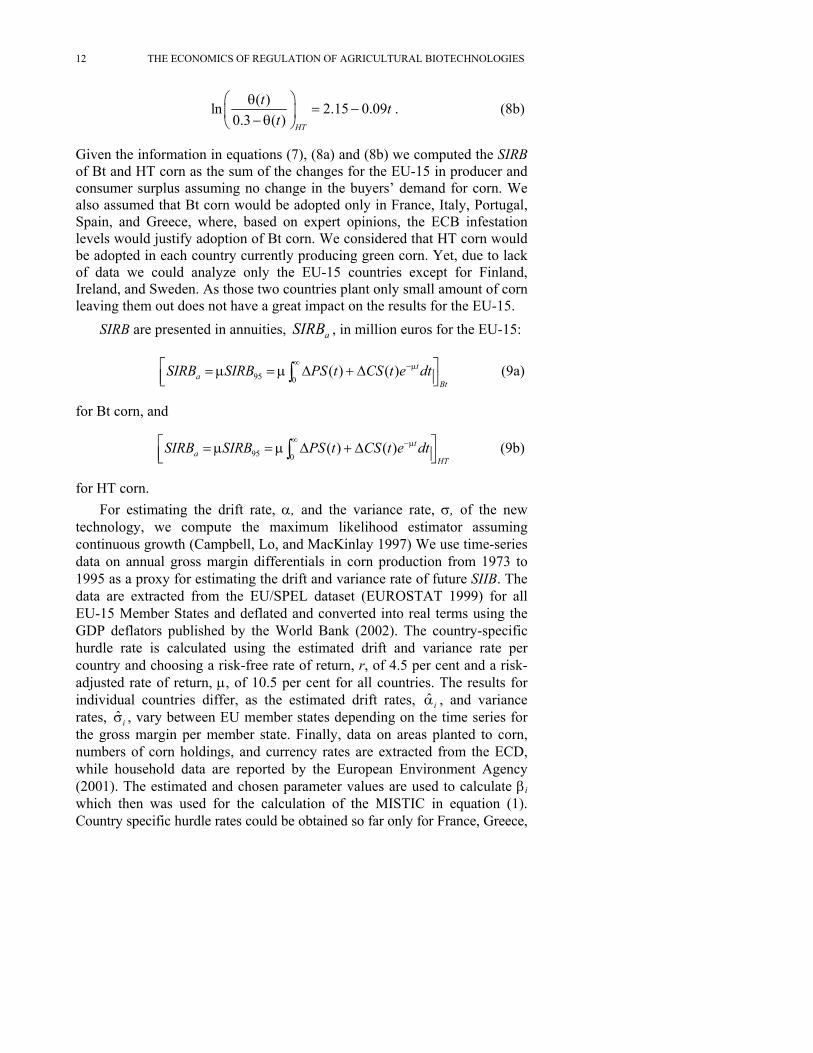
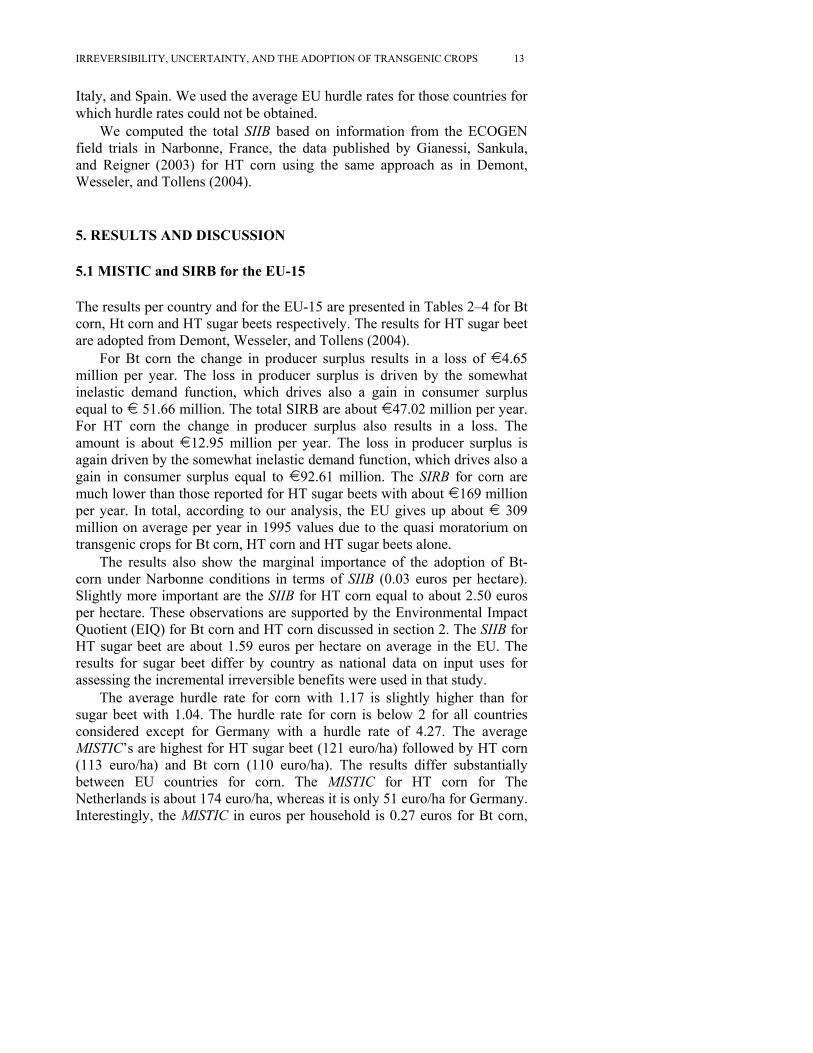
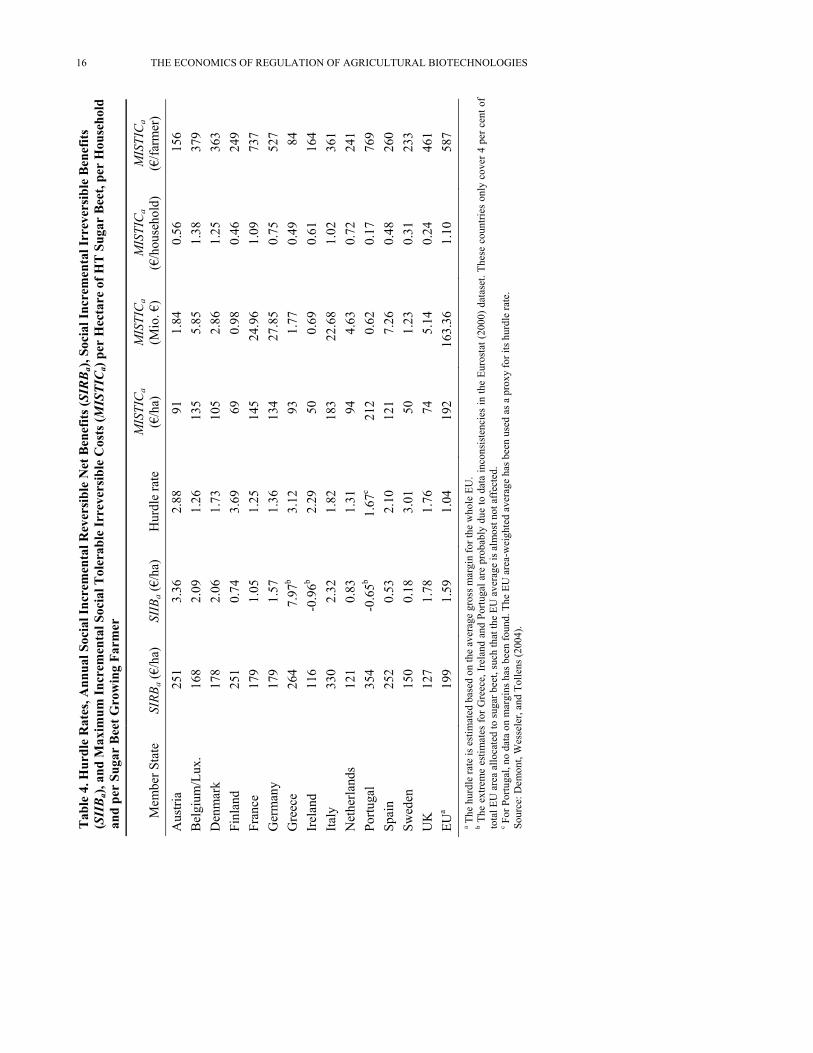
Italy, and Spain. We used the average EU hurdle rates for those countries for which hurdle rates could not be obtained. We computed the total SIIB based on information from the ECOGEN field trials in Narbonne, France, the data published by Gianessi, Sankula, and Reigner (2003) for HT corn using the same approach as in Demont, Wesseler, and Tollens (2004). 5. RESULTS AND DISCUSSION 5.1 MISTIC and SIRB for the EU-15 The results per country and for the EU-15 are presented in Tables 2–4 for Bt corn, Ht corn and HT sugar beets respectively. The results for HT sugar beet are adopted from Demont, Wesseler, and Tollens (2004). For Bt corn the change in producer surplus results in a loss of i4.65 million per year. The loss in producer surplus is driven by the somewhat inelastic demand function, which drives also a gain in consumer surplus equal to i 51.66 million. The total SIRB are about i47.02 million per year. For HT corn the change in producer surplus also results in a loss. The amount is about i12.95 million per year. The loss in producer surplus is again driven by the somewhat inelastic demand function, which drives also a gain in consumer surplus equal to i92.61 million. The SIRB for corn are much lower than those reported for HT sugar beets with about i169 million per year. In total, according to our analysis, the EU gives up about i 309 million on average per year in 1995 values due to the quasi moratorium on transgenic crops for Bt corn, HT corn and HT sugar beets alone. The results also show the marginal importance of the adoption of Bt-corn under Narbonne conditions in terms of SIIB (0.03 euros per hectare). Slightly more important are the SIIB for HT corn equal to about 2.50 euros per hectare. These observations are supported by the Environmental Impact Quotient (EIQ) for Bt corn and HT corn discussed in section 2. The SIIB for HT sugar beet are about 1.59 euros per hectare on average in the EU. The results for sugar beet differ by country as national data on input uses for assessing the incremental irreversible benefits were used in that study. The average hurdle rate for corn with 1.17 is slightly higher than for sugar beet with 1.04. The hurdle rate for corn is below 2 for all countries considered except for Germany with a hurdle rate of 4.27. The average MISTIC’s are highest for HT sugar beet (121 euro/ha) followed by HT corn (113 euro/ha) and Bt corn (110 euro/ha). The results differ substantially between EU countries for corn. The MISTIC for HT corn for The Netherlands is about 174 euro/ha, whereas it is only 51 euro/ha for Germany. Interestingly, the MISTIC in euros per household is 0.27 euros for Bt corn,
Tab
le 2
. Hur
dle
Rat
es, A
nnua
l Soc
ial I
ncre
men
tal R
ever
sibl
e N
et B
enef
its (Sirb a
), So
cial
Incr
emen
tal I
rrev
ersi
ble
Ben
efits
(Siib
a), a
nd M
axim
um In
crem
enta
l Soc
ial T
oler
able
Irre
vers
ible
Cos
ts (Mistica)
per
Hec
tare
of B
t-C
orn,
per
Hou
seho
ld a
nd p
er
Cor
n G
row
ing
Farm
er
Mem
ber S
tate
SI
RBa (
€/ha
) SI
IBa (
€/ha
) H
urdl
e ra
te
MIS
TIC
a
(€/h
a)
MIS
TIC
a
(Mio
. €)
MIS
TIC
a
(€/h
ouse
hold
) M
ISTI
Ca
(€/fa
rmer
)
Aus
tria
B
elgi
um/L
ux.
Den
mar
kFi
nlan
dFr
ance
111.
050.
031.
7065
.36
18.7
80.
8213
7G
erm
any
Gre
ece
0.15
0.03
1.46
0.14
0.03
0.01
Irel
and
Italy
35.7
00.
031.
8219
.64
5.74
0.26
183
Net
herla
nds
Portu
gal
18.4
00.
031.
929.
612.
810.
7848
Spai
n15
.80
0.03
1.92
8.26
2.41
0.16
64Sw
eden
UK
EUa
128.
520.
031.
1710
9.87
40.2
10.
2719
5
14 THE ECONOMICS OF REGULATION OF AGRICULTURAL BIOTECHNOLOGIES
a The
hur
dle
rate
is e
stim
ated
bas
ed o
n th
e av
erag
e gr
oss m
argi
n fo
r the
who
le E
U.
Tab
le 3
. Hur
dle
Rat
es, A
nnua
l Soc
ial I
ncre
men
tal R
ever
sibl
e N
et B
enef
its (SIRBa)
, Soc
ial I
ncre
men
tal I
rrev
ersi
ble
Ben
efits
(SIIBa),
and
Max
imum
Incr
emen
tal S
ocia
l Tol
erab
le Ir
reve
rsib
le C
osts
(MISTICa)
per
Hec
tare
of H
T C
orn,
per
Hou
seho
ld a
nd
per
Cor
n G
row
ing
Farm
er
Mem
ber S
tate
SI
RBa (
€/ha
) SI
IBa (
€/ha
) H
urdl
e ra
te
MIS
TIC
a
(€/h
a)
MIS
TIC
a
(Mio
. €)
MIS
TIC
a (€
/hou
seho
ld)
MIS
TIC
a
(€/fa
rmer
) A
ustri
a
159
2.50
1.17
138
1.56
0.47
49B
elgi
um/L
ux.
Ir
elan
d
wed
en
171
2.50
1.17
148
2.85
0.67
103
Den
mar
k18
62.
501.
1716
20.
730.
3215
9Fi
nlan
dFr
ance
111
2.50
1.70
7113
.19
0.58
96G
erm
any
152
2.50
4.27
518.
210.
2260
Gre
ece
852.
501.
4661
0.03
0.01
3
Italy
219
2.50
1.82
123
4.10
0.18
131
Net
herla
nds
200
2.50
1.17
174
4.63
0.72
145
Portu
gal
253
2.50
1.92
134
2.05
0.57
35Sp
ain
253
2.50
1.92
134
2.41
0.16
64S U
K12
92.
501.
1711
31.
470.
0720
0EU
a12
92.
501.
1711
369
.24
0.46
152
IRREVERSIBILITY, UNCERTAINTY, AND THE ADOPTION OF TRANSGENIC CROPS 15
a The
hur
dle
rate
is e
stim
ated
bas
ed o
n th
e av
erag
e gr
oss m
argi
n fo
r the
who
le E
U.
Mem
ber S
tate
SI
RBa (
€/ha
) SI
IBa (
€/ha
) H
urdl
e ra
te
MIS
TIC
a (€
/ha)
M
ISTI
Ca
(Mio
. €)
MIS
TIC
a (€
/hou
seho
ld)
MIS
TIC
a (€
/farm
er)
Aus
tria
1 3.
36
2.88
91
84
0.
56
6 25
1.15
Bel
gium
/ar
k Lux.
8
2.09
1.
26
5 85
1.
38
9 8
2.06
1.
73
5 86
1.
25
3 d
1 0.
74
3.69
69
98
0.
46
9 ce
9
1.05
1.
25
5 6
1.09
7
9
1.57
1.
36
4 5
0.75
7
Gre
ece
264
77
49
84
11
6 69
61
4
0
2.32
1.
82
3 8
1.02
1
s 1
0.83
1.
31
94
63
0.72
1
4 -0
2 0.
62
17
9 n
2 0.
53
2.10
1
26
0.48
0
en
0 0.
18
3.01
50
23
0.
31
3 7
1.78
1.
76
74
14
0.24
1
9 1.
59
1.04
2
1.
10
7
1613
5.37
Den
m17
102.
36Fi
nlan
250.
24Fr
an17
1424
.973
Ger
man
y17
1327
.852
7.97
b3.
12
93
1.0.
Irel
and
-0.9
6b2.
29
50
0.0.
16Ita
ly33
1822
.636
Net
herla
nd12
4.24
Portu
gal
35.6
5b1.
67c
210.
76Sp
ai25
127.
26Sw
edU
K
151.
2312
5.46
EUa
1919
163.
3658
16 THE ECONOMICS OF REGULATION OF AGRICULTURAL BIOTECHNOLOGIES
T
able
4. H
urdl
e R
ates
, Ann
ual S
ocia
l Inc
rem
enta
l Rev
ersi
ble
Net
Ben
efits
(SIRBa)
, Soc
ial I
ncre
men
tal I
rrev
ersi
ble
Ben
efits
(SIIBa),
and
Max
imum
Incr
emen
tal S
ocia
l Tol
erab
le Ir
reve
rsib
le C
osts
(MISTICa)
per
Hec
tare
of H
T S
ugar
Bee
t, pe
r H
ouse
hold
an
d pe
r Su
gar
Bee
t Gro
win
g Fa
rmer
a The
hur
dle
rate
is e
stim
ated
bas
ed o
n th
e av
erag
e gr
oss m
argi
n fo
r the
who
le E
U.
b The
ext
rem
e es
timat
es fo
r Gre
ece,
Irel
and
and
Portu
gal a
re p
roba
bly
due
to d
ata
inco
nsis
tenc
ies
in th
e Eu
rost
at (2
000)
dat
aset
. The
se c
ount
ries
only
cov
er 4
per
cen
t of
tota
l EU
are
a al
loca
ted
to su
gar b
eet,
such
that
the
EU a
vera
ge is
alm
ost n
ot a
ffec
ted.
c F
or P
ortu
gal,
no d
ata
on m
argi
ns h
as b
een
foun
d. T
he E
U a
rea-
wei
ghte
d av
erag
e ha
s bee
n us
ed a
s a p
roxy
for i
ts h
urdl
e ra
te.
Sour
ce: D
emon
t, W
esse
ler,
and
Tolle
ns (2
004)
.
IRREVERSIBILITY, UNCERTAINTY, AND THE ADOPTION OF TRANSGNIC CROPS 17
0.46 euros for HT corn and 1.10 euros for HT sugar beets or 1.83 euros for all three crops together. The MISTIC in euros per transgenic crop planting farm-household is 195 euros for Bt corn, 152 euros for HT corn and 587 euros for HT sugar beets at EU level. If households in the EU on average expect the incremental social irreversible costs per hectare and year and crop to be higher than the values calculated, the crops should not be released from a pure economic point of view. As the numbers are extremely low it can be expected that a survey among households will indicate a higher willingness-to-pay to avoid the introduction of those crops. This indicates a general problem with introducing new technologies. The average benefits per house-hold are often very small resulting in low MISTICs. This can explain the re-luctance of a large segment of society towards new technologies. The ques-tion then arises whether there is an indication that the irreversible costs are indeed beyond this level. A useful approach is to compare the maximum in-cremental social tolerable irreversible costs with the social incremental irre-versible benefits, as many of the irreversible costs of planting transgenic crops are similar to the irreversible benefits such as impacts of pesticides on health and the environment. The comparison indicates that the MISTIC at EU 15 level is 3681 times higher than SIIB for Bt corn, 120 times higher for HT sugar beet and 45 times higher for HT corn. The number for HT corn indicates, e.g., that social incremental irreversible costs can be up to 45 times higher than social incremental irreversible benefits to justify a release of HT corn. The total MISTIC per year are i40.21 million, i69.24 million, and i102.63 million for Bt corn, Ht corn and HT sugar beet respectively or i212.08 million per year for all three crops together. This is almost 10 percent of the total expenditure in 1995 (i2259 million) of EU institutions for environmental protection. 5.2 Implications for Regulating the Release of GMOs in the European Union As GMOs will be released only if considered safe for human consumption, the major regulatory issues concerning their release are issues related to environmental impacts of GM crops (e.g., impacts on biodiversity) and issues of co-existence with non-GM crops (e.g., pollen flow). Space does not allow us to discuss those issues in detail. The interested reader is referred to Beckmann and Wesseler (forthcoming), Soregaroli and Wesseler (2005), and Beckmann, Soregaroli, and Wesseler (2005) for a discussion on the implica-tion of co-existence rules and regulations in the EU on the adoption of GMOs. Here we merely report the information our analysis can provide for the discussion.
18 THE ECONOMICS OF REGULATION OF AGRICULTURAL BIOTECHNOLOGIES
In Europe there are three type of rules and regulations evolving for governing the co-existence of non-GM and GM crops. Spain has almost no rules and regulations and farmers can grow Bt corn without having to comply with additional planting requirements that differ from non-GM corn. In Denmark farmers have to register areas allocated to GM crops, keep a minimum distance to neighboring non-GM crops and have to pay a certain amount into a trust fund that will be used to compensate for any damages. In Germany GM farmers need to register all their areas allocated to GM crops in a publicly available database, have to keep a minimum distance to neighboring non-GM crops and will be liable for any damages to non-GM farmers under a system of joint liability. Other EU member states are still developing their own co-existence laws that either follows the Danish or the German model. The incremental benefits per hectare provide a first indicator about the maximum costs farmers are willing to bear for complying with regulations. The average SIRB per hectare with about 129 euros are almost the same for Bt and HT corn and about 199 euros for HT sugar beet. Adopting farmers will not be willing to pay more than this amount to comply with co-existence rules and regulations. As those amounts are relatively small on a per hectare basis to cover additional co-existence costs, e.g., under the German regula-tions, adoption will only become economically attractive if farmers can re-alize economies of scale with respect to co-existence costs. In general, looking at the average SIRB per farmer for the EU-15 the chances for im-mediate adoption of Bt corn and HT corn are almost the same assuming con-stant co-existence costs for both. The highest potential, of course, can be expected for stacked varieties, where farmers can benefit from both pest re-sistance and herbicide tolerance. As the co-existence regulations for GM sugar beets are expected to be less restrictive than for GM corn, the potential for immediate adoption of HT sugar beets will be higher.8 The SIRB for the different countries indicate that on average there will be sufficient gain from HT corn and HT sugar beets to pay into a fund to compensate for potential damages, a policy that has been introduced in Denmark. 6. CONCLUSION In this study we estimated the MISTIC, the maximum incremental social tolerable irreversible costs, associated with the immediate adoption of Bt corn and HT corn in the EU 15 using a real option approach and data from field trials carried out in 2004 in Narbonne, France. The MISTIC is an
8 Please note, that the sugar industry is very reluctant to accept HT sugar beets as currently many customers reject sugar derived from HT sugar beets.
IRREVERSIBILITY, UNCERTAINTY, AND THE ADOPTION OF TRANSGNIC CROPS 19
amount that would cover irreversible benefits from Bt corn and irreversible private net-benefits weighted by an estimated hurdle rate. SIRB, social incremental reversible benefits, accruing to producers of Bt-corn and HT-corn were found to be about 129 euros per hectare and year. The estimated SIRB for Bt-corn and HT-corn are lower than for HT sugar beets. The highest economic potential according to the MISTIC per farm for Bt corn is found to exist for France and Italy, for HT corn for the UK, Denmark, and The Netherlands, and for sugar beets for France, Germany, and the UK. The private incremental reversible benefits on a per hectare basis can hardly cover ex-ante regulatory and ex-post liability costs of planting transgenic corn and sugar beets in Germany and other EU member states that will adopt the same type of rules and regulations. Economies of scale can lower the regulatory costs per hectare, set incentives for regional agglomeration of transgenic crops and induce adoption. The case reported by Achilles (2005) supports this argument. The low MISTIC per household for all three crops over all countries included in the analysis provides a strong economic argument for prohibiting the immediate introduction of the three transgenic crops. The validity of the argument will largely depend on consumer attitudes towards transgenic crops. However, consumer attitudes may change over time, e.g., if scientific evidence shows higher environmental benefits or lower irreversible costs of transgenic crops. REFERENCES Achilles, D. 2005. “GMO Situation in Germany 2005.” GAIN Report No. GM5011. U.S.
Department of Agriculture, Washington, D.C. Antle, J., and P. Pingali. 1994. “Pesticides, Productivity and Farmers’ Health: A Philippine Case
Study.” American Journal of Agricultural Economics 76(2): 418–430. Banse, M., H. Grethe, and S. Nolte. 2005. European Simulation Model (ESIM) in GAMS:
User Handbook. Brussels: European Commission, DG AGRI. Beckmann, V., C. Soregaroli, and J. Wesseler. 2005. “Coase and Co-existence Under Irre-
versibility and Uncertainty.” Unpublished, Wageningen University. Beckmann, V., and J. Wesseler. Forthcoming. “Spatial Dimension of Externalities and the Coase
Theorem: Implications for Coexistence of Transgenic Crops.” In W. Heijman, ed., Regional Externalities. Berlin: Springer.
Campbell, J.Y., A.W. Lo, and A.C. MacKinlay. 1997. The Econometrics of Financial Mar-kets. Princeton, NJ: Princeton University Press.
Demont, M., and E. Tollens. 2004. “First Impact of Biotechnology in the EU: Bt Corn Adop-tion in Spain.” Annals of Applied Biology 145(3): 197–207.
Demont, M., J. Wesseler, and E. Tollens. 2004. “Biodiversity Versus Transgenic Sugar Beet: The One Euro Question.” European Review of Agricultural Economics 31(1): 1–18.
20 THE ECONOMICS OF REGULATION OF AGRICULTURAL BIOTECHNOLOGIES
______. 2005. “Reversible and Irreversible Costs and Benefits of Transgenic Crops.” In J. Wesseler, ed., Environmental Costs and Benefits of Transgenic Crops. Dordrecht: Springer.
Dewar, A.M., M.J. May, and J. Pidgeon. 2000. “GM Sugar Beet—The Present Situation.” British Sugar Beet Review 68(2): 22–27.
Dixit, A., and R.S. Pindyck. 1994. Investment Under Uncertainty. Princeton, NJ: Princeton University Press.
Dowd, P.F. 2000. “Indirect Reduction of Ear Molds and Associated Mycotoxins in Bacillus thuringiensis Corn Under Controlled and Open Field Conditions: Utility and Limitations.” Journal of Economic Entomology 93(6): 1669–1679.
Ervin, D., and R. Welsh. 2005. “Environmental Effects of Genetically Modified Crops: Dif-ferentiated Risk Assessment and Management.” In J. Wesseler, ed., Environmental Costs and Benefits of Transgenic Crops. Dordrecht: Springer.
Essential Biosafety. 2004. Crop Database: DBT418. Available at http://www.essentialbiosafety. info/dbase.php?action=ShowProd&data=DBT418 (accessed February 21, 2005).
European Environment Agency (EEA). 2001. Household Number and Size. European Envi-ronment Agency, Copenhagen.
Eurostat. 1999. SPEL/EU Data for Agriculture on CR-ROM: 1973–1998 Data. Office for Official Publications of the European Communities, Luxembourg.
______. 2000. Plant Protection in the EU—Consumption of Plant Protection Products in the European Union. Office of Official Publications of the European Communities, Luxembourg.
______. 2004. Eurostat New Cronos database (theme 5). Available at http://europa.eu.int/new[-] cronos (updated October 2004).
Faostat. 2004. “Faostat-Agriculture.” Available at http://faostat.fao.org/faostat/collections?[-] subset=agriculture (updated February 2004).
Gianessi, L., S. Sankula, and N. Reigner. 2003. “Plant Biotechnology: Potential Impact for Improving Pest Management in European Agriculture.” The National Center for Food and Agricultural Policy (NCFAP), Washington, D.C.
Heard, M.S., C. Hawes, G.T. Champion, S.J. Clark, L.G. Firbank, A.J. Haughton, A.M. Parish, J.N. Perry, P. Rothery, R.J. Scott, M.P. Skellern, G.R. Squire, and M.O. Hill. 2003. “Weeds in Fields with Contrasting Conventional and Genetically Modified Herbicide-Tol-erant Crops. I. Effects on Abundance and Diversity.” Philosophical Transactions of the Royal Society London B 358: 1819–1832.
Hurley, T. 2005. “Bacillus thuringiensis Resistance Management: Experiences from the USA.” In J. Wesseler, ed., Environmental Costs and Benefits of Transgenic Crops. Dor-drecht: Springer.
James, C. 2004. “Global Status of Commercialized Biotech/GM Crops 2004.” International Service for the Acquisition of Agri-Biotech Applications (ISAAA) Briefs No. 32-2004, Ithaca, NY.
Jansens, S., A. Van Vliet, C. Dickburt, L. Buysse, C. Piens, B. Saey, A. De Wulf, V. Gosselé, A. Paez, E. Göbel, and M. Peferoen. 1997. “Transgenic Corn Expressing a Cry9C Insecticidal Protein from Bacillus thuringiensis Protected from European Corn Borer Damage.” Crop Science 37(6): 1616–1624.
Katranidis, S., and K. Velentzas. 2000. “The Markets of Cotton Seeds and Corn in Greece: Welfare Implications of the Common Agricultural Policy.” Agricultural Economic Review 1(2): 80–95.
IRREVERSIBILITY, UNCERTAINTY, AND THE ADOPTION OF TRANSGNIC CROPS 21
Kendall, H.W., R. Beachy, T. Eisner, F. Gould, R. Herdt, P.H. Raven, J.S. Schell, and M.S. Swaminathan. 1997. Bioengineering of Crops. Environmental and Socially Sustainable Development Studies and Monograph Series 23. The World Bank, Washington, D.C.
Kovach, J., C. Petzoldt, J. Degni, and J. Tette. 1992. “A Method to Measure the Environ-mental Impact of Pesticides.” New York Food and Life Sciences Bulletin No. 139, New York State IPM Program, Cornell University, Ithaca, NY.
Laxminarayan, R., and D. Simpson. 2005. “Biological Limits on Agricultural Intensification: An Example from Resistance Management.” In J. Wesseler, ed., Environmental Costs and Benefits of Transgenic Crops. Dordrecht: Springer.
Lekakis, J.N., and C. Pantzios. 1999. “Agricultural Liberalization and the Environment in Southern Europe: The Role of the Supply Side.” Applied Economics Letters 6(7): 453–458.
Morel, B., S. Farrow, F. Wu, and E. Casman. 2003. “Pesticide Resistance, the Precautionary Principle, and the Regulation of Bt Corn: Real Option and Rational Option Approaches to Decision-Making.” In R. Laxminarayan, ed., Battling Resistance to Antibiotics and Pesticides. Washington, D.C.: Resources for the Future.
Moschini, G., and H. Lapan. 1997. “Intellectual Property Rights and the Welfare Effects on Agricultural R&D.” American Journal of Agricultural Economics 79(4): 1229–1242.
Moschini, G., H. Lapan, and A. Sobolevsky. 2000. “Roundup Ready Soybeans and Welfare Effects in the Soybean Complex.” Agribusiness 16(1): 33–55.
Munkvold, G.P., R.L. Hellmich, and L.G. Rice. 1999. “Comparison of Fumonisin Concentra-tions in Kernels of Transgenic Bt Maize Hybrids and Nontransgenic Hybrids.” Plant Disease 83(2): 130–138.
Munkvold, G.P., R.L. Hellmich, and W.B. Showers. 1997. “Reduced Fusarium Ear Rot and Symptomless Infection in Kernels of Maize Genetically Engineered for European Corn Borer Resistance.” Phytopathology 87(10): 1071–1077.
Nillesen, E., S. Scatasta, and J. Wesseler. 2005. “Assessing the Environmental Impact of Bt Corn and HT Corn vs. Conventional Corn Production with Regard to Pesticide Use.” Un-published, Wageningen University.
Pilcher, C.D., M.E. Rice, R.A. Higgins, K.L. Steffey, R.L. Hellmich, J. Witkowski, D. Calvin, K.R. Ostlie, and M. Gray. 2002. “Biotechnology and the European Corn Borer: Measur-ing Historical Farmer Perceptions and Adoption of Transgenic Bt Corn as a Pest Manage-ment Strategy.” Journal of Economic Entomology 95(5): 878–892.
Soregaroli, C., and J. Wesseler. 2005. “The Farmer’s Value of Transgenic Crops under Ex-Ante Regulation and Ex-Post Liability.” In J. Wesseler, ed., Environmental Costs and Bene-fits of Transgenic Crops. Dordrecht: Springer.
Waibel, H., and G. Fleischer. 1998. Kosten und Nutzen des chemischen Pflanzenschutzes in der deutschen Landwirtschaft aus gesamtwirtschaftlicher Sicht. Kiel: Wissenschaftsverlag Vauk.
Wesseler, J. 2003. “Resistance Economics of Transgenic Crops: A Real Option Approach.” In R. Laxminarayan, ed., Battling Resistance to Antibiotics: An Economic Approach. Wash-ington, D.C.: Resources for the Future.
______ (ed.). 2005. Environmental Costs and Benefits of Transgenic Crops. Dordrecht: Springer.
World Bank. 2002. World Development Indicators 2002 on CD-ROM. The World Bank, Washington, D.C.
22 THE ECONOMICS OF REGULATION OF AGRICULTURAL BIOTECHNOLOGIES
Wu, F., J.D. Miller, and E.A. Casman. 2004. “The Economic Impact of Bt Corn Resulting from Mycotoxin Reduction.” Journal of Toxicology–Toxin Reviews 23(2&3): 397–424.
Zaid, A., H.G. Hughes, E. Porceddu, and F. Nicholas. 2001. “Glossary of Biotechnology for Food and Agriculture.” FAO Research and Technology Paper 9. Food and Agriculture Organization (FAO), Rome.
APPENDIX Specification of the partial equilibrium model for green corn Country j’s supply of green corn(f), ,
sf tQ , is given below:
, , ,
Pfs s sf t f t f tQ A P
ε⎡ ⎤= ⎣ ⎦ , (A1)
where the subscript j is dropped for ease of notation; ,
sf tP is the producer (or
output) price received by corn sellers at time t; ,sf tA is a technology specific
constant term for the associated product and function. The aggregate demand for green corn, ,
df tQ , is modeled as a constant elas-
ticity function of green corn price, , , ,
Pfd d df t f t f tQ A P
η⎡ ⎤= ⎣ ⎦ , (A2)
where ,
df tP is the buyers’ (or input) price paid for corn at time t; and ,
df tA is a
parameter capturing qualitative aspects of the product such as the type of technology used in its production process. The market clears with the following requirements: ,
d,
sf t fQ Q= t
,s
(A3) , ,1d
f t f tP ⎡ ⎤+ τ =⎣ ⎦ f tP , (A4)
where
, , , ,s d d
f t f t f t fP P P⎡ ⎤τ = −⎣ ⎦ t
represents the proportional CAP price support coefficient identifying the relative difference between the output and the input price of corn due to the CAP corn price support regime.
IRREVERSIBILITY, UNCERTAINTY, AND THE ADOPTION OF TRANSGNIC CROPS 23 Based on EUROSTAT data on the value of production calculated at the seller’s price and the value of production calculated at the buyer’s price, we observe that the variation in support received by corn sellers per unit of the product does not vary with the quantity produced. The price support system, therefore, reduces marginal production costs for corn sellers causing a parallel downwards shift in the supply function. At any time period the equilibrium price, *
,f tP and quantities, *,f tQ , are
given by
* *, , ,
1
,*,
, ,
,*, ,
, ,
1
11
1 .1
PfPf Pf
PfPf Pf
Pf Pf
s df t f t f t
df td
f t sf t f t
df td
f t f t sf t f t
P P
AP
A
AQ A
A
εε −η
ηη ε
ε −η
⎧⎪
⎡ ⎤= + τ⎪ ⎣ ⎦⎪⎪ ⎡ ⎤ ⎡ ⎤⎪ = ⎢ ⎥ ⎢ ⎥⎨
+ τ⎢ ⎥ ⎢ ⎥⎪ ⎣ ⎦ ⎣ ⎦⎪⎪ ⎡ ⎤ ⎡ ⎤⎪ ⎡ ⎤= ⎢ ⎥ ⎢ ⎥⎣ ⎦⎪ + τ⎢ ⎥ ⎢ ⎥⎣ ⎦ ⎣ ⎦⎩
(A5)
Producer surplus, ,f tPS , at the equilibrium conditions in (A5) is given by (A6) *
, , , ,1df t f t f t f tPS P Q⎡ ⎤= + τ⎣ ⎦
* −
*
,
1
, * * * *, , , , ,
0 , ,
111
f t PfQ s
f t Pfs s df t f t f t f t f ts
f t Pff t
QdQ P Q P Q
A
ε⎡ ⎤ ε= −⎢ ⎥
ε +⎡ ⎤+ τ⎢ ⎥⎣ ⎦ ⎣ ⎦∫ .
Consumer surplus, ,f tCS , at the equilibrium conditions in (9) is given by
*,
, , ,Pf
df t
d d d,f t f t f t
P
CS A P dP∞
η⎡ ⎤= ⎣ ⎦∫ f t . (A7)
Following Moschini, Lapan, and Sobolevsky (2000) we assume that the adoption of a technological innovation, such as transgenic corn, causes a pivotal shift in the inverse supply function by changing the value of the technology specific constant term, α. The proportional vertical shift in the inverse supply function, f and t will be given by
24 THE ECONOMICS OF REGULATION OF AGRICULTURAL BIOTECHNOLOGIES
( )
1/ 1/
0 11/
0
1 1
1
Pf Pf
Pf
s s
s
A At K
A
ε ε
ε
⎡ ⎤ ⎡ ⎤−⎢ ⎥ ⎢ ⎥⎣ ⎦⎣ ⎦ = θ
⎡ ⎤⎢ ⎥⎣ ⎦
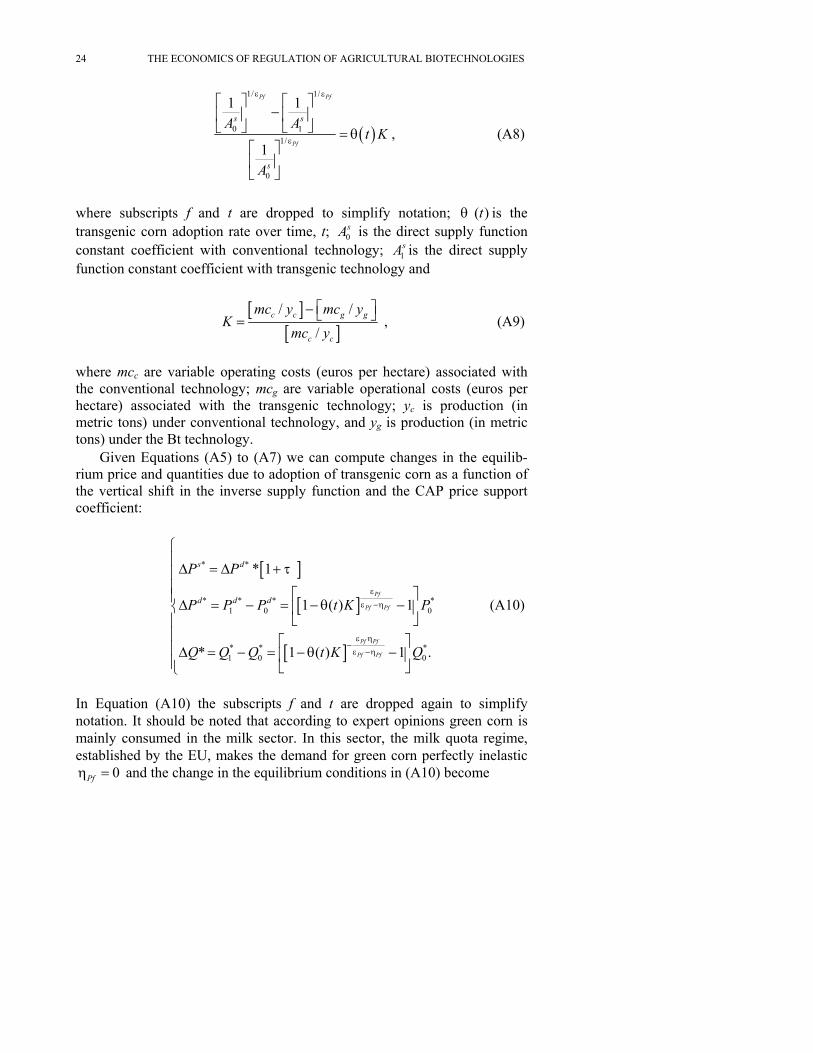
, (A8)
where subscripts f and t are dropped to simplify notation; ( )tθ is the transgenic corn adoption rate over time, t; 0
sA is the direct supply function constant coefficient with conventional technology; 1
sA is the direct supply function constant coefficient with transgenic technology and
[ ]
[ ]/ /
/c c g g
c c
mc y mc yK
mc y
⎡ ⎤− ⎣ ⎦= , (A9)
where mcc are variable operating costs (euros per hectare) associated with the conventional technology; mcg are variable operational costs (euros per hectare) associated with the transgenic technology; yc is production (in metric tons) under conventional technology, and yg is production (in metric tons) under the Bt technology. Given Equations (A5) to (A7) we can compute changes in the equilib-rium price and quantities due to adoption of transgenic corn as a function of the vertical shift in the inverse supply function and the CAP price support coefficient:
[ ]
[ ]
[ ]
* *
* * *1 0
* * *1 0 0
* 1
1 ( ) 1
* 1 ( )
Pf
Pf Pf
Pf Pf
Pf Pf
s d
d d d
P P
P P P t K P
Q Q Q t K Q
ε
ε −η
ε η−ε −η
⎧⎪∆ = ∆ + τ⎪⎪ ⎡ ⎤⎪∆ = − = − θ −⎨ ⎢
⎣ ⎦⎪⎪ ⎡ ⎤⎪∆ = − = − θ −⎢ ⎥⎪ ⎣ ⎦⎩
*0
1 .
⎥ (A10)
In Equation (A10) the subscripts f and t are dropped again to simplify notation. It should be noted that according to expert opinions green corn is mainly consumed in the milk sector. In this sector, the milk quota regime, established by the EU, makes the demand for green corn perfectly inelastic
and the change in the equilibrium conditions in (A10) become 0Pfη =
IRREVERSIBILITY, UNCERTAINTY, AND THE ADOPTION OF TRANSGNIC CROPS 25
*0 (A10a)
[ ]* *
* * *1 0* *1 0
* 1
( )
* 0
s d
d d d
P P
P P P t KP
Q Q Q
⎧∆ = ∆ + τ⎪⎪∆ = − = −θ⎨⎪∆ = − =⎪⎩
As we lack data on corn use by the milk sector, we allow input demand to be not perfectly inelastic and refer to the changes in the equilibrium conditions in (A10) for our welfare analysis. The change in producer surplus, in particular, will be given by:
[ ]1
* *1 0 0 01 1 ( ) 1
1
Pf Pf
Pf PfPf d
Pf
PS PS PS t K Q P⎡ ⎤ε +η⎣ ⎦
ε −η⎡ ⎤⎡ ⎤ε
∆ = − = τ + − − θ −⎢ ⎥⎢ ⎥ε +⎢ ⎥ ⎢ ⎥⎣ ⎦ ⎣ ⎦
(A11)
The total change in producer surplus can be decomposed in two parts: the change in producer surplus accruing from the government due to the price support system, ; and the change in producer surplus accruing from the market:
govPS∆
(A11a) 1 0
gov gov govPS PS PS∆ = − =
[ ]1
* * * * * *1 1 0 0 0 01 ( ) 1
Pf Pf
Pf Pfd dP Q P Q t K Q P
⎡ ⎤ε +η⎣ ⎦ε −η
⎡ ⎤⎡ ⎤τ − = τ − θ −⎢ ⎥⎣ ⎦ ⎢ ⎥⎣ ⎦
d
0
and (A11b) 1
mkt mkt mktPS PS PS∆ = −
[ ]1
* *0 01 1 ( ) 1
1
Pf Pf
Pf PfPfgov d
Pf
PS PS t K Q P⎡ ⎤ε +η⎣ ⎦
ε −η⎡ ⎤⎡ ⎤ε
= ∆ − ∆ = − − θ −⎢ ⎥⎢ ⎥ε +⎢ ⎥ ⎢ ⎥⎣ ⎦ ⎣ ⎦
Assuming that the introduction of transgenic corn does not cause shifts in the demand function, the consumer surplus changes as follows:
*1
*0
1
* * *1 0 0 1 0
PfQ d
d dd
Q
QCS CS CS P P Q dQA
η⎡ ⎤⎡ ⎤∆ = − = − + ⎢ ⎥⎣ ⎦
⎣ ⎦∫ d (A12)
[ ] [ ]1
* * * *0 0 0 01 ( ) 1 1 ( ) 1
1
Pf Pf Pf
Pf Pf Pf PfPfd d
Pf
t K P Q t K P Q⎡ ⎤ε +η ε⎣ ⎦
ε −η ε −η⎡ ⎤ η ⎡ ⎤
= − θ − − − θ −⎢ ⎥ ⎢ ⎥η +⎢ ⎥ ⎣ ⎦⎣ ⎦.
26 THE ECONOMICS OF REGULATION OF AGRICULTURAL BIOTECHNOLOGIES
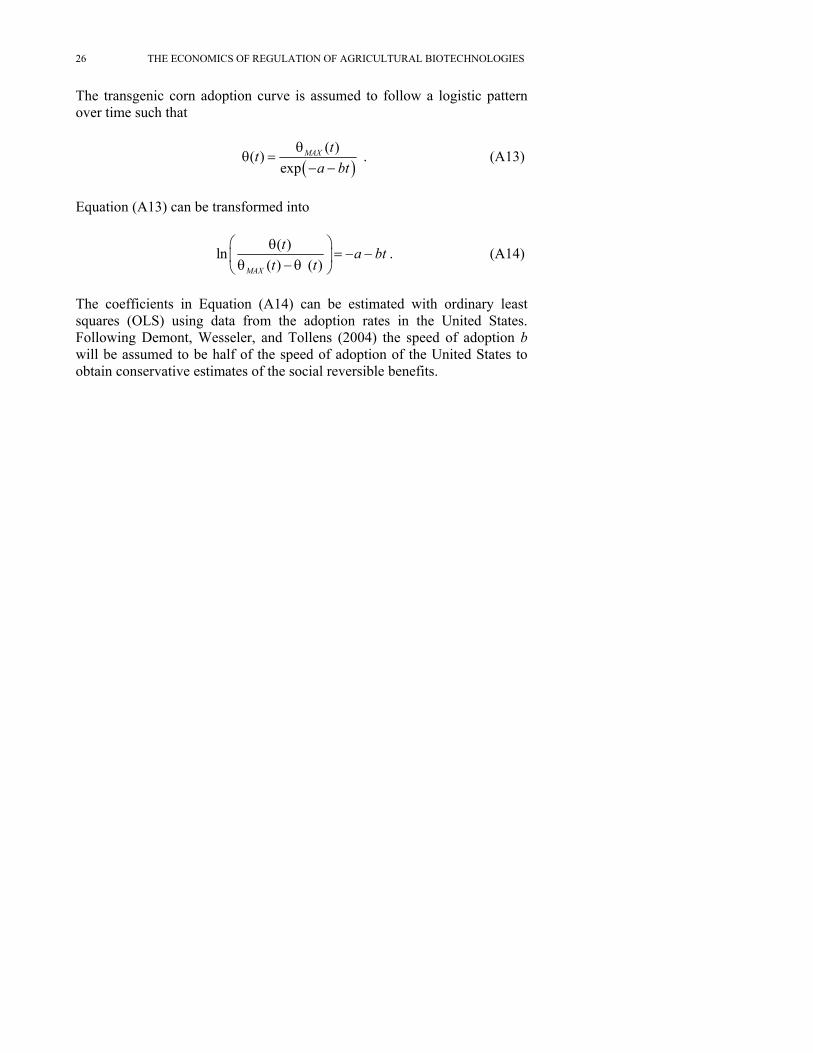
The transgenic corn adoption curve is assumed to follow a logistic pattern over time such that
( )
( )( )exp
MAX tta bt
θθ =
− − . (A13)
Equation (A13) can be transformed into
( )ln( ) ( )MAX
t a btt t
⎛ ⎞θ= − −⎜ ⎟θ − θ⎝ ⎠
. (A14)
The coefficients in Equation (A14) can be estimated with ordinary least squares (OLS) using data from the adoption rates in the United States. Following Demont, Wesseler, and Tollens (2004) the speed of adoption b will be assumed to be half of the speed of adoption of the United States to obtain conservative estimates of the social reversible benefits.
Related Documents


![Irreversibility and the second law of thermodynamicsusers.ntua.gr/rogdemma/Irreversibility and the... · Irreversibility and the second law of ... 1Some authors [14] propose an alternative](https://static.cupdf.com/doc/110x72/5ebc512431aa487d260ac79f/irreversibility-and-the-second-law-of-and-the-irreversibility-and-the-second.jpg)