Vehicular Communications 2 (2015) 47–57 Contents lists available at ScienceDirect Vehicular Communications www.elsevier.com/locate/vehcom Irresponsible AODV routing ✩ Andrea Gorrieri ∗ , Gianluigi Ferrari ∗∗ Wireless Ad-hoc Sensor Network Laboratory, Department of Information Engineering, University of Parma, I-43124, Parma, Italy a r t i c l e i n f o a b s t r a c t Article history: Received 10 July 2014 Received in revised form 15 December 2014 Accepted 22 January 2015 Available online 16 February 2015 Keywords: Vehicular Ad-hoc NETwork (VANET) Pedestrian networks Ad-hoc On demand Distance Vector (AODV) routing Flooding Broadcast Forwarding Broadcasting is a common transmission strategy used by several ad-hoc routing protocols in order to solve many issues, such as finding a route to a new host or sending control messages to all nodes in the network. Flooding is the simplest technique to achieve broadcast communications and it is widely used in many existing routing protocols for Mobile Ad-hoc NETworks (MANETs). However, because of multiple access interference, due to redundant transmissions, flooding tends to be inefficient. In this paper, the well-known Ad-hoc On demand Distance Vector (AODV) routing protocol [1] is modified by replacing the flooding mechanism, used in its route discovery process, with the probabilistic forwarding technique given by Irresponsible Forwarding (IF) [2]. The performance of the new routing protocol, denoted as irresponsible AODV (iAODV), is analyzed in three characteristic scenarios (pedestrian, pedestrian–vehicular, and vehicular). The obtained results show that the iAODV protocol can outperform the AODV protocol by significantly reducing the overhead traffic during the route discovery phase. This is more pronounced the higher are the node spatial density and/or data traffic load. The impact, on the system performance, of fundamental network parameters is investigated. © 2015 Elsevier Inc. All rights reserved. 1. Introduction A Mobile Ad-hoc NETwork (MANET) consists of a set of mo- bile devices that communicate dynamically without the need of a pre-existing network infrastructure. In a MANET, each node may forward data packets associated with multi-hop communications between other pairs of nodes, so that each node can act as source, rebroadcaster, and destination at the same time. MANETs can be useful in all situations where networks need to be deployed very quickly and fixed network infrastructures are not available. Due to the growing interest in smart cities and Internet of Things (IoT) applications [3], in the last years subclasses of MANETs, such as Vehicular Ad-hoc NETworks (VANETs) [4] and Opportunistic (such as pedestrian or Machine-to-Machine, M2M) ad-hoc networks [5], have been intensely investigated. In this type of networks, nodes share a common channel and can be highly mobile, thus making the design of routing protocols very challenging. The scientific community has tackled the design of multi-hop communication protocols very intensely in the past decade, and many routing protocols for ad-hoc networks have been proposed ✩ The work of Andrea Gorrieri is partially supported by the SPINNER 2013. * Principal corresponding author. ** Corresponding author. E-mail addresses: [email protected] (A. Gorrieri), [email protected] (G. Ferrari). and analyzed [6,7]. Although these protocols tend to be very differ- ent from each other, they all typically rely on flooding mechanisms in order to perform some routing operations, such as finding a route to a desired destination or sending control messages to all nodes in the network. This is especially true for reactive routing protocols, such as Ad-hoc On-demand Distance Vector (AODV) [1] and Dynamic Source Routing (DSR) [8], which utilize flooding in the so-called “route discovery” phase. The flooding strategy can be very inefficient in MANETs and, because of highly redundant trans- missions, can lead to serious inefficiencies, caused by collisions and interference. This problem, referred to as Broadcast Storm Prob- lem (BSP) [9], is more exacerbated the higher are the node spatial density, the node mobility level, and/or the data traffic load. In general, there are many approaches that can be used in order to reduce the redundancy introduced by flooding—the interested reader is referred to [9] for a possible classification—and, thus, de- sign energy-efficient broadcast mechanisms. One possibility is to adopt a probabilistic broadcasting approach. According to this ap- proach, a potential rebroadcaster node retransmits a packet with probability p and, consequently, takes no action with probability 1 − p. According to the probabilistic forwarding strategy, denoted as Irresponsible Forwarding (IF), introduced in [2], a node com- putes the retransmission probability for each received packet tak- ing into account the node spatial density, the transmission range (assumed fixed for all nodes), and the distance from the transmit- ter. http://dx.doi.org/10.1016/j.vehcom.2015.01.002 2214-2096/© 2015 Elsevier Inc. All rights reserved.

Welcome message from author
This document is posted to help you gain knowledge. Please leave a comment to let me know what you think about it! Share it to your friends and learn new things together.
Transcript

Vehicular Communications 2 (2015) 47–57
Contents lists available at ScienceDirect
Vehicular Communications
www.elsevier.com/locate/vehcom
Irresponsible AODV routing ✩
Andrea Gorrieri ∗, Gianluigi Ferrari ∗∗
Wireless Ad-hoc Sensor Network Laboratory, Department of Information Engineering, University of Parma, I-43124, Parma, Italy
a r t i c l e i n f o a b s t r a c t
Article history:Received 10 July 2014Received in revised form 15 December 2014Accepted 22 January 2015Available online 16 February 2015
Keywords:Vehicular Ad-hoc NETwork (VANET)Pedestrian networksAd-hoc On demand Distance Vector (AODV) routingFloodingBroadcastForwarding
Broadcasting is a common transmission strategy used by several ad-hoc routing protocols in order to solve many issues, such as finding a route to a new host or sending control messages to all nodes in the network. Flooding is the simplest technique to achieve broadcast communications and it is widely used in many existing routing protocols for Mobile Ad-hoc NETworks (MANETs). However, because of multiple access interference, due to redundant transmissions, flooding tends to be inefficient. In this paper, the well-known Ad-hoc On demand Distance Vector (AODV) routing protocol [1] is modified by replacing the flooding mechanism, used in its route discovery process, with the probabilistic forwarding technique given by Irresponsible Forwarding (IF) [2]. The performance of the new routing protocol, denoted as irresponsible AODV (iAODV), is analyzed in three characteristic scenarios (pedestrian, pedestrian–vehicular, and vehicular). The obtained results show that the iAODV protocol can outperform the AODV protocol by significantly reducing the overhead traffic during the route discovery phase. This is more pronounced the higher are the node spatial density and/or data traffic load. The impact, on the system performance, of fundamental network parameters is investigated.
© 2015 Elsevier Inc. All rights reserved.
1. Introduction
A Mobile Ad-hoc NETwork (MANET) consists of a set of mo-bile devices that communicate dynamically without the need of a pre-existing network infrastructure. In a MANET, each node may forward data packets associated with multi-hop communications between other pairs of nodes, so that each node can act as source, rebroadcaster, and destination at the same time. MANETs can be useful in all situations where networks need to be deployed very quickly and fixed network infrastructures are not available. Due to the growing interest in smart cities and Internet of Things (IoT) applications [3], in the last years subclasses of MANETs, such as Vehicular Ad-hoc NETworks (VANETs) [4] and Opportunistic (such as pedestrian or Machine-to-Machine, M2M) ad-hoc networks [5], have been intensely investigated. In this type of networks, nodes share a common channel and can be highly mobile, thus making the design of routing protocols very challenging.
The scientific community has tackled the design of multi-hop communication protocols very intensely in the past decade, and many routing protocols for ad-hoc networks have been proposed
✩ The work of Andrea Gorrieri is partially supported by the SPINNER 2013.
* Principal corresponding author.
** Corresponding author.E-mail addresses: [email protected] (A. Gorrieri),
[email protected] (G. Ferrari).
http://dx.doi.org/10.1016/j.vehcom.2015.01.0022214-2096/© 2015 Elsevier Inc. All rights reserved.
and analyzed [6,7]. Although these protocols tend to be very differ-ent from each other, they all typically rely on flooding mechanisms in order to perform some routing operations, such as finding a route to a desired destination or sending control messages to all nodes in the network. This is especially true for reactive routing protocols, such as Ad-hoc On-demand Distance Vector (AODV) [1]and Dynamic Source Routing (DSR) [8], which utilize flooding in the so-called “route discovery” phase. The flooding strategy can be very inefficient in MANETs and, because of highly redundant trans-missions, can lead to serious inefficiencies, caused by collisions and interference. This problem, referred to as Broadcast Storm Prob-lem (BSP) [9], is more exacerbated the higher are the node spatial density, the node mobility level, and/or the data traffic load.
In general, there are many approaches that can be used in order to reduce the redundancy introduced by flooding—the interested reader is referred to [9] for a possible classification—and, thus, de-sign energy-efficient broadcast mechanisms. One possibility is to adopt a probabilistic broadcasting approach. According to this ap-proach, a potential rebroadcaster node retransmits a packet with probability p and, consequently, takes no action with probability 1 − p. According to the probabilistic forwarding strategy, denoted as Irresponsible Forwarding (IF), introduced in [2], a node com-putes the retransmission probability for each received packet tak-ing into account the node spatial density, the transmission range (assumed fixed for all nodes), and the distance from the transmit-ter.
48 A. Gorrieri, G. Ferrari / Vehicular Communications 2 (2015) 47–57
In this work, we propose a novel reactive routing protocol, de-noted as irresponsible AODV (iAODV), obtained from the AODV protocol by replacing, in the route discovery process, the flooding mechanism with IF. In order to exhaustively investigate the perfor-mance of the iAODV protocol, three different types of scenarios are considered: (i) pedestrian, (ii) pedestrian–vehicular, and (iii) ve-hicular. The results show that the iAODV protocol outperforms (in terms of throughput and delay) the AODV protocol in all scenar-ios and in almost all considered network conditions, especially for high traffic load and/or high node spatial density. Moreover, owing to the use of IF in the route discovery process, the iAODV protocol can adapt effectively its behavior to the network conditions.
The remainder of this paper is organized as follows. In Sec-tion 2, we provide an overview of related work, with focus on the mitigation of the BSP. In Section 3, the IF technique is briefly re-called. In Section 4, the iAODV protocol is introduced: first, a brief overview of the AODV protocol is provided, focusing on the use of flooding in the route discovery process; then, we describe how the IF strategy is embedded into the route discovery process, leading to iAODV; finally, the capability of the iAODV protocol to mitigate the BSP is analytically evaluated. In Section 5, the three scenar-ios of interest (pedestrian, pedestrian–vehicular, and vehicular) are described. In Section 6, the performance of the iAODV protocol, di-rectly compared with that of the AODV protocol, is investigated in the considered scenarios. Finally, Section 7 concludes the paper.
2. Related work
In [10], authors explore the so-called “phase transition” phe-nomenon as a basis for defining probabilistic flooding. A phase transition occurs when a generic network parameter p exceeds a certain threshold value pc, denoted as “critical point,” radically changing the overall behavior of the network. In particular, in [10] the parameter p corresponds to the retransmission probabil-ity, which is considered fixed and equal for all nodes in network.
The phase transition phenomenon for a probabilistic broadcast technique is analyzed also in [11] where the authors show that replacing flooding with probabilistic broadcast in the route discov-ery process of the AODV protocol brings a significant performance improvement. In particular, for large networks, the number of con-trol messages used by the modified AODV protocol, denoted as AODV+G, reduces by 35% with respect to that of the AODV pro-tocol. In [11], as in [10], probabilistic flooding is performed with a fixed retransmission probability, which is the same in all network conditions and does not depend on the specific values of network parameters. In both [10] and [11], the concept of percolation [12,13] is used to characterize the phase transition.
In [14], the authors focus on the problem of the construction of a broadcast communication tree, defined as the set of nodes in-volved in a packet forwarding process—the set includes sources, relays, and destinations. In [14], several algorithms for broadcast communication tree construction in infrastructureless networks are proposed and analyzed. In particular, these algorithms, exploiting the characteristics of the wireless medium, create broadcast trans-mission trees that are optimal in terms of energy consumption minimization.
According to a completely different point of view, in [15] the authors analyze a physical layer cooperative flooding scheme. The idea is that while at the network layer collisions are harmful, at the physical layer broadcast messages can cooperate thus increas-ing the received power and the transmission range. This approach is in contrast with the traditional network layer flooding, that treats each link individually and attempts to eliminate collisions as much as possible.
Fig. 1. IF PAF, as a function of the internode distance, for various values of the shap-ing parameter c. In all cases, ρ = 900 nodes/km2 and z = 100 m.
3. Irresponsible forwarding
IF is a probabilistic forwarding technique in which every node computes its own retransmission probability in a per-packet man-ner. In a single source scenario, the broadcast forwarding process of IF can be summarized as follows: the initial transmission of a new packet from the source is denoted as the 0-th hop trans-mission. The packet is then received by all the source neighbors, that are the potential rebroadcasting nodes for the 1-st hop. Hence, their union constitutes the “1-st transmission domain.” Each node of the 1-st transmission domain rebroadcasts, independently from the other nodes of the same domain, with a probability com-puted according to a proper Probability Assignment Function (PAF). The nodes receiving a packet from the rebroadcasters of the 1-st transmission domain constitute the 2-nd transmission domain and some of them rebroadcast according to the PAF previously men-tioned. The process then repeats itself recursively.
Intuitively, the farther the potential rebroadcaster node is from the transmitting node, the higher its associated rebroadcast prob-ability should be, as this will yield the highest forward progress. Based on this idea, in [2] the PAF of IF is introduced for a monodi-mensional scenario (e.g., narrow street). In a realistic bidimen-sional scenario (e.g., a city square), the PAF of IF can be generalized as follows:
pIF = exp
{−
√ρ(z − d)
c
}(1)
where: d is the distance between the transmitter and a potential rebroadcaster (dimension: [m]); z is the transmission range (di-mension: [m]); c is a shaping coefficient (adimensional) which can be used in order to tune the retransmission probability [16]; ρ is the bidimensional nodes spatial density (dimension: [nodes/km2]). According to the PAF (1), if the network is sparse, the overall re-transmission probability is high, so that complete connectivity can still be guaranteed; on the other hand, if the network is spatially dense, the overall retransmission probability is low in order to limit transmission redundancy and collisions. In Fig. 1, the PAF (1)is shown as a function of the internode distance d for three differ-ent values of c. The node spatial density ρ is set to 900 nodes/km2
and the transmission range z is set to 100 m.The idea behind the IF rebroadcasting paradigm is that once a
node receives a packet, it estimates, in an average statistical sense, the presence of other nodes in its proximity. If the probability that another node can rebroadcast the packet is sufficiently high, then the node of interest “irresponsibly” chooses not to rebroadcast. In [2,16], it is shown that this irresponsible approach becomes very beneficial for increasing traffic load and/or node spatial density.
A. Gorrieri, G. Ferrari / Vehicular Communications 2 (2015) 47–57 49
Since IF is based on the assumption of knowing the values of some topological network parameters—such as internode distance and node spatial density—in this work we assume that each node is equipped with a Global Positioning System (GPS) interface. This allows a receiving node to evaluate the distance from the trans-mitting node. Moreover, each node could estimate the local node spatial density ρ by evaluating the distances of its direct neigh-bors.
4. Embedding IF into AODV
In this section, we first provide an overview of the AODV pro-tocol, focusing on when and how flooding is performed. Then, we show how the IF strategy can be embedded into the AODV proto-col. Finally, the ability of the iAODV protocol to mitigate the BSP is quantified analytically.
4.1. The AODV routing protocol
The AODV protocol, derived from the Distance Vector (DV) pro-tocol [17], is one of the most sought routing protocols for ad-hoc networks. AODV is a reactive routing protocol: this means that a source node tries to find a multi-hop route to a desired destination node only when it has packets to transmit. No control or routing information is generated by nodes that are not involved in a com-munication. This kind of approach is opposed to the proactive one, such as that used by the Destination Sequenced Distance Vector (DSDV) protocol [18]. With a proactive approach, all nodes in the network update their routing tables by regularly exchanging con-trol messages. Although this strategy allows to maintain up-to-date routing information from each node to every other node, it leads to a constant overhead of routing traffic. However, no initial delay is required in order to discover the route to the destination.
Unlike proactive protocols, with the AODV protocol a source node, which does not have any routing information about a de-sired destination in its routing table, first performs a so-called “route discovery” process, based on pure flooding, which can be described as follows. The source node transmits to its neighbors a Route REQuest (RREQ) packet, which contains the destination ad-dress and some other information, such as a broadcast id and a hop counter. A neighbor replies to the source with a Route REPly (RREP) message if it has routing information related to the desti-nation; otherwise, the neighbor rebroadcasts the RREQ increasing the hop counter.
One basic feature of the AODV protocol is the use of the so-called destination sequence number. This number is periodically generated by each node in order to maintain the entries of the routing tables “fresh.” Should a requesting node have the possi-bility of choosing between two routes to a destination, the one associated with the largest sequence number would be selected.
Another important property of the AODV protocol is the man-agement of the local connectivity. If a node does not send a mes-sage to any of its neighbors within a hello interval (dimension: [s]), it broadcasts a special RREP, denoted as hello message, containing its identity. The hello message is not further rebroadcasted by the node’s neighbors because its field Time To Live (TTL) is set to 1. Hello messages are used to detect a route break as follows: if a relay node between a source and a destination fails to receive a minimum number, denoted as allowed hello loss, of hello messages from the next hop in the path, a notification of link failure is sent to the source. In this case, another route discovery process is re-quired and a new “wave” of RREQ messages floods the network. For this reason, hello messages and, in particular, the values of the parameters hello interval and allowed hello loss have a significant impact on the total number of transmitted RREQ packets.
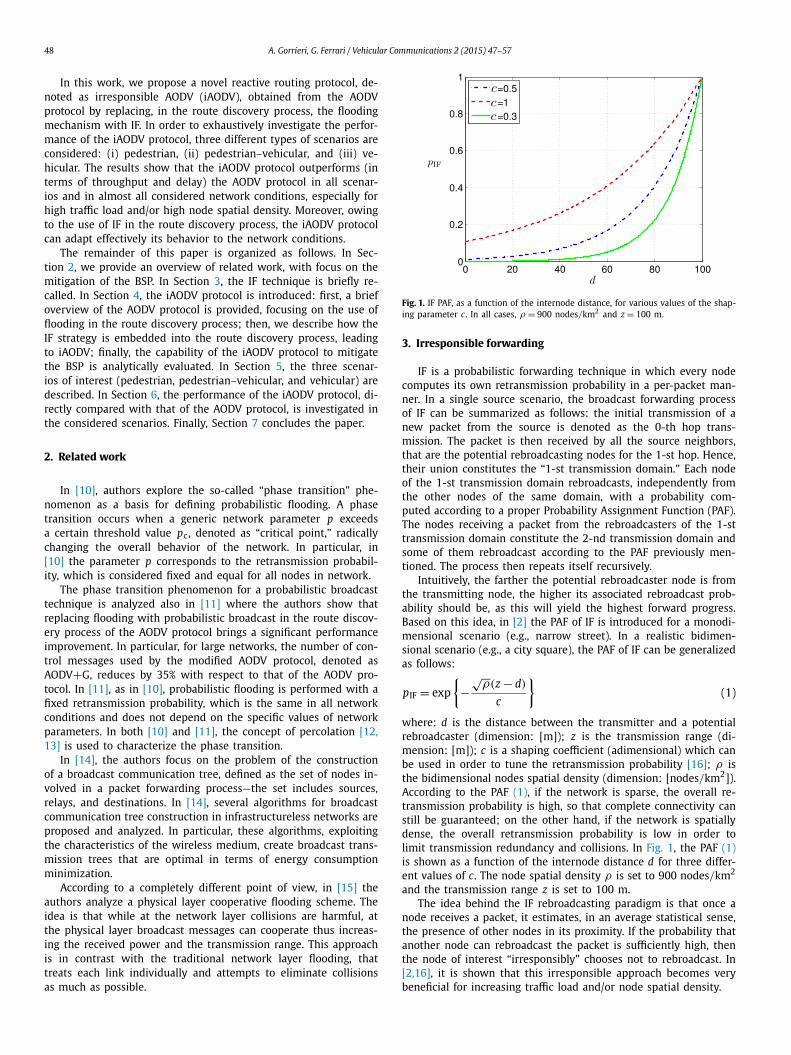
Fig. 2. Illustrative example of iAODV route discovery process. Nodes which are far away from the source rebroadcast the RREQ with higher probability.
4.2. IF in the route discovery process
In order to limit the number of broadcasted RREQ packets and, consequently, the BSP, we propose to replace the flooding mecha-nism, used in the route discovery process of AODV, with IF. When a node receives an RREQ packet, it first checks its broadcast id: if it has already received another RREQ packet with the same broad-cast id, the redundant RREQ packet is dropped; if this is not the case and if the node has no routing information to the destina-tion, the RREQ packet is rebroadcasted with a probability given by (1). This new variant of the AODV protocol will be referred to as iAODV. In Fig. 2, an illustrative example of the iAODV route discov-ery process is shown: according to the IF principle, the RREQs are propagated only (in a statistical sense) by the farthest nodes in the 1-st transmission domain.
4.3. BSP mitigation: an analytical evaluation
In order to measure the capability of the iAODV protocol to mit-igate the BSP, we analytically evaluate the number of saved redun-dant rebroadcasts brought by the use of IF in the route discovery phase of iAODV. While a similar analysis is carried out in [2] for a monodimensional scenario, in the following we consider a more realistic bidimensional scenario—this is more relevant for pedes-trian, rather than vehicular, networks.
Let us consider the first rebroadcast round as shown in Fig. 2, where the source node is placed in the center of its circular cover-age area (with radius z) and transmits to all its neighbors the first RREQ packet. We denote the total number of rebroadcasts in this first rebroadcast round as Nrtx. The total number of nodes in the coverage area (i.e., the source neighbors) is, on average, the follow-ing:
Nz = ρπ z2. (2)
According to the IF strategy, some of the neighbor nodes will re-broadcast the RREQ packet, while the others will be inhibited from doing it. Denoting with � the random variable “retransmission probability of a neighbor node” (obviously, � ∈ [0, 1]), under the use of the IF protocol the average number of rebroadcasts in the first round can be written as follows:
Nrtx-IF = ρπ z2E{�} (3)

50 A. Gorrieri, G. Ferrari / Vehicular Communications 2 (2015) 47–57
where:
E{�} =∞∫
−∞γ f�(γ )dγ =
1∫0
γ f�(γ )dγ (4)
and f�(γ ) is the Probability Density Function (PDF) of �. Denoting as D the random variable representing the “distance between the source node and one of its neighbor,” by applying the total proba-bility theorem [19], f�(γ ) can be rewritten as follows:
f�(γ ) =z∫
0
f�(γ |D = δ) P{D = δ}dδ =z∫
0
f�(γ |D = δ) fD(δ)dδ
(5)
where fD(δ) is the PDF of D . By replacing (5) into (4), one obtains:
E{�} =1∫
0
γ
z∫0
f�(γ |D = δ) fD(δ)dδ dγ
=z∫
0
1∫0
γ f�(γ |D = δ) fD(δ)dγ dδ. (6)
The PDF of �, conditioned to the fact that the neighbor node is at a distance δ from the source, is a Dirac delta function, i.e.,
f�(γ |D = δ) ={
1 if γ = e− (z−δ)c ρ
0 otherwise.(7)
Using (7) into (6) one obtains:
E{�} =z∫
0
e− (z−δ)c ρ fD(δ)dδ (8)
In order to find an expression for fD(δ), it is convenient to de-fine a coordinate system where the source node is placed at the origin, so that C � {(x, y) ∈ R
2 : x2 + y2 ≤ z2} represents the set of coordinates within the coverage area of the source. Defining E � {(x, y) ∈ R
2 : x2 + y2 ≤ δ2}, the Cumulative Density Function (CDF) of D , denoted as FD(δ), can be expressed as the fraction be-tween the area of the region identified by E and the coverage area, i.e.:
F D(δ) = P{D ≤ δ} = πδ2
π z2=
(δ
z
)2
. (9)
Therefore,
f D(δ) = dF D(δ)
dδ= 2δ
z2. (10)
By replacing (10) into (8), the average retransmission probability with IF can be expressed as follows:
E{�} = 2
z2e− zρ
c
z∫0
δeδρc dδ = 2c
zρ
[1 + c
zρ
(e− zρ
c − 1)]
. (11)
Finally, by replacing (11) into (3) one obtains the following expres-sion for the average number of rebroadcasters in the first rebroad-cast domain:
Nrtx-IF = 2πc
[z + c
ρ
(e− zρ
c − 1)]
. (12)
Note that, as a consistency check, for c → ∞ it follows that the right-hand side in (12) tends to the average number of transmis-sions in the first broadcast round with the flooding protocol, i.e.:
Fig. 3. Average number of retransmissions, in the first rebroadcast round of the route discovery phase, as a function of c. The performance of iAODV (with IF in the route discovery phase) is directly compared with that of AODV (with flooding in the route discovery phase). In both cases, the node range z is set to 100 m while the node spatial density ρ is set to 2200 nodes/km2.
limc→+∞ Nrtx-IF = lim
c→+∞ 2πc
[z + c
ρ
(e− zρ
c − 1)]
= π z2ρ (13)
where the limit follows observing that the second-order Taylor se-ries expansion of the term exp (−(zρ)/c) is equal to (1 − (zρ)/c +(zρ)2/2c2. We remark that, since with the flooding protocol each neighbor node rebroadcasts the RREQ packet, the average number of rebroadcasters is equal to Nz given by (2).
In Fig. 3, Nrtx is shown, as a function of c, comparing the IF protocol with flooding. The node range z is set to 100 m while the node spatial density ρ is set to 2200 nodes/km2. As expected, for very high values of c, Nrtx with IF converges to the value ob-tained by flooding. It can be observed that, by setting c = 0.2, the iAODV protocol can save roughly 20 rebroadcasts with respect to the AODV protocol, which corresponds to almost 30% of saved re-transmissions.
We remark that the reduction of transmitted control messages predicted by the proposed analytical framework is related to a single source node in the first round of propagation: therefore, the total number of saved rebroadcasts in the entire network can be extremely larger, especially considering dense multi-source ad hoc networks. Regarding the second and the following rebroadcast rounds, computing the number of rebroadcasts is much more com-plicated, since it depends not only by the number of rebroadcasters in the previous rebroadcast round, but also on their specific posi-tions. This is a challenging problem and we are currently working on it. Finally, we remark that the IF strategy mitigates the BSP notonly by statistically reducing the number of rebroadcasted packets, as done, for example, in [11], but also by selecting, in an average statistical sense, the best rebroadcaster nodes and adapting itself to the network conditions.
5. Simulation setup
In this section, we detail the simulation set-up behind the per-formance analysis of the iAODV protocol. In particular, we describe the three relevant and complementary networking scenarios of interest (pedestrian, pedestrian–vehicular, and vehicular) together with the selected performance metrics. All simulations are carried out with the ns-3 (ns-3.19) tool [20]. In all simulated scenarios: the number of nodes in network is denoted by N; each node has the same transmission range z (dimension: [m]); each source node generates packets of dimension Ps (dimension: [byte/pkt]) at

A. Gorrieri, G. Ferrari / Vehicular Communications 2 (2015) 47–57 51
a packet generation rate λ (dimension: [pkt/s]). The packets are then transmitted with a fixed data rate (on the wireless channel) R = 1 Mbps. The number of source nodes is denoted as Ntx and the corresponding destinations are randomly chosen among the set of all nodes. Since unicast transmissions are considered, the num-ber of destinations is at most equal to Ntx. In particular, a single node may happen to be the destination for more than one source node.
At the network layer, the performance of iAODV is compared with those of AODV and AODV+G protocols [11]. As already men-tioned in Section 2, the AODV+G protocol, embeds a static proba-bilistic broadcast in the route discovery process of the AODV pro-tocol. In particular, the retransmission probability of the AODV+G protocol is set to p = 0.65 [11]. The characteristic control parame-ters of AODV, AODV+G, and iAODV protocols, outlined in Subsec-tion 4.1, are set as indicated in [1], namely: hello interval = 1 s and allowed hello loss = 2. For the lower layers, the wireless communi-cation protocol stack defined by the ad-hoc IEEE 802.11b standard is used [21].
5.1. Pedestrian scenario
This kind of scenario is representative for opportunistic ad-hoc networks of smartphones or tablets (namely, social proximity net-works [5]). Since nodes correspond to pedestrians, this scenario is characterized by high node spatial density and low node speed. For example, one can imagine an application where a pedestrian may seldom send a very short information packet (e.g., contain-ing his/her position) to intended destinations—for example this position information could be sent periodically, with a relatively long period (because of the low speed of the considered termi-nals). For the sake of performance analysis, we assume that nodes are uniformly positioned over a square region with side L (dimen-sion: [m]) given by:
L =√
N
ρ(14)
All nodes move according to the mobility model “RandomWay-PointMobilityModel,” available in ns-3, with speed sp (dimen-sion: [m/s]).
An illustrative example of a pedestrian scenario with N = 180nodes and ρ = 1700 nodes/km2 is shown in Fig. 4. The length of the side of the square region is L � 325 m.
5.2. Pedestrian–vehicular scenario
In a pedestrian–vehicular scenario, both vehicles and pedestri-ans are present, so that a designer has to deal with heterogeneous devices, in terms of both speed and mobility patterns.
We define a scenario constituted by a single road, with two lanes, which surrounds a square region populated by pedestrians. The side of the square region is set as in the pedestrian scenario of Subsection 5.1, i.e., is given by (14). Nodes can be of two types: pedestrian or vehicular. In particular, we assume that Nped pedes-trian nodes are positioned randomly in the inner square region and move, without crossing the surrounding roads, with the same mobility model of the pedestrian scenario in Subsection 5.1 (i.e., random way point). The number of vehicles is denoted as Nvehand we assume that they are constrained to move along the road in a single driving direction. The ratio Nped/Nveh is fixed and set to 4—this is realistic for a “popular” square (e.g., a square with touris-tic attractions). The movement of the vehicles is generated with the SUMO open-source mobility simulator [22] integrated with the ns-3 simulator [23]. SUMO is a road traffic simulator that allows to
Fig. 4. Illustrative example of pedestrian scenario. N = 180 nodes are deployed over a square region with a side L � 325 m and a node spatial density ρ =1700 nodes/km2. For the sake of clarity, we show the speed vector (solid lines with arrows) only for a few representative nodes. Multi-hop paths are represented through dashed lines.
Fig. 5. Illustrative example of pedestrian–vehicular scenario. Nveh = 14 vehicular nodes are positioned along the road while Nped = 56 pedestrians are positioned into the inner square. For the sake of clarity, we show the speed vector (solid lines with arrows) only for a few representative nodes. Multi-hop paths are represented through dashed lines.
create a vehicular scenario by using one of its external tools or by converting an existing map.
In Fig. 5, an illustrative example of the scenario at hand, with Nped = 56 and Nveh = 14, is shown.
5.3. Vehicular scenario
The considered vehicular scenario is representative for the cen-ter of a large European city with many road intersections. In this kind of scenario, roads are typically narrow, with a single lane and a single driving direction. Moreover, the nodes’ speeds are highly heterogeneous: in fact, although vehicles can move fast, they are

52 A. Gorrieri, G. Ferrari / Vehicular Communications 2 (2015) 47–57
Fig. 6. Illustrative example of VANET scenario: portion of the city center of Paris (namely, the district between “Parc de la Plachette” and the “Montmartre cemetery”) imported into the SUMO mobility simulator.
constrained to abide by the traffic rules (priorities, traffic lights, etc.) forming queues and thus slowing down the overall vehicular traffic mobility. Since this highly dynamic mobility can strongly af-fect the performance of the used routing protocols, realistic VANET mobility models must be taken into account. In the last years, many approaches have been proposed in order to derive realistic mobility models for VANETs [22,24]. In order to simulate real-istic vehicular mobility, we exploit the Open Street Maps (OSM) tool [25]. OSM provides open and editable maps of the real world which can be exported into the SUMO format in order to obtain real-world vehicular mobility. Then, by integrating SUMO into ns-3, realistic VANET simulations can be run. As a representative vehicu-lar scenario, we decided to simulate a portion of the city center of Paris (namely the district between “Parc de la Plachette” and the “Montmartre cemetery”), which is shown in Fig. 6.
5.4. Performance metrics
The simulation-based performance analysis is carried out inves-tigating the following metrics: the throughput S (adimensional), the end-to-end delay D (dimension: [s]), the total number of broadcasted packets Nbroad (dimension: [pkt]), and the average communication distance dcom (dimension: [m]). We now shortly describe the considered metrics. The throughput is defined as the ratio between the number of packets that reach the intended desti-nations and all transmitted packets. The end-to-end delay is defined as the time during which a single packet stays in the network, from the generation instant (at its source) to the instant at which it reaches its destination. The end-to-end delay is obtained as the average of all per-packet delays. The total number of broadcasted packets is given by the sum of the number Nhello of hello messages and the number NRRREQ of RREQ packets transmitted during the entire simulation. The average communication distance is defined as the distance covered by a single packet, from the source to its final destination, averaged over all successfully delivered packets.
6. Performance analysis
In this section, we explore the simulation-based performance results obtained in the considered networking scenarios: pedes-trian, pedestrian–vehicular, and vehicular.
6.1. Simulation results in pedestrian scenarios
In Fig. 7, the performances of AODV, iAODV, and AODV+G protocols, in terms of (a) throughput and (b) delay, as func-tions of the packet generation rate λ, are directly compared. The main network parameters are set as follows: Ps = 40 byte/pkt, ρ = 1700 nodes/km2, N = 180 nodes, Ntx = 40 nodes, and sp =1.5 m/s. First of all, it can be observed that the iAODV protocol outperforms AODV and AODV+G protocols for all the considered values of packet generation rate. All the considered protocols reach the so-called saturation condition (in terms of throughput and de-lay) for large values of λ (namely, λ ≥ 40 pkt/s) [26]. More pre-cisely, the network reaches a saturation regime when each source has always at least one packet in its transmission queue, so that in-creasing further λ does not change the network conditions and Sand D remain approximately constant. The accumulation of pack-ets in the transmission queues occurs for large values of λ also because, when the network load is high, the backoff mechanism of the lower layers (IEEE 802.11b) slows down the transmissions, in order to avoid collisions, as much as possible.
Focusing on Fig. 7(a), it can be observed that using the iAODV protocol, the network reaches the saturation conditions more slowly with respect to the AODV protocol. This is because, for a given value of λ, the iAODV protocol uses a smaller number of RREQ messages, with respect to the AODV protocol, leading to lower channel contention and faster transmissions, which, in turn, reduce the packets’ queuing. These observations are confirmed by the delay results, which show that the delay of the iAODV protocol is significantly lower than that of the AODV protocol: this means that a single packet reaches its destination with a smaller num-ber of backoffs, because of limited channel contentions, along the traversed hops.
Note that, in Fig. 7, the performance of the AODV+G protocol is slightly better than, but trend-wise very similar to, that of the AODV protocol. It is worth noting that the AODV+G protocol, al-though designed to reduce the BSP, is outperformed by the iAODV protocol for all the considered values of λ. This is mainly due to the AODV+G protocol’s inability to effectively select the rebroad-caster nodes. By selecting the rebroadcasters in a random manner, the AODV+G protocol leads to the creation of multi-hop routes with a larger number of hops with respect to the iAODV protocol.

A. Gorrieri, G. Ferrari / Vehicular Communications 2 (2015) 47–57 53
Fig. 7. AODV, iAODV, and AODV+G protocols are directly compared, in terms of (a) throughput and (b) delay as functions of λ, in a pedestrian scenario. In all cases: Ps = 40 byte/pkt, ρ = 1700 node/km2, N = 180 nodes, Ntx = 40 nodes, and sp =1.5 m/s.
This, in turn, increases the collision probability and the number of experienced backoffs.
In order to explore the amount of traffic overhead generated by the considered routing protocols in the pedestrian scenario, in Fig. 8 Nbroad is shown, as a function of λ, in the same conditions of Fig. 7. It can be observed that the use of iAODV significantly limits the number of broadcasted messages, especially in the saturation regime (high traffic load). This leads to a better occupation of the radio channel, thus justifying the global performance improvement observed in Fig. 7. Note that the modifications made in the route discovery process (from AODV to iAODV) do not affect the broad-cast of hello messages. However, in this kind of scenario the total number Nhello of hello messages is negligible with respect the total number NRREQ of generated RREQ packets.
Focusing on the performance of the AODV+G protocol in Fig. 8, it can be observed that the number of RREQ packets reduces as well, with respect to the AODV protocol, limiting the BSP. However, the iAODV protocol uses a significantly smaller number of RREQ packets than the AODV+G protocol, while still guaranteeing better performance. As already observed, this is due to the fact that the iAODV protocol selects more efficiently the rebroadcaster nodes. For example, for λ = 16 pkt/s, the AODV+G protocol saves roughly 39% of redundant RREQ packets with S � 0.17 (low throughput),
Fig. 8. Total number of broadcasted packets, as functions of λ, in the pedestrian scenario. The AODV, iAODV and AODV+G protocols are compared. In all cases: Ps = 40 byte/pkt, ρ = 1700 nodes/km2, N = 180 nodes, Ntx = 40 nodes, and sp = 1.5 m/s.
Fig. 9. Three-dimensional characterization of delay and throughput, as functions of ρ , in the pedestrian scenario: AODV, iAODV and AODV+G are compared. In all cases: Ps = 40 byte/pkt, λ = 3.33 pkt/s, Ntx = 40 nodes, and sp = 1.5 m/s.
while the iAODV protocol can save 90% of rebroadcasts while still guaranteeing S � 0.7.
As already said, the IF strategy takes into account the node spatial density. In this way, the overall retransmission probabil-ity adapts itself to the network conditions. In order to get more insights about this feature of IF embedded into iAODV, we investi-gate the impact of the node spatial density on the performance of the considered protocols. The node spatial density is changed by varying the number of nodes and keeping the simulation area (i.e., the side L) fixed. In Fig. 9, a comparative analysis of iAODV, AODV, and AODV+G protocols is carried out in a three-dimensional space, jointly considering node spatial density, throughput, and delay. For each value of ρ , the corresponding values of S and D are com-puted and the point (ρ , S , D) is drawn for all the considered protocols. The packet generation rate λ is fixed to 3.33 pkt/s and the remaining simulation parameters are set as in Fig. 7. The pro-jections of all curves on all possible planes (namely: (S , ρ), (D , ρ), (D ,S)) are also shown.
• The projections on the plane (D , ρ) show that the node spatial density has a negative impact on the delay performance of the

54 A. Gorrieri, G. Ferrari / Vehicular Communications 2 (2015) 47–57
Fig. 10. Average communication distance, as a function of ρ , in the pedestrian sce-nario: AODV, iAODV and AODV+G are compared. In all cases: Ps = 40 byte/pkt, λ = 3.33 pkt/s, Ntx = 40 nodes, and sp = 1.5 m/s.
AODV protocol. Increasing ρ leads to an increase of the chan-nel contention level, as there are more and more nodes within the transmission range of each other, thus increasing the col-lision probability. However, it can be observed that the delay of the iAODV protocol is constant with respect to the node spatial density and this proves that IF can adapt effectively its behavior to the network conditions. The performance of the AODV+G protocol lies between those of AODV and iAODV pro-tocols, with a trend similar to that of the AODV protocol.
• Considering the projections on the plane (S , ρ), it can be con-cluded that the same insights drawn for D are valid also for S . In particular, this performance metric becomes approximately independent of the node spatial density with the use of the iAODV protocol.
• Considering the projections on the plane (D ,S), the overall in-dependence of the performance of the iAODV protocol from the node spatial density becomes evident. Conversely, the AODV+G protocol, which limits the BSP in a static manner, cannot adapt itself to the network conditions and its perfor-mance degrades for high values of ρ .
In Fig. 10, the average communication distance dcom is shown as a function of ρ , in the same conditions of Fig. 9. The more ef-ficient channel utilization brought by IF allows to support longer communication distances. This means that a single packet can be transmitted across multiple hops without being affected by colli-sions. At the opposite, the route discovery process of the AODV protocol floods the network with RREQ messages, increasing the probability of collisions and reducing the number of successful hops, thus making only destinations close to the source reachable. This aspect becomes more evident for higher node spatial densities (and, correspondingly, channel contention levels). On the contrary, with the iAODV protocol dcom seems to be independent of the node spatial density, as already observed in Fig. 9 for S and D . This confirms once more the adaptivity of IF and the corresponding benefits brought by its use in the route discovery phase of iAODV. As already observed before, the performance of the AODV+G pro-tocol is trend-wise similar to that of the AODV protocol, with a performance improvement significantly smaller than that guaran-teed by the iAODV protocol.
Fig. 11. (a) Throughput and (b) delay, as functions of λ, in the pedestrian–vehicular scenario: the AODV, AODV+G and iAODV protocols are compared. In all cases: N =160 nodes, ρ = 900 nodes/km2, Ntx = 30 nodes, Ps = 128 byte/pkt, sp = 1.5 m/s, and c = 0.3.
As mentioned in Subsection 5.1, the pedestrian scenario is rel-evant to an application where pedestrians may send very short data and, in this case, the value of the packet generation rate could be relatively small. In this type of scenario, the obtained re-sults show that the iAODV protocol outperforms the AODV and AODV+G protocols in all considered network conditions, even for medium–low values of λ. For example, with reference to Fig. 7(a) it can be observed that, for λ = 10 pkt/s, using iAODV leads to a throughput increase, with respect to AODV/AODV+G, of about 73%/26%.
6.2. Simulation results in pedestrian–vehicular scenarios
As anticipated in Subsection 5.2, the pedestrian–vehicular sce-nario is characterized by the presence of both pedestrians and vehicles. With respect to the pedestrian scenario, we consider smaller values of the number of devices and of the node spatial density—this is expedient to evaluate the efficiency of the iAODV protocol even in sparse networks scenarios. Since, in this scenario, the amount of information to be sent is not necessarily limited, accurate modeling calls for higher values of Ps and λ.
In Fig. 11, (a) the throughput S and (b) the delay D are shown as functions of λ, comparing directly iAODV, AODV, and AODV+G protocols. The main system parameters are set as fol-lows: N = 160 nodes, ρ = 900 nodes/km2, Ntx = 30 nodes, Ps =128 byte/pkt, sp = 1.5 m/s, and c = 0.3. Note that the packet gen-eration rate may reach values which are twice the maximum value

A. Gorrieri, G. Ferrari / Vehicular Communications 2 (2015) 47–57 55
Fig. 12. Three-dimensional (delay, throughput, and Ps) characterization, in the pedestrian–vehicular scenario: the AODV, AODV+G, and iAODV protocols are com-pared. In all cases: N = 160 nodes, ρ = 900 nodes/km2, Ntx = 30 nodes, λ =4 pkt/s, sp = 1.5 m/s, and c = 0.3.
considered in the pedestrian case. Focusing on Fig. 11(a), it can be observed that, for low values of λ, all protocols have roughly the same performance. This is because, with respect to the pedes-trian scenario, the values of N and Ntx are smaller, and the node spatial density is almost halved. In these conditions, even con-sidering a higher value of Ps, the channel contention is strongly reduced, so that even the flooding strategy, used by AODV in the route discovery process, can perform well. However, for medium–high values of the packet generation rate, the inefficient use of the channel brought by flooding leads the AODV protocol to a fast per-formance degradation. Focusing on the AODV+G protocol, it can be observed that, even though it outperforms the AODV protocol, it incurs a significant performance degradation for medium–high values of the network load. Conversely, with the iAODV protocol the network does not reach the saturation conditions even for the highest considered values of λ. The delay performance, shown in Fig. 11(b), confirms these conclusions: for low values of λ, all pro-tocols have good performance; for higher values of λ, the delays of the AODV and AODV+G protocols increase, while the delay of the iAODV protocol remains very low.
In addition to the packet generation rate, another parameter that strongly affects the total amount of information sent is the packet size Ps. In Fig. 12, a three dimensional performance analy-sis is carried out jointly considering D , S , and Ps. The main system parameters are set as in Fig. 11: in particular, the value of λ is set to 4 pkt/s. It can be observed that the iAODV protocol outperforms the AODV protocol for all considered values of Ps. As usual, by fo-cusing on the projections of the curves on the three “side planes,” the following insights can be derived.
• From the projection on the plane (D , Ps), it can be observed that increasing the value of the packet size the delay entailed by the AODV protocol explodes. This is due to the fact that with longer packets, a transmission act takes longer, i.e., the channel is “captured” for a longer time. This results in a higher collision probability and leads to network saturation even for low values of λ. However, using the iAODV protocol, the de-lay does not explode: this is because limiting the number of transmitted RREQ packets saves bandwidth and the channel can thus be used for longer transmissions without the need of a frequent use of the backoff mechanisms.
• From the projection on the plane (S , Ps), it can be observed that an increase of Ps leads, again, to a performance degrada-tion of the AODV protocol. For large values of Ps, the iAODV protocol prevents the network from entering into the satura-
Fig. 13. Three-dimensional characterization of delay and throughput, as functions of λ, in the vehicular scenario: the AODV, AODV+G, and iAODV protocols are compared. In all cases: N = 100 nodes, Ps = 128 byte/pkt, Ntx = 40 nodes, and c = 0.3.
tion regime, thus guaranteeing a better utilization of the radio channel. This makes the throughput of the iAODV protocol to remain almost constant for all the considered values of Ps .
• From the projection on the plane (S , D), it can be observed that the performance of the iAODV protocol is basically in-dependent from Ps. As already observed before, even though the AODV+G protocol outperforms the AODV protocol, its per-formance does not remain acceptable for increasing values of Ps.
6.3. Simulation results in vehicular scenarios
As anticipated in Subsection 5.3, we consider a vehicular sce-nario representative of a big city center. In particular, we simu-late vehicular traffic in a real portion of the city center of Paris. As mentioned, in such scenario nodes’ mobility can strongly affect the performance of a routing protocol. Therefore, accurate model-ing is crucial for the evaluation of different vehicular traffic condi-tions.
In Fig. 13, the performances of the considered routing proto-cols, in terms of S and D as functions of λ, are shown through a three-dimensional representation. The main system parameters are set as follows: N = 100 nodes, Ps = 128 byte/pkt, Ntx = 40 nodes, and c = 0.3. It can be observed that the results are quite similar to those obtained in the pedestrian–vehicular scenario (Fig. 11). In particular, while the performances of all protocols are very sim-ilar for small values of λ, the iAODV protocol outperforms the AODV and AODV+G protocols for medium–high values of the net-work load. The reason of this behavior is manly due to the fact that, in the simulated settings, the vehicular scenario includes both vehicles which are free to move and queued vehicles. Therefore, this scenario can be interpreted as a pedestrian–vehicular scenario in which pedestrians correspond to the queued vehicles (almost static).
In order to obtain an exhaustive analysis considering differ-ent vehicular traffic conditions, the impact of the number N of vehicles is analyzed. For small values of N , the light traffic con-ditions allow vehicles to move fast. Conversely, for large values of N the road traffic is congested and the creation of long queues of vehicles slows down the overall vehicular mobility. In Fig. 14, the performances of the considered routing protocols, in terms of (a) throughput and (b) delay, as functions of N , are shown. The main network parameters are set as follows: λ = 12 pkt/s, Ps = 128 byte/pkt, and c = 0.3. Regarding Ntx, we keep the ra-tio Ntx/N constant and equal to 2/3. It can be observed that, for

56 A. Gorrieri, G. Ferrari / Vehicular Communications 2 (2015) 47–57
Fig. 14. (a) Throughput and (b) delay, as functions of N , in the vehicular scenario. The AODV, AODV+G, iAODV protocols are directly compared. In all cases: λ = 12 pkt/s, Ps = 128 byte/pkt, Ntx = 2N/3, and c = 0.3.
light road traffic conditions, all routing protocols have a similar performance in terms of both S and D . When the vehicular traffic is light, there are no queued vehicles, and the node spatial den-sity reduces: the AODV protocol can thus perform well since the channel contention level is quite low. However, for increasing val-ues of N , vehicular traffic congestion corresponds to a significant increase of the node spatial density and the available bandwidth thus reduces: the wasteful use, caused by flooding, of the radio channel degrades the performance of the AODV protocol. As al-ready observed in the previously analyzed scenarios, the AODV+G protocol cannot guarantee a high performance for increasing val-ues of the node spatial density. Conversely, the iAODV protocol, by effectively adapting itself to the network conditions, guarantees a good performance, in terms of S and D , even in heavy road traffic conditions.
7. Conclusions
In this paper, we have proposed a novel reactive routing pro-tocol, denoted as iAODV, derived from the AODV protocol by re-placing the flooding mechanism used in its route discovery phase with the probabilistic forwarding mechanism denoted as IF. Three scenarios have been considered: the first one is representative of a pedestrian ad hoc network; the second is representative of
a pedestrian–vehicular scenario which involves both vehicles and pedestrian nodes; the third is a vehicular scenario corresponding to a real portion of the city center of Paris. In all cases, and for almost all the considered values of the network parameters, the iAODV protocol outperforms the AODV protocol and the AODV+G protocol. This is mainly due to the fact that the number of con-trol messages is effectively reduced by the use of IF, thus reducing the contention level and making the channel utilization more effi-cient.
We remark that the proposed IF-based route discovery process can be applied to any reactive routing protocol which shares the same route discovery phase of the AODV protocol, e.g., the DSR protocol. This represents an interesting research extension of the current work.
References
[1] C. Perkins, E. Royer, Ad-hoc on-demand distance vector routing, in: Second IEEE Workshop on Mobile Computing Systems and Applications WMCSA, New Or-leans, LA, USA, February 1999, pp. 90–100.
[2] S. Panichpapiboon, G. Ferrari, Irresponsible forwarding, in: 8th International Conference on Intelligent Transport System Telecommunication (ITST), Phuket, Thailand, 2008, pp. 311–316.
[3] J.-P. Vasseur, A. Dunkels, Interconnecting Smart Objects with IP - The Next In-ternet, Morgan Kaufmann, 2010, http://TheNextInternet.org/.
[4] O. Abedi, M. Fathy, J. Taghiloo, Enhancing AODV routing protocol using mobil-ity parameters in VANET, in: IEEE/ACS International Conference on Computer Systems and Applications (AICCSA), Doha, Qatar, 2008, pp. 229–235.
[5] L. Pelusi, A. Passarella, M. Conti, Opportunistic networking: data forwarding in disconnected mobile ad hoc networks, IEEE Commun. Mag. 44 (11) (2006) 134–141.
[6] S. Das, C. Perkins, E. Royer, Performance comparison of two on-demand routing protocols for ad hoc networks, in: Proceedings of the 19th IEEE INFOCOM, Tel Aviv, Israel, vol. 1, 2000, pp. 3–12.
[7] A. Tuteja, R. Gujral, S. Thalia, Comparative performance analysis of DSDV, AODV and DSR routing protocols in MANET using ns-2, in: Proceedings of Inter-national Conference on Advances in Computer Engineering (ACE), Bangalore, Karnataka, India, 2010, pp. 330–333.
[8] Y.H.D. Johnson, D. Maltz, The dynamic source routing protocol (DSR) for mobile ad hoc networks, http://tools.ietf.org/html/rfc4728.
[9] Y.-C. Tseng, S.-Y. Ni, Y.-S. Chen, J.-P. Sheu, The broadcast storm problem in a mobile ad hoc network, Wirel. Netw. 8 (2002) 153–167.
[10] Y. Sasson, D. Cavin, A. Schiper, Probabilistic broadcast for flooding in wireless mobile ad hoc networks, in: Proceedings of Wireless Communications and Net-working, in: WCNC, vol. 2, 2003, pp. 1124–1130.
[11] Z.J. Haas, J.Y. Halpern, L. Li, Gossip-based ad hoc routing, IEEE/ACM Trans. Netw. 14 (2006) 479–491.
[12] A. Aharony, D. Stauffer, Introduction to Percolation Theory, Taylor and Francis, London, 1994.
[13] C.-C. Shen, Z. Huang, C. Jaikaeo, Directional broadcast for mobile ad hoc net-works with percolation theory, IEEE Trans. Mob. Comput. 5 (2006) 317–332.
[14] J.E. Wieselthier, G.D. Nguyen, A. Ephremides, Energy-efficient broadcast and multicast trees in wireless networks, Mob. Netw. Appl. 7 (2002) 481–492.
[15] B.S. Mergen, S. Member, A. Scaglione, G. Mergen, Asymptotic analysis of mul-tistage cooperative broadcast in wireless networks, IEEE Trans. Inf. Theory 52 (2006) 2531–2550.
[16] S. Busanelli, G. Ferrari, S. Panichpapiboon, Efficient broadcasting in IEEE 802.11 networks through Irresponsible Forwarding, in: IEEE Global Telecommunica-tions Conference, Honolulu, Hawaii, USA, 2009, pp. 1–6.
[17] A.U. Shankar, C. Alaettinoglu, K. Dussa-Zieger, I. Matta, Transient and steady-state performance of routing protocols: distance-vector versus link-state, Inter-network. Res. Exp. 6 (1996).
[18] C.E. Perkins, P. Bhagwat, Highly dynamic destination-sequenced distance-vector routing (DSDV) for mobile computers, Comput. Commun. Rev. 24 (1994) 234–244.
[19] A. Papoulis, Probability, Random Variables and Stochastic Processes, 3rd edi-tion, McGraw-Hill Companies, 1991.
[20] A. Wang, W. Jiang, Research of teaching on network course based on ns-3, in: First International Workshop on Education Technology and Computer Science, 2009.
[21] WangInstitute of Electrical and Electronics Engineers, IEEE Std 802.11TM-2007. Part 11: Wireless LAN Medium Access Control (MAC) and Physical Layer (PHY) specifications, 2007.
[22] F. Karnadi, Z.H. Mo, K. chan Lan, Rapid generation of realistic mobility mod-els for VANET, in: IEEE Wireless Communications and Networking Conference (WCNC), Hong Kong, China, 2007, pp. 2506–2511.
http://refhub.elsevier.com/S2214-2096(15)00003-0/bib616861726F6E7931393934696E74726F64756374696F6Es1

A. Gorrieri, G. Ferrari / Vehicular Communications 2 (2015) 47–57 57
[23] Chitraxi Raj, Urvik Upadhayaya, Twinkle Makwana, Payal Mahida, Simulation of VANET using ns-3 and SUMO, Int. J. Adv. Res. Comput. Sci. Softw. Eng. 4 (2014) 563–569.
[24] C. Sommer, F. Dressler, Progressing toward realistic mobility models in VANET simulations, IEEE Commun. Mag. 46 (11) (2008) 132–137.
[25] M. Haklay, P. Weber, Openstreetmap: user-generated street maps, IEEE Perva-sive Comput. 7 (4) (2008) 12–18.
[26] J. Robinson, T. Randhawa, Saturation throughput analysis of IEEE 802.11e en-hanced distributed coordination function, IEEE J. Sel. Areas Commun. 22 (2004) 917–928.
Related Documents


![Modelling and Verifying the AODV Routing Protocol · 2 The AODV Routing Protocol The Ad hoc On-Demand Distance Vector(AODV)rout-ing protocol [39] is a widely-used routing protocol](https://static.cupdf.com/doc/110x72/5f526103bcd353229e7c4527/modelling-and-verifying-the-aodv-routing-protocol-2-the-aodv-routing-protocol-the.jpg)