Indian Minerals Yearbook 2016 (Part- III : Mineral Reviews) 55 th Edition IRON ORE (ADVANCE RELEASE) GOVERNMENT OF INDIA MINISTRY OF MINES INDIAN BUREAU OF MINES Indira Bhavan, Civil Lines, NAGPUR – 440 001 PHONE/FAX NO. (0712) 2565471 PBX : (0712) 2562649, 2560544, 2560648 E-MAIL : [email protected] Website: www.ibm.gov.in February, 2018

Welcome message from author
This document is posted to help you gain knowledge. Please leave a comment to let me know what you think about it! Share it to your friends and learn new things together.
Transcript
Indian Minerals Yearbook 2016 (Part- III : Mineral Reviews)
55th
Edition
IRON ORE
(ADVANCE RELEASE)
GOVERNMENT OF INDIA
MINISTRY OF MINES INDIAN BUREAU OF MINES
Indira Bhavan, Civil Lines, NAGPUR – 440 001
PHONE/FAX NO. (0712) 2565471
PBX : (0712) 2562649, 2560544, 2560648
E-MAIL : [email protected] Website: www.ibm.gov.in
February, 2018
28-2
IRON ORE
28 Iron Ore
Iron & steel is the driving force behind industrial
development in any country. The vitality of the Iron &
Steel Industry largely influences a country's economic
status. The mining of iron ore, an essential raw material for
Iron & Steel Industry, is arguably of prime importance
among all mining activities undertaken by any country.
With the total resources of over 33.276 billion tonnes of
haematite (Fe2O
3) and magnetite (Fe
3O
4), India is amongst
the leading producers of iron ore in the world.
RESERVES/RESOURCES
Haematite and magnetite are the most
important iron ores in India. About 79% haematite ore
deposits are found in the Eastern Sector (Assam, Bihar,
Chhattisgarh, Jharkhand, Odisha & Uttar Pradesh) while
about 93% magnetite ore deposits occur in Southern
Sector (Andhra Pradesh, Goa, Karnataka, Kerala, & Tamil
Nadu). Karnataka alone contributes 72% of magnetite
deposit in India. Of these, haematite is considered to be
superior because of its higher grade. Indian deposits of
haematite belong to the Precambrian Iron Ore Series and
the ore is within banded iron ore formations occurring as
massive, laminated, friable and also in powdery form.
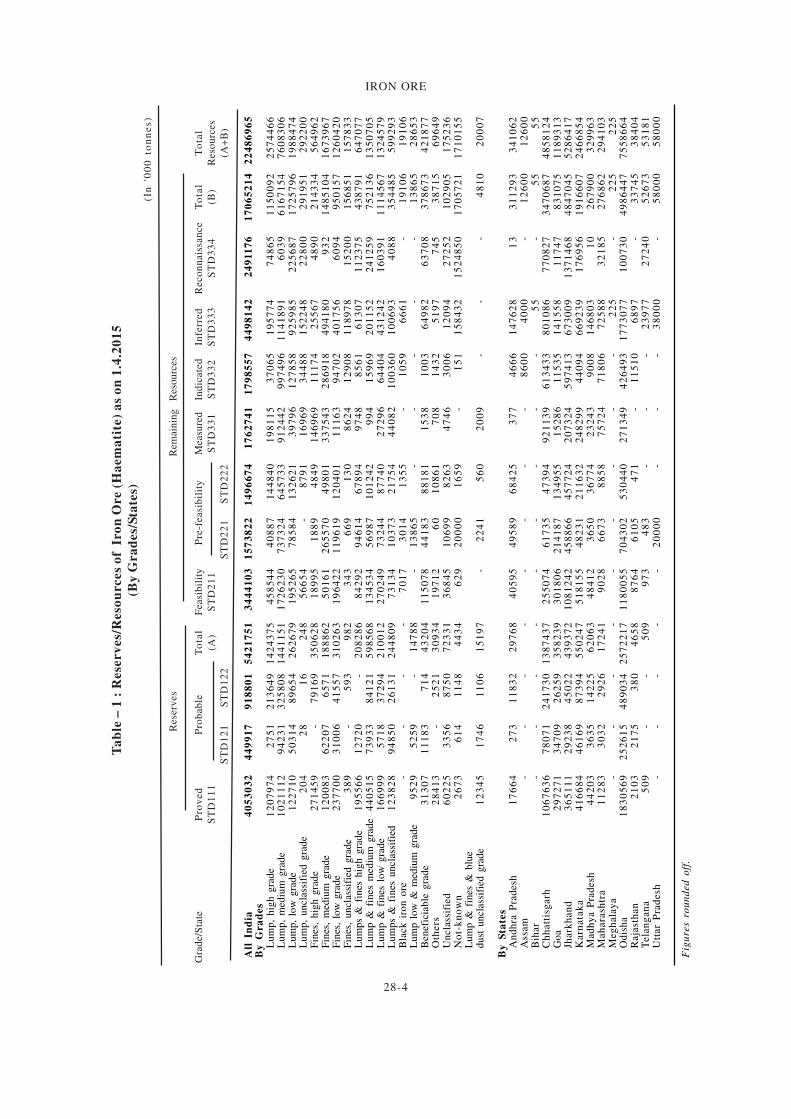
As per NMI database based on UNFC system, the
total reserves/resources of haematite as on 1.4.2015 has
been estimated at 22,487 million tonnes of which 5,422
million tonnes (24%) are under 'Reserves' category and
the balance 17,065 million tonnes (76%) are under
'Remaining Resources' category. By grades, Lumps
constitute about 56% followed by Lumps with Fines
(17%), Fines (16%), and the remaining 11% are Black Iron
ore, Lump low & medium grade, Beneficiable grade, Others,
Unclassified, Not-known and Lump & fines & blue dust
unclassified grade. Major reserves/resources of haematite
are located in Odisha (7,559 million tonnes or 34%),
Jharkhand (5,286 million tonnes or 23%), Chhattisgarh
(4,858 million tonnes or 22%), Karnataka (2,467 million
tonnes or 11%) and Goa (1,189 million tonnes or 5%).
The balance 5% resources of haematite are spread in
Andhra Pradesh, Assam, Bihar, Madhya Pradesh,
Maharashtra, Meghalaya, Rajasthan, Telangana and Uttar
Pradesh (Table-1).
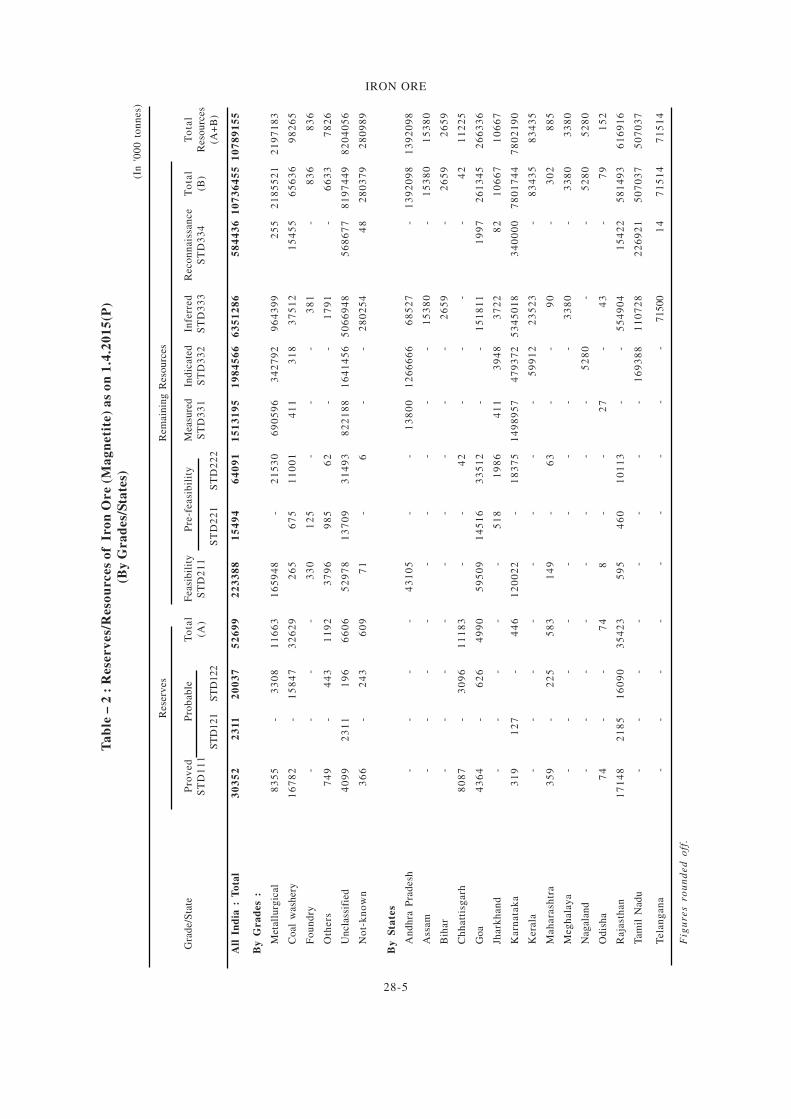
Magnetite is another principal iron ore that also
occurs in the form of oxide, either in igneous or
metamorphosed banded magnetite-silica formation,
possibly of sedimentary origin. As per NMI database
based on UNFC system, the total reserves/resources of
magnetite as on 1.4.2015 has been estimated at 10,789
million tonnes of which 'Reserves' constitute a mere 53
million tonnes while 10,736 million tonnes are placed under
'Remaining Resources'. Classification on the basis of
grades shows 20% resources are of Metallurgical grade
while 80% resources belong to grades that are categorised
as Unclassified, Not-known and Coal Washery. The
resources of Others and Foundry grades constitute
meagre proportions. India's 98% magnetite reserves/
resources are located in five States, namely, Karnataka
(7,802 million tonnes or 72% reserves) followed by Andhra
Pradesh (1,392 million tonnes or 13%), Rajasthan (617
million tonnes or 6%), Tamil Nadu (507 million tonnes or
5%) and Goa (226 million tonnes or 2%).Assam, Bihar,
Chhattisgarh, Jharkhand, Kerala, Maharashtra,
Meghalaya, Nagaland, Odisha and Telangana together
account for the remaining 2% resources (Table-2).
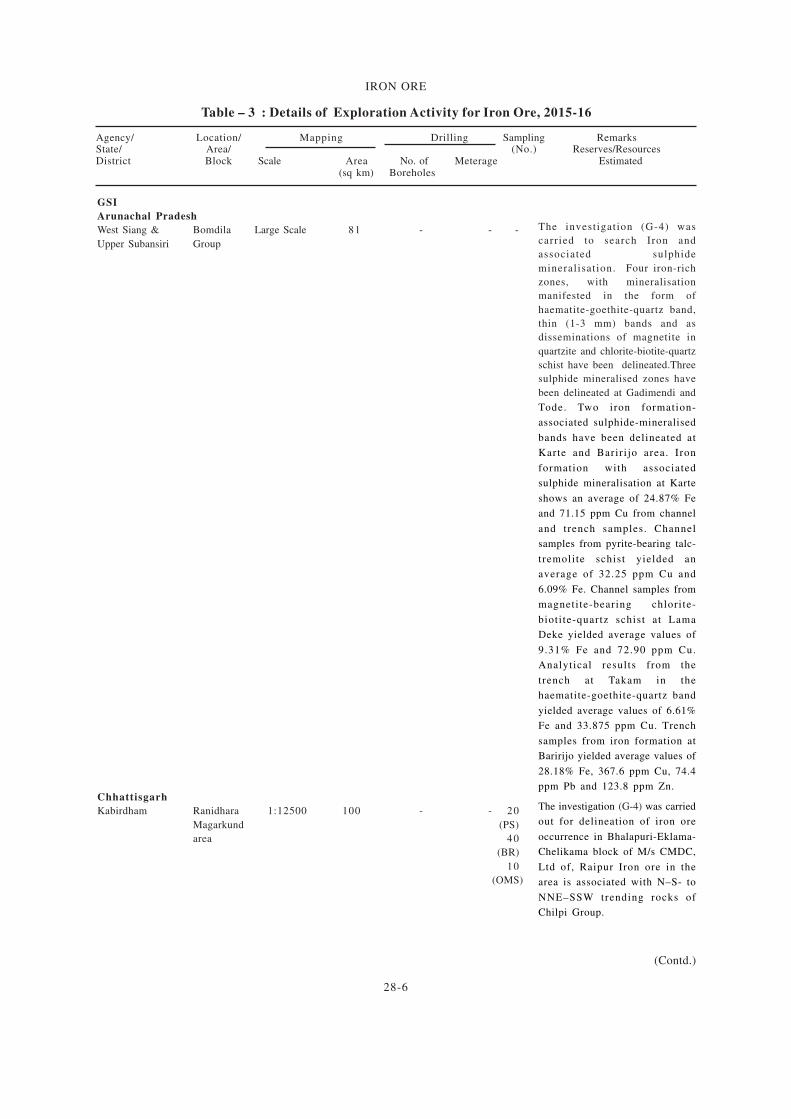
EXPLORATION&DEVELOPMENTIn 2015-16, GSI, MECL, NMDC and State DGM,
Rajasthan and Maharashtra conducted explorations for
iron ore. Details of exploration activities carried out by
various agencies in 2015-16 are furnished in Table-3.
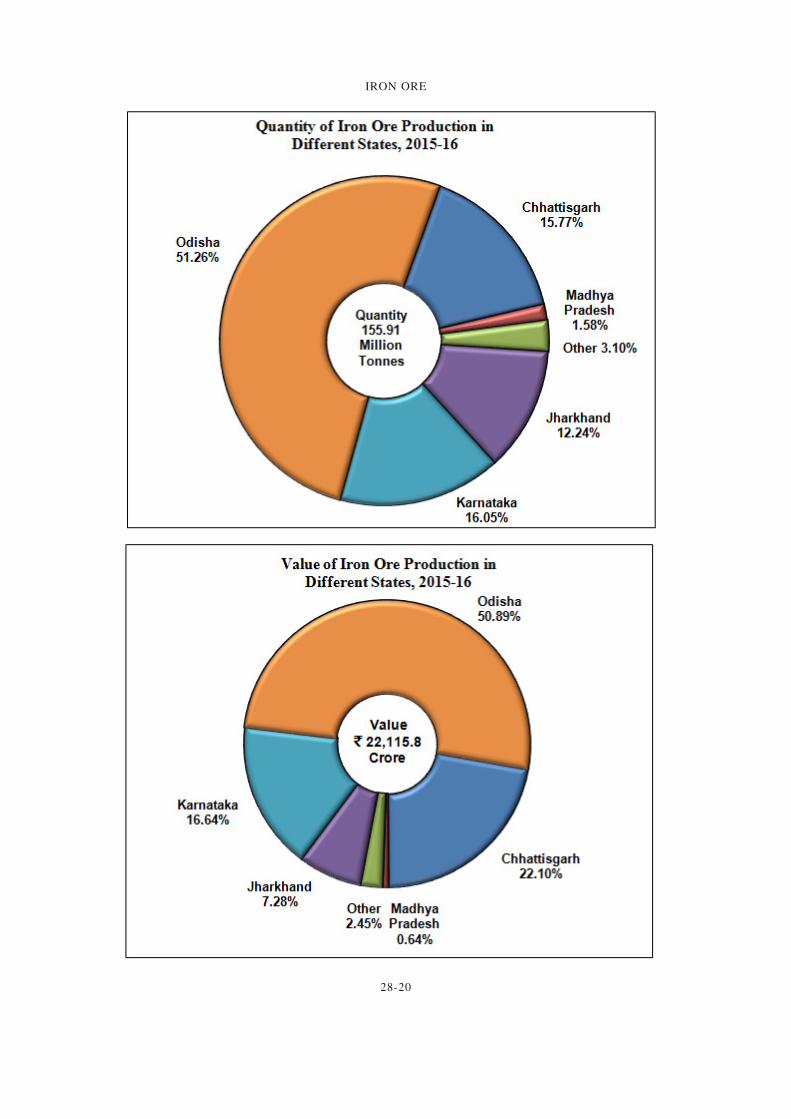
PRODUCTION & STOCKS
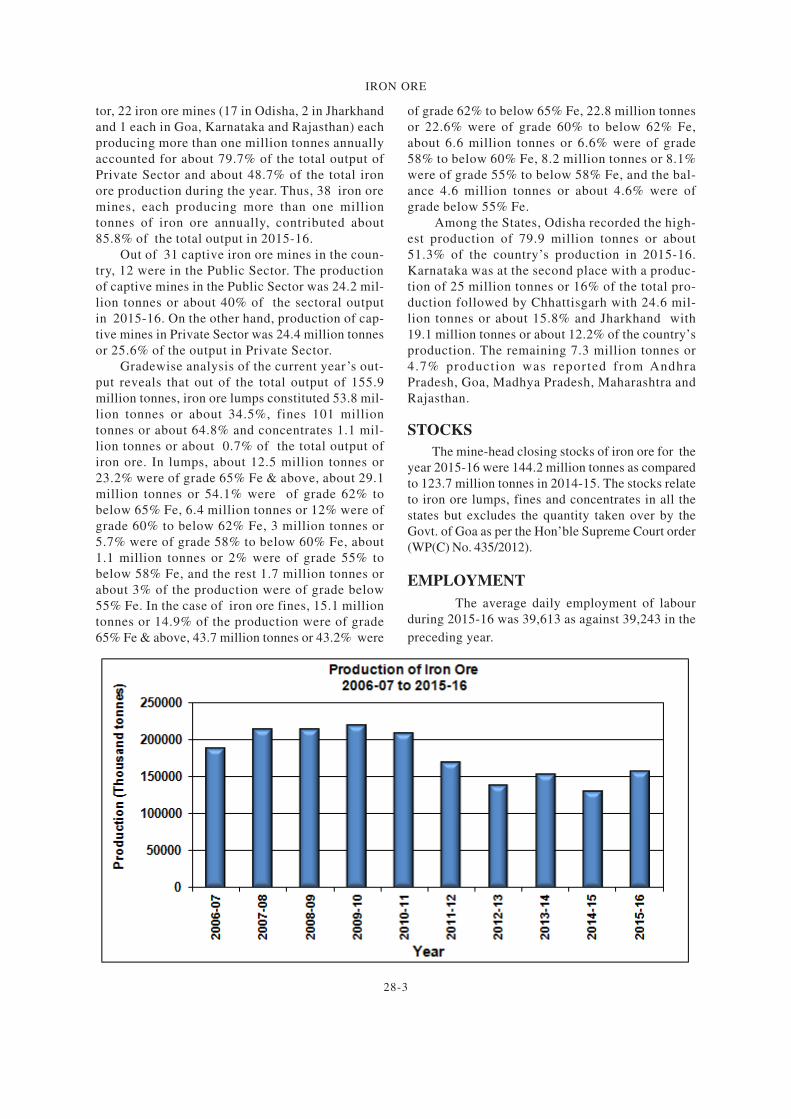
The production of iron ore constituting lumps, fines
and concentrates was at 155.9 million tonnes in the year
2015-16, showing an increase of about 21% as compared
to that in the preceding year owing to better utilisation of
resources, more demand in Odisha and restarting of pro-
duction in Goa state.
There were 297 reporting mines in 2015-16 as against
320 in the previous year. Among them, 34 mines were in
the Public Sector and 263 in Private Sector. Besides pro-
duction of iron ore was reported as an associated mineral
by 16 mines in 2015-16 as against 20 mines in 2014-15. The
contribution of Public Sector to the total production was
about 38.9% as against about 46% in the preceding
year. The remaining 61.1% of the total production
in 2015-16 was from Private Sector. Among 34 iron
ore mines and one associated mine in Public Sec-
tor, 16 iron ore mines (5 in Chhattisgarh, 4 each in
Karnataka and Odisha and 3 in Jharkhand) each
producing more than one million tonnes annually
accounted for 95.4% of the total output in Public
Sector and around 37.1% of the total production
in the country during 2015-16. Out of 263 iron ore
mines and 15 associated mines in the Private Sec-
28-3
IRON ORE
tor, 22 iron ore mines (17 in Odisha, 2 in Jharkhand
and 1 each in Goa, Karnataka and Rajasthan) each
producing more than one million tonnes annually
accounted for about 79.7% of the total output of
Private Sector and about 48.7% of the total iron
ore production during the year. Thus, 38 iron ore
mines, each producing more than one million
tonnes of iron ore annually, contributed about
85.8% of the total output in 2015-16.
Out of 31 captive iron ore mines in the coun-
try, 12 were in the Public Sector. The production
of captive mines in the Public Sector was 24.2 mil-
lion tonnes or about 40% of the sectoral output
in 2015-16. On the other hand, production of cap-
tive mines in Private Sector was 24.4 million tonnes
or 25.6% of the output in Private Sector.
Gradewise analysis of the current year’s out-
put reveals that out of the total output of 155.9
million tonnes, iron ore lumps constituted 53.8 mil-
lion tonnes or about 34.5%, fines 101 million
tonnes or about 64.8% and concentrates 1.1 mil-
lion tonnes or about 0.7% of the total output of
iron ore. In lumps, about 12.5 million tonnes or
23.2% were of grade 65% Fe & above, about 29.1
million tonnes or 54.1% were of grade 62% to
below 65% Fe, 6.4 million tonnes or 12% were of
grade 60% to below 62% Fe, 3 million tonnes or
5.7% were of grade 58% to below 60% Fe, about
1.1 million tonnes or 2% were of grade 55% to
below 58% Fe, and the rest 1.7 million tonnes or
about 3% of the production were of grade below
55% Fe. In the case of iron ore fines, 15.1 million
tonnes or 14.9% of the production were of grade
65% Fe & above, 43.7 million tonnes or 43.2% were
of grade 62% to below 65% Fe, 22.8 million tonnes
or 22.6% were of grade 60% to below 62% Fe,
about 6.6 million tonnes or 6.6% were of grade
58% to below 60% Fe, 8.2 million tonnes or 8.1%
were of grade 55% to below 58% Fe, and the bal-
ance 4.6 million tonnes or about 4.6% were of
grade below 55% Fe.
Among the States, Odisha recorded the high-
est production of 79.9 million tonnes or about
51.3% of the country’s production in 2015-16.
Karnataka was at the second place with a produc-
tion of 25 million tonnes or 16% of the total pro-
duction followed by Chhattisgarh with 24.6 mil-
lion tonnes or about 15.8% and Jharkhand with
19.1 million tonnes or about 12.2% of the country’s
production. The remaining 7.3 million tonnes or
4.7% production was reported from Andhra
Pradesh, Goa, Madhya Pradesh, Maharashtra and
Rajasthan.
STOCKS
The mine-head closing stocks of iron ore for the
year 2015-16 were 144.2 million tonnes as compared
to 123.7 million tonnes in 2014-15. The stocks relate
to iron ore lumps, fines and concentrates in all the
states but excludes the quantity taken over by the
Govt. of Goa as per the Hon’ble Supreme Court order
(WP(C) No. 435/2012).
EMPLOYMENT
The average daily employment of labour
during 2015-16 was 39,613 as against 39,243 in the
preceding year.
28-4
IRON ORE
Ta
ble
– 1
: R
ese
rv
es/
Reso
urces
of
Iro
n O
re (
Ha
em
ati
te)
as
on
1.4
.20
15
(By
Gra
des/
Sta
tes)
(In
'0
00
to
nn
es)
Res
erv
esR
emai
nin
g
Res
ou
rces
Gra
de/
Sta
teP
rov
ed
Pro
bab
leT
ota
lF
easi
bil
ity
Pre
-feasi
bil
ity
Mea
sure
dIn
dic
ated
Infe
rred
Rec
on
nai
ssan
ceT
ota
lT
ota
l
ST
D1
11
(A)
ST
D2
11
ST
D3
31
ST
D3
32
ST
D3
33
ST
D3
34
(B)
Res
ou
rces
ST
D1
21
ST
D1
22
ST
D2
21
ST
D2
22
(A+
B)
All
In
dia
40
53
03
24
49
91
79
18
80
15
42
17
51
34
44
10
31
57
38
22
14
96
67
41
76
27
41
17
98
55
74
49
81
42
24
911
76
17
06
52
14
22
48
69
65
By
Gra
des
Lu
mp
, h
igh
gra
de
12
07
97
42
75
12
13
64
91
42
43
75
45
85
44
40
88
71
44
84
01
98
11
53
70
65
19
57
74
74
86
51
15
00
92
25
74
46
6L
um
p,
med
ium
gra
de
10
21
11
29
42
31
32
58
08
14
41
15
11
72
62
30
73
73
24
64
57
33
91
24
42
99
74
96
11
41
89
16
03
96
16
71
54
76
08
30
6L
um
p,
low
gra
de
12
27
10
50
31
48
96
54
26
26
79
19
52
65
78
58
41
32
62
13
97
96
12
78
58
92
59
85
22
56
87
17
25
79
61
98
84
74
Lu
mp
, u
ncl
assi
fied
gra
de
20
42
81
62
48
56
65
4-
87
91
16
96
93
44
88
15
22
48
22
80
02
91
95
12
92
20
0F
ines
, h
igh
gra
de
27
14
59
-7
91
69
35
06
28
18
99
51
88
94
84
91
46
96
91
11
74
25
56
74
89
02
14
33
45
64
96
2F
ines
, m
ediu
m g
rad
e1
20
08
36
22
07
65
71
18
88
62
50
16
12
65
57
04
98
01
33
75
43
28
69
18
49
41
80
93
21
48
51
04
16
73
96
7F
ines
, lo
w g
rade
23
77
00
31
00
64
15
57
31
02
63
19
64
22
11
96
19
12
04
01
11
16
39
47
02
40
17
56
60
94
95
01
57
12
60
42
0F
ines
, u
ncl
assi
fied
gra
de
38
9-
59
39
82
34
36
69
13
08
62
41
29
08
11
89
78
15
20
01
56
85
11
57
83
3L
um
ps
& f
ines
hig
h g
rad
e1
95
56
61
27
20
-2
08
28
68
42
92
94
61
46
78
94
97
48
85
61
61
30
71
12
37
54
38
79
16
47
07
7L
um
p &
fin
es m
ediu
m g
rad
e4
40
51
57
39
33
84
12
15
98
56
81
34
53
45
69
87
10
12
42
99
41
59
69
20
11
52
24
12
59
75
21
36
13
50
70
5L
um
p &
fin
es l
ow
gra
de
16
69
99
57
18
37
29
42
10
01
22
70
24
97
32
44
87
74
02
72
96
64
40
44
31
24
21
60
39
11
11
45
67
13
24
57
9L
um
ps
& f
ines
un
clas
sifi
ed1
23
82
89
48
50
26
13
12
44
80
97
31
34
10
37
32
17
54
44
08
21
00
36
01
00
69
34
08
83
54
48
55
99
29
3B
lack
iro
n o
re-
--
-7
01
73
01
41
35
5-
10
59
66
61
-1
91
06
19
10
6L
um
p l
ow
& m
ediu
m g
rade
95
29
52
59
-1
47
88
-1
38
65
--
--
-1
38
65
28
65
3B
enef
icia
ble
gra
de
31
30
71
11
83
71
44
32
04
11
50
78
44
18
38
81
81
15
38
10
03
64
98
26
37
08
37
86
73
42
18
77
Oth
ers
28
41
3-
25
21
30
93
41
97
12
60
10
86
17
08
14
32
51
97
74
53
87
15
69
64
9U
ncl
assi
fied
60
22
53
35
68
75
07
23
31
36
84
51
06
99
82
63
47
46
30
06
12
09
42
72
52
10
29
05
17
52
36
No
t-k
no
wn
26
73
61
41
14
84
43
46
29
20
00
01
65
9-
15
11
58
43
21
52
48
50
17
05
72
11
71
01
55
Lum
p &
fin
es &
blu
edust
uncl
assi
fied
gra
de
12
34
51
74
61
10
61
51
97
-2
24
15
60
20
09
--
-4
81
02
00
07
By
Sta
tes
An
dh
ra P
rad
esh
17
66
42
73
11
83
22
97
68
40
59
54
95
89
68
42
53
77
46
66
14
76
28
13
31
12
93
34
10
62
Ass
am-
--
--
--
-8
60
04
00
0-
12
60
01
26
00
Bih
ar
--
--
--
--
-5
5-
55
55
Ch
hatt
isg
arh
10
67
63
67
80
71
24
17
30
13
87
43
72
55
07
46
17
35
47
39
49
21
13
96
13
43
38
01
08
67
70
82
73
47
06
87
48
58
12
4G
oa
29
72
71
34
70
92
62
59
35
82
39
30
18
06
21
41
87
13
49
55
15
28
61
15
35
14
15
58
11
74
78
31
07
51
18
93
13
Jhark
han
d3
65
11
12
92
38
45
02
24
39
37
21
08
12
42
45
88
66
45
77
24
20
73
24
59
74
13
67
30
09
13
71
46
84
84
70
45
52
86
41
7K
arn
ata
ka
41
66
84
46
16
98
73
94
55
02
47
51
81
55
48
23
12
11
63
22
48
29
94
40
94
66
92
39
17
69
56
19
16
60
72
46
68
54
Mad
hy
a P
rad
esh
44
20
33
63
51
42
25
62
06
34
84
12
36
50
36
77
42
32
43
90
08
14
68
03
10
26
79
00
32
99
63
Mah
ara
shtr
a1
12
83
30
32
29
26
17
24
19
02
86
67
38
85
87
57
24
71
80
67
25
88
32
18
52
76
86
22
94
10
3M
eg
hala
ya
--
--
--
--
-2
25
-2
25
22
5O
dis
ha
18
30
56
92
52
61
54
89
03
42
57
22
17
11
80
05
57
04
30
25
30
44
02
71
34
94
26
49
31
77
30
77
10
07
30
49
86
44
77
55
86
64
Raja
sth
an
21
03
21
75
38
04
65
88
76
46
10
54
71
-1
15
10
68
97
-3
37
45
38
40
4T
ela
ng
an
a5
09
--
50
99
73
48
3-
--
23
97
72
72
40
52
67
35
31
81
Utt
ar
Pra
desh
--
--
-2
00
00
--
-3
80
00
-5
80
00
58
00
0
Fig
ure
s ro
un
ded
off
.
28-5
IRON ORE
Ta
ble
– 2
: R
ese
rv
es/
Reso
urces
of
Iro
n O
re (
Ma
gn
eti
te)
as
on
1.4
.20
15
(P)
(By
Gra
des/
Sta
tes)
(In
'0
00
to
nn
es)
Res
erv
esR
emai
nin
g R
eso
urc
es
Gra
de/
Sta
teP
rov
ed
Pro
bab
leT
ota
lF
easi
bil
ity
Pre
-feasi
bil
ity
Mea
sure
dIn
dic
ated
Infe
rred
Rec
on
nai
ssan
ceT
ota
lT
ota
l
ST
D1
11
(A)
ST
D2
11
ST
D3
31
ST
D3
32
ST
D3
33
ST
D3
34
(B)
Res
ou
rces
S
TD
12
1
ST
D1
22
ST
D2
21
ST
D2
22
(A+
B)
All
In
dia
: T
ota
l3
03
52
23
11
20
03
75
26
99
22
33
88
15
49
46
40
91
15
13
19
51
98
45
66
63
51
28
65
84
43
61
07
36
45
51
07
89
15
5
By
Gra
des
:
Met
allu
rgic
al8
35
5-
33
08
11
66
31
65
94
8-
21
53
06
90
59
63
42
79
29
64
39
92
55
21
85
52
12
19
71
83
Co
al w
ash
ery
16
78
2-
15
84
73
26
29
26
56
75
11
00
14
11
31
83
75
12
15
45
56
56
36
98
26
5
Fo
un
dry
--
--
33
01
25
--
-3
81
-8
36
83
6
Oth
ers
74
9-
44
31
19
23
79
69
85
62
--
17
91
-6
63
37
82
6
Un
clas
sifi
ed4
09
92
31
11
96
66
06
52
97
81
37
09
31
49
38
22
18
81
64
14
56
50
66
94
85
68
67
78
19
74
49
82
04
05
6
No
t-k
no
wn
36
6-
24
36
09
71
-6
--
28
02
54
48
28
03
79
28
09
89
By
Sta
tes
An
dh
ra P
rad
esh
--
--
43
10
5-
-1
38
00
12
66
66
66
85
27
-1
39
20
98
13
92
09
8
Ass
am-
--
--
--
--
15
38
0-
15
38
01
53
80
Bih
ar
--
--
--
--
-2
65
9-
26
59
26
59
Ch
hatt
isg
arh
80
87
-3
09
61
11
83
--
42
--
--
42
11
22
5
Go
a4
36
4-
62
64
99
05
95
09
14
51
63
35
12
--
15
18
11
19
97
26
13
45
26
63
36
Jhark
han
d-
--
--
51
81
98
64
11
39
48
37
22
82
10
66
71
06
67
Karn
ata
ka
31
91
27
-4
46
12
00
22
-1
83
75
14
98
95
74
79
37
25
34
50
18
34
00
00
78
01
74
47
80
21
90
Kera
la-
--
--
--
-5
99
12
23
52
3-
83
43
58
34
35
Mah
ara
shtr
a3
59
-2
25
58
31
49
-6
3-
-9
0-
30
28
85
Meg
hala
ya
--
--
--
--
-3
38
0-
33
80
33
80
Nag
alan
d-
--
--
--
-5
28
0-
-5
28
05
28
0
Od
ish
a7
4-
-7
48
--
27
-4
3-
79
15
2
Raja
sth
an
17
14
82
18
51
60
90
35
42
35
95
46
01
01
13
--
55
49
04
15
42
25
81
49
36
16
91
6
Tam
il N
adu
--
--
--
--
16
93
88
11
07
28
22
69
21
50
70
37
50
70
37
Tela
ng
an
a
-
--
- -
-
-
-
-
71500
14
71
51
47
15
14
F
igu
re
s r
ou
nd
ed
off
.
28-6
IRON ORE
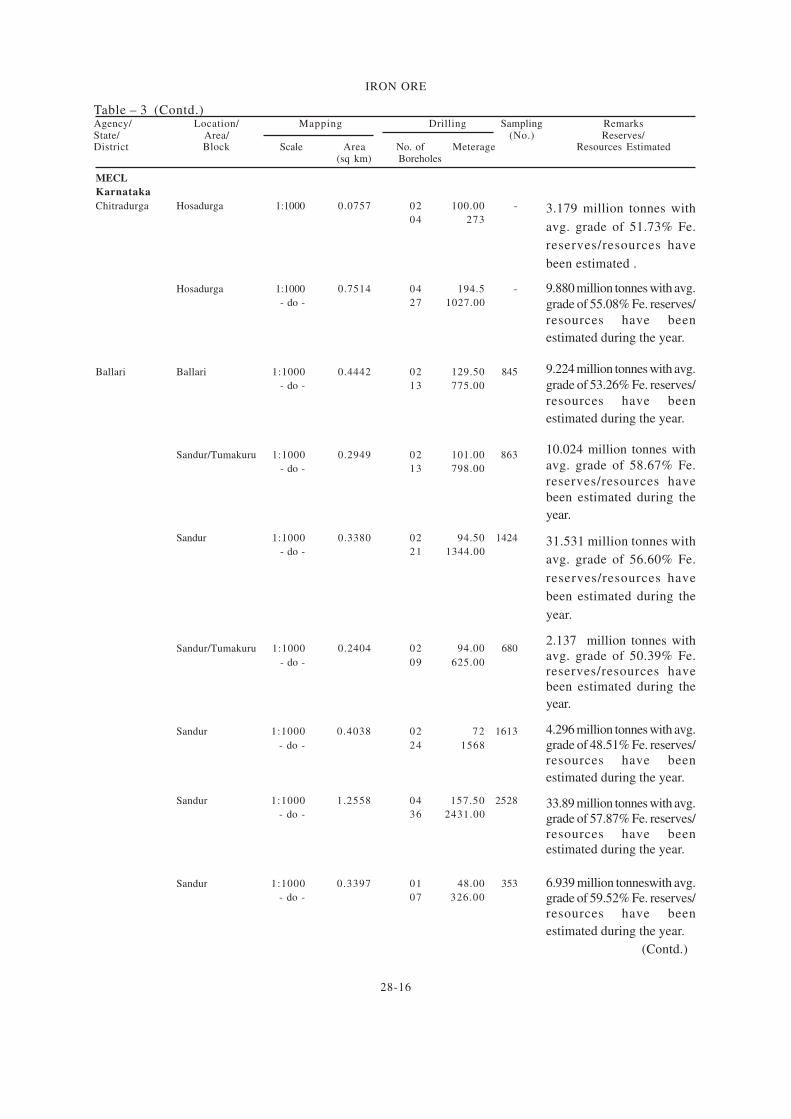
Table – 3 : Details of Exploration Activity for Iron Ore, 2015-16
Agency/ Location/ Mapping Drilling Sampling RemarksState/ Area/ (No.) Reserves/ResourcesDistrict Block Scale Area No. of Meterage Estimated
(sq km) Boreholes
(Contd.)
The investigation (G-4) was
carried to search Iron and
associated sulphide
mineralisation. Four iron-rich
zones, with mineralisation
manifested in the form of
haematite-goethite-quartz band,
thin (1-3 mm) bands and as
disseminations of magnetite in
quartzite and chlorite-biotite-quartz
schist have been delineated.Three
sulphide mineralised zones have
been delineated at Gadimendi and
Tode. Two iron formation-
associated sulphide-mineralised
bands have been delineated at
Karte and Bariri jo area. Iron
formation with associated
sulphide mineralisation at Karte
shows an average of 24.87% Fe
and 71.15 ppm Cu from channel
and trench samples. Channel
samples from pyrite-bearing talc-
tremolite schist yielded an
average of 32.25 ppm Cu and
6.09% Fe. Channel samples from
magneti te-bearing chlorite-
bioti te-quartz schist at Lama
Deke yielded average values of
9.31% Fe and 72.90 ppm Cu.
Analytical results from the
trench at Takam in the
haematite-goethite-quartz band
yielded average values of 6.61%
Fe and 33.875 ppm Cu. Trench
samples from iron formation at
Baririjo yielded average values of
28.18% Fe, 367.6 ppm Cu, 74.4
ppm Pb and 123.8 ppm Zn.
The investigation (G-4) was carried
out for delineation of iron ore
occurrence in Bhalapuri-Eklama-
Chelikama block of M/s CMDC,
Ltd of, Raipur Iron ore in the
area is associated with N–S- to
NNE–SSW trending rocks of
Chilpi Group.
GSI
Arunachal Pradesh
West Siang & Bomdila Large Scale 81 - - -
Upper Subansiri Group
Chhattisgarh
Kabirdham Ranidhara 1:12500 100 - - 20
Magarkund (PS)
area 40
(BR)
10
(OMS)
28-7
IRON ORE
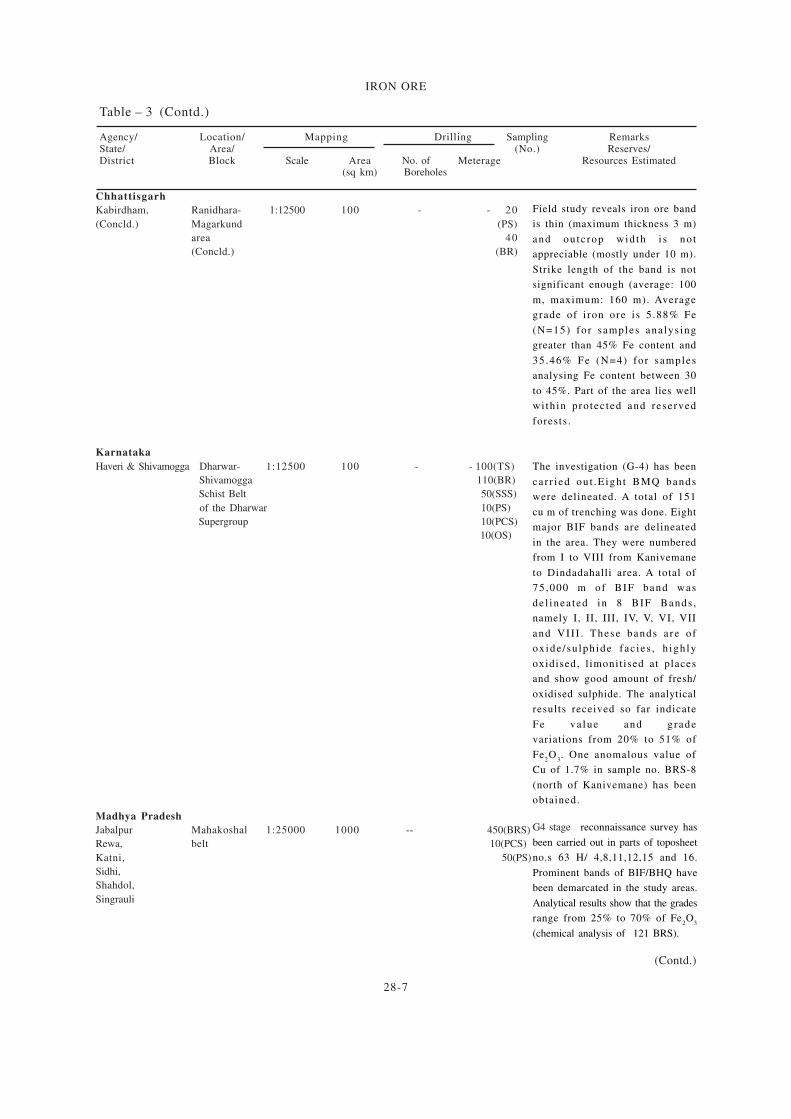
Table – 3 (Contd.)
Agency/ Location/ Mapping Drilling Sampling RemarksState/ Area/ (No.) Reserves/District Block Scale Area No. of Meterage Resources Estimated
(sq km) Boreholes
(Contd.)
G4 stage reconnaissance survey has
been carried out in parts of toposheet
no.s 63 H/ 4,8,11,12,15 and 16.
Prominent bands of BIF/BHQ have
been demarcated in the study areas.
Analytical results show that the grades
range from 25% to 70% of Fe2O
3
(chemical analysis of 121 BRS).
Field study reveals iron ore band
is thin (maximum thickness 3 m)
and ou tc rop wid th i s no t
appreciable (mostly under 10 m).
Strike length of the band is not
significant enough (average: 100
m, maximum: 160 m). Average
grade of i ron ore i s 5 .88% Fe
(N=15) fo r samples ana lys ing
greater than 45% Fe content and
35 .46% Fe (N=4) fo r samples
analysing Fe content between 30
to 45%. Part of the area lies well
wi th in pro tec ted and reserved
forests .
The investigation (G-4) has been
car r i ed ou t .E igh t BMQ bands
were delineated. A total of 151
cu m of trenching was done. Eight
major BIF bands are delineated
in the area. They were numbered
from I to VIII from Kanivemane
to Dindadahalli area. A total of
75 ,000 m of BIF band was
de l inea ted in 8 BIF Bands ,
namely I, II, III, IV, V, VI, VII
and VI I I . These bands a re o f
ox ide / su lph ide fac ies , h igh ly
oxidised, l imonit ised at places
and show good amount of fresh/
oxidised sulphide. The analytical
results received so far indicate
Fe va lue and g rade
variations from 20% to 51% of
Fe2O
3. One anomalous value of
Cu of 1.7% in sample no. BRS-8
(north of Kanivemane) has been
obtained.
Chhattisgarh
Kabirdham, Ranidhara- 1:12500 100 - - 20
(Concld.) Magarkund (PS)
area 40
(Concld.) (BR)
Karnataka
Haveri & Shivamogga Dharwar- 1:12500 100 - - 100(TS)
Shivamogga 110(BR)
Schist Belt 50(SSS)
of the Dharwar 10(PS)
Supergroup 10(PCS)
10(OS)
Madhya Pradesh
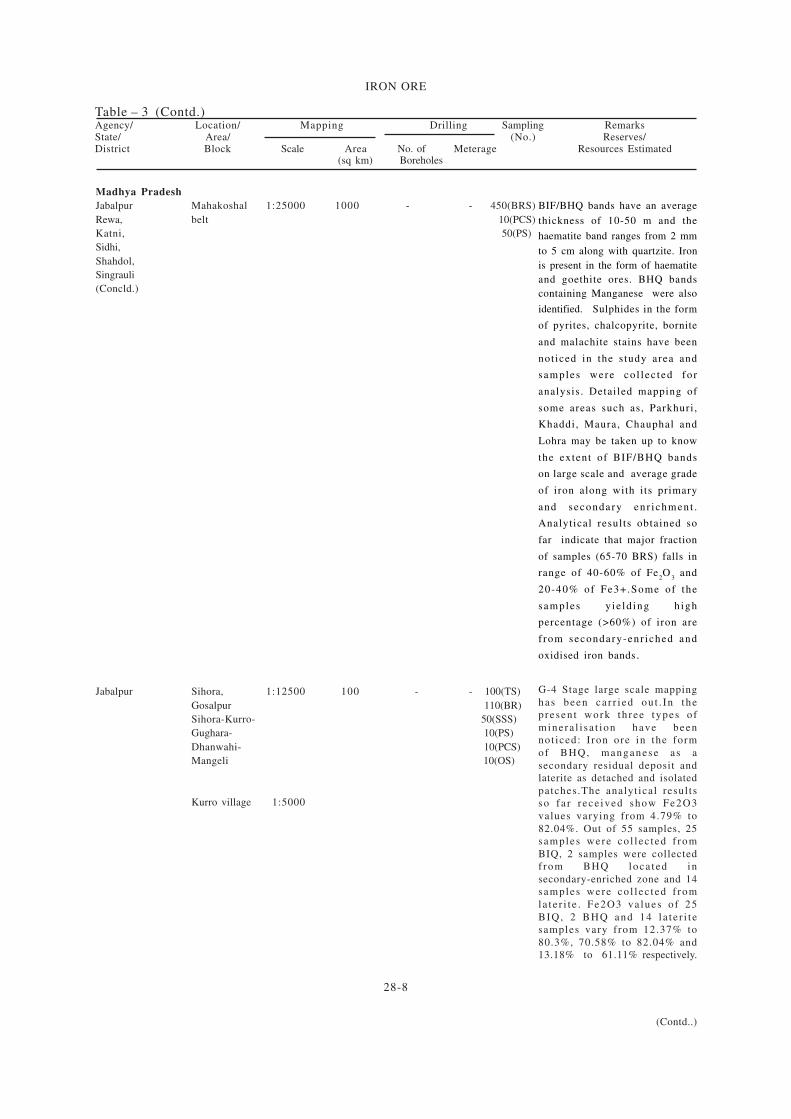
Jabalpur Mahakoshal 1:25000 1000 -- 450(BRS)
Rewa, belt 10(PCS)
Katni, 50(PS)
Sidhi,
Shahdol,
Singrauli
28-8
IRON ORE
Table – 3 (Contd.)Agency/ Location/ Mapping Drilling Sampling RemarksState/ Area/ (No.) Reserves/District Block Scale Area No. of Meterage Resources Estimated
(sq km) Boreholes
BIF/BHQ bands have an average
thickness of 10-50 m and the
haematite band ranges from 2 mm
to 5 cm along with quartzite. Iron
is present in the form of haematite
and goethite ores. BHQ bands
containing Manganese were also
identified. Sulphides in the form
of pyrites, chalcopyrite, bornite
and malachite stains have been
not iced in the s tudy area and
samples were co l l ec ted fo r
analysis . Detailed mapping of
some areas such as, Parkhuri ,
Khaddi, Maura, Chauphal and
Lohra may be taken up to know
the extent of BIF/BHQ bands
on large scale and average grade
of iron along with its primary
and secondary enr i chment .
Analytical results obtained so
far indicate that major fraction
of samples (65-70 BRS) falls in
range of 40-60% of Fe2O
3 and
20-40% of Fe3+.Some of the
samples y ie ld ing h igh
percentage (>60%) of iron are
f rom secondary-enr iched and
oxidised iron bands .
G-4 Stage large scale mapping
has been ca r r i ed ou t . In thepresen t work th ree types o f
minera l i sa t ion have beennot iced: I ron ore in the form
of BHQ, manganese a s a
secondary residual deposit andlaterite as detached and isolated
patches.The analyt ical resul tsso f a r r ece ived show Fe2O3
values varying from 4.79% to
82.04%. Out of 55 samples, 25samples were co l l ec ted f rom
BIQ, 2 samples were collectedf rom BHQ loca ted in
secondary-enriched zone and 14samples were co l l ec ted f rom
la te r i t e . Fe2O3 va lues o f 25
BIQ, 2 BHQ and 14 l a t e r i t esamples vary from 12.37% to
80.3%, 70.58% to 82.04% and13.18% to 61.11% respectively.
(Contd..)
Madhya Pradesh
Jabalpur Mahakoshal 1:25000 1000 - - 450(BRS)
Rewa, belt 10(PCS)
Katni, 50(PS)
Sidhi,
Shahdol,
Singrauli
(Concld.)
Jabalpur Sihora, 1:12500 100 - - 100(TS)
Gosalpur 110(BR)
Sihora-Kurro- 50(SSS)
Gughara- 10(PS)
Dhanwahi- 10(PCS)
Mangeli 10(OS)
Kurro village 1:5000
28-9
IRON ORE
Table – 3 (Contd.)Agency/ Location/ Mapping Drilling Sampling RemarksState/ Area/ (No.) Reserves/District Block Scale Area No. of Meterage Resources Estimated
(sq km) Boreholes
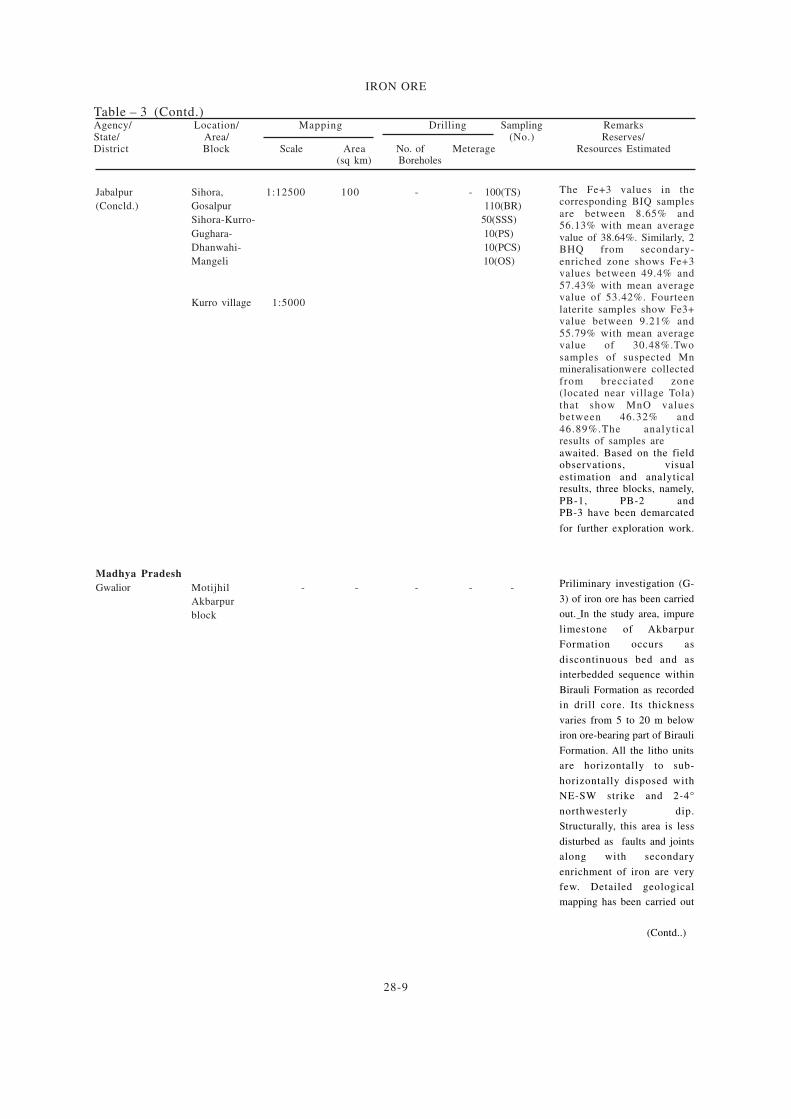
Jabalpur Sihora, 1:12500 100 - - 100(TS)
(Concld.) Gosalpur 110(BR)
Sihora-Kurro- 50(SSS)
Gughara- 10(PS)
Dhanwahi- 10(PCS)
Mangeli 10(OS)
Kurro village 1:5000
The Fe+3 values in thecorresponding BIQ samplesare between 8.65% and56.13% with mean averagevalue of 38.64%. Similarly, 2BHQ from secondary-enriched zone shows Fe+3values between 49.4% and57.43% with mean averagevalue of 53.42%. Fourteenlaterite samples show Fe3+value between 9.21% and55.79% with mean averagevalue of 30.48%.Twosamples of suspected Mnmineralisationwere collectedfrom brecciated zone(located near village Tola)that show MnO valuesbetween 46.32% and46.89%.The analyticalresults of samples areawaited. Based on the fieldobservations, visualestimation and analyticalresults, three blocks, namely,PB-1, PB-2 andPB-3 have been demarcated
for further exploration work.
Priliminary investigation (G-
3) of iron ore has been carried
out. In the study area, impure
limestone of Akbarpur
Formation occurs as
discontinuous bed and as
interbedded sequence within
Birauli Formation as recorded
in drill core. Its thickness
varies from 5 to 20 m below
iron ore-bearing part of Birauli
Formation. All the litho units
are horizontally to sub-
horizontally disposed with
NE-SW strike and 2-4°
northwesterly dip.
Structurally, this area is less
disturbed as faults and joints
along with secondary
enrichment of iron are very
few. Detailed geological
mapping has been carried out
(Contd..)
Madhya Pradesh
Gwalior Motijhil - - - - -
Akbarpur
block
28-10
IRON ORE
Table – 3 (Contd.)Agency/ Location/ Mapping Drilling Sampling RemarksState/ Area/ (No.) Reserves/District Block Scale Area No. of Meterage Resources Estimated
(sq km) Boreholes (m)
(Contd.)
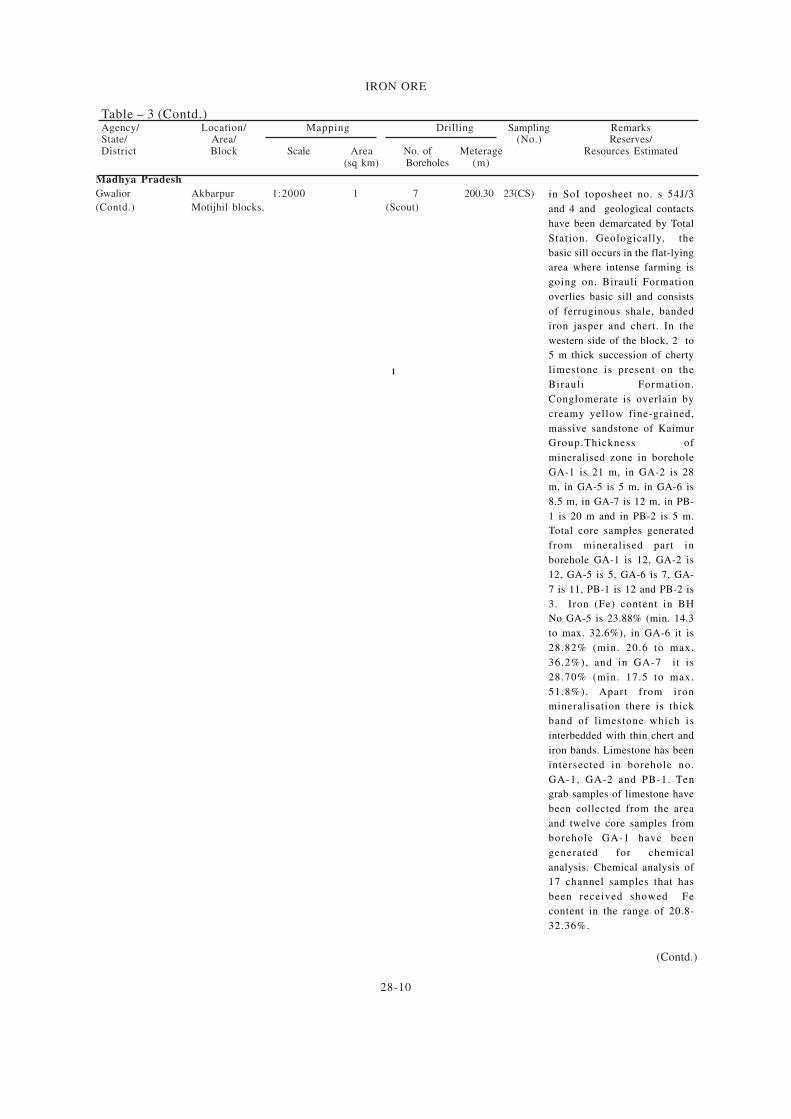
Madhya Pradesh
Gwalior Akbarpur 1:2000 1 7 200.30 23(CS)
(Contd.) Motijhil blocks, (Scout)
in SoI toposheet no. s 54J/3
and 4 and geological contacts
have been demarcated by Total
Station. Geologically, the
basic sill occurs in the flat-lying
area where intense farming is
going on. Birauli Formation
overlies basic sill and consists
of ferruginous shale, banded
iron jasper and chert. In the
western side of the block, 2 to
5 m thick succession of cherty
limestone is present on the
Birauli Formation.
Conglomerate is overlain by
creamy yellow fine-grained,
massive sandstone of Kaimur
Group.Thickness of
mineralised zone in borehole
GA-1 is 21 m, in GA-2 is 28
m, in GA-5 is 5 m, in GA-6 is
8.5 m, in GA-7 is 12 m, in PB-
1 is 20 m and in PB-2 is 5 m.
Total core samples generated
from mineralised part in
borehole GA-1 is 12, GA-2 is
12, GA-5 is 5, GA-6 is 7, GA-
7 is 11, PB-1 is 12 and PB-2 is
3. Iron (Fe) content in BH
No GA-5 is 23.88% (min. 14.3
to max. 32.6%), in GA-6 it is
28.82% (min. 20.6 to max.
36.2%), and in GA-7 i t is
28.70% (min. 17.5 to max.
51.8%). Apart from iron
mineralisation there is thick
band of l imestone which is
interbedded with thin chert and
iron bands. Limestone has been
intersected in borehole no.
GA-1, GA-2 and PB-1. Ten
grab samples of limestone have
been collected from the area
and twelve core samples from
borehole GA-1 have been
generated for chemical
analysis. Chemical analysis of
17 channel samples that has
been received showed Fe
content in the range of 20.8-
32.36%.
28-11
IRON ORE
Table – 3 (Contd.)Agency/ Location/ Mapping Drilling Sampling RemarksState/ Area/ (No.) Reserves/District Block Scale Area No. of Meterage Resources Estimated
(sq km) Boreholes (m)
(Contd.)
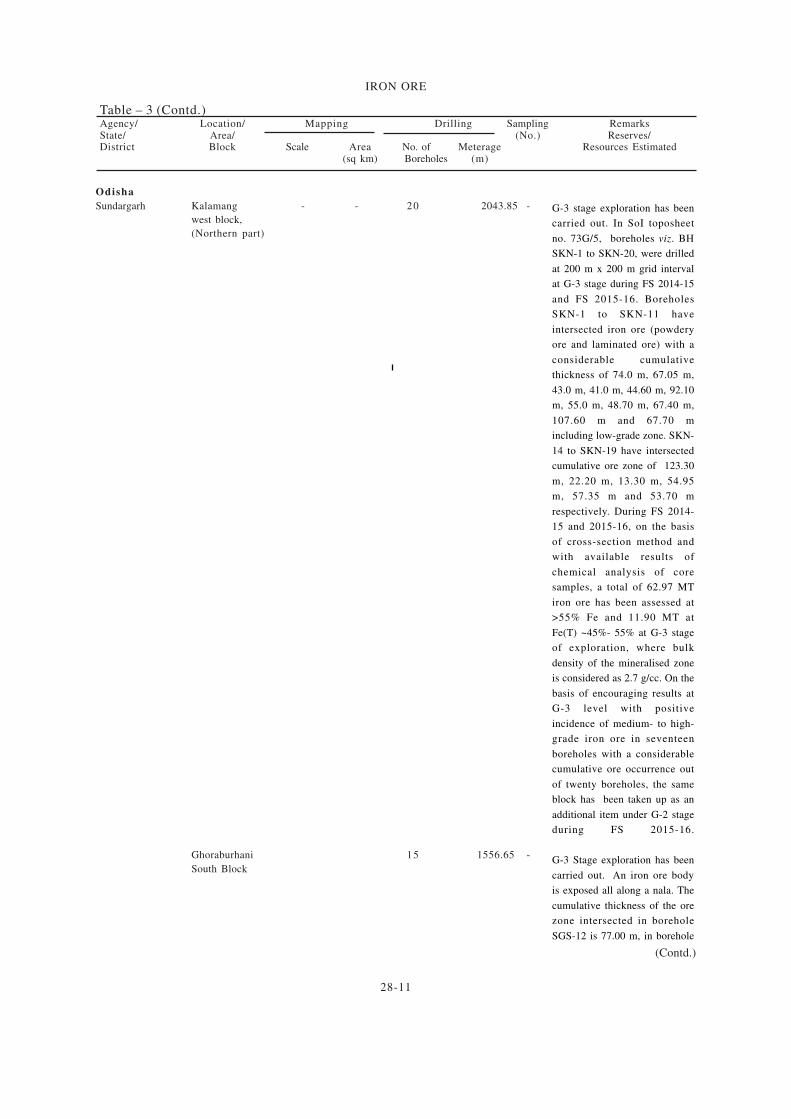
Odisha
Sundargarh Kalamang - - 20 2043.85 -
west block,
(Northern part)
G-3 stage exploration has been
carried out. In SoI toposheet
no. 73G/5, boreholes viz. BH
SKN-1 to SKN-20, were drilled
at 200 m x 200 m grid interval
at G-3 stage during FS 2014-15
and FS 2015-16. Boreholes
SKN-1 to SKN-11 have
intersected iron ore (powdery
ore and laminated ore) with a
considerable cumulative
thickness of 74.0 m, 67.05 m,
43.0 m, 41.0 m, 44.60 m, 92.10
m, 55.0 m, 48.70 m, 67.40 m,
107.60 m and 67.70 m
including low-grade zone. SKN-
14 to SKN-19 have intersected
cumulative ore zone of 123.30
m, 22.20 m, 13.30 m, 54.95
m, 57.35 m and 53.70 m
respectively. During FS 2014-
15 and 2015-16, on the basis
of cross-section method and
with available results of
chemical analysis of core
samples, a total of 62.97 MT
iron ore has been assessed at
>55% Fe and 11.90 MT at
Fe(T) ~45%- 55% at G-3 stage
of exploration, where bulk
density of the mineralised zone
is considered as 2.7 g/cc. On the
basis of encouraging results at
G-3 level with positive
incidence of medium- to high-
grade iron ore in seventeen
boreholes with a considerable
cumulative ore occurrence out
of twenty boreholes, the same
block has been taken up as an
additional item under G-2 stage
during FS 2015-16.
G-3 Stage exploration has been
carried out. An iron ore body
is exposed all along a nala. The
cumulative thickness of the ore
zone intersected in borehole
SGS-12 is 77.00 m, in borehole
Ghoraburhani 15 1556.65 -
South Block
28-12
IRON ORE
Table – 3 (Contd.)Agency/ Location/ Mapping Drilling Sampling RemarksState/ Area/ (No.) Reserves/District Block Scale Area No. of Meterage Resources Estimated
(sq km) Boreholes (m)
Odisha
Sundargarh
(Contd.)
Mendhamaruni 1:2000 0.34 4 511.40 -
West Block
SGS-13 is 90.00 m, in
borehole SGS-20 is 55.00 m,
in borehole SGS-21 is 75.00
m, in borehole SGS-23 is 37.00
m, in borehole SGS-24 is 59.00
m, in borehole SGS-25 is 77.00
m and in SGS-26 is 46.00 m.
Boreholes SGS-11, SGS-12,
SGS-13, SGS-20, SGS-21, SGS-
23 and SGS-25 show
encouraging results with Fe
content in the range of (total
value) 35.66-65.56%, 33-
65%, 37-64%, 27-40%, 25-
64%, 33-62% and 55-65%
respectively.
This area has been mapped
in par ts of SoI toposheet
no . 73 G/5 , wh ich
comprises Fe-laterite shale
and so i l .The base l ine i s
N 6 0 ° E - S 6 0 ° W- t r e n d i n g
and the grid lines are laid
perpendicular to it at 200
m in te rva l . The main
l i tho-uni t s in tersec ted in
boreho les a re ha rd
laminated ore (HLO), soft
l amina ted o re (SLO)
powdery i ron o re ,
ferruginous shale, brown to
grey shale limonitic shale
and banded haemat i t e
cher t . Minera l i sed zone
has been intersected in the
boreholes SMW-1 & 3 in
the sou theas te rn pa r t o f
study area. The cumulative
thickness of the ore zone
in te r sec ted in boreho le
SMW-1 is 35 m (99.0 m to
134 .0 m) . The maximum
Fe (total) value is 44.04%.
The cumulat ive thickness
of the ore zone intersected
in boreho le SMW-3 i s
40 .00 m (46.0 m to 86 .0
m). The maximum average
Fe (total) value is 42.51%.
(Contd.)
28-13
IRON ORE
Table – 3 (Contd.)Agency/ Location/ Mapping Drilling Sampling RemarksState/ Area/ (No.) Reserves/District Block Scale Area No. of Meterage Resources Estimated
(sq km) Boreholes (m)
Sundargarh
(contd.)
Mendhamaruni 1:2000 - 10 1937.10 -
BlockG-2 stage exploration were
carried out. Boreholes, OSM-1
to OSM- 7, OSM-9, OSM-10
and OSM-13 have been
completed in 100 m x 100 m
grid and another three boreholes
OSM-8, OSM-11 and OSM-12
are under progress. All the
boreholes are vertical in nature
and borehole depth varied from
113 m to 181 m. The
cumulative thickness of ore
zone in Borehole OSM-1 was
167.95 m, and average Fe
(total) value ranged between
47.97 and 61.72%. In Borehole
OSM-2 cumulative thickness of
ore zone was 104.65 m while
Fe (total) value ranged from
48.69-63.73%. Cumulative
thickness of Borehole OSM-3
was 137.95 m with average Fe
(total) value ranging between
39.33 and 64.77%. cumulative
thickness of Borehole OSM-4
was 87.10 m and the average
Fe (total) value was
> 5 9 . 8 5 % . C u m u l a t i v e
thickness of ore zone
intersected in Borehole OSM-
5 was 117.00 m, in borehole
OSM-6 i t was 92.00 m, in
Borehole OSM-7 86.00 m, in
Borehole OSM-8 55.00 m, in
Borehole OSM–9 113.00 m,
and in borehole OSM-10 it was
61.00 m.
G2 stage eXploration has been
carried out under Project-Iron
Ore after the encouraging
results of G-3 investigation.
At G-2 level of investigation,
the boreholes were drilled at
100 m × 100 m grid interval
of area covered through
detailed mapping area. The
boreholes have in tersected
(Contd..)
Kalamang 1:2000 - 20 590.40 -
West blocks,
(Northern part)
28-14
IRON ORE
Table – 3 (Contd.)Agency/ Location/ Mapping Drilling Sampling RemarksState/ Area/ (No.) Reserves/District Block Scale Area No. of Meterage Resources Estimated
(sq km) Boreholes (m)
Odisha
Sundargarh
(Concld.) Kalamang
West blocks,
(Northern part)
(Concld)
mainly medium- to high-grade
[Fe(T) ~ >55% as per visual
estimation (VE)] iron ore body
comprising powdery ore, soft
laminated ore, hard laminated
ore, blue dust with minor
ferruginous shale and occasionally
low grade [Fe(T) ~45 to 55% as
per VE] ore zone comprising
powdery ore, soft laminated ore
intercalated with banded haematite
jasper/banded haematite quartz
and ferruginous shale Boreholes
OSKN-1, OSKN-2, OSKN-3 and
OSKN-4 have intersected
cumulative iron ore zone
(including low-grade ore) of 87.10
m, 82.25 m, 76.25 m and 59.90
m respectively. Boreholes OSKN-
5, OSKN-7, OSKN-8 and OSKN-
9 have intersected medium- to
high-grade iron ore body with a
considerable cumulative thickness
of 18.85 m, nil, 12.0 m and 6.50
m respectively.
G-4 stage investigation has been
carried out in the area. As part of
the investigation(G-4) LSM and
sampling was carried
out in parts of SoI toposheet no.s
56N/10 and N/11. It was observed
that major part of the area is
covered by Pakhal
metasedimentaries. It is a NW-SE-
trending body, bounded by
basement granite (PGC-II) in the
west and southwest, and Sullavai
Sandstone in the NE. LSM has
helped to delineate two iron-
enriched zones: south of
Manthani, in SoI toposheet no.
56N/10 and Shanthinagar in SoI
toposheet no. 56N/11. Near south
of Manthani ferruginous/
laterite capping is
developed over ferruginous shale.
This zone has a dimension
of 1× 0.5 km (approx.) with an
average thickness of 1 m.
The Shantinagar Fe-rich zone has
an approximate dimension of 0.75
× 0.3 km (approx) with thickness
of about 1 m (approx). The
Telangana
Karimnagar South of 1:12500 197 - - 150(BRS)
Manthani 50(PTS)
20(PS)
5(PCS)
20(OMS)
28-15
IRON ORE
Table – 3 (Contd.)Agency/ Location/ Mapping Drilling Sampling RemarksState/ Area/ (No.) Reserves/District Block Scale Area No. of Meterage Resources Estimated
(sq km) Boreholes
Telangana
Karimnagar
(Contd.)
(Contd.)
approximate thickness of the iron-
enriched zone at these places is
estimated by the numerous cliff
faces made by recent excavation
in the area and by pitting and
trenching as part of this work.
These iron enriched zones are also
being sampled for assessing their
Fe content. The average specific
gravity of the specimen is 3.52 to
4.5. Chemical analyses of 150
samples showed that Fe2O3 ranged
from 0.74 wt% to 91.88 wt% and
the calculated Fe varies from 0.51%
to 64.25%. The higher Fe values
are from the float iron ore present
within laterite. Apart from iron ore,
dolomite has been extensively
developed over the entire area and
samples have been submitted for
analysis. CaO content of the
samples varied from 24.78 to 51.26
wt% and SiO2 varied from 6.12 to
11.01 wt%.
G2 Investigation in an area of 100
sq km was carried out between
Bayyaram Cheruvu to Motla
Timmapuram (SoI toposheet no.
65 C/2) on 1: 12500 scale
including mapping of eight blocks
with cumulative area of 4.54 sq
km on 1: 2000 scale.Both
haematit i te and specks of
magnetite are present. The core
samples from 18.5 m to 47 m,
totaling 20 samples at an interval
of 1 m to 2 m analysed high Th
values ranging from 43 ppm to
1992 ppm and £LREE values from
239 to 8395 ppm while £HREE
is 47 ppm to 286 ppm. La, Ce, Pr
and Nd are the dominant REEs in
the samples. The samples are also
high in Zr ranging from 115 ppm
to 2183 ppm. However, low U
content (1 ppm to 31 ppm) is
recorded. The surface sample of
the mineralized zones in the area
has an average density ranging
from 1.09 to 5.09. Petrographic
studies indicate occurrences of
brecciated haematite clasts along
with folded BIF clasts. Magnetite
grains are also present that show
transformation from magnetite
to haematite (martitization).
Khammam Bayyaram 1:12500 100 17 1168.6 262 (BRS)
& area 1:2000 67 (PS)
Warangal 111 (PCS)
47 (ORM)
28-16
IRON ORE
Table – 3 (Contd.)Agency/ Location/ Mapping Drilling Sampling RemarksState/ Area/ (No.) Reserves/District Block Scale Area No. of Meterage Resources Estimated
(sq km) Boreholes
3.179 million tonnes with
avg. grade of 51.73% Fe.
reserves/resources have
been estimated .
9.880 million tonnes with avg.
grade of 55.08% Fe. reserves/
resources have been
estimated during the year.
9.224 million tonnes with avg.
grade of 53.26% Fe. reserves/
resources have been
estimated during the year.
10.024 million tonnes with
avg. grade of 58.67% Fe.
reserves/resources have
been estimated during the
year.
31.531 million tonnes with
avg. grade of 56.60% Fe.
reserves/resources have
been estimated during the
year.
2.137 million tonnes withavg. grade of 50.39% Fe.reserves/resources havebeen estimated during the
year.
4.296 million tonnes with avg.grade of 48.51% Fe. reserves/resources have been
estimated during the year.
33.89 million tonnes with avg.grade of 57.87% Fe. reserves/resources have beenestimated during the year.
6.939 million tonneswith avg.grade of 59.52% Fe. reserves/resources have been
estimated during the year.
(Contd.)
MECL
Karnataka
Chitradurga Hosadurga 1:1000 0.0757 02 100.00 -
04 273
Hosadurga 1:1000 0.7514 04 194.5 -
- do - 27 1027.00
Ballari Ballari 1:1000 0.4442 02 129.50 845
- do - 13 775.00
Sandur/Tumakuru 1:1000 0.2949 02 101.00 863
- do - 13 798.00
Sandur 1:1000 0.3380 02 94.50 1424
- do - 21 1344.00
Sandur/Tumakuru 1:1000 0.2404 02 94.00 680
- do - 09 625.00
Sandur 1:1000 0.4038 02 72 1613
- do - 24 1568
Sandur 1:1000 1.2558 04 157.50 2528
- do - 36 2431.00
Sandur 1:1000 0.3397 01 48.00 353
- do - 07 326.00
28-17
IRON ORE
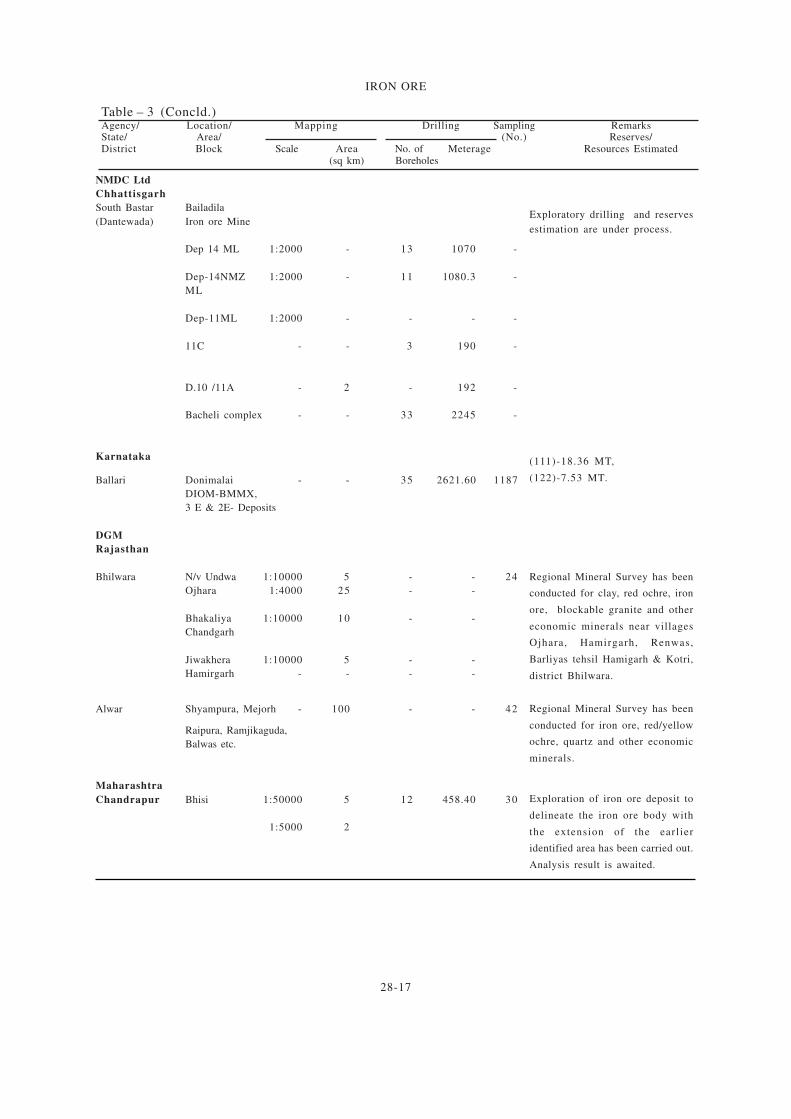
Table – 3 (Concld.)Agency/ Location/ Mapping Drilling Sampling RemarksState/ Area/ (No.) Reserves/District Block Scale Area No. of Meterage Resources Estimated
(sq km) Boreholes
NMDC Ltd
Chhattisgarh
South Bastar Bailadila
(Dantewada) Iron ore Mine
Dep 14 ML 1:2000 - 13 1070 -
Dep-14NMZ 1:2000 - 11 1080.3 -
ML
Dep-11ML 1:2000 - - - -
11C - - 3 190 -
D.10 /11A - 2 - 192 -
Bacheli complex - - 33 2245 -
Karnataka
Ballari Donimalai - - 35 2621.60 1187
DIOM-BMMX,
3 E & 2E- Deposits
DGM
Rajasthan
Bhilwara N/v Undwa 1:10000 5 - - 24
Ojhara 1:4000 25 - -
Bhakaliya 1:10000 10 - -
Chandgarh
Jiwakhera 1:10000 5 - -
Hamirgarh - - - -
Alwar Shyampura, Mejorh - 100 - - 42
Raipura, Ramjikaguda,
Balwas etc.
Maharashtra
Chandrapur Bhisi 1:50000 5 12 458.40 30
1:5000 2
Exploratory drilling and reserves
estimation are under process.
(111)-18.36 MT,
(122)-7.53 MT.
Regional Mineral Survey has been
conducted for clay, red ochre, iron
ore, blockable granite and other
economic minerals near villages
Ojhara, Hamirgarh, Renwas,
Barliyas tehsil Hamigarh & Kotri,
district Bhilwara.
Regional Mineral Survey has been
conducted for iron ore, red/yellow
ochre, quartz and other economic
minerals.
Exploration of iron ore deposit to
delineate the iron ore body with
the extension of the earl ier
identified area has been carried out.
Analysis result is awaited.
28-18
IRON ORE
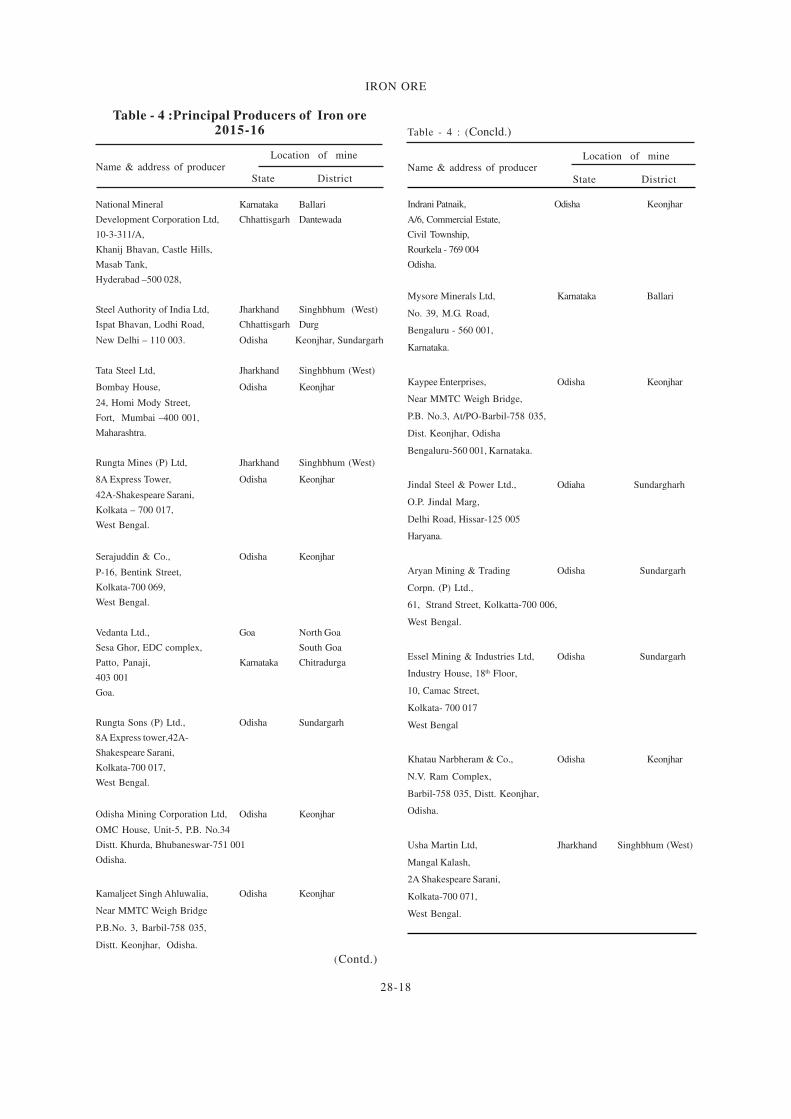
Table - 4 :Principal Producers of Iron ore2015-16
Location of mineName & address of producer
State District
National Mineral Karnataka Ballari
Development Corporation Ltd, Chhattisgarh Dantewada
10-3-311/A,
Khanij Bhavan, Castle Hills,
Masab Tank,
Hyderabad –500 028,
Steel Authority of India Ltd, Jharkhand Singhbhum (West)
Ispat Bhavan, Lodhi Road, Chhattisgarh Durg
New Delhi – 110 003. Odisha Keonjhar, Sundargarh
Tata Steel Ltd, Jharkhand Singhbhum (West)
Bombay House, Odisha Keonjhar
24, Homi Mody Street,
Fort, Mumbai –400 001,
Maharashtra.
Rungta Mines (P) Ltd, Jharkhand Singhbhum (West)
8A Express Tower, Odisha Keonjhar
42A-Shakespeare Sarani,
Kolkata – 700 017,
West Bengal.
Serajuddin & Co., Odisha Keonjhar
P-16, Bentink Street,
Kolkata-700 069,
West Bengal.
Vedanta Ltd., Goa North Goa
Sesa Ghor, EDC complex, South Goa
Patto, Panaji, Karnataka Chitradurga
403 001
Goa.
Rungta Sons (P) Ltd., Odisha Sundargarh
8A Express tower,42A-
Shakespeare Sarani,
Kolkata-700 017,
West Bengal.
Odisha Mining Corporation Ltd, Odisha Keonjhar
OMC House, Unit-5, P.B. No.34
Distt. Khurda, Bhubaneswar-751 001
Odisha.
Kamaljeet Singh Ahluwalia, Odisha Keonjhar
Near MMTC Weigh Bridge
P.B.No. 3, Barbil-758 035,
Distt. Keonjhar, Odisha.
Table - 4 : (Concld.)
Location of mineName & address of producer
State District
(Contd.)
Indrani Patnaik, Odisha Keonjhar
A/6, Commercial Estate,
Civil Township,
Rourkela - 769 004
Odisha.
Mysore Minerals Ltd, Karnataka Ballari
No. 39, M.G. Road,
Bengaluru - 560 001,
Karnataka.
Kaypee Enterprises, Odisha Keonjhar
Near MMTC Weigh Bridge,
P.B. No.3, At/PO-Barbil-758 035,
Dist. Keonjhar, Odisha
Bengaluru-560 001, Karnataka.
Jindal Steel & Power Ltd., Odiaha Sundargharh
O.P. Jindal Marg,
Delhi Road, Hissar-125 005
Haryana.
Aryan Mining & Trading Odisha Sundargarh
Corpn. (P) Ltd.,
61, Strand Street, Kolkatta-700 006,
West Bengal.
Essel Mining & Industries Ltd, Odisha Sundargarh
Industry House, 18th Floor,
10, Camac Street,
Kolkata- 700 017
West Bengal
Khatau Narbheram & Co., Odisha Keonjhar
N.V. Ram Complex,
Barbil-758 035, Distt. Keonjhar,
Odisha.
Usha Martin Ltd, Jharkhand Singhbhum (West)
Mangal Kalash,
2A Shakespeare Sarani,
Kolkata-700 071,
West Bengal.
28-19
IRON ORE
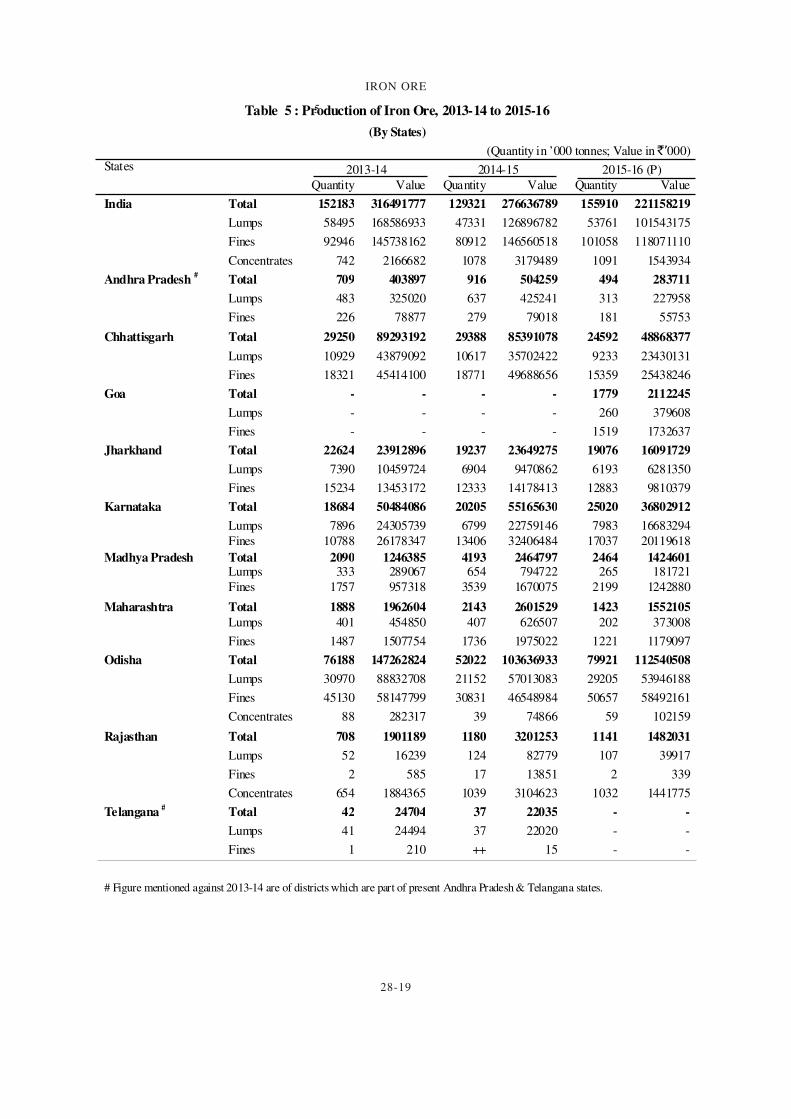
Table 5 : Production of Iron Ore, 2013-14 to 2015-16
(By States)
(Quantity in ’000 tonnes; Value in `’000)
States 2013-14 2014-15 2015-16 (P)
Quantity Value Quantity Value Quantity Value
India Total 152183 316491777 129321 276636789 155910 221158219
Lumps 58495 168586933 47331 126896782 53761 101543175
Fines 92946 145738162 80912 146560518 101058 118071110
Concentrates 742 2166682 1078 3179489 1091 1543934
Andhra Pradesh # Total 709 403897 916 504259 494 283711
Lumps 483 325020 637 425241 313 227958
Fines 226 78877 279 79018 181 55753
Chhattisgarh Total 29250 89293192 29388 85391078 24592 48868377
Lumps 10929 43879092 10617 35702422 9233 23430131
Fines 18321 45414100 18771 49688656 15359 25438246
Goa Total - - - - 1779 2112245
Lumps - - - - 260 379608
Fines - - - - 1519 1732637
Jharkhand Total 22624 23912896 19237 23649275 19076 16091729
Lumps 7390 10459724 6904 9470862 6193 6281350
Fines 15234 13453172 12333 14178413 12883 9810379
Karnataka Total 18684 50484086 20205 55165630 25020 36802912
Lumps 7896 24305739 6799 22759146 7983 16683294
Fines 10788 26178347 13406 32406484 17037 20119618
Madhya Pradesh Total 2090 1246385 4193 2464797 2464 1424601 Lumps 333 289067 654 794722 265 181721
Fines 1757 957318 3539 1670075 2199 1242880
Maharashtra Total 1888 1962604 2143 2601529 1423 1552105
Lumps 401 454850 407 626507 202 373008
Fines 1487 1507754 1736 1975022 1221 1179097
Odisha Total 76188 147262824 52022 103636933 79921 112540508
Lumps 30970 88832708 21152 57013083 29205 53946188
Fines 45130 58147799 30831 46548984 50657 58492161
Concentrates 88 282317 39 74866 59 102159
Rajasthan Total 708 1901189 1180 3201253 1141 1482031
Lumps 52 16239 124 82779 107 39917
Fines 2 585 17 13851 2 339
Concentrates 654 1884365 1039 3104623 1032 1441775
Telangana # Total 42 24704 37 22035 - -
Lumps 41 24494 37 22020 - -
Fines 1 210 ++ 15 - -
# Figure mentioned against 2013-14 are of districts which are part of present Andhra Pradesh & Telangana states.
5
28-20
IRON ORE
28-21
IRON ORE
Ta
ble
– 6
(A
) :
Pro
du
cti
on
of
Iro
n O
re,
20
14
-15
(By
Secto
rs/
Sta
tes/
Dis
tric
ts/G
ra
des)
(Qu
anti
ty i
n ’
00
0 t
on
nes
; V
alu
e in
`’0
00
)
Lu
mp
sF
ines
Co
ncen
trate
sT
ota
lS
ecto
r/
N
o.
of
Sta
te/
min
es B
elo
w5
5%
-5
8%
-6
0%
-6
2%
-6
5%
T
ota
lB
elow
55
%-
58
%-
60
%-
62
%-
65
%T
ota
lD
istr
ict
55
%bel
ow
bel
ow
bel
ow
bel
ow
Fe
&5
5%
bel
ow
bel
ow
bel
ow
bel
ow
Fe
&F
e5
8%
60
%6
2%
65
%ab
ov
eQ
tyV
alue
Fe
58
% 6
0%
62
%6
5%
ab
vo
eQ
tyV
alue
Qty
Val
ue
Qty
Val
ue
Fe
Fe
Fe
Fe
Fe
Fe
Fe
Fe
Ind
ia3
20
(20
)2
86
51
50
62
71
55
99
22
18
40
12
41
34
73
31
12
68
96
78
26
58
06
17
94
40
91
66
62
32
09
71
49
85
80
91
21
46
56
05
18
10
78
31
79
48
91
29
32
12
76
63
67
89
P
ubli
c S
ecto
r3
4(1
)5
16
32
57
29
07
12
24
96
35
82
19
39
60
85
83
45
63
13
06
21
70
96
89
18
17
76
11
83
75
23
80
20
56
92
--
59
46
21
41
06
40
37
P
rivat
e S
ecto
r2
86
(19
)2
86
01
34
32
45
83
08
59
59
16
05
52
53
92
66
03
84
37
65
17
48
73
22
39
69
73
13
92
08
86
74
33
89
66
35
48
26
10
78
31
79
48
96
98
59
13
55
72
75
2
An
dh
ra P
rad
esh
29
(1)
63
7-
--
--
63
74
25
24
12
79
--
--
-2
79
79
01
8-
-9
16
50
42
59
A
nan
tap
ur
36
--
--
-6
25
41
--
--
--
--
--
62
54
1
C
ud
dap
ah4
33
8-
--
--
33
82
36
95
42
38
--
--
-2
38
60
16
0-
-5
76
29
71
14
K
rish
na
3++
--
--
-++
21
--
--
-1
72
6-
-1
72
8
K
urn
oo
l1
8(1
)2
93
--
--
-2
93
18
57
44
40
--
--
-4
01
81
32
--
33
32
03
87
6
P
rakas
am*
1-
--
--
--
--
--
--
--
--
--
-
Ch
ha
ttis
ga
rh
14
22
04
13
95
64
07
36
18
81
06
17
35
70
24
22
12
61
34
29
93
11
38
83
56
26
41
87
71
49
68
86
56
--
29
38
88
53
91
07
8
D
ante
wad
a3
--
-1
28
97
61
33
70
42
28
68
18
49
81
16
28
51
11
46
67
86
11
31
43
14
42
93
78
23
--
21
35
67
16
19
67
2
D
urg
5-
--
-3
10
4-
31
04
60
31
02
1-
--
19
84
21
49
-4
13
36
03
51
55
--
72
37
12
06
61
76
K
anker
41
68
16
64
15
52
77
42
80
16
23
-4
87
15
11
93
47
62
86
--
47
09
04
30
2
R
ajnan
dgao
n2
52
40
33
38
31
-1
94
56
15
36
95
18
10
71
++
13
12
39
39
2-
-3
25
80
09
28
Go
a*
76
--
--
--
--
--
--
--
--
--
--
N
ort
h G
oa*
39
--
--
--
--
--
--
--
--
--
--
S
outh
Goa*
37
--
--
--
--
--
--
--
--
--
--
Jh
ark
han
d2
2(1
)2
93
26
51
03
42
09
02
63
75
85
69
04
94
70
86
22
00
10
87
51
33
15
58
77
18
03
12
33
31
41
78
41
3-
-1
92
37
23
64
92
75
S
ing
hb
hu
m (
Wes
t) 2
2(1
)2
93
26
51
03
42
09
02
63
75
85
69
04
94
70
86
22
00
10
87
51
33
15
58
77
18
03
12
33
31
41
78
41
3-
-1
92
37
23
64
92
75
Ka
rna
tak
a6
7(2
)3
59
45
75
06
16
11
36
72
19
46
79
92
27
59
14
67
68
18
91
29
27
45
01
32
66
53
13
40
63
24
06
48
4-
-2
02
05
55
16
56
30
B
agal
ko
t*3
--
--
--
--
--
--
--
--
--
--
B
alla
ri4
9(2
)3
59
43
74
56
15
48
35
20
19
46
51
42
18
17
13
36
96
16
46
26
61
44
85
31
46
53
12
68
73
08
97
26
4-
-1
92
01
52
71
43
97
C
hit
radurg
a7
-2
05
03
51
52
-2
57
86
93
59
72
24
52
66
16
12
0-
71
91
50
92
20
--
97
62
37
85
79
T
um
akuru
8-
--
28
--
28
72
65
4-
--
--
--
--
-2
87
26
54
(Co
ntd
.)
28-22
IRON ORE
Ta
ble
- 6
(A
) :
(Co
nc
ld.)
++
Neg
libib
le* O
nly
labour
report
ed.
Lu
mp
sF
ines
Co
ncen
trate
sT
ota
lS
ecto
r/
N
o.
of
Sta
te/
min
esB
elow
55
%-
58
%-
60
%-
62
%-
65
%
To
tal
Bel
ow
55
%-
58
%-
60
%-
62
%-
65
%T
ota
lD
istr
ict
55
%bel
ow
bel
ow
bel
ow
bel
ow
Fe
&5
5%
bel
ow
bel
ow
bel
ow
bel
ow
Fe
&F
e5
8%
60
%6
2%
65
%ab
ov
eQ
tyV
alue
Fe
58
% 6
0%
62
%6
5%
ab
vo
eQ
tyV
alue
Qty
Val
ue
Qty
Val
ue
F
e
Fe
Fe
Fe
Fe
F
e
F
e
Fe
Mad
hya P
rad
esh
19
(12
)6
30
23
1-
--
65
47
94
72
23
46
66
94
--
-3
53
91
67
00
75
--
41
93
24
64
79
7
B
alag
hat
1-
6-
--
-6
43
32
--
--
--
--
--
64
33
2
G
wal
ior
2-
--
--
--
-1
8-
--
--
18
10
14
4-
-1
81
01
44
Ja
bal
pu
r1
4(1
2)
61
11
71
--
-6
29
77
07
60
34
48
69
4-
--
35
21
16
59
93
1-
-4
15
02
43
06
91
S
agar
21
9-
--
--
19
19
63
0-
--
--
--
--
-1
91
96
30
Ma
ha
rash
tra
14
21
77
56
35
2-
-4
07
62
65
07
14
17
52
20
26
5-
-1
73
61
97
50
22
--
21
43
26
01
52
9
C
han
dra
pur
22
49
++
--
-5
11
24
54
21
7++
20
--
-3
75
18
02
--
88
17
63
44
G
ondia
48
--
--
-8
94
25
4-
--
--
42
16
8-
-1
21
15
93
S
indhudurg
82
07
26
63
52
--
34
84
92
54
01
39
65
21
82
65
--
16
95
19
21
05
2-
-2
04
32
41
35
92
Od
ish
a6
8(3
)3
48
64
51
07
22
18
31
14
58
54
46
21
15
25
70
13
08
33
07
29
46
92
65
66
81
41
19
68
65
30
83
14
65
48
98
43
97
48
66
52
02
21
03
63
69
33
K
eonjh
ar4
1(2
)1
21
42
84
62
28
81
08
47
64
14
10
93
36
02
20
67
71
98
77
02
90
91
04
48
55
81
21
07
23
14
42
96
03
97
48
66
35
22
06
51
20
03
2
M
ayu
rbh
anj
31
41
41
42
07
14
15
83
61
12
95
50
32
17
75
92
25
68
98
83
-5
33
85
69
82
--
18
28
58
89
15
9
S
undar
gar
h2
4(1
)8
61
89
19
19
41
31
92
32
15
74
81
83
78
70
01
71
73
47
88
26
61
35
88
12
84
92
26
14
24
90
42
--
14
97
43
26
27
74
2
Ra
jast
ha
n8
12
4-
--
--
12
48
27
79
17
--
--
-1
71
38
51
10
39
31
04
62
31
18
03
20
12
53
B
hil
war
a2
2-
--
--
24
65
--
--
--
--
10
39
31
04
62
31
04
13
10
50
88
Ja
ipu
r2
54
--
--
-5
41
49
50
--
--
--
--
--
54
14
95
0
Jh
un
jhu
nu
34
1-
--
--
41
16
17
91
7-
--
--
17
13
85
1-
-5
83
00
30
S
ikar
12
7-
--
--
27
51
18
5-
--
--
--
--
-2
75
11
85
Tela
ng
an
a3
(1)
37
--
--
-3
72
20
20
++
--
--
-++
15
--
37
22
03
5
K
arim
nag
ar*
2++
--
--
-++
70
++
--
--
-++
15
--
++
85
Kha
mm
am1
++
--
--
-++
19
7-
--
--
--
--
-++
19
7
W
aran
gal
(1)
37
--
--
-3
72
17
53
--
--
--
--
--
37
21
75
3
28-23
IRON ORE
Ta
ble
– 6
(B
) :
Pro
du
cti
on
of
Iro
n O
re,
20
15
-16
(p
)
(By
Secto
rs/
Sta
tes/
Dis
tric
ts/G
ra
des)
(Qu
an
tity
in
’0
00
to
nn
es;
Va
lue
in
`’0
00
)
Lu
mp
sF
ines
Co
ncen
trate
sT
ota
l
Sec
tor/
N
o.
of
Sta
te/
m
ines
Bel
ow
55
%-
58
%-
60
%-
62
%-
65
%
To
tal
Bel
ow
55
%-
58
%-
60
%-
62
%-
65
%T
ota
l
Dis
tric
t5
5%
bel
ow
bel
ow
bel
ow
bel
ow
Fe
&5
5%
bel
ow
bel
ow
bel
ow
bel
ow
Fe
&
Fe
58
%6
0%
62
%6
5%
ab
ov
eQ
tyV
alue
Fe
58
% 6
0%
62
%6
5%
ab
vo
eQ
tyV
alue
Qty
Val
ue
Qty
Val
ue
Fe
Fe
Fe
Fe
Fe
Fe
Fe
Fe
Ind
ia2
97
(16
)1
68
51
05
33
04
46
42
72
91
04
12
44
85
37
61
10
15
43
17
54
61
88
23
36
64
22
28
28
43
64
61
50
91
10
10
58
11
80
71
11
01
09
11
54
39
34
1
55910
221158219
Pu
bli
c S
ecto
r3
4(1
)6
14
01
83
24
66
13
35
96
48
72
26
41
44
25
89
24
82
77
71
81
71
29
25
17
19
45
20
23
79
97
46
97
89
52
--
60
63
89
12
37
87
6
Pri
vat
e S
ecto
r2
63
(15
)1
67
99
13
28
61
39
61
15
74
55
96
13
11
20
57
28
42
51
45
36
74
56
48
25
99
03
26
45
29
88
96
30
61
71
09
21
58
10
91
15
43
93
49
52
72
12
99
20
34
3
An
dh
ra P
rad
esh
25
(1)
31
3-
--
--
31
32
27
95
81
81
--
--
-1
81
55
75
3-
-4
94
28
37
11
A
nan
tap
ur
22
5-
--
--
25
12
08
3-
--
--
--
--
-2
51
20
83
C
ud
dap
ah5
16
7-
--
--
16
71
14
65
61
55
--
--
-1
55
40
96
2-
-3
22
15
56
18
K
rish
na
1-
--
--
--
-++
--
--
-++
10
2-
-++
10
2
K
urn
oo
l1
5(1
)7
6-
--
--
76
70
93
52
6-
--
--
26
14
68
9-
-1
02
85
62
4
N
ello
re1
45
--
--
-4
53
02
84
--
--
--
--
--
45
30
28
4
P
rakas
am*
1-
--
--
--
--
--
--
--
--
--
-
Ch
ha
ttis
ga
rh
15
21
69
17
32
38
26
79
59
36
92
33
23
43
01
31
20
92
09
12
68
77
02
05
33
21
53
59
25
43
82
46
--
24
59
24
88
68
37
7
B
asta
r*1
--
--
--
--
--
--
--
--
--
--
D
ante
war
a3
--
-2
40
55
70
06
10
71
68
80
87
54
76
05
84
51
65
49
03
10
72
31
89
33
29
3-
-1
68
30
35
81
41
68
D
urg
5-
-8
20
52
24
72
28
26
88
57
94
79
1-
--
20
14
16
83
28
43
98
15
54
52
44
--
66
69
11
34
00
35
K
anker
44
18
53
27
26
81
63
31
41
10
8-
20
48
13
51
45
35
66
43
75
6-
-5
19
95
78
66
R
ajnan
dgao
n2
17
58
31
24
1-
27
54
40
35
51
97
13
11
41
37
++
29
93
15
95
3-
-5
74
75
63
08
Go
a7
1(1
)1
44
68
44
31
-2
60
37
96
08
39
45
98
33
11
49
47
-1
51
91
73
26
37
--
17
79
21
12
24
5
N
ort
h G
oa
33
71
42
1-
15
23
45
38
92
02
03
81
5-
18
21
48
37
2-
-1
97
17
18
25
S
ou
th G
oa
38
(1)
13
76
7-
41
--
24
53
56
15
53
05
57
83
11
11
13
2-
13
37
15
84
26
5-
-1
58
21
94
04
20
Jh
ark
han
d1
81
80
27
84
21
48
62
82
88
30
61
93
62
81
35
08
71
35
64
03
68
34
76
92
94
81
28
83
98
10
37
9-
-1
90
76
16
09
17
29
S
ing
hb
hu
m (
Wes
t)1
81
80
27
84
21
48
62
82
88
30
61
93
62
81
35
08
71
35
64
03
68
34
76
92
94
81
28
83
98
10
37
9-
-1
90
76
16
09
17
29
Ka
rna
tak
a5
99
03
45
46
52
06
74
54
44
72
79
83
16
68
32
94
44
32
83
62
47
77
32
53
80
71
49
17
03
72
01
19
61
8-
-2
50
20
36
80
29
12
B
agal
ko
t*2
--
--
--
--
--
--
--
--
--
--
B
alla
ri4
69
03
37
35
61
34
54
44
14
72
70
41
15
04
60
07
42
97
44
22
72
73
17
35
76
14
91
44
87
18
38
26
60
--
21
52
83
34
28
66
7
C
hit
radurg
a7
-8
10
97
22
10
3-
94
21
63
72
87
14
20
92
20
58
23
1-
25
50
17
36
95
8-
-3
49
23
37
42
45
T
um
akuru
*4
--
--
--
--
--
--
--
--
--
--
`C
on
td..
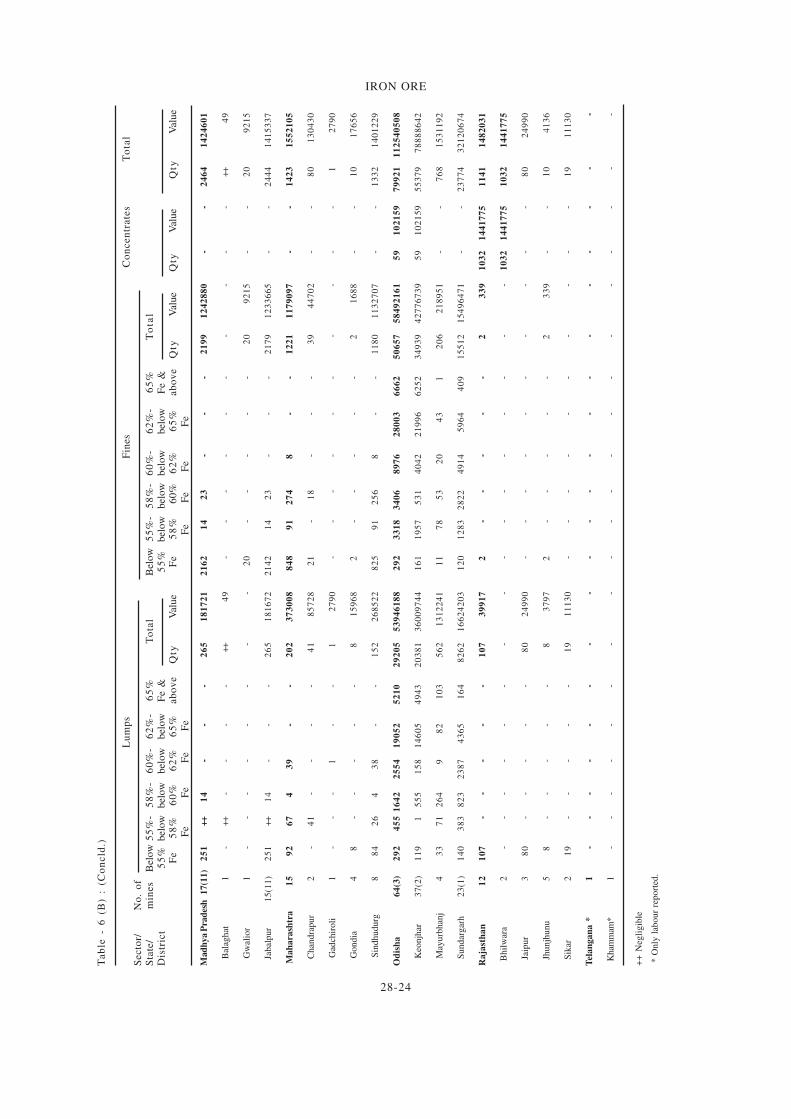
28-24
IRON ORET
ab
le -
6 (
B)
: (C
on
cld
.)
Lu
mp
sF
ines
Co
ncen
trate
sT
ota
lS
ecto
r/N
o.
of
Sta
te/
min
es
Bel
ow
55
%-
58
%-
60
%-
62
%-
65
%
To
tal
Bel
ow
55
%-
58
%-
60
%-
62
%-
65
%T
ota
lD
istr
ict
55
%bel
ow
bel
ow
bel
ow
bel
ow
Fe
&5
5%
bel
ow
bel
ow
bel
ow
bel
ow
Fe
&F
e5
8%
60
%6
2%
65
%ab
ov
eQ
tyV
alue
Fe
58
% 6
0%
62
%6
5%
ab
ov
eQ
tyV
alue
Qty
Val
ue
Qty
Val
ue
F
e
F
e
Fe
F
eF
e
Fe
Fe
Fe
Mad
hya P
rad
esh
1
7(1
1)
25
1++
14
--
-2
65
18
17
21
21
62
14
23
--
-2
19
91
24
28
80
--
24
64
14
24
60
1
B
alag
hat
1-
++
--
--
++
49
--
--
--
--
--
++
49
G
wal
ior
1-
--
--
--
-2
0-
--
--
20
92
15
--
20
92
15
Ja
bal
pu
r1
5(1
1)
25
1++
14
--
-2
65
18
16
72
21
42
14
23
--
-2
17
91
23
36
65
--
24
44
14
15
33
7
Mah
ara
shtr
a1
59
26
74
39
--
20
23
73
00
88
48
91
27
48
--
12
21
11
79
09
7-
-1
42
31
55
21
05
C
han
dra
pur
2-
41
--
--
41
85
72
82
1-
18
--
-3
94
47
02
--
80
13
04
30
G
adch
iro
li1
--
-1
--
12
79
0-
--
--
--
--
-1
27
90
G
ondia
48
--
--
-8
15
96
82
--
--
-2
16
88
--
10
17
65
6
S
indhudurg
88
42
64
38
--
15
22
68
52
28
25
91
25
68
--
11
80
11
32
70
7-
-1
33
21
40
12
29
Od
ish
a6
4(3
)2
92
45
51
64
22
55
41
90
52
52
10
29
20
55
39
46
18
82
92
33
18
34
06
89
76
28
00
36
66
25
06
57
58
49
21
61
59
10
21
59
79
92
11
12
54
05
08
K
eonjh
ar3
7(2
)1
19
15
55
15
81
46
05
49
43
20
38
13
60
09
74
41
61
19
57
53
14
04
22
19
96
62
52
34
93
94
27
76
73
95
91
02
15
95
53
79
78
88
86
42
M
ayu
rbh
anj
43
37
12
64
98
21
03
56
21
31
22
41
11
78
53
20
43
12
06
21
89
51
--
76
81
53
11
92
S
undar
gar
h2
3(1
)1
40
38
38
23
23
87
43
65
16
48
26
21
66
24
20
31
20
12
83
28
22
49
14
59
64
40
91
55
12
15
49
64
71
--
23
77
43
21
20
67
4
Ra
jast
ha
n1
21
07
--
--
-1
07
39
91
72
--
--
-2
33
91
03
21
44
17
75
11
41
14
82
03
1
B
hil
war
a2
--
--
--
--
--
--
--
--
10
32
14
41
77
51
03
21
44
17
75
Ja
ipu
r3
80
--
--
-8
02
49
90
--
--
--
--
--
80
24
99
0
Jh
un
jhu
nu
58
--
--
-8
37
97
2-
--
--
23
39
--
10
41
36
S
ikar
21
9-
--
--
19
11
13
0-
--
--
--
--
-1
91
11
30
Tel
an
gan
a *
1-
--
--
--
--
--
--
--
--
--
-
K
ham
mam
*1
--
--
--
--
--
--
--
--
--
--
++
Neg
lig
ible
* O
nly
lab
our
report
ed.
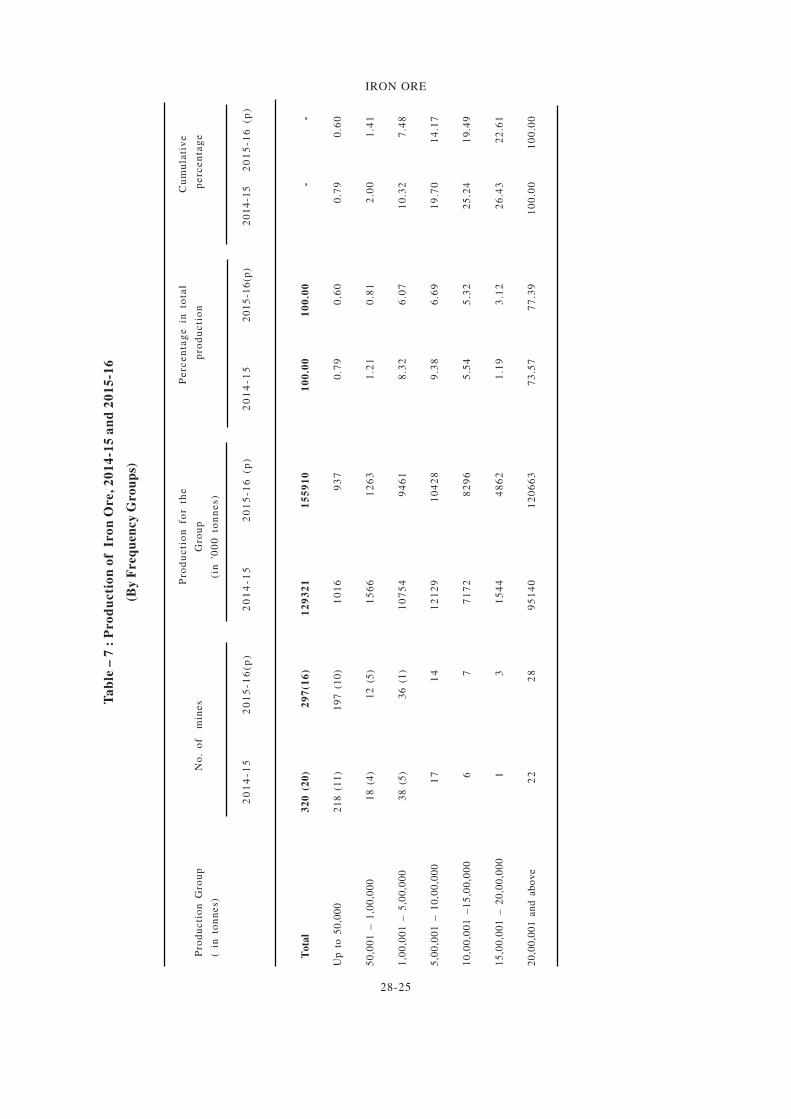
28-25
IRON ORE
Ta
ble
– 7
: P
ro
du
cti
on
of
Iro
n O
re,
20
14
-15
an
d 2
01
5-1
6
(By
Freq
uen
cy
Gro
up
s)
Pro
du
cti
on
fo
r th
eP
erc
en
tag
e i
n t
ota
lC
um
ula
tiv
e
P
rod
uc
tio
n G
rou
pN
o.
of
min
es
Gro
up
pro
du
cti
on
pe
rce
nta
ge
(
in t
on
ne
s)(i
n '
00
0 t
on
ne
s)
20
14
-15
20
15
-16
(p)
20
14
-15
20
15
-16
(p
)2
01
4-1
52
01
5-1
6(p
)
2
01
4-1
52
01
5-1
6 (p
)
T
ota
l3
20
(2
0)
29
7(1
6)
12
93
21
15
59
10
10
0.0
01
00
.00
--
Up
to
50
,00
02
18
(1
1)
19
7 (
10
)1
01
69
37
0.7
90
.60
0.7
90
.60
50
,00
1 –
1,0
0,0
00
18
(4
)1
2 (
5)
15
66
12
63
1.2
10
.81
2.0
01
.41
1,0
0,0
01
– 5
,00
,00
03
8 (
5)
36
(1
)1
07
54
94
61
8.3
26
.07
10
.32
7.4
8
5,0
0,0
01
– 1
0,0
0,0
00
17
14
12
12
91
04
28
9.3
86
.69
19
.70
14
.17
10
,00
,00
1 –
15
,00
,00
06
77
17
28
29
65
.54
5.3
22
5.2
41
9.4
9
15
,00
,00
1 –
20
,00
,00
01
31
54
44
86
21
.19
3.1
22
6.4
32
2.6
1
20
,00
,00
1 a
nd
ab
ov
e2
22
89
51
40
12
06
63
73
.57
77
.39
10
0.0
01
00
.00
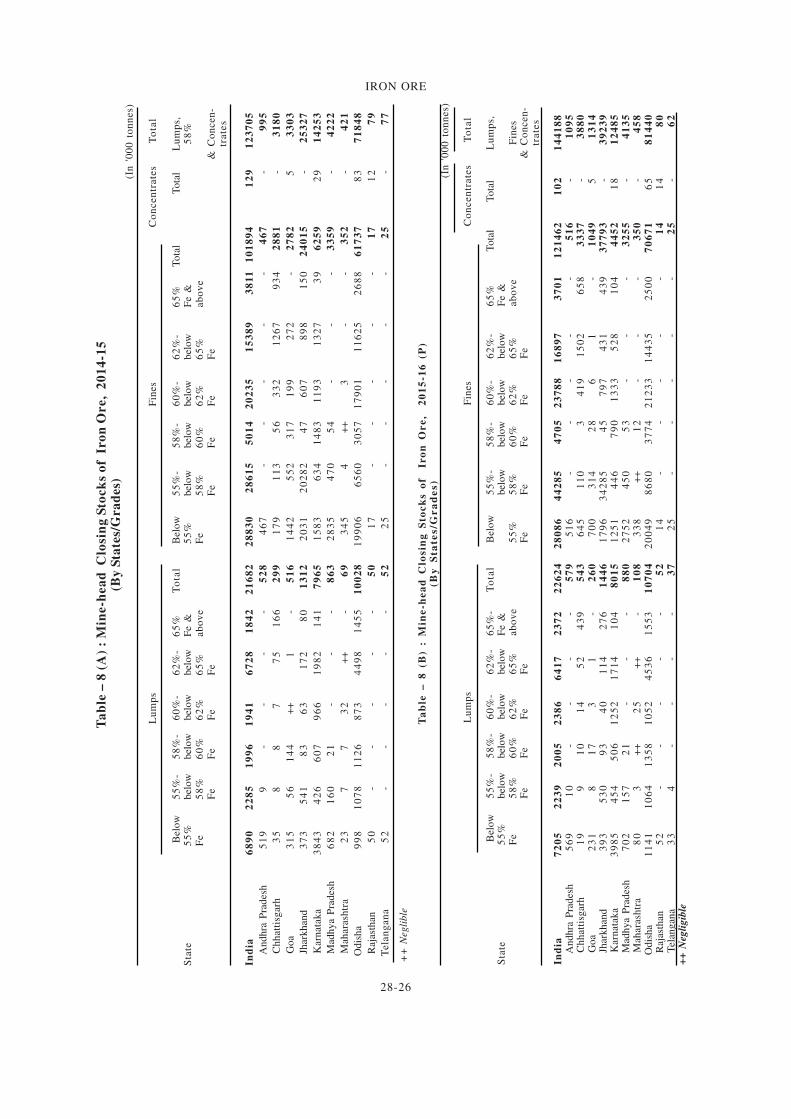
28-26
IRON ORE
Ta
ble
– 8
(A
) :
Min
e-h
ea
d C
losi
ng
Sto
ck
s o
f I
ro
n O
re,
20
14
-15
(By
Sta
tes/
Gra
des)
(In
'0
00
to
nn
es)
Lu
mp
sF
ines
Co
ncen
trate
sT
ota
l
Bel
ow
55
%-
58
%-
60
%-
62
%-
65
%T
ota
lB
elow
55
%-
58
%-
60
%-
62
%-
65
% T
ota
l
To
tal
Lu
mp
s,S
tate
55
%bel
ow
bel
ow
bel
ow
bel
ow
Fe
&5
5%
bel
ow
bel
ow
bel
ow
bel
ow
Fe
&5
8%
Fe
58
%6
0%
62
%6
5%
ab
ov
eF
e5
8%
60
%6
2%
65
%ab
ov
eF
eF
eF
eF
eF
eF
eF
eF
e&
Co
ncen
-tr
ate
s
Ind
ia6
89
02
28
51
99
61
94
16
72
81
84
22
16
82
28
83
02
86
15
50
14
20
23
51
53
89
38
11
10
18
94
12
91
23
70
5
A
nd
hra
Pra
des
h5
19
9-
--
-5
28
46
7-
--
--
46
7-
99
5
C
hh
atti
sgar
h3
58
87
75
16
62
99
17
91
13
56
33
21
26
79
34
28
81
-3
18
0
Go
a3
15
56
14
4+
+1
-5
16
14
42
55
23
17
19
92
72
-2
78
25
33
03
J
har
kh
and
37
35
41
83
63
17
28
01
31
22
03
12
02
82
47
60
78
98
15
02
40
15
-2
53
27
K
arn
atak
a3
84
34
26
60
79
66
19
82
14
17
96
51
58
36
34
14
83
11
93
13
27
39
62
59
29
14
25
3
M
adh
ya
Pra
des
h6
82
16
02
1-
--
86
32
83
54
70
54
--
-3
35
9-
42
22
M
ahar
ash
tra
23
77
32
++
-6
93
45
4+
+3
--
35
2-
42
1
O
dis
ha
99
81
07
81
12
68
73
44
98
14
55
10
02
81
99
06
65
60
30
57
17
90
11
16
25
26
88
61
73
78
37
18
48
R
ajas
than
50
--
--
-5
01
7-
--
--
17
12
79
Tela
ng
an
a5
2-
--
--
52
25
--
--
-2
5-
77
++
Neg
lible
Ta
ble
–
8
(B
) :
Min
e-h
ea
d C
losin
g S
toc
ks o
f Ir
on
O
re
, 2
01
5-1
6 (P
)(B
y S
tate
s/G
ra
de
s)
(In
'0
00
to
nn
es)
Lu
mp
sF
ines
Co
ncen
trate
sT
ota
l
Bel
ow
55
%-
58
%-
60
%-
62
%-
65
%-
To
tal
Bel
ow
55
%-
58
%-
60
%-
62
%-
65
%
T
ota
l
To
tal
Lu
mp
s,S
tate
55
%bel
ow
bel
ow
bel
ow
bel
ow
Fe
&bel
ow
bel
ow
bel
ow
bel
ow
Fe
&F
e5
8%
60
%6
2%
65
%ab
ov
e5
5%
58
%6
0%
62
%6
5%
ab
ov
eF
ines
Fe
Fe
Fe
Fe
Fe
Fe
Fe
Fe
Fe
& C
on
cen
-tr
ate
s
Ind
ia7
20
52
23
92
00
52
38
66
41
72
37
22
26
24
28
08
64
42
85
47
05
23
78
81
68
97
37
01
12
14
62
10
21
44
18
8
An
dh
ra P
rad
esh
56
91
0-
--
-5
79
51
6-
--
--
51
6-
10
95
C
hh
atti
sgar
h1
99
10
14
52
43
95
43
64
51
10
34
19
15
02
65
83
33
7-
38
80
Go
a2
31
81
73
1-
26
07
00
31
42
86
1-
10
49
51
31
4
Jh
ark
han
d3
93
53
09
34
01
14
27
61
44
61
79
63
42
85
45
79
74
31
43
93
77
93
-3
92
39
K
arn
atak
a3
98
54
54
50
61
25
21
71
41
04
80
15
12
51
44
67
90
13
33
52
81
04
44
52
18
12
48
5
Mad
hy
a P
rad
esh
70
21
57
21
--
-8
80
27
52
45
05
3-
--
32
55
-4
13
5
Mah
aras
htr
a8
03
++
25
++
-1
08
33
8+
+1
2-
--
35
0-
45
8
Odis
ha
11
41
10
64
13
58
10
52
45
36
15
53
10
70
42
00
49
86
80
37
74
21
23
31
44
35
25
00
70
67
16
58
14
40
R
ajas
than
52
--
--
-5
21
4-
--
--
14
14
80
T
elan
gan
a3
34
--
--
37
25
--
--
-2
5-
62
++
Neg
ligib
le
28-27
IRON ORE
MINING, MARKETING &
TRANSPORT
Iron ore mining is carried out by opencast
method by manual , semi-mechanised and
mechanised operations.
The method of mining and deployment of
machinery vary from place to place depending
upon characteristics of iron ore as per geological
set up. Large mechanised mines are mostly in the
Public Sector. Manual and semi-mechanised mines
are mainly in Private Sector. Some mechanised
mines in Goa, Jharkhand and Odisha are also
operated by the Private Sector.
Manual Mines
Generally, these mines are confined to float
ores where mining is done by digging the ore with
pick axes, crow bars, chisels and spades. The
mined material is screened manually to separate
+10 mm float ore which is then stacked separately.
The waste is backfilled into the pits. In some reef
workings, 35-40 mm diameter holes are drilled to
0.6 m depth by hand-held jackhammers at a
spacing of about 0.6 m and each hole is charged
with 150-200 g gunpowder or special gelatine
cartridges. Blasted tonnage per kg gunpowder
is usually 2.5-3 tonnes. Blasted ore is manually
loaded into trucks for transport to either railway
sidings or to buyer's destination directly. Output
per man shift (OMS) is normally between 1.5 and
2 tonnes.
Mechanised Mines
Most of the mechanised mines are captive
belongings of different steel plants and have been
developed to cater to specific requirements.
Mining is done by formation of systematic
benches in overburden and ore. The height of the
benches normally varies from 10 to 12 m and width
up to 20 m in the ore. Drilling holes of 300 mm
diameter and till 12 m depth by crawler drills and
use of explosives, such as, ANFO, SMS and
emulsion explosives for blasting are in practice.
Loading is done by earth-moving machinery
powered by diesel or electric engines, such as,
hydraulic excavators in the range from 1.9 cu m to
10 cu m. Ripper dozers and motor graders are also
deployed for excavation and levelling purposes.
In some Goan mines , where o re i s
predominantly in powdery form, hydraulic shovels
with boom height of 9 m are used for excavation
and loading. Heavy-duty Ripper-Dozers are
preferred for mining as Goan ores are soft. Height
of the benches is restricted to 7 m for safe and
efficient operations. Width of working benches is
maintained at more than 15 m and bench slope is
maintained at about 80o. The ore produced is
transported to short distances by dumpers up to
40-tonne capacity. For longer distances and barge
loading, dumpers/trucks up to 10-tonne capacity
are used. The barges carry the ore to harbours.
The ore from the barges is loaded to ships either
through berth or through transshippers.
Almost all the Public Sector mines including
Kiriburu, Barsua, Gua, Bailadila, Donimalai, Daitari
and Dalli-Rajhara operated by SAIL, NMDC and
OMC are fully mechanised. Kudremukh iron ore
mine of KIOCL closed since December 2005 was
also mechanised. In Private Sector, mines operated
in Goa region and Tata Steel's captive mines are
mechanised. Approximately, 90% i ron ore
production comes from mechanised mines. NMDC
operates a couple of large mechanised iron ore mines
in the country at Bailadila (Chhattisgarh) and
Donimalai (Karnataka). With a strategic vision to
augment production, the development of Deposit
11B mine at an enhanced capacity of 7.0 million
tonnes ROM per annum has been taken up.The
development of Kumaraswamy Iron Ore Mine with
capacity of 7.0 million tonnes per annum is being
taken up.The entire project is being executed through
six packages. Orders have been placed for all the
packages and the major works have been completed.
To augment the production capacity of Kirandul
complex, construction of 12.0 million tpy screening
plant with loading facilities is envisaged. This
plant caters to both Deposit 11-B & Deposit 14 of
Kirandul complex. The entire project has been
planned to be executed in seven packages.
The processing of iron ore in the country
involves crushing, screening, washing and in some
cases beneficiation and agglomeration. Crushing
and screening are adopted mainly for sizing the
28-28
IRON ORE
ore and also for removing the adherent gangue
minerals. Dry and wet grinding is also resorted to
in some cases.
The lumps and fines of iron ore are marketed
after washing, screening and beneficiation. Fines
are converted into sinters for use in steel plants
while pellets made from concentrates/fines are
predominantly exported and also are utilised for
internal consumption in sponge iron units.
ENVIRONMENTAL FACTORS
Afforestation, waste dump management, top
soil management, management of sub-grade
minera l s , mechanica l benef ic ia t ion , dus t
suppression, monitoring of water & air quality,
vibration survey, publicity and propaganda are
some common environmental restoration efforts
pursued by all mechanised and semi-mechanised
iron ore mines. Mining and beneficiation of ores
carried out on large-scale cause environmental
problems. A specific problem in iron ore mining
is the disposal of tailings and other deleterious
silica minerals and phosphorous. To safeguard
the env i ronment and preven t eco log ica l
degradation, thrust has been laid on green belt
deve lopment , so l id was te management ,
monitoring of liquid & air effluents and other
crucial environmental parameters.
Goa region is prone to siltation of agricultural
fields, nallahs, riverbeds and creeks due to wash
off from iron ore dumps in rainy season. Loss in
crop yield and reduction in fish population in
streams and navigation diff icul t ies are the
problems caused by silting. To overcome these
problems, check dams and water filter beds at
higher contours have been constructed. Tailing
ponds are also being maintained at some mines.
Afforestation is the mainstay in reclaiming the
mined out areas in Goa. In a few cases, pits are
used as water reservoir for pisciculture.
In Ballari-Hosapete area, Karnataka, dust
concentration (suspended particulate matter) is
the main environmental problem. Environmental
concerns had led to closing down of mining
operations at Kudremukh iron ore mine of KIOCL
in December 2005, in compliance with the order
passed by the Hon'ble Supreme Court in this
regard. In Bailadila Sector, Chhattisgarh, forest
is fairly widespread and dense, supported by
good rainfall and rich flora and fauna. The
deforestation taking place due to mining and
was te dumping needs to be compensa ted
continuously by afforestation at suitable slopes
and in township a reas . In Jharkhand ,
afforestation of land is the main recourse adopted
for rec lamat ion of degraded lands o r
improvement in land uses.
INDUSTRY
Iron ore is the basic raw material used for
making pig iron, sponge iron and finished steel.
The iron ore is used mainly in blast furnaces, mini-
blast furnaces (MBF), DRI & sintering and
pelletisation plants.
Pelletisation
In general, the pelletisation process involves
mixing of iron ore and required limestone with
water which later is ground in ball mills to the
desired size. The discharged slurry from ball mills
is filtered in pressure filters. The filter cake from
filters is then mixed with dry-ground coke fines
to which bentonite is mixed in suitable proportion
to form green pellets in pelletising discs. The coke
fines and bentonite are ground separately.The
green pellets are then dried, heated and fired in
indurating machine to produce iron ore pellets.
There is an increasing trend for utilisation of
pellets or sinters in the recent years. The use of
pellets as feed in the blast furnace has several
advantages because of their uniform size, known
composition and strength. Iron ore pellet is a kind
of agglomerated fines which has better tumbling
index as compared to that of parent ore and can be
used as a substitute used in blast furnaces in
countries where lump ore is not available.
28-29
IRON ORE
The twenty pelletisation plants in the country,
about which information is available have a total
capacity of 59.30 million tonnes per annum. The JSW
Steel Ltd has a manufacturing capacity of 9.2 million
tonnes of pellets annually at Vijayanagar. The pellet
production unit consists of India’s first dry process
pelletising plant, ideally suited for the soft iron ore
of Ballari-Hosapete region. Amba River Coke Limited
a wholly subsidiary Company of JSW Steel has set
up a 4 million tpy pellet plant at Dolvi.
Jindal Steel & Power Ltd has a total installed
capacity of 9 MTPA pellet plant at Barbil for
production of different grades of pellets. The plant
includes dry grinding facility that harnesses
recuperation type of straight grate technology.
Essar Steel Pelletisation plant at Visakhapatnam
has installed capacity of 8 million tonnes per annum.
The plant receives iron ore slurry which after
pelletisation is provided as vital raw material for their
steel plant at Hazira (Gujarat). Setting up of
integrated pelletisation facility of 12 million tpy is
under progress at Paradip, Odisha, and is
implemented in two phases by Essar Steel.
Successful commissioning of Phase I (6 million tpy)
has been completed, while the second phase is
under construction. The Ist Phase pellet plant at
Paradip has an assured supply of high-quality iron
ore from the beneficiation plant at Dabuna. The
plant's proximity to the Paradip port ensures
expeditious shipment of pellets to their steel plant
in Hazira. After completion of second phase, the
capacity of pellet plant at Paradip, Odisha, would
get scaled up to 12 million tpy and the total pellet
plant capacity of the Company would get augmented
to 20 million tpy.
NMDC is in the process of setting up two pellet
plants, one at Donimalai in Karnataka with 1.2 million
tpy capacity by using slimes of tailing dam of
Donimalai and the second at Nagarnar with 2 million
tpy capacity, along with 2 million tpy beneficiation
plant at Bacheli interconnected by a slurry pipeline
between Bacheli and Nagarnar in Chhattisgarh.
The construction of the above said 1.2 MTPA
Pellet Plant at Donimalai has been completed and
trial production is said to have commenced.
Regarding the 2 MTPA Pellet Plant at Nagarnar, all
the statutory clearances have been received and site
development work has begun. Statutory clearances
for slurry pipeline system and Ore processing plant
at Bacheli are at various stages of completion.
As a diversification measure, the Government
approved the construction of a 3 million tonnes per
year capacity pellet plant in Mangaluru in May, 1981.
The capacity of the pellet plant was enhanced to 3.5
million tonnes with additions/modifications. The
plant went into commercial production in 1987 and is
now catering to both domestic and international
customer.
The following Memoranda of Understanding
(MoU) regarding pellet plant were signed in the
presence of Hon’ble Prime Minister, Hon’ble Minister
for Steel & Mines and the Chief Minister,
Chhattisgarh on 09th May, 2015 :
1. An MoU was signed between Government
of Chhattisgarh and NMDC for slurry pipeline and
2MTPA pellet plant at Nagarnar in Bastar District
involving an investment of ̀ 4,000 crore.
2. An MoU was signed between Government
of Chhattisgarh and SAIL for setting up 1 MTPA
pellet plant at Dalli-Rajhara, Balod District with an
investment of ` 826 crore.
The installation of a 1.8 MTPY pelletisation
plant by M/s Monnet Ispat and Energy Ltd has been
completed and is at commissioning stage.
To ensure gainful use of the extra-fine iron ore
fines which are generated while mining and
processing, Tata Steel has implemented a 6 million
tpy pelletising plant in Jamshedpur with capabilities
to convert these fines into pellets for use as
replacement of iron ore lumps as a blast furnace feed.
This not only is aimed at contributing significantly
to energy savings in the blast furnace operations
but also at cutting the cost of operations. The
Eastern region accounts for 55% of the total number
of iron ore pellet units in the country, the rest 45% is
equally divided between the Southern and Western
part. The Northern region is devoid of any presence
as far as the Iron Ore Pellet Industry is concerned –
a key feature of this Industry, which is in sync with
the pattern of spread of the Indian Sponge Iron
Industry.
Steel plants are likely to increase usage of pellets
in their production process to reduce pollution and
increase productivity. Moreover, the forecast of spike
in growth in Infrastructure, Real Estate and
Automobile Sectors in the ensuing years is expected
to augment demand for steel, which in turn would
raise the demand and prices of pellets in the near
future.
To encourage beneficiation and pelletisation of
iron ore fines in the country, basic customs duty
(Import Duty on Iron Ore @ 2.5 % ) on the plants
28-30
IRON ORE
Sintering
In sintering process, iron ore fines, other
iron bearing wastes and coke dust are blended
and combusted. The heat fuses the fines into
course lumps that can be charged to a blast
furnace. The twenty-six sintering plants in the
country, about which information is available,
have a total capacity of about 70.05 million tonnes
per annum. Most of the Integrated Steel Plants
(ISP) in the country have their own sintering
plants. Sinter plants receive raw material mostly
from their captive mines. Steel Authority of India
Ltd (SAIL) had started its commercial production
in December 2012 at IISCO steel plant in West
Bengal, with a capacity of 3.8 million tonnes per
annum.The installation of a 0.75 MTPY sinter
plant by M/s Monnet Ispat and Energy Ltd has
been completed and is at commissioning stage.
Pellets along with sinters have resulted in growth
in utilisation of iron ore fines and blue dust.
Information on capacity and production of pellets
and sintering plants is provided in Table-9.
Pig Iron
Pig iron is one of the basic raw materials
required by Foundry and Casting Industry for
manufacturing various types of castings for the
engineering sect ion.The post- l iberal isat ion
regime has witnessed Expression of Interest from
a large number of entrepreneurs for setting up
mini-blast furnaces for production of hot metal/
pig iron. Commissioned pig iron units are mostly
of stand-alone type.
KIOCL also has its Pig Iron Complex (Blast
Furnace Unit) at Mangaluru for manufacturing
and supplying pig iron of Foundry Grade to the
domestic market. However, the operation of this
Unit is kept under suspension since 2009 due to
negative contribution.
India is an important producer of pig iron. The
production for sale of pig iron in the country in
2015-16 was 9 .228 mi l l ion tonnes . Pos t -
liberalisation, with setting up of several units in
the Pr iva te Sec tor , no t on ly impor t s have
drastically reduced but also India has turned out
to be a net exporter of pig iron. The Private Sector
accounted for 92% of total production for sale of
pig iron in the country in 2015-16. The production
for sale of pig iron has increased from 1.6 million
tonnes in 1991-92 to 9.228 million tonnes in 2015-
16. As per National Steel Policy 2017, the demand
for pig iron for merchant use, such as for castings
and supplementary metallic in the electric arc or
induction furnaces, is projected to increase to 17
MT by 2030- 31.
Spong iron
India is the world's largest producer of sponge
iron or Direct Induced Iron (DRI) with a host of
coal-based units located in the mineral-rich states
of the country. Over the years, the coal-based
route has emerged as a key contributor and
accounted for 79% of the total sponge iron
production in the country in 2015-16 .The growth
of Sponge Iron Industry during the last few years
in terms of capacity has been substantial. The
installed capacity of sponge iron increased from
1.52 million tonnes per annum in 1990-91 to around
43 million tonnes in 2015-16. Production has
increased from 0.9 million tonnes in 1990-91 to 22.43
million tonnes in 2015-16. India has been the world’s
largest sponge iron producer every year since 2003.
As per National Steel Policy 2017, the demand for
sponge iron is projected to increase to 80 million
tonnes by 2030-31.
Sponge iron is a good substitute for scrap which
is required by the electric arc furnaces and induction
furnaces or mini-steel plants in the country. The
availability of indigenous metal scrap is scarce, and
therefore, to meet the domestic demand, scrap is
usually imported. Sponge iron is a viable alternative
for scrap and is produced by direct reduction of high-
grade iron ore or pellets to metallic iron ore in solid
state by using coal or natural gas as reductant. It is
also known as Direct Reduced Iron (DRI) or Hot
Briquetted Iron (HBI).
and equipment required for initial setting up or
for substantial expansion of iron ore pellets plants
and iron ore beneficiation plants has been reduced
from 7.5% to 2.5% w.e.f 17th March 2012. To ensure
easy availability of raw material in domestic market
at reasonable prices, export duty on iron ore at
30 % for >58% Fe iron ore and 0% for <58% Fe
iron ore and iron ore pellets was imposed.
28-31
IRON ORE
Iron & Steel
The details of the Iron & Steel Industry are
provided in the Review on "Iron & Steel and Scrap".
Ferro-alloys
Iron is an important constituent of ferro-alloys,
like ferro-manganese (high carbon, medium carbon
and low carbon), ferro-silicon, ferro-chrome (high
carbon and low carbon)/charge-chrome, ferro-
molybdenum, ferro-vanadium, ferro-tungsten, ferro-
silicon-magnesium, ferro-aluminium, ferro-silicon-
zirconium, ferro-titanium, etc. Ferro-alloys in turn are
either used in Steel Industries to impart some special
qualities or are exported. The details about the
Ferro-Alloys Industry are provided in the Review on
'Ferro-Alloys'.
Cement
Iron ore lumps and powder containing +58%
Fe, are normally used in the Cement Industry as they
improve burning properties, impart colour and
balance the composition of the mix. Further details
about the Cement Industry are provided in the
Review on 'Cement'.
Coal Washeries
Magnetite ore is used as heavy media in
coal washeries. As information available in Energy
Statistics 2016, there are 18 washeries for coking
coal and 34 washeries for non-coking coal with 29.69
million tpy and 101.55 million tpy installed capacity,
respectively. Details on coal washeries are provided
in the Review on 'Coal & Lignite'.
USES & SPECIFICATIONSIron ore is mainly used for manufacturing pig
iron, sponge iron and steel. It is also used in cement,
coal washeries, ferro-alloys, foundry, vanaspati and
glass industries. The specifications of iron ore
consumed by major sponge iron plants are furnished
in Table-10 and by major steel plants in Table-11.
Table – 9 : Installed Capacity & Production of Pellets/Sinters, 2015-16(By Plants)
(In '000 tonnes)
Name & location of plant Annual Production Iron ore fines General specifications ofinstalled consumed concentrates/fines usedcapacity
2014-15 2015-16 (P) 2014-15 2015-16 (P)
A) Pellet Plants
i) Rashmi Metaliks Ltd, 2100 969 1082 791 1723 1410 NA
Shyamraipur, Gokulpur,
West Midnapore, West Bengal
ii) JSW Steel Ltd, Vijaynagar Works, 9200 4710 5456 13602 14083 NA
Vidyanagar, Toranagally,
Ballari, Karnataka
iii) Arya Iron and Steel Company 1200 687 494 757 544 NA (AISCO) Barbil, Odisha
iv) Ardent Steel Ltd Phuljhar, 600 NA NA NA NA NA
Keonjhar, Odisha
v) Sarda Energy and Minerals Ltd, 600 NA 495 NA 769
Siltara Raipur, Chhattisgarh
(Contd.)
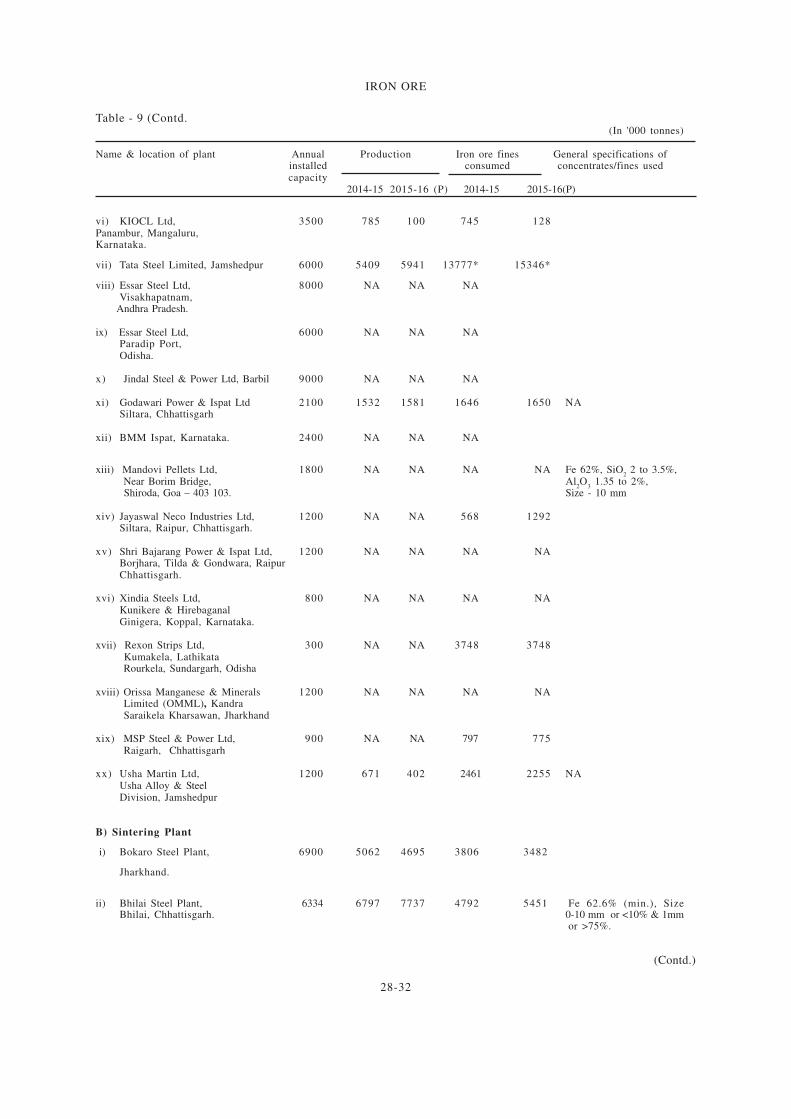
28-32
IRON ORE
Table - 9 (Contd.(In '000 tonnes)
Name & location of plant Annual Production Iron ore fines General specifications ofinstalled consumed concentrates/fines usedcapacity
2014-15 2015-16 (P) 2014-15 2015-16(P)
vi) KIOCL Ltd, 3500 785 100 745 128Panambur, Mangaluru,Karnataka.
vii) Tata Steel Limited, Jamshedpur 6000 5409 5941 13777* 15346*
viii) Essar Steel Ltd, 8000 NA NA NAVisakhapatnam,
Andhra Pradesh.
ix) Essar Steel Ltd, 6000 NA NA NAParadip Port,Odisha.
x) Jindal Steel & Power Ltd, Barbil 9000 NA NA NA
xi) Godawari Power & Ispat Ltd 2100 1532 1581 1646 1650 NASiltara, Chhattisgarh
xii) BMM Ispat, Karnataka. 2400 NA NA NA
xiii) Mandovi Pellets Ltd, 1800 NA NA NA NA Fe 62%, SiO2 2 to 3.5%,
Near Borim Bridge, Al2O
3 1.35 to 2%,
Shiroda, Goa – 403 103. Size - 10 mm
xiv) Jayaswal Neco Industries Ltd, 1200 NA NA 568 1292Siltara, Raipur, Chhattisgarh.
xv) Shri Bajarang Power & Ispat Ltd, 1200 NA NA NA NABorjhara, Tilda & Gondwara, RaipurChhattisgarh.
xvi) Xindia Steels Ltd, 800 NA NA NA NAKunikere & HirebaganalGinigera, Koppal, Karnataka.
xvii) Rexon Strips Ltd, 300 NA NA 3748 3748 Kumakela, Lathikata Rourkela, Sundargarh, Odisha
xviii) Orissa Manganese & Minerals 1200 NA NA NA NA Limited (OMML), Kandra Saraikela Kharsawan, Jharkhand
xix) MSP Steel & Power Ltd, 900 NA NA 797 775 Raigarh, Chhattisgarh
xx) Usha Martin Ltd, 1200 671 402 2461 2255 NAUsha Alloy & SteelDivision, Jamshedpur
B) Sintering Plant
i) Bokaro Steel Plant, 6900 5062 4695 3806 3482
Jharkhand.
ii) Bhilai Steel Plant, 6334 6797 7737 4792 5451 Fe 62.6% (min.), SizeBhilai, Chhattisgarh. 0-10 mm or <10% & 1mm
or >75%.
(Contd.)
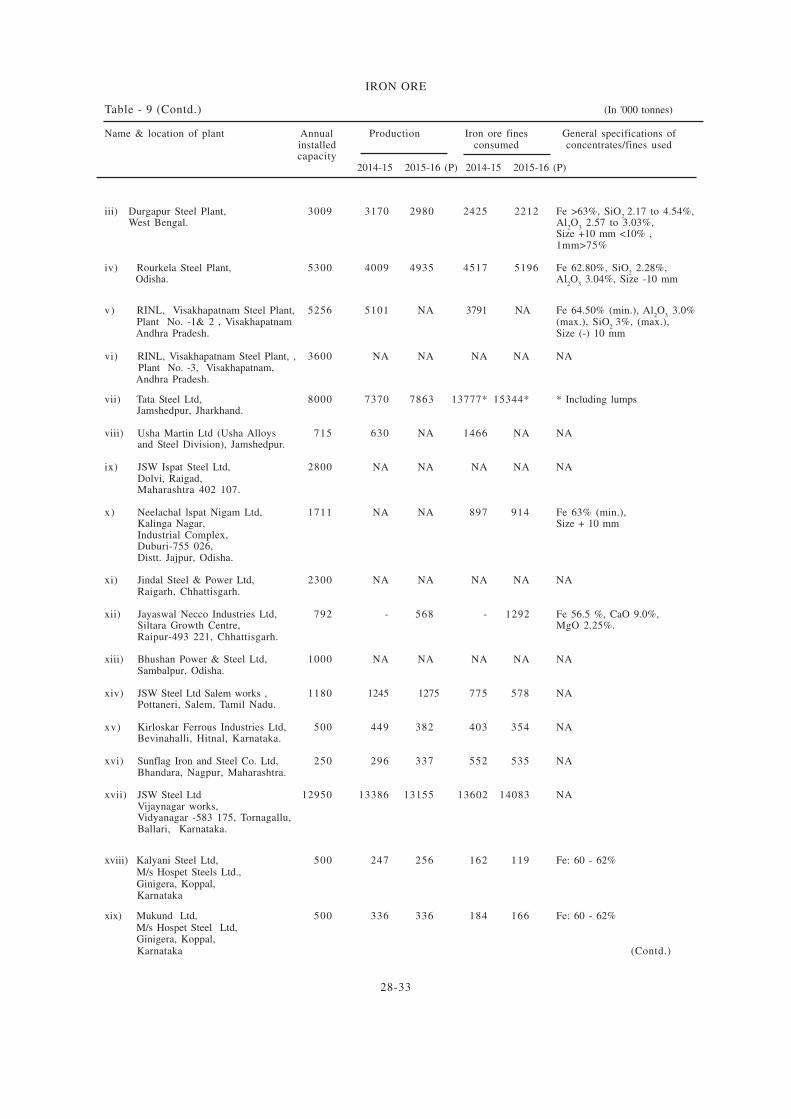
28-33
IRON ORE
Table - 9 (Contd.) (In '000 tonnes)
Name & location of plant Annual Production Iron ore fines General specifications ofinstalled consumed concentrates/fines usedcapacity
2014-15 2015-16 (P) 2014-15 2015-16 (P)
iii) Durgapur Steel Plant, 3009 3170 2980 2425 2212 Fe >63%, SiO2
2.17 to 4.54%,West Bengal. Al
2O
3 2.57 to 3.03%,
Size +10 mm <10% ,1mm>75%
iv) Rourkela Steel Plant, 5300 4009 4935 4517 5196 Fe 62.80%, SiO2 2.28%,
Odisha. Al2O
3 3.04%, Size -10 mm
v) RINL, Visakhapatnam Steel Plant, 5256 5101 NA 3791 NA Fe 64.50% (min.), Al2O
3 3.0%
Plant No. -1& 2 , Visakhapatnam (max.), SiO2
3%, (max.), Andhra Pradesh. Size (-) 10 mm
vi) RINL, Visakhapatnam Steel Plant, , 3600 NA NA NA NA NA Plant No. -3, Visakhapatnam,
Andhra Pradesh.
vii) Tata Steel Ltd, 8000 7370 7863 13777* 15344* * Including lumps Jamshedpur, Jharkhand.
viii) Usha Martin Ltd (Usha Alloys 715 630 NA 1466 NA NAand Steel Division), Jamshedpur.
ix) JSW Ispat Steel Ltd, 2800 NA NA NA NA NADolvi, Raigad,Maharashtra 402 107.
x) Neelachal lspat Nigam Ltd, 1711 NA NA 897 914 Fe 63% (min.),Kalinga Nagar, Size + 10 mmIndustrial Complex,Duburi-755 026,Distt. Jajpur, Odisha.
xi) Jindal Steel & Power Ltd, 2300 NA NA NA NA NARaigarh, Chhattisgarh.
xii) Jayaswal Necco Industries Ltd, 792 - 568 - 1292 Fe 56.5 %, CaO 9.0%,Siltara Growth Centre, MgO 2.25%.Raipur-493 221, Chhattisgarh.
xiii) Bhushan Power & Steel Ltd, 1000 NA NA NA NA NASambalpur, Odisha.
xiv) JSW Steel Ltd Salem works , 1180 1245 1275 775 578 NAPottaneri, Salem, Tamil Nadu.
xv) Kirloskar Ferrous Industries Ltd, 500 449 382 403 354 NABevinahalli, Hitnal, Karnataka.
xvi) Sunflag Iron and Steel Co. Ltd, 250 296 337 552 535 NABhandara, Nagpur, Maharashtra.
xvii) JSW Steel Ltd 12950 13386 13155 13602 14083 NAVijaynagar works,Vidyanagar -583 175, Tornagallu,Ballari, Karnataka.
xviii) Kalyani Steel Ltd, 500 247 256 162 119 Fe: 60 - 62% M/s Hospet Steels Ltd., Ginigera, Koppal, Karnataka
xix) Mukund Ltd, 500 336 336 184 166 Fe: 60 - 62% M/s Hospet Steel Ltd, Ginigera, Koppal, Karnataka (Contd.)
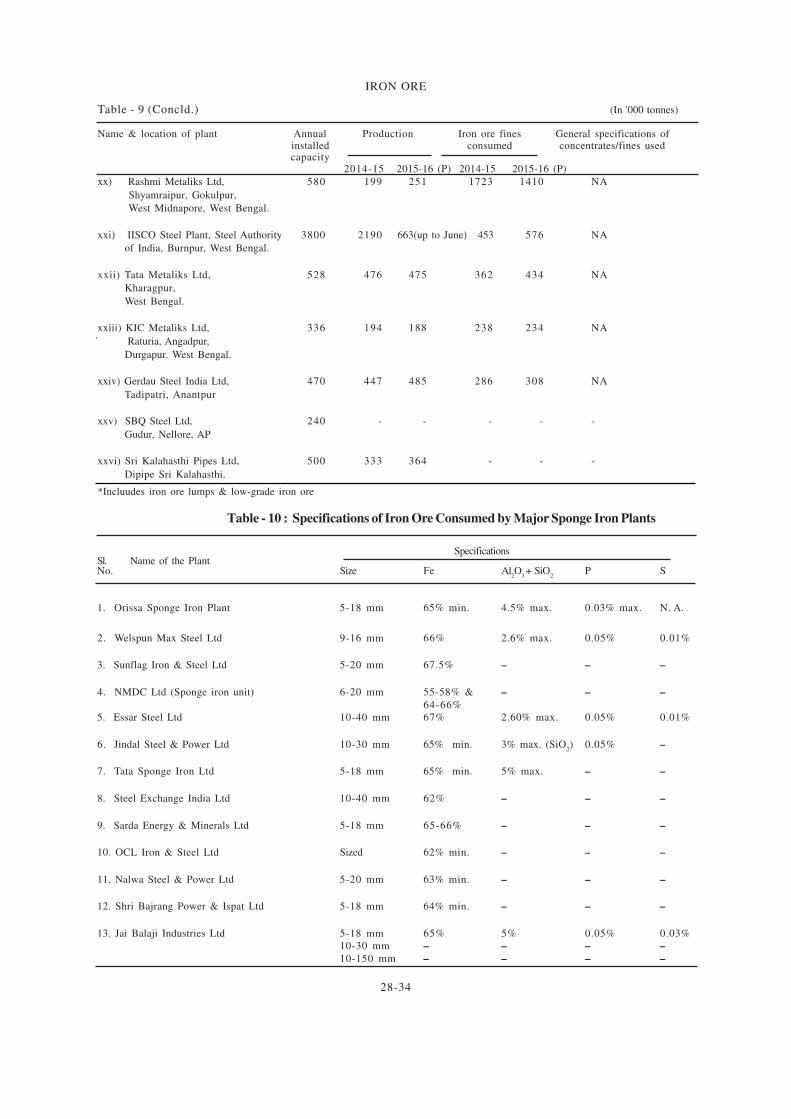
28-34
IRON ORE
Table - 9 (Concld.) (In '000 tonnes)
Name & location of plant Annual Production Iron ore fines General specifications ofinstalled consumed concentrates/fines usedcapacity
2014-15 2015-16 (P) 2014-15 2015-16 (P)
xx) Rashmi Metaliks Ltd, 580 199 251 1723 1410 NA
Shyamraipur, Gokulpur,
West Midnapore, West Bengal.
xxi) IISCO Steel Plant, Steel Authority 3800 2190 663(up to June) 453 576 NA
of India, Burnpur, West Bengal.
xxii) Tata Metaliks Ltd, 528 476 475 362 434 NA
Kharagpur,
West Bengal.
xxiii) KIC Metaliks Ltd, 336 194 188 238 234 NA
Raturia, Angadpur,
Durgapur. West Bengal.
xxiv) Gerdau Steel India Ltd, 470 447 485 286 308 NA
Tadipatri, Anantpur
xxv) SBQ Steel Ltd, 240 - - - - -
Gudur, Nellore, AP
xxvi) Sri Kalahasthi Pipes Ltd, 500 333 364 - - -
Dipipe Sri Kalahasthi.
*Incluudes iron ore lumps & low-grade iron ore
Table - 10 : Specifications of Iron Ore Consumed by Major Sponge Iron Plants
SpecificationsSl. Name of the PlantNo. Size Fe Al
2O
3 + SiO
2P S
1. Orissa Sponge Iron Plant 5-18 mm 65% min. 4.5% max. 0.03% max. N. A.
2. Welspun Max Steel Ltd 9-16 mm 66% 2.6% max. 0.05% 0.01%
3. Sunflag Iron & Steel Ltd 5-20 mm 67.5% – – –
4. NMDC Ltd (Sponge iron unit) 6-20 mm 55-58% & – – –
64-66%5. Essar Steel Ltd 10-40 mm 67% 2.60% max. 0.05% 0.01%
6. Jindal Steel & Power Ltd 10-30 mm 65% min. 3% max. (SiO2) 0.05% –
7. Tata Sponge Iron Ltd 5-18 mm 65% min. 5% max. – –
8. Steel Exchange India Ltd 10-40 mm 62% – – –
9. Sarda Energy & Minerals Ltd 5-18 mm 65-66% – – –
10. OCL Iron & Steel Ltd Sized 62% min. – – –
11. Nalwa Steel & Power Ltd 5-20 mm 63% min. – – –
12. Shri Bajrang Power & Ispat Ltd 5-18 mm 64% min. – – –
13. Jai Balaji Industries Ltd 5-18 mm 65% 5% 0.05% 0.03%10-30 mm – – – –
10-150 mm – – – –
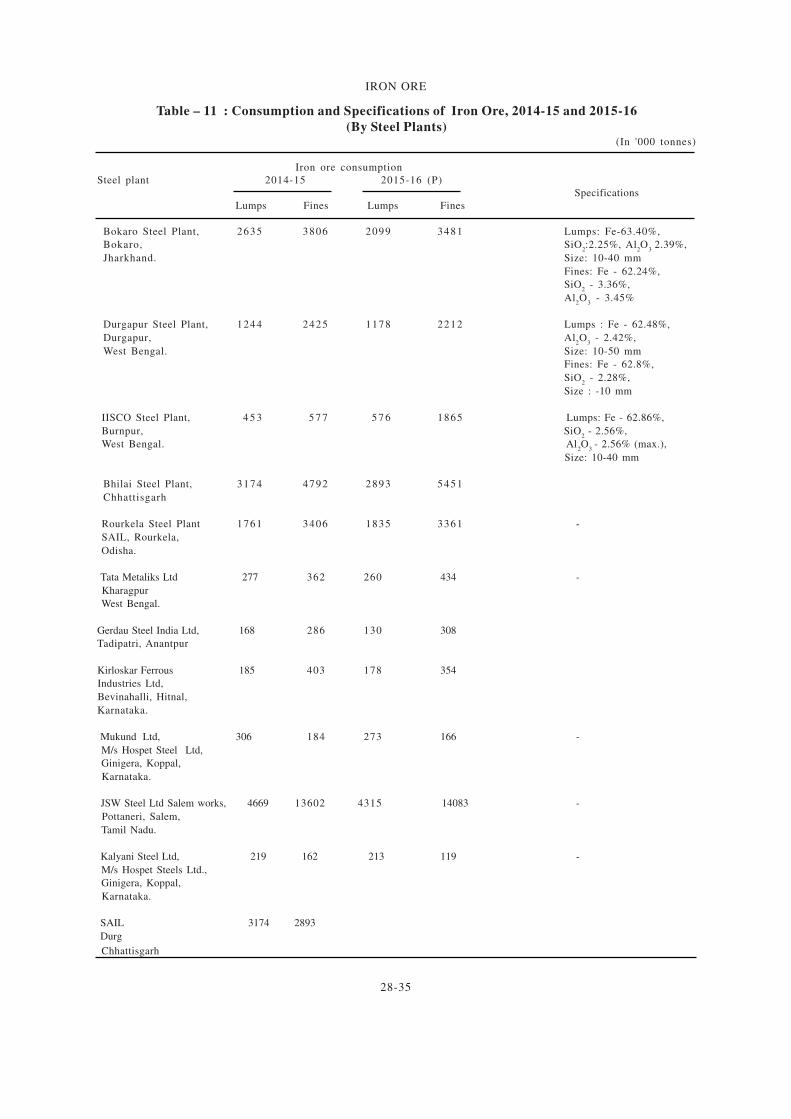
28-35
IRON ORE
Table – 11 : Consumption and Specifications of Iron Ore, 2014-15 and 2015-16
(By Steel Plants)(In '000 tonnes)
Iron ore consumption
Steel plant 2014-15 2015-16 (P)
Specifications
Lumps Fines Lumps Fines
Bokaro Steel Plant, 2635 3806 2099 3481 Lumps: Fe-63.40%,
Bokaro, SiO2:2.25%, Al
2O
3 2.39%,
Jharkhand. Size: 10-40 mm
Fines: Fe - 62.24%,
SiO2 - 3.36%,
Al2O
3 - 3.45%
Durgapur Steel Plant, 1244 2425 1178 2212 Lumps : Fe - 62.48%,
Durgapur, Al2O
3 - 2.42%,
West Bengal. Size: 10-50 mm
Fines: Fe - 62.8%,
SiO2 - 2.28%,
Size : -10 mm
IISCO Steel Plant, 4 5 3 5 7 7 5 7 6 1865 Lumps: Fe - 62.86%,
Burnpur, SiO2 - 2.56%,
West Bengal. Al2O
3 - 2.56% (max.),
Size: 10-40 mm
Bhilai Steel Plant, 3174 4792 2893 5451
Chhattisgarh
Rourkela Steel Plant 1761 3406 1835 3361 -
SAIL, Rourkela,
Odisha.
Tata Metaliks Ltd 277 362 260 434 -
Kharagpur
West Bengal.
Gerdau Steel India Ltd, 168 286 130 308
Tadipatri, Anantpur
Kirloskar Ferrous 185 403 178 354
Industries Ltd,
Bevinahalli, Hitnal,
Karnataka.
Mukund Ltd, 306 184 273 166 -
M/s Hospet Steel Ltd,
Ginigera, Koppal,
Karnataka.
JSW Steel Ltd Salem works, 4669 13602 4315 14083 -
Pottaneri, Salem,
Tamil Nadu.
Kalyani Steel Ltd, 219 162 213 119 -
M/s Hospet Steels Ltd.,
Ginigera, Koppal,
Karnataka.
SAIL 3174 2893
Durg
Chhattisgarh
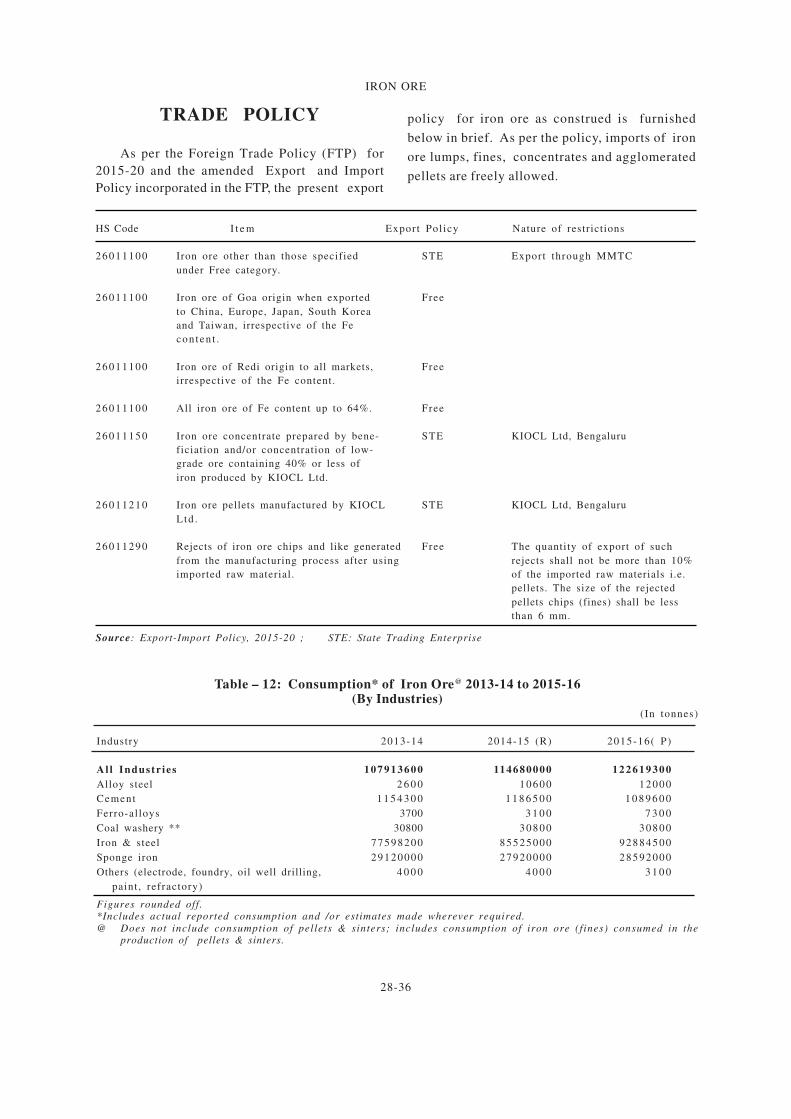
28-36
IRON ORE
Table – 12: Consumption* of Iron Ore@ 2013-14 to 2015-16(By Industries)
(In tonnes)
Industry 2013-14 2014-15 (R) 2015-16( P)
All Industr ies 1 0 7 9 1 3 6 0 0 114680000 1 2 2 6 1 9 3 0 0
Alloy steel 2 6 0 0 10600 12000
Cement 1 1 5 4 3 0 0 1 1 8 6 5 0 0 1 0 8 9 6 0 0
Ferro-alloys 3700 3 1 0 0 7 3 0 0
Coal washery ** 30800 30800 30800
Iron & steel 77598200 85525000 92884500
Sponge iron 29120000 27920000 28592000
Others (electrode, foundry, oil well drilling, 4 0 0 0 4 0 0 0 3 1 0 0
paint , refractory)
Figures rounded off.*Includes actual reported consumption and /or estimates made wherever required.
@ Does not include consumption of pellets & sinters; includes consumption of iron ore (fines) consumed in theproduction of pellets & sinters.
TRADE POLICY
As per the Foreign Trade Policy (FTP) for
2015-20 and the amended Export and Import
Policy incorporated in the FTP, the present export
HS Code I t e m Export Pol icy Nature of restrictions
26011100 Iron ore other than those specified STE Export through MMTC
under Free category.
26011100 Iron ore of Goa origin when exported Free
to China, Europe, Japan, South Korea
and Taiwan, irrespective of the Fe
con ten t .
26011100 Iron ore of Redi origin to all markets, Free
irrespective of the Fe content.
26011100 All iron ore of Fe content up to 64%. Free
26011150 Iron ore concentrate prepared by bene- STE KIOCL Ltd, Bengaluru
ficiation and/or concentration of low-
grade ore containing 40% or less of
iron produced by KIOCL Ltd.
26011210 Iron ore pellets manufactured by KIOCL STE KIOCL Ltd, Bengaluru
Ltd .
26011290 Rejects of iron ore chips and like generated Free The quantity of export of such
from the manufacturing process after using rejects shall not be more than 10%
imported raw material. of the imported raw materials i.e.
pellets. The size of the rejected
pellets chips (fines) shall be less
than 6 mm.
Source: Export-Import Policy, 2015-20 ; STE: State Trading Enterprise
policy for iron ore as construed is furnished
below in brief. As per the policy, imports of iron
ore lumps, fines, concentrates and agglomerated
pellets are freely allowed.
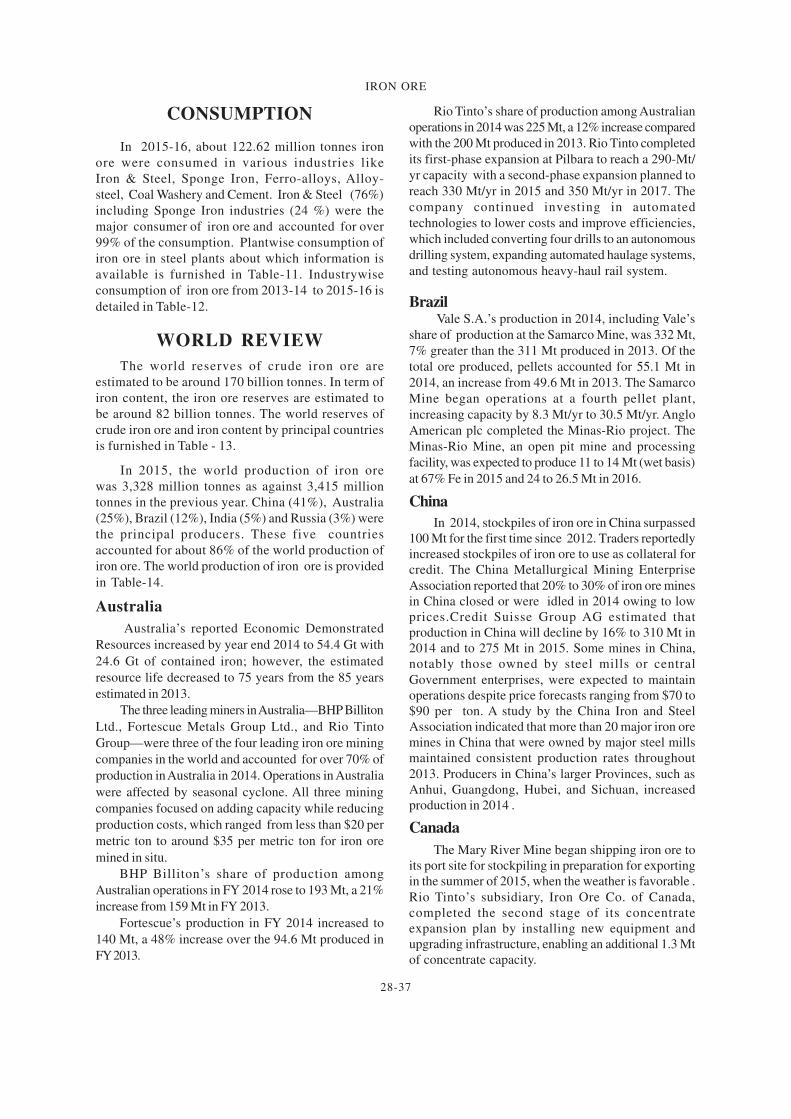
28-37
IRON ORE
CONSUMPTION
In 2015-16, about 122.62 million tonnes iron
ore were consumed in various industries like
Iron & Steel, Sponge Iron, Ferro-alloys, Alloy-
steel, Coal Washery and Cement. Iron & Steel (76%)
including Sponge Iron industries (24 %) were the
major consumer of iron ore and accounted for over
99% of the consumption. Plantwise consumption of
iron ore in steel plants about which information is
available is furnished in Table-11. Industrywise
consumption of iron ore from 2013-14 to 2015-16 is
detailed in Table-12.
WORLD REVIEW
The world reserves of crude iron ore are
estimated to be around 170 billion tonnes. In term of
iron content, the iron ore reserves are estimated to
be around 82 billion tonnes. The world reserves of
crude iron ore and iron content by principal countries
is furnished in Table - 13.
In 2015, the world production of iron ore
was 3,328 million tonnes as against 3,415 million
tonnes in the previous year. China (41%), Australia
(25%), Brazil (12%), India (5%) and Russia (3%) were
the principal producers. These five countries
accounted for about 86% of the world production of
iron ore. The world production of iron ore is provided
in Table-14.
Australia
Australia’s reported Economic Demonstrated
Resources increased by year end 2014 to 54.4 Gt with
24.6 Gt of contained iron; however, the estimated
resource life decreased to 75 years from the 85 years
estimated in 2013.
The three leading miners in Australia—BHP Billiton
Ltd., Fortescue Metals Group Ltd., and Rio Tinto
Group—were three of the four leading iron ore mining
companies in the world and accounted for over 70% of
production in Australia in 2014. Operations in Australia
were affected by seasonal cyclone. All three mining
companies focused on adding capacity while reducing
production costs, which ranged from less than $20 per
metric ton to around $35 per metric ton for iron ore
mined in situ.
BHP Billiton’s share of production among
Australian operations in FY 2014 rose to 193 Mt, a 21%
increase from 159 Mt in FY 2013.
Fortescue’s production in FY 2014 increased to
140 Mt, a 48% increase over the 94.6 Mt produced in
FY 2013.
Rio Tinto’s share of production among Australian
operations in 2014 was 225 Mt, a 12% increase compared
with the 200 Mt produced in 2013. Rio Tinto completed
its first-phase expansion at Pilbara to reach a 290-Mt/
yr capacity with a second-phase expansion planned to
reach 330 Mt/yr in 2015 and 350 Mt/yr in 2017. The
company continued investing in automated
technologies to lower costs and improve efficiencies,
which included converting four drills to an autonomous
drilling system, expanding automated haulage systems,
and testing autonomous heavy-haul rail system.
Brazil Vale S.A.’s production in 2014, including Vale’s
share of production at the Samarco Mine, was 332 Mt,
7% greater than the 311 Mt produced in 2013. Of the
total ore produced, pellets accounted for 55.1 Mt in
2014, an increase from 49.6 Mt in 2013. The Samarco
Mine began operations at a fourth pellet plant,
increasing capacity by 8.3 Mt/yr to 30.5 Mt/yr. Anglo
American plc completed the Minas-Rio project. The
Minas-Rio Mine, an open pit mine and processing
facility, was expected to produce 11 to 14 Mt (wet basis)
at 67% Fe in 2015 and 24 to 26.5 Mt in 2016.
China
In 2014, stockpiles of iron ore in China surpassed100 Mt for the first time since 2012. Traders reportedlyincreased stockpiles of iron ore to use as collateral forcredit. The China Metallurgical Mining Enterprise
Association reported that 20% to 30% of iron ore minesin China closed or were idled in 2014 owing to lowprices.Credit Suisse Group AG estimated thatproduction in China will decline by 16% to 310 Mt in2014 and to 275 Mt in 2015. Some mines in China,notably those owned by steel mills or central
Government enterprises, were expected to maintainoperations despite price forecasts ranging from $70 to$90 per ton. A study by the China Iron and SteelAssociation indicated that more than 20 major iron oremines in China that were owned by major steel millsmaintained consistent production rates throughout
2013. Producers in China’s larger Provinces, such asAnhui, Guangdong, Hubei, and Sichuan, increasedproduction in 2014 .
Canada
The Mary River Mine began shipping iron ore toits port site for stockpiling in preparation for exportingin the summer of 2015, when the weather is favorable .
Rio Tinto’s subsidiary, Iron Ore Co. of Canada,completed the second stage of its concentrateexpansion plan by installing new equipment andupgrading infrastructure, enabling an additional 1.3 Mtof concentrate capacity.
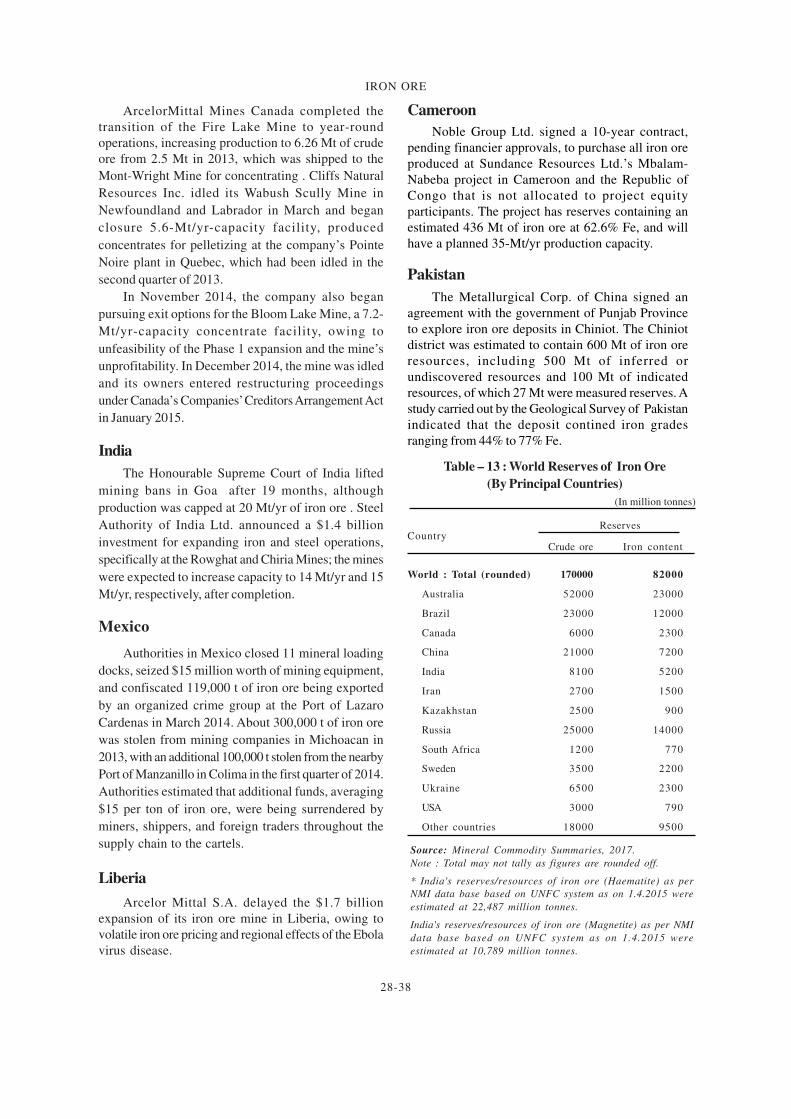
28-38
IRON ORE
ArcelorMittal Mines Canada completed the
transition of the Fire Lake Mine to year-round
operations, increasing production to 6.26 Mt of crude
ore from 2.5 Mt in 2013, which was shipped to the
Mont-Wright Mine for concentrating . Cliffs Natural
Resources Inc. idled its Wabush Scully Mine in
Newfoundland and Labrador in March and began
closure 5.6-Mt/yr-capacity facility, produced
concentrates for pelletizing at the company’s Pointe
Noire plant in Quebec, which had been idled in the
second quarter of 2013.
In November 2014, the company also began
pursuing exit options for the Bloom Lake Mine, a 7.2-
Mt/yr-capacity concentrate facility, owing to
unfeasibility of the Phase 1 expansion and the mine’s
unprofitability. In December 2014, the mine was idled
and its owners entered restructuring proceedings
under Canada’s Companies’ Creditors Arrangement Act
in January 2015.
India
The Honourable Supreme Court of India lifted
mining bans in Goa after 19 months, although
production was capped at 20 Mt/yr of iron ore . Steel
Authority of India Ltd. announced a $1.4 billion
investment for expanding iron and steel operations,
specifically at the Rowghat and Chiria Mines; the mines
were expected to increase capacity to 14 Mt/yr and 15
Mt/yr, respectively, after completion.
Mexico
Authorities in Mexico closed 11 mineral loading
docks, seized $15 million worth of mining equipment,
and confiscated 119,000 t of iron ore being exported
by an organized crime group at the Port of Lazaro
Cardenas in March 2014. About 300,000 t of iron ore
was stolen from mining companies in Michoacan in
2013, with an additional 100,000 t stolen from the nearby
Port of Manzanillo in Colima in the first quarter of 2014.
Authorities estimated that additional funds, averaging
$15 per ton of iron ore, were being surrendered by
miners, shippers, and foreign traders throughout the
supply chain to the cartels.
Liberia
Arcelor Mittal S.A. delayed the $1.7 billion
expansion of its iron ore mine in Liberia, owing to
volatile iron ore pricing and regional effects of the Ebola
virus disease.
Cameroon
Noble Group Ltd. signed a 10-year contract,
pending financier approvals, to purchase all iron ore
produced at Sundance Resources Ltd.’s Mbalam-
Nabeba project in Cameroon and the Republic of
Congo that is not allocated to project equity
participants. The project has reserves containing an
estimated 436 Mt of iron ore at 62.6% Fe, and will
have a planned 35-Mt/yr production capacity.
Pakistan
The Metallurgical Corp. of China signed an
agreement with the government of Punjab Province
to explore iron ore deposits in Chiniot. The Chiniot
district was estimated to contain 600 Mt of iron ore
resources, including 500 Mt of inferred or
undiscovered resources and 100 Mt of indicated
resources, of which 27 Mt were measured reserves. A
study carried out by the Geological Survey of Pakistan
indicated that the deposit contined iron grades
ranging from 44% to 77% Fe.
Source: Mineral Commodity Summaries, 2017.
Note : Total may not tally as figures are rounded off.
* India's reserves/resources of iron ore (Haematite) as per
NMI data base based on UNFC system as on 1.4.2015 were
estimated at 22,487 million tonnes.
India's reserves/resources of iron ore (Magnetite) as per NMI
data base based on UNFC system as on 1.4.2015 were
estimated at 10,789 million tonnes.
Table – 13 : World Reserves of Iron Ore
(By Principal Countries)
(In million tonnes)
ReservesCountry
Crude ore Iron content
World : Total (rounded) 170000 82000
Australia 52000 23000
Brazil 23000 12000
Canada 6000 2300
China 21000 7200
India 8100 5200
Iran 2700 1500
Kazakhstan 2500 900
Russia 25000 14000
South Africa 1200 770
Sweden 3500 2200
Ukraine 6500 2300
USA 3000 790
Other countries 18000 9500
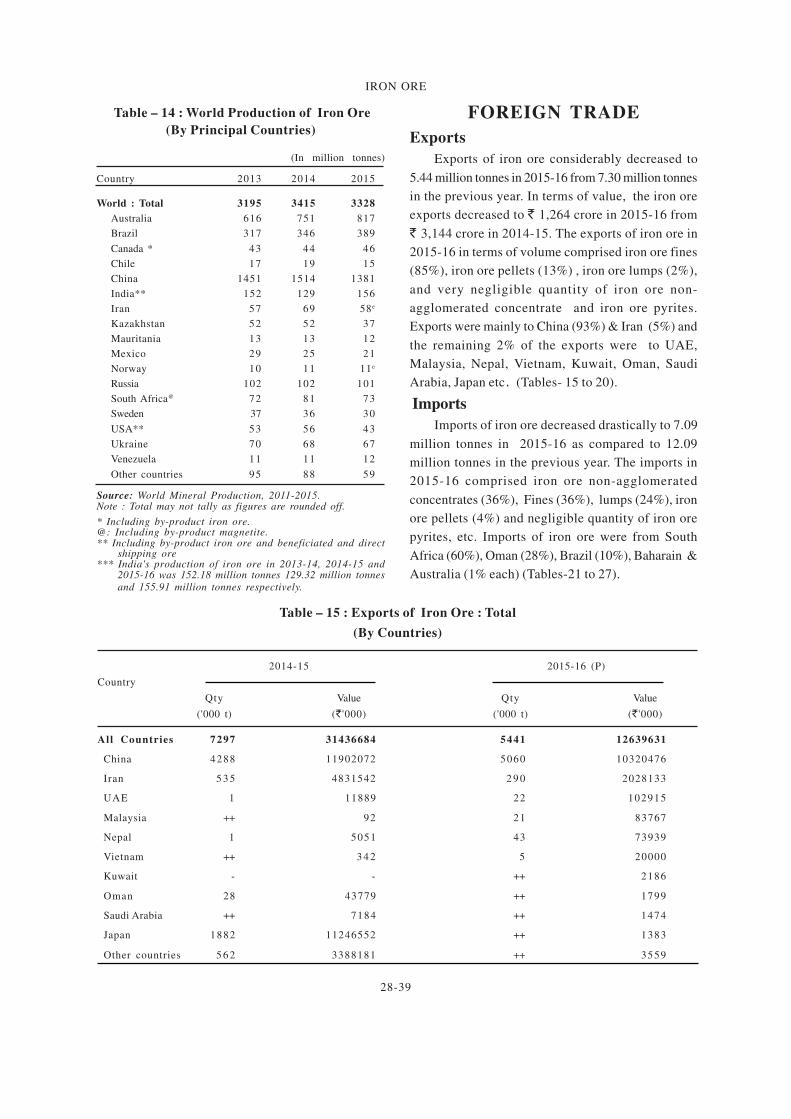
28-39
IRON ORE
FOREIGN TRADE
Exports
Exports of iron ore considerably decreased to
5.44 million tonnes in 2015-16 from 7.30 million tonnes
in the previous year. In terms of value, the iron ore
exports decreased to ` 1,264 crore in 2015-16 from
` 3,144 crore in 2014-15. The exports of iron ore in
2015-16 in terms of volume comprised iron ore fines
(85%), iron ore pellets (13%) , iron ore lumps (2%),
and very negligible quantity of iron ore non-
agglomerated concentrate and iron ore pyrites.
Exports were mainly to China (93%) & Iran (5%) and
the remaining 2% of the exports were to UAE,
Malaysia, Nepal, Vietnam, Kuwait, Oman, Saudi
Arabia, Japan etc. (Tables- 15 to 20).
Imports
Imports of iron ore decreased drastically to 7.09
million tonnes in 2015-16 as compared to 12.09
million tonnes in the previous year. The imports in
2015-16 comprised iron ore non-agglomerated
concentrates (36%), Fines (36%), lumps (24%), iron
ore pellets (4%) and negligible quantity of iron ore
pyrites, etc. Imports of iron ore were from South
Africa (60%), Oman (28%), Brazil (10%), Baharain &
Australia (1% each) (Tables-21 to 27).
Table – 14 : World Production of Iron Ore
(By Principal Countries)
(In million tonnes)
Country 2013 2014 2015
World : Total 3195 3415 3328
Australia 616 751 817
Brazil 317 346 389
Canada * 43 44 46
Chile 17 19 15
China 1451 1514 1381
India** 152 129 156
Iran 57 69 58e
Kazakhstan 52 52 37
Mauritania 13 13 12
Mexico 29 25 21
Norway 10 11 11e
Russia 102 102 101
South Africa@ 72 81 73
Sweden 37 36 30
USA** 53 56 43
Ukraine 70 68 67
Venezuela 11 11 12
Other countries 95 88 59
Source: World Mineral Production, 2011-2015.Note : Total may not tally as figures are rounded off.
* Including by-product iron ore.@: Including by-product magnetite.** Including by-product iron ore and beneficiated and direct
shipping ore*** India's production of iron ore in 2013-14, 2014-15 and
2015-16 was 152.18 million tonnes 129.32 million tonnes
and 155.91 million tonnes respectively.
Table – 15 : Exports of Iron Ore : Total
(By Countries)
2014-15 2015-16 (P)
Country
Qty Value Qty Value
('000 t) (` '000) ('000 t) (` '000)
All Countries 7297 31436684 5441 12639631
China 4288 11902072 5060 10320476
Iran 5 3 5 4831542 2 9 0 2028133
UAE 1 11889 22 102915
Malaysia ++ 92 21 83767
Nepal 1 5051 43 73939
Vietnam ++ 3 4 2 5 20000
Kuwait - - ++ 2186
Oman 28 43779 ++ 1799
Saudi Arabia ++ 7184 ++ 1474
Japan 1882 11246552 ++ 1383
Other countries 5 6 2 3388181 ++ 3559
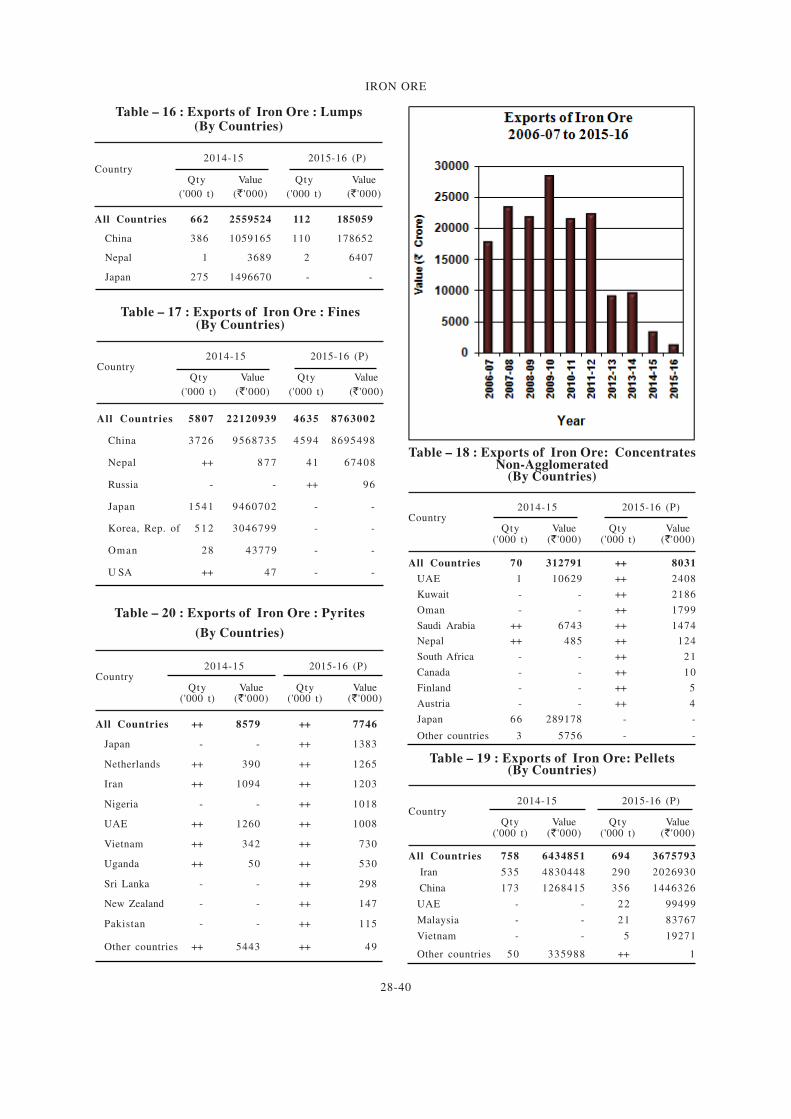
28-40
IRON ORE
Table – 16 : Exports of Iron Ore : Lumps(By Countries)
2014-15 2015-16 (P)Country
Qty Value Qty Value
('000 t) (` '000) ('000 t) (` '000)
All Countries 662 2559524 112 185059
China 386 1059165 110 178652
Nepal 1 3689 2 6407
Japan 275 1496670 - -
Table – 18 : Exports of Iron Ore: ConcentratesNon-Agglomerated
(By Countries)
2014-15 2015-16 (P)Country
Qty Value Qty Value('000 t) (` '000) ('000 t) (`'000)
All Countries 70 312791 ++ 8031
UAE 1 10629 ++ 2408
Kuwait - - ++ 2186
Oman - - ++ 1799
Saudi Arabia ++ 6743 ++ 1474
Nepal ++ 485 ++ 124
South Africa - - ++ 21
Canada - - ++ 10
Finland - - ++ 5
Austria - - ++ 4
Japan 66 289178 - -
Other countries 3 5756 - -
Table – 19 : Exports of Iron Ore: Pellets(By Countries)
2014-15 2015-16 (P)Country
Qty Value Qty Value('000 t) (` '000) ('000 t) (` '000)
All Countries 758 6434851 694 3675793
Iran 535 4830448 290 2026930
China 173 1268415 356 1446326
UAE - - 22 99499
Malaysia - - 21 83767
Vietnam - - 5 19271
Other countries 50 335988 ++ 1
Table – 17 : Exports of Iron Ore : Fines(By Countries)
2014-15 2015-16 (P)Country
Qty Value Qty Value
('000 t) (` '000) ('000 t) (` '000)
All Countries 5807 22120939 4635 8763002
China 3726 9568735 4594 8695498
Nepal ++ 8 7 7 41 67408
Russia - - ++ 96
Japan 1541 9460702 - -
Korea, Rep. of 5 1 2 3046799 - -
Oman 28 43779 - -
U SA ++ 47 - -
Table – 20 : Exports of Iron Ore : Pyrites
(By Countries)
2014-15 2015-16 (P)Country
Qty Value Qty Value('000 t) (` '000) ('000 t) (` '000)
All Countries ++ 8579 ++ 7746
Japan - - ++ 1383
Netherlands ++ 390 ++ 1265
Iran ++ 1094 ++ 1203
Nigeria - - ++ 1018
UAE ++ 1260 ++ 1008
Vietnam ++ 342 ++ 730
Uganda ++ 50 ++ 530
Sri Lanka - - ++ 298
New Zealand - - ++ 147
Pakistan - - ++ 115
Other countries ++ 5443 ++ 49
28-41
IRON ORE
Table – 22: Imports of Iron Ore Concentrates:Non-agglomerated
(By Countries)
2014-15 2015-16 (P)Country
Qty Value Qty Value('000 t) (` '000) ('000 t) (` '000)
All Countries 4939 24964666 2565 11462874
South Africa 1708 9117925 2060 9439580
Brazil 1910 8935947 5 0 5 2020499
Netherlands - - ++ 1274
Sweden ++ 1405 ++ 1097
Nigeria - - ++ 1 7 7
Germany ++ 24 ++ 82
UAE - - ++ 77
Iran - - ++ 40
Niger - - ++ 30
Sudan ++ 98 ++ 18
Other countries 1321 6909267 - -
Table – 21 : Imports of Iron Ore: Total
(By Countries)
2014-15 2015-16 (P)
Country
Qty Value Qty Value
('000 t) (` '000) ('000 t) (` '000)
All Countries 12093 65947375 7099 31971445
South Africa 5044 28973403 4252 19578175
Oman 207 1297227 1965 8146494
Brazil 3419 17634296 694 3151415
Baharain - - 105 720561
Australia 1995 9929559 67 248124
Singapore - - 7 48698
Saudi Arabia - - 6 29633
Turkey 2 16915 2 17109
Finland 7 65756 1 10736
China 10 75819 ++ 8354
Other countries 1409 7954400 ++ 12146
Table – 23 : Imports of Iron Ore : Pellets(By Countries)
2014-15 2015-16 (P)Country
Qty Value Qty Value('000 t) (` '000) ('000 t) (` '000)
All Countries 656 5151575 279 1907301
Brazil 323 2491750 122 833511
Baharain - - 105 720561
Oman 93 822907 52 353229
Australia 79 585207 - -
Ukraine 53 457406 - -
Russia 49 448662 - -
Qatar 44 232472 - -
China 10 68840 - -
Finland 5 44331 - -
Other countries - - - -
Table – 24 : Imports of Iron Ore : Pyrites(By Countries)
2014-15 2015-16 (P)Country
Qty Value Qty Value('000 t) (` '000) ('000 t) (` '000)
All Countries 4 52397 3 46031
Turkey 1 12258 2 17109
Finland 2 21425 1 10736
China ++ 6832 ++ 8354
Italy ++ 3853 ++ 4598
Pakistan 1 6982 ++ 2477
Albania - - ++ 1671
Australia - - ++ 482
Austria - - ++ 453
USA ++ 32 ++ 151
UAE ++ 1015 _ _
Other countries - - - -
Table – 25 : Imports of Iron Ore : PyritesRoasted
(By Countries)
2014-15 2015-16(P)Country
Qty Value Qty Value('000 t) (` '000) ('000 t) (` '000)
All Countries ++ 2 4 7 ++ 2 0 8
USA - - ++ 1 5 1
China ++ 2 4 7 ++ 57
Other countries - - - -
28-42
IRON ORE
FUTURE OUTLOOKIndia is one of the leading producers of iron
ore in the world. Among the consuming industries,
Cement Industry is the second major consumer of
iron ore after Iron & Steel Industry (including
Sponge Iron Industry). In order to conserve iron
ore resources of the country for long term
domestic value addit ion, export duty on all
varieties of iron ore (except pellets) has been
increased from 20% to 30% ad valorem.
The Ministry of Steel under Government of
India has recently introduced that new National
Table – 27 : Imports of Iron Ore Fines(By Countries)
2014-15 2015-16 (P)Country
Qty Value Qty Value('000 t) (` '000) ('000 t) (` '000)
All Countries 4837 25280627 2543 10392710
Oman 114 474319 1913 7793266
South Africa 1860 10431130 563 2302039
Brazil 1186 6206599 67 297405
Australia 1448 6966257 - -
Mauritania 148 776977 - -
Venezuela 80 420558 - -
Turkey 1 4658 - -
Malaysia ++ 123 - -
Qatar ++ 6 - -
Table – 26: Imports of Iron Ore : Lumps(By Countries)
2014-15 2015-16 (P)Country
Qty Value Qty Value('000 t) (` '000) ('000 t) (` '000)
All Countries 1657 10498110 1709 8162529
South Africa 1476 9424348 1629 7836556
Australia 133 826496 67 247642
Singapore - - 7 48698
Saudi Arabia - - 6 29633
Qatar 44 232472 - -
Senegal 2 12174 - -
Nicaragua 2 2620 - -
Other countries - - - -
Steel Policy 2017 and with the roll out of the
National Steel Policy 2017 and the DMI&SP policy,
it is envisaged that the industry can be steered
with appropriate policy support in creating an
environment for promoting domestic steel and
thereby ensuring a scenario where production
meets the an t ic ipa ted pace of g rowth in
consumption. Thus, the Indian Steel Sector is all
set to achieve its vision thereby setting a global
benchmark in terms of quality, standards and
technology. It is anticipated that crude steel
28-43
IRON ORE
capacity of 300 million tonnes will be required by
2030-31. However, achieving crude steel capacity
up to 300 million tonnes will require extensive
mobilisation of natural resources, f inances,
manpower and infrastructure including land.
Availability of raw material (iron ore) at iron
ore, intensive & deeper exploration would have
to be promoted for augmenting the resource base.
Eco-friendly viable underground mining technique
for optimal utilisation of magnetite ore deposits
locked in Western Ghats would also have to be
explored in conjunction with mining research
ins t i tu tes . The government has a l ready
promulga ted the Mines and Minera l s
(Development and Regulation) Amendment Act,
2015 and therein has laid great emphasis on time
bound mine development with increased stress on
mineral explorat ion and sustainable mining
operations. The Act has brought clarity on mine
allocation process (through auction) and procedures
for mining lease renewal. The Act, further, provides
for reservation of any particular mine for a particular
end use and put conditions permitting auction
among such eligible end users.
Ministry of Steel in conjunction with Ministry
of Mines, will facilitate creation of a uniform
countrywide sales platform for bringing transparency
and predictability in the process of sale of iron ore.
Related Documents