International Research Journal of Engineering and Technology (IRJET) e-ISSN: 2395 -0056 Volume: 02 Issue: 03 | June-2015 www.irjet.net p-ISSN: 2395-0072 © 2015, IRJET.NET- All Rights Reserved Page 1995 Phosphorus isotherms sorption in semi arid soil Wissem Hamdi* 1,5 , Jean Aimé Messiga 2 , David Peslter 3 , NouraZiadi 4 , Mongi Seffen 5 1 High Institute of Agronomy, Chott Meriem 4042, Sousse, Tunisia (Sousse University) 2 Environmental and resource Studies Program, Trent University, Peterborough, ON, Canada, K9J 7B8 3 International Livestock Research Institute (ILRI), Old Naivasha Road, 00100 Nairobi, Kenya 4 Agriculture and Agri-Food Canada, 2560 Hochelaga Blvd., Sainte-Foy, Quebec, 5 High School of Sciences and Technology, 4011 Hammam Sousse (Sousse University). ---------------------------------------------------------------------***--------------------------------------------------------------------- Abstract - The aims of this study were to determine the phosphorus (P) adsorption capacity of the semi-arid soils from Tunisian Sahel and to generate that relates these capacities to soil properties. Air-dried samples soils collected at four depths from three sites in the Sahel region of Tunisia (Chott-Mariem, Enfidha and Kondar). Soil chemical, physical and mineralogical properties were analyzed. 0,5g of each soil samples were shaken with increasing concentrations of solution P for 36 hr at 20 °C. The maximum of P adsorption were greatly influenced by soil organic matter, calcium, magnesium and clay content. Moreover, the data obtained was fitted using Langmuir and Freundlich isotherm functions. P adsorption data revealed that Langmuir equation (R 2 = 0.98) showed a better describe the adsorption phenomena over the Freundlich equation (R 2 =0. 96) in all the three series. Key Words: Phosphorus, adsorption isotherm, Sahel of Tunisia, Langmuir, Freundlich equations. 1. INTRODUCTION Phosphorus (P) is after nitrogen the second most important nutrient for plant growth and optimal yield production in cropping systems [1, 2]. Phosphorus also plays a central role for other living organisms such as microbes as it plays a predominant role in cellular metabolism such as ATP and as an important constituent of many structural and biochemical functional components [3]. During the last decades, the amount of economically-available reserves of rock phosphate decreased as a result of crop intensification to support the demand for food [4, 5]. Nevertheless, fertilizer P use efficiency in most cropping systems is still relatively low, less than 50% in field crops and around 20-30% in grasslands [6]. The biogeochemistry of P in soils is strongly influenced by the presence of minerals such as apatite, strengite, and variscite. The weathering of these soil minerals is generally too slow to meet crop demand for P. Furthermore, P bearing minerals including calcium (Ca), iron (Fe), and aluminum (Al) phosphates vary in their dissolution rates; depending on the size of the mineral particles and soil pH [7]. In neutral-to-calcareous soils, as those found in the sahel region of Tunisia, P applied as fertilizer is fixed onto the soil matrix through precipitation reactions [8] and adsorption on the surface of Ca-carbonate [9] and clay minerals [3]. The adsorption of phosphates is an approach wherein phosphate ions in soil solution react with cations on the surface of soils particles, and affects both the availability of P to plants and the fate of P fertilizer. In acidic soils, Zhang et al., [10] and Wen et al., [11] determined that P was dominantly adsorbed by Fe and Al oxides and hydroxides such as gibbsite, hematite and goethite. With increasing soil pH, Fe and Al phosphate solubility increases but solubility of Ca-phosphate decreases [1]. Phosphate can precipitate with Ca, generating di- calcium phosphate which is still available to plants. However, the di-calcium phosphate can be further transformed into more stable forms such as octo- calcium phosphate and hydroxyapatite, which are less available to plants at alkaline pH [12]. In neutral-to-calcareous soils, P retention is dominated

Welcome message from author
This document is posted to help you gain knowledge. Please leave a comment to let me know what you think about it! Share it to your friends and learn new things together.
Transcript

International Research Journal of Engineering and Technology (IRJET) e-ISSN: 2395 -0056
Volume: 02 Issue: 03 | June-2015 www.irjet.net p-ISSN: 2395-0072
© 2015, IRJET.NET- All Rights Reserved Page 1995
Phosphorus isotherms sorption in semi arid soil
Wissem Hamdi*1,5, Jean Aimé Messiga2, David Peslter 3, NouraZiadi 4, Mongi Seffen5
1High Institute of Agronomy, Chott Meriem 4042, Sousse, Tunisia (Sousse University)
2Environmental and resource Studies Program, Trent University, Peterborough, ON, Canada, K9J 7B8
3International Livestock Research Institute (ILRI), Old Naivasha Road, 00100 Nairobi, Kenya
4Agriculture and Agri-Food Canada, 2560 Hochelaga Blvd., Sainte-Foy, Quebec,
5 High School of Sciences and Technology, 4011 Hammam Sousse (Sousse University).
---------------------------------------------------------------------***---------------------------------------------------------------------
Abstract - The aims of this study were to determine the phosphorus (P) adsorption capacity of the semi-arid soils from Tunisian Sahel and to generate that relates these capacities to soil properties. Air-dried samples soils collected at four depths from three sites in the Sahel region of Tunisia (Chott-Mariem, Enfidha and Kondar). Soil chemical, physical and mineralogical properties were analyzed. 0,5g of each soil samples were shaken with increasing concentrations of solution P for 36 hr at 20 °C. The maximum of P adsorption were greatly influenced by soil organic matter, calcium, magnesium and clay content. Moreover, the data obtained was fitted using Langmuir and Freundlich isotherm functions. P adsorption data revealed that Langmuir equation (R2= 0.98) showed a better describe the adsorption phenomena over the Freundlich equation (R2
=0. 96) in all the three series.
Key Words: Phosphorus, adsorption isotherm, Sahel of Tunisia, Langmuir, Freundlich equations.
1. INTRODUCTION
Phosphorus (P) is after nitrogen the second most
important nutrient for plant growth and optimal
yield production in cropping systems [1, 2].
Phosphorus also plays a central role for other living
organisms such as microbes as it plays a
predominant role in cellular metabolism such as
ATP and as an important constituent of many
structural and biochemical functional components
[3]. During the last decades, the amount of
economically-available reserves of rock phosphate
decreased as a result of crop intensification to
support the demand for food [4, 5]. Nevertheless,
fertilizer P use efficiency in most cropping systems
is still relatively low, less than 50% in field crops
and around 20-30% in grasslands [6]. The
biogeochemistry of P in soils is strongly influenced
by the presence of minerals such as apatite,
strengite, and variscite. The weathering of these soil
minerals is generally too slow to meet crop demand
for P. Furthermore, P bearing minerals including
calcium (Ca), iron (Fe), and aluminum (Al)
phosphates vary in their dissolution rates;
depending on the size of the mineral particles and
soil pH [7]. In neutral-to-calcareous soils, as those
found in the sahel region of Tunisia, P applied as
fertilizer is fixed onto the soil matrix through
precipitation reactions [8] and adsorption on the
surface of Ca-carbonate [9] and clay minerals [3].
The adsorption of phosphates is an approach
wherein phosphate ions in soil solution react with
cations on the surface of soils particles, and affects
both the availability of P to plants and the fate of P
fertilizer. In acidic soils, Zhang et al., [10] and
Wen et al., [11] determined that P was dominantly
adsorbed by Fe and Al oxides and hydroxides such
as gibbsite, hematite and goethite. With increasing
soil pH, Fe and Al phosphate solubility increases
but solubility of Ca-phosphate decreases [1].
Phosphate can precipitate with Ca, generating di-
calcium phosphate which is still available to plants.
However, the di-calcium phosphate can be further
transformed into more stable forms such as octo-
calcium phosphate and hydroxyapatite, which are
less available to plants at alkaline pH [12]. In
neutral-to-calcareous soils, P retention is dominated
International Research Journal of Engineering and Technology (IRJET) e-ISSN: 2395 -0056
Volume: 02 Issue: 03 | June-2015 www.irjet.net p-ISSN: 2395-0072
© 2015, IRJET.NET- All Rights Reserved Page 1996
by precipitation reactions, although P can also be
adsorbed on the surface of Ca-carbonate [9] and
clay minerals [3]. The adsorption of phosphate is an
approach wherein phosphate ions in soil solution
react with elements on the surface of soils particles,
and is an important property affecting both the
availability of phosphate to plants and the fate of
phosphate fertilizer. Other factors can limit P
availability as well, such as the buffering capacity
of the soil [13], the surface area [14, 15], nutrient
balance, organic matter (OM) and crop husbandry
practices [16]. In soil solution, dissolved
phosphorus is composed of orthophosphate (H2PO4-
, HPO4- PO4
3-) with different degrees of protonation
depending on the pH. Orthophosphate strongly
adsorbs through covalent bonding to soil functional
groups forming stable bonds [17]. The soil matrix
therefore acts as a sink that traps much of the
orthophosphate found in the soil solution [18], with
PO43-
having the strongest binding capacity to the
soil functional groups at soil pH [19]. As a result, it
was believed that P transport through subsurface
runoff was negligible. Nevertheless, for the most
highly fertilized soils added PO43-
may exceed the P
sorption capacity of the soil, causing PO43-
concentrations to increase in the soil solution [20].
The adsorption is measured by shaking of the soil
samples with standard phosphate solution,
measuring the change in phosphate concentration
and calculating the phosphate adsorbed. In solution,
the concentration of phosphate is determined and
the quantity of phosphate adsorbed is calculated.
Freundlich and Langmuir adsorption isotherms
models are mostly employed for understanding the
relationship between the quantity of phosphorus
adsorbed per unit soil weight and the concentration
of phosphorus in solution and provide a
distribution-equilibrium coefficient that describes
the ratio of adsorbed to dissolved orthophosphates.
They have previously been applied to a wide
variety of soils [21], however none of which
investigated P dynamics for the soils of Tunisia; in
particular the soils of the Sahel region. This region
is considered to be one of the most important areas
for crop production in Tunisia. The aim of this
study was to investigate the P adsorption capacity
by three soil profiles from three different sites of
the Sahel region and select from the two isotherms
models the best fit for the data.
MATERIAL AND METHODS
Site description and soil characteristics
The P sorption experiment was conducted with
soils from three sites of the Sahel region of Tunisia:
Chott Mariem (35°54’N10°36’E), Enfidha
(36°08’N10°22’E) and Kondar (35°55’N10°17’
E).
The climate is moderate in the winter and hot in the
summer, with mean annual temperature of 23°C,
and mean annual precipitation of 300 mm. The soil
(0–25-cm) is fine sandy loam (Isohumic soils) at
Chott Marien, clay soil (Calcic-magnesic) at
Enfidha and Kondar (Solonetz) [22]. Chemical
characteristics of the studied sites are presented in
Table 1. The pHwater varied from 8.12 at Chott
Mariem to 8.66 at Kondar, organic matter varied
from 1.89% at Chott Mariem to 7,36 % at Kondar,
Mehlich-3 P (PM3) varied from 1.98 mg kg–1
at
Kondar to 93.68 mg kg–1
at Chott Mariem, and
Mehlich-3 Ca varied from 5450 mg kg–1
at Chott
Mariem to 17784 mg kg–1
at Kondar. Triplicates
soil samples were randomly collected at four depth,
0–25-, 25–60-, 60–90-, and 90–120-cm, air-dried,
sieved (<2 mm) and stored until analysis. The soils
were classified as isohumic soils for Chott Mariem,
calcic-magnesic for Enfidha, and solonetz for
Kondar. Soil pH was determined in a 1:2 soil: water
suspension [23]; organic C (OC) by the wet
oxidation method [24]; particle-size distribution by
the pipette method [25] and calcium carbonate
equivalent (CCE) by the BaCl2 extraction method
[26]. Mehlich-III [27] P, Ca, Mg, Fe, Al, Cd, Cu,
Mn, were determined by equilibrating 2.5 g of air-
dried soil with 25 mL of Mehlich-III extracting
solution for 5 min and filtering through Whatman
No. 40 filter paper. Concentrations of the various
elements in the extracts were determined by
inductively coupled plasma optical emission
spectrophotometer (CP–OES, Perkins Elmer,
Model 4300DV). The quantitative mineralogical
analysis was extracted from the powder XRD data
using an internal standard for each mineral [28].
The clay fraction was quantified, after purification,
and based on a pure, standard clay mineral.

International Research Journal of Engineering and Technology (IRJET) e-ISSN: 2395 -0056
Volume: 02 Issue: 03 | June-2015 www.irjet.net p-ISSN: 2395-0072
© 2015, IRJET.NET- All Rights Reserved Page 1997
Batch experiment
Solutions with a range of P concentrations were
formulated in a 0.01 mM CaCl matrix for batch
equilibration with the air-dried soils. Initial
equilibrating solution-P concentrations were
selected to ensure that the upper concentration
represent a distinct curvature of the plotted P
sorption isotherm (0, 50, 100, 150, 200, 250, and
300 mg P L–1
). The sorption batch were replicated
twice and consisted of mixing 0.5 g of air-dried soil
with 25 ml of one of the equilibrating solutions.
Each batch was shaken at 120 rpm on a horizontal
mechanical shaker for a contact time of 36 h at 20
°C, and then filtered through Whatman no. 42 filter
paper. The filtrates were colorimetrically analyzed
for P at 882 nm using the ascorbic acid method
[29], and the difference between amount of P in
solution before and after equilibrium was assumed
to equal the amount of P sorbed to the soil matrix.
The experimental data were fitted using the
Langmuir and Freundlich isotherms.
Data modeling
1-Langmuir adsorption-isotherm equation
Q = Ck
CkQ
l
l
1max (1)
Where Q (mg P kg–1
) is the adsorbed P onto the soil
after 36-h contact, Qmax (mg P kg–1
) is the P
sorption maximum; kl (P mg.L–1
) is the binding
energy of P, and C (mg P L–1
) is the equilibrium P
concentration in solution (Barrow 1978).
2- Freundlich adsorption-isotherm equation
Q = n
F Ck (2)
Where Q (mg P kg–1
) is the adsorbed P onto the soil
after 36h contact, kF is a coefficient, C (mg L–1
) is
the equilibrium P concentration in solution, and n is
a coefficient introducing non-linearity.
Statistical analysis Non-linear regression techniques were applied to
the sorption data using NLIN procedure (SAS
Institute, 2001). Sorption was characterized by
fitting Eqs. (1) and (2) to the plot of adsorbed P
against equilibrium P concentration in solution. The
fit of the regression curve was evaluated using the
adjusted R2 to determine how well the curve
explains experimental data variation and the root
mean square error (RMSE) which estimates the
variation, expressed in the same units as the data,
between theatrical and experimental values. This
parameter is defined by the following formula:
RMSE=
2/1
1
2exp)(
n
i
the
n
Where: Qthe and Qexp are simulated and observed
values, respectively. The RMSE tests the accuracy
of the model, which is defined as the extent to
which simulated values approach a corresponding
set of measured values [30].
RESULTS AND DISCUSSION
Soil Characteristics
The pH, particle size distribution, and concentration
of major elements within the different soils are
indicated in Table 1.
All of the different samples were alkaline for all
depths with the pH generally above 8. The texture
for the Chott Mariem site varied with depth, and
ranged from a fine sandy loam to clay. Soil texture
Kondar for the varied to clay a heavy clay. Finally,
in the profile texture soil site of Enfidha, only
heavy clay texture soil was determined at different
horizons. The variation in texture reflects the
differences in parent materials [31]. Clay content in
particular can affect soil behaviour, fertility, water
and nutrient holding capacities as well as plant root
movement [3]. The Enfidha soils with their high
clay content would probably hold more water and
nutrients than the two other soils. It would also
likely have a high phosphorus fixing capacity [32].
Soil OM content reflects the level of soil fertility
[33] and was highly variable between the various
sites and horizons (Table 1). For Enfidha soils, the
OM content was similar for all depths, with a mean
of 3.16%, which was relatively high compared to
the other soils. This is likely due to migration of
OM to deeper horizons and it’s incorporation with
the particle size of clay under the action of
microbial activity [34]. In the Chott-Mariem soils,
the majority of OM accumulated at depth, primarily
between 60 and120 cm. By contrast, the soil profile
from the Kondar site contained very high rates of
OM in the surface horizons (i.e. 0-25 cm and 25-60
cm), which decreased with the depth. In general the
International Research Journal of Engineering and Technology (IRJET) e-ISSN: 2395 -0056
Volume: 02 Issue: 03 | June-2015 www.irjet.net p-ISSN: 2395-0072
© 2015, IRJET.NET- All Rights Reserved Page 1998
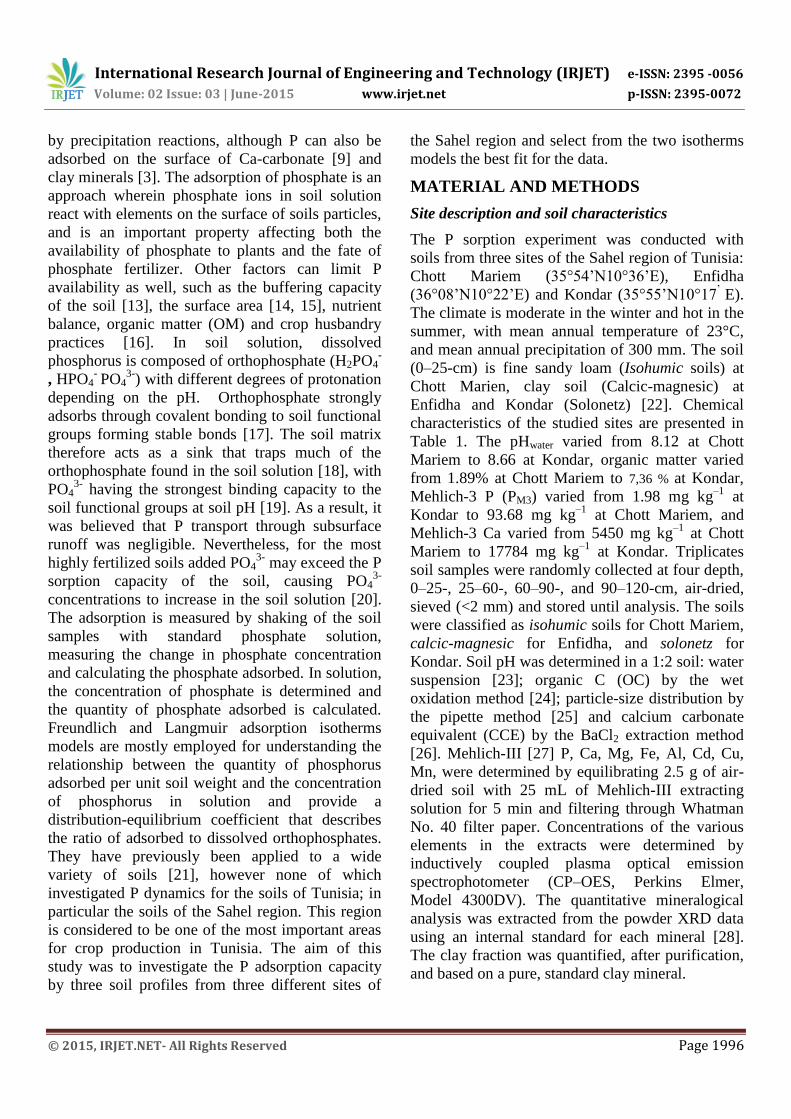
distribution of level of organic matter is influenced
by different factors such the amount of organic
matter and the soil texture, especially clay content
[35,36]. The mineral content (phosphorus, calcium,
magnesium, potassium, iron and aluminum) also
differed markedly between the soils. The Ca
content was particularly different and varied
between less than 6 mgkg-1
dry weight in the
surface horizon for the Chott-Mariem profile to
more than 20 mgkg-1
dry weight for the deeper
horizon from the Kondar profile. The values for the
soils were high and in all instances increased with
depth. By contrast, available P, in the two of the
three soils was low and in all profiles soil P
decreased with depth.
Table1. Samples Soils characteristics
Chott-Mariem site Enfidha site Kondar site
Dept(cm) 0-25 25-60 60-90 90-120 0-25 25-60 60-90 90-120 0-25 25-60 60-90 90-120
pH (H2O) 8.12 8.41 8.56 8.54 8.26 8.14 7.97 7.87 8.66 8.86 8.35 8.12
OM (%) 1,89 1,42 3,61 4,66 3,48 3,18 3,19 3,08 7,36 7,13 5,68 1,89
P(mg/kg) 93,68 20,90 4,12 4,99 4,48 2,19 3,70 3,79 1,98 1,53 1,27 1,91
Ca(mg/kg) 5450 5508 5874 5450 10026 9495 7885 11360 17784 10108 12786 20337
Al(mg/kg) 76 87 72 51 230 159 108 198 34 19 14 34
K (mg/kg) 491 299 135 106 294 310 298 376 143 129 160 234
Fe(mg/kg 33 24 9 3 41 41 45 44 12 19 30 31
Mn(mg/kg) 410 433 356 461 668 774 717 841 680 963 1000 966
Clay 12.8 24.4 30.5 25.8 63.3 76.1 78.8 77.5 58.6 56.8 51.5 71.8
sand 49.2 60.4 59.5 59.1 20.7 13.9 12.2 10.5 28.6 26.8 46 24.2
Silt 38 15.2 10 15.1 16 10 9 12 12.8 16.4 2.5 4
Texture Fine
sandy
loam
Loam
sandy
clay
clay Loam
sandy
clay
Clay Heavy
clay
Heavy
clay
Heavy
clay
Clay Clay Sandy
clay
Heavy
clay
Phosphorus adsorption capacity
The results of the physico-chemical and
mineralogical illustrated in the Tables 1 and 2 show
that there is some correlation between the amounts
of P adsorbed and the different compositions in all
the soils. In fact, the amount of P adsorption have a
positive correlation with the clay content, organic
matter and calcium exchangeable, with organic
matter (OM) and magnesium exchangeable and
with organic matter, exchangeable magnesium and
iron cations respectively in the profile soil of Chott
Mariem, Enfidha and Kondar. This correlation was
also observed by Akhter et al., [37]. The positive
relationship of P adsorption with clay content may
be related with larger surface area of clay as
compared to sand [38]. It could also be related to
the relatively large number of positive charges that
can react and strongly bind the negatively charged
phosphate ions in soil solution. Barbieri et al., [39]
and Broggi et al., [40] indicated that the adsorption
of P on the clay fraction is assigned to the variable
electrical loads of the edges of the sheets of the
clays, especially present in the kaolinite and
smectite. However, our X-ray analyzes have
revealed an abundance of kaolinite and smectite in
our soils (Table 2). Positive relationships of organic matter and P
adsorption had also been reported by several
researchers. Jelali et al. [8] showed that coefficient
for soil OM to predict maximum P adsorption had
positive sign and the soils with high OM had poorly
crystalline iron oxides suggesting inhibiting effect
on iron oxide crystallization through complexation
increasing sorption capacity for phosphate.
Additionally [41] found that the role of organic
matter in increasing the ability of soils to adsorb P
that is attributed to its association with cations such
as Fe, Al and Ca. On the contrary, negative
relationships between the organic matter contents of
soils and P adsorption was reported Waheed et al

International Research Journal of Engineering and Technology (IRJET) e-ISSN: 2395 -0056
Volume: 02 Issue: 03 | June-2015 www.irjet.net p-ISSN: 2395-0072
© 2015, IRJET.NET- All Rights Reserved Page 1999
[42]. They found that the presence of organic
matter on highly weathered soils reduces P
adsorption capacity. This reduction may be due to
direct result of competition for adsorption sites
Table 2: Mineralogical composition of the different soils profiles
Profiles Depths Identification of mineralogy
Kaolinite Quartz Calcite Smectite Illite chlorite
Chott-
Mariem
0-25cm + +++ + - - -
25-60cm - +++ + + - -
60-90cm + +++ + + + -
90-120cm + +++ ++ + + +
Enfidha 0-25cm + +++ ++ + - +
25-60cm + +++ ++ + + -
60-90cm + +++ ++ + + -
90-120cm + +++ ++ + + +
Kondar 0-25cm - +++ +++ + - -
25-60cm + +++ +++ + - +
60-90cm + +++ +++ + + +
90-120cm + ++ ++ + + +
+++ Abundant, ++ moderately abundant, + poorly abundant
between phosphate and organic ligands. There was
also suggestion of possible reduction of organic
matter enhance the positive surface charge by
lowering pH. This decreases the attraction of P to
the soil surface. The relationship between
exchangeable calcium and the soil adsorption
capacity showed that as the exchangeable calcium
increased, the adsorption capacity also increased
[43]. Similar observation has been reported for
Iranian soils [8]. It has been suggested that
increases in P adsorption at high pH values have
frequently been ascribed to the precipitation of
calcium phosphorus. This phenomenon is related to
the high levels of calcium existed, such in our case.
The Ca-minerals promotes the formation of highly
reactive polyhydroxides, and enhance the
adsorption of phosphorus on calcium compound
[44].
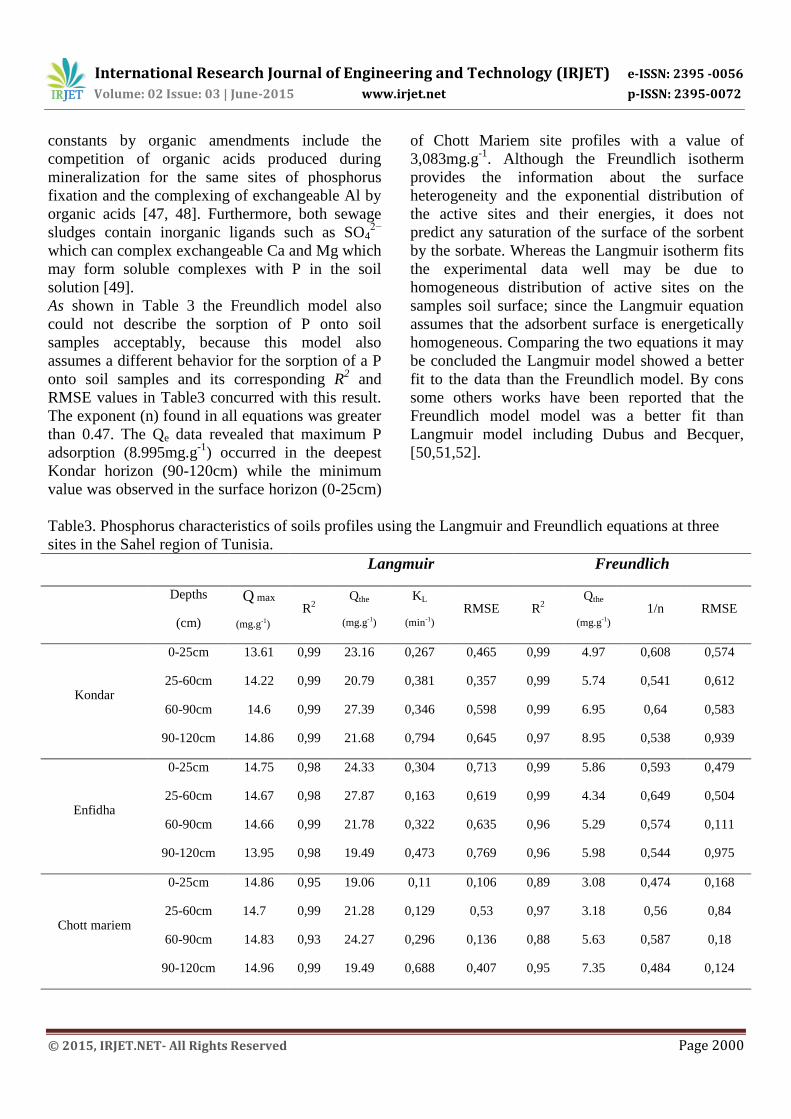
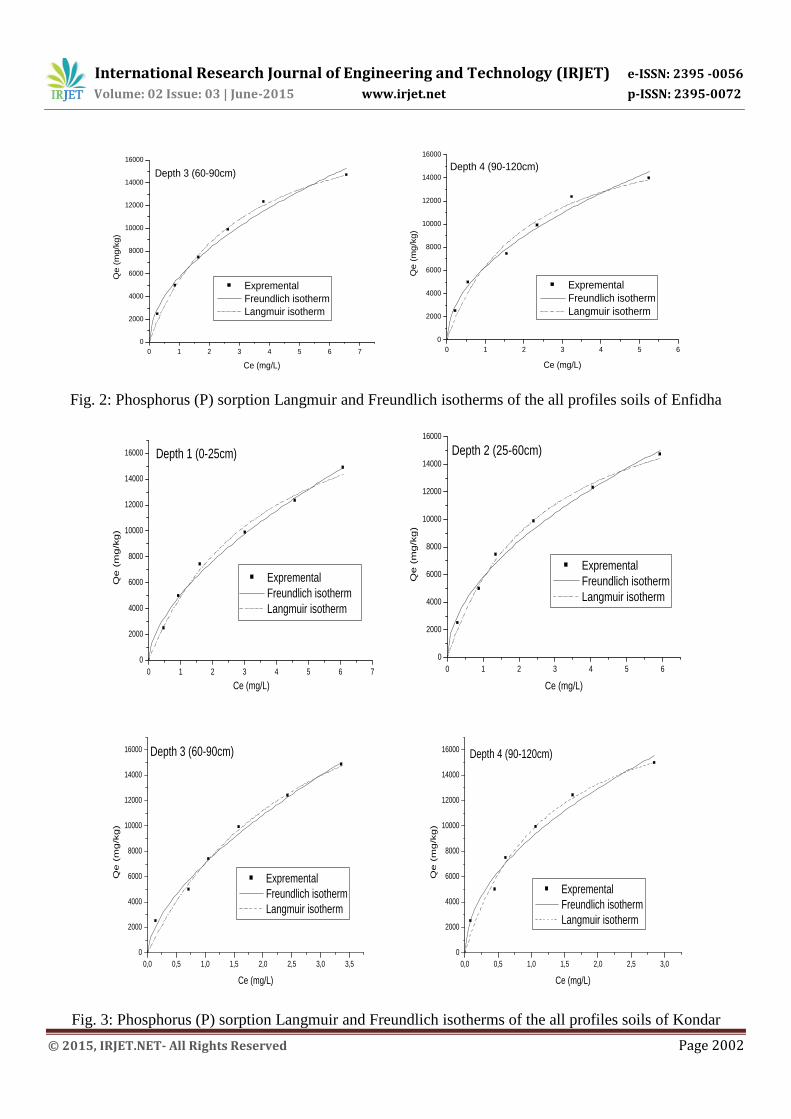
Adsorption modeling
The relationship of soluble and adsorbed P was best
described using the linear form of the two equations
of Langmuir and Freundlich models, Figs (1. 2 and
3). The data thus obtained are presented in Tables
3. Application of the Langmuir equation indicates
that the sorption phenomenon was adequately
described by this isotherm. It can be provided a
strong fit adjusted R2 (R
2 =0.98) and weakness
values of RMSE for all layers of different profiles
except in the layer of (60-90cm) of Chott Mariem
profile witch it recorded a low value of R2
= 0.93
and a high value RMSE= 0,136.The values of
maximum adsorption capacity (Qmax) determined
using Langmuir model was higher than the
experimental adsorbed amount and corresponded to
the adsorption isotherm plateau, which is
unacceptable. The value of kL (Lmg-1
) parameter of
the Langmuir model is the constant representing the
affinity of sorbate to sorbent. Higher b values mean
more affinity of sorbate to sorbent. Comparison of
these values with kL parameter of the Langmuir
model in this study reveals that the sorption affinity
of P to samples soil Chott Mariem is lower than the
affinity of Enfidha and Kondar. Both the Qmax and
binding energy (kL) values indicated that P
adsorption capacity as suggested by the population
of sites in the low equilibrium P. High kL values
observed in this experiment show that the tenacity
of phosphorus sorption is greater at low P
equilibrium concentrations. Qmax tends to be
correlated with soil organic content (Zhong et al.,
2012; Rogan et al., 2010) because the OM controls
P sorption capacity [45, 46]. Processes for the
control of sorption maxima and the affinity
International Research Journal of Engineering and Technology (IRJET) e-ISSN: 2395 -0056
Volume: 02 Issue: 03 | June-2015 www.irjet.net p-ISSN: 2395-0072
© 2015, IRJET.NET- All Rights Reserved Page 2000
constants by organic amendments include the
competition of organic acids produced during
mineralization for the same sites of phosphorus
fixation and the complexing of exchangeable Al by
organic acids [47, 48]. Furthermore, both sewage
sludges contain inorganic ligands such as SO42−
which can complex exchangeable Ca and Mg which
may form soluble complexes with P in the soil
solution [49].
As shown in Table 3 the Freundlich model also
could not describe the sorption of P onto soil
samples acceptably, because this model also
assumes a different behavior for the sorption of a P
onto soil samples and its corresponding R2 and
RMSE values in Table3 concurred with this result.
The exponent (n) found in all equations was greater
than 0.47. The Qe data revealed that maximum P
adsorption (8.995mg.g-1
) occurred in the deepest
Kondar horizon (90-120cm) while the minimum
value was observed in the surface horizon (0-25cm)
of Chott Mariem site profiles with a value of
3,083mg.g-1
. Although the Freundlich isotherm
provides the information about the surface
heterogeneity and the exponential distribution of
the active sites and their energies, it does not
predict any saturation of the surface of the sorbent
by the sorbate. Whereas the Langmuir isotherm fits
the experimental data well may be due to
homogeneous distribution of active sites on the
samples soil surface; since the Langmuir equation
assumes that the adsorbent surface is energetically
homogeneous. Comparing the two equations it may
be concluded the Langmuir model showed a better
fit to the data than the Freundlich model. By cons
some others works have been reported that the
Freundlich model model was a better fit than
Langmuir model including Dubus and Becquer,
[50,51,52].
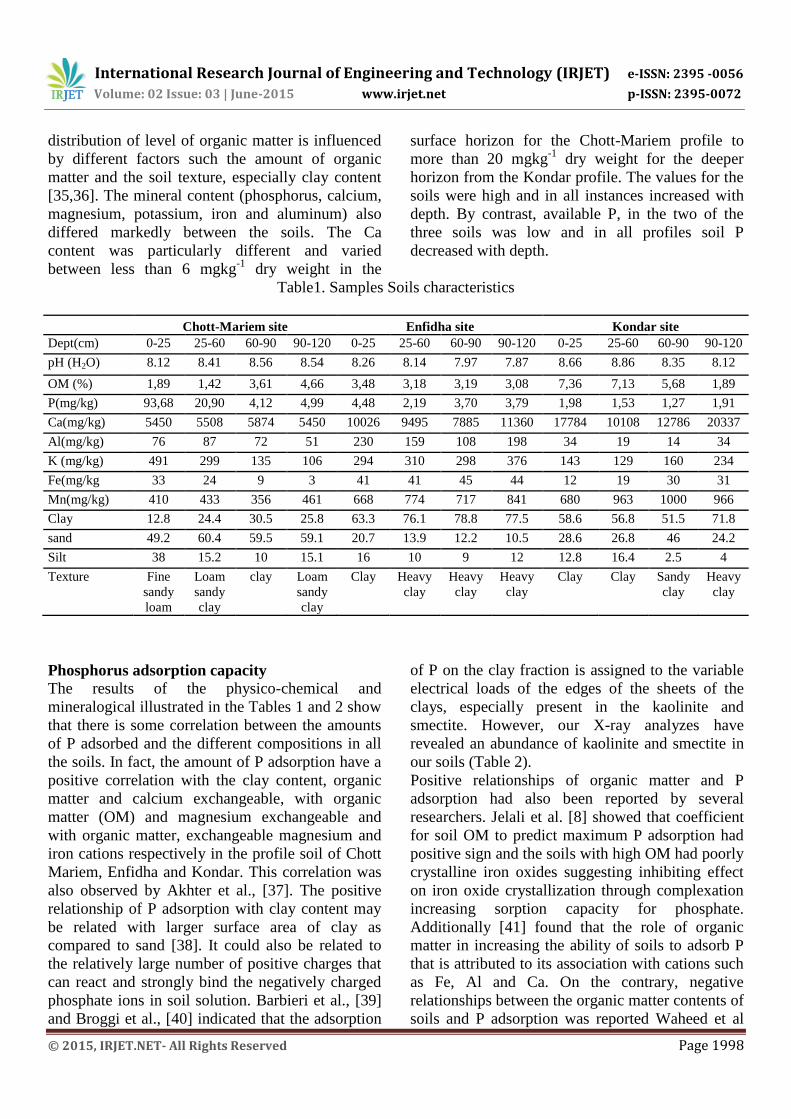
Table3. Phosphorus characteristics of soils profiles using the Langmuir and Freundlich equations at three
sites in the Sahel region of Tunisia. Langmuir Freundlich
Depths
(cm)
Q max
(mg.g-1)
R2
Qthe
(mg.g-1)
KL
(min-1)
RMSE R2
Qthe
(mg.g-1)
1/n RMSE
Kondar
0-25cm 13.61 0,99 23.16 0,267 0,465 0,99 4.97 0,608 0,574
25-60cm 14.22 0,99 20.79 0,381 0,357 0,99 5.74 0,541 0,612
60-90cm 14.6 0,99 27.39 0,346 0,598 0,99 6.95 0,64 0,583
90-120cm 14.86 0,99 21.68 0,794 0,645 0,97 8.95 0,538 0,939
Enfidha
0-25cm 14.75 0,98 24.33 0,304 0,713 0,99 5.86 0,593 0,479
25-60cm 14.67 0,98 27.87 0,163 0,619 0,99 4.34 0,649 0,504
60-90cm 14.66 0,99 21.78 0,322 0,635 0,96 5.29 0,574 0,111
90-120cm 13.95 0,98 19.49 0,473 0,769 0,96 5.98 0,544 0,975
Chott mariem
0-25cm 14.86 0,95 19.06 0,11 0,106 0,89 3.08 0,474 0,168
25-60cm 14.7 0,99 21.28 0,129 0,53 0,97 3.18 0,56 0,84
60-90cm 14.83 0,93 24.27 0,296 0,136 0,88 5.63 0,587 0,18
90-120cm 14.96 0,99 19.49 0,688 0,407 0,95 7.35 0,484 0,124

International Research Journal of Engineering and Technology (IRJET) e-ISSN: 2395 -0056
Volume: 02 Issue: 03 | June-2015 www.irjet.net p-ISSN: 2395-0072
© 2015, IRJET.NET- All Rights Reserved Page 2001
Qmax = P sorption maximum; b= binding energy of P, Qthe = P theoretical sorption; n is a coefficient introducing non-linearity,
RMSE = root mean square error probability.
0 5 10 15 20 25 30
0
2000
4000
6000
8000
10000
12000
14000
Expremental
Freundlich isotherm
Langmuir isotherm
Qe (
mg
/kg)
Ce (mg/L)
Depth 1 (0-25cm)
0 2 4 6 8 10 12 14 16
0
2000
4000
6000
8000
10000
12000
14000
16000
Expremental
Freundlich isotherm
Langmuir isothermQ
e (
mg
/kg
)
Ce (mg/L)
Depth 2 (25-60cm)
0 1 2 3 4 5 6
0
2000
4000
6000
8000
10000
12000
14000
16000
Expremental
Freundlich isotherm
Langmuir isotherm
Qe (
mg/k
g)
Ce (mg/L)
Depth 3 (60-90cm)
0 1 2 3 4 5
0
2000
4000
6000
8000
10000
12000
14000
16000
Expremental
Freundlich isotherm
Langmuir isotherm
Qe (
mg
/kg)
Ce (mg/L)
Depth 4 (90-120cm)
Fig. 1: Phosphorus (P) sorption Langmuir and Freundlich isotherms of the all profiles soils of Chott Mariem
0 1 2 3 4 5
0
2000
4000
6000
8000
10000
12000
14000
16000
Depth 1 (0-25cm)
Expremental
Freundlich isotherm
Langmuir isotherm
Qe
(m
g/k
g)
Ce (mg/L)
0 2 4 6 8 10 12 14 16
0
2000
4000
6000
8000
10000
12000
14000
16000
Expremental
Freundlich isotherm
Langmuir isotherm
Qe
(m
g/k
g)
Ce (mg/L)
Depth 2 (25-60cm)
International Research Journal of Engineering and Technology (IRJET) e-ISSN: 2395 -0056
Volume: 02 Issue: 03 | June-2015 www.irjet.net p-ISSN: 2395-0072
© 2015, IRJET.NET- All Rights Reserved Page 2002
0 1 2 3 4 5 6 7
0
2000
4000
6000
8000
10000
12000
14000
16000
Expremental
Freundlich isotherm
Langmuir isotherm
Qe
(m
g/k
g)
Ce (mg/L)
Depth 3 (60-90cm)
0 1 2 3 4 5 6
0
2000
4000
6000
8000
10000
12000
14000
16000
Expremental
Freundlich isotherm
Langmuir isotherm
Qe (
mg
/kg)
Ce (mg/L)
Depth 4 (90-120cm)
Fig. 2: Phosphorus (P) sorption Langmuir and Freundlich isotherms of the all profiles soils of Enfidha
0 1 2 3 4 5 6 7
0
2000
4000
6000
8000
10000
12000
14000
16000 Depth 1 (0-25cm)
Qe (
mg
/kg)
Ce (mg/L)
Expremental
Freundlich isotherm
Langmuir isotherm
0 1 2 3 4 5 6
0
2000
4000
6000
8000
10000
12000
14000
16000
Expremental
Freundlich isotherm
Langmuir isotherm
Qe
(m
g/k
g)
Ce (mg/L)
Depth 2 (25-60cm)
0,0 0,5 1,0 1,5 2,0 2,5 3,0 3,5
0
2000
4000
6000
8000
10000
12000
14000
16000
Expremental
Freundlich isotherm
Langmuir isotherm
Qe (
mg
/kg)
Ce (mg/L)
Depth 3 (60-90cm)
0,0 0,5 1,0 1,5 2,0 2,5 3,0
0
2000
4000
6000
8000
10000
12000
14000
16000
Expremental
Freundlich isotherm
Langmuir isotherm
Qe (
mg
/kg)
Ce (mg/L)
Depth 4 (90-120cm)
Fig. 3: Phosphorus (P) sorption Langmuir and Freundlich isotherms of the all profiles soils of Kondar
International Research Journal of Engineering and Technology (IRJET) e-ISSN: 2395 -0056
Volume: 02 Issue: 03 | June-2015 www.irjet.net p-ISSN: 2395-0072
© 2015, IRJET.NET- All Rights Reserved Page 2003
Conclusion
The results of this study indicate that the different
profiles of various sites alkaline soils for the Sahel
region have high phosphate adsorption capacities.
The adsorption isotherm showed different curves
for the three soils. From our data, it can be seen that
the soils samples with high organic matter,
exchangeable Ca, exchangeable Mg and clay
content sorbed significantly more P. Phosphorus
adsorbed may be more or less available depending
on the strength of the interaction and type of
compound formed. It is known that minerals such
as hydroxiapatite can be very stable, decreasing
plant available phosphorus [53]. By contrast, soil
samples rich in organic matter (e.g. surface
horizons of Kondar site) had lower phosphorus
adsorption. This suggests that use of organic matter
can be a useful management practice for controlling
P sorption and hence increase fertilizer use
efficiency in these soils. Langmuir and Freundlich
equations were used to describe P adsorption
processes. The results indicate a better fit with the
Langmuir model.
REFERENCES
[1] P Hinsinger. Bioavailability of soil inorganic P
in the rhizosphere as affected by root-induced
chemical changes: a review. Plant Soil. 2001;
237:173–195.
[2] K Raghothama and A Karthikeyan .Phosphate
acquisition. Plant and Soil. 2005; 274:37–49.
[3] N Devau, Hinsinger P, E Le Cadre, B Colomb,
F Gérard. Fertilization and pH effects on processes
and mechanisms controlling dissolved inorganic
phosphorus in soils. Geochim Cosmochim Acta.
2011; 75: 2980–2996.
[4] D Cordell, Drangert JO, S White. The story of
phosphorus: global food security and food for
thought. Glob Environ Change. 2009;19: 292–305.
[5] N Gilbert. Environment: the disappearing
nutrient. Nature. 2009; 461: 716–718.
[6] AE Richardson, JP Lynch, PR Ryan, E
Delhaize, FA Smith, SE Smith. Plant and microbial
strategies to improve the phosphorus efficiency of
agriculture. Plant and soil. 2011; 349: 121-156.
[7] EH Oelkers, E Valsami-Jones, Roncal-Herrero
T. Phosphate mineral reactivity from global cycle
stosustainable development. Mineral.Mag. 2008;
72:337–340.
[8] M Jalali .Phosphorous concentration, solubility
and species in the groundwater in a semi-arid basin,
southern Malayer, western Iran. Environ Geol.
2009; 57:1011–1020.
[9] HU Sø, D Postma, R Jakobsen and F Larsen.
Sorption of phosphate onto calcite; results from
batch experiments and surface complexation
modeling. Geochimica et Cosmochimica Acta.
2011; 75 .29:11–2923.
[10] CP Zhang, P Wu, XZ Tang CY, Tao, ZW Han,
J Sun, H Liu (2013) The study of soil acidification
of paddy field influenced by acid mine drainage.
Environ Earth Sci 70(7):2931–2940.
[11] XJ Wen, CQ Duan, DC Zhang. Effect of
simulated acid rain on soil acidification and rare
earth elements leaching loss in soils of rare earth
mining area in southern Jiangxi Province of China.
Environ Earth Sci. 2013; 69(3):843–853.
[12] TW Chang, MK Wang, C Lin. Adsorption of
copper in the different sorption/water ratios of soil
systems. Water Air Soil Poll.2002; 138:199–209.
[13] AK Søvik, B Kløve. Phosphorus retention
processes in shell sand filter systems treating
municipal wastewater. Ecol Eng. 2005; 25(2):168–
182.
[14] M Ahmed, IR Kennedy, AT Choudhury, ML
Kecske´s and R Deaker. Phosphorus Adsorption in
Some Australian Soils and Influence of Bacteria on
the Desorption of Phosphorus. Communications in
Soil Science and Plant Analysis. 2008;39: 1269–
1294.
[15] Y Yin, CA Impellitteri, SJ You, HE Allen
(2002) The importance of organic matter
distribution and extract soil:solution ratio on the
desorption of heavy metals from soils. Sci Total
Environ 15(287):107–119.

International Research Journal of Engineering and Technology (IRJET) e-ISSN: 2395 -0056
Volume: 02 Issue: 03 | June-2015 www.irjet.net p-ISSN: 2395-0072
© 2015, IRJET.NET- All Rights Reserved Page 2004
[16] M Pirzadeh, M Afyuni, A Khoshgoftarmanesh,
R Schulin. Micronutrient status of calcareous paddy
soils and rice products: implication for human
health. Biol Fert Soils, 2010; 46:317–322.
[17] H Jehangir, S Bhadha, H Daroub, AL Timothy.
Effect of kinetic control, soil:solution ratio,
electrolyte cation, and others, on equilibrium
phosphorus concentration,Geoderma.2012; 173–
174: 209–214.
[18] V Cucarella, G Renman. Phosphorus sorption
capacity of filter materials used for on-site
wastewater treatment determined in batch
experiments-A comparative study. J Environ Qual.
2009; 38:381–392.
[19] Q Zhou, Y Zhu. Potential pollution and
recommended critical levels of phosphorus in
paddy soils of the southern Lake Tai area, China.
Geoderma (2003) 115:45–54.
[20] MB McGechan, DR Lewis. Sorption of
phosphorus by soil, part 1: principles, equations and
models. Biosyst. Eng. 2002; 82: 1–24.
[21] A Mtimet . Soils of Tunisia. In : Zdruli P,
Steduto P, Lacirignola C, Montanarella L, eds. Soil
resources of Southern and Eastern Mediterranean
countries. Bari : Centre international de hautes
études agronomiques méditerranéennes- Instituto
Agronomico Mediterraneo di Bari. 2001.
[22] A Walkley and IA Black . An examination of
the Degtjareff method for determining soil organic
matter, and a proposed modification of the chromic
acid titration method. Soil Science, 1934; 37:29-38.
[23] GW Gee, JW Bauder. Particle-size Analysis.
P. 383 - 411. In A.L. Page (ed.). Methods of soil
analysis, Part1, Physical and mineralogical
methods. Second Edition, American Society of
Agronomy, Madison, WI. FL, USA. 1986; 167-175.
[24] WH Hendershot, H Lalande, M Duquette. Ion
exchange and exchangeable cations. In: Soil
Sampling and Methods of Analysis (Carter M. R.,
ed.). Boca Raton, FL, USA: Lewis Publisher.
1993b; 167–175.
[25] A Mehlich. Mehlich-3 soil test extractant: a
modification of Mehlich-2 extractant. Commun.
Soil Sci. Plant Anal. 1984; 15: 1409-1416.
[26] RD Cody, GL Thompson. Quantitative X-ray
powder diffraction analysis of clays using an
orienting internal standard and pressed disks of
bulk shale samples. Clays and Clay Minerals,
1976;24, 224–231.
[27] J Murphy and JP Riley. A modified single
solution method for determination of phosphate in
natural waters. Anal. Chim. Acta. 1962; 27:31-36.
[28] SAS Institute. SAS user’s guide: Statistics,
Ver. 8.2, Cary, N.C. 2001.
[29] S Daroub, JD Stuck, OA Diaz. Phosphorus
Transport Studies in the WCA: WCA Canal
Sediment P Studies, Inventory, Release and
Transport." Seminar presented at the ARM
Loxahatchee National Wildlife Refuge; 2003.
[30] R McDowell, N Mahieu, P Brookes, P
Poulton. Mechanisms of phosphorus solubilisation
in a limed soil as function of pH. Chemosphere.
2003; 51:685–692.
[31] RW McDowell, AN Sharpley. Approximating
phosphorus release from soils to surface runoff and
subsurface drainage. J Environ Qual, 2001;30:508–
520.
[32] A Zhou, H Tang, D Wang (2005) Phosphorus
adsorption on natural sediments: modeling and
effects of pH and sediment composition. Water Res
39:1245–1254.
[33] M Jalali, MN Hemati. Soil phosphorus forms
and their variations in selected paddy soils of Iran.
Environ Monit Assess. 2014; 85:8557–8565.
[34] R Cornelia, K Ingrid. Deep soil organic matter-
a key but poorly understood component of
terrestrial C cycle. Plant Soil. 2010; 338:143–158.
[35] DV Ige, O Akinremi, D Flaten. Evaluation of
phosphorus retention equations for Manitoba soils.
Can J Soil Sci, 2008; 88:327–335.
- D Curtin, JK Syers. Lime-induced changes in
indices of soil phosphate availability. Soil Sci Soc
Am J. 2001; 65:147–152.
[36] R Hiederer, R Jones, J Daroussin. Soil Profile
Analytical Database for Europe (SPADE):
Reconstruction and Validation of the Measured
Data (SPADE/M). Geografisk Tidsskrift, Danish
Journal of Geography. 2006; 106-71-85.

International Research Journal of Engineering and Technology (IRJET) e-ISSN: 2395 -0056
Volume: 02 Issue: 03 | June-2015 www.irjet.net p-ISSN: 2395-0072
© 2015, IRJET.NET- All Rights Reserved Page 2005
[37] MS Akhter, BK Richards, P Medrano, De M
Groot. and TS Steenhuis. Dissolved phosphorus
from undisturbed soil cores: Related to adsorption
strength, flow rate or soil structure. Soil Sci. Soc.
Am. J. 2003;67:458–470.
[38] M Sarfaraz, M Abid and SM Mehdi. External
and internal phosphorus requirement of wheat in
Rasulpur soil series of Pakistan. Soil and
Environment. 2009; 28: 38-44.
[39] DM Barbieri, J Marques, L Alleoni, FJ
Garbuio, OA Camargo. Hillslope curvature, clay
mineralogy, and phosphorus adsorption in an
Alfisol cultivated with sugarcane. Scientia
Agricola. 2009; 819-826.
[40] F Broggi, AC Oliverira, F Freire, M Freire, C
Nascimento. Adsorption and chemical extraction of
phosphorus as a function of soil incubation time.
Revista Brasileira de Engenharia Agrícola e
Ambiental. 2010; 32-38.
[41] A Waheed, M Yousaf, M Mukhtar and T
Mahmood. Phosphorus adsorption characteristics of
soil in relation to different phosphatic fertilizers.
Abstract published in 10th
international congress of
soil science at Tandojam Sindh, Pakistan. 2004; 30.
[42] AG Buret, K Scott, AC Chin. Giardiasis:
Pathophysiology and pathogenesis, in: Giardia, the
cosmopolitan parasite. Olson B., Olson M.E. &
Wallis P.M. (eds), CAB International, Wallingford
(UK). 2002; 109-127.
[43] LY Zhong, LM Liu, JW Yang.
Characterization of heavy metal pollution in the
paddy soils of Xiangyin County, Dongting lake
drainage basin, central south China. Environ Earth
Sci 2012; 67(8): 2261–2268.
[44] N Rogan, T Dolenec, T Serafimovski, G
Tasev, M Dolenec. Distribution and mobility of
heavy metals in paddy soils of the Koani field in
Macedonia. Environ Earth Sci. 2010; 61(5):899–
907.
[45] HS Hundal, K Singh, D Singh, R Kumar.
Arsenic mobilization in alluvial soils of Punjab,
North-West India under flood irrigation practices.
Environ Earth Sci. 2013;69(5):1637–1648.
[46] Li TQ, H Jiang, Yang X, He ZL. Competitive
sorption and desorption of cadmium and lead in
paddy soils of eastern China. Environ Earth Sci.
2013; 68(6):1599–1607.
[47] Tu CL, He TB, Lu XH, Lang YC, Li LB.
Accumulation of trace elements in paddy topsoil of
the Wudang County,Southwest China: parent
materials and anthropogenic controls. Environ
Earth Sci. 2013; 70(1):131–137.
[48] CF Wu, LM Zhang. Heavy metal
concentrations and their possible sources in paddy
soils of a modern agricultural zone, southeastern
China. Environ Earth Sci, 2010; 60(1):45–56.
[49] H Moazed, Y Hoseini, A Naseri and F Abbasi.
Determining phosphorus adsorption isotherm in soil
and its relation to soil characteristics." Journal of
Food, Agriculture and Environment, 2010; 8(2),
1153-1157.
[50] IG Dubus, T Becquer. Phosphorus sorption
and desorption in oxide-rich Ferralsols of New
Caledonia. Aust. J. Soil Res. 2001; 39: 403-414.
[51] C Victor, Z Tomasz and M Ryszard .
Phosphorus sorption capacity of different types of
opoka. Annals of Warsaw University of Life
Sciences – SGGW. Land Reclamation. 2007;
38:11–18.
[52] MS Khan, A Zaidi, M Ahemad, M Oves and
PA Wani .Plant growth promotion by phosphate
solubilizing fungi-current perspective. Arch. Agron.
Soil Sci. 2010;56:73-98.
[53] L Johansson and J P Gustafsson. Phosphate
removal using blast furnace slags and opoka-
mechanisms. Water Research. 2000; 34(1), 259-
265.
Related Documents