Feature Ireland’s immigration policies (1997–present): Links to global trends of labour division and effects on national labour market structure Siobha ´n R McPhee University of British Columbia, Canada Abstract Ireland’s economic growth (1992–2007) was fuelled by availability of capital, but also through access to cheap flexible labour. This article attempts to provide evidence that the Irish state played a central role in facilitating and shaping labour supply, a role that has resulted in the clustering of non-Irish workers in particular sectors of the labour market. Worker mobility across national borders takes place at the intersection of global economic trends and local or regional labour market development, thus creating global consistency in the operation of local or regional markets and demand for workers; however, each labour market is unique as each creates its own local and global social relations. The state, as a main actor in the formulation of immi- gration policies and in shaping labour market structure, has a central role in affecting the nature of the interconnection between global and local. The analysis considers how Ireland’s immigration policies, as they reflect global labour trends, contribute to the clustering of certain migrants in particular sectors. The method of analysis involves a three-step numerical analysis of clustering: (1) percentages, (2) ODDS ratios and (3) two-step cluster analysis. Results suggest the existence of economic clustering and channelling of workers into specific jobs linked back to immigration policies and recruitment drives. Keywords clustering, Dublin, immigration polices, Ireland, location quotients, ODDs ratio, segmented labour markets Corresponding author: Siobha ´n R McPhee, Department of Geography, University of British Columbia, 1984 West Mall Vancouver, BC V6T 1Z2, Canada. Email: [email protected] Local Economy 2014, Vol. 29(6–7) 579–597 ! The Author(s) 2014 Reprints and permissions: sagepub.co.uk/journalsPermissions.nav DOI: 10.1177/0269094214543168 lec.sagepub.com at University of British Columbia Library on February 23, 2015 lec.sagepub.com Downloaded from

Welcome message from author
This document is posted to help you gain knowledge. Please leave a comment to let me know what you think about it! Share it to your friends and learn new things together.
Transcript
Feature
Ireland’s immigrationpolicies (1997–present):Links to global trends oflabour division and effectson national labourmarket structure
Siobhan R McPheeUniversity of British Columbia, Canada
Abstract
Ireland’s economic growth (1992–2007) was fuelled by availability of capital, but also through
access to cheap flexible labour. This article attempts to provide evidence that the Irish state
played a central role in facilitating and shaping labour supply, a role that has resulted in the
clustering of non-Irish workers in particular sectors of the labour market. Worker mobility
across national borders takes place at the intersection of global economic trends and local or
regional labour market development, thus creating global consistency in the operation of local or
regional markets and demand for workers; however, each labour market is unique as each creates
its own local and global social relations. The state, as a main actor in the formulation of immi-
gration policies and in shaping labour market structure, has a central role in affecting the nature of
the interconnection between global and local. The analysis considers how Ireland’s immigration
policies, as they reflect global labour trends, contribute to the clustering of certain migrants in
particular sectors. The method of analysis involves a three-step numerical analysis of clustering:
(1) percentages, (2) ODDS ratios and (3) two-step cluster analysis. Results suggest the existence
of economic clustering and channelling of workers into specific jobs linked back to immigration
policies and recruitment drives.
Keywords
clustering, Dublin, immigration polices, Ireland, location quotients, ODDs ratio, segmented labour
markets
Corresponding author:
Siobhan R McPhee, Department of Geography, University
of British Columbia, 1984 West Mall Vancouver, BC V6T
1Z2, Canada.
Email: [email protected]
Local Economy
2014, Vol. 29(6–7) 579–597
! The Author(s) 2014
Reprints and permissions:
sagepub.co.uk/journalsPermissions.nav
DOI: 10.1177/0269094214543168
lec.sagepub.com
at University of British Columbia Library on February 23, 2015lec.sagepub.comDownloaded from
An overview of Irishimmigration
Ireland’s historical demographic and migra-tion profile is unique, particularly in theWestern European context (Mac Einrı andWhite, 2008). The famine of the 1840s wasthe beginning of a long period of emigrationfrom Ireland lasting until the late 1950s,during which local population levels neverincreased. A new Taoiseach (PrimeMinister), Sean Lemass (1959–1966),brought Ireland more into the folds ofEurope with job creation, an improvedeconomy and the eventual joining of theEuropean Economic Community in 1973(Garvin, 2009). These factors led to adecline in emigration and in fact a 22%increase in population (Mac Einrı, 2001)as Irish emigrants returned to Ireland withtheir families. Recession ensued in the 1980sleading to renewed emigration to a return toemigration as unemployment rates reached16% (Central Statistics Office).
The emergence of the Celtic Tiger eco-nomic boom saw growth in employmentand the economy and inward multinationalinvestment (primarily in the IT andpharmaceutical sectors). Ireland was sud-denly experiencing an inflow of migrants;however, it is important to note, especiallyin the earlier years of the Celtic Tiger, that alarge proportion of these were returnee Irishfrom the 1980s emigration flow (Gilmartin,2004). The numbers seeking asylum peakedat 11,634 in 2002 before dropping to 7900 in2003, and 4304 in 2005 (Mac Einrı andCoakley, 2007; Ruhs, 2004). For most ofthe late 1990s, the majority of asylum see-kers came from Africa and until 1999 54%of these came from three countries: Nigeria,the Democratic Republic of Congo andAlgeria (Faughnan and Woods, 2000). In1999, the situation changed as mostasylum applicants came from Romania.
Prior to the 1990s, few immigrants cameto Ireland who were neither of Irish nor
British background, and non-EU immigra-tion, aside from professionals in the multi-national sector, was insignificant (Barrettet al., 2006). This changed dramatically atthe end of the 1990s, and immigrantsincluded workers on short-term work per-mits, asylum seekers and students. The resulthas been that 486,300 people moved toIreland in the period whilst 263,800 peopleemigrated, resulting in net immigration of222,500 (Central Statistics Office). Net immi-gration continued until the onset of the Irishrecession in 2007 and the global financialcrash in 2008 (Ruhs and Quinn, 2009).
Linked to the immigration trends was theskills shortage problem which Ireland facedwith surges in Foreign Direct Investment(FDI) and export demand in the ICT andpharmaceutical sectors between 1995 and2002 (Barrett et al., 2006). This was fol-lowed by six years of growth due to thebubble period of property-price inflationthat yielded high levels of transactionbased tax revenue and triggered unsustain-able levels of expenditure (Honohan, 2010).Growth, during the period 1995–2008, ini-tially due to FDIs followed by property-price inflation, occurred across the economyspecifically in the low-skilled service sector.A good example of this market expansioncan be seen in the Irish hospitality sector,considered one of the major indicators ofgrowth as an economy booms and grows(Cangiano 2008; Cholewinski, 2005). Atthe height of the bubble period, the servicessector accounted for 66% of the economy(Central Statistics Office). The rapid expan-sion of the services sector created labourshortages in both high-skilled and low-skilled jobs as the demand could not bemet by the Irish labour force (Turner, 2010).
State policies and migrantworkers
With the growing labour shortages, specif-ically in the service sector of the economy,
580 Local Economy 29(6–7)
at University of British Columbia Library on February 23, 2015lec.sagepub.comDownloaded from
immigration became a labour source, withworkers selected through work permitschemes, the Green Card scheme andthrough full labour market access for 2004EU accession countries. The ‘Jobs IrelandCampaign’,1 financed through governmentgrants, was aimed particularly at highskilled sectors with large labour shortages.This campaign continued until 2002 when itwas decided it had ‘successfully achieved itsobjectives’ (O’Byrne of FAS, cited inHayward and Howard, 2007: 49).Involvement of the Department ofEnterprise and Employment in formulatingrecruitment policy highlights the import-ance of the state in connecting labourdemand and immigration, i.e. in doing soimmigration is considered as a form oflabour supply. The work permit scheme,modelled on that of guest worker pro-grammes in France and Germany, wasintroduced in 1999 with a 700% increasein the number of permits issued between1999 and 2003 (Ruhs, 2005: 15).
The Irish State adopted a more interven-tionist approach to work migration (Ruhs,2005), a fact further illustrated when theIrish government chose to allow full accessto labour markets for 2004 accession work-ers. The belief was that this new flow oflabour would fill gaps in the labourmarket, though this policy was not grantedto the 2007 accession countries of Bulgariaand Romania due to changes in the outlookfor economic growth. Hence, rather thanhaving a more liberated and enlightenedposition, the Irish State illustrates a degreeof ambiguity to the mechanisms of demandfor labour.
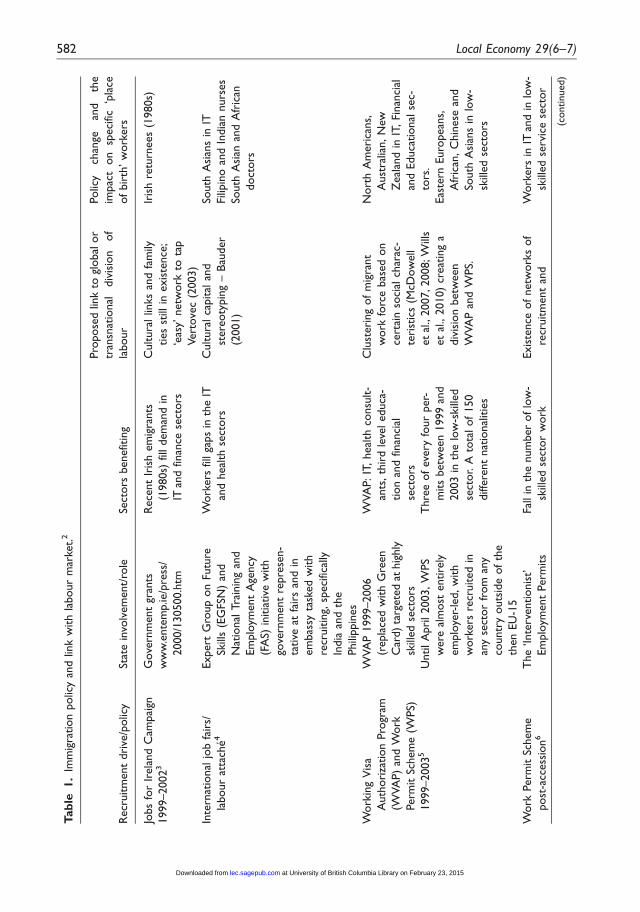
Table 1 provides an outline of the differ-ent policies, recruitment drives, permits andvisas available to migrant workers inIreland. The first column outlines the spe-cific recruitment drive or policy that con-tributed to immigration into Ireland. Therole of the Irish state is outlined in thesecond column with the specific sectors
that benefitted in the third column. Thefourth column illustrates how each of therecruitment drives or policies is linked tobroader theoretical and empirical discus-sions. The final column highlights worker‘place of birth’ links to specific recruitmentdrives or policies. Links between economicgrowth, state action and immigration policyissues are evident, and have led to the chan-nelling of workers into sectors and jobs.
Approaching spatial clusteringanalysis
While international migrations areembedded in larger geopolitical and trans-national economic dynamics, the formationof national politics and the impact of theseon the individual workers are in the realmof the nation state (Sassen, 1998). The resultof the exercise of power by the state and itsrole in linking the dialectical interconnec-tion between the global and the local(Massey, 2005) are the subject of thispaper. Policies of the Irish state are ana-lysed to evaluate how they facilitate andbenefit from the existence of global supplyof labour. The impact of these immigrationpolicies on the Irish labour market is mea-sured through an adoption of SegmentedLabour Market (SLM) theory, specificallythe spatial segmentation of workers. Socialprocesses are spatial processes (Jessop et al.,2008) and all workers have spatial relation-ships that tie them into the local labourmarket.
Geographers have been trying to tacklelabour regulation by reconstructing the con-cept of the local labour market within a pol-itical economy framework. ‘Local labourmarkets are man-made, not neutral, andare structured according to power, not neu-tral rules of demand and supply’ (Clark,1983: 2). There is not a perfect fit betweenlabour supply and labour demand as labourmarket roles are not created in isolationfrom the structure of society, and
McPhee 581
at University of British Columbia Library on February 23, 2015lec.sagepub.comDownloaded from
Tab
le1.
Imm
igra
tion
polic
yan
dlin
kw
ith
labour
mar
ket.
2
Recr
uitm
ent
dri
ve/p
olic
ySt
ate
invo
lvem
ent/
role
Sect
ors
benefit
ing
Pro
pose
dlin
kto
global
or
tran
snat
ional
div
isio
nof
labour
Polic
ych
ange
and
the
impac
ton
speci
fic‘p
lace
of
bir
th’w
ork
ers
Jobs
for
Irela
nd
Cam
pai
gn
1999–2002
3G
ove
rnm
ent
gran
ts
ww
w.e
nte
mp.ie
/pre
ss/
2000/1
30500.h
tm
Rece
nt
Iris
hem
igra
nts
(1980s)
filldem
and
in
ITan
dfin
ance
sect
ors
Cultura
llin
ks
and
fam
ily
ties
still
inexis
tence
;
‘eas
y’netw
ork
tota
p
Vert
ove
c(2
003)
Iris
hre
turn
ees
(1980s)
Inte
rnat
ional
job
fair
s/
labour
atta
che
4Expert
Gro
up
on
Futu
re
Skill
s(E
GFS
N)
and
Nat
ional
Tra
inin
gan
d
Em
plo
yment
Age
ncy
(FA
S)in
itia
tive
with
gove
rnm
ent
repre
sen-
tative
atfa
irs
and
in
em
bas
syta
sked
with
recr
uitin
g,sp
eci
fical
ly
India
and
the
Phili
ppin
es
Work
ers
fillga
ps
inth
eIT
and
heal
thse
ctors
Cultura
lca
pital
and
stere
oty
pin
g–
Bau
der
(2001)
South
Asi
ans
inIT
Filip
ino
and
India
nnurs
es
South
Asi
anan
dA
fric
an
doct
ors
Work
ing
Vis
a
Auth
ori
zation
Pro
gram
(WVA
P)
and
Work
Perm
itSc
hem
e(W
PS)
1999–2003
5
WVA
P1999–2006
(repla
ced
with
Gre
en
Car
d)
targ
ete
dat
hig
hly
skill
ed
sect
ors
UntilA
pri
l2003,W
PS
were
alm
ost
entire
ly
em
plo
yer-
led,w
ith
work
ers
recr
uited
in
any
sect
or
from
any
countr
youts
ide
of
the
then
EU
-15
WVA
P:IT
,heal
thco
nsu
lt-
ants
,th
ird
leve
leduca
-
tion
and
finan
cial
sect
ors
Thre
eof
every
four
per-
mits
betw
een
1999
and
2003
inth
elo
w-s
kill
ed
sect
or.
Ato
talof
150
diff
ere
nt
nat
ional
itie
s
Clu
steri
ng
of
mig
rant
work
forc
ebas
ed
on
cert
ain
soci
alch
arac
-
teri
stic
s(M
cDow
ell
et
al.,
2007,2008;W
ills
et
al.,
2010)
creat
ing
a
div
isio
nbetw
een
WVA
Pan
dW
PS.
Nort
hA
meri
cans,
Aust
ralia
n,N
ew
Zeal
and
inIT
,Fi
nan
cial
and
Educa
tional
sec-
tors
.
Eas
tern
Euro
pean
s,
Afr
ican
,C
hin
ese
and
South
Asi
ans
inlo
w-
skill
ed
sect
ors
Work
Perm
itSc
hem
e
post
-acc
ess
ion
6T
he
‘Inte
rventionis
t’
Em
plo
yment
Perm
its
Fall
inth
enum
ber
oflo
w-
skill
ed
sect
or
work
Exis
tence
of
netw
ork
sof
recr
uitm
ent
and
Work
ers
inIT
and
inlo
w-
skill
ed
serv
ice
sect
or
(continued)
582 Local Economy 29(6–7)
at University of British Columbia Library on February 23, 2015lec.sagepub.comDownloaded from
Tab
le1.
Continued.
Recr
uitm
ent
dri
ve/p
olic
ySt
ate
invo
lvem
ent/
role
Sect
ors
benefit
ing
Pro
pose
dlin
kto
global
or
tran
snat
ional
div
isio
nof
labour
Polic
ych
ange
and
the
impac
ton
speci
fic‘p
lace
of
bir
th’
work
ers
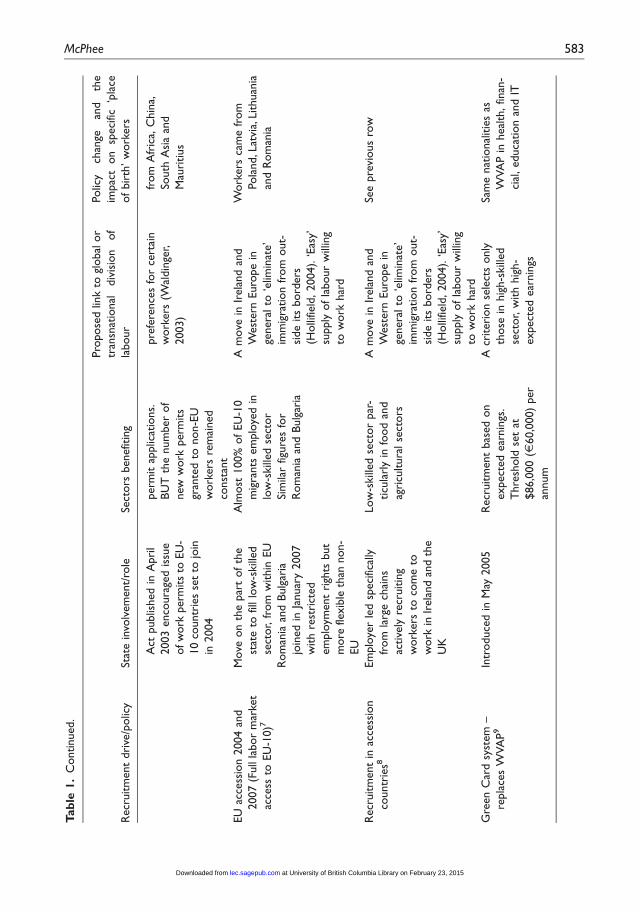
Act
publis
hed
inA
pri
l
2003
enco
ura
ged
issu
e
ofw
ork
perm
its
toEU
-
10
countr
ies
set
tojo
in
in2004
perm
itap
plic
atio
ns.
BU
Tth
enum
ber
of
new
work
perm
its
gran
ted
tonon-E
U
work
ers
rem
ained
const
ant
pre
fere
nce
sfo
rce
rtai
n
work
ers
(Wal
din
ger,
2003)
from
Afr
ica,
Chin
a,
South
Asi
aan
d
Mau
ritius
EU
acce
ssio
n2004
and
2007
(Full
labor
mar
ket
acce
ssto
EU
-10)7
Move
on
the
par
tof
the
stat
eto
filllo
w-s
kill
ed
sect
or,
from
within
EU
Rom
ania
and
Bulg
aria
join
ed
inJa
nuar
y2007
with
rest
rict
ed
em
plo
yment
righ
tsbut
more
flexib
leth
annon-
EU
Alm
ost
100%
of
EU
-10
mig
rants
em
plo
yed
in
low
-skill
ed
sect
or
Sim
ilar
figure
sfo
r
Rom
ania
and
Bulg
aria
Am
ove
inIr
ela
nd
and
West
ern
Euro
pe
in
genera
lto
‘elim
inat
e’
imm
igra
tion
from
out-
side
its
bord
ers
(Holli
field
,2004).
‘Eas
y’
supply
of
labour
will
ing
tow
ork
har
d
Work
ers
cam
efr
om
Pola
nd,L
atvi
a,Lithuan
ia
and
Rom
ania
Recr
uitm
ent
inac
cess
ion
countr
ies8
Em
plo
yer
led
speci
fical
ly
from
larg
ech
ains
active
lyre
cruitin
g
work
ers
toco
me
to
work
inIr
ela
nd
and
the
UK
Low
-skill
ed
sect
or
par
-
ticu
larl
yin
food
and
agri
cultura
lse
ctors
Am
ove
inIr
ela
nd
and
West
ern
Euro
pe
in
genera
lto
‘elim
inat
e’
imm
igra
tion
from
out-
side
its
bord
ers
(Holli
field
,2004).
‘Eas
y’
supply
of
labour
will
ing
tow
ork
har
d
See
pre
vious
row
Gre
en
Car
dsy
stem
–
repla
ces
WVA
P9
Intr
oduce
din
May
2005
Recr
uitm
ent
bas
ed
on
expect
ed
ear
nin
gs.
Thre
shold
set
at
$86,0
00
(E60,0
00)
per
annum
Acr
iteri
on
sele
cts
only
those
inhig
h-s
kill
ed
sect
or,
with
hig
h-
expect
ed
ear
nin
gs
Sam
enat
ional
itie
sas
WVA
Pin
heal
th,fin
an-
cial
,educa
tion
and
IT
McPhee 583
at University of British Columbia Library on February 23, 2015lec.sagepub.comDownloaded from
‘undesirable’ jobs or conditions can only bedefined and filled when there are individualsto accept them (Piore and Doeringer, 1971);therefore matching people with jobs issocially constructed (Bauder, 2001). Withthe adoption of SLM, there is an acknow-ledgment of the fundamental role that geo-graphical theory must play in looking at therelationship between the local labourmarket and state structure, and the impactof the spatial division of labour (Castreeet al., 2004). Hence supply of and demandfor labour along with the role of the stateshould be understood as autonomous butequally influential factors in local labourmarket processes. This paper does notintend to tackle all sides of the triad ofSLM (supply, demand and the state), butfocuses on the specifics of the Irish state’simmigration policies with regard to labourmigrants and how these led to spatial clus-tering of workers in specific jobs. Capitaldoes not create particular roles for thesemigrant groups through the combinationof specific demographic conditions (wheremigrant workers come from) and thenature of the state (Peck, 1996), but itdoes exploit their existence (Bauder, 2001).
In linking relationships between eco-nomic change, immigration policies andsocial characteristics of workers, spatialclustering analysis, focusing on the industryof employment, can offer an overview ofevidence of spatial segmentation in thelabour market. As stated in the opening sec-tion, a geographical approach plays a fun-damental role with its focus on the locallabour market and the role of the state inhow this translates into a greater under-standing of broader national and inter-national market structure. Rather thanattempting to state conclusively that seg-mented labour markets exist in Ireland (anintrinsically difficult analysis to do), the aimis to establish that the Irish state had/has arole in creating and maintaining spatial seg-mentation within the local labour market
(Massey, 2005, 2007). The analysis offersbroad and initial indication of the possibil-ity of existing labour market inequalities,which may be evidence of segmentedlabour market (McDowell et al., 2008,2009). In Australia, Chiswick et al. (2003)illustrate the geographical concentration ofdifferent immigrant groups across the coun-try, with the framework including variablesassociated with labour market processes. In‘Global Cities at Work’, Wills et al. (2010)focus on the industrial concentration ofimmigrants, specifically in temporary low-paid jobs in London’s metropolitan area.Such jobs exist because of economic devel-opment approaches adopted by the UKsince the 1980s.
Methodological approach
Ireland is a small economy in terms of thespectrum of economic activities and henceindustrial classification is selected as theempirical tool to most accurately capture thestructure of the economy and provide evi-dence of spatial clustering. Data from theCentral Statistics Office (CSO) in the form ofthe national census as well as the QuarterlyNational Household Survey (QNHS) areused to perform the analysis. The variable‘place of birth’ rather than nationality or citi-zenship is selectedas the dependent variable inanalysing distribution across industrial sec-tors. There are two reasons for this selection:the first is that it provides the most significantbreakdown of different nationalities in theIrish labour market; the second is the natureof recent immigration to Ireland, whichmeans that the majority of migrant workershavenotobtained Irish citizenshipor perman-ent residency.
Three-step analysis
Although the outline of immigration policychanges (see final column of Table 1) indi-cates a relationship with the ‘place of birth’
584 Local Economy 29(6–7)
at University of British Columbia Library on February 23, 2015lec.sagepub.comDownloaded from
of workers coming into Ireland, further evi-dence is required to establish whether or notgroups of workers are spatially segmentedin certain jobs. The analysis that followsprovides a three-step process in the presen-tation of evidence of clustering of workersof certain ‘place of birth’ in particular sec-tors in the labour market. The initial sourceis percentage evidence based on ‘place ofbirth’ and sector of employment (Souza-Poza, 2004). To further verify industrialand spatial segmentation in the Irishlabour market by non-Irish ‘place ofbirth’, an ODDs ratio analysis is appliedfollowed by application of a two-step clus-ter analysis (Ellis et al., 2004, 2007).
Step 1. Labour market percentage distribution by
‘place of birth’. Table 2 illustrates the per-centage distribution breakdown of workersin the major migrant receiving sectors. Thetable shows the percentage by industry foreach ‘place of birth’ region as a percentageof the total for that specific ‘place of birth’region. Workers whose ‘place of birth’ isPoland, Lithuania, Other EU 15–25 andOther European are concentrated in theindustrial categories of manufacturing, con-struction, wholesale and retail, and hoteland restaurant work. In linking it back tothe role of the state and immigration policy,the decision to grant full working rights toEU accession countries in 2004 was deter-mined by demand in these sectors and led toa dramatic drop in the number of workpermit applications (see Table 1). Othertrends appear such as the Africa ‘place ofbirth’ in real estate, renting and businessactivity industry. Many of the Africa‘place of birth’ arrived as refugees, butover time have set up small businesses inmany urban centres, but specifically incounties Laois and Louth as these werethe towns where they were first housed bythe state on arrival (CSO, 2011; Fanninget al., 2000; Guerin, 2002). Workers fromAsia ‘place of birth’ are 30% more likely
to be employed in health and social workthan any other industry, a direct result ofstate recruitment drives for nurses and doc-tors in Asia (see Table 1).
Step 2. ODDs Ratio. The second step calcu-lates the likelihood of the employment of aparticular non-Irish group in a specificindustry compared to Irish counterparts orthe ODDS ratio.10 ODDs ratio measuresthe effect size, describing the strength ofthe relationship between ‘place of birth’and sector of employment. This descriptivetest illustrates each migrant worker groupcompared to their Irish counterpart. AnODDS ratio (OR) of less than 1 impliesthat employment (E) is less concentratedcompared to others; if OR is equal to 1then E has the same concentration com-pared to others; and if OR is greater than1 then E is more concentrated compared toothers. In this research, an industrial clusteris defined as one in which the ODDS ratio is1.5 or greater (Wang and Pandit, 2007;Hudson, 2003; Wright and Ellis, 2000).Table 3 provides a summary of the mostsignificant ODDS ratio based on the dataanalysis.
Results further emphasise the percentagedistribution analysis illustrating the concen-tration of female migrant workers fromEastern Europe, specifically Lithuania, inagriculture. The presence of a very highODDs ratio of Asian male migrant workersin the hotels and restaurant sector also con-curs with the percentage distribution ana-lysis, and further illustrates the lowincidence of Irish workers, specificallymales, in this sector. The ODDs ratio high-lights the area of business activities, asaddressed in step 1 with percentage concen-tration of Africa ‘place of birth’, beingattributed possibly to workers from this‘place of birth’ region engaging in the grow-ing number of ethnic businesses in urbancentres (Birdthistle, 2012, Cooney andFlynn, 2008). The ODDs ratios in terms of
McPhee 585
at University of British Columbia Library on February 23, 2015lec.sagepub.comDownloaded from
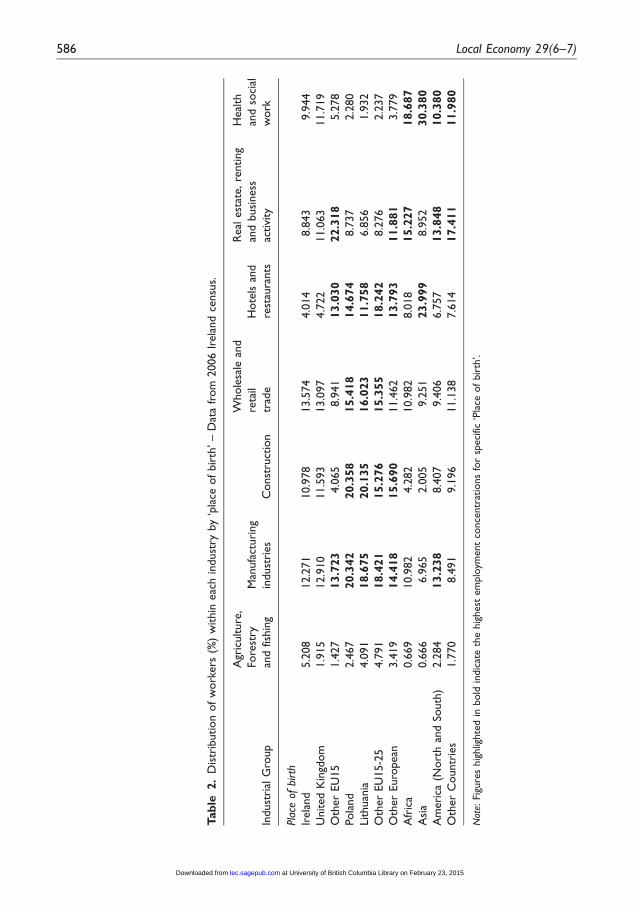
Tab
le2.
Dis
trib
ution
of
work
ers
(%)
within
eac
hin
dust
ryby
‘pla
ceof
bir
th’–
Dat
afr
om
2006
Irela
nd
censu
s.
Indust
rial
Gro
up
Agr
iculture
,
Fore
stry
and
fishin
g
Man
ufa
cturi
ng
indust
ries
Const
ruct
ion
Whole
sale
and
reta
il
trad
e
Hote
lsan
d
rest
aura
nts
Real
est
ate,
renting
and
busi
ness
activi
ty
Heal
th
and
soci
al
work
Plac
eof
birt
h
Irela
nd
5.2
08
12.2
71
10.9
78
13.5
74
4.0
14
8.8
43
9.9
44
United
Kin
gdom
1.9
15
12.9
10
11.5
93
13.0
97
4.7
22
11.0
63
11.7
19
Oth
er
EU
15
1.4
27
13.7
23
4.0
65
8.9
41
13.0
30
22.3
18
5.2
78
Pola
nd
2.4
67
20.3
42
20.3
58
15.4
18
14.6
74
8.7
37
2.2
80
Lithuan
ia4.0
91
18.6
75
20.1
35
16.0
23
11.7
58
6.8
56
1.9
32
Oth
er
EU
15-2
54.7
91
18.4
21
15.2
76
15.3
55
18.2
42
8.2
76
2.2
37
Oth
er
Euro
pean
3.4
19
14.4
18
15.6
90
11.4
62
13.7
93
11.8
81
3.7
79
Afr
ica
0.6
69
10.9
82
4.2
82
10.9
82
8.0
18
15.2
27
18.6
87
Asi
a0.6
66
6.9
65
2.0
05
9.2
51
23.9
99
8.9
52
30.3
80
Am
eri
ca(N
ort
han
dSo
uth
)2.2
84
13.2
38
8.4
07
9.4
06
6.7
57
13.8
48
10.3
80
Oth
er
Countr
ies
1.7
70
8.4
91
9.1
96
11.1
38
7.6
14
17.4
11
11.9
80
Not
e:Fi
gure
shig
hlig
hte
din
bold
indic
ate
the
hig
hest
em
plo
yment
conce
ntr
atio
ns
for
speci
fic‘P
lace
of
bir
th’.
586 Local Economy 29(6–7)
at University of British Columbia Library on February 23, 2015lec.sagepub.comDownloaded from
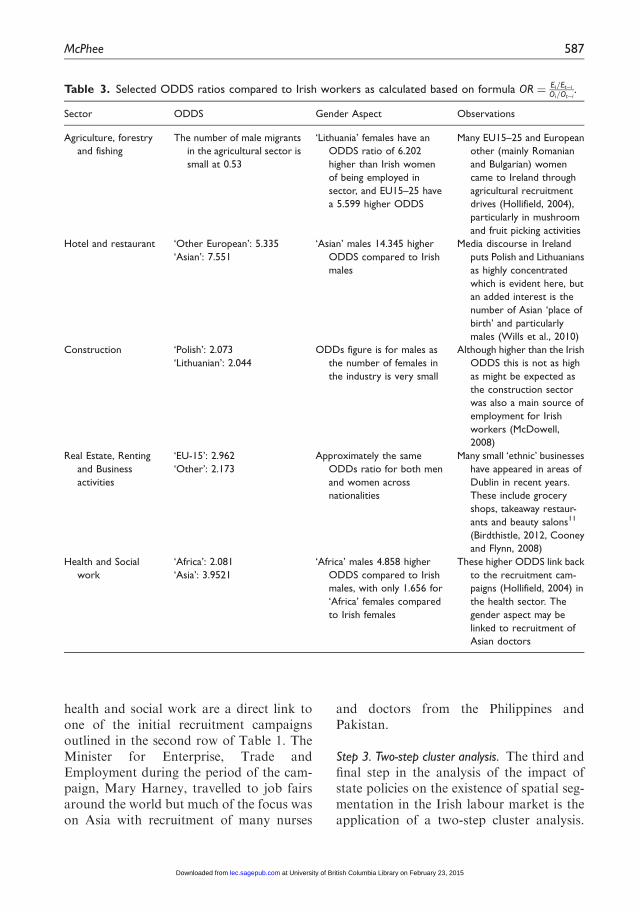
health and social work are a direct link toone of the initial recruitment campaignsoutlined in the second row of Table 1. TheMinister for Enterprise, Trade andEmployment during the period of the cam-paign, Mary Harney, travelled to job fairsaround the world but much of the focus wason Asia with recruitment of many nurses
and doctors from the Philippines andPakistan.
Step 3. Two-step cluster analysis. The third andfinal step in the analysis of the impact ofstate policies on the existence of spatial seg-mentation in the Irish labour market is theapplication of a two-step cluster analysis.
Table 3. Selected ODDS ratios compared to Irish workers as calculated based on formula OR ¼ Ei=Et�i
Oi=Ot�i.
Sector ODDS Gender Aspect Observations
Agriculture, forestry
and fishing
The number of male migrants
in the agricultural sector is
small at 0.53
‘Lithuania’ females have an
ODDS ratio of 6.202
higher than Irish women
of being employed in
sector, and EU15–25 have
a 5.599 higher ODDS
Many EU15–25 and European
other (mainly Romanian
and Bulgarian) women
came to Ireland through
agricultural recruitment
drives (Hollifield, 2004),
particularly in mushroom
and fruit picking activities
Hotel and restaurant ‘Other European’: 5.335
‘Asian’: 7.551
‘Asian’ males 14.345 higher
ODDS compared to Irish
males
Media discourse in Ireland
puts Polish and Lithuanians
as highly concentrated
which is evident here, but
an added interest is the
number of Asian ‘place of
birth’ and particularly
males (Wills et al., 2010)
Construction ‘Polish’: 2.073
‘Lithuanian’: 2.044
ODDs figure is for males as
the number of females in
the industry is very small
Although higher than the Irish
ODDS this is not as high
as might be expected as
the construction sector
was also a main source of
employment for Irish
workers (McDowell,
2008)
Real Estate, Renting
and Business
activities
‘EU-15’: 2.962
‘Other’: 2.173
Approximately the same
ODDs ratio for both men
and women across
nationalities
Many small ‘ethnic’ businesses
have appeared in areas of
Dublin in recent years.
These include grocery
shops, takeaway restaur-
ants and beauty salons11
(Birdthistle, 2012, Cooney
and Flynn, 2008)
Health and Social
work
‘Africa’: 2.081
‘Asia’: 3.9521
‘Africa’ males 4.858 higher
ODDS compared to Irish
males, with only 1.656 for
‘Africa’ females compared
to Irish females
These higher ODDS link back
to the recruitment cam-
paigns (Hollifield, 2004) in
the health sector. The
gender aspect may be
linked to recruitment of
Asian doctors
McPhee 587
at University of British Columbia Library on February 23, 2015lec.sagepub.comDownloaded from
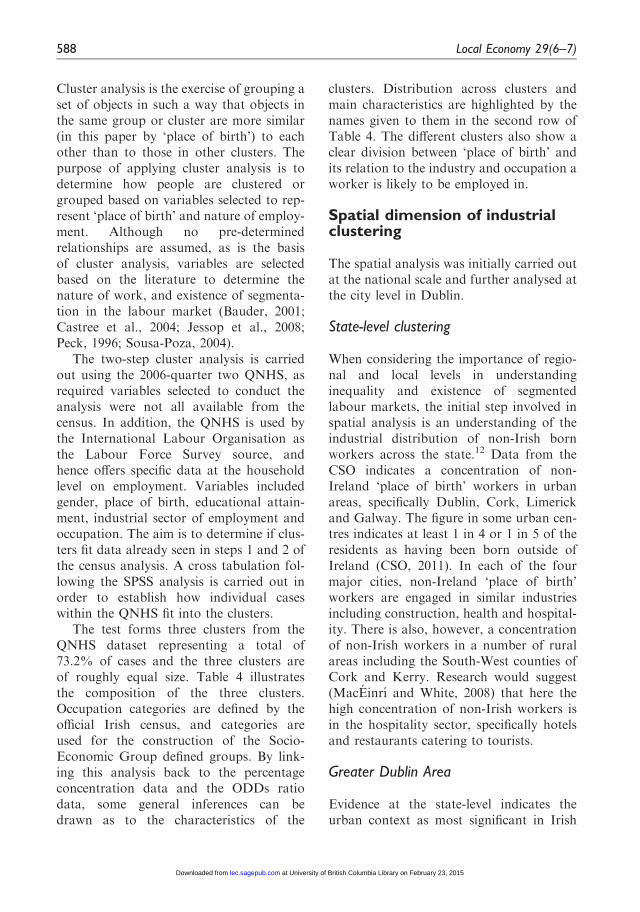
Cluster analysis is the exercise of grouping aset of objects in such a way that objects inthe same group or cluster are more similar(in this paper by ‘place of birth’) to eachother than to those in other clusters. Thepurpose of applying cluster analysis is todetermine how people are clustered orgrouped based on variables selected to rep-resent ‘place of birth’ and nature of employ-ment. Although no pre-determinedrelationships are assumed, as is the basisof cluster analysis, variables are selectedbased on the literature to determine thenature of work, and existence of segmenta-tion in the labour market (Bauder, 2001;Castree et al., 2004; Jessop et al., 2008;Peck, 1996; Sousa-Poza, 2004).
The two-step cluster analysis is carriedout using the 2006-quarter two QNHS, asrequired variables selected to conduct theanalysis were not all available from thecensus. In addition, the QNHS is used bythe International Labour Organisation asthe Labour Force Survey source, andhence offers specific data at the householdlevel on employment. Variables includedgender, place of birth, educational attain-ment, industrial sector of employment andoccupation. The aim is to determine if clus-ters fit data already seen in steps 1 and 2 ofthe census analysis. A cross tabulation fol-lowing the SPSS analysis is carried out inorder to establish how individual caseswithin the QNHS fit into the clusters.
The test forms three clusters from theQNHS dataset representing a total of73.2% of cases and the three clusters areof roughly equal size. Table 4 illustratesthe composition of the three clusters.Occupation categories are defined by theofficial Irish census, and categories areused for the construction of the Socio-Economic Group defined groups. By link-ing this analysis back to the percentageconcentration data and the ODDs ratiodata, some general inferences can bedrawn as to the characteristics of the
clusters. Distribution across clusters andmain characteristics are highlighted by thenames given to them in the second row ofTable 4. The different clusters also show aclear division between ‘place of birth’ andits relation to the industry and occupation aworker is likely to be employed in.
Spatial dimension of industrialclustering
The spatial analysis was initially carried outat the national scale and further analysed atthe city level in Dublin.
State-level clustering
When considering the importance of regio-nal and local levels in understandinginequality and existence of segmentedlabour markets, the initial step involved inspatial analysis is an understanding of theindustrial distribution of non-Irish bornworkers across the state.12 Data from theCSO indicates a concentration of non-Ireland ‘place of birth’ workers in urbanareas, specifically Dublin, Cork, Limerickand Galway. The figure in some urban cen-tres indicates at least 1 in 4 or 1 in 5 of theresidents as having been born outside ofIreland (CSO, 2011). In each of the fourmajor cities, non-Ireland ‘place of birth’workers are engaged in similar industriesincluding construction, health and hospital-ity. There is also, however, a concentrationof non-Irish workers in a number of ruralareas including the South-West counties ofCork and Kerry. Research would suggest(MacEinrı and White, 2008) that here thehigh concentration of non-Irish workers isin the hospitality sector, specifically hotelsand restaurants catering to tourists.
Greater Dublin Area
Evidence at the state-level indicates theurban context as most significant in Irish
588 Local Economy 29(6–7)
at University of British Columbia Library on February 23, 2015lec.sagepub.comDownloaded from
immigration processes resulting from statepolices. According to the 2006 census, 68%of migrants in Ireland reside and work inDublin, a figure linking to evidence of thegrowth of importance of Dublin in the Irisheconomy as a whole (Gilmartin and Mills,2008). The local context is important forunderstanding the processes of globalisa-tion, and Dublin as a so-called ‘gatewaycity’13 provides the opportunity to seethese processes unfold. Migration processesor the flow of workers take place at theintersection of global economic trends andlocal or regional labour market develop-ments, creating a global consistency inhow local or regional markets operate
and demand workers (Massey, 2005; Peck,1996; Sassen, 1998). The application ofmethods of uncovering industrial clusteringin Dublin indicates that non-Ireland-bornworkers are clustered in specific industrialsectors. This provides initial evidence ofthe possibility that spatial segmentationcan and does occur at the most local level,and within the same physical space.Census data from 2006 indicate that non-Irish born workers are concentred(aside from UK nationals) in cities.Although Cork, Galway, Limerick andWaterford share a proportion of the cityresidents, Dublin is the largest receiver ofimmigrants.
Table 4. Composition of the three clusters 2006.
Cluster 1
(38.5% of 73.2%)
Cluster 2
(34.9% of 73.2%)
Cluster 3
(26.6% of 73.2%)
Cluster name Manual cluster Service cluster Professionals
Gender Gender is important with
a larger number of
males
Gender is important with
a larger number of
females
Number of females slightly
higher but roughly
equal from both
genders
Place of Birth Accession state feature
highest of all other
non-Ireland ‘place of
birth’
‘Other’ a little higher as a
‘place of birth’, but all
roughly equal
EU-15, Other and
American feature high-
est amongst non-
Ireland ‘place of birth’
Education Lowest educational
achievement cluster
mostly no formal/pri-
mary, lower secondary,
upper secondary and
leaving certificate
Centered around the
middle with mainly
upper secondary and
leaving certificate as
well as non-degree
third level
Most third level numbers
as well as highest third
level non-degree
Industry Almost entirely agricul-
ture and mining sec-
tors. Also highest
percentage of manufac-
turing, electricity, con-
struction, transport
and communication
Highest number of retail
and hotels/restaurants,
public administration,
health and ‘other’
Highest number of finan-
cial, real estate, educa-
tion and health
Occupation Highest number of man-
agers, craft and related,
plant and machine
operatives and ‘other’
Clerical and secretarial,
personal and protect-
ive, and sales
Professional and associate
professional and
technical
McPhee 589
at University of British Columbia Library on February 23, 2015lec.sagepub.comDownloaded from
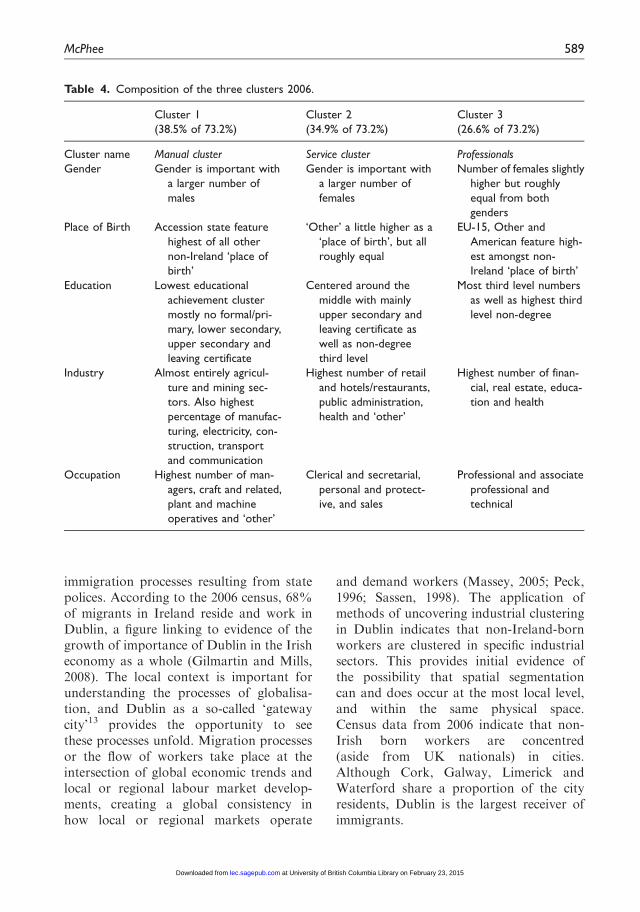
Electoral divisions of significance
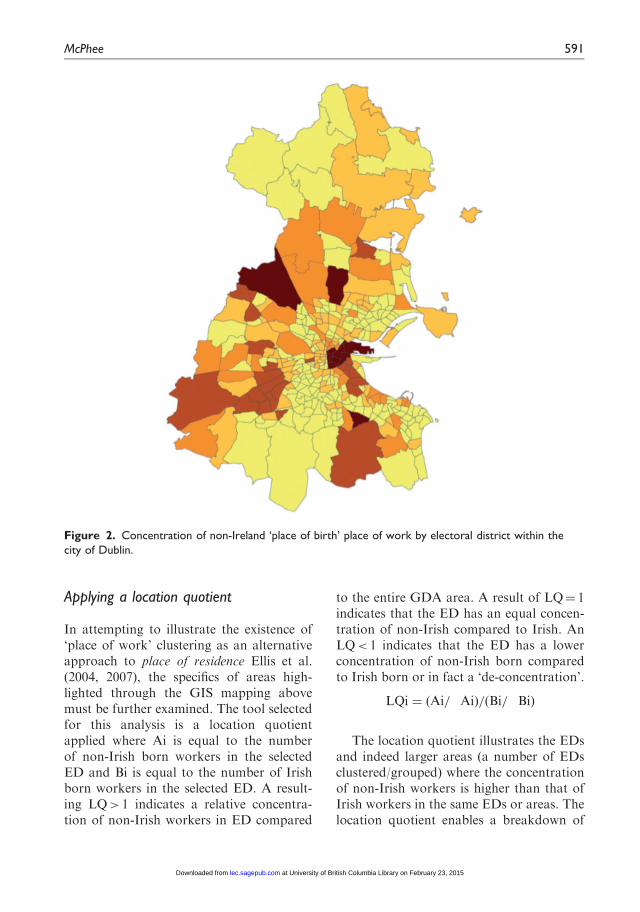
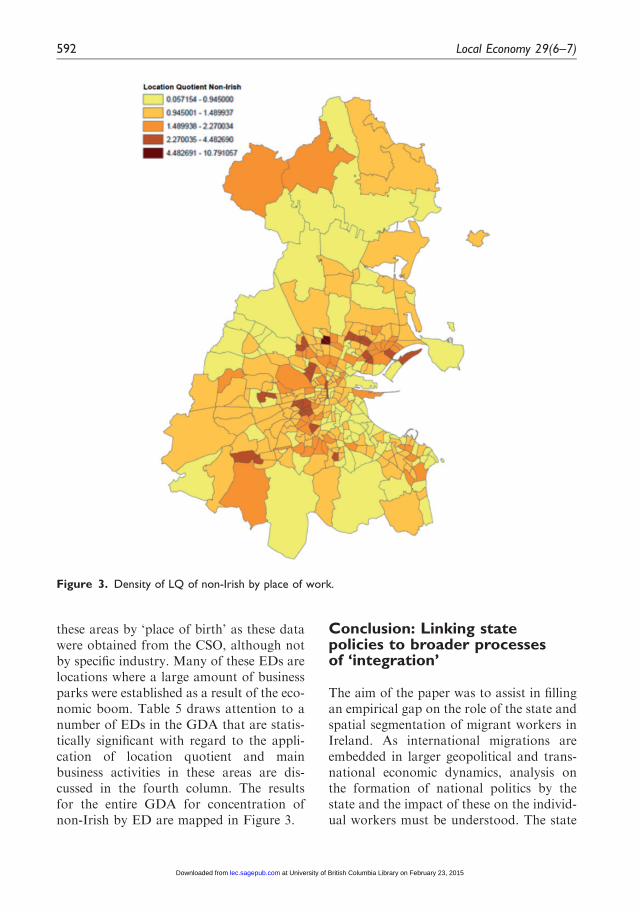
The Greater Dublin Area (GDA) is madeup of 322 Electoral Divisions (EDs), thesmallest available statistical data from theCSO. These 322 EDs are divided into fourareas which make up the GDA: DublinCity – 162 EDs; Dun Laoghaire-Rathdown – 69 EDs; Fingal – 42 EDs;South Dublin – 49 EDs. Figures 1 and 2illustrate the distribution of Irish and non-Irish by ‘place of work’. The maps indicatethat there is a concentration of workers in
particular EDs and areas. Proportions ofworkers are calculated based on the per-centage distribution of workers in thelabour market whose ‘place of birth’ isIreland versus those whose ‘place ofbirth’ is elsewhere. The results illustrate aconcentration of all workers, both Irishborn and non-Irish born, in specific EDsbased on where most employment inDublin is located; however, the maps indi-cate that non-Irish born workers are morehighly concentrated in certain geographicalareas over others.
Figure 1. Concentration of Ireland-born place of work by electoral district within the city of Dublin.
590 Local Economy 29(6–7)
at University of British Columbia Library on February 23, 2015lec.sagepub.comDownloaded from
Applying a location quotient
In attempting to illustrate the existence of‘place of work’ clustering as an alternativeapproach to place of residence Ellis et al.(2004, 2007), the specifics of areas high-lighted through the GIS mapping abovemust be further examined. The tool selectedfor this analysis is a location quotientapplied where Ai is equal to the numberof non-Irish born workers in the selectedED and Bi is equal to the number of Irishborn workers in the selected ED. A result-ing LQ> 1 indicates a relative concentra-tion of non-Irish workers in ED compared
to the entire GDA area. A result of LQ¼ 1indicates that the ED has an equal concen-tration of non-Irish compared to Irish. AnLQ< 1 indicates that the ED has a lowerconcentration of non-Irish born comparedto Irish born or in fact a ‘de-concentration’.
LQi ¼ Ai=�Aið Þ= Bi=�Bið Þ
The location quotient illustrates the EDsand indeed larger areas (a number of EDsclustered/grouped) where the concentrationof non-Irish workers is higher than that ofIrish workers in the same EDs or areas. Thelocation quotient enables a breakdown of
Figure 2. Concentration of non-Ireland ‘place of birth’ place of work by electoral district within the
city of Dublin.
McPhee 591
at University of British Columbia Library on February 23, 2015lec.sagepub.comDownloaded from
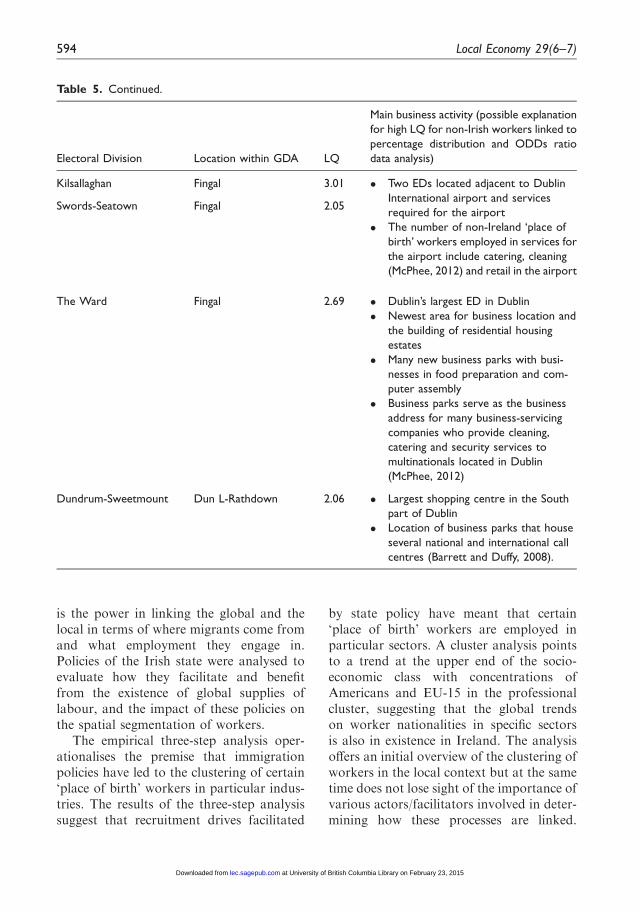
these areas by ‘place of birth’ as these datawere obtained from the CSO, although notby specific industry. Many of these EDs arelocations where a large amount of businessparks were established as a result of the eco-nomic boom. Table 5 draws attention to anumber of EDs in the GDA that are statis-tically significant with regard to the appli-cation of location quotient and mainbusiness activities in these areas are dis-cussed in the fourth column. The resultsfor the entire GDA for concentration ofnon-Irish by ED are mapped in Figure 3.
Conclusion: Linking statepolicies to broader processesof ‘integration’
The aim of the paper was to assist in fillingan empirical gap on the role of the state andspatial segmentation of migrant workers inIreland. As international migrations areembedded in larger geopolitical and trans-national economic dynamics, analysis onthe formation of national politics by thestate and the impact of these on the individ-ual workers must be understood. The state
Figure 3. Density of LQ of non-Irish by place of work.
592 Local Economy 29(6–7)
at University of British Columbia Library on February 23, 2015lec.sagepub.comDownloaded from
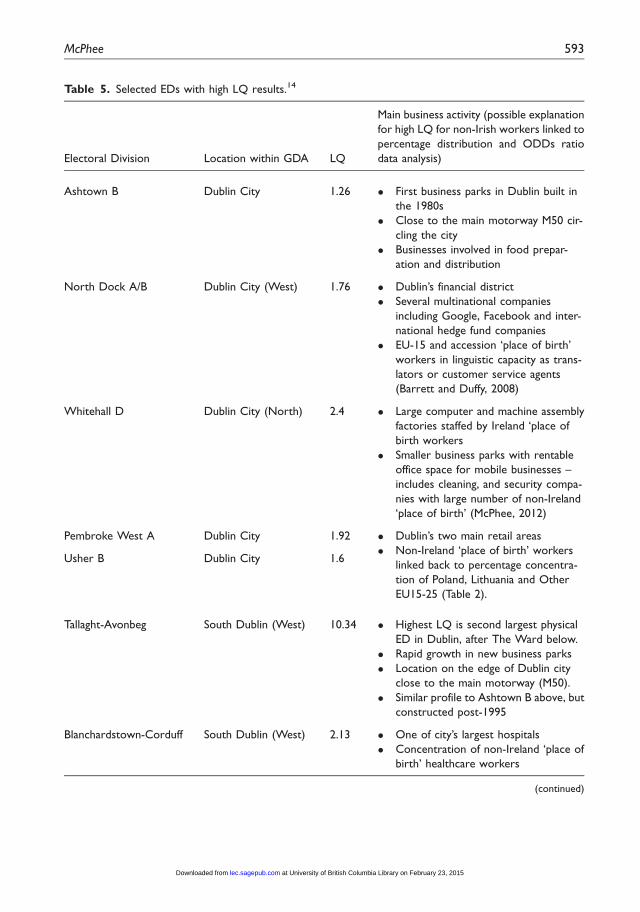
Table 5. Selected EDs with high LQ results.14
Electoral Division Location within GDA LQ
Main business activity (possible explanation
for high LQ for non-Irish workers linked to
percentage distribution and ODDs ratio
data analysis)
Ashtown B Dublin City 1.26 � First business parks in Dublin built in
the 1980s
� Close to the main motorway M50 cir-
cling the city
� Businesses involved in food prepar-
ation and distribution
North Dock A/B Dublin City (West) 1.76 � Dublin’s financial district
� Several multinational companies
including Google, Facebook and inter-
national hedge fund companies
� EU-15 and accession ‘place of birth’
workers in linguistic capacity as trans-
lators or customer service agents
(Barrett and Duffy, 2008)
Whitehall D Dublin City (North) 2.4 � Large computer and machine assembly
factories staffed by Ireland ‘place of
birth workers
� Smaller business parks with rentable
office space for mobile businesses –
includes cleaning, and security compa-
nies with large number of non-Ireland
‘place of birth’ (McPhee, 2012)
Pembroke West A Dublin City 1.92 � Dublin’s two main retail areas
� Non-Ireland ‘place of birth’ workers
linked back to percentage concentra-
tion of Poland, Lithuania and Other
EU15-25 (Table 2).
Usher B Dublin City 1.6
Tallaght-Avonbeg South Dublin (West) 10.34 � Highest LQ is second largest physical
ED in Dublin, after The Ward below.
� Rapid growth in new business parks
� Location on the edge of Dublin city
close to the main motorway (M50).
� Similar profile to Ashtown B above, but
constructed post-1995
Blanchardstown-Corduff South Dublin (West) 2.13 � One of city’s largest hospitals
� Concentration of non-Ireland ‘place of
birth’ healthcare workers
(continued)
McPhee 593
at University of British Columbia Library on February 23, 2015lec.sagepub.comDownloaded from
is the power in linking the global and thelocal in terms of where migrants come fromand what employment they engage in.Policies of the Irish state were analysed toevaluate how they facilitate and benefitfrom the existence of global supplies oflabour, and the impact of these policies onthe spatial segmentation of workers.
The empirical three-step analysis oper-ationalises the premise that immigrationpolicies have led to the clustering of certain‘place of birth’ workers in particular indus-tries. The results of the three-step analysissuggest that recruitment drives facilitated
by state policy have meant that certain‘place of birth’ workers are employed inparticular sectors. A cluster analysis pointsto a trend at the upper end of the socio-economic class with concentrations ofAmericans and EU-15 in the professionalcluster, suggesting that the global trendson worker nationalities in specific sectorsis also in existence in Ireland. The analysisoffers an initial overview of the clustering ofworkers in the local context but at the sametime does not lose sight of the importance ofvarious actors/facilitators involved in deter-mining how these processes are linked.
Table 5. Continued.
Electoral Division Location within GDA LQ
Main business activity (possible explanation
for high LQ for non-Irish workers linked to
percentage distribution and ODDs ratio
data analysis)
Kilsallaghan Fingal 3.01 � Two EDs located adjacent to Dublin
International airport and services
required for the airport
� The number of non-Ireland ‘place of
birth’ workers employed in services for
the airport include catering, cleaning
(McPhee, 2012) and retail in the airport
Swords-Seatown Fingal 2.05
The Ward Fingal 2.69 � Dublin’s largest ED in Dublin
� Newest area for business location and
the building of residential housing
estates
� Many new business parks with busi-
nesses in food preparation and com-
puter assembly
� Business parks serve as the business
address for many business-servicing
companies who provide cleaning,
catering and security services to
multinationals located in Dublin
(McPhee, 2012)
Dundrum-Sweetmount Dun L-Rathdown 2.06 � Largest shopping centre in the South
part of Dublin
� Location of business parks that house
several national and international call
centres (Barrett and Duffy, 2008).
594 Local Economy 29(6–7)
at University of British Columbia Library on February 23, 2015lec.sagepub.comDownloaded from
In sum, the approach taken by the Irishstate to immigration policies appears toplay a role in shaping the structure of thelabour market.
In making an empirical claim that spatialsegmentation by ‘place of birth’ exists in theIrish labour market, the paper attempts todraw attention away from broad claims ofthe integration of migrants into Irish soci-ety. In providing an analysis of the role ofstate, the empirical findings are not conclu-sive of a challenging labour market experi-ence for migrant workers, but ratherindicate its complexity, with the role of thestate just one side of the triad. However,without first understanding the processesby which workers are employed where,moving beyond to any social implicationsis futile. Particular ‘place of birth’ workers’positions in Irish society more generally willnot improve, because they are spatiallytrapped in a specific sector or job. Until fun-damental processes of diversification of thelabour market through improved and trans-parent immigration policies are addressed,issues around the integration of non-Ireland born workers will continue todeteriorate. In terms of other academicresearch on labour market structure, spatialsegmentation and immigration, a similarassessment of the implications for policycan be made, namely, that any empiricalwork must take a step by step approach tounderstanding migrants’ experience and thisstep by step must be contextualised withinthe scale of the local labour market.
Funding
This research received no specific grant from any
funding agency in the public, commercial, or
not-for-profit sectors.
Notes
1. http://www.djei.ie/press/2000/130500.htm
2. The table is constructed through figures and
data from the Central Statistics Office(CSO), Economic and Social ResearchInstitute (ESRI), the Department of Jobs,
Enterprise and Innovation website (http://www.djei.ie/index.htm) and the MigrantRights Centre of Ireland (MRCI).
3. First Report of the Expert Group on Future
Skills Needs 1998 http://www.forfas.ie/media/egfsn981201b_first_report_egfsn.pdf
4. Ibid.
5. http://www.djei.ie/labour/workpermits/6. Ibid.7. Ibid.
8. http://www.enterprise-ireland.com/en/Export-Assistance/International-Office-Network-Services-and-Contacts/Enterprise-Ireland-Guide-to-Recruiting-in-Poland-.pdf
9. http://www.djei.ie/labour/workpermits/10. OR ¼ Ei=Et�i
Oi=Ot�i.
11. http://www.eurofound.europa.eu/pubdocs/
2011/218/en/1/EF11218EN.pdf12. Due to confidentiality issues the data for
Place of Work from the CSO is only avail-
able at the county level. However, this is atthe urban and rural level, and separates thefive Irish cities.
13. http://www.lboro.ac.uk/gawc/projects.html14. Information for this table was complied by
the author using business directories andobservation in addition to the concentration
of workers based on the census and QNHSdata.
References
Barrett A, Bergin A and Duffy D (2006) The
labour market characteristics and labourmarket impacts of immigrants in Ireland.The Economic and Social Review 371: 1–26.
Barrett A and Duffy D (2008) Are Ireland’simmigrants integrating into its labormarket? International Migration Review
42(3): 597–619.Bauder H (2001) Culture in the labor market:
Segmentation theory and perspectives ofplace. Progress in Human Geography 25(1):
37–52.Birdthistle N (2012) An examination of ethnic
entrepreneurship in the mid-west region of
Ireland, Doras Luimnı, Ireland. Available
McPhee 595
at University of British Columbia Library on February 23, 2015lec.sagepub.comDownloaded from
at: dorasluimni.org/wp-content/uploads/pdf/
publications/entrepreneurship.pdf (accessed15 May 2013).
Cangiano A (2008) Foreign migrants in
Southern European countries: Evaluation ofrecent data. In: Raymer J and Willekens F(eds) International Migration in Europe.Data, Models and Estimates. Chichester:
John Wiley and Sons Inc, pp. 89–114.Castree N, Coe N, Ward K, et al. (2004) Spaces
of Work. London: SAGE.
Central Statistics Office (2011) Profile ofMigration and Diversity Ireland. Availableat: www.cso.ie/en/media/csoie/census/documents/
census2011profile6/Profile,6,Migration,and,Diversity,entire,doc.pdf (accessed 11 October2012).
Chiswick BR, Lee YL and Miller PW (2003)
Patterns of immigrant occupational attain-ment in a longitudinal survey. InternationalMigration 41(4): 47–69.
Cholewinski R (2005) The legal status ofmigrants admitted for employment.Strasburg: Council of Europe Publishing.
Clark GL (1983) Government policy and theform of local labour markets. UrbanGeography 4: 1–15.
Cooney T and Flynn A (2008) A Mapping ofEthnic Entrepreneurship in Ireland, Institutefor Minority Entrepreneurship. DublinInstitute of Technology, Ireland. Available
at: arrow.dit.ie/cgi/viewcontent.cgi?article¼1000&context¼imerep (accessed 19 February2011).
Ellis M, Wright R and Parks V (2004) Worktogether, live apart? Geographies of racialand ethnic segregation at home and at
work. Annals of the Association of AmericanGeographers 94(3): 620–637.
Ellis M, Wright R and Parks V (2007)
Geography and the immigrant division oflabour. Economic Geography 83(3): 255–281.
Fanning B, et al. (2000) Asylum Seekers and theRight to Work in Ireland. Dublin: Irish
Refugee Council.Faughnan P and Woods M (2000) Lives on Hold
Seeking Asylum in Ireland. Summary report.
(Dublin: Social Science Research Centre,National University of Ireland). Availableat: jcmc.huji.ac.il/vol1/issue2/aycock.html
(accessed 18 April 2010).
Garvin T (2009) Judging Lemass: The Measure
of the Man. Dublin: Royal Irish Academy.Gilmartin M (2004) Geography in Ireland in
Transition: Some comments. Irish
Geography 37: 121–144.Gilmartin M and Mills G (2008) Mapping
migrants in Ireland: The limits of cartog-raphy. Translocations: Migration and Social
Change 4(1): 21–34.Guerin P (2002) Opportunity Knocks? Refugees,
Asylum Seekers and Work in Ireland. Dublin:
Association of Refugees & Asylum Seekers inIreland (ARASI).
Hayward K and Howard K (2007) Cherry-
picking the Diaspora. In: Fanning B (ed.)Immigration and Social Change in theRepublic of Ireland. Manchester: ManchesterUniversity Press, pp. 47–62.
Hollifield JF (2004) The emerging migrationstate. International Migration Review 38:885–912.
Honohan P (2010) The Irish Banking Crisis:Regulatory and Financial Stability Policy2003–2008. Irish Central Bank. Available at:
www.bankinginquiry.gov.ie/The%20Irish%20Banking%20Crisis%20Regulatory%20and%20Financial%20Stability%20Policy%
202003-2008.pdf (accessed 23 November2011).
Hudson M (2003) Modeling the probability ofniche employment: Exploring workforce seg-
mentation in metropolitan Atlanta. UrbanGeography 23: 528–559.
Jessop B, Brenner N and Jones M (2008)
Theorizing sociospatial relations.Environment and Planning D: Society andSpace 26(3): 389–401.
Massey D (2005) For Space. London: SagePublications Ltd.
Massey D (2007) World City. Cambridge, UK:
Polity Press.McDowell L (2008) Thinking through
work: Complex inequalities, constructionsof difference and trans-national migrants.
Progress in Human Geography 32(4):491–507.
McDowell L, Batnitzky A and Dyer S (2008)
Internationalization and the spaces of tem-porary labour: The global assembly of alocal workforce. British Journal of Industrial
Relations 46(4): 750–770.
596 Local Economy 29(6–7)
at University of British Columbia Library on February 23, 2015lec.sagepub.comDownloaded from
McDowell L, Batnitzky A and Dyer S (2009)
Precarious work and economic migration:Emerging immigrant divisions of labour ingreater London’s service sector. International
Journal of Urban and Regional Research33(1): 3–25.
Mac Einrı P (2001) Immigration into Ireland:Trends, policy responses, outlook. In: Paper
presented at the international conferencemigration studies ICMS, Cork, UniversityCollege Cork, Ireland.
Mac Einrı P and Coakley L (2007) Islands ofdifference? The integration of refugees and per-sons with leave to remain in the Cork City
area. Report commissioned by Receptionand Integration Agency, Department ofJustice, Equality and Law Reform, Dublin,Ireland.
Mac Einrı P and White A (2008) Immigrationinto the Republic of Ireland: A bibliographyof recent research. Irish Geography 41(2):
151–179.McPhee SR (2012) Employers and migration in
low-skilled services in Dublin. Employee
Relations 34(6): 628–641.Peck J (1996) Work Place – The Social
Regulation of Labour Markets. New York:
Guilford Press.Piore M and Doeringer P (1971) Internal Labor
Markets and Manpower Analysis. New York:Shapre.
Ruhs M (2004) Ireland: A Crash Course inImmigration Policy. Available at: www.migra-tioninformation.org (accessed 22 May 2010).
Ruhs M (2005) Managing the Immigration andEmployment of Non-EU Nationals in Ireland.Dublin: Trinity College (TCD) Studies in
Social Policy No. 19: Available at: hdl.han-dle.net/2262/60230 (accessed 10 June 2010).
Ruhs M and Quinn E (2009) Ireland: From Rapid
Immigration to Recession. Available at: www.migrationpolicy.org/article/ireland-rapid-immigration-recession (accessed October
2010).Sassen S (1998) Globalization and its Discontents.
New York: Blackwell Publishing.Sousa-Poza A (2004) Is the Swiss labor market
segmented? An analysis using alternativeapproaches. Labour: Review of LabourEconomics and Industry 18(1): 131–161.
Turner T (2010) The jobs immigrants do: Issuesof displacement and marginalisation in theIrish labour market. Work, Employment and
Society 24(2): 318–336.Vertovec S (2003) Migration and other modes of
transnationalism: Towards conceptual cross-fertilization. International Migration Review
37: 641–665.Waldinger R (2003) Network, beauracracy and
exclusion: Recruitment and selection in an
immigrant metropolis. In: Bean FD andBell-Rose S (eds) Immigration andOpportunity, Race, Ethnicity and
Employment in the United States. New York,NY: Russell Sage Foundation, pp. 228–260.
Wang Q and Pandit K (2007) Measuring ethnic
labor market concentration and segmenta-tion. Journal of Ethnic and Migration Studies33(8): 1227–1252.
Wills J, McIlwaine C, Datta K, et al. (2010)
Global Cities at Work – New MigrantDivisions of Labour. London: Pluto Press.
Wright R and Ellis M (2000) The ethnic and
gender division of labor compared amongimmigrants to Los Angeles. InternationalJournal of Urban and Regional Research
24(3): 567–582.
McPhee 597
at University of British Columbia Library on February 23, 2015lec.sagepub.comDownloaded from
Related Documents