IRELAND: MIGRATION AND EU ENLARGEMENT Kevin Quinn Manager, International Employment Services FAS Ireland Keflavic 30 th May 2008

IRELAND: MIGRATION AND EU ENLARGEMENT Kevin Quinn Manager, International Employment Services FAS Ireland Keflavic 30 th May 2008.
Dec 29, 2015
Welcome message from author
This document is posted to help you gain knowledge. Please leave a comment to let me know what you think about it! Share it to your friends and learn new things together.
Transcript

IRELAND: MIGRATION AND EU ENLARGEMENT
Kevin QuinnManager, International Employment
ServicesFAS
Ireland
Keflavic 30th May 2008

Irish Employment 1988-2007
11,11,21,31,41,51,61,71,81,9
22,12,22,3
1988
1989
1990
1991
1992
1993
1994
1995
1996
1997
1998
1999
2000
2001
2002
2003
2004
2005
2006
2007
Mil
lion

Irish Economic FactsIrish Economic FactsGDP (2007) €185bnGDP Growth (2007) 5.3%GDP per Capita (2007) €42,581 ($64k)Irish GDP per Capita as % of EU 142%Inflation (2007) 4.9%Current Account Deficit (2007) 5.9% of GDPPopulation (2007) 4.3 million Average Full Time Wage (2007) €764National Minimum Wage (July 2007) €8.65 per hourWeekly Unemployment All.(Jan 2008) €197.80Adult Dependent (Jan 2008) €131.30

Implications for Eures Ireland,implications for
Eures, EuropeStill a shortage of key workers

Change in Socio-Economic Indicators 1995-2006
20071995
51%64%Dependency rate
4.5%12.2%Unemployment rate
101,000177,000Unemployment
69%47%Employment rate
2.1m1.28mEmployment
3.7m2.7mPopulation Aged 15+
4.3m3.6mPopulation
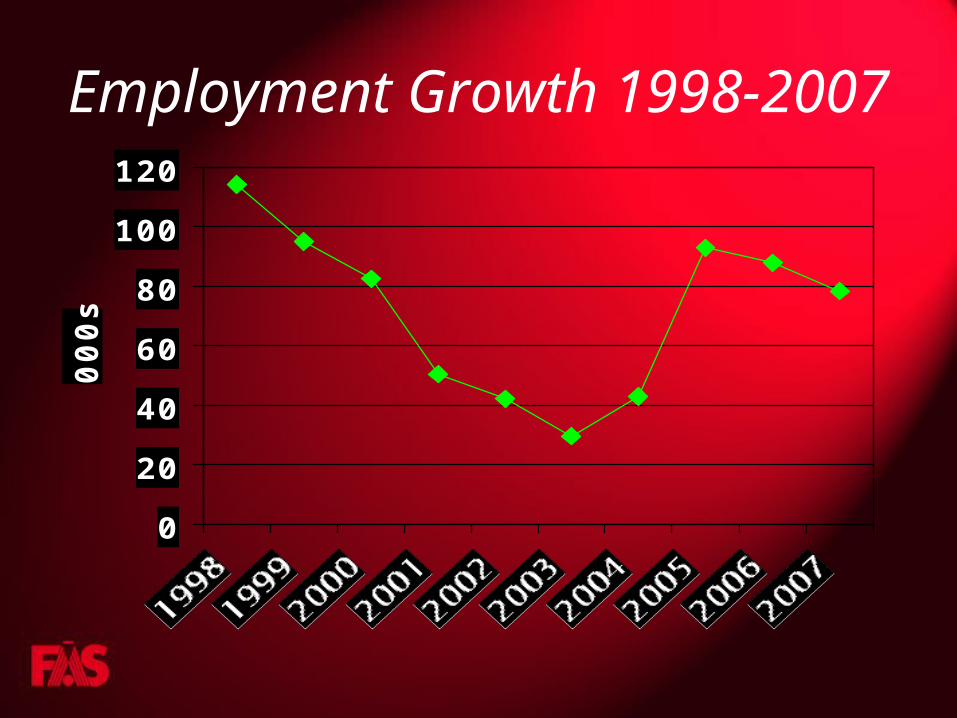
Employment Growth 1998-2007
0
20
40
60
80
100
120
000s

Unemployment Trends 1998-2007
0
20
40
60
80
100
120
140
1998 1999 2000 2001 2002 2003 2004 2005 2006 2007
000s
0
1
2
3
4
5
6
7
8
9
%
000s
%
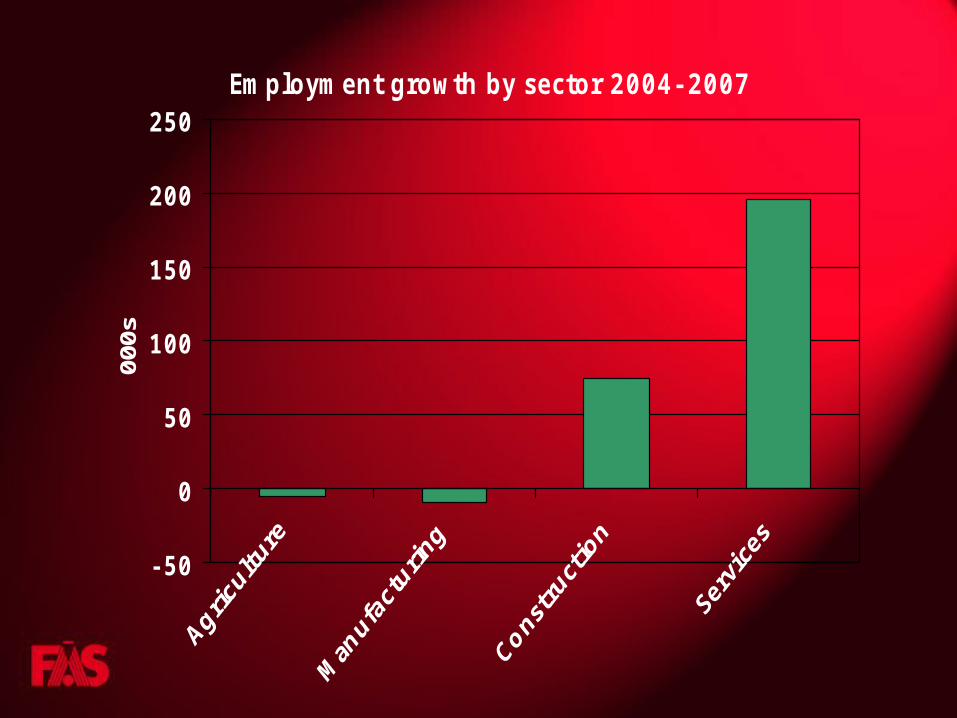
Employment growth by sector 2004- 2007
- 50
0
50
100
150
200
25000
0s

Labour Force Growth Decomposed
-20
0
20
40
60
80
100
1999
2000
2001
2002
2003
2004
2005
2006
2007
000s
Natural increaseParticipationMigration

To Twenty-five….and then?
How far east?

To Twenty-five….and then?
How far east?

Post-enlargement migration trendPPSN Allocations to EU10
0
2000
4000
6000
8000
10000
12000
14000
16000Ju
l-04
Oct-
04
Jan-05
Apr-
05
Jul-
05
Oct-
05
Jan-06
Apr-
06
Jul-
06
Oct-
06
Jan-07
Apr-
07
Jul-
07
Oct-
07
Jan-08
Apr-
08
Peak
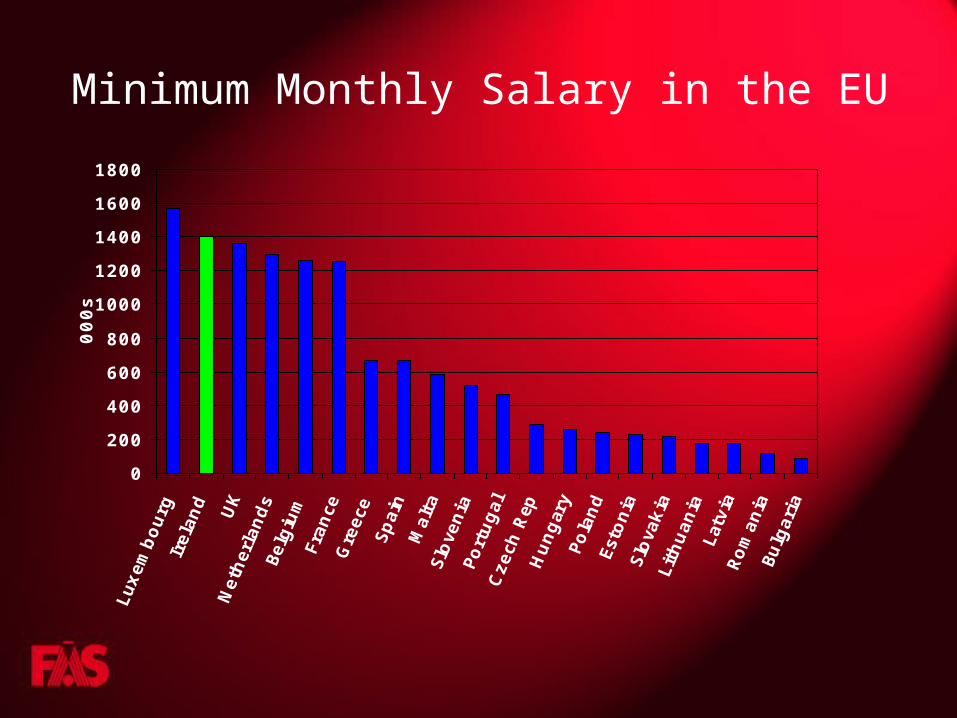
Minimum Monthly Salary in the EU
0
200
400
600
800
1000
1200
1400
1600
1800
000s

Sectoral Employment Growth by Nationality Since Enlargement
- 40
-20
0
20
40
60
80
000s
Non- Irish
Irish
Total

Unemployment Rising RapidlyLive Register
150000
160000
170000
180000
190000
200000
210000
Jan-02 Sep-02 May-03 Jan-04 Sep-04 May-05 Jan-06 Sep-06 May-07 Jan-08

Figure 1.6: Unemployment Trends 2001-2007
0
2
4
6
8
10
%
EU27
Ireland

Labour demand has been strong
020000400006000080000
100000120000140000160000
2002
2003
2004
2005
2006
2007
FAS Vacancies 2003-2007
Work Permit
Non-Work Permit

……..but shortages have been ..but shortages have been bearablebearable

……..but employers ..but employers increasingly pessimisticincreasingly pessimistic

Figure 1.9: Annual Employment Growth (%) 2002-2007
0
1
2
3
4
5
6
% A
nn
ual
Gro
wth
Rat
e

Quarter-on-Quarter Construction Employment Growth 2002-2007
-6
-4
-2
0
2
4
6
8
10
12
000s

Employment Growth 1996-2009
- 40
- 20
0
20
40
60
80
100
120
140
000s

Forecast
2007 2008 2009
Agriculture 116 117 115
Construction 282 262 245
Manufacturing 296 292 287
Services 1,424 1,470 1,473
Total Employment 2,117 2,141 2,120
Unemployed 101 124 150
Labour Force 2,217 2,265 2,270
Net Immigration 65 25 0
Unemployment Rate 4.5% 5.5% 6.6%

Implications for Eures, Ireland.Implications for Eures, Europe.
Skilled available workforceStill a shortage(20,000) key workers
We brought them over, we have a responsibility
Eures must be more proactive on policyWe have a system, lets use it!

ConclusionsConclusions• Irish Labour Market has been the envy of Irish Labour Market has been the envy of
EuropeEurope
There has also been cyclical variationThere has also been cyclical variation
Second wave of the boom is coming to an Second wave of the boom is coming to an
endend
Unemployment will depend on labour supply Unemployment will depend on labour supply
responseresponse
Volatility makes medium-term prospects Volatility makes medium-term prospects
uncertainuncertain
Some groups will be particularly vulnerableSome groups will be particularly vulnerable

Thank you!Komið og dansið með okkur á Írlandi
Related Documents