AUSTRALIAN FOOD, BEVERAGE AND PHARMACEUTICAL PRODUCT MANUFACTURING INDUSTRY SECTOR IRC Skills Forecast and Proposed Schedule of Work 2018–2021 Prepared on behalf of the Food, Beverage and Pharmaceutical Industry Reference Committee and the Pharmaceutical Manufacturing Industry Reference Committee for the Australian Industry and Skills Committee. skillsimpact.com.au

Welcome message from author
This document is posted to help you gain knowledge. Please leave a comment to let me know what you think about it! Share it to your friends and learn new things together.
Transcript

AUSTRALIAN FOOD, BEVERAGE AND
PHARMACEUTICAL PRODUCT MANUFACTURING
INDUSTRY SECTOR
IRC Skills Forecast and
Proposed Schedule of Work
2018–2021
Prepared on behalf of the Food, Beverage and Pharmaceutical Industry Reference Committee
and the Pharmaceutical Manufacturing Industry Reference Committee for the Australian Industry
and Skills Committee.
skillsimpact.com.au

IRC SKILLS FORECAST AND PROPOSED
SCHEDULE OF WORK 2018–2021
Purpose
This skills forecast represents the latest industry intelligence and resulting schedule of work of
the Food, Beverage and Pharmaceutical Industry Reference Committee and the Pharmaceutical
Manufacturing Industry Reference Committee. It was developed through research of national and
industry data sources and ongoing input from IRC members and key stakeholders. The report is
designed to provide industry intelligence to support the Australian Industry and Skills
Committee’s (AISC) four-year rolling National Schedule of training product development and
review work.
This industry intelligence covers the following sections:
Sector Overview – examining the depth and breadth of the industry and identifying the macro
environment that currently challenges and/or provides opportunities for the industry
Employment – reviewing the employment projections by the Department of Employment and
outlining the current workforce profile and supply for the industry
Skills Outlook – identifying the key priority skills for the industry and how they can benefit from
improvement or development of national skills standards
Training Product Review Work Plan – establishing the scope and timeframe of proposed
training package development in line with industry priority skills.
Administrative Information
Name of Applicable Industry
Reference Committees (IRCs)
Food, Beverage and Pharmaceutical Industry Reference
Committee
Pharmaceutical Manufacturing Industry Reference
Committee
Name of Applicable Skills
Service Organisation (SSO)
Skills Impact Ltd
This IRC Skills Forecast and Proposed Schedule of Work 2018–2021 has been produced with
the assistance of funding provided by the Commonwealth Government through the Department
of Education and Training.
skillsimpact.com.au

IRC Skills Forecast and Proposed Schedule of Work 2018–2021 1
CONTENT
Purpose ....................................................................................................................................... 2
Administrative Information ........................................................................................................... 2
A. EXECUTIVE SUMMARY ..................................................................................................... 2
Summary of Key Points in each Section ..................................................................................... 3
SECTOR OVERVIEW ....................................................................................................................... 11
Sector Description ..................................................................................................................... 11
Relevant Training Package Qualifications ................................................................................ 12
Sector Analysis .......................................................................................................................... 14
Relevant Stakeholders .............................................................................................................. 29
Industry and Occupational Regulations and Standards ............................................................ 34
Challenges and Opportunities in the Sector.............................................................................. 37
A. EMPLOYMENT AND TRAINING .............................................................................................. 44
Employment Update .................................................................................................................. 44
Employment Outlook ................................................................................................................. 52
Training Update ......................................................................................................................... 52
Training Activity ......................................................................................................................... 53
D. SKILLS OUTLOOK ............................................................................................................ 59
Industry Priority Skills ................................................................................................................ 59
Industry Priority for Generic Skills ............................................................................................. 69
B. IRC SIGN-OFF .......................................................................................................................... 72
ATTACHMENT A .............................................................................................................................. 73
IRC Training Product Review Plan 2018–2021 for the Food, Beverage and Pharmaceuticals
Industry Sector .......................................................................................................................... 73
ATTACHMENT B .............................................................................................................................. 75
Active IRC Projects for the Food, Beverage and Pharmaceuticals Industry Sector ................. 75
ATTACHMENT C .............................................................................................................................. 76
2018–2019 Project Details ........................................................................................................ 76

IRC Skills Forecast and Proposed Schedule of Work 2018–2021 2
A. EXECUTIVE SUMMARY
This report provides an overview of workforce development and skills needs for the Australian food,
beverage and pharmaceutical manufacturing industry sectors. The report was commissioned to
support the Australian Industry and Skills Committee (AISC) in developing the four-year rolling
National Schedule of training product development and review work. The report is structured in three
main sections as follows: Sector Overview, Employment and Skills Outlook. The methods used to
collect, collate and analyse this data included research of published national and industry data
sources, and consultation with Industry Reference Committee (IRC) members and key stakeholders.
Increased capacity to supply products, exponential population growth and new demands for food
and medicines provide these industries with the potential for growth and new business opportunities.
This growth is shaped by government policies and regulations. These industries now enjoy access
to a diverse range of overseas markets and can prioritise investment in technology and business
development to suit these new markets. Domestic and international markets for food, beverages and
pharmaceuticals are characterised by a growing focus on healthier, ‘ready to eat’ and ‘grab and go’
food and drink options, an increase in supplementary medicines and locally made pharmaceuticals,
a growing export trade and the implementation and ongoing development of advanced technologies.
This report describes the industry sector’s workforce. Consistent with many other industry sectors,
the workforce is ageing. The retirement age of workers in food and beverage manufacturing is being
reached in high numbers. This trend creates significant challenges for employers in attracting people
to the industry and developing relevant, modern skills.
Employers are increasingly seeking higher-level skills to support more demanding job functions.
Businesses respond to opportunities with strategies that create value, structure capital, develop
products and invest in innovation and new technologies. The workforce needs to be able to support
higher efficiency targets, innovations and an increasingly automated manufacturing environment.
Job roles are changing. Work functions need to meet higher, more complex demands. Operational
employees now need to plan, inspect quality, report, improve processes, and operate and maintain
technical equipment and computerised platforms. Specialist managers are required to support
strategic developments and targets. This includes strategic leadership and change-management
skills, marketing skills, developing investment project skills, global supply chain and logistics skills
and other high-level managerial skills.
Many of the skills needed in the industries associated with food processing, beverage manufacturing
and pharmaceutical and nutraceutical manufacturing address new and emerging fields of work, such
as artisan food manufacturing and pharmaceutical bioprocessing. There is also a range of generic
skills and knowledge needed in the range of occupations addressed within the FBP Training
Package. These include using sustainable work practices, energy consumption, adapting to new
technologies in an increasingly automated workforce, innovative product development and
workplace health and safety regulations. The increasing demand for traceability of consumable
products has created a need for skills in recording, maintaining and tracing food and pharmaceutical
provenance and to monitor and prevent fraudulent activity within supply chains.

IRC Skills Forecast and Proposed Schedule of Work 2018–2021 3
Summary of Key Points in each Section
Sector overview
• The food, beverage and pharmaceutical product manufacturing industries can be described as
having five sectors: food processing and manufacturing, beverage manufacturing,
pharmaceutical manufacturing, nutraceutical manufacturing, and wholesaling/retailing of the
above. The industry can also be described in more detail through a range of sub-sectors.
• The industry includes approximately 12,480 manufacturing businesses and 27,000 wholesalers
and retailers, who collectively employ approximately 217,632 people.
• In general, the sectors are characterised by a large number of small and medium-sized
producers who produce for local or niche markets, and a smaller number of large producers who
are often multinational companies and operating globally.
• Total sales turnover of the manufacturing sectors decreased by 0.4 per cent (or $414 million) to
$101.9 billion between 2014–2015 and 2015–2016.
• These industries are represented by about 55 peak organisations at a national and state level,
including industry and industry sub-sectors associations, industry services bodies such as
research and development (R&D) corporations, professional associations, employee
associations and regulatory bodies.
• Key regulations for these industries include, or are related to:
• Food Standards Australia New Zealand; industry/customer standards
• Australian Consumer Law; the Australian Packaging Covenant
• sugar industry regulations
• excise compliance
• export licence
• advertising and packaging regulations
• environmental protection measures
• pharmaceuticals regulations, including international regulations such as the FDA in the USA
for exports
• complementary medicines regulations
• biological regulations
• wine industry regulations
• alcohol product retail regulations.
• Key macro forces that currently challenge and provide opportunities for these five industry
sectors include:
• the trend towards healthy living, including less sugar, more nutritious foods and more raw,
unprocessed foods affects the food industry in sifting a focus from weight management
towards nutrition and natural wellbeing
• an increase in sustainable food systems, foods and technologies, and the agriculture that
underpins them, to maximise and replenish their environmental resource footprint, to
balance population growth and deal with environmental challenges

IRC Skills Forecast and Proposed Schedule of Work 2018–2021 4
• global food security significance and higher food demand in expanding markets, such as the
Asia-Pacific region, reflected also in a number of government policies aimed at facilitating
the sector’s growth
• the range of therapeutic goods reforms, which is expected to encourage innovation and
provide patients with faster and early access to lifesaving, innovative medicines
• climate change and its effects on the upstream sectors, which create both challenges and
opportunities for many food processing sectors to increase collaboration with the supply
chains; these partnerships will aim to support decisions and development of more resilient
crop varieties and large-scale farming systems
• export growth of food, beverage and pharmaceutical products and clear customer trends,
which provide opportunities for businesses to achieve greater adaptation of products to more
diversified markets; and, where there is the greatest potential for value-adding, develop
targeted marketing of different product qualities to market segments
• ongoing development of enabling technologies that allow for more efficient and sustainable
food, beverage and pharmaceutical processing, integrated packaging, enhancement of the
nutritional value of products and reduction of waste and water use.
Employment and training
• Employment in the food, beverage and pharmaceutical industry sector is expected to grow by 5
per cent over the next five years.
• The industry workforce is ageing. The proportion of employees in each age group category over
50 years increased by up to 3 per cent in 2016 when compared with 2006.
• The most common occupations in the food and beverage industry are food and drink factory
workers, sales assistants, bakers and pastry cooks, packers, sales representatives,
storepersons and forklift drivers. In the pharmaceutical industry, the majority of people are
employed as technical sales representatives, storepersons, advertising and sales managers,
specialist managers, pharmacists, marketing professionals, logistics and supply chain officers,
and machine operators.
Skills outlook
• Priority skills in the food, beverage and pharmaceutical industry over the next four years, 2018–
2021, are summarised in the following tables:
PRIORITY
SKILL
DESCRIPTION DRIVERS TRAINING
PACKAGE
SOLUTION
Industry Specific
Bioprocessing
technologies
This involves the
manufacture of
chemically processed
drugs, and medicines
that are manufactured
in living organisms such
as bacteria, yeast and
mammalian cells.
Bioprocessing technology is
increasing in use as the
biopharma industry
expands, attracts
investment, grows its
workforce and improves
processing capabilities.
• 1 new
qualification
• 1 new skill set
• 15 new units of
competency

IRC Skills Forecast and Proposed Schedule of Work 2018–2021 5
PRIORITY
SKILL
DESCRIPTION DRIVERS TRAINING
PACKAGE
SOLUTION
The skills required by this
growing workforce are not
currently addressed within
the vocational education and
training sector.
These include being able to
manage higher risks of
product degradation,
process variability,
contamination and complex
analytical techniques.
• Revision of 9
existing units of
competency
• Assessment of
AQF level for
the new
qualification
Artisanal
cheesemaking
This project addresses
the skills needed by
artisan cheesemakers.
The skills required
include managing the
affinage process,
working with complex
molecular and biological
processes, small-scale
pasteurisation,
developing new recipes,
identifying and
troubleshooting
mistakes and problems,
and setting up a
functioning cheese
factory.
Drivers of the need for this
work include:
• the growth in popularity
of artisanal
cheesemaking resulting
in a need for trained
workers with skills in
complex processing of
raw milks
• the inadequacy of
qualifications and
courses available in
Australia
• introduction of different
types of milks and
cheeses that the current
market demands
• increased regulatory
requirements for food
safety and processing of
raw milk products.
• 1 new
qualification or
skill set
• 19 new units of
competency
• Revision of 17
existing units of
competency
• Assessment of
AQF level for
the new
qualifications
Brewing and
distilling
This project will identify
and fill the gaps in
current food processing
qualifications to address
the complex skills
required for brewing
beer and distilling spirits
using a range of
methods and products.
Drivers of the need to
undertake this work include:
• the increase in popularity
of craft or artisan beer,
cider and distilled spirits
• substantial growth in
production and employee
numbers in small
breweries and distilleries
• 2 new
qualifications
• 3 new skill sets
• 10 new units of
competency
• Revision of 20
existing units of
competency

IRC Skills Forecast and Proposed Schedule of Work 2018–2021 6
PRIORITY
SKILL
DESCRIPTION DRIVERS TRAINING
PACKAGE
SOLUTION
• establishment of many
new independent
breweries in recent years
• many successful small
breweries partnering with
larger producers to
access infrastructure for
further growth
• current training options
are insufficient to meet
this growing need
• regulations around food
processing and food
safety have recently
been enhanced.
• Assessment of
AQF level for
the new
qualifications
Food and
beverage
fermentation
This project will identify
and fill the gaps in
current food processing
qualifications to address
food safety and
processes involved in
the growing field of
fermented food and
non-alcoholic fermented
beverage production.
Due to low-cost entry to
market and growing demand
for functional fermented food
and non-alcoholic fermented
beverage products, small
home-based and medium-
sized businesses have
started to appear in greater
numbers.
Occupational standards are
required to support the
growth in industry and
ensure consistent and safe
products are produced.
• 1 new
qualification
• 3 skill sets
• 9 new units of
competency
• Revision of 4
existing units of
competency
• Assessment of
AQF level for
the new
qualification
Pharmaceutical
auditing and
compliance
skills
This project addresses
the increasing
regulations and laws
that govern
pharmaceutical
manufacturing in
Australia and the skills
required to administer,
audit and monitor
compliance.
Global trends in
pharmaceutical
manufacturing include the
push for transparency in
recordkeeping and reporting,
enhanced requirements for
the registration of medicines,
more rigorous requirements
for Therapeutic Goods
Administration (TGA)
compliance and international
regulations affecting the
growing export market of
• 1 new skill set
• 5 new units of
competency
• Revision of 4
existing units of
competency

IRC Skills Forecast and Proposed Schedule of Work 2018–2021 7
PRIORITY
SKILL
DESCRIPTION DRIVERS TRAINING
PACKAGE
SOLUTION
Australian pharmaceuticals
and nutraceuticals.

IRC Skills Forecast and Proposed Schedule of Work 2018–2021 8
Food, Beverage and Pharmaceutical Cross-Sector issues
Automation/
digitalisation in
pharmaceutical,
food and
beverage
manufacturing
processes
This project addresses
the need for skills and
knowledge to operate
and maintain
increasingly complex
and computerised
equipment in
manufacturing
processes.
Computerisation and
advanced technology are
playing a major role in food,
beverage and
pharmaceutical
manufacturing industries.
They are experiencing an
increasing reliance on
computers and advanced
technologies.
Improved quality, efficiency
and productivity allow these
industries to compete in a
global economy.
Manufacturers are installing
complex automated
equipment to remain globally
competitive, which means
the workforce is now
required to operate more
complex automated
equipment within advanced
manufacturing systems.
Automated systems to
eliminate counterfeit
products and improve
tamper proofing of products
and systems are being
heavily pushed by the
regulators.
Revision and
redevelopment of
all units of
competency that
have not been
substantially
reviewed over the
past three years.
Sustainability/
energy
consumption
This project will review
all components of the
FBP Training Package
to ensure current
sustainable practices
and minimal energy
consumption are
addressed.
The issues of energy
consumption and
sustainability of natural
resources permeate all
aspects of our lives and are
vital to most food, beverage
and pharmaceutical
manufacturing operations.
Review of all
components of the
FBP Training
Package.
Traceability,
supply chain
management
and food fraud
This project will review
all components of the
FBP Training Package
to address current
expectations of
product traceability,
supply chain
management and
Increased presence of the
Australian food businesses
in the global marketplace
and international expansion
of businesses demand
abilities to deal with global
supply chain management
and logistics including full
Review all
components of the
FBP Training
Package for current
expectations of
traceability and food
fraud management

IRC Skills Forecast and Proposed Schedule of Work 2018–2021 9
mitigation of fraudulent
practices.
traceability, especially in
times of product recall.
The motivation to adulterate
food for financial gain is
growing and current food
safety management systems
are not always designed for
fraud detection or mitigation.
Globalisation and complex
supply chains are creating
more opportunities for
fraudulent activities. Food
safety regulations require
monitoring and action to
eliminate risks of food fraud.
Food Standards Australia
and New Zealand (FSANZ)
requires producers on
request to provide details
about food on premises and
its source, and provides a
code that covers the ‘one
step back and one step
forward’ elements of
traceability among other
related elements.
skills and
knowledge.
Innovation in
product
development
and food
packaging
This project will review
all components of the
FBP Training Package
to identify where
innovative practices in
the development of
new food products and
food packaging can be
addressed.
Higher business targets for
efficiency, productivity and
competitiveness reached
through innovative new
products and packaging,
addressing industry-wide
challenges while realising
business opportunities.
Existing new product
development and packaging
innovation to maximise
opportunities in new
markets, supply channels
and food and beverage
categories.
New process and
technological developments
in food and beverage
product making based on
chemistry and microbiology
discoveries of opportunities
Review all
components of the
FBP Training
Package, especially
units within the
bottling and
packaging skill sets.

IRC Skills Forecast and Proposed Schedule of Work 2018–2021 10
for existing food
manufacturers.
Work health and
safety (WHS)
This project will review
all components of the
FBP Training Package
to identify where safe
and healthy work
practices can be
incorporated into tasks
and work activities.
Work health and safety
remains a focus across the
sector.
Risk management skills and
knowledge across all
occupations will be needed
as processes and
procedures change within
production and other
aspects of the industry.
Review all
components of the
FBP Training
Package.
Higher-level
strategic
planning and
management
skills across the
food and
beverage
industry
This project will review
the components of the
FBP Training Package
that address
management skills,
and consider importing
relevant units from
other packages to
meet the needs of
these industries.
Increased demand for
Australia’s quality food and
beverage products from
international domestic
markets.
Growing adoption in some
food industry sectors of
vertical integration and other
approaches.
Review all relevant
components of the
FBP Training
Package related to
management skills.
Consider importing
units from other
training packages.
Consider
developing a skill
set for managers
within the food
processing industry.
Online sales
and customer
service skills for
the food
processing
industry
This project will review
all components of the
FBP Training Package
that relate to sales and
customer service, and
consider importing
relevant units from
other training
packages to allow for
these skills to be
developed specifically
for the food processing
industry.
Opportunities exist for
Australian producers across
the food and beverage
sectors to expand existing
markets and enter new
international markets,
particularly in the Asian
regions.
Review all relevant
components of the
FBP Training
Package related to
sales and customer
service.
Consider importing
units from other
training packages.
Consider
developing a skill
set for sales
representatives
within the food
processing industry.

IRC Skills Forecast and Proposed Schedule of Work 2018–2021 11
SECTOR OVERVIEW
Sector Description
The food, beverage and pharmaceutical product manufacturing industry sector integrates all
businesses that operate in the following sub-sectors.
• food processing and manufacturing
• dairy product manufacturing
• bakery product manufacturing
• grain processing, cereal and pasta manufacturing
• fruit and vegetable processing
• sugar manufacturing
• confectionery manufacturing
• snack food manufacturing
• functional food and beverage manufacturing
• beverage manufacturing
• wine and spirit manufacturing
• beer manufacturing
• soft drinks manufacturing
• livestock and pet feed manufacturing
• pharmaceutical and nutraceutical product manufacturing
• human pharmaceuticals and medicinal product manufacturing
• complementary medicine manufacturing
• veterinary pharmaceuticals and medicinal product manufacturing
• wholesaling of the above.
In 2016, the sector included 12,480 manufacturing businesses and 27,000 wholesalers and
retailers, employing 217,632 people.1,2
The sector’s contribution to the Australian economy includes3:
• total sales turnover, which decreased by 0.4 per cent (or $414 million) to $101.9 billion
between 2014–2015 and 2015–2016
• industry value added (IVA), which decreased by 2.9 per cent (or $725 million) to $23.7 billion
over the same period.
1 ABS, 2017, Counts of Australian Businesses, including Entries and Exits, Jun 2012 to Jun 2016. 2 ABS, 2016 Census 3 ABS, Australian Industry, 2015-16, Cat No 8155.0.

IRC Skills Forecast and Proposed Schedule of Work 2018–2021 12
Relevant Training Package Qualifications
The two training packages for the food, beverage and pharmaceutical industries are FBP – Food,
Beverage and Pharmaceutical and FDF10 Food Processing. Once current activities are completed,
FDF10 will be superseded and FBP will become the sole training package for these industries.
• FBP comprises 14 qualifications, 211 units of competency and 3 skill sets.
• FDF10 comprises 14 qualifications, 284 units of competency and 24 skill sets.
FBP QUALIFICATIONS
Qualification Level: Certificate I
Certificate I in Food Processing
Certificate I in Baking
Qualification Level: Certificate II
Certificate II in Baking
Certificate II in Food Processing
Certificate II in Food Processing (Sales)
Qualification Level: Certificate III
Certificate III in Baking
Certificate III in Bread Baking
Certificate III in Cake and Pastry
Certificate III in Food Processing
Certificate III in Food Processing (Sales)
Certificate III in Plant Baking
Certificate III in Rice Processing
Qualification Level: Certificate IV
Certificate IV in Baking
Certificate IV in Flour Milling
FDF10 QUALIFICATIONS
Qualification Level: Certificate I

IRC Skills Forecast and Proposed Schedule of Work 2018–2021 13
Certificate I in Pharmaceutical Manufacturing
Certificate I in Sugar Milling Industry Operations
Qualification Level: Certificate II
Certificate II in Pharmaceutical Manufacturing
Certificate II in Wine Industry Operations
Certificate II in Sugar Milling Industry Operations
Qualification Level: Certificate III
Certificate III in Pharmaceutical Manufacturing
Certificate III in Wine Industry Operations
Certificate III in Sugar Milling Industry Operations
Qualification Level: Certificate IV
Certificate IV in Food Processing
Certificate IV in Pharmaceutical Manufacturing
Certificate IV in Food Science and Technology
Qualification Level: Diploma
Diploma of Food Processing
Diploma of Pharmaceutical Manufacturing
Diploma of Food Science and Technology

IRC Skills Forecast and Proposed Schedule of Work 2018–2021 14
Sector Analysis
Sub-sector description and analysis of businesses involved
FOOD PROCESSING AND MANUFACTURING
SUB-SECTOR
NAME
DAIRY PRODUCT MANUFACTURING
SCOPE OF
WORK
The sector consists of businesses that process milk and cream, make milk
and cream products with varying levels of fat content, and manufacture dairy
products such as cheese, butter, yoghurt, condensed milk, ice cream and
milk powder.
PRODUCERS
In 2016, there were 563 businesses in the sector, with the majority being
small and medium-sized operators.4 However, dairy processing in the sector
is dominated by a small number of large, diversified dairy companies with
global operations and multiple production sites across Australia. Smaller
producers specialise in niche products or cater for smaller local or foreign
markets.
Major producers5
• Devondale Murray Goulburn Cooperative Co. Ltd (MGC) (Australian
dairy farmers’ cooperative)
• Lion Pty Ltd (subsidiary of Japanese Kirin Holdings Company Ltd)
• Parmalat Australia Pty Ltd (subsidiary of Parmalat Belgium SA)
• Fonterra Australia Pty Ltd (subsidiary of New Zealand cooperative of
dairy farmers)
• Bega Cheese Cooperative Ltd (Australian-owned and publicly listed
manufacturer)
• Warrnambool Cheese and Butter (subsidiary of Canadian dairy company
Saputo)
• Tatura Milk Industries Ltd (subsidiary of Bega Cheese)
• Peters Food Group Ltd
• Unilever Australia (Holdings) Pty Ltd (subsidiary of UK Unilever PLC)
• Bulla Dairy Foods (Australian-owned company)
• Bon Appetit Australia Pty Ltd
• Norco Cooperative Ltd
• Sara Lee Group (Australia) Pty Ltd (subsidiary of Canadian frozen food
company McCain)
• Weis Frozen Foods
4 ABS, 2017, Counts of Australian Businesses, including Entries and Exits, Jun 2012 to Jun 2016. 5 Enterprises listed according to their relative market share or significance in the sector.

IRC Skills Forecast and Proposed Schedule of Work 2018–2021 15
GEOGRAPHICAL
LOCATION
While all Australian states have dairy product processing operations, Victoria
contributes the largest share, followed by New South Wales, in national dairy
product output. The processing establishments are generally located near
dairy farms or areas with high concentration of dairy farming activities and
water availability.
AUTOMATION
AND
DIGITALISATION
The level of automation varies depending on the type and scale of
production. New process engineering practices and technologies are being
integrated into diary operations to develop new product attributes and
ingredients and improve existing processes. Computerised systems are
used to streamline administrative and managerial operations and to
contribute to improved marketing and distribution systems.
SUB-SECTOR
NAME
BAKERY PRODUCT MANUFACTURING
SCOPE OF
WORK
The sector includes businesses involved in the production of all range of
bread products, bread dough, cakes, pastries and other similar bakery
products such as artisan breads and biscuits. Bakery producers operate from
factory-based premises and non-factory-based locations such as retail
bakeries, supermarket in-store bakeries and home-based businesses.
PRODUCERS
The sector is characterised by a large number of small and medium-sized
producers, with many producing from non-factory-based premises for local
or niche markets. In 2016, there was a total of 5,852 businesses in the
sector.6 There is a small number of large producers, yet they dominate the
national bread and biscuits product output through the large number of sites
operated across Australia. Often, these companies are multinational, and
operate globally.
Smaller producers, including those operating as franchisees, account for a
larger number of businesses with smaller, individual and specialised output.
Many specialise in niche areas as a means to differentiate themselves in the
market, for example, artisanal baking.
Major producers7
• Goodman Fielder Ltd (subsidiary of Singapore’s Wilmar International
and Hong Kong’s First Pacific)
• Patties Foods Ltd (Australian-owned company)
• George Weston Foods (GWF) (a wholly-owned subsidiary of Associated
British Foods PLC [ABF])
• Sara Lee Australia (subsidiary of Canadian frozen food company
McCain)
6 ABS, 2017, Counts of Australian Businesses, including Entries and Exits, Jun 2012 to Jun 2016. 7 Enterprises listed according to their relative market share or significance in the sector.

IRC Skills Forecast and Proposed Schedule of Work 2018–2021 16
• Arnott’s Biscuits Holdings Pty Ltd (subsidiary of the US-based Campbell
Soup Company Inc.)
• Green’s Foods Holdings Pty Ltd (Australian-owned company)
GEOGRAPHICAL
LOCATION
Bread and bakery production occurs across all Australian states.
AUTOMATION
AND
DIGITALISATION
The level of automation and integration of digital technology vary depending
on the scale of production. In large operations, bread production is a fully-
mechanised process, with machines undertaking jobs from dough mixing to
moulding and baking, as well as slicing and wrapping. Larger companies also
use computer-based systems and software to achieve better inventory and
production planning, and improved marketing and distribution systems.
SUB-SECTOR
NAME
GRAIN PROCESSING, CEREAL AND PASTA MANUFACTURING
SCOPE OF
WORK
The sector includes businesses that process grains, vegetables or plants into
a range of flour and meal products (primary processing activity), and
businesses that manufacture prepared cereal foods, fresh and dried pasta,
and prepared baking mixes.
PRODUCERS
In 2016, there were 94 grain processors in the sector, including three large
businesses and smaller operators largely catering for niche and specialty
products. Cereal and pasta manufacturing includes 259 businesses, both
large multinational companies and small, local manufacturers and resellers.8
Smaller operators are usually specialist breakfast cereal and baking mix
companies that concentrate on a specific range of products.
Major producers9
Grain processing:
• Manildra Milling Pty Ltd (Australian family-owned business)
• Food Investments Pty Ltd (subsidiary of the UK-based Associated British
Foods PLC)
• Allied Mills Australia Pty Ltd (subsidiary of Australia’s GrainCorp Ltd)
Cereal and pasta manufacturing:
• Kellogg Australia (subsidiary of the US-based Kellogg Company)
• Australian Health & Nutrition Association Limited (AHNAL) (Australian-
owned company – Sanitarium Health & Wellbeing is the trading name of
AHNAL and New Zealand Health Association Ltd, both wholly-owned by
the Seventh-day Adventist Church)
• General Mills Australia (subsidiary of the US-based General Mills)
8 ABS, 2017, Counts of Australian Businesses, including Entries and Exits, Jun 2012 to Jun 2016. 9 Enterprises listed according to their relative market share or significance in the sector.

IRC Skills Forecast and Proposed Schedule of Work 2018–2021 17
• Nestlé Australia Ltd (subsidiary of the Swiss Nestlé SA Company)
• Clearlight Investments Pty Ltd (Australian-owned private company)
GEOGRAPHICAL
LOCATION
Flour and grain product manufacturers are located in both metropolitan and
country areas. Metropolitan manufacturers are located close to downstream
markets, such as wholesalers and food manufacturing industries. In country
areas, manufacturers are located in wheat-growing areas to be close to key
inputs. Likewise, large cereal and pasta producers tend to have operations
near key inputs to reduce transport costs. Although sector producers are
spread across Australia, New South Wales and Victoria have the largest
share.
AUTOMATION
AND
DIGITALISATION
The sector is characterised by the introduction of further automation of
traditional processes and re-engineering or equipment design to increase
efficiency and operating capacity. Other major developments relate to
computerisation of processes and stocks, and improved packaging
processes through adoption of automated equipment. Value-adding through
the development of new products is a key driver of innovation in the sector.
SUB-SECTOR
NAME
FRUIT AND VEGETABLE PROCESSING
SCOPE OF
WORK
The sector represents businesses that process, bottle, can, preserve, quick-
freeze and quick-dry fruit and vegetables, including dehydrated vegetable
products, sauces, pickles and mixed meat and vegetable products.
PROCESSORS
The sector comprises 575 businesses, with the majority being small and
medium-sized operators including farmer cooperatives.10 The sector is also
characterised by a high level of vertical integration, particularly in the fruit
processing segment. Where vertical integration is limited, processors enter
into supply contracts with growers, which gives them a level of control on
management functions related to quantity and quality of supply. Processors
with large-scale operations in the sector are generally multinational
companies.
Major processors11
• Simplot Australia (Holdings) Pty Ltd (subsidiary of US-based J.R.
Simplot Company)
• SPC Ardmona (SPC) (subsidiary of Coca-Cola Amatil)
• McCain Foods (Australia) Pty Ltd (subsidiary of Canadian McCain
Corporation)
• Heinz Wattie’s Pty Ltd (subsidiary of US-based Heinz)
10 ABS, 2017, Counts of Australian Businesses, including Entries and Exits, Jun 2012 to Jun 2016. 11 Enterprises listed according to their relative market share or significance in the sector.

IRC Skills Forecast and Proposed Schedule of Work 2018–2021 18
• One Harvest Pty Ltd (Australian, family-owned business based in
Queensland)
GEOGRAPHICAL
LOCATION
Production facilities are located in all Australian states, generally in areas
with a high concentration of fruit and vegetable growers. New South Wales,
Victoria and Queensland have the largest share of fruit and vegetable
processors.
AUTOMATION
AND
DIGITALISATION
The sector, particularly in relation to larger processors, integrates automated
processes and digital systems that provide efficient control of inventory and
management of production processes, and improved marketing and
distribution systems.
SUB-SECTOR
NAME
SUGAR MANUFACTURING
SCOPE OF
WORK
The industry’s major product is raw crystal sugar, which is sold to refineries
both domestically and abroad. Approximately 95 per cent of the Australian
sugar produced comes from Queensland, with the balance coming from
northern New South Wales.
The Australian sugarcane industry is one of Australia’s largest rural
industries, with sugarcane being Queensland’s largest agricultural crop. Up
to 35 million tonnes of sugarcane is crushed annually. This can produce up
to 4.5 million tonnes of raw sugar, 1 million tonnes of molasses and 10 million
tonnes of bagasse annually. Approximately 85 per cent of raw sugar is
exported, generating up to $2 billion in export earnings.
PRODUCERS
The sugar manufacturing sector is characterised by a small number of
operators, which are a combination of publicly-owned entities, private
companies and cooperatives. Large producers include Australian-owned
companies and global operators with a high level of vertical integration.
Major producers
Sugar manufacturing:
• Wilmar Sugar Australia Ltd and its subsidiaries
• Mackay Sugar Ltd (unlisted public company)
• MP Australia Holdings Pty Ltd (trading as MSF Sugar, subsidiary of
Thai-based Mitr Phol Sugar Corp)
• Finasucre Investments (Australia) Pty Ltd (subsidiary of the Belgian
sugar giant Societe Financiere des Sucres)
• Tully Sugar Ltd (wholly-owned subsidiary of Chinese agribusiness
company COFCO)
• Isis Central Mill
• Sunshine Sugar

IRC Skills Forecast and Proposed Schedule of Work 2018–2021 19
• Sugar Australia
GEOGRAPHICAL
LOCATION
Sugar processing facilities are located mainly along Australia’s eastern
coastline, from Mossman in far north Queensland to Grafton in northern New
South Wales. There are approximately 4,400 cane-farming entities growing
sugarcane on a total of 380,000 hectares annually, supplying 24 mills, owned
by eight separate milling companies. Sugar refinery facilities operate from
Port Melbourne in Victoria to Mackay in Queensland. Chocolate and
confectionery producers are located in most Australian states, with the
majority in metropolitan areas in New South Wales and Victoria.
AUTOMATION
AND
DIGITALISATION
Sugar manufacturing is characterised by extensive capital equipment; this
capital equipment undergoes a renewal program in excess of $300 million
every year. New technology adoption in the sector has been limited;
however, this has improved in recent times with the introduction of foreign
ownership and new capital.
SUB-SECTOR
NAME
CONFECTIONERY MANUFACTURING
SCOPE OF
WORK
The sector consists of companies that manufacture confectionery, chocolate
or cocoa products, with or without sugar.
PRODUCERS
The chocolate and confectionery sector is represented by three large,
globally-operated producers and about 330 small and medium-sized
businesses.12 Small producers have a significant role in small local and
foreign markets and niche markets.
Major producers13
• Mondelez Australia Holdings Pty Ltd (subsidiary of the US-based
Mondelez International Inc.)
• Nestlé Australia Ltd (subsidiary of Switzerland-based Nestlé SA)
• Mars Australia Pty Ltd (subsidiary of US-based Mars Inc.)
• Ferrero Australia Pty Ltd (subsidiary of Luxembourg-based Ferrero
International SA)
GEOGRAPHICAL
LOCATION
Chocolate and confectionery producers are located in most Australian states,
with the majority in metropolitan areas in New South Wales and Victoria.
AUTOMATION
AND
DIGITALISATION
Chocolate and confectionary producers involve a high level of production
automation and computer-controlled equipment for precise calibration and
tolerances. Digital systems for improved supply chain arrangements, and
better marketing and distribution systems, are also a driver of improvements
in the sector.
12 ABS, 2017, Counts of Australian Businesses, including Entries and Exits, Jun 2012 to Jun 2016. 13 Enterprises listed according to their relative market share or significance in the sector.

IRC Skills Forecast and Proposed Schedule of Work 2018–2021 20
SUB-SECTOR
NAME
SNACK FOOD MANUFACTURING
SCOPE OF WORK The sector includes companies that manufacture dried fruit and nut bars,
muesli bars, protein bars, mixed nuts, potato/corn chips, extruded snacks,
popcorn, pretzels and other sweet and savoury snack products. The
primary distribution channels are supermarkets, milk bars and convenience
stores.
PRODUCERS The snack food sector is represented by large multinationals that specialise
in snack food production, such as Frito-Lay, or that dedicate a small
segment of their business to snack foods, like Nestlé Australia; major
grocery supermarkets through their own private labels; and small-scale
producers that specialise in niche, lower-volume products, with many
entering the market in recent years.
Major producers14
• Frito-Lay Australia Holdings Pty Ltd (subsidiary of US-based Frito-Lay
Inc.)
• Smith’s Snackfood Company (subsidiary of the multinational
corporation PepsiCo)
• Snack Brands Limited (privately owned Australian snack food
company)
• Woolworths Ltd (private labels)
• Aldi Stores Supermarkets Pty Ltd (private labels)
• Wesfarmers Ltd (private labels)
• Manassen Foods Australia Pty Ltd
• Sakata Rice Snacks Australia Pty Ltd
• Stuart Alexander & Co Pty Ltd
• San Remo Macaroni Co Pty Ltd
• Rice Growers Ltd
• Menora Foods Pty Ltd
• Nestlé Australia Ltd
GEOGRAPHICAL
LOCATION
The majority of snack food establishments are located in metropolitan
areas of Queensland, Victoria and New South Wales.
AUTOMATION
AND
DIGITALISATION
Many snack food producers benefit from the introduction of automated,
computer-controlled equipment, which provides increased efficiency and,
in many cases, improved product quality.
14 Enterprises listed according to their relative market share or significance in the sector.

IRC Skills Forecast and Proposed Schedule of Work 2018–2021 21
SUB-SECTOR
NAME
FUNCTIONAL FOOD AND BEVERAGE MANUFACTURING
SCOPE OF
WORK
The sector encompasses companies that manufacture foods and drinks,
including fermented foods, fortified, enriched or enhanced with vitamins and
nutraceutical components such as probiotics (micro-organisms that provide
digestive benefits), omega-3 (fish oil) extracts, and nutrients found in plants
(such as soy beans, blueberries or grapes) and algae/seaweeds.
Examples of functional foods and drinks include fruit juice, bread and pasta
fortified with vitamins and minerals, fermented cheeses, fermented fruit and
vegetables, kombucha, margarine containing plant sterols, yoghurt with
specific bacterial strains, health drinks, sports drinks and energy drinks.
PRODUCERS Food and beverage companies are the primary producers of functional food.
Nutraceutical/ingredient extraction may be conducted in-house, or it may be
outsourced to specialised suppliers dedicated to food ingredient technology
research and product development.
AUTOMATION
AND
DIGITALISATION
Nutraceutical extraction involves specialised, sophisticated technologies.
Research and development is often significant.
BEVERAGE MANUFACTURING
SUB-SECTOR
NAME
SPIRIT MANUFACTURING
SCOPE OF
WORK
The sector includes businesses that ferment and distil grapes (including
recovered material from wine production), sugarcane or sugar beet products
(including cane juices, molasses and sugar), grain and ferments (yeast and
yeast cultures) to produce spirit products such as food-grade ethanol,
brandy, vodka, gin, whisky and liqueurs.
PRODUCERS The sector includes approximately 50 spirit producers.15 The majority are
non-employing or small producers that make boutique spirits, with many
promoting themselves as tourism destinations.
Major spirit distillers
• Carlton & United Breweries CUB (a subsidiary of AB InBev)
• Bacardi Lion (joint venture of Bacardi and Lion)
• Diageo Australia (foreign-owned public company, distributor of beer,
spirits and a small portfolio of premium Champagne)
• Beam Global Australia (subsidiary of the US-based Beam Inc.)
15 ABS, 2017, Counts of Australian Businesses, including Entries and Exits, Jun 2012 to Jun 2016.

IRC Skills Forecast and Proposed Schedule of Work 2018–2021 22
• Vok Beverages (independently owned and operated Australian
alcoholic beverage company)
• Brown-Forman Australia (subsidiary of the US-based Brown-Forman
spirit company)
• Suntory Australia (subsidiary of Japan-based Suntory Liquors Ltd)
• Campari Australia (subsidiary of Italy-based Gruppo Campari)
• Asahi Holdings (Australia) Pty Ltd (previously Independent Distillers,
producer and distributor of a range of RTD products, spirits and craft
beers)
• ONEBEV (independently owned Australian alcoholic beverage
company)
• Coca-Cola Amatil Limited (CCA) (subsidiary of Beam Inc., distributor
of a range of spirit, cider and RTD products)
• Lion Pty Ltd (subsidiary of Japanese Kirin Brewing Company,
producer and distributor of a range of wine, cider and beer products)
GEOGRAPHICAL
LOCATION
There are a number of spirit manufacturing enterprises in New South Wales,
Queensland and Victoria. Tasmania has some world-recognised whisky
distilleries, while Queensland and South Australia have some of the oldest
and largest.
AUTOMATION
AND
DIGITALISATION
The sector, particularly in relation to larger processors, integrates automated
processes and digital systems that provide economies of scale, better quality
control, greater product consistency, efficient control of inventory,
management of production processes, and improved marketing and
distribution systems for spirit producers.
An area that spirit producers are tapping into is big data from their online
presence, and use of this consumer data to aid social media for mass
marketing.
SUB-SECTOR
NAME
WINE MANUFACTURING
SCOPE OF
WORK
The sector includes businesses that ferment grapes into wine, fortified wine
and wine-based alcoholic beverages. The sector also includes the production
of cider from the fermentation of apples or pear and a range of other non-
traditional cider flavours. These products are sold in bulk, bottles or casks in
domestic and export markets.
In 2015, the Australian wine industry exported 789 million litres of wine,
generating $2.11 billion for the Australian economy.16 Domestically, wine
sales totalled $2.78 billion in 2014–2015.17
16 Wine Australia 2015, Wine Export Approval Report, Moving Annual Total (MAT) to December 2014. 17 Wine Australia 2016, State of Australia Wine, March 2016.

IRC Skills Forecast and Proposed Schedule of Work 2018–2021 23
An additional stream in this sector is the recovery of waste materials from the
wine industry, including marc (the solid remains of wine grapes after pressing
of the grapes), and transforming the waste into value-added products, such
as grape alcohol, chemical additives for wine, tannins, grape juice and
various agricultural and horticultural products including stock feed, mulch,
soil conditioner and organic fertiliser.
PRODUCERS The sector comprises 1,902 wine businesses, including a few large
producers, several medium-sized businesses and many small, family-owned
businesses.
Major wine producers
• Accolade Wines Holdings Australia Pty Ltd (private equity
ownership, Australian Wine producer, largest winery in the southern
hemisphere)
• Casella Wines Pty Ltd (Australia’s largest family-owned winery, also
a distributor of craft beer)
• Treasury Wine Estates Ltd (TWE) (Australian-owned producer and
distributor of wine with global operations)
• Pernod Ricard Pacific Holding Pty Ltd (subsidiary of France-based
spirits and wine giant Pernod Ricard SA
• Australian Vintage Limited (AVL)
• Kingston Estate Wines
• De Bortoli Wines
GEOGRAPHICAL
LOCATION
Wine production facilities are located at or near vineyards in all Australian
states, with concentrations in regions like the Barossa Valley, McLaren Vale,
Clare Valley, Riverland, Coonawarra, Eden Valley and Adelaide Hills in
South Australia; Sunraysia, Yarra Valley, Mornington Peninsula, Heathcote,
Western District, Rutherglen and Beechworth in Victoria; the Hunter Valley,
Great Dividing Range, Orange, Forbes, and Griffith in New South Wales; and
Margaret River, Frankland River, Mount Barker and Swan Valley in Western
Australia.
AUTOMATION
AND
DIGITALISATION
Technological change in the industry is driven by automation for cost
reduction, product consistency and environmental sustainability. Producers
employ sensor technology to monitor grape growing and vine conditions,
machines to harvest crops, mechanical presses to crush grapes, and
computer-controlled winery operations such as tank temperature and
filtration and fining processes. After ageing, the bottling and packaging
process is able to be automated.
Another area of innovation is packaging and label design that allows
producers to differentiate themselves from competitors and attract
consumers. Producers are embracing recyclable packaging and
experimenting with single-serve packaging in the form of pouches, cans and
aseptic cartons.

IRC Skills Forecast and Proposed Schedule of Work 2018–2021 24
Smaller boutique producers often have a rich heritage and produce unique
wine that reflects the character of wines of their region. These producers,
while innovative and dedicated, are generally not in a financial position to
automate, but are often very active in the digital and/or social media space.
SUB-SECTOR
NAME
BEER MANUFACTURING
SCOPE OF
WORK
Businesses in this sector brew, package and distribute keg, bottled and
canned beer in a range of varieties, such as ale, lager and stout. The basic
ingredients include barley (sometimes wheat, rye or other grains), water, hops
and yeast.
PRODUCERS The sector includes approximately 520 producers, the majority of which are
small, privately-owned brewers producing premium beers. There are a few
large, multinational companies that dominate the market. Independent brewers
account for 3 per cent of the total beer production in Australia. In 2016, the
independent brewing sector comprised approximately 380 businesses located
across every Australian state and territory.18.19 There are a few large,
multinational companies that dominate the market.
Major beer brewers and distributors
• Lion Pty Ltd (subsidiary of the Japanese Kirin Brewery Company Ltd)
• Carlton & United Breweries CUB (a subsidiary of AB InBev, the world’s
largest brewer)
• Coopers Brewery Ltd
• Australian Beer Company (ABCo) (joint venture of the Coca-Cola
Amatil and Casella)
• Gage Roads Brewing Co. Ltd
• Asahi Holdings (Australia) Pty Ltd
GEOGRAPHICAL
LOCATION
Although the majority of industry establishments are concentrated in Victoria,
New South Wales and Western Australia, operations can also be found in
Queensland and South Australia, and a smaller number in Tasmania.
AUTOMATION
AND
DIGITALISATION
Computerisation is playing a major role in ensuring consistency in beverage
products by monitoring ingredient flow and ensuring that these ingredients are
mixed in correct quantities and at specified temperatures.
SUB-SECTOR
NAME
SOFT DRINKS MANUFACTURING
18 Independent Brewers Association, 2017, Independent Brewing Industry National Economic Evaluation 19 ABS, 2017, Counts of Australian Businesses, including Entries and Exits, Jun 2012 to Jun 2016.

IRC Skills Forecast and Proposed Schedule of Work 2018–2021 25
SCOPE OF
WORK
The sector includes businesses that produce canned or bottled soft drinks
(carbonated and non-carbonated), cordial, juice, syrup, sport drinks and
energy drinks.
PRODUCERS The sector is dominated by a few large, multinational companies, but also
contains 404 smaller, regionally-based operators.20 Many of these operators
produce private-label products and service niche market segments.
Major producers and distributors21
• Coca-Cola Amatil (Australia) Ltd (CCA) (subsidiary of US-based
Coca-Cola Amatil Ltd)
• Asahi Holdings (Australia) Pty (subsidiary of the Japanese-based
company)
• Tru Blu Beverages (Australian-owned private company)
GEOGRAPHICAL
LOCATION
Soft drink manufacturers have facilities all over Australia, with key sites in
Sydney, Melbourne, Adelaide and Perth.
AUTOMATION
AND
DIGITALISATION
Soft drink manufacturing is characterised by extensive capital equipment,
with the adoption of new technology in the sector being limited. Digital
systems for improved supply chain arrangements, and better marketing and
distribution systems are also adopted in the sector.
LIVESTOCK AND PET FEED MANUFACTURING
SUB-SECTOR
NAME
LIVESTOCK AND PET FEED MANUFACTURING
SCOPE OF
WORK
The sector includes businesses involved in the manufacture of stockfeed for
animals and birds (including cereal meal, grain offal or crushed grain for use
as fodder), and canned food for pets. Products are transported in bulk form
to distribution centres across the country.
PRODUCERS In 2016, there were 289 businesses in the sector,22 with the majority being
small operators. However, the stockfeed products market is dominated by a
small number of large and medium producers. The level of vertical
integration within the sector is relatively minor. Also, some of the major
companies listed below are stockfeed or pet food divisions of global food and
beverage corporations.
Major producers23
• Ridley Corporation Ltd (Australian-owned public company)
20 ABS, 2017, Counts of Australian Businesses, including Entries and Exits, Jun 2012 to Jun 2016. 21 Enterprises listed according to their relative market share or significance in the sector. 22 ABS, 2017, Counts of Australian Businesses, including Entries and Exits, Jun 2012 to Jun 2016. 23 Enterprises listed according to their relative market share or significance in the sector.

IRC Skills Forecast and Proposed Schedule of Work 2018–2021 26
• Mars Australia Pty Ltd (subsidiary of US-based Mars Inc.)
• Riverina (Australia) Pty Ltd (subsidiary of Japan-based Mitsubishi
Corporation)
• Ingham Holdings (subsidiary of US-based private equity firm TPG)
• Nestlé Australia Ltd (subsidiary of Switzerland-based Nestlé SA)
• Ricegrowers Ltd (Australian-owned public company)
GEOGRAPHICAL
LOCATION
The majority of stockfeed and canned pet food production facilities are
located across New South Wales, Queensland and Victoria, generally in rural
or country areas and close to key inputs such as grain mills, cattle farms or
meat processing plants. A few facilities are also located in Western Australia
and South Australia.
AUTOMATION
AND
DIGITALISATION
The sector integrates high levels of automation and involves almost
continuous operations. Processes and stock inventory and distribution are
supported by computerised systems. Packaging also involves a variety of
equipment, including collators, conveyors, spiral chutes, carton drops and
automated case packers.
PHARMACEUTICAL AND NUTRACEUTICAL PRODUCT MANUFACTURING
SUB-SECTOR
NAME
HUMAN PHARMACEUTICAL PRODUCT MANUFACTURING
SCOPE OF
WORK
The sector comprises businesses that manufacture medicinal and
pharmaceutical products for human use, including medicines and chemical
testing agents, blood serums and biotech products.
Recent developments include booming export markets (mainly China), which
have been a driver for improved company growth and opportunities.
The sector includes organisations across a breadth of specialisations and
manufacturing processes, with some being extremely specialised. The more
complex the production tasks, the less reliance there is on generic,
transferable production skills such as Good Manufacturing Practice (GMP),
and more reliance on internal training on organisation-specific equipment.
PRODUCERS The sector includes 360 producers,24 including the following major producers,
often multinational, pharmaceutical manufacturing companies that dominate
the market.25
• Pfizer Australia Holdings Pty Ltd (subsidiary of the US-based
company Pfizer Inc.)
• AstraZeneca Pty Ltd (subsidiary of the British-Swedish AstraZeneca
PLC)
24 ABS, 2017, Counts of Australian Businesses, including Entries and Exits, Jun 2012 to Jun 2016. 25 Enterprises listed according to their relative market share or significance in the sector.

IRC Skills Forecast and Proposed Schedule of Work 2018–2021 27
• GlaxoSmithKline Holdings Pty Ltd (GSK Australia) (subsidiary of the
British GlaxoSmithKline PLC [GSK])
• Aspen Pharmacare Australia Pty Ltd (subsidiary of the South Africa-
based company Aspen Pharmacare Holdings Ltd)
• CSL Ltd (Australian-based, public company)
• Alphapharm (subsidiary of the foreign-owned company Mylan)
• Sanofi-Aventis Australia Pty Ltd (subsidiary of the French Sanofi-
Aventis company)
GEOGRAPHICAL
LOCATION
New South Wales and Victoria account for two-thirds of the business
enterprises in this sector. Several businesses are also located in
Queensland, Western Australia and South Australia, and a small number in
Tasmania.
AUTOMATION
AND
DIGITALISATION
The operations used in the sector range from simple processes of mixing
ingredients and packaging, to complex procedures involving the latest
capital-intensive technology. The sector is evolving in line with various
technological advancements. As the job task becomes more complex, there
is greater focus on organisation-specific training and less on accredited
training, especially with automation within the industry.
SUB-SECTOR
NAME
COMPLEMENTARY MEDICINE MANUFACTURING
SCOPE OF
WORK
The sector comprises businesses that manufacture vitamins, mineral and
dietary supplements, and herbal and homoeopathic medicines.
Dietary supplements are products in form of liquid, capsule, powder or pill,
which concentrate nutraceutical components derived from natural sources
such as herbals, non-herbals and others.
PRODUCERS The sector includes a few highly specialised companies that produce their
own branded dietary supplement products, such as Blackmores Ltd and
Swisse Wellness Pty Ltd, and a number of small contract manufacturing
businesses that produce a range of vitamins and supplements for
pharmaceutical companies and consumers.
GEOGRAPHICAL
LOCATION
Industry activity is concentrated in New South Wales, Victoria and
Queensland to take advantage of the infrastructure provided and market
size.
AUTOMATION
AND
DIGITALISATION
The equipment for extracting nutraceutical components can be specialised
and based on sophisticated technologies. Other operations in the sector
range from simple processes of mixing ingredients and packaging, to
complex procedures involving advanced technology. The sector is evolving
in line with various technological advancements. As the job task becomes

IRC Skills Forecast and Proposed Schedule of Work 2018–2021 28
more complex, there is greater focus on organisation-specific training and
less on accredited training, especially with automation within the industry.
SUB-SECTOR
NAME
VETERINARY PHARMACEUTICAL MANUFACTURING
SCOPE OF
WORK
This sector manufactures drugs, medicines, medicinal chemicals, vaccines,
serums and other pharmaceutical products for veterinary use.
PRODUCERS The sector includes 71 producers.26 There are a few large, multinational
companies that dominate the market, several medium-sized businesses, and
a larger number of small, family-owned producers.
Major producers27
• Zoetis (a global producer, spin-off from Pfizer)
• Virbac Australia Pty Ltd (subsidiary of France-based Virbac)
• Intervet Australia (MSD Animal Health Australia) (part of the US-
based pharmaceutical giant Merck & Co Inc.)
• Jurox Pty Ltd (family-owned and Australia-based company)
• Bayer Australia Ltd (subsidiary of German-based Bayer company)
• Bioproperties Pty Ltd (Australian-owned company)
• Elanco Australia (A division of Eli Lily and Company)
GEOGRAPHICAL
LOCATION
The majority of industry establishments are concentrated in New South
Wales, but there are also production facilities in Victoria and Queensland.
AUTOMATION
AND
DIGITALISATION
Veterinary pharmaceutical manufacturing generally involves complex
processes using capital-intensive technology and equipment. The sector is
evolving in line with various technological advancements. As the job task
becomes more complex, there is greater focus on organisation-specific
training and less on accredited training, especially with automation within the
industry.
WHOLESALING AND RETAILING OF FOOD, BEVERAGE AND PHARMACEUTICAL PRODUCE
SUB-SECTOR
NAME
WHOLESALING AND RETAILING
SCOPE OF
WORK
This sector operates via two channels:
26 ABS, 2017, Counts of Australian Businesses, including Entries and Exits, Jun 2012 to Jun 2016. 27 Enterprises listed according to their relative market share or significance in the sector.

IRC Skills Forecast and Proposed Schedule of Work 2018–2021 29
• retail and trade merchants
• wholesalers, manufacturers, importers and exporters.
Wholesalers, manufacturers, importers and exporters sell, import and/or
export large volumes of food, beverage and pharmaceutical produce, and
distribute them through the retail sector or directly to the specialist industries.
PLAYERS The sector is highly fragmented, comprising many geographically-focused
wholesalers and a large number of retail points. Large supermarkets and
retailers deal directly with manufacturers, reducing the need for an industry
wholesaler.
Some of the key wholesalers include:
• Sigma Healthcare
• Symbion
• NPD (National Pharmacies Distribution)
• Australian Pharmaceutical Industries (API) Ltd
• CH2
• National Pharmaceutical Services Association (NPSA)
• DHL
• World Courier
• Toll
GEOGRAPHICAL
LOCATION
Food, beverage and pharmaceutical merchants operate throughout
Australia.
AUTOMATION
AND
DIGITALISATION
Manufacturers and merchants are increasingly reviewing the best ways of
providing products, information and services to customers, and adapting to
new methods of collaborative logistics (computerised inventory control
systems, tracking and reporting technologies) and digital communication.
Relevant Stakeholders
The food, beverage and pharmaceutical industry sector is represented by about 55 peak
organisations at a national and state level. These organisations include over 35 industry and industry
sub-sector associations, about 10 industry services bodies including R&D, and a small number of
professional associations, employee associations and regulatory bodies. There are also over 80
local wine region associations focused on the promotion of wine from their defined regions.
Table 1: Relative number of industry peak bodies
CATEGORY NUMBER
Industry associations 7

IRC Skills Forecast and Proposed Schedule of Work 2018–2021 30
Industry sub-sector associations 28
Industry services bodies 6
Industry R&D services bodies 4
Employee associations 3
Regulatory bodies 4
Industry standards bodies 1
Professional associations 2
Total 55
Table 2: Peak industry organisations
CATEGORIES – PEAK INDUSTRY ORGANISATIONS GEOGRAPHICAL
REPRESENTATION
INDUSTRY SECTOR ASSOCIATIONS
Ai Group NATIONAL
Australian Food and Grocery Council (AFGC) NATIONAL
Food Technology Association of Australia NATIONAL
Foodservice Industry Association NATIONAL
Food and Beverage Importers Association NATIONAL
Foodservice Suppliers Association Australia (FSAA) NATIONAL
Food Industries Association of Queensland (FIAQ) QLD
INDUSTRY SUB-SECTOR ASSOCIATIONS
DAIRY
Australian Dairy Products Federation (ADPF) NATIONAL
Dairy Australia NATIONAL
Dairy Industry Association of Australia Inc. (DIAA) NATIONAL
National Centre for Dairy Education (NCDE) NATIONAL
Tasmanian Dairy Industry Association TAS

IRC Skills Forecast and Proposed Schedule of Work 2018–2021 31
CATEGORIES – PEAK INDUSTRY ORGANISATIONS GEOGRAPHICAL
REPRESENTATION
Australian Specialist Cheesemakers’ Association NATIONAL
BAKERY
Australian Society of Baking NATIONAL
Baking Association of Australia NATIONAL
National Baking Industry Association (NBIA) NATIONAL
SUGAR
Australian Sugar Industry Alliance NATIONAL
Australian Sugar Milling Council NATIONAL
SOFT DRINKS
Australian Beverages Council NATIONAL
BEER
Independent Brewers Association NATIONAL
Brewers Association of Australia and New Zealand NATIONAL
Cider Australia NATIONAL
WINE
Australian Vignerons NATIONAL
Winemakers’ Federation of Australia NATIONAL
NSW Wine Industry Association NSW
Queensland Wine Industry Association QLD
South Australian Wine Industry Association SA
Wine Grape Council of South Australia SA
Wine Victoria VIC
Wines of WA WA
SPIRITS
Distilled Spirits Industry Council of Australia (DSICA) NATIONAL

IRC Skills Forecast and Proposed Schedule of Work 2018–2021 32
CATEGORIES – PEAK INDUSTRY ORGANISATIONS GEOGRAPHICAL
REPRESENTATION
Australian Distillers Association NATIONAL
PHARMACEUTICAL
Medicines Australia (MA) NATIONAL
Generic and Biosimilar Medicines Association (GBMA) NATIONAL
Complementary Medicines Australia NATIONAL
Australian Self-Medication Industry Association NATIONAL
AusBiotech NATIONAL
INDUSTRY R&D SERVICES BODIES
Sugar Research Australia (SRA) NATIONAL
Sugar Research Institute NATIONAL
Grape and Wine Research and Development Corporation
(Wine Australia)
NATIONAL
Meat and Livestock Australia NATIONAL
Grains Research and Development Corporation NATIONAL
Australian Wine Research Institute NATIONAL
EMPLOYEE REPRESENTATIVE ORGANISATIONS
Australian Manufacturing Workers’ Union NATIONAL
Breweries and Bottleyards Employees’ Industrial Union of
Workers of Western Australia
WA
National Union of Workers NATIONAL
INDUSTRY SERVICES BODIES
Food Innovation Australia Limited (FIAL) NATIONAL
The Allergen Bureau NATIONAL
Medical Technology and Pharmaceuticals Growth Centre
(MTPConnect)
NATIONAL
Nutrition Australia NATIONAL

IRC Skills Forecast and Proposed Schedule of Work 2018–2021 33
CATEGORIES – PEAK INDUSTRY ORGANISATIONS GEOGRAPHICAL
REPRESENTATION
Wine Grapes Marketing Board NSW
Queensland Sugar Limited QLD
Sugar Terminals Limited QLD
Tasmanian Whisky Academy TAS
Institute of Brewing and Distilling INTERNATIONAL
INDUSTRY STANDARDS BODIES
Food Standards Australia New Zealand NATIONAL
Standards Australia NATIONAL
PROFESSIONAL ASSOCIATIONS
Australian Society of Sugarcane Technologists NATIONAL
Australian Society of Viticulture and Oenology NATIONAL
International Society for Pharmaceutical Engineering INTERNATIONAL
Parenteral Drug Association NATIONAL
REGULATORY BODIES
Australian Grape and Wine Authority (Wine Australia) NATIONAL
Pharmaceutical Benefits Advisory Committee (PBAC) NATIONAL
Therapeutic Goods Administration NATIONAL
Food Standards Australia and New Zealand NATIONAL
Standards Australia NATIONAL
ACT Health ACT
Northern Territory Department of Health NT
New South Wales Food Authority NSW
VineHealth Australia SA
Dairy Authority of South Australia SA
South Australian Department of Health SA

IRC Skills Forecast and Proposed Schedule of Work 2018–2021 34
CATEGORIES – PEAK INDUSTRY ORGANISATIONS GEOGRAPHICAL
REPRESENTATION
Queensland Department of Health QLD
Safe Food Production Queensland QLD
Tasmanian Department of Health and Human Service TAS
Dairy Food Safety Victoria VIC
PrimeSafe VIC
Victorian Department of Health and Human Services VIC
Western Australian Department of Health WA
Office of the Gene Technology Regulator NATIONAL
Industry and Occupational Regulations and Standards
Industry Regulations and Standards
The Australian food, beverage and pharmaceutical industry operates under a high level of regulation.
Food Standards Australia New Zealand
All food and beverage manufacturing operations are subject to national standards and safety
assurance systems enforced by Food Standards Australia New Zealand (FSANZ). The Food
Standards Code (The Code) represents the uniform law governing Australian food and beverage
production.
The Code describes appropriate labelling requirements, provides specific definitions of products,
details the composition of products and permitted ingredients, and outlines approved processing
methods.
All genetically modified (GM) foods intended for sale in Australia and New Zealand must also
undergo a safety assessment by FSANZ. FSANZ will not approve a GM food unless it is deemed
safe to eat.
Likewise, businesses manufacturing functional foods and drink must comply with all requirements
under The Code that are relevant to content formulation and nutrition, health and related claims
made on labels or in advertisements.
The industry is likely to be affected by further regulation changes related to country of origin labelling
laws due to hepatitis outbreaks in February 2015. Under the proposed changes, manufacturers will
need to explicitly state where ingredients have come from.
Food safety practices are also enforced by local councils and environmental health offices. These
systems are applicable to local producers.
Producer’s licence
A producer of liquor who wants to sell their product is required to hold a producer’s licence or
equivalent licence under the respective state/territory liquor licensing legislation.

IRC Skills Forecast and Proposed Schedule of Work 2018–2021 35
Wine industry regulations
The wine industry has stand-alone regulations in relation to geographical terms, labels and exports
under the Australian Grape and Wine Authority Act 2013 and Australian Grape and Wine Authority
Regulations 1981.
Industry/customer standards
The food and beverage manufacturing sector is also subject to many customer food standard
requirements, including the Woolworths Quality Assurance (WQA) Standard, and international food
safety standards, including the BRC Global Standard for Food Safety and the IFS International Food
Safety Standard.
Australian Consumer Law
All nutrition content and health claims of functional food and drink products must be factually correct
and substantiated through scientific research papers or clinical trials to avoid misleading consumers
and breaching Australian Consumer Law.
Australian Packaging Covenant
Businesses signatory to the Australian Packaging Covenant, an agreement between government,
industry and community groups, are obliged to find and fund solutions to address packaging
sustainability issues.
Sugar industry regulations
In the past, the Queensland Government played a central role in forming industry policy and
regulations in the sugar industry in relation to controlling price, sugarcane plantation areas,
compulsory sale of all sugar to Queensland Sugar Limited (QSL) and mills’ licence permits. In recent
years, this sector has become more open and transparent. Early in 2014, QSL was removed as the
only option for sugar milling companies to market their sugar. As a result, most major sugar
companies decided to break ties with QSL from 2017, creating their own marketing and export
channels. In response to cane grower concerns regarding changes to sugar marketing arrangements
in Australia, a federal government-established taskforce released a report in 2015 recommending
the creation and implementation of a mandatory code of conduct for the Australian sugar industry.
Subsequently, the Sugar Industry (Real Choice in Marketing) Amendment Act 2015 was passed in
the Queensland Parliament, providing Queensland cane growers with the right to choose who sells
and prices Grower Economic Interest (GEI) sugar, and permitting arbitration if required.28
Excise compliance
The alcoholic beverage sector is subject to excise regulations that require producers to measure and
sample the alcohol content of the product they produce to calculate the excise that is payable. A
licence from the Australian Taxation Office (ATO) is required to distil alcoholic spirits in Australia.
This licence imposes several obligations to ensure spirit products are kept secure, production is
accounted, and excise duty is paid when due. The ATO requires significant and adequate records
for all excisable products to show these obligations have been met.
Export licence
Wine producers and exporters have to obtain an export licence from the Australian Grape and Wine
Authority (AGWA). The regulation of wine exports is primarily to ensure the quality of Australian
products marketed overseas. AGWA also oversees labelling requirements for wine producers to
ensure labels include the variety of grapes used and regional zones of production.
28 QSL, 2016, ‘Developments in the Queensland export sugar industry’, <http://www.qsl.com.au/developments-queensland-
export-sugar-industry/fast-facts>.

IRC Skills Forecast and Proposed Schedule of Work 2018–2021 36
Advertising and packaging regulations
Alcohol beverage advertising and packaging also needs to be consistent with other applicable laws
and codes, for example:
• federal competition and consumer legislation
• state/territory fair trading legislation
• Alcohol Beverages Advertising Code
• Australian Association of National Advertisers (AANA) Code of Ethics
• Commercial Television Industry Code of Practice
• Commercial Radio Code of Practice
• Outdoor Media Association Code of Ethics.
Environmental protection measures
Food and beverage manufacturers must adhere to national and state environment protection
measures, as do all businesses; however, there are particular challenges in relation to the discharge
of waste into waterways and chemical emissions in the air caused by fermentation reactions in
production.
Pharmaceuticals regulations
Regulation of pharmaceuticals in Australia is overseen by the federal government in relation to the
quality, safety, listing and pricing, patent protection, clinical trials, and efficacy of therapeutic goods
supplied in Australia through the following:
• Therapeutic Goods Administration (TGA)
• Australian Register of Therapeutic Goods (ARTG)
• Advisory Committee on Prescription Medicines
• Good Manufacturing Practice (GMP)
• Advisory Committee on the Safety of Medicines
• Pharmaceutical Benefits Scheme (PBS)
• Pharmaceutical Benefits Advisory Committee (PBAC)
• IP Australia
• Medicine Australia
• Pharmaceutical Inspection Cooperation Scheme (PICS)
The advertising of therapeutic goods, including complementary medicines, is subject to the
advertising requirements of the Therapeutic Goods Act 1989, which adopts the Therapeutic Goods
Advertising Code (TGAC) and the supporting regulations, the Competition and Consumer Act 2010
and other relevant laws.
The state governments play an important role in the control of pharmaceutical product distribution
through their scheduling systems. The industry is also subject to self-regulation by Medicine Australia
through an internationally recognised code of conduct.
Companies who export or have multinational operations are also subject to regulations of various
countries and unions (such as the FDA in the USA and EMA in the European Union), along with
other sovereign agencies, depending on location of exports or operations.

IRC Skills Forecast and Proposed Schedule of Work 2018–2021 37
Complementary medicines regulations
Complementary medicines are regulated under the Therapeutic Goods Act 1989. In addition, the
Australian Regulatory Guidelines for Complementary Medicines (ARGCM) provides detail on the
regulation of complementary medicines and assists sponsors to meet their legislative obligations.
Business will also need to consider whether their product needs to be listed or registered with the
Therapeutic Goods Administration (TGA).
The TGA inspects manufacturers on an ongoing basis for compliance with good manufacturing
practice and undertakes monitoring of safety, quality and efficacy of listed, registered and included
therapeutic goods once they are on the market.
Therapeutic goods available on, and sold through, international websites are not regulated by the
TGA.
Alcoholic product retail regulations
The retail sale of alcohol products is heavily regulated, requiring retailers and hospitality venues to
obtain licences to sell alcohol within the hours stipulated and to develop and implement management
plans to identify and control associated risks.
Regulated occupations in the industry
Regulated occupations have legal (or industry) requirements or restrictions to perform the work.
Regulated occupations require a licence to practice from, or registration by, a professional
association or occupational licensing authority.
There are some occupations specific to this industry sector that require licensing and/or registration
before employment. The industry also employs a wide range of trade-licensed occupations, including
electricians, plumbers and forklift operators.
Challenges and Opportunities in the Sector
The Australian food, beverage and pharmaceutical industry sector operates in a dynamic
environment shaped by a range of policy frameworks (including international trade policies and
biofuel policies), environmental challenges, and market factors such as food production, trade and
food prices. The challenges and opportunities for growth that relate to these factors are discussed
below.
GOVERNMENT POLICIES
Food manufacturing, along with the agriculture sector, is at the forefront of government policy agenda
in Australia, prioritising it as a growth sector. Opportunities in the sector are provided by the
increasing significance of global food security and higher food demand in expanding markets, such
as those in the Asia-Pacific region. The Australian Government facilitates the sector’s growth through
a range of initiatives including the following:
• The Food and Agribusiness Industry Growth Centre – Food Innovation Australia Limited
(FIAL)
• Agricultural Competitiveness White Paper
• MTP Connect.

IRC Skills Forecast and Proposed Schedule of Work 2018–2021 38
Further global trade liberalisation through new Free Trade Agreements will enable increased ‘tariff-
free’ access to a diverse range of overseas markets.
In addition, state governments have a focus on the agriculture and food sectors as critical
contributors to local growth and export, leading to policies for state-based industry strategies and
action plans.
The challenge for individual companies is to unlock commercial benefits from these government
programs and agreements by becoming export ready, culturally literate and market savvy.
The food manufacturing sector can contribute alongside the forestry sector to the huge opportunity
that Australia has to use renewable fuels in its energy sector. The sectors will benefit from clear
government policies that support:
• hybrid systems based on production residues to deliver useful heat or electricity or gas for
transportation and industrial heat
• subsidies to promote growth.
There is a need for a coherent energy policy as price rises for gas and electricity are undermining
the competitiveness of the food and grocery manufacturing sector. The Australian Food and Grocery
Council (AFGC) highlighted that ‘… Australian producers had little or no capacity to pass through
higher utility costs’.29 AFGC’s then CEO, Gary Dawson, further stated, ‘Food and grocery processing
is the lifeblood of many regional economies and higher gas costs have a direct impact on the
profitability and competitiveness of food companies. If a food processing plant shuts down, there is
a direct flow-on effect to farmers supplying that plant when they lose their key customer’.30
Similarly, the risks to the pharmaceutical manufacturing industry caused by unreliable energy
sources that may result in loss of continuity of production can undermine the competitiveness of
manufacturers in the global marketplace. There is a need for sustainable energy sources that reduce
these risks.
For the pharmaceutical sector, there is ongoing work on changes to the regulation of therapeutic
goods. The Therapeutic Goods Amendment (2016 Measures No. 1) Bill 2016, was passed in 2017
providing improvements in registration approval processes and listing times. This means that
Australian patients can now get faster and earlier access to lifesaving, innovative medicines.
The TGA is currently undertaking reforms to the regulatory framework for complementary medicines.
The reforms aim to improve the regulatory controls for complementary medicines manufactured,
supplied and/or exported from Australia to increase consumer protection and stimulate business
innovation.31
The federal government legalised the use of medicinal cannabis through the Narcotic Drugs
Amendment Bill 2016 and states and territories regulate its cultivation, with Victoria having already
harvested its first cannabis crop for medicinal use by people with epilepsy. These regulatory set-ups
offer new opportunities for agriculture and the manufacture of medicinal cannabis in Australia.
CLIMATE IMPACTS ON AGRICULTURAL CROP AND FOOD SUPPLY
29 Australian Food & Grocery Council, 2014, ‘Gas market reform and increased supply urgently needed to reduce damaging
impacts of higher gas prices’, viewed April 2017, <http://www.afgc.org.au/2014/07/gas-market-reform-and-increased-
supply-urgently-needed-to-reduce-damaging-impacts-of-higher-gas-prices/>. 30 Ibid 31 Therapeutic Goods Administration, 2017, ‘Reforms to the regulatory framework for complementary medicines:
assessment pathways’, viewed April 2017, <http://www.tga.gov.au/consultation/consultation-reforms-regulatory-framework-
complementary-medicines-assessment-pathways>.

IRC Skills Forecast and Proposed Schedule of Work 2018–2021 39
The future of Australian food production, for many food categories, is reliant on the agricultural crop
health and productivity where arable land and water resources become increasingly difficult
constraints to crop production, and where the frequency and severity of climate variations may
increase due to the effects of climate change.
There are opportunities for many food processing sectors to increase collaboration with breeders,
horticultural and animal farms, and with research teams. This is to support decisions and develop
more resilient crop varieties and large-scale farming systems for increased productivity, efficiency
and optimisation of available resource utilisation.
MARKET AND TRADE
By 2050, the world’s population is expected to reach 9.1 billion, 34 per cent higher than today. Global
demand for food, feed and fibre is expected to grow by 70 per cent.32
Australia is well located to take advantage of the opportunities provided by higher food consumption
in the Asia-Pacific region in the future. However, there will be a need for a change to food production
to fully capture these opportunities. At the industry level, this will require greater adaptation of our
products to more diversified markets, and targeted marketing of different product qualities to market
segments where there is the greatest potential for value-adding.
The global food trends include:33
• demand for transparency in food labelling and clear definitions for ‘natural’ and ‘nutritious’
food
• increasing demand for new flavours, new fresh foods and nutritionally-enhanced
‘superfoods’
• growing incomes in developing nations, where well-off individuals are prepared to pay a
premium for quality food and ingredients created in clean environments
• a growing focus on healthier food options within Australia’s and Asia’s middle-classes,
particularly on products that have reduced sugar, salt and fat, or are gluten-free
• increasingly health-conscious consumers interested in functional foods and complementary
medicines as a way of managing health concerns such as weight and high cholesterol
• a growing market for fermented foods and non-alcoholic drinks
• growing interest in alternative ingredients such as macro-algae (seaweed), micro-algae
(spirulina and chlorella) and insects as a form of protein
• growing interest in omega oils and mineral sources available in functional foods and
complementary medicines
• growing importance of provenance and transparency for the Millennial generation (15–35
years) who are tech-savvy, experience-driven and less brand loyal than older consumers
• rapid growth in ready-to-eat meals because of non-traditional work patterns, changing family
structures and declining importance of formal meal times
• repositioning and value-adding of traditional frozen foods (seafood and vegetables) to
emphasise their superior nutritional content
32 FAO, 2009, ‘How to Feed the World in 2050’, viewed April 2017,
<http://www.fao.org/fileadmin/templates/wsfs/docs/expert_paper/How_to_Feed_the_World_in_2050.pdf>. 33 Agrifood Skills Australia, 2015, Environmental Scan 2015.

IRC Skills Forecast and Proposed Schedule of Work 2018–2021 40
• greater importance of minimising, reusing and recycling production waste
• a growing focus on preventing overconsumption – in food, alcohol and packaging.
In addition, growing demand from Asian consumers continues to generate substantial sales for
Australian vitamins and dietary supplements. The sales are also supported by the strong brand
equity of the leading Australian players. Likewise, the market for intrinsically healthy foods and
functional foods is experiencing remarkable growth and consumer interest.
The medicinal cannabis market, supported by the new regulations, offers new opportunities in
Australia. Medicinal cannabis is already a rapidly growing industry in Israel, the USA and Canada,
and many global companies are now positioning themselves for entry in Australia. Thirty-five
Australian companies have now been granted a licence to cultivate, produce or manufacture
medicinal cannabis.34
Key points on the industry’s international trade
Australia is a net exporter of processed food and beverages. Exports of processed food and
beverages, excluding meat and seafood sectors, increased by 7.8 per cent to $25.9 billion in 2015–
2016, with vegetables, fruits, nuts and beverages recording the highest growth. Imports increased
by 13.1 per cent to $13.6 billion.35 Imported products with the highest aggregate value at a national
level were flour mill and cereal food products. Australian wine exports grew at the strongest rate in
more than a decade in 2015, partly due to the depreciation of Australian currency and the subsequent
boost to global competitiveness. The value of Australian wine exports increased by 7.8 per cent,
while the volume increased by 4.9 per cent.36 Despite the strong export growth, the average value
of Australian wine exports per litre increased by only 3 per cent from AU$2.60 to AU$2.67. This is
consistent with the industry commentary that overseas markets remain fiercely competitive and the
Australian dollar depreciation has not been a windfall for local producers as they try to build overseas
sales.37
Conversely, Australia has a high dependence on imported medicinal and pharmaceutical products,
particularly active ingredients. Imports increased by 8.6 per cent to $11.2 billion in 2016. Exports
went up by 41 per cent to 3.4 billion in 2016 after a progressive drop during the previous years.38
The pharmaceutical sector is moving to more competitive production processes, including
automation and robotics as means of defining a competitive advantage in production, and supporting
competition against international companies in both the domestic and export markets.
Many food and beverage manufacturing companies are engaged in exporting products directly from
Australia or through an agent. A few are currently involved in other international relationships, such
as importing goods or services or being involved in an international supply chain or outsourced part
of their process. Many see opportunities and plan to expand overseas in the coming years. The most
significant challenges for the manufacturing sector, including food and beverage, in doing business
overseas includes:39
• high domestic costs in Australia
• adverse exchange rate movements
34 The Office of Drug Control, 16 April 2018, https://www.odc.gov.au/summary-licences-granted >. 35 ABARES, Agricultural commodity statistics 2016. 36 Wine Australia, 2015, Wine Export Approval Report. 37 Winetitles Media, 2016, Australian and New Zealand Wine Industry Directory 2016, 34th annual edn. 38 ABS International Trade in Goods and Services, Australia, Dec 2016 Cat No 5368. 39 Austrade, 2016,’ Industry profile report: manufacturing’, Australia’s International Business Survey, viewed April 2017,
<http://www.austrade.gov.au/ArticleDocuments/5729/AIBS2016_IR_Manufacturing.pdf.aspx>.

IRC Skills Forecast and Proposed Schedule of Work 2018–2021 41
• increased international competition
• risk of financial or economic crisis in key overseas markets
• ‘red tape’ in Australia.
Additional challenges include:
• compliance and auditing costs related to international food safety standards and labelling
requirements
• increased manufacturing competitiveness through production efficiency improvements, for
example lean automation.
RESEARCH, INNOVATION AND APPLIED TECHNOLOGY
Technology is considered one of the greatest drivers of future growth in this sector. Many businesses
in the food, beverage and pharmaceutical sector are adopting cloud technologies. This increases
transparency and improves business models. These businesses are using data and analytics to
improve decision-making related to consumer insight, brand and product management and pricing;
focus on product innovations (including healthier or functional foods); and increased customer
acquisition and alternative sales and distribution channels.
Industry is supporting specific research and innovation organisations seeking to maximise industry
potentials. Two such organisations include:
• The Food Agility Cooperative Research Centre (CRC), with 54 signed partners across food,
technology and research sectors supported by various governments, research providers,
industry networks and regional development centres. The CRC will integrate the agile culture
and processes of the digital economy through a whole-of-value-chain lens for fresh and
processed food.40
• The Australian Packaging Covenant Organisation, with the aim to change the culture of
business to design more sustainable packaging and increase recycling rates. The covenant
is an agreement between government and industry to find and fund solutions to address
packaging sustainability issues.41
In pharmaceuticals and many other sectors, the introduction of automated processes through
robotics is a means of creating a competitive advantage – as productivity and output increase, and
employment costs decrease. This also allows for a more effective application of just-in-time (JIT)
production principles and minimised stock holdings.
By using industrial robots, food processors can improve quality, achieve greater accuracy and
precision, eliminate contamination, increase productivity, improve workplace safety and reduce risk
of injury. Through advanced technology, such as new advanced visual inspection systems, the
food processing industry can now address serious issues such as quality control, improved
efficiency and productivity, worker safety, traceability and operating simplicity.
Breakthroughs continue in the R&D centres of both ingredient suppliers and equipment
manufacturers. For food researchers, the objectives are to support the efficient and sustainable
conversion of agricultural food materials into value-added ingredients and products.
40 Food Agility, 2017, ‘Overview’, viewed April 2017, <http://www.foodagility.com/overview>. 41 Australian Packaging Covenant, 2017, ‘About APC, viewed April 2017,
<http://www.packagingcovenant.org.au/pages/about-apc.html>.

IRC Skills Forecast and Proposed Schedule of Work 2018–2021 42
Emerging food processing technologies include innovative approaches such as:42,43
• megasonic processing in the palm oil, olive, coconut and soybean industries
• gluten-free barley beer (BARLEYmax)
• long-chain omega-3 oil from canola
• ready-to-eat high pressure thermal processed (HPTP) meals
• advances in safe, high-quality stabilised fruits and vegetables
• emerging non-thermal separation technologies
• novel membrane technologies
• next-gen extrusion processing
• component separation using chromatography
• pasteurisation using pulsed electric fields
• sterilisation using cool plasma and high-pressure processing
• homogenisation and fortification using micro-fluidisation.
Emerging pharmaceutical manufacturing technologies include innovative approaches such as:
• biologics
• cell therapies
• assistive technologies
• regenerative medicine
• precision medicine and personalised care
• antimicrobial resistance.
The opportunities for sourcing healthy foods, nutritional components and functional food
development are extensive in Australia. Further research into materials of relevance to Australia,
such as those listed below, will be able to provide scientific evidence of health benefits, confirm
usable food ingredients, and offer further opportunities in a competitive environment:44
• bioactive honey
• whey protein powder
• freeze-dried young barley grass or other fruit/vegetable powders
• fish and shark-liver oil (EPA)
• herbs and spices derived from native plants that have proven health benefits.
42 Food & Beverage Industry News, 2016, ‘CSIRO takes food manufacturing innovation to IFT16’, viewed April 2017,
<https://foodmag.com.au/csiro-takes-food-manufacturing-innovation-to-ift16/>. 43 Department of Industry, Innovation, Science, Research and Tertiary Education, 2011, ‘The potential role of enabling
technologies in the future of the Australian food industry’, viewed April 2017,
<http://www.industry.gov.au/industry/IndustrySectors/nanotechnology/Publications/Documents/WorkshopReport_Food.pdf#
page13>. 44 Australian Trade Commission, 2016, ‘Health and functional foods to Japan’, viewed April 2017,
<http://www.austrade.gov.au/Australian/Export/Export-markets/Countries/Japan/Industries/Food-and-beverage-health-and-
functional-foods>.

IRC Skills Forecast and Proposed Schedule of Work 2018–2021 43
There is also a substantial drive to enhance food and beverage packaging. Developments include
barrier packaging, anti-microbial packaging, active packaging and smart packaging.
The Monash University-based Food Innovation Centre was funded by the Victorian Government in
2016 to provide food and fibre businesses with access to world-class product and packaging design
and development services, sensory evaluation, consumer testing and visualisation. The centre also
provides new insights into Chinese consumer needs, regulatory requirements and better access to
platforms to fast-track export opportunities.45 Likewise, RMIT Food Research and Innovation Centre
received government funding in 2016 to serve as an incubation facility for small to medium-sized
businesses, enabling them to test new product concepts, develop prototypes and turn their ideas
into high value products and services.46
In the pharmaceutical sector, the Centre for Commercialisation of Regenerative Medicine in
Melbourne will focus on developing technology, supporting start-ups and accelerating the
commercialisation of regenerative medicine technologies and cell-based therapies.47
Challenges exist around the adoption/implementation of new technologies by food manufacturing
firms, the commercialisation of food science and technology for food products, and consumer
acceptance of ‘designed’ foods. Consumers indicate a preference for their views to be considered
sufficiently early in the product development process. They also demand to be provided with
enough information to be able to make safe and informed choices. However, there are examples of
technologies, such as high-pressure pasteurisation, that have persevered through some initial
resistance and are starting to have an impact on both the product development and plant operation
sides of the food and beverage industry.
45 Premier of Victoria, 2016, ‘Food innovation centre opens new pathways to Asia’, viewed April 2017,
<http://www.premier.vic.gov.au/food-innovation-centre-opens-new-pathways-to-asia/>. 46 Premier of Victoria, 2016, ‘Innovation hub to grow Victoria’s food and fibre’, viewed April 2017,
<http://www.premier.vic.gov.au/innovation-hub-to-grow-victorias-food-and-fibre/>. 47 Premier of Victoria, 2016, ‘Victorians to benefit from new regenerative medicine’, viewed April 2017,
<http://www.premier.vic.gov.au/victorians-to-benefit-from-new-regenerative-medicine/>.

IRC Skills Forecast and Proposed Schedule of Work 2018–2021 44
A. EMPLOYMENT AND TRAINING
Employment Update
Food and Beverage Manufacturing and Wholesaling
Total and State Employment
According to census data, the Australian food and beverage manufacturing and wholesaling industry
employed 186,666 people in 2016.48,49 This covers all food subsectors, except seafood processing
and meat manufacturing, beverage manufacturing and related wholesaling activities. About 70 per
cent of these people were employed full-time.
Manufacturing activities accounted for about three-quarters (77 per cent) of this industry’s
employment. The industry was concentrated in Victoria and New South Wales, providing 60 per cent
of the industry employment.
Industry employment by subsectors and states and territories, 2016
Changes in Employment, 2006 to 2016
The food and beverage manufacturing and wholesaling industry experienced an overall decline in
employment from 2006 to 2016. This decline was due to a significant employment fall (40 per cent)
in the wholesaling sector, and additional workforce reductions in the fruit and vegetable processing,
sugar and confectionary manufacturing, and grain mill and cereal product manufacturing sectors. A
sub-sector analysis also shows that bakery product manufacturing went through positive
48 All employment data in this report is sourced from the ABS Census datasets via the TableBuilder Pro product. 49 National Census dataset system adjusts counts by a small number to maintain confidentiality of information. As a result,
small inconsistencies can be noticed in this report between total industry employment and the sum of individual values of
the data tables from Attachments.
8%4%
4%
27%
6%9%5%
14%
23%
Dairy Product Manufacturing
Fruit and Vegetable Processing
Oil and Fat Manufacturing
Grain Mill and Cereal Product Manufacturing
Bakery Product Manufacturing
Sugar and Confectionery Manufacturing
Other Food Product Manufacturing
Food Product Manufacturing, nfd
Beverage Manufacturing
Grocery, Liquor and Tobacco Product Wholesaling
186,666

IRC Skills Forecast and Proposed Schedule of Work 2018–2021 45
employment growth (22 per cent) from 2006 to 2016. The employment levels in all other industry
sub-sectors remained relatively stable.
Employment trends, 2006 - 2016
Industry employment by gender, 2006-2016
Gender Composition of the Workforce
This industry has a higher level of male employees than female. In 2016, women represented 41 per
cent of industry’s employees and men 59 per cent. Data also shows that the proportion of male and
female participation changed slightly from 2006 to 2016, indicating a small increase (3 per cent) in
the female workforce.
A sub-sector analysis indicates that bakery product manufacturing had the highest female
participation (54 per cent) of all industry sub-sectors in 2016. The lowest level (32 per cent) was in

IRC Skills Forecast and Proposed Schedule of Work 2018–2021 46
dairy product manufacturing, sugar and confectionary manufacturing, and grain mill and cereal
product manufacturing.
Age Levels of the Workforce
The industry workforce is ageing. The proportion of employees in each age group category over 50
years increased by up to 3 per cent in 2016, when compared with 2006.
Among all industry sub-sectors, bakery product manufacturing employed a high proportion of people
in the age groups 10 to 19 years (18 per cent) and 20 to 29 years (22 per cent) and a lower proportion
in the older age groups.
Tables 1 and 2 show industry employment in data tables and charts by industry subsectors, states
and territories, gender age groups and occupations for the period 2006-2016.
Changes in Occupation of Employment, 2006 to 2016
The most common occupation in the industry is food and drink factory workers. In 2016, people
employed in this occupation represented 11 per cent of total industry employment.
Other top occupations include food and drink factory workers, sales assistants, bakers and
pastrycooks, packers, sales representatives, storepersons and forklift drivers.
In terms of occupational dynamics, the proportion of people working as sales assistants increased
by 2 per cent across industry subsectors including food, beverage and related wholesaling. The
proportion of bakers and pastrycooks in the food manufacturing sector was also considerably higher
in 2016 when compared with 2006. Conversely, the relative number of factory workers, crop farm
workers and packers decreased from 2006 to 2016. All other occupations remained relatively stable
over this period of time.
Industry employment by age level, 2006-2016

IRC Skills Forecast and Proposed Schedule of Work 2018–2021 47

IRC Skills Forecast and Proposed Schedule of Work 2018–2021 48

IRC Skills Forecast and Proposed Schedule of Work 2018–2021 49
Pharmaceutical Manufacturing
Total Employment
According to census data, the Australian pharmaceutical manufacturing and wholesaling industry
employed 30,966 people in 2016.50 This covers human and veterinary pharmaceutical and medicinal
product manufacturing and related wholesaling activities. About 80 per cent of these people were
employed full-time.
Manufacturing activities provided just under half (47 per cent) of this industry’s employment. The
industry was concentrated in New South Wales and Victoria, providing 76 per cent of employment.
Industry employment by subsectors and states and territories, 2016
Changes in Employment, 2006 to 2016
The pharmaceutical manufacturing and wholesaling industry experienced an overall decline in
employment from 2006 to 2016. Analysis shows that all industry sub-sectors experienced positive
employment growth from 2006 to 2011, however suffered a relatively significant decline in 2016.
Employment for human pharmaceutical manufacturing dropped below the 2006 levels by 6 per cent,
and for wholesaling by 9 per cent.
50 All employment data in this report is sourced from the ABS Census datasets via the TableBuilder Pro product.
45%
2%1%
53%
Human Pharmaceutical and Medicinal ProductManufacturing
Veterinary Pharmaceutical and Medicinal ProductManufacturing
Pharmaceutical and Medicinal ProductManufacturing nfd
Pharmaceutical and Toiletry Goods Wholesaling
30,966

IRC Skills Forecast and Proposed Schedule of Work 2018–2021 50
Gender Composition of the Workforce
The pharmaceutical industry has relatively equal participation of male and female employees. In
2016, women represented 56 per cent of all employees, and men 44 per cent. Male and female
participation remained relatively stable from 2006 to 2016.
A sub-sector analysis indicates that pharmaceutical wholesaling had the highest female participation
(61 per cent) of all industry sub-sectors in 2016. The lowest level was in veterinary pharmaceutical
manufacturing (45 per cent), although this increased by 7 per cent when compared to the year 2006.
Age Levels of the Workforce
The industry workforce is ageing. The proportion of employees in each age group category over 50
years increased by up to 2 per cent in 2016, when compared with 2006.
Among the four industry sub-sectors, veterinary pharmaceutical manufacturing employed a lower
proportion of people in the age groups 20 to 29 and 30 to 39 years, and a higher proportion in the
older age groups.
Employment trends, 2006-2016 Industry employment by gender, 2006-2016

IRC Skills Forecast and Proposed Schedule of Work 2018–2021 51
Changes in occupation of employment, 2006 to 2016
The most common occupation in the pharmaceutical industry is technical sales representatives. In
2016, people employed in this occupation represented 11 per cent of total industry employment.
Other top occupations include storepersons, advertising and sales managers, specialist managers,
pharmacists, marketing professionals, logistics and supply chain officers, and machine operators.
Industry employment by age level, 2006-2016

IRC Skills Forecast and Proposed Schedule of Work 2018–2021 52
Employment Outlook
The Department of Employment51 estimates that employment in the food, beverage and
pharmaceutical industry will grow by 5 per cent over five years to 2022 (Table 1).
Table 1: Department of Employment Industry Projections – five years to May 202252
Industry Sector Employment Level Employment Projections
May 2017 May 2022 Growth
('000) ('000) ('000) (%)
Food Product Manufacturing, nfd 22.4 24.0 1.6 7.2
Dairy Product Manufacturing 16.8 17.9 1.1 6.6
Fruit and Vegetable Processing 6.8 7.0 0.2 3.1
Oil and Fat Manufacturing 1.2 1.2 0.0 2.8
Grain Mill and Cereal Product
Manufacturing 7.4 7.6 0.2 2.8
Bakery Product Manufacturing 58.5 59.0 0.5 0.8
Sugar and Confectionery Manufacturing 12.9 13.6 0.7 5.6
Other Food Product Manufacturing 12.6 13.4 0.9 7.0
Beverage Manufacturing 32.5 34.7 2.2 6.7
Pharmaceutical and Medicinal Product
Manufacturing 23.5 26.2 2.7 11.6
Grocery, Liquor and Tobacco Product
Wholesaling 64.7 68.1 3.4 5.3
Pharmaceutical and Toiletry Goods
Wholesaling 18.6 17.9 -0.7 -3.8
Total 277.9 290.6 12.7 5
Training Update
Anticipating future skills needs in the food, beverage and pharmaceutical product industry is crucial
to prepare for and meet the new demands of food sustainability and product markets in Australia.
Leading indicators of the current and future skills needs in the sector include:
51 Department’s projections are based on the forecasts and projections set out in the Mid-Year Economic and Fiscal Outlook 52 Department of Employment, 2016, ‘Industry Employment Projections – Five Years to May 2022’, viewed December 2017,
<http://lmip.gov.au/default.aspx?LMIP/EmploymentProjections>.

IRC Skills Forecast and Proposed Schedule of Work 2018–2021 53
• trends and/or estimates of workforce supply, skill shortages, employment growth or growing
occupations
• future changes in workplace and job design that are driven by innovation at the business
and/or industry level as a result of economic, technological, social and environmental
factors, as well as introduction of new policies and legislations.
This section identifies the priority skills needs in the food, beverage and pharmaceutical product
manufacturing over the next four years (2018–2021) through an analysis of new and estimated future
demands placed upon the industry. The section focuses on the skills needs that can benefit from
improvement or development of national skills standards, as opposed to market adjustment
mechanisms designed to balance the supply and demand for a skilled workforce.
The industry expects that the priority skills projects identified in this section will be undertaken over
2018 and 2019 so that the skills can be developed and available before 2021. Refer to Attachment
A – IRC Training Product Review Plan 2018–2021 for the proposed schedule of priority skills projects
and units of competency to be checked for currency and possibly reviewed as part of the four-year
cycle.
The 2018–2021 outlook for skills needs and priorities in the food, beverage and pharmaceutical
product industry is shaped by a range of development trends and factors as outlined below.
Training Activity
Number of Training Providers
Currently, there are 746 registered training organisations with FDF10 Food Processing Training
Package training components on their scope, servicing the food, beverage and pharmaceutical
product manufacturing industry sector.53
It is expected that these RTOs will upgrade to using the FBP Food, Beverage and Pharmaceuticals
Training Package over the next twelve months.
Number of student enrolments
In 2016, there were 19,423 student enrolments in FDF qualifications and 159,677 student enrolments
in FDF units of competency. Most students were attracted by private training providers and TAFE
organisations in Victoria.54
Student enrolments, 2016
FDF Qualifications FDF Subjects*
53 training.gov.au 54 All training data in this report is sourced from VOCSTATS

IRC Skills Forecast and Proposed Schedule of Work 2018–2021 54
* Units of competency prefixed FDF.
Top 5 most popular qualifications
Enrolments
Least popular qualifications
37%
59%
1% 3%
TAFE
Private training provider
School
University
Community education provider
Enterprise provider
33%
64%
1% 2%
19,423 159,677

IRC Skills Forecast and Proposed Schedule of Work 2018–2021 55
Enrolments
Qualifications with no enrolments
Year Qualification Name
2016 Certificate I in Sugar Milling Industry Operations
Certificate I in Pharmaceutical Manufacturing
Certificate II in Pharmaceutical Manufacturing
Certificate II in Sugar Milling Industry Operations
Certificate III Sugar Milling Industry Operations
Certificate IV in Pharmaceutical Manufacturing
Certificate IV in Flour Milling
Diploma of Pharmaceutical Manufacturing
Qualification enrolments
Total VET enrolments in FDF qualifications
declined by 3 per cent (or 676 enrolments) to
19,423 between 2014 and 2016. This includes
enrolments from all types of providers and
combines government-funded, apprentices,
VET in schools and fee-for-service training
from private and other training providers.
Apprenticeships and traineeships for food
trade and non-trade occupations dropped by
45 per cent to 3,057 commencements in
2014, after a relatively steady period.
Commencements improved slightly between
2014 and 2016.
Government-funded enrolments for FDF
qualifications increased gradually from a low of 8,953 in 2010 to a high of 15,419 in 2015. This
represents a 72 per cent increase in enrolments over 2010–2015. This growth was followed by a
slight fall of 2 per cent (or 340 enrolments) to 15,079 in 2016.
VET in schools activity regarding FDF qualifications delivered to school students expanded by
261 per cent from 2010 to 2016, to a total of 1,319 enrolments.
Trends in enrolments for FDF qualifications, 2010–2016

IRC Skills Forecast and Proposed Schedule of Work 2018–2021 56
State level comparison for total VET enrolments in FDF qualifications, 2015–2016*
* State/territory of training organisation. Uncategorised data for state/territories (reported as 'Not known') is not included.
This table also presents VET activity for the FDF qualifications in data tables by program type (total
VET activity, apprenticeship and traineeship and government-funded training and VET in schools),
training status (enrolments and completions), qualification names and state and territory for the
period 2012–2016.
Subject Enrolments
Total VET enrolments for FDF subjects
increased by 4 per cent (or 5,825
enrolments) from 2014 to 2015 and dropped
slightly in 2016.
Government-funded enrolments expanded by
69 per cent (or 45,200 enrolments) from 2010 to
2013 and continued to rise gradually to a high of
120,337 in 2015. This growth was followed by a
slight decline (3 per cent) reaching 117,009
enrolments in 2016.
VET in schools activity regarding FDF
subjects delivered to school students increased
gradually from a low of 2,808 enrolments in
2010 to 10,443 enrolments in 2016. This represents a 272 per cent increase in enrolments over
2010-2016.
Trends in enrolments for FDF units of competency, 2010–2016

IRC Skills Forecast and Proposed Schedule of Work 2018–2021 57
State level comparison for total VET enrolments in FDF units of competency, 2015–2016*
* State/territory of training organisation. Uncategorised data for state/territories (reported as 'Not known') is not included.
This table also presents VET activity for the FDF units of competency in data tables by program type
(total VET activity, government-funded training and VET in schools), training status (enrolments and
completions) and units of competency name for the period 2012-2016.
Student profile
• Total student cohort enrolled in FDF qualifications was represented by 58 per cent male and
42 per cent female in 2016. The highest proportion of students were in the age groups 15 to
19, 20 to 24 and 30 to 39 years. There was a small representation of Indigenous students
(573). Over half of students lived in major cities and a quarter in inner regional Australia. A
small proportion of students resided overseas.
Student personal characteristics: GENDER AND AGE*

IRC Skills Forecast and Proposed Schedule of Work 2018–2021 58
Student personal characteristics: INDIGENOUS STATUS*
Student personal characteristics: REMOTENESS*
* Uncategorised data (reported as 'Not known') is not included.

IRC Skills Forecast and Proposed Schedule of Work 2018–2021 59
D. SKILLS OUTLOOK
This section identifies the priority skills needs in the food, beverage and pharmaceutical
manufacturing industry over the next four years (2018-2021), as established by the Industry
Reference Committees through an analysis of new and estimated future demands placed upon the
industry.
The section focuses on the skills needs that can benefit from improvement or development of the
national skills standards as opposed to skills shortages (positions difficult to fill). The latter is outside
the scope of this report and are typically addressed through other mechanisms such as industries’
workforce strategic plans and governments’ market adjustment mechanisms, designed to balance
the supply and demand for a skilled workforce.
Industry Priority Skills
The 2018-2021 outlook for skills needs and priorities in the food, beverage and pharmaceutical
manufacturing industry is shaped by a range of development trends and factors, as outlined below.
(Note: these are divided into two sections for each of the IRCs.)
PHARMACEUTICAL MANUFACTURING IRC
Priority Skill 1
Bioprocessing
Technologies
Skill description
The biotechnological sector in the Australian pharmaceutical manufacturing
industry is expanding and attracting significant investment with further growth
expected. This industry involves the manufacture of products from or via
living organisms. Examples of such organisms include bacteria, yeast and
mammalian cells. Primarily, industrial biotechnology deals with the
manufacture of protein-based products. Working with these “large molecules”
involves a more complex production process. This requires a specific set of
skills and knowledge, and involves managing higher risks of product
degradation, process variability, contamination and complex analytical
techniques.
Biotechnology is currently used in applied immunology, pharmaceutical
therapies and diagnostic tests.
The skills and knowledge required to work in this growing field include:
• contamination control
• cleanroom operations
• recombinant DNA technology
• cell culture manufacturing
• aseptic and sterile manufacturing
• purification processing
• manufacturing execution systems
• stainless steel and single use technology manufacturing

IRC Skills Forecast and Proposed Schedule of Work 2018–2021 60
• data analytics, including Process Analytical Technology and Industry
4.0
Relevant occupations
• Manufacturing operators
• Plant operators
• Bioprocess technicians
• Quality assurance and quality control staff
• Research and development staff
• Fill finish/packaging operators
• Project managers
• Stock management and distribution staff
Drivers
• The biotechnological industry is a fast-growing sector within the
pharmaceutical manufacturing industry. There is rapid growth in the
numbers of people employed in this industry and the domestic and
international markets are expanding.
• The availability of skills and talent in biotechnologies is seen by the
industry as a key prerequisite for future competitiveness, investment
and employment. Approximately half of the workforce required for this
sector require skills addressed through the vocational education and
training sector, including plant and machine operators, tradespeople
and technicians.
• Given anticipated expansion, job openings are expected to arise within
the biotech industry in Australia over the next few years. The skills and
knowledge required in the workforce to meet these needs will need to
align with this expansion.
• New entrants to the industry will need to develop new, relevant skills
for working with biotechnologies. Existing employees will require
upskilling and ongoing development of skills and knowledge.
• Stringent quality compliance and regulator demands, including
international standards mean that the manufacture of biotech products
requires a high level of training and awareness of the risks involved
and standards required.
• Other factors driving the need for this review include global standards
of product and process compliance, the expectations of innovation and
operational excellence, and the pace of change in the pharmaceutical
manufacturing sector.

IRC Skills Forecast and Proposed Schedule of Work 2018–2021 61
Training package solutions
• 1 new qualification
• 1 new skill set
• 15 new units of competency
• Revision of 9 existing units of competency
• Assessment of AQF level for the new qualification
Impact
• Higher-skilled new entrants to the industry.
• A specific stream of study for people wishing to enter this field.
• Formalised upskilling program for existing staff.
Risks of not proceeding
Without sufficiently skilled biotech workers in Australia, the industry will need
to:
• source skilled biotech workers from overseas
• rely on internal training programs to upskill and train employees,
placing the responsibility for training for this industry onto the larger
biotech producers
• source workers with tertiary qualifications (engineers, biochemists,
microbiologists, pharmacists) to perform general production tasks.
Priority skill 1
Artisanal
cheesemaking
Skill description
This project addresses the inadequacies identified in the current
qualifications available to a growing market of artisan cheese and other
fermented dairy product makers seeking skills recognition and training for
making cheeses using an increasingly diverse variety of raw products and
methods.
The skills required in this industry that are not currently addressed in the
Certificate III in Food Processing include:
• setting up and maintaining a functioning factory
• life cycle of fungi and bacteria
• fermentation-related biological processes
• creation of own recipes and tastes
• cheese grading
• cleaning options (including decreasing environmental impact)
• waste management
• processing different types of cheese

IRC Skills Forecast and Proposed Schedule of Work 2018–2021 62
• working with different chemical compositions of raw milks from
different species and seasons
• pasteurisation on a small scale (batch, continuous)
• recordkeeping and regulatory compliance
• traceability systems and monitoring
• diagnosing and troubleshooting problems with plant and equipment
• pathogen management
• recall processes
• maintain current knowledge of industry trends and product
development
• affinage environments, tools and processes
• milk quality control and preparation
• microbiological processes for artisan and farmhouse cheesemakers.
Drivers
Artisan cheese is growing in popularity and small entrepreneurial businesses
are flourishing and employing staff. Current qualifications and courses
available in Australia do not address the complex skills required to safely
process raw product and the various types of milks and cheeses that the
current market demands.
Training package solutions
• 1 new qualification
• 19 new units of competency
• Revision of 17 existing units of competency
• Assessment of AQF level for the new qualification
Relevant occupations
• Cheesemakers
• Assistant cheesemakers
• Production managers – cheese
• Production technicians – cheese
• Production assistants – cheese
Impact
• Higher-skilled entrepreneurs setting up cheese manufacturing
businesses.
• Higher-skilled new entrants to the industry.

IRC Skills Forecast and Proposed Schedule of Work 2018–2021 63
• Cheesemakers will no longer need to go to Europe and America to
learn about the more complex aspects of affinage (maturation)
processes and biological processes involved in cheesemaking.
• A specific stream of study for people wishing to enter this field.
• It will create a formalised upskilling program for existing staff.
• Training organisations will be able to package qualifications with
sufficient relevant units specifically for people entering the artisanal
cheesemaking industry without having to provide training and
assessment services on necessary topics.
• Graduates will achieve a qualification with a title that reflects their field
of study.
Risks of not proceeding
• Increase in health risks due to poor knowledge of food safety when
handling and processing different types of raw milk.
• Cheesemakers and their staff will continue to travel outside of
Australia to gain the higher-level skills required for this industry.
• Due to the lack of options available and the cost of going to French or
American cheese training institutions, many cheesemakers and their
staff will remain unqualified.
• The qualification will continue to not reflect – in title and content – the
skills needed for this industry.
• People will continue to be discouraged to enrol in a qualification that
does not meet their needs and does not have a title that reflects their
field of expertise.
Priority skill 2
Brewing and
distilling
Skill description
Those working with beer, cider and a range of other alcoholic beverages need
to be able to:
• produce safe spirit/beer of high quality
• operate, maintain and clean equipment, and all production (cooling,
fermenting and distilling) systems
• produce consistent quality beverages
• create recipes to suit specific demographics
• alter and refine recipes to meet consumer needs
• create tasting notes
• produce a variety of styles
• explain the production process to others
• work autonomously

IRC Skills Forecast and Proposed Schedule of Work 2018–2021 64
• manage a team to achieve suitable production and quality outcomes
• conduct pasteurisation on a small scale (batch, continuous)
• understand and operate keg, bottling and/or canning lines
• keep records and document excise information
• understand fluid transfer requirements
• demonstrate a good understanding of the international and domestic
craft fermented beverage market
• understand, select and use relevant cleaning options (including
managing environmental concerns)
• understand, select and use relevant waste management options
• understand, select and adopt relevant food safety systems
• Understand the compliance and business requirements of a small
operation.
Relevant occupations:
• Brewer/distiller
• Master brewer
• Assistant brewer/distiller
• Packaging and bottling assistant
• Brewery/distillery production manager
• Brewery/distillery production assistant
Drivers
The increase in popularity of craft or artisan beer and distilled spirits has seen
this industry expand.
Small breweries and distilleries have experienced substantial growth in
production and employee numbers.
There were 46 new independent breweries established in 2017 and some
existing craft breweries are partnering with larger producers to access
infrastructure that will enable further growth.
Current training options are limited and are mostly operating outside of the
Australian VET sector. Within the VET sector, the Certificate III in Food
Processing does not sufficiently meet the multi-faceted skill needs of brewers
and distillers and their staff in small to medium-sized breweries and distilleries.
Training package solutions
• 2 new qualifications
• 3 new skill sets
• 10 new units of competency

IRC Skills Forecast and Proposed Schedule of Work 2018–2021 65
• Revision of 20 existing units of competency
• Assessment of AQF level for the new qualifications
Impact
• Higher skilled entrepreneurs setting up brewing and spirit distilling
businesses.
• Higher-skilled new entrants to the industry.
• Brewers and distillers will no longer need to go overseas to learn about
the more complex aspects of beer making, spirit distilling processes.
• This will create a specific stream of study for people wishing to enter
this field.
• It will create a formalised upskilling program for existing staff.
• Training organisations will be able to package qualifications with
sufficient relevant units specifically for people entering the brewing and
spirit distilling industry without having to provide training and
assessment services on necessary topics.
• Graduates will achieve a qualification with a title that reflects their field
of study.
• This will encourage greater access to appropriate education in modern
brewing techniques.
• This project will align the complexity of the brewing skills to an
appropriate qualification and AQF level.
• It will increase the usage of a nationally-recognised qualification.
Risks of not proceeding
• Brewers and distillers will be unable to access education and training in
the rapidly changing technologies used within the industry.
• Brewing and distilling companies will continue to source internationally-
trained staff.
• The industry will need to access international training opportunities in
lieu of suitable local options available.
• The emerging market for Australian facilities to attract international
students will be halted.
• Increase in health risks due to poor knowledge of food safety when
handling and processing beer and spirits.
• Brewers, distillers and their staff will continue to travel outside of
Australia or to purchase international training courses and products to
gain the higher-level skills required for this industry.
• Due to the lack of options available and the cost of accessing
international training institutions, many operators of smaller breweries
and their staff will remain unqualified.

IRC Skills Forecast and Proposed Schedule of Work 2018–2021 66
• The qualification will continue to not reflect – in title and content – the
skills needed for this industry.
• People will continue to be discouraged to enrol in a qualification that
does not meet their needs and does not have a title that reflects their
field of expertise.
Priority skill 3
Food and
beverage
fermentation
This project will identify and fill the gaps in current food processing qualifications
to address food safety and manufacturing processes involved in the growing
field of fermented food and beverage production.
Fermentation preserves food, enhances flavours and has health benefits –
humans have been doing it for centuries. Fermentation is a transformative
process in which microorganisms (bacteria, yeast and fungi) turn sugars into
food acids, carbon dioxide and/or alcohol. Fermentation can occur naturally or
by application of a commercially-produced starter culture.
The sector encompasses companies that manufacture bread, beer, cider, wine,
ginger beer, mead, cheese, yoghurt, sauerkraut, vinegar and pickles. There are
many more products increasing in popularity that may be less familiar:
• kefir is a cultured fermented beverage, made from milk, water or
coconut milk
• kimchi is a staple Korean side dish, made from salted, spiced and
fermented vegetables
• kombucha is an effervescent drink, fermented from sweetened black or
green tea.
Skills and knowledge required for this industry include:
• understanding the nature and control of fermentation processes
• operation of technologically advanced fermenting and related tools and
equipment
• understanding and application of good manufacturing practices,
including equipment cleaning and sanitising
• understanding and application of micro-organisms involved in
fermenting food
• cultivation and isolation of microorganisms relating to the fermentation
process
• application of knowledge of yeast, bacterial and fungal fermentation
processes
• application of food safety principles to the fermentation process
• conducting and interpreting tests of samples of fermented food and
beverages
• working with living cultures and organisms.
Relevant occupations:

IRC Skills Forecast and Proposed Schedule of Work 2018–2021 67
• Food processing technicians
• Manufacturing technicians
• Food processing operators
• Biotechnologists
Drivers
Due to low-cost entry to market and growing demand for functional fermented
food and non-alcoholic fermented beverage products, small home-based and
medium-sized businesses have started to appear in greater numbers.
Occupational standards are required to support the growth in industry and
ensure consistent and safe products are produced.
The growing market for fermented foods and drinks is also being driven by a
growing focus on healthier food options within Australia’s and Asia’s middle-
classes, particularly on products that have beneficial effects on gut health and
the growing awareness of fermented food and non-alcoholic fermented
beverages in addressing digestive disorders.
Training package solutions
• 1 new qualification
• 3 skill sets
• 9 new units of competency
• Revision of 4 existing units of competency
• Assessment of AQF level for the new qualification
Impact
• Higher skilled entrepreneurs setting up food fermenting businesses.
• Higher-skilled new entrants to the industry.
• This will create a specific stream of study for people wishing to enter
this field.
• It will create a formalised upskilling program for existing staff.
• Training organisations will be able to package qualifications with
sufficient relevant units specifically for people wishing to enter the food
fermentation industry without having to provide training and assessment
services on necessary topics.
• Graduates will achieve a qualification with a title that reflects their field
of study.
• This will encourage greater access to appropriate education in modern
food fermentation techniques.
• This project will align the complexity of food fermentation skills to an
appropriate qualification and AQF level.
• It will increase the usage of a nationally-recognised qualification.

IRC Skills Forecast and Proposed Schedule of Work 2018–2021 68
Risks of not proceeding
• Food fermentation technicians and other people involved in fermenting
foods will be unable to access education and training in the rapidly
changing technologies used within the industry.
• Food fermentation companies will continue to source internationally-
trained staff.
• The industry will need to access international training opportunities in
lieu of suitable local options available.
• Increase in health risks due to poor knowledge of food safety when
handling and processing different types of fermented food and non-
alcoholic fermented beverages.
• Due to the lack of options available and the cost of accessing
international training institutions, many food fermentation technicians
will remain unqualified.
• The qualification will continue to not reflect – in title and content – the
skills needed for this industry.
• People will continue to be discouraged to enrol in a qualification that
does not meet their needs and does not have a title that reflects their
field of expertise.

IRC Skills Forecast and Proposed Schedule of Work 2018–2021 69
Industry Priority for Generic Skills
Industry Reference Committees were consulted on ranking the generic skills priorities for the industry
from a list provided by the Department of Education and Training. Error! Reference source not f
ound. below table outlines the advice received.
Table X: Industry generic skills ranking by priority
Rank Generic Skill
1 Managerial / Leadership skills
Ability to effectively communicate with all functional areas of the organisation.
Ability to represent and develop tasks and work processes for desired outcomes.
Ability to oversee processes, guide initiatives and steer employees toward
achievement of goals.
2 Learning agility / Information literacy / Intellectual autonomy and self-
management skills
Ability to identify a need for information.
Ability to identify, locate, evaluate, and effectively use and cite the information.
Ability to discriminate and filter information for importance.
Ability to do more with less.
Ability to quickly develop a working knowledge of new systems to fulfil the
expectations of a job.
Ability to work without direct leadership and independently.
3 Technology use and application skills
Ability to create and/or use of technical means understand their interrelation with life,
society, and the environment.
Ability to understand and apply scientific or industrial processes, inventions, methods
etc.
Ability to deal with increasing mechanisation and automation and computerisation.
Ability to do work from mobile devices rather than from paper.
4 Science, Technology, Engineering and Maths (STEM) skills
Sciences, mathematics and scientific literacy.
5 Language, Literacy and Numeracy (LLN) skills
Foundation skills of literacy and numeracy.
6 Entrepreneurial skills

IRC Skills Forecast and Proposed Schedule of Work 2018–2021 70
Rank Generic Skill
Ability to take any idea, whether it be a product and service, and turn that concept into
reality and not only bring it to market but make it a viable product and/or service.
Ability to focus on the very next step to get closer to the ultimate goal.
Ability to weather the ups and downs of any business.
Ability to sell ideas, products or services to customers, investors or employees etc.
7 Data analysis skills
Ability to translate vast amounts of data into abstract concepts and understand data-
based reasoning.
Ability to use data effectively to improve programs, processes and business
outcomes.
Ability to work with large amounts of data: facts, figures, number crunching, analysing
results.
8 Communication / Collaboration including virtual collaboration/ Social
intelligence skills
Ability to understand and apply the principles of creating more value for customers
with fewer resources (lean manufacturing) and collaborative skills.
Ability to critically assess and develop content that uses new media forms and
leverage these media for persuasive communications.
Ability to connect with others deeply and directly, to sense and stimulate reactions and
desired interactions.
9 Design mindset / Thinking critically / System thinking / Solving problems skills
Ability to adapt products to rapidly shifting consumer tastes and trends.
Ability to determine the deeper meaning or significance of what is being expressed via
technology.
Ability to understand how things that are regarded as systems influence one another
within a complete entity, or larger system.
Ability to think holistically.
10 Environmental and Sustainability skills
Ability to focus on problem-solving and the development of applied solutions to
environmental issues and resource pressures at local, national and international
levels.
11 Customer service / Marketing skills
Ability to interact with another human being, whether helping them find, choose or buy
something.

IRC Skills Forecast and Proposed Schedule of Work 2018–2021 71
Rank Generic Skill
Ability to supply customers' wants and needs both via face to face interactions or
digital technology.
Ability to manage online sales and marketing.
Ability to understand and manage digital products.
12 Financial skills
Ability to understand and apply core financial literacy concepts and metrics,
streamlining processes such as budgeting, forecasting, and reporting, and stepping up
compliance.
Ability to manage costs and resources, and drive efficiency.
13 Other generic skills:
Workplace Health and Safety

IRC Skills Forecast and Proposed Schedule of Work 2018–2021 72
B. IRC SIGN-OFF
This IRC Skills Forecast and Proposed Schedule of Work was agreed as the result of a
properly constituted IRC decision.

IRC Skills Forecast and Proposed Schedule of Work 2018–2021 73
ATTACHMENT A
IRC Training Product Review Plan 2018–2021 for the Food, Beverage and Pharmaceuticals
Industry Sector
Relevant training package: FBP Food Processing
Contact details: Skills Impact Ltd, 559A Queensberry Street, North Melbourne, VIC, 3051
Date submitted to Department of Education and Training: 28 April 2018
2018–2019
Bioprocessing technologies This sector of the pharmaceutical manufacturing industry involves the manufacture of chemically processed
drugs, and medicines that are manufactured in living organisms, such as bacteria, yeast and mammalian
cells. This project will develop training package components to address the skills and knowledge needed to
work with bioprocessing technologies.
Artisanal cheesemaking This project addresses inadequacies identified in the current qualifications for a growing market of artisan
cheesemakers seeking skills recognition and training for an increasingly diverse variety of raw products and
methods. The skills required include managing the affinage process, working with complex molecular and
biological processes, small-scale pasteurisation, developing new recipes, identifying and troubleshooting
mistakes and problems, and setting up a functioning cheese factory.
Brewing and distilling This project will identify and fill the gaps in current food processing qualifications to address the complex
skills required for brewing beer and distilling sprits using a range of methods and products.
Food and beverage fermentation This project will identify and fill the gaps in current food processing qualifications to address food safety and
processes involved in the growing field of fermented food and non-alcoholic fermented beverage production.
2019–2020
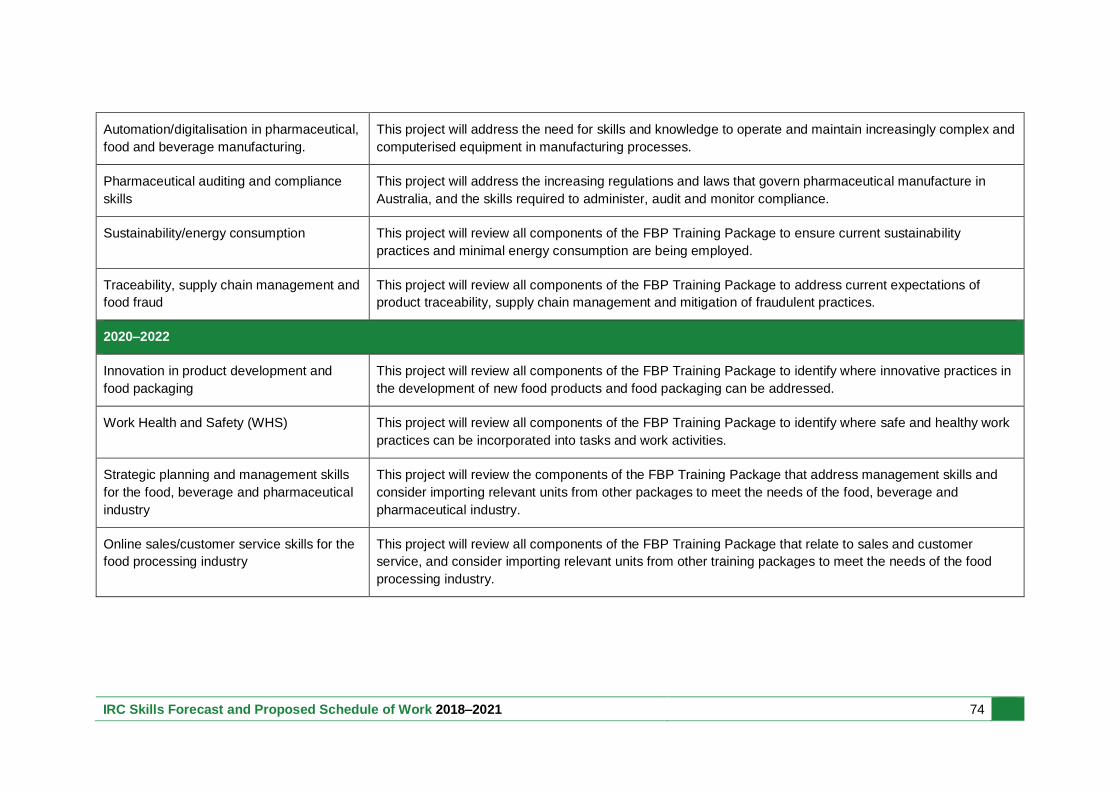
IRC Skills Forecast and Proposed Schedule of Work 2018–2021 74
Automation/digitalisation in pharmaceutical,
food and beverage manufacturing.
This project will address the need for skills and knowledge to operate and maintain increasingly complex and
computerised equipment in manufacturing processes.
Pharmaceutical auditing and compliance
skills
This project will address the increasing regulations and laws that govern pharmaceutical manufacture in
Australia, and the skills required to administer, audit and monitor compliance.
Sustainability/energy consumption This project will review all components of the FBP Training Package to ensure current sustainability
practices and minimal energy consumption are being employed.
Traceability, supply chain management and
food fraud
This project will review all components of the FBP Training Package to address current expectations of
product traceability, supply chain management and mitigation of fraudulent practices.
2020–2022
Innovation in product development and
food packaging
This project will review all components of the FBP Training Package to identify where innovative practices in
the development of new food products and food packaging can be addressed.
Work Health and Safety (WHS) This project will review all components of the FBP Training Package to identify where safe and healthy work
practices can be incorporated into tasks and work activities.
Strategic planning and management skills
for the food, beverage and pharmaceutical
industry
This project will review the components of the FBP Training Package that address management skills and
consider importing relevant units from other packages to meet the needs of the food, beverage and
pharmaceutical industry.
Online sales/customer service skills for the
food processing industry
This project will review all components of the FBP Training Package that relate to sales and customer
service, and consider importing relevant units from other training packages to meet the needs of the food
processing industry.

IRC Skills Forecast and Proposed Schedule of Work 2018–2021 75
ATTACHMENT B
Active IRC Projects for the Food, Beverage and Pharmaceuticals Industry Sector
Relevant training package: FBP Food Processing
Contact details: Skills Impact Ltd, 559A Queensberry Street, North Melbourne, VIC, 3051
Date submitted to Department of Education and Training: 27 April 2018
FOOD AND BEVERAGE IRC
YEAR PRIORITY SKILLS QUALIFICATION CODE & NAME
2017 Wine Operations Certificate II in Wine Industry Operations
Certificate III in Wine Industry Operations
2017 Food Science and Technology Certificate IV in Food Manufacturing
Diploma of Food Science and Technology
Diploma of Food Safety Auditing
2017 Food Processing Cross-Sector Various units in the fields of: bottling and packaging, people planning and logistics,
work health and safety, and technical fields.
2017 Pharmaceutical Manufacturing Standards Certificate II in Pharmaceutical Manufacturing
Certificate III in Pharmaceutical Manufacturing
Certificate IV in Pharmaceutical Manufacturing

IRC Skills Forecast and Proposed Schedule of Work 2018–2021 76
ATTACHMENT C
2018–2019 Project Details
Project title: BIOPROCESSING TECHNOLOGIES
Description The biotechnological sector in the Australian pharmaceutical
manufacturing industry is expanding and attracting significant
investment, with further growth expected. This industry involves the
manufacture of products from or via living organisms. Examples of such
organisms include bacteria, yeast and mammalian cells. Primarily,
industrial biotechnology deals with the manufacture of protein-based
products. Working with these “large molecules” involves a more
complex production process. This requires a specific set of skills and
knowledge. It involves complex analytical techniques and managing
higher risks of product degradation, process variability and
contamination.
Biotechnology is currently used in applied immunology, pharmaceutical
therapies and diagnostic tests.
The skills and knowledge required to work in this growing field include:
• contamination control
• cleanroom operations
• recombinant DNA technology
• cell culture manufacturing
• aseptic and sterile manufacturing
• purification processing
• manufacturing execution systems
• stainless steel and single use technology manufacturing
• data analytics, including process analytical technology and
Industry 4.0.
Rationale • With annual growth of around 7 per cent and an estimated
international market value of AUD$920 billion by 2025, the
biotechnological industry is a fast-growing sector within the
pharmaceutical manufacturing industry. There is rapid growth in
the numbers of people employed in this industry through the
expansion of both domestic and international markets.
• The availability of skills and talent in biotechnologies is seen by
the industry as a key prerequisite for future competitiveness,
investment and employment. Approximately half the workforce
for this sector require skills addressed through the vocational
education and training sector, including plant and machine
operators, tradespeople and technicians.

IRC Skills Forecast and Proposed Schedule of Work 2018–2021 77
• Given anticipated expansion, job openings are expected to arise
within the biotech industry in Australia over the next few years.
The skills and knowledge required in the workforce to meet these
needs will need to align with this expansion.
• New entrants to the industry will need to develop new, relevant
skills for working with biotechnologies. Existing employees will
require upskilling and ongoing development of skills and
knowledge.
• Stringent quality compliance and regulatory demands, including
international standards, mean that the manufacture of biotech
products requires a high level of training and awareness of the
risks involved and standards required.
• Other factors driving the need for this review include global
standards of product and process compliance, the expectations
of innovation and operational excellence, and the pace of change
in the pharmaceutical manufacturing sector.
Ministers’ priorities
addressed:
• Through the development of these training package
components, more information about this industry’s expectations
of training delivery will be available to training providers to
improve their delivery, and to consumers to enable better-
informed choices.
• The training system will better support individuals to move more
easily between the range of pharmaceutical processing
industries, especially those using bioprocessing technologies.
• Improved efficiency of the training system will be gained through
the development of units and qualifications that can be owned
and used by multiple industry sectors, such as other
pharmaceutical manufacturing industries.
• As this project is expected to consider the development of one or
more new skill sets, it will foster greater recognition of skill sets
within this industry.
Consultation plan The Pharmaceutical Industry Reference Committee will support the
progress of this review by sourcing key stakeholders involved in the
biotechnical manufacturing industry to consult with Skills Impact when
developing training package components, structuring the qualification
and determining the skills required for the industry on a national level.
The key stakeholder for this project is CSL Behring, which develops and
manufactures plasma protein biotherapies.
The key stakeholder for this project is CSL Behring, which develops and
manufactures plasma protein biotherapies. Additional stakeholders to
consult during this project will include Seqirus (bioCSL) and
BioMelbourne Network.
Proposed timelines:
• June – project planning and location booking

IRC Skills Forecast and Proposed Schedule of Work 2018–2021 78
• July – subject matter expert meetings, research and functional
analysis
• August – development of draft one documents
• September – public consultation – via website and workshops
• October – development of draft two documents
• November – TBA – second public consultation via website;
targeted subject matter expert meetings
• December – final drafting of documents
• February – public validation via website
• February – finalisation of documents including case for
endorsement
• April – proofreading of documents
• May – edit and equity review
• May – IRC case for endorsement approval to submit for quality
assurance review
• May – quality assurance evaluation
• June – state/territory training authority review
• June – Industry Reference Committee final sign off
• June – submission to Australian Industries and Skills
Committee
Scope of project This project is expected to take approximately 12 months to complete,
and will comprise:
• 1 new qualification
• 1 new skill set
• 15 new units of competency
• revision of 9 existing units of competency
• assessment of AQF level for the new qualification.
Qualification to be developed:
• Diploma in Bioprocessing Technologies.
Skill set to be developed:
• Bioprocessing Skill Set.
Units of competency to be developed:
• Manage the preparation of a cleanroom environment
• Manage cleanroom operations
• Work within complex manufacturing processes in the biological
pharmaceutical field

IRC Skills Forecast and Proposed Schedule of Work 2018–2021 79
• Identify and work with cell culture
• Prepare and maintain aseptic and sterile biological
manufacturing processes and environments
• Manage upstream therapeutic cell manufacturing processes,
isolate and cultivate cells, manage cell banking
• Manage cell culture expansion processes, include wave
technology, bioreactors (batch and perfusion based)
• Harvest cells – including centrifugation and depth filtration
• Manage downstream therapeutic cell manufacturing processes
– including chromatography, ultrafiltration, diafiltration, viral
inactivation, viral filtration, precipitation methods
• Separate biomass (microbial cells)
• Disrupt cells to release product
• Process analytical technology and single use technology
• Manufacturing execution systems
• Industry 4.0 future manufacturing
• Lyophilisation of product during fill and finish.
Units of competency to be reviewed:
• FBPPHM4003 Facilitate contamination control
• FBPPHM3005 Operate a concentration process
• FBPPHM3006 Operate an extraction process
• FBPPHM3007 Operate a separation process using
chromatography
• FBPPHM3011 Dispense pharmaceutical raw materials
• FBPPHM3014 Operate a liquid manufacturing process
• FBPPHM3016 Operate a sterilisation process using an
autoclave
• FBPPHM3008 Operate an aseptic fill and seal process
• FBPPHM3009 Operate an aseptic form, fill and seal process.
Project title: ARTISANAL CHEESEMAKING
Description This project addresses inadequacies identified in the current
qualifications for a growing market of artisan cheese and other
fermented dairy product makers seeking skills recognition and training
for an increasingly diverse variety of raw products and methods.
The skills required in this industry that are not currently addressed in
the Certificate III in Food Processing include:

IRC Skills Forecast and Proposed Schedule of Work 2018–2021 80
• setting up and maintaining a functioning factory
• life cycle of fungi and bacteria
• fermentation-related biological processes
• creation of recipes and tastes
• cheese grading
• cleaning options (including decreasing environmental impact)
• waste management
• processing different types of cheese
• working with different chemical compositions of raw milks from
different species and seasons
• pasteurisation on a small scale (batch, continuous)
• recordkeeping and regulatory compliance
• traceability systems and monitoring
• diagnosing and troubleshooting problems with plant and
equipment
• pathogen management
• recall processes
• maintain current knowledge of industry trends and product
development
• affinage environments, tools and processes
• milk quality control and preparation
• microbiological processes for artisan and farmhouse
cheesemakers
Rationale Artisan cheese is growing in popularity, and small entrepreneurial
businesses are flourishing and employing staff. Current qualifications
and courses available do not address the complex skills required to
safely process raw product and the various types of milks and cheeses
that the current market demands.
Ministers’ priorities
addressed:
• Through the development of these training package
components, more information about this industry’s expectations
of training delivery will be available to training providers to
improve their delivery, and to consumers to enable better-
informed choices.
• The training system will better support individuals to move more
easily between the range of cheese and dairy-related processing
industries.
• Improved efficiency of the training system will be gained through
the development of units that can be owned and used by multiple

IRC Skills Forecast and Proposed Schedule of Work 2018–2021 81
industry sectors, such as other artisanal food manufacturing
industries.
• As this project is expected to consider the development of one or
more new skill sets, it will foster greater recognition of skill sets
within this industry.
Consultation plan Building on the relationships established during the research for this
skills forecast report, Skills Impact will consult with key stakeholders in
the execution of this project including, but not limited to:
• Australian Specialist Cheesemakers’ Association
• Bega Cheese (represented on the Food, Beverage and
Pharmaceutical IRC)
• Warrnambool Cheese and Butter Factory
• Tolpuddle Goat Cheese and Farm Foods
• Artisan Cheese Making Academy Australia (TAFE SA)
• Hindmarsh Valley Dairy
• Bruny Island Cheese and Beer Co.
• Grandvewe Cheeses and Distillery
• Shaw River Buffalo Cheese
• National Centre for Dairy Education
• Goulburn Ovens TAFE.
Proposed timelines:
• June – project planning and location booking
• July – subject matter expert meetings, research and functional
analysis
• August – development of draft one documents
• September – public consultation – via website and workshops
• October – development of draft two documents
• November – TBA – second public consultation via website and
targeted subject matter expert meetings
• December – final drafting of documents
• February – public validation via website
• February – finalisation of documents including case for
endorsement
• April – proofreading of documents
• May – edit and equity review
• May – IRC case for endorsement approval to submit for quality
assurance review

IRC Skills Forecast and Proposed Schedule of Work 2018–2021 82
• May – quality assurance evaluation
• June – state/territory training authority review
• June – Industry Reference Committee final sign off
• June – submission to Australian Industries and Skills
Committee
Scope of project This project is expected to take approximately 10 months to complete,
and will comprise:
• 1 new qualification
• 19 new units of competency
• revision of 17 existing units of competency
• assessment of AQF level for the new qualification.
Qualification to be developed:
• Certificate IV in Artisanal Cheesemaking.
Units of competency to be developed:
• Setting up and maintaining a functioning cheese factory
• Life cycle of fungi and bacteria
• Fermentation-related biological processes
• Creation of recipes and tastes
• Cheese grading
• Cleaning options (including decreasing environmental impact)
• Waste management
• Producing different types of cheese
• Working with different chemical compositions of raw milks from
different species and seasons
• Pasteurisation on a small scale (batch, continuous)
• Recordkeeping and regulatory compliance
• Traceability systems and monitoring
• Diagnosing and troubleshooting problems with plant and
equipment
• Pathogen management
• Recall processes
• Maintain current knowledge of industry trends and product
development
• Affinage environments, tools and processes
• Milk quality control and preparation
• Microbiological processes for artisan and farmhouse
cheesemakers
Units of competency to be reviewed:
• FDFCH4001A Carry out sampling and interpret tests for cheese
production
• FBPCHE3001 Conduct cheesemaking operations

IRC Skills Forecast and Proposed Schedule of Work 2018–2021 83
• FBPCHE3002 Carry out processes for a range of artisan
cheeses
• FDFCH4004A Produce acid – heat coagulated cheese
• FBPDPR2001 Operate a butter churning process
• FBPDPR2003 Operate a curd production and cutting process
• FBPDPR2004 Operate a cooling and hardening process
• FBPDPR2005 Operate a cheese pressing and moulding process
• FBPDPR2006 Operate a fermentation process
• FDFFST4021A Carry out sampling and testing of milk at receival
• FDFFST5023A Implement and review the production of milk fat
products
• FDFFST5024A Implement and review the production of
fermented dairy products and dairy desserts
• FDFFST4022A Implement and review the preparation of milk for
processing
• FBPOPR2043 Operate a homogenising process
• FDFCH4002A Produce acid-coagulated soft cheese
• FDFCH4003A Produce a range of rennet-coagulated cheeses
• FBPOPR2014 Participate in sensory analyses.
Project title: BREWING AND DISTILLING ALCOHOLIC BEVERAGES
Description This project will identify and fill the gaps in current food processing
qualifications to address the complex skills required for brewing beer and
distilling spirits using a range of methods and products.
Those working with beer, cider and a range of other alcoholic
beverages need to be able to:
• operate, maintain and clean brewing equipment, including
packaging, heating and cooling systems
• create recipes to suit specific demographics
• alter and refine recipes
• create tasting notes
• produce a variety of styles
• explain the brewing process to others
• work autonomously
• manage a team to achieve suitable production and quality
outcomes

IRC Skills Forecast and Proposed Schedule of Work 2018–2021 84
• pasteurisation on a small scale (batch, continuous)
• understanding and operation of keg, bottling and/or canning lines
• keep records and document excise information
• demonstrate a good understanding of the international and
domestic craft fermented beverage market
• understand, select and use relevant cleaning options (including
managing environmental concerns)
• understand, select and use relevant waste management options
• understand, select and adopt relevant food safety systems.
Those working with the production of gin, whisky, brandy and other
distilled alcoholic beverages need to be able to:
• operate, maintain and clean distilling equipment, including
heating and cooling systems
• create recipes to suit specific demographics
• alter and refine recipes
• create tasting notes
• produce a variety of styles
• explain the distillation process to others
• understanding and operation of barrel maturation and bottling
lines
• work autonomously
• manage a team to achieve suitable production and quality
outcomes
• keep records and document excise information
• demonstrate a good understanding of the international and
domestic spirits market
• understand, select and use relevant cleaning options (including
managing environmental concerns)
• understand, select and use relevant waste management
options
• understand, select and adopt relevant food safety systems.
Rationale The increase in popularity of craft or artisan beer, cider and distilled
spirits has seen this industry expand. Small breweries and distilleries
have experienced substantial growth in production and employee
numbers.
There were 46 new independent breweries established in 2017 and
some existing craft breweries are partnering with larger producers to
access infrastructure that will enable further growth.

IRC Skills Forecast and Proposed Schedule of Work 2018–2021 85
Current training options are limited and are mostly operating outside of
the Australian VET sector. Within the VET sector, the Certificate III in
Food Processing does not sufficiently meet the multifaceted skill needs
of brewers and brewer’s assistants in small to medium-sized breweries.
Ministers’ priorities
addressed:
• Through the development of these training package
components, more information about this industry’s expectations
of training delivery will be available to training providers to
improve their delivery, and to consumers to enable better-
informed choices.
• The training system will better support individuals to move more
easily between the range of brewing and distilling operations.
• Improved efficiency of the training system will be gained through
the development of units that can be owned and used by multiple
industry sectors, such as wine and cider production and other
artisanal food manufacturing industries.
• As this project is expected to consider the development of one or
more new skill sets, it will foster greater recognition of skill sets
within this industry.
Consultation plan Building on the relationships established during the research for this
skills forecast report, Skills Impact will consult with key stakeholders in
the execution of this project, including, but not limited to:
• Lovedale Brewery
• Hope Estate Brewery
• Independent Brewers Association
• Foghorn Brewhouse
• Prancing Pony Brewery
• Coopers Brewery
• CUB (represented on the FBP IRC)
• TAFE SA
• TAFE NSW
• Institute of Brewing and Distilling
• Tasmanian Whisky Academy
• Moo Brew
• Bruny Island Cheese and Beer Co.
• Grandvewe Cheese and Distillery
• FermenTasmania
• LionCo.
Proposed timelines:

IRC Skills Forecast and Proposed Schedule of Work 2018–2021 86
• June – project planning and location booking
• July – subject matter expert meetings, research and functional
analysis
• August – development of draft one documents
• September – public consultation – via website and workshops
• October – development of draft two documents
• November – TBA – second public consultation via website and
targeted subject matter expert meetings
• December – final drafting of documents
• February – public validation via website
• February – finalisation of documents including case for
endorsement
• April – proofreading of documents
• May – edit and equity review
• May – IRC case for endorsement approval to submit for quality
assurance review
• May – quality assurance evaluation
• June – state/territory training authority review
• June – Industry Reference Committee final sign off
• June – submission to Australian Industries and Skills
Committee
Scope of project This project is expected to take approximately 10 months to complete,
and will comprise:
• 2 new qualifications
• 3 new skill sets
• 10 new units of competency
• revision of 20 existing units of competency
• assessment of AQF level for the new qualifications.
Qualifications to be developed:
• Certificate IV in Brewing
• Certificate IV in Distilling Spirits>
Skill sets to be developed:
• Brewing beer
• Brewing cider
• Distilling spirits.
Units of competency to be developed:

IRC Skills Forecast and Proposed Schedule of Work 2018–2021 87
• Operate, maintain and clean brewing equipment, cooling
systems
• Create recipes to suit specific demographics
• Alter and refine recipes
• Create tasting notes
• Brew a wide variety of styles.
• Explain the brewing process to others
• Work autonomously
• Manage a team to achieve suitable production and quality
outcomes.
• Keep records and document excise information.
• Demonstrate a good understanding of the international and
domestic craft beer market.
Units of competency to be reviewed:
• FBPCEL3001 Perform second distillation (pot still brandy)
operations
• FBPCEL3005 Perform rectification (continuous still) operations
• FBPCEL3006 Perform single column lees stripping (continuous
still brandy) operations
• FBPCEL3007 Operate clarification by separation (centrifugation)
process
• FBPCEL3008 Perform dual column distillation (continuous still
brandy) operations
• FBPCEL3009 Perform first distillation (pot still brandy)
operations
• FBPCEL3011 Handle and store spirits
• FDFCEL2019A Carry out transfer operations
• FDFOP2003A Clean equipment in place
• FDFOP2004A Clean and sanitise equipment
• FDFOP2013A Apply sampling procedures
• FDFOP2066A Operate a wort production process
• FDFOP2067A Operate a brewery fermentation process
• FDFOP2068A Operate a beer maturation process
• FDFOP2069A Operate a beer filtration process
• FDFOP2070A Operate a bright beer tank process
• FDFOP2071A Identify key stages and beer production
equipment in a brewery

IRC Skills Forecast and Proposed Schedule of Work 2018–2021 88
• FDFOP2072A Operate a beer filling process
• FDFOP2073A Operate a beer packaging process
• FDFOP2074A Prepare and monitor beer yeast propagation
processes.
Project title: FOOD AND BEVERAGE FERMENTATION
Description This project will identify and fill the gaps in current food processing
qualifications to address food safety and manufacturing processes
involved in the growing field of fermented food and beverage production.
Fermentation preserves food, enhances flavours and has health benefits
– humans have been doing it for centuries. Fermentation is a
transformative process in which microorganisms (bacteria, yeast and
fungi) turn sugars into food acids, carbon dioxide and/or alcohol.
Fermentation can occur naturally or by application of a commercially-
produced starter culture.
The sector encompasses companies that manufacture bread, beer,
cider, wine, ginger beer, mead, cheese, yoghurt, sauerkraut, vinegar and
pickles. There are many more products increasing in popularity that may
be less familiar:
• kefir is a cultured fermented beverage, made from milk, water or
coconut milk
• kimchi is a staple Korean side dish, made from salted, spiced
and fermented vegetables
• kombucha is an effervescent drink, fermented from sweetened
black or green tea based on the skilled application of microbial
fermentation.
Skills and knowledge required for this industry include:
• understanding the nature and control of fermentation processes
• operation of technologically advanced fermenting and related
tools and equipment
• understanding and application of good manufacturing practices,
including equipment cleaning and sanitising
• understanding and application of micro-organisms involved in
fermenting food
• cultivation and isolation of microorganisms relating to the
fermentation process
• application of knowledge of yeast, bacterial and fungal
fermentation processes
• application of food safety principles to the fermentation process

IRC Skills Forecast and Proposed Schedule of Work 2018–2021 89
• conducting and interpreting tests of samples of fermented food
and beverages
• working with living cultures and organisms.
Rationale • Due to low-cost entry to market and growing demand for
fermented food and beverage products, micro, small and
medium-sized businesses have started to appear in greater
numbers.
• Occupational standards are required to support the growth in
industry and ensure the manufacture, distribution and sale of
safe, wholesome and consistently high-quality products.
• The growing market for fermented foods and drinks is also being
driven by a growing focus on healthier food options within
Australia’s and Asia’s middle-classes, particularly on products
that are reported to have beneficial effects on gut health, and the
growing awareness of the potential of some fermented food and
beverages in addressing digestive disorders.
Ministers’ priorities
addressed:
• Through the development of these training package
components, more information about this industry’s expectations
of training delivery will be available to training providers to
improve their delivery, and to consumers to enable better-
informed choices.
• The training system will better support individuals to move more
easily between the range of cheese and dairy-related processing
industries
• Improved efficiency of the training system will be gained through
the development of units that can be owned and used by multiple
industry sectors, such as other artisanal food manufacturing
industries.
• As this project is expected to consider the development of one or
more new skill sets, it will foster greater recognition of skill sets
within this industry.
Consultation plan The Food, Beverage and Pharmaceutical IRC will support the progress
of this review by sourcing key stakeholders involved in the food and
beverage fermenting industry to consult with Skills Impact when
developing training package components, structuring the qualification
and determining the skills required for the industry on a national level.
Key stakeholders to consult include:
• FermenTasmania
• Food Innovation Australia.
Proposed timelines:
• June – project planning and location booking
• July – subject matter expert meetings, research and functional
analysis

IRC Skills Forecast and Proposed Schedule of Work 2018–2021 90
• August – development of draft one documents
• September – public consultation – via website and workshops
• October – development of draft two documents
• November – TBA – second public consultation via website and
targeted subject matter expert meetings
• December – final drafting of documents
• February – public validation via website
• February – finalisation of documents including case for
endorsement
• April – proofreading of documents
• May – edit and equity review
• May – IRC case for endorsement approval to submit for quality
assurance review
• May – quality assurance evaluation
• June – state/territory training authority review
• June – Industry Reference Committee final sign off
• June – submission to Australian Industries and Skills Committee
Scope of project This project is expected to take approximately 10 months to complete,
and will comprise:
• 1 new qualification
• 3 skill sets
• 9 new units of competency
• revision of 4 existing units of competency
• assessment of AQF level for the new qualification.
Qualifications to be developed:
• Certificate III in Food and Beverage Fermentation.
Skill sets to be developed:
• Fermenting vegetables
• Fermenting dairy products
• Fermenting beverages.
Units of competency to be developed:
• Implementing the nature and control of fermentation processes
• Operation of technologically advanced fermenting and related
tools and equipment
• Handling fermentation micro-organisms

IRC Skills Forecast and Proposed Schedule of Work 2018–2021 91
• Cultivating micro fermentation micro-organisms
• Isolating fermentation micro-organisms
• Fermenting using yeast, bacterial and fungal processes
• Application of food safety principles to the fermentation process
• Conducting and interpreting tests of samples of fermented food
and beverages
• Working with living cultures and organisms.
Units of competency to be reviewed:
• FDFFST5024A Implement and review the production of
fermented dairy products and dairy desserts
• FBPCEL2002 Perform fermentation operations
• FBPBEV2001 Operate a deaeration, mixing and carbonation
process
• FBPOPR2010 Work with temperature controlled stock.
Related Documents