Vibrational Spectroscopy 66 (2013) 83–92 Contents lists available at SciVerse ScienceDirect Vibrational Spectroscopy jou rn al hom epage: www.elsevier.com/locate/vibspec IR spectroscopy of crystalline polymers from ab initio calculations: Nylon 6,6 Daria Galimberti a , Claudio Quarti a , Alberto Milani a,∗ , Luigi Brambilla a , Bartolomeo Civalleri b , Chiara Castiglioni a a Politecnico di Milano – Dip. Chimica, Materiali e Ing. Chimica “G. Natta”, P.zza Leonardo da Vinci 32, I-20133 Milano, Italy b Università di Torino – Dip. Chimica e Centro di Eccellenza NIS, Via P. Giuria 7, I-10125 Torino, Italy a r t i c l e i n f o Article history: Received 27 November 2012 Received in revised form 11 January 2013 Accepted 8 February 2013 Available online 27 February 2013 Keywords: Polyamides Hydrogen bonding Density functional theory calculations Crystallinity bands a b s t r a c t The IR spectrum of Nylon 6,6 in the crystalline phase is computed by means of dispersion-corrected density functional theory calculations carried out with periodic boundary conditions on the crystal. The results are carefully compared to experimental spectra through a detailed analysis of different fre- quency regions and focusing on the spectroscopic markers of crystallinity or regularity (i.e. of the regular conformation of the polymer chain). The previous assignments, based exclusively on experimental or semi-empirical investigations, are critically revised, demonstrating that state of the art computational methods in solid state chemistry can provide tools to obtain an unambiguous description of the vibra- tional properties of the crystalline phases of macromolecular materials. In particular, the ambiguities related to the assignment of some debated bands of crystallinity/regularity are solved. The structural and vibrational properties are interpreted on the basis of the peculiar intra and intermolecular interactions occurring in polyamides. © 2013 Elsevier B.V. All rights reserved. 1. Introduction Despite the widely spread application of vibrational spec- troscopy methods for polymer systems [1–4] also in the industrial environment, the study of polymers structure and of their vibra- tional properties by means of quantum chemical approaches is only at its early stages. While molecular dynamics simulations and peri- odic first principles calculation encountered a large success for the investigation of the crystal structure of macromolecules, few cal- culations have been carried out for the accurate prediction of the vibrational spectra of polymers, due to the fact that quantum chem- ical calculations of a suitable level of theory are required to this aim. The investigation of the vibrational properties of polymers and the assignments of the IR spectra for practical and analyt- ical purposes has been based mainly on experimental works or semiempirical calculations. It is thus not rare to find contrasting assignments, different interpretations and also some ambiguities in the past literature. More recently, ab initio calculations have been often carried out by taking into account small molecular models (i.e. short oligomers), according to the so-called “oligomer approach” [5–9] but only in the last years, ab initio calculations of IR spectra of polymers explicitly exploiting the translational symmetry have been presented [10–19], thanks in particular to the new computa- tional tools that have been implemented and that are now routinely ∗ Corresponding author. Tel.: +39 0223993383. E-mail address: [email protected] (A. Milani). available. Furthermore, accurate computational models for a cor- rect description of intermolecular interactions in the framework of density functional theory became available only recently [20–23] and they are mandatory for a reliable study of molecular crystals, especially in the case of soft materials such as polymers. In this class of materials, polyamides are well recognized and widespread in our everyday life. Furthermore, the development of new systems such as nanocomposites [24,25], electrospun nanofibers [26–34] and their application in the field of biomaterial and nanomedicine are currently promising fields of research. How- ever, some fundamental chemical/physical phenomena related to the interplay between intra- and inter-molecular interactions are currently investigated both experimentally and theoretically aim- ing at the development of structure/property relationships based on a molecular approach, in connection with related characteriza- tion techniques. Furthermore, the complexity of these interactions has been the main responsible of the ambiguities which are present in the literature, lacking the support of a suitable computational investigation. In this paper, we want to explore the application of the new computational tools now available for the description of polymeric materials in the crystalline state, presenting a computational study based on density functional theory (DFT) calculations augmented with an empirical dispersion correction (DFT-D) [20,21] of the IR spectra of NY6,6 by using the CRYSTAL09 code [35,36]. The calcula- tions take into account the space group symmetry for the accurate simulation of the vibrational properties of crystalline molecular materials. In the case of vibrational spectroscopy of polymers, this 0924-2031/$ – see front matter © 2013 Elsevier B.V. All rights reserved. http://dx.doi.org/10.1016/j.vibspec.2013.02.005

Welcome message from author
This document is posted to help you gain knowledge. Please leave a comment to let me know what you think about it! Share it to your friends and learn new things together.
Transcript

I
DCa
b
a
ARRAA
KPHDC
1
tetaoicviaaisatos[obt
0h
Vibrational Spectroscopy 66 (2013) 83–92
Contents lists available at SciVerse ScienceDirect
Vibrational Spectroscopy
jou rn al hom epage: www.elsev ier .com/ locate /v ibspec
R spectroscopy of crystalline polymers from ab initio calculations: Nylon 6,6
aria Galimberti a, Claudio Quarti a, Alberto Milania,∗, Luigi Brambillaa, Bartolomeo Civallerib,hiara Castiglionia
Politecnico di Milano – Dip. Chimica, Materiali e Ing. Chimica “G. Natta”, P.zza Leonardo da Vinci 32, I-20133 Milano, ItalyUniversità di Torino – Dip. Chimica e Centro di Eccellenza NIS, Via P. Giuria 7, I-10125 Torino, Italy
r t i c l e i n f o
rticle history:eceived 27 November 2012eceived in revised form 11 January 2013ccepted 8 February 2013vailable online 27 February 2013
a b s t r a c t
The IR spectrum of Nylon 6,6 in the crystalline � phase is computed by means of dispersion-correcteddensity functional theory calculations carried out with periodic boundary conditions on the crystal.The results are carefully compared to experimental spectra through a detailed analysis of different fre-quency regions and focusing on the spectroscopic markers of crystallinity or regularity (i.e. of the regularconformation of the polymer chain). The previous assignments, based exclusively on experimental or
eywords:olyamidesydrogen bondingensity functional theory calculationsrystallinity bands
semi-empirical investigations, are critically revised, demonstrating that state of the art computationalmethods in solid state chemistry can provide tools to obtain an unambiguous description of the vibra-tional properties of the crystalline phases of macromolecular materials. In particular, the ambiguitiesrelated to the assignment of some debated bands of crystallinity/regularity are solved. The structural andvibrational properties are interpreted on the basis of the peculiar intra and intermolecular interactionsoccurring in polyamides.
. Introduction
Despite the widely spread application of vibrational spec-roscopy methods for polymer systems [1–4] also in the industrialnvironment, the study of polymers structure and of their vibra-ional properties by means of quantum chemical approaches is onlyt its early stages. While molecular dynamics simulations and peri-dic first principles calculation encountered a large success for thenvestigation of the crystal structure of macromolecules, few cal-ulations have been carried out for the accurate prediction of theibrational spectra of polymers, due to the fact that quantum chem-cal calculations of a suitable level of theory are required to thisim. The investigation of the vibrational properties of polymersnd the assignments of the IR spectra for practical and analyt-cal purposes has been based mainly on experimental works oremiempirical calculations. It is thus not rare to find contrastingssignments, different interpretations and also some ambiguities inhe past literature. More recently, ab initio calculations have beenften carried out by taking into account small molecular models (i.e.hort oligomers), according to the so-called “oligomer approach”5–9] but only in the last years, ab initio calculations of IR spectra
f polymers explicitly exploiting the translational symmetry haveeen presented [10–19], thanks in particular to the new computa-ional tools that have been implemented and that are now routinely∗ Corresponding author. Tel.: +39 0223993383.E-mail address: [email protected] (A. Milani).
924-2031/$ – see front matter © 2013 Elsevier B.V. All rights reserved.ttp://dx.doi.org/10.1016/j.vibspec.2013.02.005
© 2013 Elsevier B.V. All rights reserved.
available. Furthermore, accurate computational models for a cor-rect description of intermolecular interactions in the framework ofdensity functional theory became available only recently [20–23]and they are mandatory for a reliable study of molecular crystals,especially in the case of soft materials such as polymers.
In this class of materials, polyamides are well recognized andwidespread in our everyday life. Furthermore, the developmentof new systems such as nanocomposites [24,25], electrospunnanofibers [26–34] and their application in the field of biomaterialand nanomedicine are currently promising fields of research. How-ever, some fundamental chemical/physical phenomena related tothe interplay between intra- and inter-molecular interactions arecurrently investigated both experimentally and theoretically aim-ing at the development of structure/property relationships basedon a molecular approach, in connection with related characteriza-tion techniques. Furthermore, the complexity of these interactionshas been the main responsible of the ambiguities which are presentin the literature, lacking the support of a suitable computationalinvestigation.
In this paper, we want to explore the application of the newcomputational tools now available for the description of polymericmaterials in the crystalline state, presenting a computational studybased on density functional theory (DFT) calculations augmentedwith an empirical dispersion correction (DFT-D) [20,21] of the IR
spectra of NY6,6 by using the CRYSTAL09 code [35,36]. The calcula-tions take into account the space group symmetry for the accuratesimulation of the vibrational properties of crystalline molecularmaterials. In the case of vibrational spectroscopy of polymers, this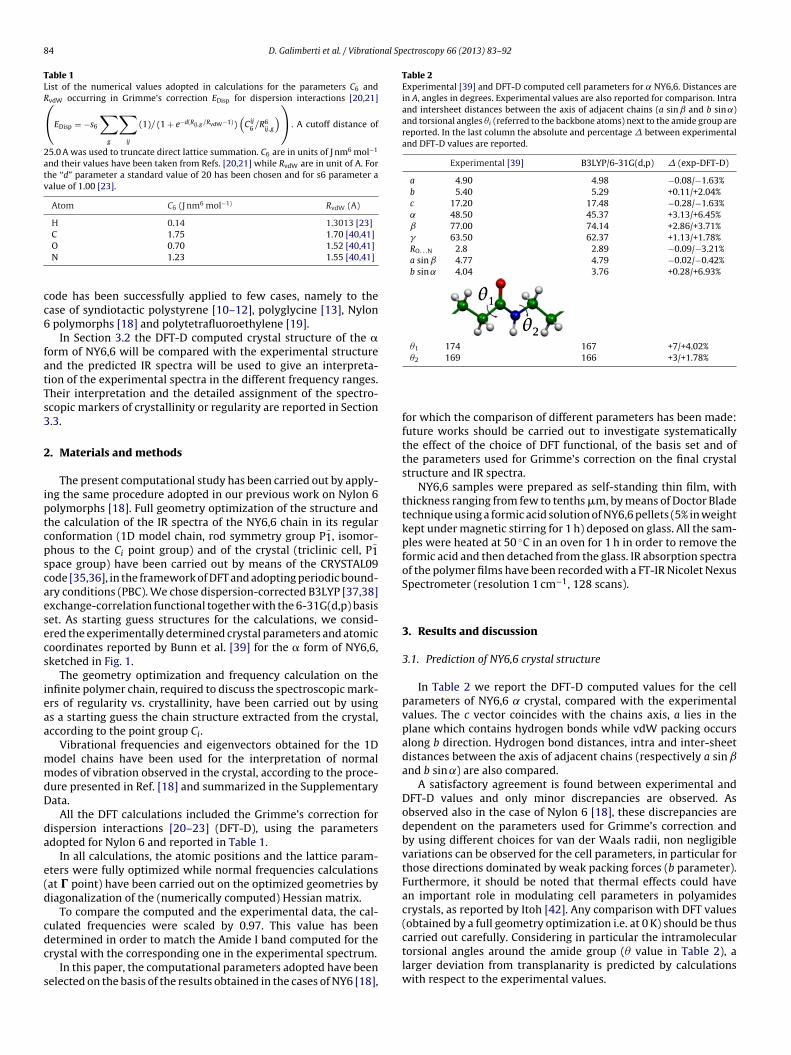
84 D. Galimberti et al. / Vibrational Spectroscopy 66 (2013) 83–92
Table 1List of the numerical values adopted in calculations for the parameters C6 andRvdW occurring in Grimme’s correction EDisp for dispersion interactions [20,21](
EDisp = −s6
∑g
∑ij
(1)/ (1 + e−d(Rij,g /RvdW−1))(
Cij6 /R6
ij,g
)). A cutoff distance of
25.0 A was used to truncate direct lattice summation. C6 are in units of J nm6 mol−1
and their values have been taken from Refs. [20,21] while RvdW are in unit of A. Forthe “d” parameter a standard value of 20 has been chosen and for s6 parameter avalue of 1.00 [23].
Atom C6 (J nm6 mol−1) RvdW (A)
H 0.14 1.3013 [23]C 1.75 1.70 [40,41]
cc6
fatTs3
2
iptcpscaesecs
ieaa
mmdD
da
e(d
cdc
s
Table 2Experimental [39] and DFT-D computed cell parameters for ̨ NY6,6. Distances arein A, angles in degrees. Experimental values are also reported for comparison. Intraand intersheet distances between the axis of adjacent chains (a sin ̌ and b sin ˛)and torsional angles �i (referred to the backbone atoms) next to the amide group arereported. In the last column the absolute and percentage � between experimentaland DFT-D values are reported.
Experimental [39] B3LYP/6-31G(d,p) � (exp-DFT-D)
a 4.90 4.98 −0.08/−1.63%b 5.40 5.29 +0.11/+2.04%c 17.20 17.48 −0.28/−1.63%˛ 48.50 45.37 +3.13/+6.45%ˇ 77.00 74.14 +2.86/+3.71%� 63.50 62.37 +1.13/+1.78%RO. . .N 2.8 2.89 −0.09/−3.21%a sin ˇ 4.77 4.79 −0.02/−0.42%b sin ˛ 4.04 3.76 +0.28/+6.93%
�1 174 167 +7/+4.02%� 169 166 +3/+1.78%
O 0.70 1.52 [40,41]N 1.23 1.55 [40,41]
ode has been successfully applied to few cases, namely to thease of syndiotactic polystyrene [10–12], polyglycine [13], Nylon
polymorphs [18] and polytetrafluoroethylene [19].In Section 3.2 the DFT-D computed crystal structure of the �
orm of NY6,6 will be compared with the experimental structurend the predicted IR spectra will be used to give an interpreta-ion of the experimental spectra in the different frequency ranges.heir interpretation and the detailed assignment of the spectro-copic markers of crystallinity or regularity are reported in Section.3.
. Materials and methods
The present computational study has been carried out by apply-ng the same procedure adopted in our previous work on Nylon 6olymorphs [18]. Full geometry optimization of the structure andhe calculation of the IR spectra of the NY6,6 chain in its regularonformation (1D model chain, rod symmetry group P1, isomor-hous to the Ci point group) and of the crystal (triclinic cell, P1pace group) have been carried out by means of the CRYSTAL09ode [35,36], in the framework of DFT and adopting periodic bound-ry conditions (PBC). We chose dispersion-corrected B3LYP [37,38]xchange-correlation functional together with the 6-31G(d,p) basiset. As starting guess structures for the calculations, we consid-red the experimentally determined crystal parameters and atomicoordinates reported by Bunn et al. [39] for the � form of NY6,6,ketched in Fig. 1.
The geometry optimization and frequency calculation on thenfinite polymer chain, required to discuss the spectroscopic mark-rs of regularity vs. crystallinity, have been carried out by usings a starting guess the chain structure extracted from the crystal,ccording to the point group Ci.
Vibrational frequencies and eigenvectors obtained for the 1Dodel chains have been used for the interpretation of normalodes of vibration observed in the crystal, according to the proce-
ure presented in Ref. [18] and summarized in the Supplementaryata.
All the DFT calculations included the Grimme’s correction forispersion interactions [20–23] (DFT-D), using the parametersdopted for Nylon 6 and reported in Table 1.
In all calculations, the atomic positions and the lattice param-ters were fully optimized while normal frequencies calculationsat � point) have been carried out on the optimized geometries byiagonalization of the (numerically computed) Hessian matrix.
To compare the computed and the experimental data, the cal-ulated frequencies were scaled by 0.97. This value has been
etermined in order to match the Amide I band computed for therystal with the corresponding one in the experimental spectrum.In this paper, the computational parameters adopted have beenelected on the basis of the results obtained in the cases of NY6 [18],
2
for which the comparison of different parameters has been made:future works should be carried out to investigate systematicallythe effect of the choice of DFT functional, of the basis set and ofthe parameters used for Grimme’s correction on the final crystalstructure and IR spectra.
NY6,6 samples were prepared as self-standing thin film, withthickness ranging from few to tenths �m, by means of Doctor Bladetechnique using a formic acid solution of NY6,6 pellets (5% in weightkept under magnetic stirring for 1 h) deposed on glass. All the sam-ples were heated at 50 ◦C in an oven for 1 h in order to remove theformic acid and then detached from the glass. IR absorption spectraof the polymer films have been recorded with a FT-IR Nicolet NexusSpectrometer (resolution 1 cm−1, 128 scans).
3. Results and discussion
3.1. Prediction of NY6,6 crystal structure
In Table 2 we report the DFT-D computed values for the cellparameters of NY6,6 ̨ crystal, compared with the experimentalvalues. The c vector coincides with the chains axis, a lies in theplane which contains hydrogen bonds while vdW packing occursalong b direction. Hydrogen bond distances, intra and inter-sheetdistances between the axis of adjacent chains (respectively a sin ˇand b sin ˛) are also compared.
A satisfactory agreement is found between experimental andDFT-D values and only minor discrepancies are observed. Asobserved also in the case of Nylon 6 [18], these discrepancies aredependent on the parameters used for Grimme’s correction andby using different choices for van der Waals radii, non negligiblevariations can be observed for the cell parameters, in particular forthose directions dominated by weak packing forces (b parameter).Furthermore, it should be noted that thermal effects could havean important role in modulating cell parameters in polyamidescrystals, as reported by Itoh [42]. Any comparison with DFT values(obtained by a full geometry optimization i.e. at 0 K) should be thuscarried out carefully. Considering in particular the intramoleculartorsional angles around the amide group (� value in Table 2), a
larger deviation from transplanarity is predicted by calculationswith respect to the experimental values.
D. Galimberti et al. / Vibrational Spectroscopy 66 (2013) 83–92 85
tructu
3
t2ttoebtaAot
Fa0
Fig. 1. Sketch of the crystalline s
.2. IR spectra of NY6,6
In Fig. 2 we report the comparison between the experimen-al and DFT computed IR spectra of NY6,6 in the frequency range000–500 cm−1 which is the most important for practical applica-ion. The spectra computed both for the infinite polymer chain andhe crystal are reported: as expected, in the case of polyamides, theccurrence of hydrogen bonding prevents the interpretation of thexperimental spectra on the basis of a single, infinite chain modelut the whole crystal needs to be considered. This is particularlyrue in the case of Amide I and Amide II bands, whose frequenciesnd intensities are significantly influenced by hydrogen bonding.
s described in Section 3.3, the comparison between the IR spectraf the infinite chain and the crystal is anyway useful, since it giveshe possibility to assign the marker bands sensitive to the crystalig. 2. Comparison between experimental and DFT-D computed IR spectra (crystalnd single chain model) in the frequency range below 2000 cm−1 (scaling factor.97).
re of the NY6,6 crystal, ̨ phase.
packing (e.g. crystallinity bands) or mainly due to the existence of aregular conformation of the chains (e.g. regularity bands). This issueis particularly important in the case of NY6,6 since many of the dis-crepancies found in the literature [43–64] concern the assignmentsof some bands as marker of crystallinity or regularity, thus affectingtheir use in practical applications.
The spectrum computed for the crystal in Fig. 2 reproduces accu-rately the experimental spectrum even in minor details and thepattern in both frequencies and relative intensities shows a verygood agreement. In the following, the different frequency rangeswill be analyzed in detail, focusing in particular on the markerbands previously proposed in the literature and which are sum-marized in Table 3.
3.2.1. 800–1100 cm−1 frequency rangeIn this frequency region, important marker bands are found
for polyamides crystals: also in the case of NY6,6, the two bandsobserved at 936 and 906 cm−1 are usually assigned as marker ofcrystallinity [43–53]. However, a significant discrepancy is presentin the literature: based on previous observations [54], Quintanilla
et al. [50] state that the band at 936 cm−1 is a marker of thetrans conformation of the chain, independently of the presenceof a crystal phase (i.e. it is a regularity band). Such assignmentwould prevent a diagnosis of crystallinity in real samples basedTable 3Wavenumbers of the most important experimentally determined IR marker bandsof NY6,6 proposed in the literature by different authors [43–64].
Wavenumber (cm−1) of marker bands in the IR spectra
Crystallinity 906, 936, 1200, 1466, 1460, 2946Regularity 1474, 1417Amorphous 924, 1136, 1140Reference 1630Uncertain 1180, 1144, 1224, 1329

86 D. Galimberti et al. / Vibrational Sp
FN
otw(taFbip
3
ossbAl
vhDva
FN
ig. 3. Comparison between experimental and DFT-D computed IR spectra for ˛-Y6,6 in the wavenumber range 1100–800 cm−1 (scaling factor: 0.97).
n the detection this band, as well as its quantitative determina-ion through the measured absorption intensity. In Section 3.3 weill show that DFT-D calculations carried out on the isolated chain
1D model chain) can unravel this ambiguity and confirm that bothhese bands (predicted at 921 cm−1 and 900 cm−1, scaled values)re markers for the NY6,6 crystal. In addition to these two bands,ig. 3 shows that the pattern of the four main bands observedetween 1080 cm−1 and 980 cm−1 in the experimental spectrum
s reproduced by the calculations, where four bands are indeedredicted.
.2.2. 1100–1500 cm−1 frequency rangeIn the frequency range below 1500 cm−1 many bands are
bserved having medium/weak intensity if compared with thetrong amide I and II bands. The comparison with DFT-D computedpectra is reported in Fig. 4 and a good agreement is again foundoth in frequencies and intensities, even for the minor features.lso in this range, a lot of discrepancies are present in the previous
iterature.The weak and broad band observed at 1144 cm−1 has been pre-
iously assigned to the amorphous phase and in Refs. [50,55] itas been assigned to chain defects involving gauche conformations.
FT-D calculations predict a very weak band at 1128 cm−1 (scaledalue) which can be related to the experimental band at 1144 cm−1nd thus they support the conclusions of Vasanthan [45,46] who
ig. 4. Comparison between experimental and DFT-D computed IR spectra for ˛-Y6,6 in the frequency range 1500–1100 cm−1 (scaling factor: 0.97).
ectroscopy 66 (2013) 83–92
indicated that also a contribution of the crystalline phase to thisfeature can be present. In any case, even if such a contribution ispresent, it is not strong enough to ascribe the observed transitionto the effect of the crystal phase only and we can definitely confirmthe assignment of the 1144 cm−1 band as a marker of the amor-phous phase. In the case of the band observed at 1180 cm−1, someauthors assigned it as a marker of the amorphous phase [56], whileVasanthan [45,46] and Cooper [55] demonstrated that it gets a con-tribution due to the crystalline phase: DFT-D calculations predict aband at 1174 cm−1 (scaled value) thus confirming that it is due tothe NY6,6 crystal. The crystallinity band falling at 1202 cm−1 [45,46]is also confirmed (computed band at 1194 cm−1).
The weak bands observed at 1329 and 1224 cm−1 have beenpreviously attributed to folded chains in the crystal [47,48] andshould be thus absent in DFT-D computed spectra due to the peri-odic boundary conditions adopted to describe the (ideal) crystal.However, two bands are predicted at 1340 cm−1 (weak intensity)and 1216 cm−1, demonstrating that the two bands are present inthe bulk crystal and cannot be taken as evidence of chain folding,as also previously discussed by Cooper [55]. Further marker bandsare those found between 1491 and 1437 cm−1: computed spec-tra are still in general agreement with previous assignments [55]of the observed bands at 1474, 1466 and 1417 cm−1 (predicted at1437 cm−1) to the crystal or to chains with regular conformationbut a deeper investigation based also on the single chain model isrequired for a detailed assignment (see Section 3.3).
As a final comment, the calculations indicate the presence of fourother possible marker bands at 1387, 1372, 1305 and 1278 cm−1
(computed values) for the crystal, not used in previous studies.
3.2.3. Other spectral regionsIn Fig. 5a the experimental and DFT-D spectra are compared
in the frequency range 800–400 cm−1. Again a close correspon-dence is found, in particular for the two bands at about 578 and535 cm−1 whose pattern is accurately predicted. In the case of thebroad, structured bands falling between 680 and 760 cm−1 DFT-Dcalculations are not able to reproduce the correct relative intensi-ties: a similar behavior was observed also in the case of NY6 [18]in the same spectral region and it could be due to the contributionof the amorphous in the experimental spectra.
In the frequency range 1700–1450 cm−1 (Fig. 5b) the intenseamide I and II bands are observed and their pattern in frequen-cies and intensities is again nicely reproduced by the calculations,including the presence of the weak band observed at about1475 cm−1. As widely known [57], the amide bands, in addition tothe NH stretching band observed at about 3300 cm−1 and reportedin Fig. 5d, are very sensitive to hydrogen bonding and their cor-rect prediction requires calculations on the whole crystal, makingunreliable the 1D chain model for an interpretation of the spectraof crystalline samples.
Finally, in Fig. 5c the CH stretching region (3100–2800 cm−1)is reported: as expected some discrepancies are found, in par-ticular when relative intensities are analyzed; two main featuresare however predicted, both characterized by the presence of sev-eral components in agreement with the experimental spectrum. Itis well-known that in this frequency range anharmonicity effects(overtones, Fermi resonances) can give an important contribution;furthermore, conformational effects (e.g. amorphous contribution)can introduce a modulation of the CH stretching bands [65]. Also theapproximations introduced by the calculations (e.g. basis set super-position error, Grimme’s correction for dispersion interactions, etc.)
can originate discrepancies. In spite of this, we will show in thenext section that also in this frequency range, DFT-D calculationsare useful to obtain some further insights on the intramolecularinteractions taking place for the polymer chain.
D. Galimberti et al. / Vibrational Spectroscopy 66 (2013) 83–92 87
F Y6,6 i3
3
dcccaicstmlsitcu
idrd
ig. 5. Comparison between experimental and DFT-D computed IR spectra for ̨ N100–2750 cm−1, (d) 3500–3100 cm−1 (scaling factor: 0.97).
.3. Comparison with 1D model chain spectra
Vibrational spectra of highly crystalline polymers [1,3] are ofteniscussed in terms of crystallinity vs. regularity bands. This classifi-ation is based on the assumption that the q = 0 phonons of therystal can be described in terms of q = 0 phonons of the singlehains belonging to the 3-D unit cell, which are characterized by
regular conformation and then are described as 1-D crystal. If thenter-molecular interactions are weak, the perturbation by the 3-Drystal packing is small and the spectrum is reasonably predictedimply by the calculation of the phonons of the isolated chain: onhis basis we can conclude that we are in presence of vibrations
ainly sensitive to the regular structure of the single chain (regu-arity bands). Sometimes, as for instance in the case of polyethylene,ome regularity bands show the so called crystal splitting, whichs indeed the signature of the presence of a regular 3-D packing: inhis case the band is classified as crystallinity band. Moreover therystal splitting proves the presence of more than one chain in thenit cell [1,3].
In the case of NY6,6 (and in general for polymers character-zed by strong intermolecular interactions (i.e. H-bonds) the above
escription does not apply, since in this case the regular single chainepresents an ideal model. Indeed a NY6,6 chain is expected toevelop inter- and intra-molecular hydrogen bonds in any phasen the following wavenumbers ranges: (a) 800–400 cm−1, (b) 1700–1450 cm−1, (c)
of the matter (and in particular both in the amorphous and in thecrystalline phases). It may be however interesting to exploit thecomparison of the vibrational spectrum of the 3-D crystal with thatcalculated for the ideal 1-D model, in order to obtain a classifica-tion of the normal modes capable to get some information on therelevant interactions taking place in the solid state. On the basisof the comparison of the two computed infrared spectra and inanalogy with the case of van der Waals polymers crystals, we willassign marker bands of crystallinity (i.e. of bands associated to nor-mal vibrations which are sensitive to the 3-D crystal packing) ormarker bands of regularity, the latter being simply predicted onthe basis of the phonons of the 1-D infinite chain, i.e. related to theexistence of a regular conformation of the chains, independently oftheir supramolecular arrangement.
An additional advantage of ab initio calculations relies in thepossibility to associate each frequency to the corresponding nor-mal mode of vibration, allowing to propose a detailed vibrationalassignment and gathering information on the dynamics of the sys-tem in terms of specific intra and intermolecular interactions. Theanalysis has been done by following the “projection method” pre-viously adopted in the case of Nylon 6 [18] and described in the
Supplementary Data. According to this method, the normal modesof the crystal are described on the basis of the characteristic normalmodes of the isolated chain. In this way a correspondence between
88 D. Galimberti et al. / Vibrational Spectroscopy 66 (2013) 83–92
F odel c(
tcpib
pneeeitiwt9spmomSattth
1tacbeSmmp
bcbf
from those previously proposed by some authors [55,58,59,64] whoassigned the band at 1474 and 1417 cm−1 as regularity bands. Onthe contrary, the previous assignment of the band at 1440 cm−1 to
ig. 6. Comparison between DFT-D computed IR spectra of the ̨ crystal and 1D mfrequency scaling factor: 0.97).
he relevant IR active transitions of the crystal and of the 1D modelan be established, enabling to capture the effects of the crystalacking and H bonds formation in terms of frequency shifts and IR
ntensity redistribution due to the “mixing” of chain modes inducedy the intermolecular interactions.
In Fig. 6a the frequency range 800–1100 cm−1 is shown. In therevious section we shown that the debated band at 936 cm−1 isicely predicted by calculations carried out on the crystal; how-ver this does not prove that the appearance of this band in thexperimental spectrum should be taken as an evidence of the pres-nce of a 3-D packing (i.e. it is a marker of crystallinity). Indeedt could be due only to the presence of chain segments showingrans-planar conformation (such as that observed in crystal), evenf they are not packed in a crystal, characterized by a regular net-
ork of H bonds. The comparison with the spectrum computed forhe 1D model chain definitely assigns both the band observed at36 and 906 cm−1 as markers of crystallinity: indeed, their inten-ity would be much weaker for a regular isolated chain and theattern recorded can be nicely reproduced only if a periodic tridi-ensional chain packing is present. On this basis the assignment
f the band at 936 cm−1 as a marker band of trans regular confor-ation [50] is definitely discarded. As reported in Table S1 of the
upplementary Data, the normal modes associated to the bands 936nd 906 cm−1 involve directly the amide groups and CH2 deforma-ion modes. It is thus quite straightforward to understand why, dueo the high sensitivity to the intra/intermolecular environment ofhe CH bonds [65,66], these bands are significantly affected by theydrogen bonding, taking place in the crystal.
On the one hand, the four bands observed between 950 and080 cm−1 result to be slightly stronger according to the calcula-ion on the crystal but the differences between 1D and 3D modelsre not so significant to consider them as reliable markers of therystalline phase: for this reason it is reasonable to suggest that theands predicted at 1077 and 998 cm−1 should be considered mark-rs of regularity, as also confirmed by the analysis reported in theupplementary Data. On the other hand, based on intensity argu-ents, the two bands at 1049 and 1029 cm−1 could be consideredarkers of crystallinity, even if they are not suitable for practical
urposes.In the case of 1400–1100 cm−1 range (Fig. 6b) a quite complex
ehavior is observed: while the band at about 1174 cm−1 in the
omputed spectrum of the crystal (assigned to the experimentaland at 1180 cm−1) is a marker of crystallinity, the band predictedor the isolated chain at about 1176 cm−1 seems to lose intensityhain of NY6,6 in the frequency range (a) 1100–800 cm−1 and (b) 1400–1100 cm−1
in the crystal; the same holds also for the bands predicted at about1235 and 1128 cm−1.1 It should be also noted that, in the case ofthe doublet of bands predicted at 1194 and 1174 cm−1 the projec-tion method reveals that a significant coupling of different normalmodes of the 1D chains is present and thus the trend in intensitycannot be simply interpreted carrying out a one-to-one correspon-dence with the bands of the 1D chain. Based on these results, it isappropriate to assign the bands observed at 1201 and 1180 cm−1
as markers of crystallinity, confirming the conclusions reported inprevious papers [45,46]. On the opposite, it is possible to assignthe bands predicted at about 1278 and 1216 cm−1 in the crystal asmarkers of regularity while the bands predicted at 1372, 1387 and1305 cm−1 are enhanced in intensity in the crystal and are assignedas markers of crystallinity (see Table S1). As pointed out in theprevious section, the two bands observed at 1224 and 1329 cm−1
cannot be considered as markers of chain folding [55] since theyhave two correspondent bands in the DFT-D computed spectrumat 1216 and 1340 cm−1 respectively.
On the basis of the previous investigation carried out on Nylon6 [18], we can also conclude that the assignment of individualbands as markers of crystallinity/regularity is not trivial in thisrange since significant dynamical couplings take place because ofthe supramolecular arrangement. In particular the whole patternof bands and their relative intensity in this region provide the evi-dence of crystallinity, as clearly shown in Fig. 6b.
In Fig. 7a the frequency range associated to Amide I and IIbands is reported: the usual frequency downshift and intensifica-tion of Amide I band and the frequency upshift of Amide II bandswhen passing from the 1D chain to the crystal is observed, consis-tently with the occurrence of hydrogen bonding [57]. In additionto this standard and well-known behavior, further insights can beobtained by inspection of the 1490–1400 cm−1 range. The bandsobserved at 1474 and 1466 cm−1 and predicted for the crystal at1491 and 1476 cm−1 (scaled values) increase in intensity due tocrystal packing and are thus markers of crystallinity. Finally, theother major band predicted at 1437 cm−1 for the crystal is clearlya marker of crystallinity. Our assignments in this region differ
1 A similar behavior in intensity has been found in the same frequency range alsofor Nylon 6 and it is due probably to subtle effects of hydrogen bonding in modulatingnon-principal charge fluxes [67–70] associated to these vibrations.

D. Galimberti et al. / Vibrational Spectroscopy 66 (2013) 83–92 89
F del ch( ve be
alb
kh
ailnmoocrfg
sNMmisb
group are expected to be remarkably different from the othermethylenic groups. Furthermore, since the creation of hydrogenbonding strongly modulates the electronic structure of the whole
ig. 7. Comparison between DFT-D computed IR spectra of the ̨ crystal and 1D mofrequency scaling factor: 0.97). In panel (b) the intensity for the 1D model chain ha
gauche conformation of the chain is assessed also by our calcu-ations since we do not observe bands with significant intensity toe assigned to this experimental feature.
In Fig. 7 we report also the NH stretching region where the well-nown significant redshift and intensification [57] originated byydrogen bonding is clearly observed in the computed spectra.
Lastly, we now analyze the comparison between experimentalnd DFT-D computed spectra in the CH stretching region, reportedn Fig. 8. We already mentioned that this region should be ana-yzed with care, due to the presence of significant anharmonicityot taken into account in present calculations, carried out in har-onic approximation. As usual, this region is structured, due to the
verlap of many contributions and it is difficult to detect markersf crystallinity/regularity in such a range. As a first observation, wean note that the pattern of bands of the crystal is blue-shifted withespect to that of the 1D chain, as also observed in the case of the ˛orm of Nylon 6, probably due to the steric hindrance between CH2roups when packed in the crystal.
The analysis of CH stretching bands is particularly useful totudy the intramolecular vibrational interactions taking place inY6,6 chain. It is indeed well-known since the pioneering work byckean [66] that CH stretching frequencies are sensitive to their
olecular environment; furthermore, in a very recent paper [65],t is shown how CH2 stretching frequencies are particularly sen-itive to the neighboring chemical groups, being influenced bothy inductive effects by halogens and electronegative groups and
ain of NY6,6 in the frequency range (a) 1750–1400 cm−1 and (b) 3550–3100 cm−1
en multiplied for 5 for a better comparison.
by conformational effects. In the present case of NY6,6, the pres-ence of the amide groups can modify the nature of the CH2 in thealkyl chain depending on their relative distance along the poly-mer. In particular, CH2 groups immediately adjacent to the amide
Fig. 8. Comparison between DFT-D computed IR spectra of the ̨ crystal and 1Dmodel chain of NY6,6 in the frequency range 3100–2700 cm−1.

90 D. Galimberti et al. / Vibrational Spectroscopy 66 (2013) 83–92
Table 4Assignment of the CH stretching modes. In the last column the location of the CH2 group with respect to the N-H or C O bond of the amide group is indicated by Greek letters(�: first neighbor, �: second neighbor. . .).
CrystalDFT computed frequency (scaled) (cm−1) IR intensity (km/mol) Assignment
3029 35 CH2 antisymmetric stretching Collective3027 226 CH2 antisymmetric stretching �(CO)
�(NH)3015 81 CH2 antisymmetric stretching �(NH)
�(NH)�(NH)
2997 12 CH2 antisymmetric stretching �(NH)�(NH)
2993 17 CH2 antisymmetric stretching �(CO)2980 65 CH2 symmetric stretching �(CO)2970 244 CH2 symmetric stretching �(NH)
�(NH)�(NH)
2959 17 CH2 Symmetric stretching �(NH)�(NH)�(NH)
2956 14 CH2 Symmetric stretching �(CO)
aoatCaCs2tar
evt[sirtcada3C
tcpd
TIc
2952 23
mide group, it can be expected that it results also in a modulationf the characteristic of the CH2 groups closer to it and the bandsssociated to vibrations localized on these groups will be sensitiveo the crystal packing. In Table 4 we report the assignment of theH stretching bands: it is immediately evident that some bandsre directly related to a normal mode localized only on one or twoH2 groups adjacent to the NH or C O bonds of the amide group,uch as for example the bands calculated at 3027, 2997, 2993, 2980,956 and 2952 cm−1. The extreme sensitivity of CH2 vibrations toheir environment is further highlighted by the fact that CH2 groupsdjacent to the NH bond have different stretching frequencies withespect to CH2 groups adjacent to the C O bond.
Thanks to the projection method, it seems correct to relate thexperimental bands at 2946 and 2933 cm−1 respectively to the con-olution of the modes predicted in the range 3029–3027 cm−1 ando the band at 3015 cm−1. We agree with the assignment of Cooper55] and Heidemann [58] of the band at 2946 cm−1 to the anti-ymmetric stretching of the CH2 mainly adjacent to the NH bond;n addition the contribution of the mode predicted at 3027 cm−1 iselated to normal modes associated also to the CH2 groups adjacento the C O bond. Considering the band at 2970 cm−1, this is asso-iated to stretching modes on CH2 groups adjacent to the N atom,s proposed by Zimba [60]. Finally, since no other bands are pre-icted above 3029 cm−1 (corresponding to the experimental bandt 2946 cm−1), we confirm that the bands observed at 3195 and058 cm−1 can be probably assigned to overtones, as proposed byannon [61].
As a summary to the whole discussion and in order to quan-ify the effect on IR intensities due to the hydrogen bonding in the
rystal, we report in Table 5 the comparison between the com-uted intensity sums for the 1D model chain and the crystal in theifferent regions of the spectrum previously analyzed.able 5ntensity behavior of the infrared spectrum of 1D model chains (single chain) andrystals of NY6,6.
Frequency range (cm−1) 1D (chain) 3D (crystal)
500–900 31 468900–1150 27 1031150–1550 1332 1731Amide I and II 1061 2161CH stret 492 733NH stretc 28 1804
CH2 Symmetric stretching �(NH)�(NH)
As expected due to the presence of hydrogen bonding, the NHstretching region and the Amide I and II region are significantlyenhanced in intensity; however, also in the 500–900 and 900–1150regions, an enhancement in intensity characterizes the crystal, con-firming again that many bands in this region are indeed importantmarkers of crystallinity, which can be used also for practical pur-poses. On the other side, in the region 1150–1550 cm−1, with theexception of the amide II band, such a remarkable effect is notobserved and the projection method reveals that it is quite difficultto obtain a definite assignment of crystallinity/regularity bands inthis region.
Based on the detailed analysis reported, we finally report inTable 6 our assignments for the IR spectrum of NY6,6 ̨ crystal, alsocompared to previous assignments. In this Table we report only therelevant marker bands; the complete list of DFT-D computed fre-quencies and intensities for both the crystal and the chain can befound in the Supplementary Data.
4. Conclusions
In this work, we have shown how recent developments intheoretical and computational solid-state research offer valuabletools for the calculation of the infrared spectra and vibrationalproperties of soft crystalline materials. Polymers are a significantexample of this kind of materials, since vibrational spectroscopytechniques are widely used also in the industrial environment, buttheir application relied almost exclusively on experimental and/orsemiempirical approaches. It is thus not rare to find many discrep-ancies, ambiguities and open questions in the literature, also inrelation to materials which are widely used in the everyday life.The CRYSTAL code is very powerful to predict the IR spectra ofmolecular crystals, due to the possibility to take into account thefull space group symmetry (required for structural optimization,band assignment and description of the polarization properties)and to include a suitable description of van der Waals interactionsin the framework of density functional theory. Here, we have usedCRYSTAL09 code to carry out DFT-D calculations of the IR spectra ofnylon 6,6 polymer, by considering both the crystalline structure (˛
form) and the infinite chain model. A good description of both thecrystalline structure and of the experimental IR spectrum has beenobtained. In particular, some ambiguities in the assignment of themarker bands, previously proposed on the basis of experimental
D. Galimberti et al. / Vibrational Spectroscopy 66 (2013) 83–92 91
Table 6Classification of marker bands of NY6,6 � crystal. The computed frequencies refer to the calculation on the crystal. In the case of “regularity” bands the computed valueaccording to the model of isolated chain (1D model) is also reported in {} brackets.
Experimental frequency (cm−1) Previous classification DFT-D frequency(scaled) (cm−1)
DFT-D IR intensity(Km/mol)
New classification
906 Crystallinity [43,45,46,56] 900 7 Crystallinity
924 Amorphous [45,46]
936 [45,46,50]943 [55]
Crystallinity [45,46,49]
Regularity [50,55]
921 58 Crystallinity
998{988}
2{3}
Regularity
1029 18 Crystallinity
1049 8 Crystallinity
1077{1062}
4{6}
Regularity
1136 Amorphous [45,46]
1144 Amorphous [47–50,62,63]
regularity – gauche conformation[50,55]
1128 10 Crystallinity
1180 References [45,46]
Amorphous [56]
1174 29 Crystallinity
1202 Crystallinity [45,46] 1194 51 Crystallinity
1224 Regular chain folding [47,48]
Not due to folding [55]
1216 18 Crystallinity
1278{1235}
144{170}
Regularity
1300 11 Crystallinity
1305 32 Crystallinity
1329 Regular chain folding [47,48]
Not due to folding [55]
1340 8 Crystallinity
1372 92 Crystallinity
1387 15 Crystallinity
1417 Regularity [55,58,59,64] 1437 109 Crystallinity
1440 Non-trans conformations [58,59,64] 1455 1 Crystallinity
1460 1476 52 Crystallinity
1466 Crystallinity [58,59] 1482 10 Crystallinity
1474 Regularity [55,58,59,64] 1491 244 Crystallinity
1630 [45,46]1645 [50]1650 [55]
References [45,46,50] 1632 1258 Crystallinity
2980{2950}
65{67}
Regularity
3058 Overtone [61]
io
mDppnt
3195 Overtone [61]
3307
nvestigations, have been unraveled and a better insight has beenbtained.
As in our recent paper on vibrational properties of Nylon 6 poly-orphs [18], the results here obtained demonstrate that accurateFT-D calculations of the IR spectra of crystalline polymers are
ossible and can be applied to discuss a wide range of problems,roviding answers to several open questions. Their importance isot restricted to the interpretation of the chemical/physical proper-ies of material but they are a valuable tool to support experimentaltechniques in the development and characterization of innovativepolymeric systems.
Appendix A. Supplementary data
Supplementary data associated with this article can befound, in the online version, at http://dx.doi.org/10.1016/j.vibspec.2013.02.005

9 nal Sp
R
[
[
[
[[
[[[[
[[[[
[
[[
[[
[
[
[[
[
[[
[
[
[[[[[[[[
[
[[[[[
[[
[[
[[[
[[[[[[[[
[[
2 D. Galimberti et al. / Vibratio
eferences
[1] P.C. Painter, M.M. Coleman, J.L. Koening, The Theory of Vibrational Spectroscopyand its Application to Polymeric Materials, Wiley, Chichester, 1982.
[2] G. Zerbi, in: R.J.G. Clark, R.R. Hester (Eds.), Advances in Infrared and RamanSpectroscopy, 11, Wiley Heyden, London, 1984, p. 301.
[3] C. Castiglioni, in: N.J. Everall, L.M. Chalmers, P.R. Griffiths (Eds.), VibrationalSpectroscopy of Polymers: Principles and Practices, Wiley, Chichester, 2007, p.455.
[4] R. Zbinden, Infrared Spectroscopy of High Polymers, Academic Press,New York, 1964.
[5] E. Koglin, R.J. Meier, Comput. Theory Polym. Sci. 9 (1999) 327–333.[6] R.J. Meier, Polymer 43 (2002) 517–522.[7] A. Tarazona, E. Koglin, B.B. Coussens, R.J. Meier, Vib. Spectrosc. 14 (1997)
159–170.[8] A. Milani, C. Castiglioni, E. Di Dedda, S. Radice, G. Canil, A. Di Meo, R. Picozzi, C.
Tonelli, Polymer 51 (2010) 2597–2610.[9] A. Milani, M. Tommasini, C. Castiglioni, G. Zerbi, S. Radice, G. Canil, P. Toniolo,
F. Triulzi, P. Colaianna, Polymer 49 (2008) 1812–1822.10] F. Javier Torres, B. Civalleri, A. Meyer, P. Musto, A.R. Albunia, P. Rizzo, G. Guerra,
J. Phys. Chem. B 113 (2009) 5059–5071.11] F. Javier Torres, B. Civalleri, C. Pisani, P. Musto, A.R. Albunia, G. Guerra, J. Phys.
Chem. B 111 (2007) 6327–6335.12] A.R. Albunia, P. Rizzo, G. Guerra, F. Javier Torres, B. Civalleri, C.M. Zicovich-
Wilson, Macromolecules 40 (2007) 3895–3897.13] A.M. Ferrari, B. Civalleri, R. Dovesi, J. Comput. Chem. 31 (2010) 1777–1784.14] S.M. Nakhmanson, R. Korlacki, J. Travis Johnston, S. Ducharme, Z. Ge, J.M. Takacs,
Phys. Rev. B 81 (2010) 174120.15] J. Kleis, B.I. Lundqvist, D.C. Langreth, E. Schroder, Phys. Rev. B 76l (2007) 100201.16] N.J. Ramer, T. Marrone, K.A. Stiso, Polymer 47 (2006) 7160–7165.17] N.J. Ramer, C.M. Raynor, K.A. Stiso, Polymer 47 (2006) 424–428.18] C. Quarti, A. Milani, B. Civalleri, R. Orlando, C. Castiglioni, J. Phys. Chem. B 116
(2012) 8299–8311.19] C. Quarti, A. Milani, C. Castiglioni, J. Phys. Chem. B 117 (2013) 706–718.20] S. Grimme, J. Comput. Chem. 25 (2004) 1463–1473.21] S. Grimme, J. Comput. Chem. 27 (2006) 1787–1795.22] C.S. Liu, G. Pilania, C. Wang, R. Ramprasad, J. Phys. Chem. A 116 (2012)
9347–9352.23] B. Civalleri, C.M. Zicovich-Wilson, L. Valenzano, P. Ugliengo, CrystEngComm 10
(2008) 405–410.24] L.S. Loo, K.K. Gleason, Macromolecules 36 (2003) 2587–2590.25] G. Chen, D. Shen, M. Feng, M. Yang, Macromol. Rapid Commun. 25 (2004)
1121–1124.26] K. Song, J.F. Rabolt, Macromolecules 34 (2001) 1650–1654.27] K.H. Lee, K.W. Kim, A. Pesapane, H.Y. Kim, J.F. Rabolt, Macromolecules 41 (2004)
1494–1498.28] F. Granato, A. Bianco, C. Bertarelli, G. Zerbi, Macromol. Rapid Commun. 30
(2009) 453–458.
29] A. Bianco, G. Iardino, A. Manuelli, C. Bertarelli, G. Zerbi, Chem. Phys. Chem. 8(2007) 510–514.30] J.S. Stephens, D.B. Chase, J.F. Rabolt, Macromolecules 37 (2004) 877–881.31] Y. Liu, L. Qi, F. Guan, N.E. Hedin, L. Zhu, H. Fong, Macromolecules 40 (2007)
6283–6290.
[[
[
ectroscopy 66 (2013) 83–92
32] E. Zussman, N. Burman, A.L. Yarin, R. Khalfin, Y. Cohen, J. Polym. Sci. B: Polym.Phys. 44 (2006) 1482–1489.
33] U. Stachewicz, A.H. Barber, Langmuir 27 (2011) 3024–3029.34] A. Milani, M. Casalegno, C. Castiglioni, G. Raos, Macromol. Theory Simul. 20
(2011) 305–319.35] R. Dovesi, V.R. Saunders, C. Roetti, R. Orlando, C.M. Zicovich-Wilson, F. Pascale,
B. Civalleri, K. Doll, N.M. Harrison, I.J. Bush, P. D’Arco, M. Llunell, CRYSTAL09User’s Manual, University of Torino, Torino, 2009.
36] R. Dovesi, R. Orlando, B. Civalleri, C. Roetti, V.R. Saunders, C.M. Zicovich-Wilson,F. Pascale, Zeit. Kristallogr. 220 (2005) 571–573.
37] A.D. Becke, J. Chem. Phys. 98 (1993) 5648–5652.38] C. Lee, W. Yang, R.G. Parr, Phys. Rev. B 37 (1988) 785–789.39] C.W. Bunn, E.V. Garner, Proc. Roy Soc. 39 (1947) 39–68.40] A. Bondi, J. Phys. Chem. 68 (1964) 441–451.41] R. Scott Rowland, R. Taylor, J. Phys. Chem. 100 (1996) 7384–7391.42] T. Itho, Jpn. J. Appl. Phys. 15 (1976) 2295–2306.43] H. Arimoto, J. Polym. Sci. A 2 (1964) 2283.44] N.S. Murthy, R. Bray, S. Curran, M. McDonald, in: J.P. Sibilia (Ed.), A Guide to
Material Characterization and Analysis, VCH, New York, 1994, p. 84.45] N. Vasanthan, D.R. Salem, J. Polym. Sci. B: Polym.Phys. 38 (2000)
516–552.46] N. Vasanthan, D.R. Salem, Mat. Res. Innovat. 38 (2001) 155–160.47] J.L. Koenig, M. Itoga, J. Macromol. Sci. Phys. B 6 (1972) 309.48] J.L. Koenig, M.C. Agboatwalla, J. Macromol. Sci. Phys. B 2 (1968) 391.49] J. Jakes, S. Krimm, Spectrochim. Acta A 27 (1971) 19.50] L. Quintanilla, J.C. Rodriguez-Cabello, J.M. Pastor, Polymer 35 (1994)
2321–2328.51] S.J. Cooper, E.D.T. Atkins, M.J. Hill, Macromolecules 31 (1998) 5032–5042.52] S.J. Cooper, E.D.T. Atkins, M.J. Hill, J. Polym. Sci. B: Polym. Phys. Edn. 36 (1998)
2849–2863.53] S.J. Cooper, E.D.T. Atkins, M.J. Hill, Macromolecules 31 (1998) 8947–8956.54] D. Garcia, H.W. Starkweather, J. Polym. Sci.: Polym. Phys. Edn. 23 (1985)
537.55] S.J. Cooper, M. Coogan, N. Everall, I. Priestnall, Polymer 42 (2001) 10119–10132.56] E.M. Murty, T.W. Yehl, Polym. Eng. Sci. 30 (1990) 1595.57] G.C. Pimentel, A.L. McClellan, The Hydrogen Bond, W.H., Freeman, San
Francisco, 1960.58] G. Heidemann, H. Zahn, Macromol. Chem. 62 (1963) 123.59] I. Matsubara, J.H. Magill, Polymer 7 (1966) 199–215.60] C.G. Zimba, J.F. Rabolt, A.D. English, Macromolecules 22 (1989) 2863–2867.61] C.G. Cannon, Spectrochim. Acta 16 (1960) 302–319.62] A. Anton, J. Appl. Polym. Sci. 12 (1968) 2117.63] H.W. Starkweather, R.E. Moynihan, J. Polym. Sci. 19 (1956) 363.64] A. Miyake, J. Polym. Sci. 44 (1963) 223.65] A. Milani, C. Castiglioni, L. Brambilla, G. Zerbi, J. Mol. Struct. 1009 (2012)
130–140.66] D.C. McKean, Chem. Soc. Rev. 7 (1978) 399.67] M. Gussoni, C. Castiglioni, G. Zerbi, G. in: J. Chalmers, P. Griffiths (Ed.), Handbook
of Vibrational Spectroscopy, John Wiley & Sons, Chichester, 2001.68] A. Milani, C. Castiglioni, J. Phys. Chem. A 114 (2010) 624–632.69] A. Milani, D. Galimberti, C. Castiglioni, G. Zerbi, J. Mol. Struct. 976 (2010)
342–349.70] A. Milani, M. Tommasini, C. Castiglioni, Theor. Chem. Acc. 131 (2012) 1139.
Related Documents