MORI BUILDING CO.,LTD. Financial Report for the Fiscal Year Ending March 2021 (FY2020) 2021.5.28 Image of Toranomon-Azabudai Project ⒸDBox for Mori Building Co.

Welcome message from author
This document is posted to help you gain knowledge. Please leave a comment to let me know what you think about it! Share it to your friends and learn new things together.
Transcript

0
MORI BUILDING CO.,LTD.
Financial Report for the Fiscal Year Ending March 2021 (FY2020)
2021.5.28
Image of Toranomon-Azabudai ProjectⒸDBox for Mori Building Co.

1
01 Overview of Financial Results for FY2020
02 Financial Forecasts for FY2021
04 Referential Materials
03 Environmental Initiatives

2
Overview of Financial Results for FY2020(Consolidated)
(Billions of yen)
FY2019 FY2020
Revenue from operations 250.2 230.0 △20.1 △8%
Operating income 65.7 50.9 △14.8 △23%
Ordinary income 60.7 48.5 △12.1 △20%
Profit attributable to owners of parent 31.3 31.4 +0.0 +0%
FY2019 FY2020
Total assets 2,200.3 2,280.9 +80.6 +4%
Interest-bearing debt 1,401.8 1,427.5 +25.6 +2%
Equity 525.7 559.7 +34.0 +6%
Equity ratio 23.9% 24.5% +0.6% -
(After considering equity capital attributes of hybrid securities) (25.0%) (26.7%)
Net D/E ratio 1.95 1.89 △0.06 -
(After considering equity capital attributes of hybrid securities) (1.82) (1.65)
change
change

3
65.7
50.9△6.5 △0.8
△7.8
+0.1
FY2019 Leasing Propertysales
Operationof facilities
Overseas FY2020
250.2
230.0△4.6
+1.3
△16.3
+0.4
FY2019 Leasing Propertysales
Operationof facilities
Overseas FY2020
Consolidated Income Statement for FY2020
■Revenue from operations
■Operating income(Billions of yen)
(Billions of yen)
Leasing
Includes revenue gained from leasing and management and operation of real
estate, consigned operation of real estate, contracted construction, regional
heating and cooling/electricity supply, etc.
Property salesIncludes revenue gained from real estate property sales to investors and
individual customers.
Operation of facilitiesIncludes operation and management of hotels, membership clubs and golf
courses.
OverseasIncludes urban development and real estate leasing and management
businesses, etc. outside Japan.
(Billions of yen)
FY2019 FY2020
Leasing 161.7 157.1 △4.6
Property sales 40.6 41.9 +1.3
Operation of facilities 29.3 12.9 △16.3
Overseas 23.7 24.1 +0.4
Revenue from operations 250.2 230.0 △20.1 △8%
Leasing 38.7 32.1 △6.5
Property sales 28.9 28.1 △0.8
Operation of facilities 2.1 △ 5.7 △7.8
Overseas 8.3 8.4 +0.1
Operating income 65.7 50.9 △14.8 △23%
Non-operating income 6.2 7.8 +1.6
Non-operating expenses 11.2 10.2 △1.0
Ordinary income 60.7 48.5 △12.1 △20%
Extraordinary income 1.9 3.6 +1.6
Extraordinary losses 14.1 5.6 △8.4
Income before income taxes 48.5 46.5 △2.0
31.3 31.4 +0.0 +0%
change
Profit attributable to owners
of parent

4
20.4 19.1 17.323.8 26.8 29.0
33.0 36.7 39.0 39.2 38.732.1 32.5
FY2009 FY2010 FY2011 FY2012 FY2013 FY2014 FY2015 FY2016 FY2017 FY2018 FY2019 FY2020 FY2021Forecast
Forecast
Results
(Billions of yen)
FY2020 ~Segment Overview (Leasing)~
■Changes in revenue from operations ■Changes in operating income
■Changes in revenue from operations for each segment (Billions of yen)(Billions of yen)
FY2019 FY2020 changeFY2021
Forecast
Revenue from operations 161.7 157.1 △4.6 155.0
Leasing and management
and operation of real estate111.2 108.0 △3.1 -
Consigned operation of real
estate22.8 27.6 +4.7 -
Contracted construction 9.8 11.3 +1.4 -
Regional heating and
cooling/electricity supply5.3 5.3 △0.0 -
Other 12.4 4.9 △7.5 -
Operating income 38.7 32.1 △6.5 32.5
70.5 69.4 71.174.9
100.6 105.5110.6 108.6 110.6 111.4 111.2 108.0
17.0 18.0 20.534.5
31.0 18.9 15.9 17.9 20.2 19.4 22.8 27.6
5.2 6.7 6.0
8.8
8.610.0 9.5 13.6 8.7 7.3 9.8 11.3
4.6 4.9 4.7
5.0
5.15.1 4.8 4.7 5.0 5.6
5.3 5.3
12.9 12.0 9.4
10.4
5.55.5 6.4 7.8 10.5 12.4
12.4 4.9155.0
FY2009 FY2010 FY2011 FY2012 FY2013 FY2014 FY2015 FY2016 FY2017 FY2018 FY2019 FY2020 FY2021Forecast
Forecast
Other
Regional heating andcooling/electricity supply
Contracted construction
Consigned operaion ofreal estate
Leasing and management andoperation of real estate
110.5 111.2
151.0
111.8
133.8145.2
(Billions of yen)
147.5 152.9 155.2161.7156.4 157.1

5
10.0%
8.0%
6.0%
4.0% 4.0%
3.0% 3.0%2.0% 2.0%
1.0% 1.0%2.0%
0%
5%
10%
15%
FY2009 FY2010 FY2011 FY2012 FY2013 FY2014 FY2015 FY2016 FY2017 FY2018 FY2019 FY2020
Segment Overview (Leasing) ~Vacancy rate~
■ Vacancy rate of offices for lease
■Survey of Large-scale Office Building Market in Tokyo's 23 Cities
■ Vacancy rate of residential units for lease
14.0%
9.0%
8.0%
7.0%
5.0% 5.0% 5.0% 5.0%
4.0% 4.0%
6.0%
9.0%
0%
5%
10%
15%
FY2009 FY2010 FY2011 FY2012 FY2013 FY2014 FY2015 FY2016 FY2017 FY2018 FY2019 FY2020
Main Business Areas of Focus13
88
26
5668
51
28
109
53
116104
87
32
31
41
47
41
32
31
63
10
84
24
82
5645 47
114
51
9381
55
74
57
58 74
38
47
34
3
6.9
7.8
6.2
4.33.9
3.2
2.6
1.9 1.8
4.0
5.8 5.7
5.7
2.83.8
4.1
2.4
1.7
1.83.3
3.93.5
4.8
2.1
4.1
4.13.0
2.0
1.4
2.2
-10
-8
-6
-4
-2
0
2
4
6
8
10
0
50
100
150
200
250
300
350
400
'11 '12 '13 '14 '15 '16 '17 '18 '19 '20
Major business areas of central Tokyo
Supply Volume (10,000 m2)
Other Cities
Supply Volume (10,000 m2)
13
88
26
5668
51
28
109
53
116104
87
32
31
41
47
41
32
31
63
10
84
24
82
5645 47
114
51
9381
55
74
57
58 74
38
47
34
3
6.9
7.8
6.2
4.33.9
3.2
2.6
1.9 1.8
4.0
5.8 5.7
5.7
2.83.8
4.1
2.4
1.7
1.83.3
3.93.5
4.8
2.1
4.1
4.13.0
2.0
1.4
2.2
-10
-8
-6
-4
-2
0
2
4
6
8
10
0
50
100
150
200
250
300
350
400
'11 '12 '13 '14 '15 '16 '17 '18 '19 '20
Major business areas of central Tokyo
Supply Volume (10,000 m2)
Other Cities
Supply Volume (10,000 m2)
Major business areas of central Tokyo
New Demand (10,000 m2)
Other Cities
New Demand (10,000 m2)
Tokyo’s 23 cities
Vacancy Rate (%)
Major business areas of central Tokyo
Vacancy Rate (%)
Major business areas of central Tokyo
(100,000㎡-class or higher office
buildings)
Vacancy Rate (%)
13
88
26
5668
51
28
109
53
116104
87
32
31
41
47
41
32
31
63
10
84
24
82
5645 47
114
51
9381
55
74
57
58 74
38
47
34
3
6.9 7.8 6.2 4.3 3.9
3.2
2.61.9 1.8 4.05.8 5.7
5.7
2.8
3.8
4.1
2.4 1.7
1.8
3.33.9 3.5 4.8 2.1
4.1
4.1
3.0 2.0
1.4 2.2
0
50
100
150
200
250
300
350
400
'11 '12 '13 '14 '15 '16 '17 '18 '19 '20
Major business areas of central Tokyo
Supply Volume (10,000 m2)
Other Cities
Supply Volume (10,000 m2)
Major business areas of central Tokyo
New Demand (10,000 m2)
Other Cities
New Demand (10,000 m2)
Tokyo’s 23 cities
Vacancy Rate (%)
Major business areas of central Tokyo
Vacancy Rate (%)
Major business areas of central Tokyo
(100,000㎡-class or higher office
buildings)
Vacancy Rate (%)

6
Completed and Ongoing Projects
ARK Hills
“Cultural Heart of Tokyo”Roppongi Hills
“Modern Urban Village”Toranomon-Azabudai
Project
“Global Business Center”Toranomon Hills

7
Toranomon-Azabudai Project: “Hills of the future”
• This “Hills of the future” project will boast an overwhelming scale and impact. Principal construction started in August 2019 and is scheduled to finish in March 2023.
• As a comprehensive development covering a vast 8.1-hectare area, it will comprise diverse urban functions, including offices, residences, a hotel, an international school, and retail and cultural facilities.
• Under the “Modern Urban Village” concept, it will be a huge open space in the heart of Tokyo filled with lush greenery. Supported by its “Green” and “Wellness” pillars, the project will assemble diverse people in an overwhelmingly verdant environment in harmony with nature to form a new community where people can genuinely enjoy life.
• th nature.
Council of RedevelopingCitiesestablished (1989)
Urban Redevelopment Preparations Committeeestablished (1993)
1990 2000 2010 2020
City Plan approved(Sep. 2017)
Urban Redevelopment Associationapproved (Mar. 2018)
Construction started (Aug. 2019)
Plannedcompletion(Mar. 2023)
Rezoned redevelopment area(2001)
Site area Approx. 8.1ha
Ground area Approx. 63,900m2
Total floor area Approx. 861,500m2
Construction start August 2019
Planned completion March 2023
Rights conversion planapproved (Feb. 2019)
Image of view above Sakurada-doriAve. from Kamiyacho Station
Image of central square

8
Image of retail facilities
Image of food market
Site Plan
Image of international school
B-1 district
Height: approx. 270mResidences, offices, etc.
A district
Height: approx. 330m
Residences, offices, retail facilities, medical facility, school, etc.
B-2 district
Height: approx. 240mResidences, hotel, etc.
Central Square
C district
Offices, residences, retail facilities, etc.
Cross-section Plan
Toranomon-Azabudai Project: “Hills of the future”

9
Message from Shingo Tsuji, President and CEO of Mori Building"Wellness, a core concept of the Toranomon-Azabudai Project, is a global theme that has gained increased importance due in part to the COVID-19 pandemic. Collaborating with Keio University, which has been a leader in the advancement of preventive medicine through clinical and research activities, Mori Building is committed to enhancing urban wellness and contributing to the magnetic power of Tokyo, one of the world's greatest cities."
Membership program (image)
Basic Agreement with Keio University Aimed at Realizing a Healthier and More Active Society
• Keio University and Mori Building concluded a basic agreement to relocate/expand the Keio University Center for Preventive Medicine to the Toranomon-Azabudai Project site and launch the “Hills Joint Research Laboratory for Future Preventive Medicine and Wellness.”
• By providing preventive care that meets personalized needs and membership programs that connect various facilities and new preventive-medicine and wellness services based on the results of the joint research, the project will contribute to the true wellness of everyone living and working in the community and help to realize a more active society where people of any generation can lead healthier lives.

10
Message from Shingo Tsuji, President and CEO of Mori Building"Tokyo must add to its magnetic power if it is to succeed in its competition with other great cities. Mori Building is joining hands with Aman, which operates diverse world-class resorts, to provide a world-leading residential environment and hotel unlike anything ever seen in Tokyo, where people will achieve harmony with nature as well as connect with and inspire others through creativity. By realizing this new form of 'urban wellness,' Mori Building will enhance Tokyo's magnetic power."
Image of Aman Spa in Aman Residences, Tokyo for residents onlyImage of lounge in Aman Residences, Tokyo
“Aman Residences, Tokyo” and New “Janu Tokyo” Hotel BrandHighlight Toranomon-Azabudai Project
• Mori Building and Aman, the operator of diverse world-class luxury hotels and resorts, will collaborate in the Toranomon-Azabudai Project toward the launch of Aman Residences, Tokyo and Janu Tokyo, the latter a sister hotel brand from Aman. The opening of Janu Tokyo will mark as the debut of the luxurious Janu brand in Japan.
• Aman Residences, Tokyo will offer Aman's signature hospitality for extraordinarily peaceful lifestyles in vibrant central Tokyo.
• Janu Tokyo will welcome guests from around the world with its warm hospitality, spa, fitness center, and six restaurants, a cafe and bars for leisure and business gatherings.

11
Toranomon Hills Area: New International Hub and Global Business Center
Toranomon Hills
Mori TowerToranomon Hills
Residential TowerPlanned completion in
January 2022
Toranomon Hills Station Tower
(tentative name)Planned completion
in July 2023
Site area Approx. 7.5ha
Total floor space Approx. 800,000m2
Office floor space Approx. 300,000m2
Residential units Approx. 720
Retail space Approx. 26,000m2
Green space Approx. 15,000m2
Toranomon Hills area, June 2020
Toranomon HillsStation on the
Tokyo Metro Hibiya Subway Line
Opened in June 2020
Toranomon Hills
Business Tower
Opened in June 2020

12
Toranomon Hills Mori Tower
Completed in 2014
Ground area : 17,069m2
Total floor space : 244,360m2
Height : 247m/52 floorsConfiguration : Offices, retail facilities,
residences, hotel, conference facility, etc.
2015 2016 2017 2018 2019 2020 2021 2022 2023
Toranomon Hills Business Tower
Toranomon Hills Residential Tower
Toranomon Hills Station Tower (tentative name)
SHINTORA-DORI CORE
Jul.City plan decided Jan.
Redevelopment association established
Feb.Construction started
Jan.PlannedCompletion
Toranomon Hills Business Tower
Completed in January 2020
Ground area : Approx. 10,065m2
Total floor space : Approx. 172,925m2
Height : Approx. 185m/36 floorsConfiguration : Offices, retail facilities,
business incubation center, bus terminal, etc.
Toranomon Hills Residential Tower
Planned completion in January 2022
Ground area : Approx. 6,530m2
Total floor space : Approx. 121,000m2
Height : Approx. 220m/54 floorsConfiguration : Residences, retail facilities,
parenting support facilities, spa, etc.
Toranomon Hills Station Tower
(tentative name)
Planned completion in July 2023
Ground area : Approx. 13,960m2
Total floor space : Approx. 253,210m2
Height : Approx. 265m/49 floorsConfiguration : Offices, commercial
facilities, hotel, business multifunctional complex, etc.
Sept.City plan decided
Mar.Construction started
Jan.Completion
Mar.City plan decided
Nov.Redevelopment association established
Nov.Construction started Jul.
PlannedCompletion
Jul.Construction started
Sept.Completion
Toranomon Hills Area: New International Hub and Global Business Center
13
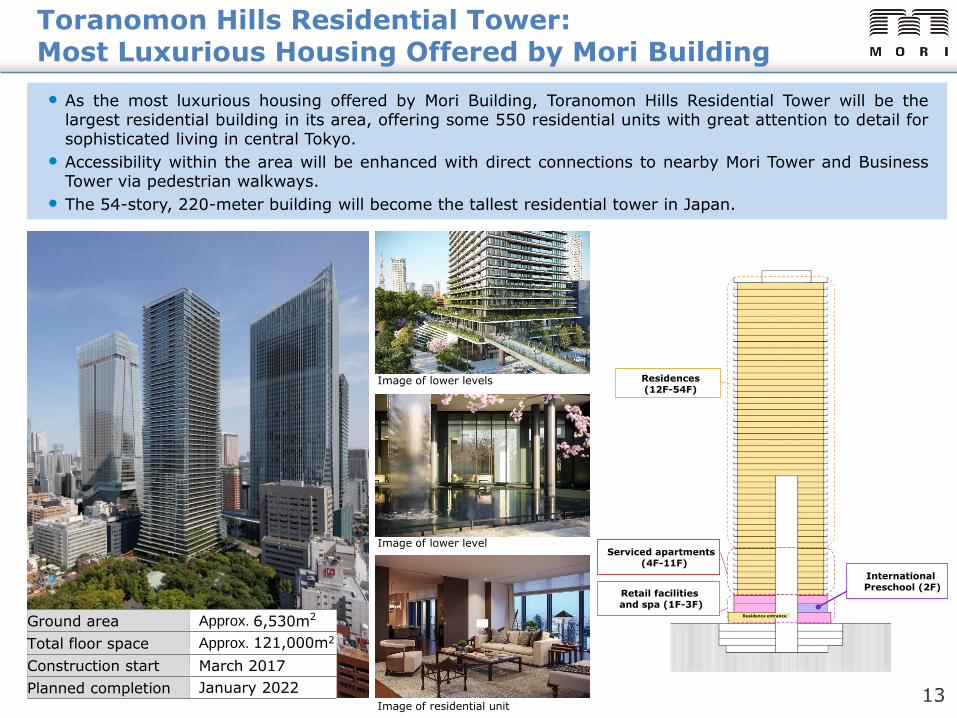
As the most luxurious housing offered by Mori Building, Toranomon Hills Residential Tower will be thelargest residential building in its area, offering some 550 residential units with great attention to detail forsophisticated living in central Tokyo.
Accessibility within the area will be enhanced with direct connections to nearby Mori Tower and BusinessTower via pedestrian walkways.
The 54-story, 220-meter building will become the tallest residential tower in Japan.
Image of lower levels
Image of residential unit
Residences (12F-54F)
Serviced apartments (4F-11F)
Retail facilities and spa (1F-3F)
International Preschool (2F)
Ground area Approx. 6,530m2
Total floor space Approx. 121,000m2
Construction start March 2017
Planned completion January 2022
Residence entrance
Image of lower level
Toranomon Hills Residential Tower:Most Luxurious Housing Offered by Mori Building

14
Construction of Toranomon Hills Station Tower began in Nov. 2019 and completion is planned in July 2023.
The tower will have a plaza that connects conveniently to Toranomon Hills Station on the Hibiya SubwayLine. A multilayer (underground, ground level and elevated deck) pedestrian network will be developed inconjunction with surrounding projects.
The building will be a 265m, 49-story skyscraper offering offices, retail facilities and a hotel.
The top floor of the A-1 district’s structure, a multifunctional complex equipped for diverse business events,exhibitions and dining, is expected to become Tokyo’s focal point for business and innovation.
Ground area Approx. 13,960m2
Total floor space Approx. 253,210m2
Construction start November 2019
Planned completion July 2023
A-1 district
A-3 district
A-2 district
Offices
Residences
Office
Hotel
Retail facilities
Retail
facilities
Plaza Plaza
Retail facilities
Route 1 express-
way
To Toranomon Hospital &Akasaka
area
To Toranomon Hills Mori Tower &
Shimbashi area
Offices
Offices
Toranomon Hills Station
Deck level
Ground level
Multifunctionalbusiness complex
Toranomon Hills Station Tower (tentative name) (completion by July 2023)
Toranomon Hills
Mori Tower
Area map
A-1 district
A-3 district
A-4district
A-2district

15
■Real estate sales business
■Residential sales business ■Changes in revenue from operations
Motoazabu Hills
Toranomon Hills Mori Tower
FY2020 ~Segment Overview (Property sales)~
(Billions of yen)
FY2019 FY2020 changeFY2021
Forecast
Revenue from operations 40.6 41.9 +1.3 49.0
32.4 37.2 +4.8 -
8.1 4.6 △3.5 -
Operating income 28.9 28.1 △0.8 26.0
Residential sales business for
individual customers
Real estate sales business for
investors
32.7
56.9
42.2
63.0
53.9
38.344.4 45.0
36.1 32.1 32.437.2
0.8
9.1
0.9
14.1
16.1
20.3 137 12.1
8.87.5 8.1
4.6
49.0
FY2009 FY2010 FY2011 FY2012 FY2013 FY2014 FY2015 FY2016 FY2017 FY2018 FY2019 FY2020 FY2021Forecast
Forecast
Residential sales forindividual customers
Real estate sales forinvestors
33.6
77.2
43.2
66.158.7
70.0(Billions of yen)
58.2 57.1
44.941.939.6 40.6

16
■Major facilities operated by Mori Building
Andaz Tokyo Grand Hyatt Tokyo
Andaz Sky Suite Presidential Suite
FY2020 ~Segment Overview(Operation of facilities)~
(Billions of yen)
FY2019 FY2020 changeFY2021
Forecast
Revenue from operations 29.3 12.9 △16.3 22.5
Hotels 21.6 7.4 △14.2 -
Membership clubs 5.5 3.7 △1.7 -
Golf courses 2.1 1.7 △0.3 -
Operating income 2.1 △ 5.7 △7.8 △ 2.0

17
■Changes in revenue from operations
■Changes in operating income
Shanghai World Financial Center
Completed in August 2008
Park Hyatt Shanghai Observatory (Sky walk 100)
474m above ground
(Billions of yen)
FY2020 ~Segment Overview (Overseas)~
(Billions of yen)
OfficesLeasing and management of offices and stores such as "Shanghai World
Financial Center", "Hang Seng Bank Tower", etc.
Hotels, etc.Operation of facilities such as "Park Hyatt Shanghai", observatory
facilities, etc.
(Billions of yen)
FY2019 FY2020 changeFY2021
Forecast
Revenue from operations 23.7 24.1 +0.4 26.5
Offices 18.5 19.7 +1.1 -
Hotels, etc. 5.1 4.3 △0.7 -
Operating income 8.3 8.4 +0.1 9.0 14.4
17.9
35.2
20.1
30.331.2
30.028.5
26.6 27.2
23.7 24.126.5
8.7 10.7
29.9
14.2
24.0 24.2 23.0 21.6 21.3 21.018.5 19.7
5.7
7.2
5.2
5.8
6.3 6.96.9
6.95.2 6.1
5.1 4.3
FY2009 FY2010 FY2011 FY2012 FY2013 FY2014 FY2015 FY2016 FY2017 FY2018 FY2019 FY2020 FY2021Forecast
Forecast
Hotels, etc.
Offices
9.0
△1.0
0.5
13.3
3.8
9.4
0.2
8.16.6
8.4 9.58.3 8.4
FY2009 FY2010 FY2011 FY2012 FY2013 FY2014 FY2015 FY2016 FY2017 FY2018 FY2019 FY2020 FY2021Forecast
Forecast
Results
18
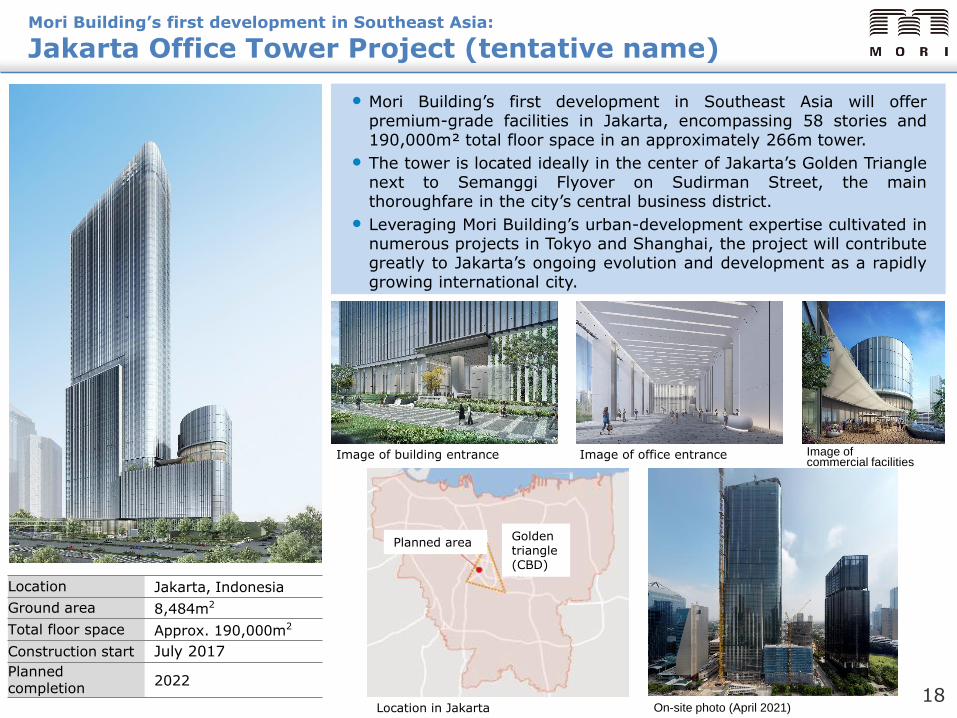
Location Jakarta, Indonesia
Ground area 8,484m2
Total floor space Approx. 190,000m2
Construction start July 2017
Planned completion
2022
Mori Building’s first development in Southeast Asia:
Jakarta Office Tower Project (tentative name)
Mori Building’s first development in Southeast Asia will offerpremium-grade facilities in Jakarta, encompassing 58 stories and190,000m² total floor space in an approximately 266m tower.
The tower is located ideally in the center of Jakarta’s Golden Trianglenext to Semanggi Flyover on Sudirman Street, the mainthoroughfare in the city’s central business district.
Leveraging Mori Building’s urban-development expertise cultivated innumerous projects in Tokyo and Shanghai, the project will contributegreatly to Jakarta’s ongoing evolution and development as a rapidlygrowing international city.
Image of building entrance Image of office entrance Image ofcommercial facilities
On-site photo (April 2021)Location in Jakarta
Planned areaGolden triangle (CBD)

19
9.6 8.8
559.7 525.7
206.7 170.8
69.5 72.9
1,488.71,608.4
284.0263.9
1,191.51,191.8
235.9210.0
42.038.3
17.221.0
376.0369.3
2,200.32,280.9 2,280.9
2,200.3
9.6 8.8
559.7 525.7
206.7 170.8
69.5 72.9
1,488.71,608.4
284.0263.9
1,191.51,191.8
235.9210.0
42.038.3
17.221.0
376.0369.3
2,200.32,280.9 2,280.9
2,200.3
FY2020As of Mar-31,2021
Cash and cash equivalents
InventoriesOther current assets
Property, plant andequipment
Intangible assets
Borrowings
Other liabilities
Equity
Bonds payable
(Billions of yen)
Investments and other assets
Non-controlling interests
FY2019As of Mar-31,2020
Summary of Consolidated Balance Sheet for FY2020
FY2019As of Mar-31,2020

20
1,122.01,185.61,235.4
1,302.7
1,713.51,746.71,819.5
1,888.51,986.9
2,089.82,200.3
2,280.9
FY2009 FY2010 FY2011 FY2012 FY2013 FY2014 FY2015 FY2016 FY2017 FY2018 FY2019 FY2020
FY2020 Total assets
(Billions of yen)

21
554.5
474.3436.7 450.3
503.0
737.4 727.6755.6
806.8838.2
913.0949.5
FY2009 FY2010 FY2011 FY2012 FY2013 FY2014 FY2015 FY2016 FY2017 FY2018 FY2019 FY2020
FY2020 Income Generating Assets Unrealized Gains
※From the annual securities report
(Billions of yen)

22
Status of Interest-bearing debt for FY2020
67.4 45.5 47.0
1,069.3 1,146.3 1,144.5
205.0210.0 235.9
379.5 376.0 369.3
962.11,025.8 1,058.2
1,341.71,401.8 1,427.5
FY2018 FY2019 FY2020
Bonds payable
Long-term borrowings
Short-term borrowings
Net interest-bearing debt
Cash and cash equivalents
(Billions of yen)

23
Changes in Net Interest-bearing debt and Net DER ※ After considering equity capital attributes of hybrid securities
688.0 677.0 694.8 709.5688.2
858.5 851.5 853.1 859.4 845.4
937.1
1,000.8 1,008.22.932.86
2.96 2.95
2.65
2.311.97 1.96 1.93
1.75 1.82 1.82
1.65
FY2008 FY2009 FY2010 FY2011 FY2012 FY2013 FY2014 FY2015 FY2016 FY2017 FY2018 FY2019 FY2020
Net interest-bearing debt Net DER
(Billions of yen)

24
Status of Equity (Ratio) for FY2020
483.1 491.2 525.7 559.7
1,503.81,598.5
1,674.61,721.2
1,986.9
2,089.8
2,200.32,280.9
24.3% 23.5% 23.9%24.5%
FY2017 FY2018 FY2019 FY2020
(Billions of yen)
Liabilities, etc.
Equity
Equity ratio

25
234.5 236.9 234.9 240.2259.4
371.5
432.2 434.4 445.0
483.1
516.2
550.7
609.7
20.98% 21.11%
19.82%19.45%
19.92%
21.68%
24.75%23.88% 23.57%
24.31%24.70% 25.03%
26.73%
FY2008 FY2009 FY2010 FY2011 FY2012 FY2013 FY2014 FY2015 FY2016 FY2017 FY2018 FY2019 FY2020
Equity Equity ratio
(Billions of yen)
Changes in Equity (Ratio)※ After considering equity capital attributes of hybrid securities

26
04 Referential Materials
03 Environmental Initiatives
01 Overview of Financial Results for FY2020
02 Financial Forecasts for FY2021

27
32.128.1
△ 5.7
8.4
32.526.0
△ 2.0
9.0
Leasing Property sales Operation offacilities
Overseas
■Revenue from operations
■Operating income
Financial Forecasts for FY2021
(Billions of yen)
FY2020
Results
FY2021
Forecastchange
Revenue from operations 230.0 247.0 +16.9
Leasing 157.1 155.0 △2.1
Property sales 41.9 49.0 +7.0
Operation of facilities 12.9 22.5 +9.5
Overseas 24.1 26.5 +2.3
Operating income 50.9 52.0 +1.0
Leasing 32.1 32.5 +0.3
Property sales 28.1 26.0 △2.1
Operation of facilities △ 5.7 △ 2.0 +3.7
Overseas 8.4 9.0 +0.5
Ordinary income 48.5 49.0 +0.4
31.4 34.0 +2.5 Profit attributable to
owners of parent

28
02 Financial Forecasts for FY2021
04 Referential Materials
01 Overview of Financial Results for FY2020
03 Environmental Initiatives

29
Environmental Certifications
Acquisition plan of certifications for new construction projects
Based on the above policy, Mori Building plans to obtain thefollowing environmental certifications.
Projects that have acquired CASBEE certification
Note: The information above is subject to change.
Policy for acquiring
environmental certifications
When constructing flagship-level buildings, Mori Building aims to secure top-levelevaluation through certifications for environmental performance and urban greenery, andthereafter strives to acquire and maintain CASBEE, LEED, etc. certifications.
Rank S (certified in 2011)
Toranomon Hills Mori Tower
ARK Hills SengokuyamaMori Tower
Toranomon Hills Business Tower
Rank S (certified in 2010) Rank S (certified in 2017)
LEED ND(まちづくり)
LEED BD+C(建物)
BGA GreenMark
CASBEE-建築(新築)
WELLCASBEE-ウェルネス
オフィス
虎ノ門ヒルズ ビジネスタワー
2020
(仮称)虎ノ門ヒルズ ステーションタワー
2023
A街区 2023
海外
ジャカルタ・オフィスタワーPJ
2021
虎ノ門ヒルズエリア
虎ノ門・麻布台プロジェクト
竣工年(予定)
総合環境認証 健康・快適性 認証
物件名称
Toranomon Hills area
Toranomon-Azabudai project
Abroad
Toranomon Hills Business Tower
Toranomon Hills Station Tower
(tentative name)
A district
The Jakarta Office Tower Project
Project nameConstructionCompletion
Environment Health and comfort
WELLBuildingStandard
CASBEE-Wellness
Office
CASBEE-for Building
(new construction)
BGA Green Mark
LEED BD+C (Building
Design and Construction)
LEED ND(Neighborhood development)
Projects and real estate certified for environmental performance
CASBEE-for Building (new
construction)
• Toranomon Hills Mori Tower (rank S)
• ARK Hills Sengokuyama Mori Tower (rank S)
• Toranomon Hills Business Tower (rank S)
CASBEEReal Estate
• Toranomon Hills Mori Tower (rank S)
• ARK Hills Sengokuyama Mori Tower (rank S)
• Hirakawacho Mori Tower (rank S)
• Roppongi Hills Mori Tower (rank S)
• ARK Mori Building (rank S)
• Atago Green Hills Mori Tower (rank S)
• Holland Hills Mori Tower (rank S)
• Akasaka Tameike Tower (rank A)
• Koraku Mori Building (rank S)
【CASBEE- for Building (new construction)】
ReceivedPlatinum-levelprecertification
ReceivedPlatinum-levelprecertification
Receivedprecertification
Receivedprecertification
Receivedprecertification

30
Environmental Achievements evaluated in LEED• Mixed-use development with diverse urban
functions • Walkable city plan centering around plaza• Electricity supply from renewable energy• City’s high energy conversion efficiency• Joint efforts with land owners in city design
Health achievements evaluated in WELL• Propagation of city planning under Mori
Building’s concept “Green and Wellness”• Greenery plan centering around plaza• Superior air environment achieved by the
use of high quality air filtration• Healthy meals offerings at café• Exercise opportunities at plaza and
pedestrian zone
LEED: Leadership in Energy & Environmental DesignLEED is a globally recognized green building rating system that focuses onthe strategy to build high-level environment for architects and cities. Itauthenticates buildings and developments which promote sustainable cleanenergy, and is considerate of one’s health, while reducing costs and capitalas well (Reference: Green Building Japan).LEED ND (Neighborhood Development) evaluates from the plan phase tothe construction phase of complex area development.
WELL Building Standard™An evaluation system that aims to create a better environment byincorporating consideration for the concept of “human health” in the design,construction and operation of living spaces. Complementing the evaluationof environmental performance by bodies such as LEED and CASBEE, this isthe world’s first building and indoorenvironmental evaluation system that focuses on the health and comfort ofthose living and working in specific environments. In particular, variousaspects of design with a potential impact on residents’ health are evaluatedand verified from a medical standpoint as well as from an environmentalengineering perspective. (Reference: Green Building Japan).
LEED
Complexes where everyone can feel fulfillment and minimize their environmental impact
Measures for the environment and employees as core corporate values
Mori Building became the first in Tokyo to receive precertification of LEED’s top Platinum-level. The acquisition of Platinum-level LEED precertification is an exceptional
case by large-scale project situated in urban centers.
Mori Building’s projects have acquired WELL certifications on the world's largest scale to provide individuals with health support and comfort. Once completed, both projects are expected to obtain WELL Platinum certifications.
Precertified top rating levels in global certifications
Environmental Certifications
WELL Building Standard
Toranomon-Azabudai Project and Toranomon Hills Area Project have been precertified underLEED and WELL global-standard certifications. Mori Building’s urban development initiatives arehighly in tune with the ideals represented in these certifications.
Confirming Mori Building’s urban development achievements world-wide

31
Utilization of Renewable Energy
Excerpt from press release
issued by Mori Building on September 2, 2019:
Mori Building has begun to supply electricity from renewablesources to tenants in the Roppongi Hills Mori Tower in Tokyothrough the utilization of Japan’s non-fossil fuel energy valuetrading market, the first initiative in Japan by an office leasingcompany to supply electricity from renewable sources to itstenants. This was made possible by the fact that RoppongiHills has its own energy plant and a registered electricityretailer, Roppongi Energy Service Co., Ltd., that operates theplant.
Mori Building Commences Supply of Electricity
from Renewable Sources to Roppongi Hills
Aiming to promote the realization of low-carbon urban environments
Compliant with global corporate initiatives such as RE100
Customers supplied non-fossil energy by Mori Building(as of November 11, 2020):
■Roppongi Hills Mori Tower8 cases
■Toranomon Hills Business Tower4 cases
Note: Includes planned cases
In addition to the above, all electricity to be supplied in the Toranomon-Azabudai project will be renewable energy, compliant with "RE100" (100% renewable energy).
After the completion of the Toranomon-Azabudai project, the renewable energy ratio* of the Mori Building Group is expected to be approximately 30%.
*Proportion of renewable energy to all electricity used by Mori Building Group in Japan, including projected energy provision at Roppongi Hills and Toranomon Hills Business Tower
Evidence of provision and transfer of renewable energy
DurationDD/MM/YY – DD/MM/YY
Amount of energyconsumptionXX kwh
Source of electricitySolar power, wind power, etc.
AreaEnergyCenter
Co-generation system and
district heating and
cooling
Office and Retail Facilities
Heat
Electricity
Electricity
Residence
Renewable energy(no CO2 emission during
power generation)
Water
power
Solar powerWind power
Fossil-fuel electricity such as fire power
(CO2 emissions during power generation)
Fossil-oriented electricity
such as fire power
Renewable energy
Non-fossil certification
Non-fossil energy trading market
【Area】
The supply of 100 percent renewable energy

32
12ha
2023
9.59ha
20202019
9.44ha
Urban Greenery
Certification cases
JHEP certification AAA(Ecosystem ConservationSociety-Japan )
ARK Hills Sengokuyama Mori ToTower, Toranomon Hills Mori Tower
ABINC certification(Association for BusinessInnovation in harmony with Nature and Community)
Roppongi Hills Cross Point
EDO-MIDORIRegistered green area(Bureau of Environment,Tokyo Metropolitan Government)
ARK Hills Sengokuyama Mori Tower
“Urban Oasis” in Social and Environmental Green Evaluation System(Organization for Landscapeand Urban Green
Infrastructure)
ARK Mori Building, Roppongi Hills Mori Tower, ToranomonHills Mori Tower
Surface temperatures at Roppongi Hills is 5℃ to 15℃ lower than those insurrounding areas.
Large-scale urban greenery
• Beginning with ARK Hills in 1986, Mori Building has been implementing large-scale greenery initiatives.
• As of 2019, green areas at major Hills properties totaled 9.59ha.
• Including future developments, these green areas are expected to expand to approximately 12ha by 2023.
Addressing Heat Island phenomenonMajor Hills properties average 42.2% greencoverage rate (Minato Ward overall average is:21.8%). Greenery helps to suppress the urbanheat-island phenomenon and lowers groundsurface temperatures compared to surroundingareas.
Creating Ecological NetworksLinking green area of each HillsProjects to foster a local ecosystem.
Greenery certifications
ARK Hills Sengokuyama Mori Tower
Toranomon HillsRoppongi HillsAtago Green HillsARK Hills
Changes in green coverage

33
02 Financial Forecasts for FY2021
03 Environmental Initiatives
01 Overview of Financial Results for FY2020
04 Referential Materials

34
The newly developed Hills Network is a digital platform that integrates comprehensive urban operationsthrough advanced digital-transformation (DX) technologies. It will steadily enhance the convenience,quality and joy of living in, working in and visiting Hills complexes and other properties managed byMori Building in central Tokyo.
Hills Network utilizes cutting-edge technologies to manage data on user attributes, usage of specificproperties and facilities, and location for unprecedentedly seamless “Hills life,” transforming eachcomplex into a thoroughly integrated space for living and working.
■ Hills Network
Hills Network for unprecedentedly seamless urban life

35
Mori Building’s president and CEO oversees groupwide health and productivity management as a businessmatter. In addition, the Human Resources Department, Health Office & Company Doctor, which also serve asthe Health and Productivity Management Promotion Secretariat, cooperate with the Working Style ReformCommittee, employee representatives and the Health Committee to develop measures for maintaining andenhancing employee health.
Health and Productivity Management
Health and Productivity Management
Mori Building has been certified as a Health & Productivity Management
Outstanding Organization FY 2021 (large enterprise category)
Mori Building carries out health and productivity management activities from the perspective of employeehealth management as a business strategy aimed at ensuring that each employee remains physically andmentally healthy to allow them to work enthusiastically. By maintaining and enhancing health, the companyreinforces the vitality and performance of both individual employees and the company overall for furthergrowth and development. Also, Mori Building fulfills its social mission to revitalize people and businessesthrough the work of creating and developing cities. Mori Building continues to advance the development ofcities where residents, workers and visitors can spend their lives in good physical and mental health.
Health and Productivity Management Declaration
Management Structure
Health and Productivity Management Promotion Secretariat
Head of Health and Productivity Management Promotion
President and CEO
Human Resources Department
Health Office & Company Doctor
Working Style Reform
Committee
Employee representatives
Health Committee
Collaboration

36
Portfolio (Major Properties)
MORI Tower Forest TowerLocation Akasaka, Minato-ku Pudong , Shanghai Motoazabu, Minato-ku Roppongi, Minato-ku Toranomon, Minato-kuCompletion date March 1986 April 1998 July 2001 October 2001 May 2002 April 2003 February 2005
Number of floors37 above ground
4 underground
46 above ground
4 underground42 above ground
2 underground
42 above ground
5 underground
29 above ground
3 underground
54 above ground
6 underground
24 above ground
2 underground
Total floor area 181,833㎡ 116,824㎡ 86,570㎡ 62,475㎡ 45,023㎡ 379,408㎡ 35,656㎡
Atago, Minato-ku
Holland Hills
Mori Tower
Roppongi Hills
Mori Tower
Name of the
property ARK Mori Building Hang Seng Bank TowerAtago Green Hills Motoazabu Hills
Forest Tower
1 2 3 4 5 6
Location Jingumae, Shibuya-ku Pudong District , Shanghai Roppongi, Minato-ku Toranomon, Minato-ku Toranomon, Minato-kuCompletion date January 2006 August 2008 August 2012 May 2014 January 2020
Number of floors6 above ground
6 underground
101 above ground
3 underground
47 above ground
4 undertground
52 above ground
5 underground
36 above ground
3 underground
Total floor area 34,062㎡ 381,600㎡ 143,426㎡ 244,360㎡ 172,925㎡
Toranomon Hills
Business Tower
Name of the
property Omotesando HillsShanghai World
Financial Center
ARK Hills
Sengokuyama
Mori Tower
Toranomon Hills
Mori Tower
7 8 9 10 11

37○:Consolidated subsidiaries ※:Affiliates accounted for using the equity method
Business of the Mori Building Group
Leasing Property sales Operation of facilities Overseas
Leasing and management
and operation of real
estate
○ Silent Partnership Roppongi
Hills Financial Corp
○ Silent Partnership AR・ONE
○ Aomi T Special Purpose
Company
○ Aomi S1 Special Purpose
Company
※ Mori Hills REIT Investment
Corporation
Consigned operation of
real estate
○ Mori Building Investment
Management Co., Ltd.
○ Mori Urban Planning
Corporation
Contracted construction Regional heating and
cooling/electricity supply
○ Roppongi Energy Service
Co., Ltd.
○ ARK Hills Heating & Cooling
Supply Co., Ltd.
○ Toranomon Energy Network
Co., Ltd.
Other
Investment, observation deck ,
forum , etc.
Real estate sales
business for investors
Residential sales
business for individual
customers
Hotel & Membership
club
○ Mori Hospitality
Corporation Golf
○ Shishido Golf Club
Co,. Ltd. Nursing home
※ Prime Stage Co,. Ltd.
Offices
○ Shanghai World Financial
Center Co., Ltd.
○ Shanghai Senmao
International Real Estate
Co., Ltd.
Hotels, etc.
○ Shanghai Hills Hotel
Management Co., Ltd.
○ Shanghai Hills Forum & City
View Co., Ltd.
○ Mori Building China
(Shanghai) Co., Ltd.
○ Shanghai World Financial
Center Investment Co., Ltd.
○ Shanghai World Financial Center
Investment No.1
(Cayman) Limited
○ Shanghai World Financial Center
Investment No.2
(Cayman) Limited
○ Shanghai World Financial Center
Investment No.3
(Cayman) Limited
〇 Mori Building Asia Pte. Ltd.

38
■ Details of bonds in issue (as of May 28, 2021)
■ Bond redemption schedule (Billions of yen)
Bond Issuance Policy, Bond Specification and Redemption Schedule
Bond IssuancePolicy
Corporate bonds will be issued in a flexible manner, taking into account the level of
other companies in the same industry and other factors, with a limit of 20% to 25% of
non-consolidated interest-bearing debt for the time being, depending on market trends.
*Excluding subordinated bonds
Issue No. Launch date Maturity date Years of maturity
(Year)Amount of bonds issued
(Billions of yen)CouponInterest
Bp againstgovernment bonds
Bp againstSWAP
14th Bond 8/8/2014 8/14/2024 10 13.0 0.861% 34.0bp 15.1bp
15th Bond 2/6/2015 2/13/2025 10 10.0 0.784% 43.0bp 16.4bp
16th Bond 4/24/2015 4/30/2027 12 10.0 1.002% 56.0bp 30.2bp
17th Bond 8/7/2015 8/13/2021 6 10.0 0.523% 39.0bp 16.3bp
18th Bond 4/20/2016 4/25/2031 15 10.0 0.800% 75.0bp 48.4bp
19th Bond 7/5/2016 7/11/2036 20 10.0 0.830% 78.0bp 66.4bp
20th Bond 10/19/2016 10/25/2021 5 12.0 0.120% 32.5bp 12.8bp
21st Bond 2/10/2017 2/16/2027 10 10.0 0.440% 34.5bp 10.0bp
22nd Bond 3/2/2018 3/8/2023 5 10.0 0.180% 30.1bp 2.9bp
23rd Bond 5/11/2018 5/17/2038 20 10.0 0.970% 44.7bp 28.0bp
24th Bond 8/10/2018 8/16/2028 10 10.0 0.460% 35.0bp 7.5bp
25th Bond 7/25/2019 7/31/2029 10 10.0 0.340% 48.6bp 26.7bp
26th Bond 11/8/2019 11/14/2029 10 15.0 0.320% 37.0bp 15.9bp
1st Subordinated bond 1/17/2019 1/31/2056 37 50.0 1.430% 158.0bp 137.0bp
2nd Subordinated bond 10/13/2020 10/19/2056 36 45.0 1.170% 127.1bp 120.0bp
Total Bond Balance - - - 235.0 - - -
22.0
10.0
23.0
10.0 10.0 10.0
25.0
10.0 10.0 10.0
0.0
5.0
10.0
15.0
20.0
25.0
30.0
FY2021 FY2022 FY2023 FY2024 FY2025 FY2026 FY2027 FY2028 FY2029 FY2030 FY2031 FY2032 FY2033 FY2034 FY2035 FY2036 FY2037 FY2038

39
Consolidated Balance Sheet for FY2020
(millions of yen)
Account name change Account name change
Current assets Current liabilities
Cash and deposits 340,998 317,345 △ 23,653 10,748 10,195 △ 553
10,200 9,633 △ 566 Short-term borrowings 45,517 47,069 1,552
Short-term investment securities 35,084 52,000 16,915 20,000 22,950 2,950
Inventories 17,232 21,055 3,823 Income taxes payable 9,462 2,563 △ 6,899
Other 31,884 28,771 △ 3,113 Provision for bonuses 1,596 1,315 △ 281
Allowance for doubtful accounts △ 36 △ 33 2 Other 31,600 50,278 18,678
Total current assets 435,364 428,772 △ 6,592 Total current liabilities 118,926 134,373 15,446
Fixed assets Long-term liabilities
Property, plant and equipment Bonds payable 190,000 213,000 23,000
Buildings and structures 241,378 237,872 △ 3,506 Long-term borrowings 1,146,376 1,144,528 △ 1,847
12,274 11,541 △ 733 83,962 81,266 △ 2,695
7,259 6,876 △ 382 2,029 1,575 △ 453
Land 440,674 485,593 44,919 Retirement benefit liability 1,727 1,745 18
Construction in progress 126,674 124,058 △ 2,616 903 938 35
Real estate in progress 109,038 153,520 44,482 3,500 3,500 -
Beneficial interests in real estate trust 549,717 587,222 37,505 Deferred tax liabilities 114,822 123,355 8,533
Other 1,740 1,722 △ 17 Other 3,547 7,267 3,720
1,488,758 1,608,408 119,650 Total long-term liabilities 1,546,867 1,577,178 30,310
1,665,794 1,711,551 45,757
Intangible assets
Leasehold right 54,572 55,486 914
Goodwill 12,084 11,896 △ 188
Other 2,892 5,601 2,708 Shareholders' equity
Total intangible assets 69,550 72,985 3,434 Capital stock 79,500 79,500 -
Capital surplus 22,516 22,539 23
Investments and other assets Retained earnings 428,398 443,610 15,211
Investment securities 34,398 39,799 5,400 Treasury stock △ 11,507 △ 11,507 -
Equity investments 82,946 24,751 △ 58,195 Total shareholders' equity 518,907 534,142 15,235
Long-term loans receivable 43,565 58,716 15,150
Retirement benefit assets 317 1,065 748 4,187 10,688 6,500
Deferred tax assets 676 140 △ 536 Deferred gains or losses hedges △ 730 △ 489 240
Other 45,365 47,558 2,192 3,541 15,134 11,593
△ 564 △ 1,201 △ 637 △ 183 275 458
206,705 170,828 △ 35,876 6,815 25,609 18,793
Total fixed assets 1,765,013 1,852,222 87,208 Non-controlling interests 8,860 9,691 830
534,583 569,443 34,859
Total assets 2,200,378 2,280,994 80,616 2,200,378 2,280,994 80,616
Total net assets
Total liabilities and net assets
Provision for dismantling cost of fixed assets
Total investments and other assets
Total Property, plant and equipment
Total accumulated other comprehensive
income
Notes and accounts receivable - trade
Allowance for doubtful accounts Remeasurements of defined benefit plans
Foreign currency translation adjustment
Valuation difference on available-for-sale
securities
Accumulated other comprehensive
income
Net assets
Assets Liabilities
Total liabilities
FY2019
As of Mar-31,2020
FY2020
As of Mar-31,2021
FY2019
As of Mar-31,2020
FY2020
As of Mar-31,2021
Notes and accounts payable - trade
Current portion of bonds payable
Leasehold and guarantee deposits received
Long-term deposits received
Provision for retirement benefits for directors
Tools, furniture and fixtures
Machinery, equipment and vehicles

40
Consolidated Income Statement for FY2020
Account name FY2019 FY2020 change
250,222 230,082 △ 20,139
158,209 156,957 △ 1,252
92,012 73,125 △ 18,886
26,263 22,204 △ 4,058
65,749 50,920 △ 14,828
677 738 60
570 780 210
2,031 1,927 △ 104
1,673 1,659 △ 13
- 819 819
1,285 1,962 677
6,237 7,888 1,650
7,809 7,769 △ 39
747 - △ 747
2,362 1,263 △ 1,098
342 1,216 873
11,261 10,250 △ 1,011
60,724 48,558 △ 12,166
1,840 2,078 237
- 1,375 1,375
131 184 53
1,971 3,637 1,665
274 147 △ 126
0 1,800 1,800
8,797 413 △ 8,384
3,500 - △ 3,500
- 3,045 3,045
1,534 260 △ 1,273
14,106 5,667 △ 8,438
48,590 46,528 △ 2,062
15,645 8,514 △ 7,131
954 5,947 4,993
31,990 32,067 76
622 649 27
31,368 31,417 49
Non-operating income
Other
Extraordinary losses
Income before income taxes
Income taxes - current
Income taxes - deferred
Gain on sales of fixed assets
Other
Extraordinary income
Loss on sales of fixed assets
Loss on reduction of fixed assets
Loss on COVID-19
Foreign exchange losses
Other
Dividend income
Compensation income
Equity in earnings of affiliates
Subsidy income
Other
Interest income
Revenue from operations
Operating gross profit
Operating income
Selling, general and administrative
expenses
Cost of revenue from operations
Interest expenses
Finance charges and fees
Profit attributable to non-controlling
interests
Profit attributable to owners of
parent
Profit
Ordinary income
Non-operating expenses
Impairment loss
Provision for dismantling cost of fixed assets
Burden charge receivable
Description regarding future forecast in this report are based on
information available on the day of the announcement, as analyzed and
judged by Mori Building. Therefore, these forecasts are subject to inherent
risks and uncertainty, and actual results may differ due to changes in
various factors.
Related Documents