By David Weild and Edward Kim June 2010 Capital Markets Series Market structure is causing the IPO crisis — and more

Welcome message from author
This document is posted to help you gain knowledge. Please leave a comment to let me know what you think about it! Share it to your friends and learn new things together.
Transcript
8/8/2019 IPO Crisis June 2010 FINAL
http://slidepdf.com/reader/full/ipo-crisis-june-2010-final 1/32
By David Weild and Edward Kim June 2010
Capital Markets Series
Market structure is causingthe IPO crisis — and more

8/8/2019 IPO Crisis June 2010 FINAL
http://slidepdf.com/reader/full/ipo-crisis-june-2010-final 2/32
Contents
1 Preface
3 Introduction5 History of the IPO market
9 Decline of the IPO market
15 Effect on capital markets
19 Conclusion
21 The Perfect Storm
25 About the authors
27 About Grant Thornton LLP

8/8/2019 IPO Crisis June 2010 FINAL
http://slidepdf.com/reader/full/ipo-crisis-june-2010-final 3/32
Market structure is causing the IPO crisis — and more 1
Market structure is causing the IPO crisis — and more bringscurrent two previously published studies, Why are IPOs inthe ICU? and Market structure is causing the IPO crisis.Grant Thornton LLP has studied the decimation of the U.S.capital markets structure, the demise of the IPO market and,with the release of A wake-up call for America, the systemicdecline in the number of publicly listed companies. We haveprovided analysis and insights and offered ideas for a new,opt-in stock market capable of reinvigorating the U.S. IPOmarket and stimulating job creation.
Grant Thornton has discussed our findings with a wide rangeof key market participants, including current and former SECsenior staffers, investment bank executives and the venture capitalcommunity. In fact, our IPO study was cited in the “NVCA 1 4-Pillar Plan to Restore Liquidity in the U.S. Venture Capital
Industry,” which was released on April 29, 2009. As our studiesgained visibility, the topic and our conclusions gained favor withthe financial news media and with members of Congress andtheir staffers. On December 16, 2009, Sen. Ted Kaufman,D-Del., entered Market structure is causing the IPO crisis and A wake-up call for America into the public record during hisspeech: “Kaufman calls decline in IPOs ‘choke point’ to jobcreation, economic recovery.”
The economic climate is ever changing. To receive periodicreports on issues relevant and timely to today’s capitalmarkets, visit www.Grant Thornton.com/subscribe andselect the Capital Markets Series.
Special thanks go to:• David Coolidge, vice chairman of
William Blair & Company• Dixon Doll, co-founder of Doll
Capital Management and formerchairman of the NVCA
• Mike Halloran, former deputy chiefof staff and counselor to SECChairman Christopher Cox andcurrent partner at Haynes andBoone LLP
• Harry Kellogg, vice chairman,Silicon Valley Bank
• Pascal Levensohn, founder ofLevensohn Venture Partners andmember of the Counsel of ForeignRelations
• Chuck Newhall, one of thefounders of New EnterpriseAssociates (NEA) and “dean” ofthe venture capital business
• Duncan Niederauer, chairman andCEO of NYSE Euronext
• Ken Wilcox, president and CEO,SVB Financial Group
Preface
1 National Venture Capital Association

8/8/2019 IPO Crisis June 2010 FINAL
http://slidepdf.com/reader/full/ipo-crisis-june-2010-final 4/32
2 Market structure is causing the IPO crisis — and more
8/8/2019 IPO Crisis June 2010 FINAL
http://slidepdf.com/reader/full/ipo-crisis-june-2010-final 5/32
Introduction
As Congress battles over the shape of financial reform, will itaddress the lack of a properly functioning market structure? Themarket for underwritten IPOs, given its current structure,is closed to 80 percent of the companies that need it. In fact,since 2001 the U.S. has averaged only 126 IPOs per year, withonly 38 in 2008 and 61 in 2009 — this compared to the headinessof 1991–2000 with averages of 530 IPOs per year. Companiescan no longer rely on the U.S. capital markets for an infusion of capital, nor can they turn to credit-strapped banks. The result?Companies are unable to expand and grow — they are unableto innovate and compete — so they are left to wither and die,contributing to today’s high unemployment rate.
During the time since our studies were released,Grant Thornton has received a number of intriguing questions.Market structure is causing the IPO crisis — and more addresses
these questions and presents updated data through December2009, while examining the continued lack of a properlyfunctioning IPO and small cap stock market. The systemicfailure of the U.S. capital markets to support healthy IPOand robust small cap markets inhibits our economy’s abilityto innovate, create jobs and grow. At a time when America isstruggling with double-digit unemployment, the failure of theU.S. capital markets structure can no longer be ignored.
Lessons learned1. IPO Crisis worsens — Calendar year 2009 represented oneof the worst IPO markets in 40 years. Given that the size of the
U.S. economy, in real GDP terms, is over three times what it was40 years ago, this is a remarkable and frightening state of affairs.Only 61 companies went public in the United States in 2009 ,and the trend that disfavors small IPOs and small companieshas continued. The median IPO in 2009 was $140 million in size— quite a contrast to 20 years ago when Wall Street commonlyexecuted $10 million IPOs that succeeded.
2. Small business impact — The ramifications of the IPOCrisis extend well beyond the venture capital industry and affect“mom and pop” businesses as well. The non-venture capital andnon-private equity segment of the market historically (over morethan 20 years) has represented more than 50 percent of all IPOs.The lack of an IPO market is thus hurting small business bycutting off a source of capital (capital realized from going public)that in turn would drive reinvestment and entrepreneurship in theUnited States. We heard this repeatedly in our discussions.
3. Market structure is at fault — The IPO Crisis isprimarily a market-structure-caused crisis, the roots of whichdate back at least to 1997. The erosion in the U.S. IPO marketcan be seen as the perfect storm of unintended consequencesfrom the cumulative effects of uncoordinated regulatory changesand inevitable technology advances — all of which stripped away
the economic model that once supported investors and small capcompanies with capital commitment, sales support and high-quality research.
4. Casino capitalism — We have interacted withmanagement and portfolio managers of a number of classic,long-term investment firms, including Capital Guardian,Delaware Asset Management, Kaufman Funds, T. Rowe Priceand Wasatch Advisors, that invest in small cap companies.These investors confirm that the current stock market modelforces Wall Street to cater to high-frequency trading accountsat the expense of long-term investors, and that Wall Street isincreasingly out of touch with the interests and needs of long-
term equity investors. Specifically, we have heard that the qualityof research on Wall Street has deteriorated dramatically while, incomparison, institutional investors’ quality of in-house researchis now “much better.” We also have heard that more investment-oriented portfolio managers are more likely to be treated as “C”accounts (Wall Street may rank accounts as “A,” “B” or “C”;most resources are given to the so-called “A” accounts).
Market structure is causing the IPO crisis — and more 3

8/8/2019 IPO Crisis June 2010 FINAL
http://slidepdf.com/reader/full/ipo-crisis-june-2010-final 6/32
4 Market structure is causing the IPO crisis — and more
5. Crisis started before Sarbanes-Oxley (2002) —The IPO Crisis was not induced by Sarbanes-Oxley, RegulationFair Disclosure or NASD Rule 2711 (separation of banking andresearch). Each of these changes occurred well after the IPOCrisis was underway. While we believe these well-intentionedinvestor protections may have raised the costs of goingpublic (and taking companies public), they did not cause the
abandonment of the investment-centric Wall Street model (thatalso supported small cap companies and thus IPOs) in favor of ahigh-frequency trading model.
6. Origins of crisis obscured by Dot-Com Bubble (1997) — The IPO Crisis began during, but was hidden by, the Dot-Com Bubble. We see a clear decline in the number of smallerIPOs beginning in the 1996/1997 time frame, which alignsperfectly with the introduction of the Manning and OrderHandling Rules. In addition, we spoke with the CEO of afirm that was active in small cap IPOs in the heart of that timeframe. He shared that “the handwriting was on the wall that thecombination of trading changes that were being contemplatedwas going to destroy support for small cap stocks.”
7. This equity crisis exacerbates the credit crisis — Goodcredit starts with a layer of equity. Companies are less able toattract debt capital or credit when they have inadequate equitycapital. The IPO Crisis is creating an equity crisis companionthat is exacerbating the credit crisis.
8. A dysfunctional IPO market fuels unemployment — Inaddition to negatively impacting the number of publicly listed
companies in the United States, our current market structureis having a deleterious effect on job creation. When companiescannot raise capital efficiently — or at all — they are deprived of their ability to acquire the assets and human resources they needto grow their businesses. If we want to stop this vicious cycle of rising unemployment and its devastating impact on U.S. citizens,we must take steps now to revive our IPO markets.
In addition to negatively impacting thenumber of publicly listed companies in theUnited States, our current market structureis having a deleterious effect on job creation.
2007
A dysfunctional IPO market contributes to increased unemployment.
Source: Grant Thornton LLP, Dealogic and U.S. Department of LaborData includes corporate IPOs as of December 31, 2009, excluding funds, REITs, SPACs and LPs.
0%1998 1999 2000 2001 2002 2003 20041991 1992 1993 1994 1995 1996 1997 2005 2006 2008 2009
5%
3%
1%
2%
4%
10%
7%
6%
8%
9%
500
300
100
200
400
700
600
800
900
U.S. IPOs Annual U.S. unemployment rate
Annual U.S. unemployment rate U.S. IPOs

8/8/2019 IPO Crisis June 2010 FINAL
http://slidepdf.com/reader/full/ipo-crisis-june-2010-final 7/32
Market structure is causing the IPO crisis — and more 5
Does the effect of penny stocks alter this view ofthe IPO landscape?Penny stock IPOs are generally defined as IPOs that are pricedat less than $5 per share (the minimum price generally requiredfor listing on the NYSE and NASDAQ). As it turns out, whilethe absolute number of penny stock IPOs was elevated duringthe 1990s, penny stock IPOs represented significantly less than10 percent of small IPOs (Exhibit 1). Penny stocks have hadlittle, if any, effect on the small IPO market.
History of the IPO market
Let’s take a look at the IPO market that preceded the Dot-Com Bubble of 1996 (see Exhibit 1). The Pre-Bubble periodtraded about the same number of IPOs as the Dot-Com Bubbleperiod,2 yet the Pre-Bubble period had over four times moreIPOs than the Post-Bubble period. On average, there were 520IPOs per year leading up to the Bubble; you have to wonderwhy, since then, the average number of IPOs has fallen by 75percent to 126 IPOs per year.
The IPO market is brokenIn the last decade the number of IPOs has fallen dramatically, specifically deals less than $50 million in proceeds.
Number of Initial Public Offerings800
600
400
200
01991 1992 1993 1994 1995 1996 1997 1998 1999 2000 2001 2002 2003 2004 2005 2006 2007
Pre-Bubble Bubble Post-Bubble
Source: Dealogic, Capital Markets Advisory PartnersData includes corporate IPOs as of December 31, 2009, excluding funds, REITs, SPACs and LPs*Christie, William G., and Schultz, Paul H., “Why do NASDAQ Market Makers Avoid Odd-Eighth Quotes?”Journal of Finance , Vol. 49, No. 5, 1994.
A B D E F G H I
Deal size < $50 million
Price/share < $5.00
Deal size >= $50 million
A Christie-Schultz study*B First online brokerageC New Order Handling RulesD Online brokerage surges
and stock bubble inflates;Gramm-Leach-Bliley Act
E Regulation FDF DecimalizationG Sarbanes-Oxley ActH Global Research Analyst
Settlement
I Regulation NMS
520 averageIPOs/year Pre-Bubble
539 averageIPOs/year Bubble
126 averageIPOs/year Post-Bubble
2008 2009C
Exhibit 1
2 Contrary to popular opinion, the number of IPOs during the Bubble was similar to the number of IPOs in the five years leading up to the Bubble. However, the average proceeds per IPO nearlytripled during the Bubble, with the proceeds directed at very early-stage businesses by historical standards.

8/8/2019 IPO Crisis June 2010 FINAL
http://slidepdf.com/reader/full/ipo-crisis-june-2010-final 8/32
While it is impossible to establish cause and effect, it isreasonable to hypothesize that the Dot-Com Bubble maskedan underlying pathology: the explosive growth in sub-$25commission-per-trade, self-directed online brokerage accounts
brought unprecedented investment into stocks, helped to causethe Bubble and destroyed the very best stock marketing enginethe world had ever known. Retail stockbrokers were chasedfrom the no-longer-sustainable $250 (and higher) commission-per-trade business of traditional stockbrokerage to becomingfee-based financial advisors (asset gatherers).
The so-called competition of ideas, wherein stockbrokerswould look for the best available stock ideas for their clients, waskilled by online brokerage. Unfortunately, the significance of this loss may have been masked by the headiness of the Bubbleand the carnage following the correction.
Online brokerage accounts proliferateThe first online brokerage accounts were launched in 1996,beginning with Charles Schwab and Co., Inc. and quicklyfollowed by Datek Online Brokerage Services LLC, E*Trade
Financial, Waterhouse Securities Inc. and numerous others.Initial brokerage fees were around $25 per trade (soon to golower), putting the whole advice-based brokerage industry,with fees of $250 and higher, on notice. Under the theory thatE*Trade would be a pretty fair proxy for levels of activity in theonline brokerage industry overall, we reviewed E*Trade 10-Ksto chart the number of online brokerage accounts opened atE*Trade (see Exhibit 2).
6 Market structure is causing the IPO crisis — and more
“By killing the IPO goose that laid the golden egg of U.S.economic growth, technology, legislation and regulationundermined investment in small cap stocks, drovespeculation and killed the best IPO market on earth.”– David Weild, Senior Advisor at Grant Thornton LLP, Capital Markets
Exhibit 2
Did online brokerage help undermine the U.S. equities market?The Dot-Com Bubble (1996 through 2000) masked the IPO crisis.
Index value (January 1991 = 100%)1200%
100%1991 1992 1993 1994 1995 1996 1997 1998 1999 2000 2001 2002 2003 2004 2005 2006 2007 2008 2009
Source: NASDAQ.com and NYSE.com*Christie, William G., and Schultz, Paul H., “Why do NASDAQ Market Makers Avoid Odd-Eighth Quotes?”Journal of Finance , Vol. 49, No. 5, 1994.
1000%
900%
600%
400%
200%
300%
500%
700%
800%
1100%
91,000 in 1996
225,000 in 1997
544,000 in 1998
1,551,000 in 1999
2,952,000 in 2000
3,511,941 in 2001 Number of E*Trade accounts(10-K Information)
S&P 500
NASDAQDow 30
A Christie-Schultz study*B First online brokerageC New Order Handling RulesD Online brokerage surges
and stock bubble inflates;Gramm-Leach-Bliley Act
E Regulation FDF DecimalizationG Sarbanes-Oxley ActH Global Research Analyst
SettlementI Regulation NMS
A B D E F G H IC

8/8/2019 IPO Crisis June 2010 FINAL
http://slidepdf.com/reader/full/ipo-crisis-june-2010-final 9/32
Market structure is causing the IPO crisis — and more 7
If small companies can be sold to large companies, whyshould we care about whether or not the IPO market can befixed? For starters, a structurally compromised IPO marketleaves a lot of shareholder return, economic growth and jobformation on the table. No crystal ball can predict whichcompanies are acquired before their prime. Even AT&T, Disneyand General Electric all went public once. Some IPOs are tiny —
mighty Intel Corporation went public in 1971 with an $8 millionIPO and a mere $53 million valuation. Big corporations areeating our young. The young starve for capital before they havethe opportunity to reach adulthood, so their true potential willnever be known.
More troubling perhaps is how the lack of an IPO market hascaused venture capitalists to avoid financing some of the more far-reaching and risky ideas that have no obvious Fortune 500 buyer.Gone are the days when most venture capitalists would willinglypioneer new industries and technologies (e.g., semiconductors,computers and biotechnology) that have no obvious outlet otherthan the IPO market. Today, the first question most venturecapitalists ask of a potential portfolio investment is “Who are thenatural strategic buyers for your company or idea?” If the answeris “no one” — as it might have been in 1983 when Genentechwas the first biotech company to go public — the present-dayGenentechs likely will never be funded.
Venture capital retreatsInterestingly, the Johnny Appleseed for the IPO market —namely the venture capital industry — raised many times morecapital during and after the Dot-Com Bubble (see Exhibit 3)than it did in the years leading up to the Dot-Com Bubble.
It can take, on average, five to six years3 for a successfulventure-funded company to execute an IPO. The data in
Exhibit 3 reveals that the time has passed for an expected rebirthin the U.S. IPO market. Simply stated, a U.S. economy with anabundance of venture capital should have produced over 500IPOs every single year for each of the last four years — that,however, is not the reality.
It’s no mystery to people who work in the venture capitalindustry that in order to drive returns for investors in theirfunds, they’ve monetized returns by seeking “liquidityevents” away from the public markets. While there is an arrayof liquidity options — including alternative listing venues,such as the NASDAQ Portal, the AIM (London) or the TSX(Canada) — most of these options have their own limitationsand satisfy only a small fraction of liquidity needs. As a result,most companies today never make it public. Instead, the exitworkhorse of venture capital is now the sale of a portfoliocompany to mostly strategic (large corporate) acquirers.
3 According to the NVCA, the median age of a venture-backed company at IPO hit 8.6 years in 2007, the longest “gestation period” on record dating back to 1991.
The number of IPOs is depressed Post-Bubble despite higher levels of venture capital raisedThe number of venture-funded IPOs should be at an all-time high given that the amount of venture capital raised post-1996 far exceeds that raised pre-1996.
Source: National Venture Capital Association Web site
Exhibit 3
Venture capital raised$28 billion Pre-Bubble
Venture capital raised$243.6 billion Bubble
Venture capital raised$218.2 billion Post-Bubble
Venture Capital raised ($Billions)
$0
1991 1992 1993 1994 1995 1996 1997 1998 1999 2000 2001 2002 2003 2004 2005 2006 2007 2008 2009
$100
$60
$20
$40
$80
$120
Pre-Bubble Bubble Post-Bubble
8/8/2019 IPO Crisis June 2010 FINAL
http://slidepdf.com/reader/full/ipo-crisis-june-2010-final 10/32
8 Market structure is causing the IPO crisis — and more
2007
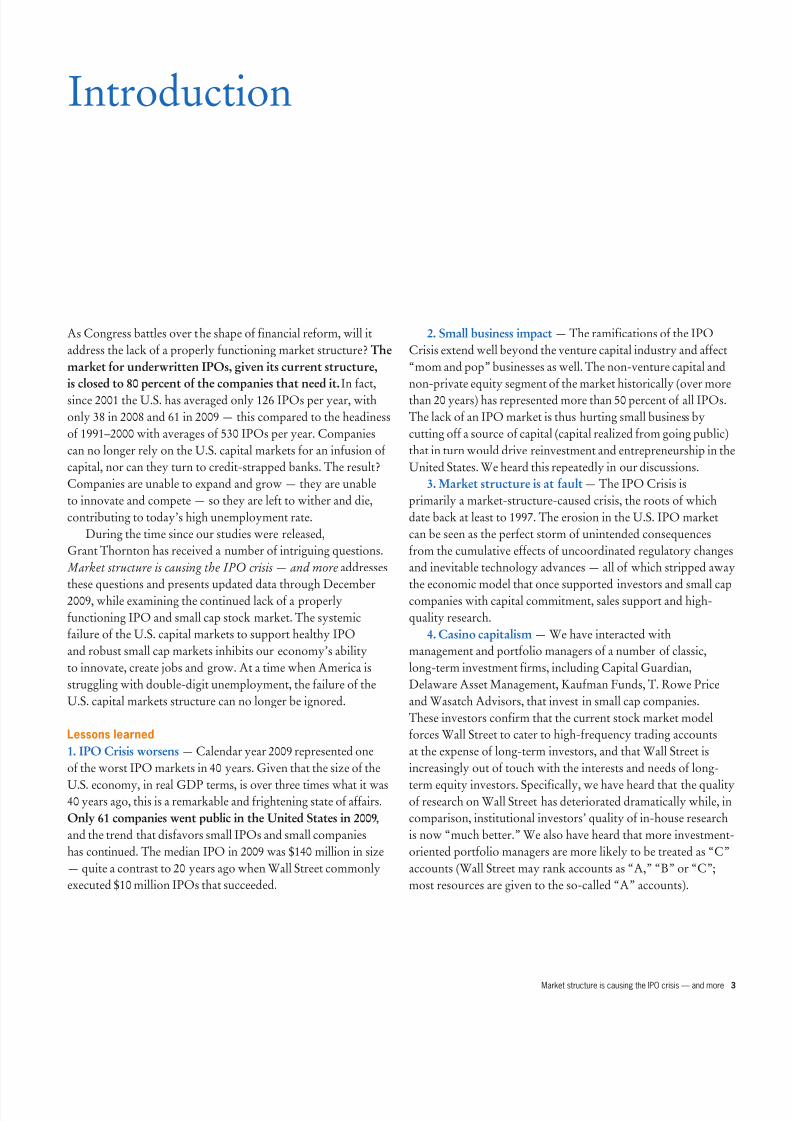
Private equity firms take one company public for every company they take private, maintaining the equilibrium between PE-backed IPO andPE-led public-to-private transactions.
Source: PitchBook Data, Inc.
Exhibit 4
0
1998 1999 2000 2001 2002 2003 2004 2005 2006 2008 2009
100
60
20
40
80
PE-led Public-to-Private PE-backed IPOs
As venture-backed activity has declined, much of what wehave seen in the new issue market revolves around private-equity-sponsored IPOs. We believe these transactions, whichare larger in size and capitalization and frequently involvewell-known brand names, tend to skew the public perceptionof the health of the IPO market. The IPOs last year of severalprominent private-equity-backed companies led many in thepopular press to conclude that the markets were again fertile fornew issues. The reality, however, is that these larger transactionsmasked the underlying weakness in the broader IPO market.
“One big misconception is that theexplosive growth in private equity hassiphoned off companies from the publicmarkets. While the level of IPO andpublic-to-private by private equity firmsincreased from 2004 to 2007, the ratio of IPO to public-to-private activity held fairlyconstant. Public-to-private transactions byprivate equity firms account for a minorityof delisting activity.”– Edward Kim, Senior Advisor at Grant Thornton LLP, Capital Markets

8/8/2019 IPO Crisis June 2010 FINAL
http://slidepdf.com/reader/full/ipo-crisis-june-2010-final 11/32
Market structure is causing the IPO crisis — and more 9
When the small IPO all but disappears,it is fair to say that the market is brokenand needs to be fixed.
Decline of the IPO market
Companies stay privateAll large companies start small. Many more small companieswant to access small amounts of equity capital than do largeones. So, when the small IPO all but disappears, it is fair to saythat the market is broken and needs to be fixed.
As you can see in Exhibit 5, small IPOs — those under $25million in size — suffered a rapid decline from 1996 to 2000.Interestingly, the small IPOs were seeing steady downwardpressure at the same time that online brokerage was boomingand displacing stockbrokers. Sarbanes-Oxley didn’t come intoplay until later in 2002. So while Sarbanes-Oxley did increase thecosts and time required to go public, it is a bit of a red herring inthat it is only one factor, and probably not the major factor, inthe demise of the IPO market.
Exhibit 5
Online brokerage surges and Order Handling Rules are imposed, causing decline in small IPOsOnline brokerage rages from 1996-1999; Order Handling Rules are imposed in 1997; IPOs raising less than $25 million decline sharply from 1996-2000;Sarbanes-Oxley was not implemented until 2002. Number of Initial Public Offerings
Source: Dealogic, Capital Markets Advisory PartnersData includes corporate IPOs as of December 31, 2009, excluding funds, REITs, SPACs and LPs*Christie, William G., and Schultz, Paul H., “Why do NASDAQ Market Makers Avoid Odd-Eighth Quotes?”Journal of Finance , Vol. 49, No. 5, 1994.
A Christie-Schultz study*B First online brokerageC New Order Handling RulesD Online brokerage surges
and stock bubble inflates;Gramm-Leach-Bliley Act
E Regulation FDF Decimalization
G Sarbanes-Oxley ActH Global Research AnalystSettlement
I Regulation NMS
01991 1992 1993 1994 1995 1996 1997 1998 1999 2000 2001 2002 2003 2004 2005 2006 2007 2008 2009
A B D E F G H I
400
250
150
50
100
200
300
350
C
8/8/2019 IPO Crisis June 2010 FINAL
http://slidepdf.com/reader/full/ipo-crisis-june-2010-final 12/32
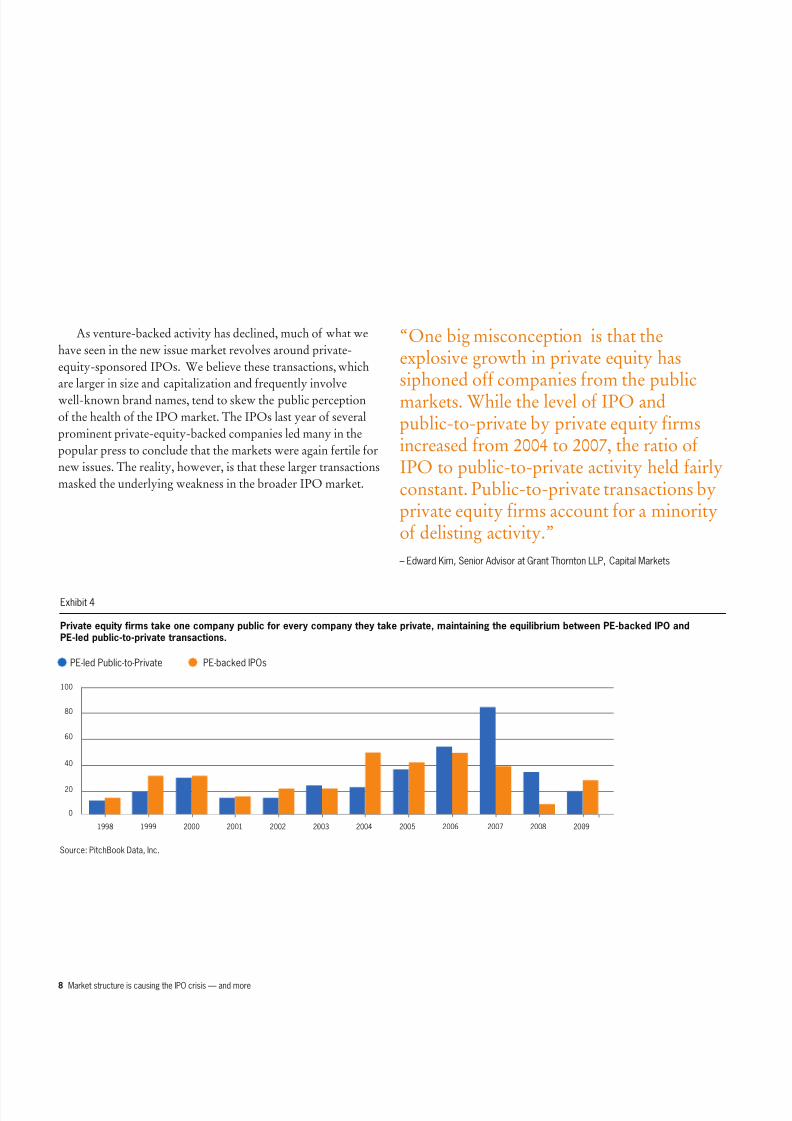
Exhibit 6
Perfect Storm pressures small IPOs as the number of transactions falls markedlyFrom 1991 to 1997 nearly 80% of IPOs were smaller than $50 million. By 2000 the number of sub-$50 million IPOshad declined to only 20% of the market.
Percent of total IPOs
Source: Dealogic, Capital Markets Advisory PartnersData includes corporate IPOs as of December 31, 2009, excluding funds, REITs, SPACs and LPs*Christie, William G., and Schultz, Paul H., “Why do NASDAQ Market Makers Avoid Odd-Eighth Quotes?”Journal of Finance , Vol. 49, No. 5, 1994.
0%
80%
50%
30%
10%
20%
40%
60%
70%
90%
100%
A Christie-Schultz study*B First online brokerageC New Order Handling RulesD Online brokerage surges
and stock bubble inflates;Gramm-Leach-Bliley Act
E Regulation FDF DecimalizationG Sarbanes-Oxley ActH Global Research Analyst
SettlementI Regulation NMS
1991 1992 1993 1994 1995 1996 1997 1998 1999 2000 2001 2002 2003 2004 2005 2006 2007 2008 2009A B D E F G H I
Transactions raising less than $50 million
Transactions raising at least $50 million
C
< $50 million
$50 million adjusted for CPI
>= $50 million
10 Market structure is causing the IPO crisis — and more
Inflation-adjusting IPO sizes would paint a rosier small-IPOpicture — wouldn’t it?Several readers of our prior studies posited that we had ignored
inflation in our discussions. Upon analyzing the impact of inflation, we found that it was not material to the conclusionsreached in our studies (Exhibit 6). A $10 million IPO in 1991would “only” increase to a $15.66 million IPO by the end of 2009 when adjusted for inflation (CPI has grown by 2.52 percent(compounded annual rate) from 1991 to 2009). Similarly, from1991 to year-end 2009, a $25 million IPO would inflate to $39.15million, and a $50 million IPO would inflate to $78.30 million.In other words, if investment banks were encouraging minimumIPO sizes of $8 million in 1991 and $75 million in 2009, then theinflation-adjusted minimum IPO size has increased by a factorof 6x. We refer to this as the “market structure effect” of raising
the bar to become a public company.
“Another common criticism is that inflationaccounts for the demise of the small IPO.
This is false. The demise of the small IPO isdue to changes in market structure and canbe seen even in the inflation-adjusted data.”– David Weild, Senior Advisor at Grant Thornton LLP, Capital Markets
8/8/2019 IPO Crisis June 2010 FINAL
http://slidepdf.com/reader/full/ipo-crisis-june-2010-final 13/32
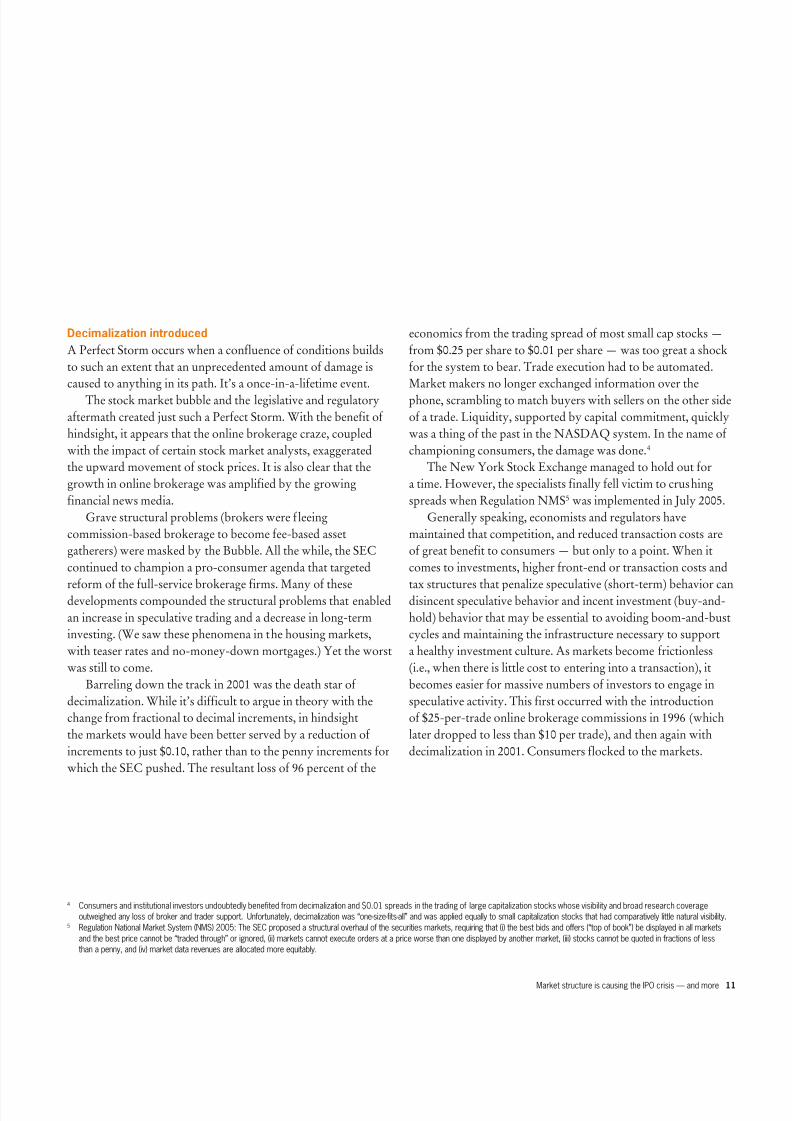
Decimalization introducedA Perfect Storm occurs when a confluence of conditions buildsto such an extent that an unprecedented amount of damage iscaused to anything in its path. It’s a once-in-a-lifetime event.
The stock market bubble and the legislative and regulatoryaftermath created just such a Perfect Storm. With the benefit of hindsight, it appears that the online brokerage craze, coupledwith the impact of certain stock market analysts, exaggeratedthe upward movement of stock prices. It is also clear that thegrowth in online brokerage was amplified by the growingfinancial news media.
Grave structural problems (brokers were fleeingcommission-based brokerage to become fee-based assetgatherers) were masked by the Bubble. All the while, the SECcontinued to champion a pro-consumer agenda that targeted
reform of the full-service brokerage firms. Many of thesedevelopments compounded the structural problems that enabledan increase in speculative trading and a decrease in long-terminvesting. (We saw these phenomena in the housing markets,with teaser rates and no-money-down mortgages.) Yet the worstwas still to come.
Barreling down the track in 2001 was the death star of decimalization. While it’s difficult to argue in theory with thechange from fractional to decimal increments, in hindsightthe markets would have been better served by a reduction of increments to just $0.10, rather than to the penny increments forwhich the SEC pushed. The resultant loss of 96 percent of the
4 Consumers and institutional investors undoubtedly benefited from decimalization and $0.01 spreads in the trading of large capitalization stocks whose visibility and broad research coverageoutweighed any loss of broker and trader support. Unfortunately, decimalization was “one-size-fits-all” and was applied equally to small capitalization stocks that had comparatively little natural visib
5 Regulation National Market System (NMS) 2005: The SEC proposed a structural overhaul of the securities markets, requiring that (i) the best bids and offers (“top of book”) be displayed in all marketand the best price cannot be “traded through” or ignored, (ii) markets cannot execute orders at a price worse than one displayed by another market, (iii) stocks cannot be quoted in fractions of lessthan a penny, and (iv) market data revenues are allocated more equitably.
Market structure is causing the IPO crisis — and more 11
economics from the trading spread of most small cap stocks —from $0.25 per share to $0.01 per share — was too great a shockfor the system to bear. Trade execution had to be automated.Market makers no longer exchanged information over thephone, scrambling to match buyers with sellers on the other sideof a trade. Liquidity, supported by capital commitment, quicklywas a thing of the past in the NASDAQ system. In the name of championing consumers, the damage was done.4
The New York Stock Exchange managed to hold out fora time. However, the specialists finally fell victim to crushingspreads when Regulation NMS 5 was implemented in July 2005.
Generally speaking, economists and regulators havemaintained that competition, and reduced transaction costs areof great benefit to consumers — but only to a point. When itcomes to investments, higher front-end or transaction costs and
tax structures that penalize speculative (short-term) behavior candisincent speculative behavior and incent investment (buy-and-hold) behavior that may be essential to avoiding boom-and-bustcycles and maintaining the infrastructure necessary to supporta healthy investment culture. As markets become frictionless(i.e., when there is little cost to entering into a transaction), itbecomes easier for massive numbers of investors to engage inspeculative activity. This first occurred with the introductionof $25-per-trade online brokerage commissions in 1996 (whichlater dropped to less than $10 per trade), and then again withdecimalization in 2001. Consumers flocked to the markets.
8/8/2019 IPO Crisis June 2010 FINAL
http://slidepdf.com/reader/full/ipo-crisis-june-2010-final 14/32
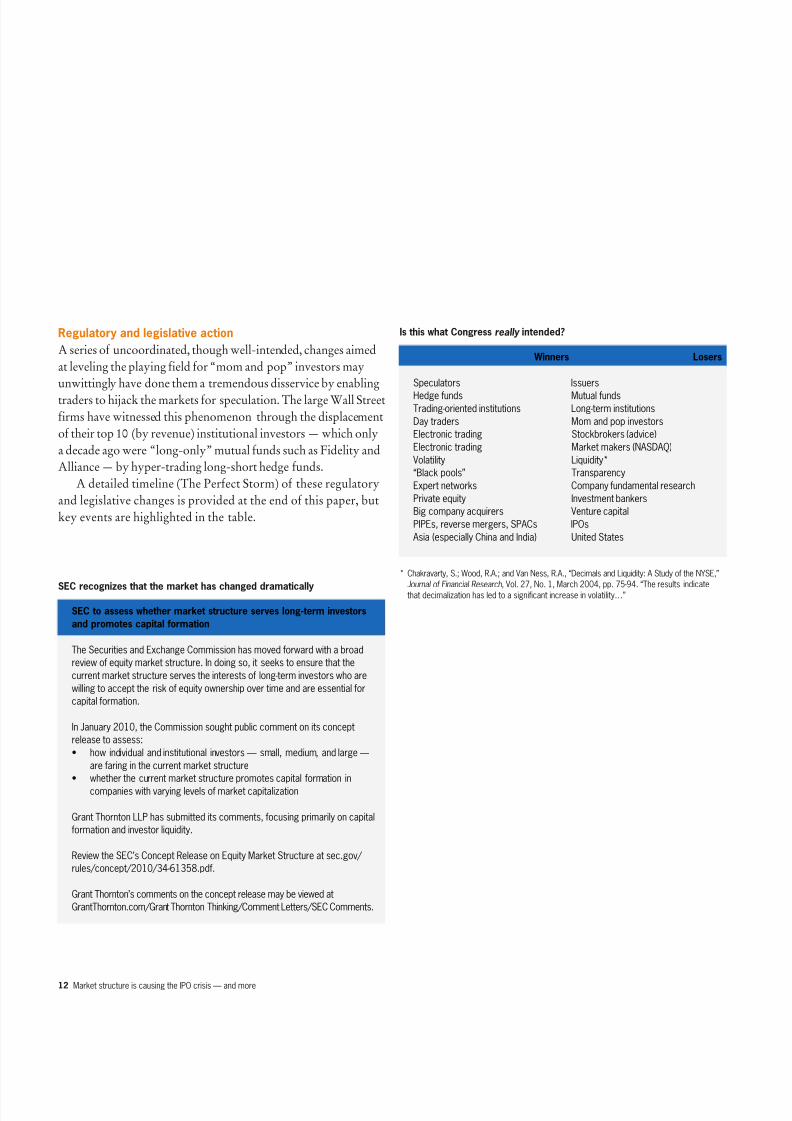
Regulatory and legislative actionA series of uncoordinated, though well-intended, changes aimedat leveling the playing field for “mom and pop” investors mayunwittingly have done them a tremendous disservice by enablingtraders to hijack the markets for speculation. The large Wall Streetfirms have witnessed this phenomenon through the displacementof their top 10 (by revenue) institutional investors — which onlya decade ago were “long-only” mutual funds such as Fidelity andAlliance — by hyper-trading long-short hedge funds.
A detailed timeline (The Perfect Storm) of these regulatoryand legislative changes is provided at the end of this paper, butkey events are highlighted in the table.
Winners Losers
Speculators IssuersHedge funds Mutual fundsTrading-oriented institutions Long-term institutionsDay traders Mom and pop investorsElectronic trading Stockbrokers (advice)Electronic trading Market makers (NASDAQ)Volatility Liquidity*“Black pools” TransparencyExpert networks Company fundamental researchPrivate equity Investment bankersBig company acquirers Venture capitalPIPEs, reverse mergers, SPACs IPOsAsia (especially China and India) United States
Is this what Congress really intended?
* Chakravarty, S.; Wood, R.A.; and Van Ness, R.A., “Decimals and Liquidity: A Study of the NYSE,”Journal of Financial Research , Vol. 27, No. 1, March 2004, pp. 75-94. “The results indicatethat decimalization has led to a significant increase in volatility…”
12 Market structure is causing the IPO crisis — and more
SEC to assess whether market structure serves long-term investorsand promotes capital formation
The Securities and Exchange Commission has moved forward with a broadreview of equity market structure. In doing so, it seeks to ensure that thecurrent market structure serves the interests of long-term investors who arewilling to accept the risk of equity ownership over time and are essential forcapital formation.
In January 2010, the Commission sought public comment on its conceptrelease to assess:• how individual and institutional investors — small, medium, and large —
are faring in the current market structure• whether the current market structure promotes capital formation in
companies with varying levels of market capitalization
Grant Thornton LLP has submitted its comments, focusing primarily on capitalformation and investor liquidity. Review the SEC’s Concept Release on Equity Market Structure at sec.gov/ rules/concept/2010/34-61358.pdf.
Grant Thornton’s comments on the concept release may be viewed atGrantThornton.com/Grant Thornton Thinking/Comment Letters/SEC Comments.
SEC recognizes that the market has changed dramatically
8/8/2019 IPO Crisis June 2010 FINAL
http://slidepdf.com/reader/full/ipo-crisis-june-2010-final 15/32
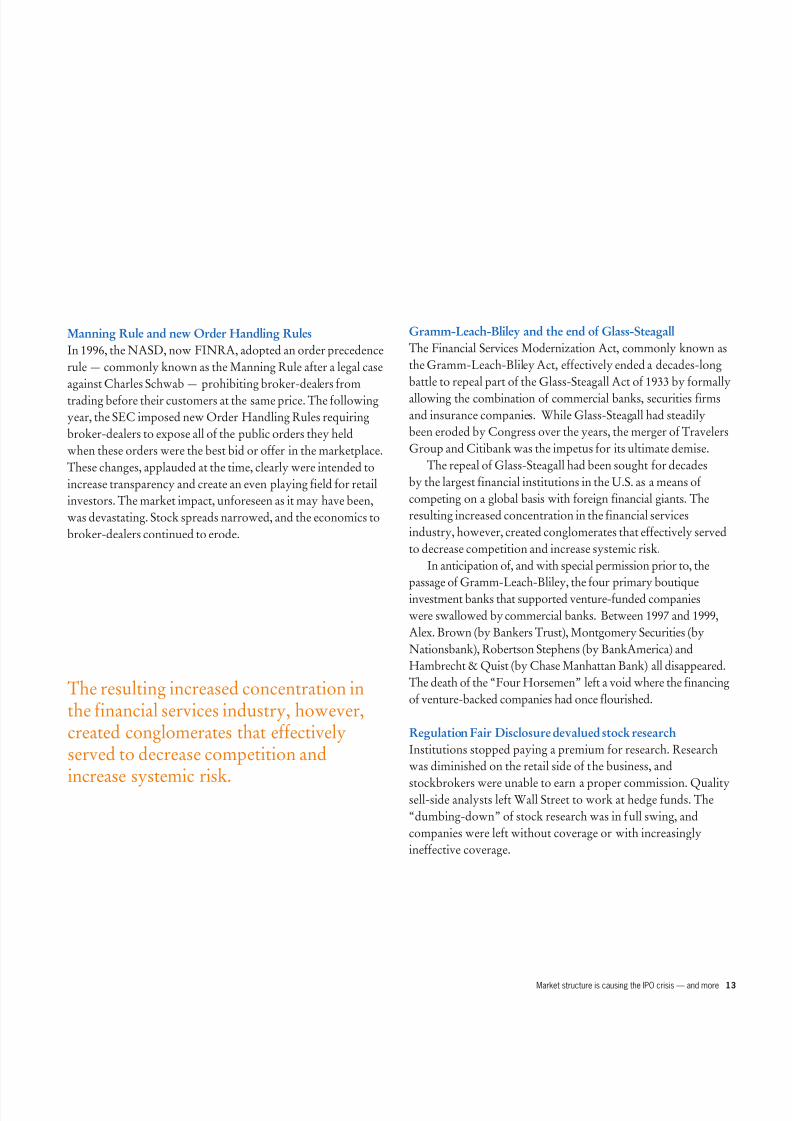
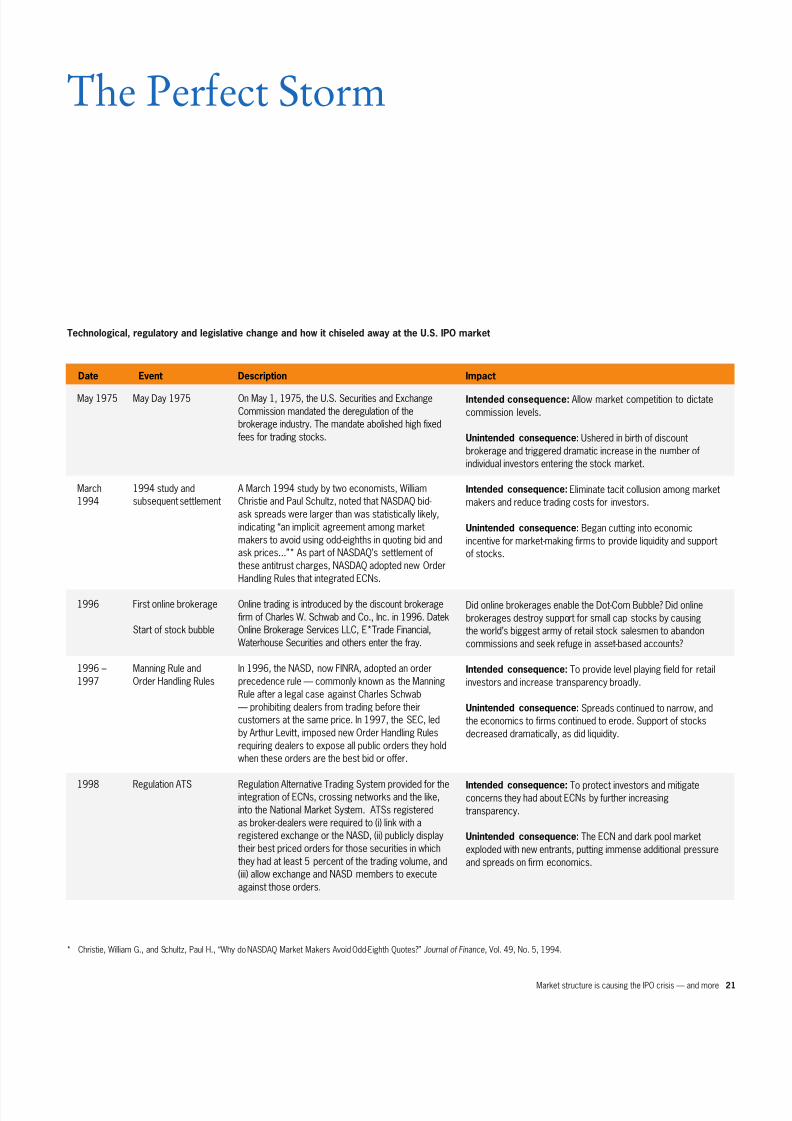
Manning Rule and new Order Handling RulesIn 1996, the NASD, now FINRA, adopted an order precedencerule — commonly known as the Manning Rule after a legal caseagainst Charles Schwab — prohibiting broker-dealers fromtrading before their customers at the same price. The followingyear, the SEC imposed new Order Handling Rules requiringbroker-dealers to expose all of the public orders they heldwhen these orders were the best bid or offer in the marketplace.These changes, applauded at the time, clearly were intended toincrease transparency and create an even playing field for retailinvestors. The market impact, unforeseen as it may have been,was devastating. Stock spreads narrowed, and the economics tobroker-dealers continued to erode.
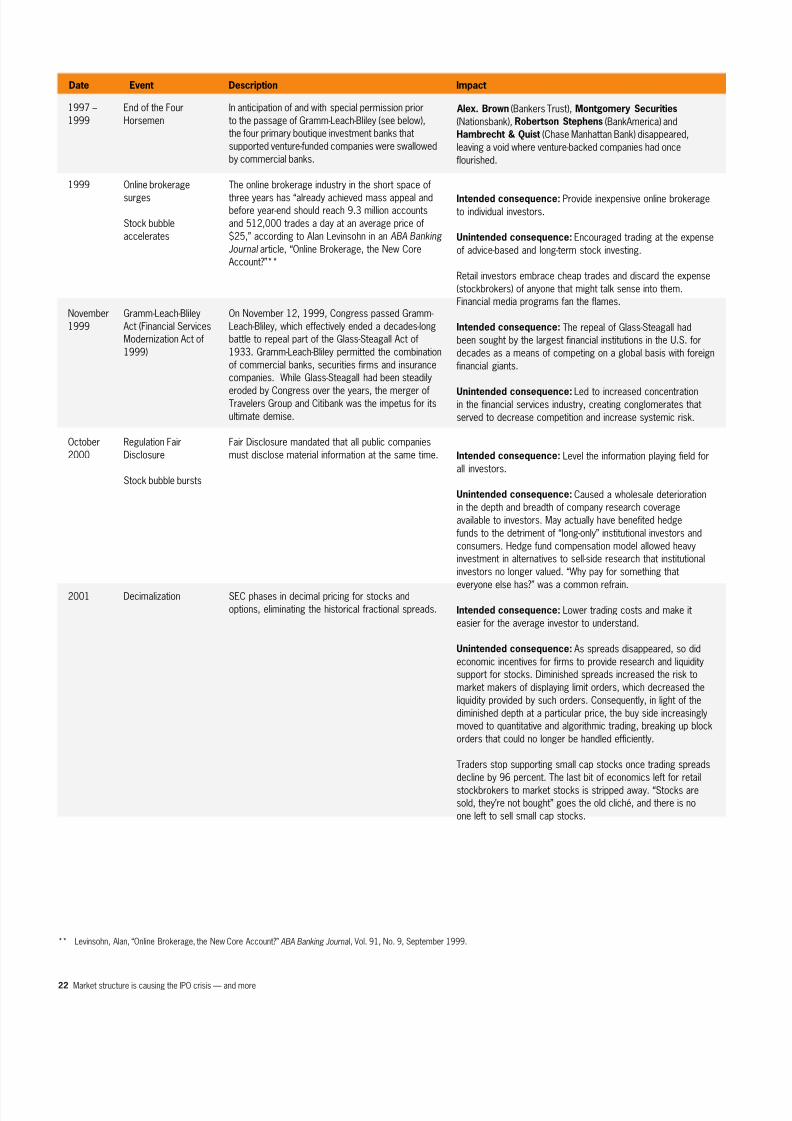
Gramm-Leach-Bliley and the end of Glass-SteagallThe Financial Services Modernization Act, commonly known asthe Gramm-Leach-Bliley Act, effectively ended a decades-longbattle to repeal part of the Glass-Steagall Act of 1933 by formallyallowing the combination of commercial banks, securities firmsand insurance companies. While Glass-Steagall had steadilybeen eroded by Congress over the years, the merger of TravelersGroup and Citibank was the impetus for its ultimate demise.
The repeal of Glass-Steagall had been sought for decadesby the largest financial institutions in the U.S. as a means of competing on a global basis with foreign financial giants. Theresulting increased concentration in the financial servicesindustry, however, created conglomerates that effectively servedto decrease competition and increase systemic risk.
In anticipation of, and with special permission prior to, the
passage of Gramm-Leach-Bliley, the four primary boutiqueinvestment banks that supported venture-funded companieswere swallowed by commercial banks. Between 1997 and 1999,Alex. Brown (by Bankers Trust), Montgomery Securities (byNationsbank), Robertson Stephens (by BankAmerica) andHambrecht & Quist (by Chase Manhattan Bank) all disappeared.The death of the “Four Horsemen” left a void where the financingof venture-backed companies had once flourished.
Regulation Fair Disclosure devalued stock research Institutions stopped paying a premium for research. Researchwas diminished on the retail side of the business, and
stockbrokers were unable to earn a proper commission. Qualitysell-side analysts left Wall Street to work at hedge funds. The“dumbing-down” of stock research was in full swing, andcompanies were left without coverage or with increasinglyineffective coverage.
The resulting increased concentration inthe financial services industry, however,created conglomerates that effectivelyserved to decrease competition and
increase systemic risk.
Market structure is causing the IPO crisis — and more 13
8/8/2019 IPO Crisis June 2010 FINAL
http://slidepdf.com/reader/full/ipo-crisis-june-2010-final 16/32
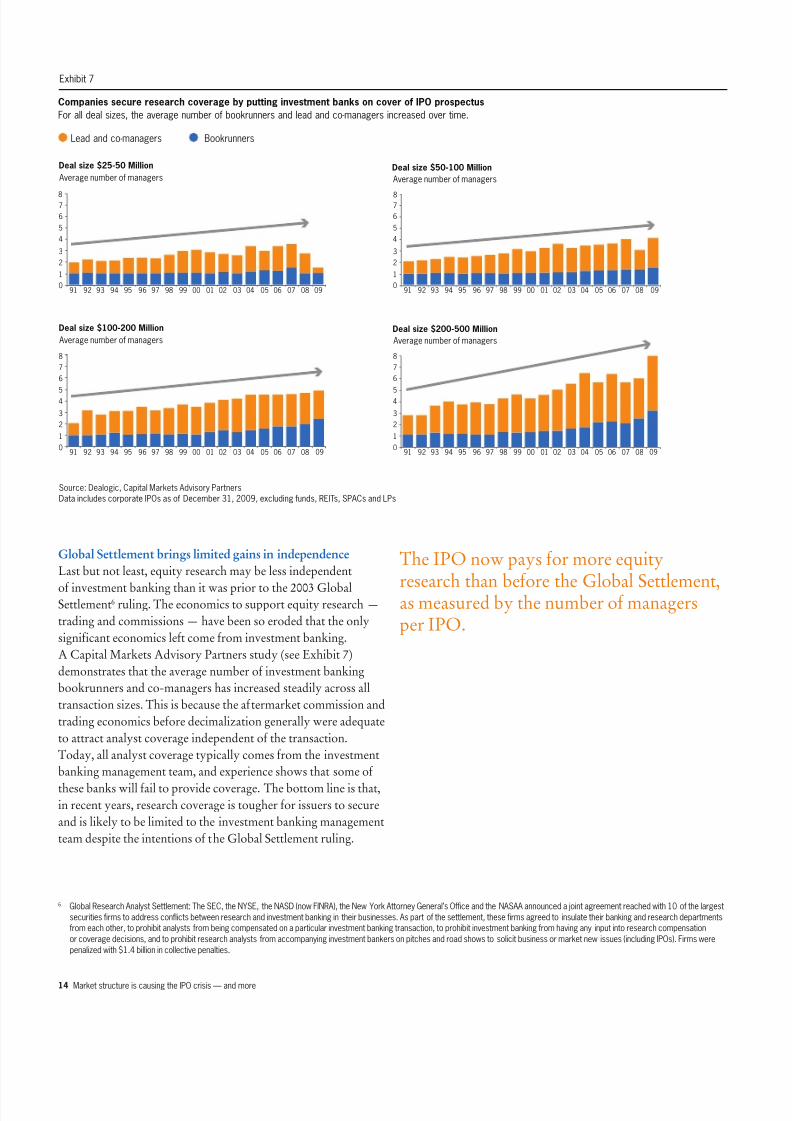
Global Settlement brings limited gains in independenceLast but not least, equity research may be less independent
of investment banking than it was prior to the 2003 GlobalSettlement6 ruling. The economics to support equity research —trading and commissions — have been so eroded that the onlysignificant economics left come from investment banking.A Capital Markets Advisory Partners study (see Exhibit 7)demonstrates that the average number of investment bankingbookrunners and co-managers has increased steadily across alltransaction sizes. This is because the aftermarket commission andtrading economics before decimalization generally were adequateto attract analyst coverage independent of the transaction.Today, all analyst coverage typically comes from the investmentbanking management team, and experience shows that some of these banks will fail to provide coverage. The bottom line is that,in recent years, research coverage is tougher for issuers to secureand is likely to be limited to the investment banking managementteam despite the intentions of the Global Settlement ruling.
Exhibit 7
Companies secure research coverage by putting investment banks on cover of IPO prospectusFor all deal sizes, the average number of bookrunners and lead and co-managers increased over time.
Lead and co-managers Bookrunners
Source: Dealogic, Capital Markets Advisory PartnersData includes corporate IPOs as of December 31, 2009, excluding funds, REITs, SPACs and LPs
Average number of managersDeal size $25-50 Million Deal size $50-100 Million
Average number of managers
Average number of managersDeal size $100-200 Million Deal size $200-500 Million
Average number of managers
0 96949391 95 97 0298 0099 01 03 04 0605 07
123
4567
0892
0 96949391 95 97 0298 0099 01 03 04 0605 07
12345
67
0892
0 96949391 95 97 0298 0099 01 03 04 0605 07
123
4567
0892
0 96949391 95 97 0298 0099 01 03 04 0605 07
12345
67
0892
09
09 09
09
88
8 8
6 Global Research Analyst Settlement: The SEC, the NYSE, the NASD (now FINRA), the New York Attorney General’s Office and the NASAA announced a joint agreement reached with 10 of the securities firms to address conflicts between research and investment banking in their businesses. As part of the settlement, these firms agreed to insulate their banking and research departmentsfrom each other, to prohibit analysts from being compensated on a particular investment banking transaction, to prohibit investment banking from having any input into research compensationor coverage decisions, and to prohibit research analysts from accompanying investment bankers on pitches and road shows to solicit business or market new issues (including IPOs). Firms werepenalized with $1.4 billion in collective penalties.
The IPO now pays for more equity
research than before the Global Settlement,as measured by the number of managersper IPO.
14 Market structure is causing the IPO crisis — and more
8/8/2019 IPO Crisis June 2010 FINAL
http://slidepdf.com/reader/full/ipo-crisis-june-2010-final 17/32
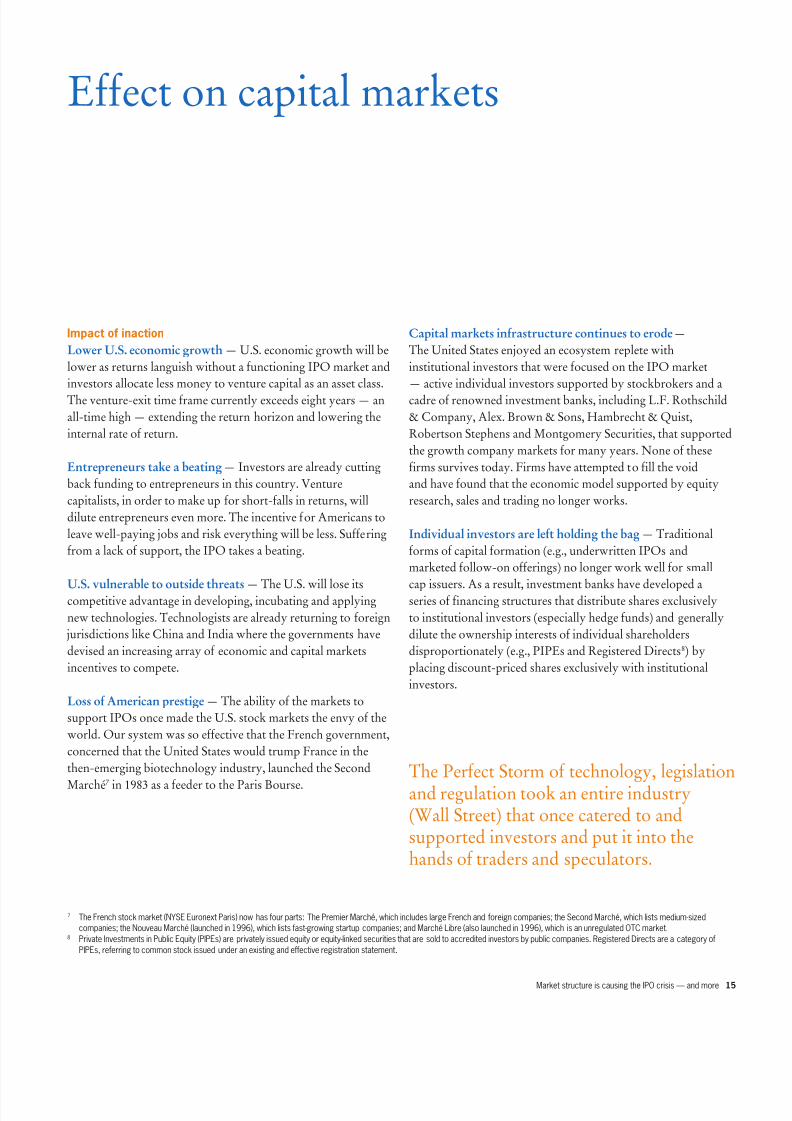
Capital markets infrastructure continues to erode —The United States enjoyed an ecosystem replete withinstitutional investors that were focused on the IPO market— active individual investors supported by stockbrokers and acadre of renowned investment banks, including L.F. Rothschild& Company, Alex. Brown & Sons, Hambrecht & Quist,Robertson Stephens and Montgomery Securities, that supportedthe growth company markets for many years. None of thesefirms survives today. Firms have attempted to fill the voidand have found that the economic model supported by equityresearch, sales and trading no longer works.
Individual investors are left holding the bag — Traditionalforms of capital formation (e.g., underwritten IPOs andmarketed follow-on offerings) no longer work well for small
cap issuers. As a result, investment banks have developed aseries of financing structures that distribute shares exclusivelyto institutional investors (especially hedge funds) and generallydilute the ownership interests of individual shareholdersdisproportionately (e.g., PIPEs and Registered Directs 8) byplacing discount-priced shares exclusively with institutionalinvestors.
Effect on capital markets
Impact of inactionLower U.S. economic growth — U.S. economic growth will belower as returns languish without a functioning IPO market andinvestors allocate less money to venture capital as an asset class.The venture-exit time frame currently exceeds eight years — anall-time high — extending the return horizon and lowering theinternal rate of return.
Entrepreneurs take a beating — Investors are already cuttingback funding to entrepreneurs in this country. Venturecapitalists, in order to make up for short-falls in returns, willdilute entrepreneurs even more. The incentive for Americans toleave well-paying jobs and risk everything will be less. Sufferingfrom a lack of support, the IPO takes a beating.
U.S. vulnerable to outside threats — The U.S. will lose itscompetitive advantage in developing, incubating and applyingnew technologies. Technologists are already returning to foreign jurisdictions like China and India where the governments havedevised an increasing array of economic and capital marketsincentives to compete.
Loss of American prestige — The ability of the markets tosupport IPOs once made the U.S. stock markets the envy of theworld. Our system was so effective that the French government,concerned that the United States would trump France in thethen-emerging biotechnology industry, launched the Second
Marché7 in 1983 as a feeder to the Paris Bourse.
7 The French stock market (NYSE Euronext Paris) now has four parts: The Premier Marché, which includes large French and foreign companies; the Second Marché, which lists medium-sizedcompanies; the Nouveau Marché (launched in 1996), which lists fast-growing startup companies; and Marché Libre (also launched in 1996), which is an unregulated OTC market.
8 Private Investments in Public Equity (PIPEs) are privately issued equity or equity-linked securities that are sold to accredited investors by public companies. Registered Directs are a category ofPIPEs, referring to common stock issued under an existing and effective registration statement.
The Perfect Storm of technology, legislationand regulation took an entire industry(Wall Street) that once catered to andsupported investors and put it into thehands of traders and speculators.
Market structure is causing the IPO crisis — and more 15
8/8/2019 IPO Crisis June 2010 FINAL
http://slidepdf.com/reader/full/ipo-crisis-june-2010-final 18/32
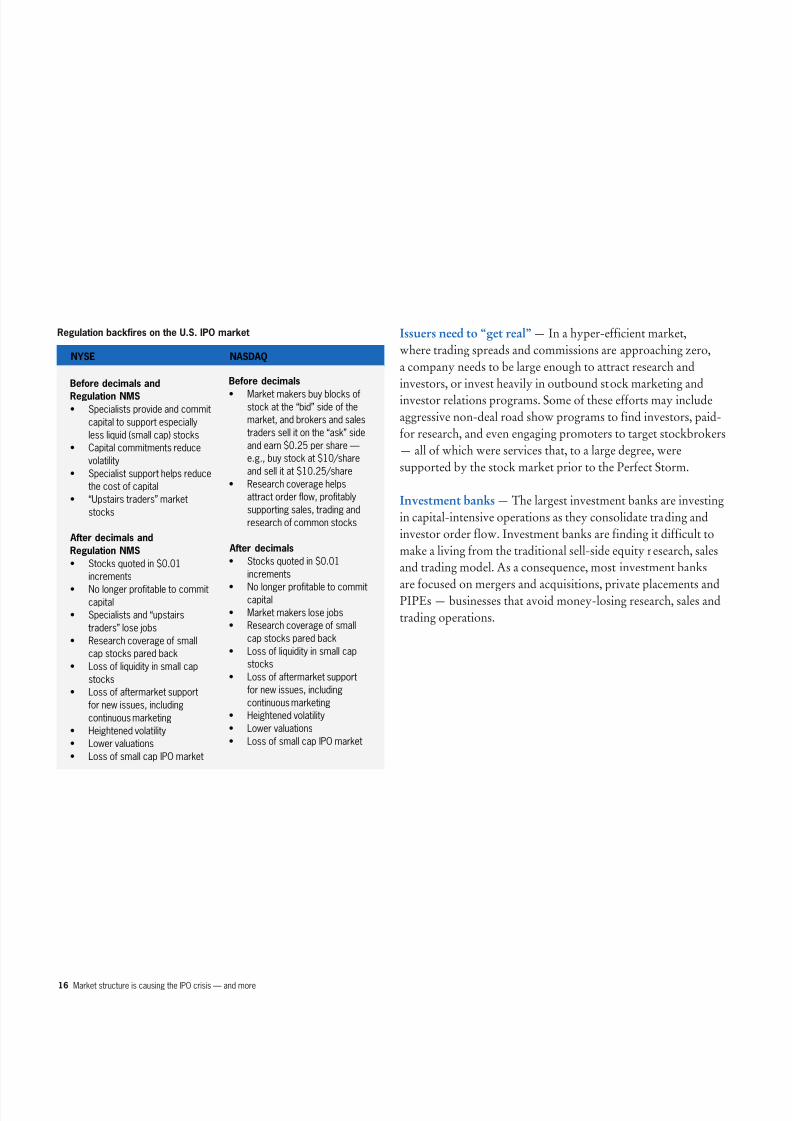
Issuers need to “get real” — In a hyper-efficient market,where trading spreads and commissions are approaching zero,a company needs to be large enough to attract research andinvestors, or invest heavily in outbound stock marketing andinvestor relations programs. Some of these efforts may includeaggressive non-deal road show programs to find investors, paid-for research, and even engaging promoters to target stockbrokers— all of which were services that, to a large degree, weresupported by the stock market prior to the Perfect Storm.
Investment banks — The largest investment banks are investingin capital-intensive operations as they consolidate trading andinvestor order flow. Investment banks are finding it difficult tomake a living from the traditional sell-side equity research, salesand trading model. As a consequence, most investment banks
are focused on mergers and acquisitions, private placements andPIPEs — businesses that avoid money-losing research, sales andtrading operations.
Before decimals andRegulation NMS• Specialists provide and commit
capital to support especiallyless liquid (small cap) stocks
• Capital commitments reducevolatility
• Specialist support helps reducethe cost of capital
• “Upstairs traders” marketstocks
After decimals andRegulation NMS• Stocks quoted in $0.01
increments
• No longer profitable to commitcapital
• Specialists and “upstairstraders” lose jobs
• Research coverage of smallcap stocks pared back
• Loss of liquidity in small capstocks
• Loss of aftermarket supportfor new issues, includingcontinuous marketing
• Heightened volatility• Lower valuations• Loss of small cap IPO market
Regulation backfires on the U.S. IPO market
NYSE NASDAQ
Before decimals• Market makers buy blocks of
stock at the “bid” side of themarket, and brokers and salestraders sell it on the “ask” sideand earn $0.25 per share —e.g., buy stock at $10/shareand sell it at $10.25/share
• Research coverage helpsattract order flow, profitablysupporting sales, trading andresearch of common stocks
After decimals• Stocks quoted in $0.01
increments
• No longer profitable to commitcapital• Market makers lose jobs• Research coverage of small
cap stocks pared back• Loss of liquidity in small cap
stocks• Loss of aftermarket support
for new issues, includingcontinuous marketing
• Heightened volatility• Lower valuations• Loss of small cap IPO market
16 Market structure is causing the IPO crisis — and more
8/8/2019 IPO Crisis June 2010 FINAL
http://slidepdf.com/reader/full/ipo-crisis-june-2010-final 19/32
Market structure is causing the IPO crisis — and more 17
Search for alternativesThere has been no shortage of effort to find an alternative to anIPO for private U.S. companies. Among these are the NASDAQPortal Alliance (144A PIPO) and Entrex markets.
To date, most of the major U.S. investment-bankinginitiatives have been focused on the 144A PIPO market in effortsto create institutional-only markets for private placements of equity. The equity would be issued to qualified institutionalbuyers (QIBs) and accredited investors that are subject to aRegulation D exemption from registration and a 144A safeharbor for aftermarket trading. Wall Street refers to theseofferings as 144A PIPOs or “pre-IPOs.”
There were four credible marketplace entries in this niche:GSTrUE (Goldman Sachs Tradable Unregistered Equities),OPUS-5 (an alliance among five of the large investment banks),
NASDAQ Portal, and Friedman Billings Ramsey. Over the lastyear, participants in OPUS-5 and Goldman Sachs have throwntheir hats in with NASDAQ to form the NASDAQ PortalAlliance. Friedman Billings Ramsey remains independent, as itwas the market share leader.
“It is said that if the IPO market has a cold,the 144A market will catch pneumonia.”– Edward Kim, Senior Advisor at Grant Thornton LLP, Capital Markets
9 Oaktree Capital Management raised $880 million in May 2007, becoming the first firm to list on the Goldman Sachs Tradable Unregistered Equity market (GSTrUE).
These so-called 144A markets will come to the aid of somecompanies, but not most companies. The reason is simple: thenumber and type of investor is restricted. There is little liquidity.In fact, even the $880 million Oaktree offering9 that was run byGoldman Sachs is said to have attracted less than 50 investors.
One constructive structural element to the NASDAQ PortalAlliance is that it is quote driven and not electronic, whichshould create incentives for market makers to commit capital andprovide liquidity (unlike the current public market structure).The market will need to attract more institutional investors,market makers and research analysts if it is to have a chance of succeeding. However, the loss of individual investors from themarket is likely to undercut its ability to support small offerings,because large populations of small (retail) investors are what(historically) support liquidity and valuations in small cap stocks.
Smaller companies attract fewer institutional investors willingto participate due to liquidity constraints — a problem that doesnot afflict most individuals.

8/8/2019 IPO Crisis June 2010 FINAL
http://slidepdf.com/reader/full/ipo-crisis-june-2010-final 20/32
18 Market structure is causing the IPO crisis — and more
8/8/2019 IPO Crisis June 2010 FINAL
http://slidepdf.com/reader/full/ipo-crisis-june-2010-final 21/32
Market structure is causing the IPO crisis — and more 19
• Quote driven – The market would be a telephone market 10 supported by market makers or specialists, much like themarkets of a decade ago. These individuals would commitcapital and could not be disintermediated by electroniccommunication networks (ECNs), which could not interactwith the book.
• Minimum quote increments (spreads) at $0.10 and$0.20 and minimum commissions – $0.10 increments(spreads) for stocks under $5.00 per share, and $0.20increments for stocks $5.00 per share and greater, asopposed to today’s penny spread market. The incrementscould be reviewed annually by the market and the SEC.These measures would bring sales support back to stocksand provide the economics to support equity researchindependent of investment banking.
• Broker intermediated – Investors could not execute directelectronic trades in this market; buying stock would require acall or electronic indication to a brokerage firm. Brokers onceagain would earn commissions and be incented to phone andpresent stocks to potential investors. These measures woulddiscourage day trading.
• Research requirement – Firms making markets in thesesecurities would be required to provide equity researchcoverage that meets minimum standards, such as a thoroughinitial report, quarterly reports (typically a minimum of 1-2 pages) and forecasts.
This structure would lead to investment in the types of investment banks that once supported the IPO market in thiscountry (e.g., Alex. Brown & Sons, Hambrecht & Quist, L.F.Rothschild & Company, Montgomery Securities, RobertsonStephens) and would rejuvenate investment activity andinnovation.
Alternative public market segmentThe United States needs an issuer and investor opt-in capitalmarket that provides the same structure that served the nation ingood stead for so many years. This market would make use of full SEC oversight and disclosure, and could be run as a separatesegment of NYSE or NASDAQ, or as a new market entrant. Itwould have these attributes:
• Opt-in/freedom of choice – Issuers would have the freedomto choose whether to list in the alternative marketplaceor in the traditional marketplace. Issuers could choose tomove from their current market segment into the alternativemarket segment (we suspect that many small companieswould make this selection, while large cap companies wouldnot). Investors would have the freedom to buy and sell stocks
from either market. This is a “let-the-best-solution-win”approach that will re-grow the ecosystem to support smallcap stocks and IPOs.
• Public – Unlike the 144A market, this market would beopen to all investors. Thus, brokerage accounts and equityresearch could be processed to keep costs under control andto leverage currently available infrastructure.
• Regulated – The market would be subject to the sameSEC corporate disclosure, oversight and enforcement asexisting markets. However, market rules would be tailoredto preserve the economics necessary to support qualityresearch, liquidity (capital commitment) and sales support,
thus favoring investors over high-frequency and day trading.Traditional public (SEC) reporting and oversight would be inplace, including Sarbanes-Oxley.
Conclusion
10 The market would use electronic quotations to advertise indicative prices, but market makers (including “specialists”) would be left to negotiate actual buys and sells.

8/8/2019 IPO Crisis June 2010 FINAL
http://slidepdf.com/reader/full/ipo-crisis-june-2010-final 22/32
20 Market structure is causing the IPO crisis — and more
8/8/2019 IPO Crisis June 2010 FINAL
http://slidepdf.com/reader/full/ipo-crisis-june-2010-final 23/32
8/8/2019 IPO Crisis June 2010 FINAL
http://slidepdf.com/reader/full/ipo-crisis-june-2010-final 24/32
Date Event Description Impact
1997 –1999
1999
November1999
October2000
2001
End of the FourHorsemen
Online brokeragesurges
Stock bubbleaccelerates
Gramm-Leach-BlileyAct (Financial ServicesModernization Act of1999)
Regulation FairDisclosure
Stock bubble bursts
Decimalization
In anticipation of and with special permission priorto the passage of Gramm-Leach-Bliley (see below),the four primary boutique investment banks thatsupported venture-funded companies were swallowedby commercial banks.
The online brokerage industry in the short space ofthree years has “already achieved mass appeal andbefore year-end should reach 9.3 million accountsand 512,000 trades a day at an average price of$25,” according to Alan Levinsohn in anABA Banking Journal article, “Online Brokerage, the New CoreAccount?”**
On November 12, 1999, Congress passed Gramm-Leach-Bliley, which effectively ended a decades-longbattle to repeal part of the Glass-Steagall Act of1933. Gramm-Leach-Bliley permitted the combinationof commercial banks, securities firms and insurancecompanies. While Glass-Steagall had been steadily
eroded by Congress over the years, the merger ofTravelers Group and Citibank was the impetus for itsultimate demise.
Fair Disclosure mandated that all public companiesmust disclose material information at the same time.
SEC phases in decimal pricing for stocks andoptions, eliminating the historical fractional spreads.
Alex. Brown (Bankers Trust),Montgomery Securities (Nationsbank),Robertson Stephens (BankAmerica) andHambrecht & Quist (Chase Manhattan Bank) disappeared,leaving a void where venture-backed companies had onceflourished.
Intended consequence: Provide inexpensive online brokerageto individual investors.
Unintended consequence: Encouraged trading at the expenseof advice-based and long-term stock investing.
Retail investors embrace cheap trades and discard the expense(stockbrokers) of anyone that might talk sense into them.Financial media programs fan the flames.
Intended consequence: The repeal of Glass-Steagall hadbeen sought by the largest financial institutions in the U.S. fordecades as a means of competing on a global basis with foreignfinancial giants.
Unintended consequence: Led to increased concentrationin the financial services industry, creating conglomerates thatserved to decrease competition and increase systemic risk.
Intended consequence: Level the information playing field forall investors.
Unintended consequence: Caused a wholesale deteriorationin the depth and breadth of company research coverageavailable to investors. May actually have benefited hedgefunds to the detriment of “long-only” institutional investors andconsumers. Hedge fund compensation model allowed heavyinvestment in alternatives to sell-side research that institutionalinvestors no longer valued. “Why pay for something that
everyone else has?” was a common refrain.Intended consequence: Lower trading costs and make iteasier for the average investor to understand.
Unintended consequence: As spreads disappeared, so dideconomic incentives for firms to provide research and liquiditysupport for stocks. Diminished spreads increased the risk tomarket makers of displaying limit orders, which decreased theliquidity provided by such orders. Consequently, in light of thediminished depth at a particular price, the buy side increasinglymoved to quantitative and algorithmic trading, breaking up blockorders that could no longer be handled efficiently.
Traders stop supporting small cap stocks once trading spreadsdecline by 96 percent. The last bit of economics left for retailstockbrokers to market stocks is stripped away. “Stocks aresold, they’re not bought” goes the old cliché, and there is noone left to sell small cap stocks.
** Levinsohn, Alan, “Online Brokerage, the New Core Account?”ABA Banking Journal, Vol. 91, No. 9, September 1999.
22 Market structure is causing the IPO crisis — and more
8/8/2019 IPO Crisis June 2010 FINAL
http://slidepdf.com/reader/full/ipo-crisis-june-2010-final 25/32
Market structure is causing the IPO crisis — and more 23
Date Event Description Impact
July 2002
2003 –2004
April 2003
July 2005
July 2007
Sarbanes-Oxley Act
Mutual fund scandals
The Global Settlement
Regulation NationalMarket System
Amendment to Rule201 of Regulation SHO
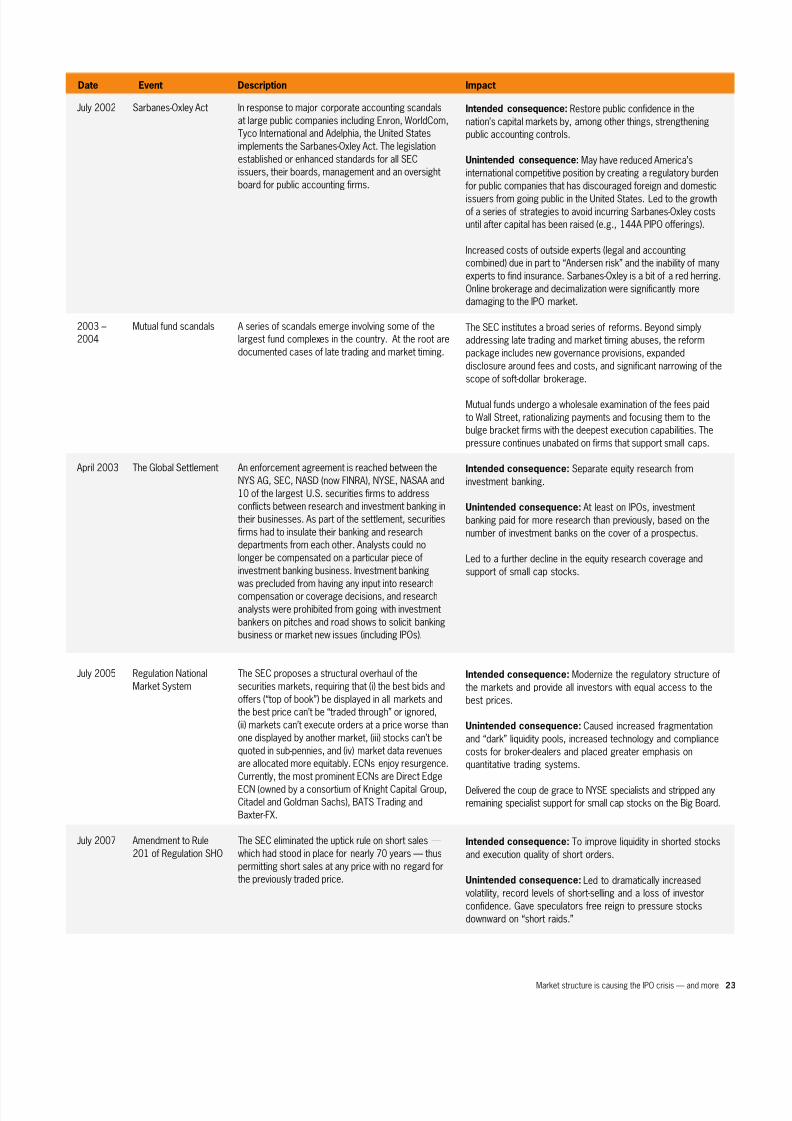
In response to major corporate accounting scandalsat large public companies including Enron, WorldCom,Tyco International and Adelphia, the United Statesimplements the Sarbanes-Oxley Act. The legislationestablished or enhanced standards for all SECissuers, their boards, management and an oversightboard for public accounting firms.
A series of scandals emerge involving some of thelargest fund complexes in the country. At the root aredocumented cases of late trading and market timing.
An enforcement agreement is reached between theNYS AG, SEC, NASD (now FINRA), NYSE, NASAA and10 of the largest U.S. securities firms to addressconflicts between research and investment banking intheir businesses. As part of the settlement, securitiesfirms had to insulate their banking and researchdepartments from each other. Analysts could nolonger be compensated on a particular piece ofinvestment banking business. Investment bankingwas precluded from having any input into researchcompensation or coverage decisions, and researchanalysts were prohibited from going with investmentbankers on pitches and road shows to solicit bankingbusiness or market new issues (including IPOs).
The SEC proposes a structural overhaul of thesecurities markets, requiring that (i) the best bids andoffers (“top of book”) be displayed in all markets andthe best price can’t be “traded through” or ignored,(ii) markets can’t execute orders at a price worse thanone displayed by another market, (iii) stocks can’t bequoted in sub-pennies, and (iv) market data revenuesare allocated more equitably. ECNs enjoy resurgence.Currently, the most prominent ECNs are Direct EdgeECN (owned by a consortium of Knight Capital Group,Citadel and Goldman Sachs), BATS Trading andBaxter-FX.
The SEC eliminated the uptick rule on short sales —which had stood in place for nearly 70 years — thuspermitting short sales at any price with no regard forthe previously traded price.
Intended consequence: Restore public confidence in thenation’s capital markets by, among other things, strengtheningpublic accounting controls.
Unintended consequence: May have reduced America’sinternational competitive position by creating a regulatory burdenfor public companies that has discouraged foreign and domesticissuers from going public in the United States. Led to the growthof a series of strategies to avoid incurring Sarbanes-Oxley costsuntil after capital has been raised (e.g., 144A PIPO offerings).
Increased costs of outside experts (legal and accountingcombined) due in part to “Andersen risk” and the inability of manyexperts to find insurance. Sarbanes-Oxley is a bit of a red herring.Online brokerage and decimalization were significantly moredamaging to the IPO market.
The SEC institutes a broad series of reforms. Beyond simplyaddressing late trading and market timing abuses, the reformpackage includes new governance provisions, expandeddisclosure around fees and costs, and significant narrowing of thescope of soft-dollar brokerage.
Mutual funds undergo a wholesale examination of the fees paidto Wall Street, rationalizing payments and focusing them to thebulge bracket firms with the deepest execution capabilities. Thepressure continues unabated on firms that support small caps.
Intended consequence: Separate equity research frominvestment banking.
Unintended consequence: At least on IPOs, investmentbanking paid for more research than previously, based on thenumber of investment banks on the cover of a prospectus.
Led to a further decline in the equity research coverage andsupport of small cap stocks.
Intended consequence: Modernize the regulatory structure ofthe markets and provide all investors with equal access to thebest prices.
Unintended consequence: Caused increased fragmentationand “dark” liquidity pools, increased technology and compliancecosts for broker-dealers and placed greater emphasis onquantitative trading systems.
Delivered the coup de grace to NYSE specialists and stripped anyremaining specialist support for small cap stocks on the Big Board.
Intended consequence: To improve liquidity in shorted stocksand execution quality of short orders.
Unintended consequence: Led to dramatically increasedvolatility, record levels of short-selling and a loss of investorconfidence. Gave speculators free reign to pressure stocksdownward on “short raids.”

8/8/2019 IPO Crisis June 2010 FINAL
http://slidepdf.com/reader/full/ipo-crisis-june-2010-final 26/32
24 Market structure is causing the IPO crisis — and more
8/8/2019 IPO Crisis June 2010 FINAL
http://slidepdf.com/reader/full/ipo-crisis-june-2010-final 27/32
Market structure is causing the IPO crisis — and more 25
Edward KimEdward Kim is a capital markets senior advisor atGrant Thornton LLP, providing strategies and insights intotoday’s global capital markets. He is co-author of Marketstructure is causing the IPO crisisand A wake-up call for America, and often provides the financial news media withcommentary and analysis on capital markets trends.
He is a managing director at Capital Markets AdvisoryPartners and former head of product development at TheNASDAQ Stock Market. In addition, Ed has worked in equityresearch at Robertson Stephens, equity trading at LehmanBrothers and investment banking at Prudential Securities.
David WeildDavid Weild is a capital markets senior advisor at Grant ThorntonLLP, providing strategies and insights into today’s global capitalmarkets. He is co-author of Market structure is causing theIPO crisis and A wake-up call for America, and is a frequentresource to the financial news media on issues relevant to thecapital markets.
He is the founder of Capital Markets Advisory Partners andthe former vice chairman and executive vice president overseeingthe more than 4,000 listed companies of The NASDAQ StockMarket. David spent 14 years in a variety of senior investmentbanking and equity capital markets roles at Prudential Securities.He participated in NYSE’s and National Venture CapitalAssociation’s Blue Ribbon Regional Task Force to explore waysto help restore a vibrant IPO market and keep innovation
flourishing in the United States.
About the authors
Contact information
David WeildSenior AdvisorGrant Thornton LLP, Capital MarketsT 212.542.9979E [email protected]
Contact information
Edward KimSenior AdvisorGrant Thornton LLP, Capital MarketsT 702.823.1259E [email protected]
The Capital Markets SeriesVisit www.GrantThornton.com/subscribe and select the Capital MarketsSeries to receive periodic reports on issues relevant and timely to today’scapital markets.

8/8/2019 IPO Crisis June 2010 FINAL
http://slidepdf.com/reader/full/ipo-crisis-june-2010-final 28/32
26 Market structure is causing the IPO crisis — and more

8/8/2019 IPO Crisis June 2010 FINAL
http://slidepdf.com/reader/full/ipo-crisis-june-2010-final 29/32
Market structure is causing the IPO crisis — and more 27
About Grant Thornton LLP
Today, Grant Thornton LLP serves as the auditor for more than425 SEC issuer audit clients. More than 800 public companies areclients of our tax and advisory practices, including 53 percent of the companies that make up the components of the Dow JonesIndustrial Average. Our experience and dedication to customerservice help clients access market windows for equity, debt, sale,merger and acquisition transactions.
Over the past six years, Grant Thornton LLP has workedwith every one of the top 20 investment banks to help clientsraise capital. On behalf of our clients, we work with and areaccepted by the major rating agencies and regulatory bodies.We understand that the biggest cost to any company is thefailure to make a “market window.” Consequently, wepride ourselves on delivering the most responsive servicein the marketplace.
Grant Thornton International Ltd member firms are activein the major world markets and accepted by major securitiesregulators everywhere. Our access to these resources allows usto support more listing choices for our clients. In fact,Grant Thornton UK LLP audits several regulatory and publicinterest bodies in the UK and also is the largest auditor of AIM-listed companies. Senior advisors at Grant Thornton LLPmaintain key relationships with management at the NYSE,NASDAQ and the London Stock Exchange.
The people in the independent firms of Grant ThorntonInternational Ltd provide personalized attention and thehighest quality service to public and private clients in morethan 100 countries. Grant Thornton LLP and Grant ThorntonUK LLP are member firms of Grant Thornton InternationalLtd, one of the six global audit, tax and advisory organizations.
Grant Thornton International Ltd and its member firms arenot a worldwide partnership, as each member firm is a separateand distinct legal entity.
Audit• Financial statement audits for
public, private and international
companies• Benefit plan audits• Public finance
Tax• Compliance• Federal tax
• State and local tax• International tax• Private wealth• Compensation and benefits
Advisory• Information technology• Forensics, investigation and
litigation• Governance, risk and compliance• Performance improvement• Transaction support• Restructuring and turnaround• Business strategy• Valuation
Public sector• Financial management and
accounting
• Cost and performancemanagement
• Economic development• Business intelligence• Organizational improvements

8/8/2019 IPO Crisis June 2010 FINAL
http://slidepdf.com/reader/full/ipo-crisis-june-2010-final 30/32
28 Market structure is causing the IPO crisis — and more
Offices of Grant Thornton LLP
National Office175 West Jackson BoulevardChicago, IL 60604
National Tax Office1900 M Street, NW, Suite 300Washington, DC 20036
ArizonaPhoenix 602.474.3400
CaliforniaIrvine 949.553.1600Los Angeles 213.627.1717Sacramento 916.449.3991San Diego 858.704.8000San Francisco 415.986.3900San Jose 408.275.9000Woodland Hills 818.936.5100
Colorado Denver 303.813.4000
FloridaFort Lauderdale 954.768.9900Miami 305.341.8040Orlando 407.481.5100Tampa 813.229.7201
GeorgiaAtlanta 404.330.2000
Hawaii
Honolulu 808.536.0066
IllinoisChicago 312.856.0200Oakbrook Terrace 630.873.2500
KansasWichita 316.265.3231
MarylandBaltimore 410.685.4000
MassachusettsBoston 617.723.7900
MichiganDetroit 248.262.1950
MinnesotaMinneapolis 612.332.0001
MissouriKansas City 816.412.2400St. Louis 314.735.2200
NevadaReno 775.786.1520
New JerseyEdison 732.516.5500
New Mexico Albuquerque 505.855.7900
New YorkLong Island 631.249.6001Downtown 212.422.1000Midtown 212.599.0100
North CarolinaCharlotte 704.632.3500Greensboro 336.271.3900Raleigh 919.881.2700
OhioCincinnati 513.762.5000Cleveland 216.771.1400
OklahomaOklahoma City 405.218.2800Tulsa 918.877.0800
OregonPortland 503.222.3562
PennsylvaniaPhiladelphia 215.561.4200
South CarolinaColumbia 803.231.3100
TexasDallas 214.561.2300Houston 832.476.3600San Antonio 210.881.1800
UtahSalt Lake City 801.415.1000
VirginiaAlexandria 703.837.4400McLean 703.847.7500
WashingtonSeattle 206.623.1121
Washington, D.C.
Washington, D.C. 202.296.7800
WisconsinAppleton 920.968.6700Madison 608.257.6761Milwaukee 414.289.8200

8/8/2019 IPO Crisis June 2010 FINAL
http://slidepdf.com/reader/full/ipo-crisis-june-2010-final 31/32

8/8/2019 IPO Crisis June 2010 FINAL
http://slidepdf.com/reader/full/ipo-crisis-june-2010-final 32/32
© Grant Thornton LLP
Content in this publication is not intended to answerspecific questions or suggest suitability of action ina particular case. For additional information onthe issues discussed, consult a Grant Thorntonclient-service partner.
Related Documents