Iowa Northland Regional Transportation Authority LONG-RANGE TRANSPORTATION PLAN Adopted December 17, 2020 2045 2045

Welcome message from author
This document is posted to help you gain knowledge. Please leave a comment to let me know what you think about it! Share it to your friends and learn new things together.
Transcript
Iowa Northland Regional Transportation Authority
LONG-RANGE TRANSPORTATION PLAN
Adopted December 17, 2020
2045 2045

This page intentionally left blank
RESOLUTION OF THE IOWA NORTHLAND REGIONAL TRANSPORTATION AUTHORITY
WHEREAS, the Iowa Northland Regional Transportation Authority Policy Board has been designated as the Regional Planning Affiliation for Black Hawk, Bremer, Buchanan, Butler, Chickasaw, and Grundy Counties, excluding the Waterloo-Cedar Falls metropolitan area; and
WHEREAS, the Policy Board in cooperation with the state is conducting a continuing, cooperative, and comprehensive (3-C) transportation planning process pursuant to 23 CFR 450 (b); and
WHEREAS, this planning process shall lead to the development, maintenance, and operation of an integrated system that considers all relevant modes of transportation for the efficient movement of people and goods; and
WHEREAS, the Policy Board, in cooperation with the Federal Highway Administration, the Federal Transit Administration, the Iowa Department of Transportation, the Regional Transit Commission, and city and county jurisdictions has developed an integrated and multimodal 2045 Long-Range Transportation Plan in compliance with Iowa Department of Transportation guidelines; and
WHEREAS, the Policy Board has included the open participation of the public in the development of the 2045 Long-Range Transportation Plan in conformance with the Policy Board's approved Public Participation Plan; and
WHEREAS, the Policy Board certifies that the 2045 Long-Range Transportation Plan was developed in accordance with 23 CFR 450 (b), and is being conducted in accordance with all applicable requirements.
NOW, THEREFORE BE IT RESOLVED that the Iowa Northland Regional Transportation Authority Policy Board hereby approves the 2045 Long-Range Transportation Plan for the Iowa Northland Region; and
BE IT FURTHER RESOLVED that the Iowa Northland Regional Transportation Authority Policy Board certifies that the 2045 Long-Range Transportation Plan is consistent with the transportation planning process as described in 23 CFR 450 (b).
Passed and adopted this 17th day of December, 2020.
____________________________________ Gary Gissel, Chair
ATTEST:
____________________________________ Kevin Blanshan, INRCOG Executive Director

This page intentionally left blank
TABLE OF CONTENTS
Chapter 1 – Overview 1 Purpose of the Long-Range Transportation Plan 2 Regional Planning Affiliations 3 Iowa Northland Regional Transportation Authority 3 Transportation Planning Process 6 Federal and State Legislation 6 FAST Act Planning Factors 6 FAST Act National Goals 7 State Transportation Plans 8
Iowa in Motion 2045 State Transportation Plan 8 Iowa Transportation Asset Management Plan 2019 9 Iowa Strategic Highway Safety Plan 2019 10 Iowa State Freight Plan 2018 11 Iowa Public Transit 2050 Long Range Plan 11
Performance-Based Planning and Programming 12 RTA Goals, Objectives, and Performance Measures 13
Chapter 2 – Region Profile 15 Population 16 Population Projections 17 Age 18 Diversity 18 Household Income 22 Cost of Housing 24 Vehicles per Household 25 Disabilities 25 Employment 27 Employment Projections 27 Employment by Industry 28 Unemployment 29 Mode of Transportation to Work 30 Commute to Work 30 Major Employers 34 Activity Centers 34
Chapter 3 – Roads and Bridges 36 State Road and Bridge Plans 37
Iowa in Motion 2045 State Transportation Plan 37 Iowa Transportation Asset Management Plan 2019 40 Roadway Inventory 41 Roadway Conditions 43
Pavement Condition Index 43 International Roughness Index 44 Average Annual Daily Traffic 44
Bridge Inventory 48 Bridge Conditions 48
Posted and Closed Bridges 48 Structurally Deficient Bridges 49 Sufficiency Ratings 49
Short-Term Road and Bridge Projects 55 RTA Projects 55
Iowa DOT Projects 59 Funding Deficiencies 59
Long-Term Corridor Projects 61 Technological Change 64
Connected and Autonomous Vehicles (CAV) 64 Alternative-Fuel Vehicles 65
Iowa Advisory Council on Automated Transportation (AT Council) 65 2020 Public Input Survey 66
Chapter 4 – Transit 67 State Transit Plan 68 Transit Planning 68 Transit Asset Management Plan 69 Transit Advisory Committee (TAC) 69 Public Input 70
Transit Advisory Committee (TAC) 70 Passenger Transportation Survey 70 2012 Public Input Survey 72 2020 Public Input Survey 72
Transit Service 74 Transit Ridership 75 Transit Ridership Forecasts 75 Planning Concerns 76
Transit Demand 76 Ridesharing and Car Sharing 78 Driver Recruitment and Retention 78 Vehicle Replacement 78 Increasing Costs 79 Regulations 80 Medicaid Brokerage 80 Technology 80 Coordination of Services and Marketing 81
Projects and Initiatives 81
Chapter 5 – Bicycle and Pedestrian 85 State Bicycle and Pedestrian Plan 86 Overview of Bicycle and Pedestrian Facilities 87 Site-Specific Bicycle and Pedestrian Treatments 89 National Guidance 92 State Guidance 94 Existing Facilities 96
American Discovery Trail 96 Great American Rail-Trail 99 Cedar Valley Nature Trail 99 Rolling Prairie Trail 101 Comet Trail 101 Pioneer Trail 101
Current Planning 103 2045 Bicycle Accommodation Plan 103 Rolling Prairie Trail Wayfinding and Guide Signs 105 Trail Counters 105 2020 Public Input Survey 107
Other Non-Motorized Projects 109 Black Hawk County Water Trails Master Plan 109 Wapsipinicon River Water Trail 110 Safe Routes to School 112
Short-Term Bicycle and Pedestrian Projects 113 Long-Term Vision 113
Chapter 6 – Freight 114 Freight Background 115 State Freight Plans 116
Iowa State Freight Plan 116 Iowa State Rail Plan 118 Freight at the National Level 119 Freight in Iowa 121 Freight in the Region 125 Truck Transportation 129
Highway Network 129 Truck Transportation Planning Issues 130
Rail Transportation 132 Passenger Rail 133
Rail Transportation Planning Issues 134 Pipeline Transportation 136 Air Transportation 137
Waterloo Regional Airport (ALO) 137 Independence Municipal Airport (IIB) 138 Allison Municipal Airport (K98) 139 Grundy Center Municipal Airport (6K7) 139 New Hampton Municipal Airport (1Y5) 139 Waverly Municipal Airport (C25) 139 Recent and Planned Improvements 140 Commercial Service 141 Air Transportation Planning Issues 141
2020 Public Input Survey 142
Chapter 7 – Safety and Security 143 National Crash Background 144 Iowa Crash Statistics 144 Region Crash Statistics 145 Safety Plans and Efforts 149
Iowa Strategic Highway Safety Plan 2019 149 Iowa Crash Analysis Tool 150 Local Road Safety Workshops 150 Iowa DOT Top 200 Safety Improvement Candidate Locations 150 Drive Safe Cedar Valley 151 Local Road Safety Plans 151
State Safety Legislation 152 Ignition Interlock 152 Statewide Sobriety and Drug Monitoring Program 152 Use of Electronic Communication 152 Homicide-by-vehicle 152 Blue and White Lights 152 Move Over or Slow Down 153 Future Legislative Strategies 153
Safety Improvements 154 Longitudinal Rumble Strips and Stripes 154 SafetyEdgeSM 154 Roundabouts 155 Systemic Application of Multiple Low-Cost Countermeasures at Stop-Controlled Intersections 156 Roadside Design Improvements 157 Road Diet 158 Corridor Access Management 158 Medians and Pedestrian Crossing Islands in Urban and Suburban Areas 159 Leading Pedestrian Intervals 159
Walkways 160 Pedestrian Hybrid Beacons 160 Funding Programs for Safety Projects 161
Traffic Safety Improvement Program (TSIP) 161 Highway Safety Improvement Program (HSIP) – Secondary 161 Iowa Traffic Engineering Assistance Program (TEAP) 162 Sign Replacement Program for Cities and Counties 162
Security Planning 163 U.S. DOT Strategic Plan 163 National Response Framework and National Incident Management System 163 Iowa Statewide Traffic Management Center (TMC) 163 Intelligent Transportation Systems (ITS) 164 2018 Black Hawk County Evacuation Plan 165 Multi-Jurisdiction Hazard Mitigation Plans 165
2020 Public Input Survey 166
Chapter 8 – Environmental Review 167 Environmental Review Background 168 Federal Requirements 168 Environmental Strategy 172 Local Mitigation Examples 172 Mitigation Activities 174 Integrated Roadside Vegetation Management 175 Environmental Analysis 176
Major Water Sources 177 Watersheds 178 Impaired Waters 179 Floodplains 181 Wetlands 182 Archeological and Historic Sites 183 Additional Environmental Factors 184
Consultation 189
Chapter 9 – Financial Analysis 190 Traditional Transportation Revenue Sources 191 Federal Funding 191 State Funding 194 Local Funding 196 RTC Funding Analysis 197 RTA Funding Analysis 198 Funding Deficiencies 201 Short-Term Road and Bridge Projects 202 RTA Project Selection Process 206
Iowa’s Transportation Alternatives Program (TAP) 206 Surface Transportation Block Grant (STBG) Program 207
Chapter 10 – Public Involvement 209 Public Participation Plan 210 Public Involvement Efforts 212
2020 Public Input Survey 212 Passenger Transportation Survey 213 Policy Board and Technical Committee 213 Website and Social Media 213 Long-Range Transportation Plan Public Input Meetings 214 External Stakeholder Consultation 214

Appendices 215 Appendix I – RTA Committees 216 Appendix II – Acronyms 218 Appendix III – Public Input Survey 220 Appendix IV – Public Comments & Supporting Information 241
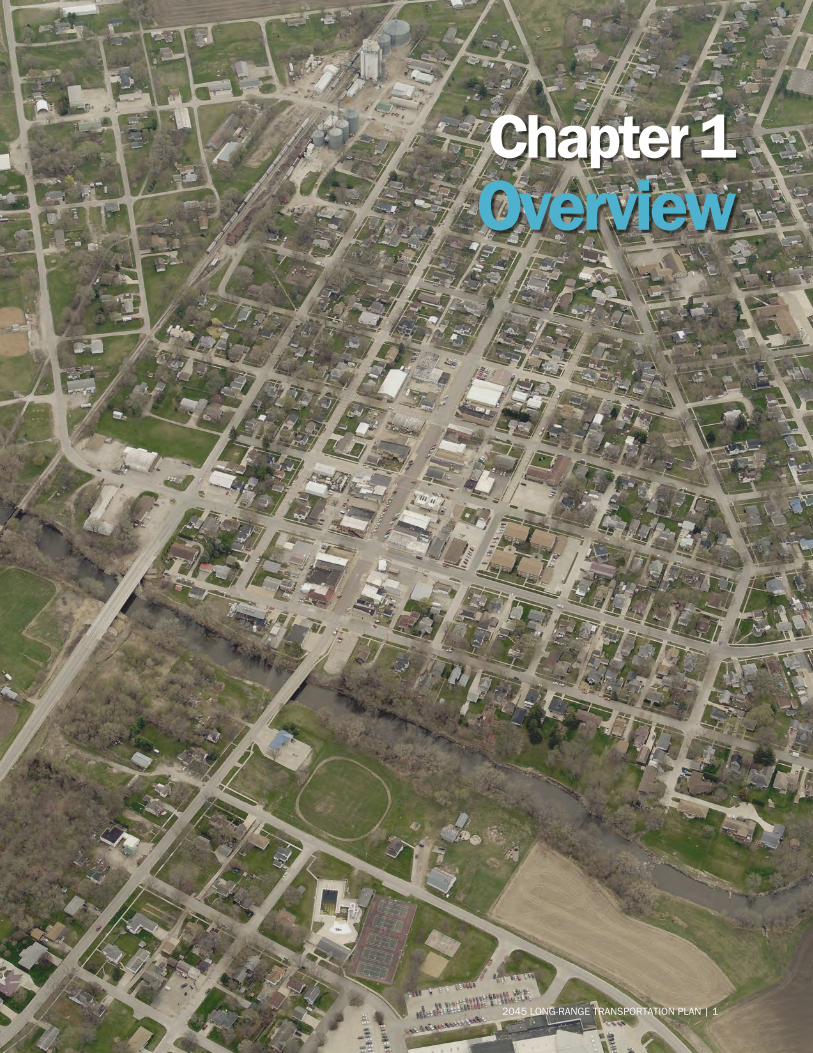
Chapter 1
Overview
2045 LONG-RANGE TRANSPORTATION PLAN | 1
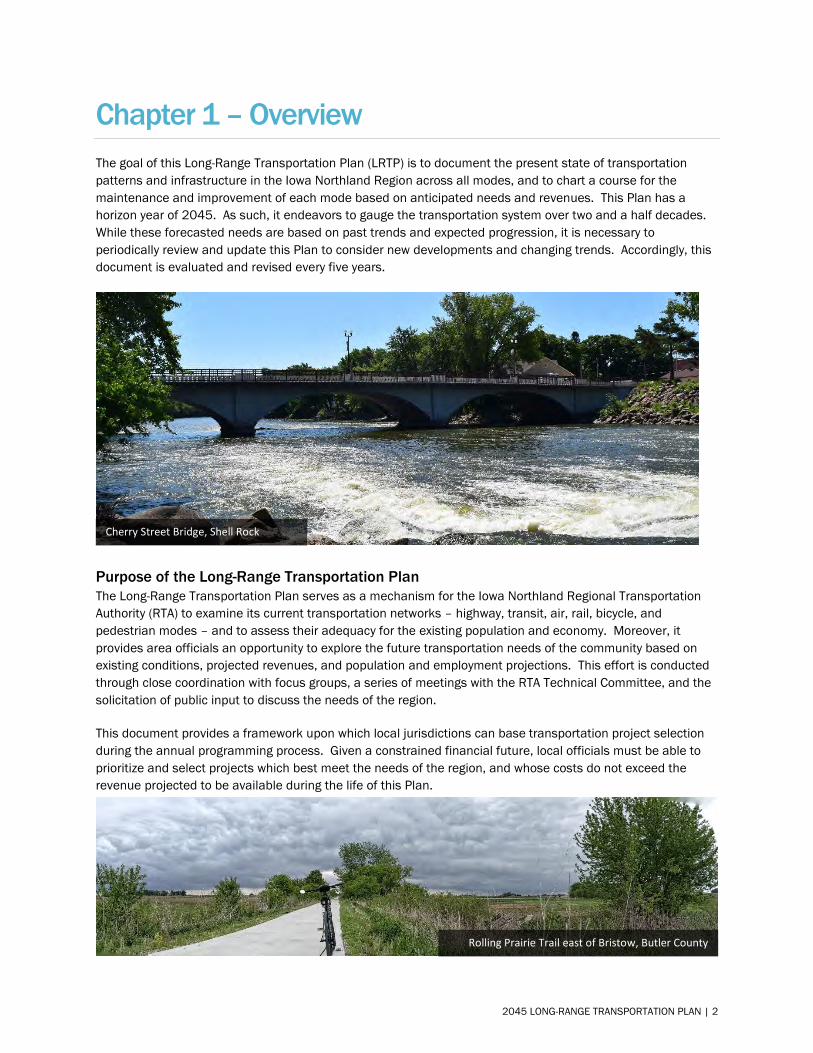
Chapter 1 – Overview The goal of this Long-Range Transportation Plan (LRTP) is to document the present state of transportation patterns and infrastructure in the Iowa Northland Region across all modes, and to chart a course for the maintenance and improvement of each mode based on anticipated needs and revenues. This Plan has a horizon year of 2045. As such, it endeavors to gauge the transportation system over two and a half decades. While these forecasted needs are based on past trends and expected progression, it is necessary to periodically review and update this Plan to consider new developments and changing trends. Accordingly, this document is evaluated and revised every five years.
Purpose of the Long-Range Transportation Plan The Long-Range Transportation Plan serves as a mechanism for the Iowa Northland Regional Transportation Authority (RTA) to examine its current transportation networks – highway, transit, air, rail, bicycle, and pedestrian modes – and to assess their adequacy for the existing population and economy. Moreover, it provides area officials an opportunity to explore the future transportation needs of the community based on existing conditions, projected revenues, and population and employment projections. This effort is conducted through close coordination with focus groups, a series of meetings with the RTA Technical Committee, and the solicitation of public input to discuss the needs of the region.
This document provides a framework upon which local jurisdictions can base transportation project selection during the annual programming process. Given a constrained financial future, local officials must be able to prioritize and select projects which best meet the needs of the region, and whose costs do not exceed the revenue projected to be available during the life of this Plan.
Cherry Street Bridge, Shell Rock
Rolling Prairie Trail east of Bristow, Butler County
2045 LONG-RANGE TRANSPORTATION PLAN | 2
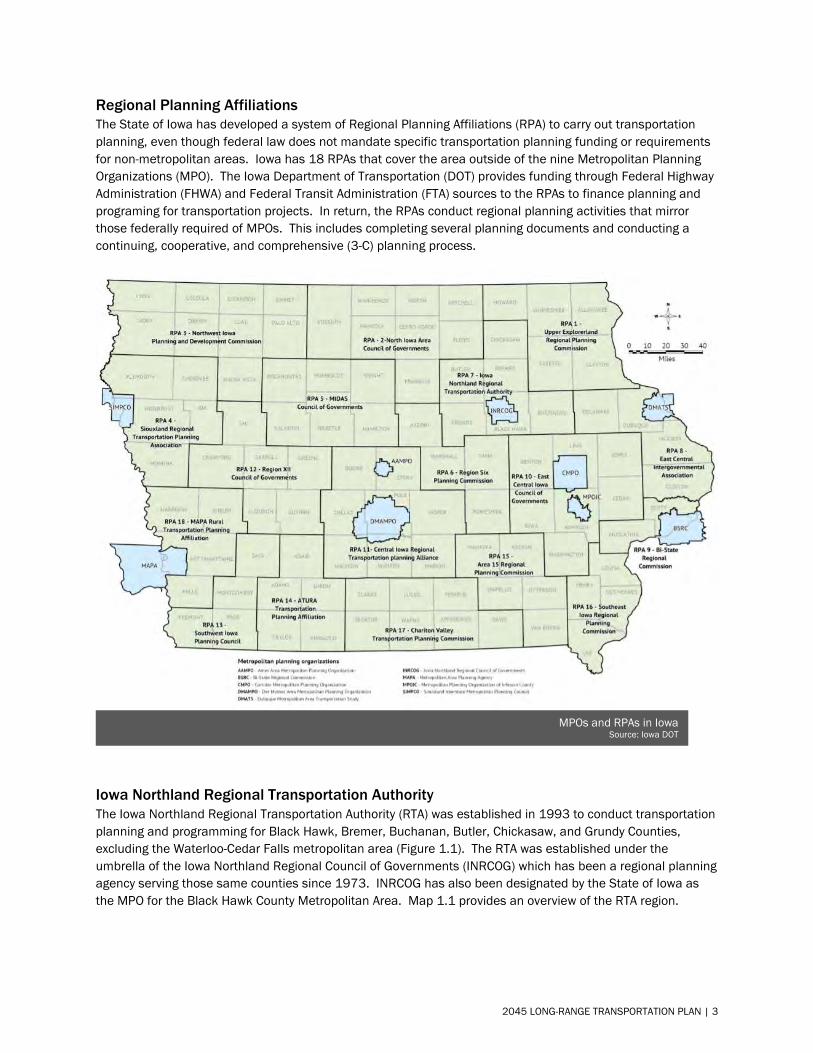
Regional Planning Affiliations The State of Iowa has developed a system of Regional Planning Affiliations (RPA) to carry out transportation planning, even though federal law does not mandate specific transportation planning funding or requirements for non-metropolitan areas. Iowa has 18 RPAs that cover the area outside of the nine Metropolitan Planning Organizations (MPO). The Iowa Department of Transportation (DOT) provides funding through Federal Highway Administration (FHWA) and Federal Transit Administration (FTA) sources to the RPAs to finance planning and programing for transportation projects. In return, the RPAs conduct regional planning activities that mirror those federally required of MPOs. This includes completing several planning documents and conducting a continuing, cooperative, and comprehensive (3-C) planning process.
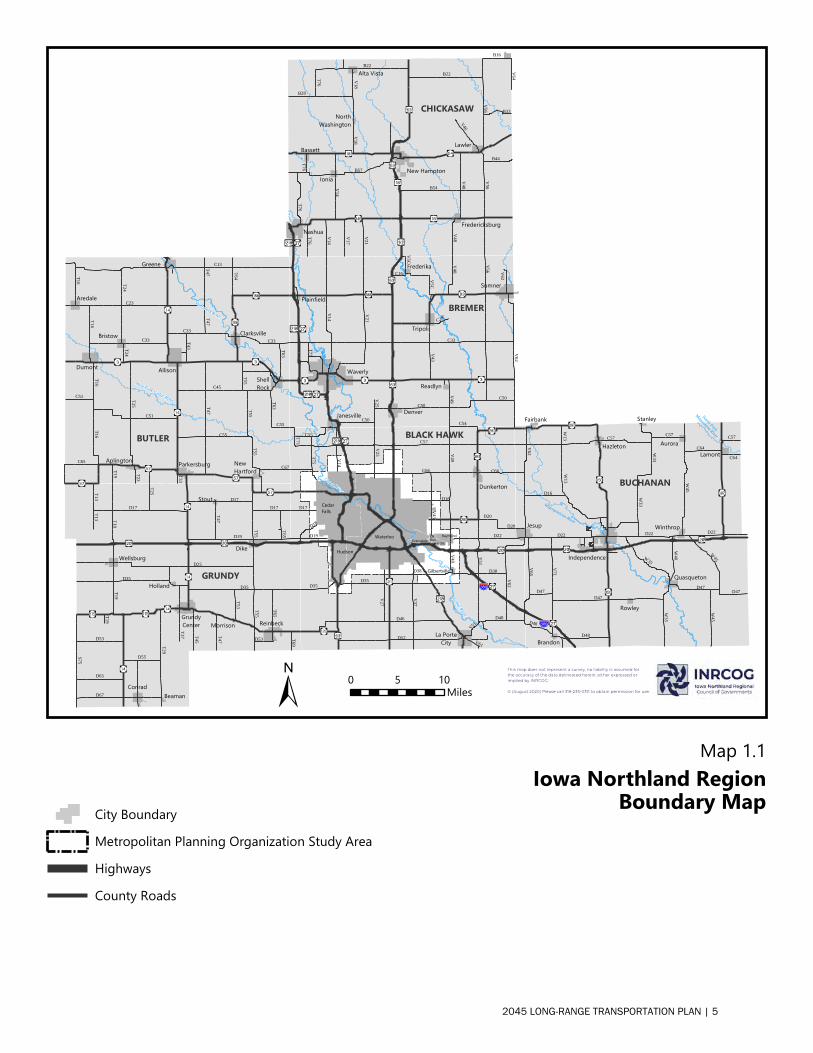
Iowa Northland Regional Transportation Authority The Iowa Northland Regional Transportation Authority (RTA) was established in 1993 to conduct transportation planning and programming for Black Hawk, Bremer, Buchanan, Butler, Chickasaw, and Grundy Counties, excluding the Waterloo-Cedar Falls metropolitan area (Figure 1.1). The RTA was established under the umbrella of the Iowa Northland Regional Council of Governments (INRCOG) which has been a regional planning agency serving those same counties since 1973. INRCOG has also been designated by the State of Iowa as the MPO for the Black Hawk County Metropolitan Area. Map 1.1 provides an overview of the RTA region.
MPOs and RPAs in Iowa Source: Iowa DOT
2045 LONG-RANGE TRANSPORTATION PLAN | 3
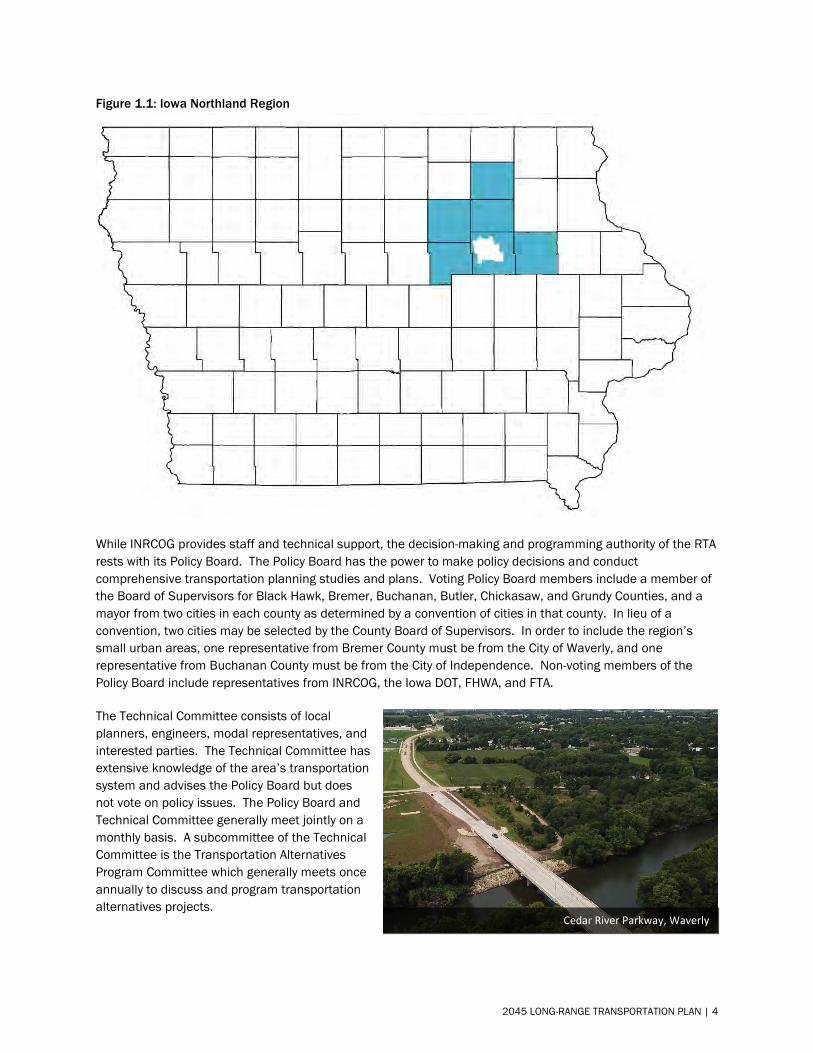
Figure 1.1: Iowa Northland Region
While INRCOG provides staff and technical support, the decision-making and programming authority of the RTA rests with its Policy Board. The Policy Board has the power to make policy decisions and conduct comprehensive transportation planning studies and plans. Voting Policy Board members include a member of the Board of Supervisors for Black Hawk, Bremer, Buchanan, Butler, Chickasaw, and Grundy Counties, and a mayor from two cities in each county as determined by a convention of cities in that county. In lieu of a convention, two cities may be selected by the County Board of Supervisors. In order to include the region’s small urban areas, one representative from Bremer County must be from the City of Waverly, and one representative from Buchanan County must be from the City of Independence. Non-voting members of the Policy Board include representatives from INRCOG, the Iowa DOT, FHWA, and FTA.
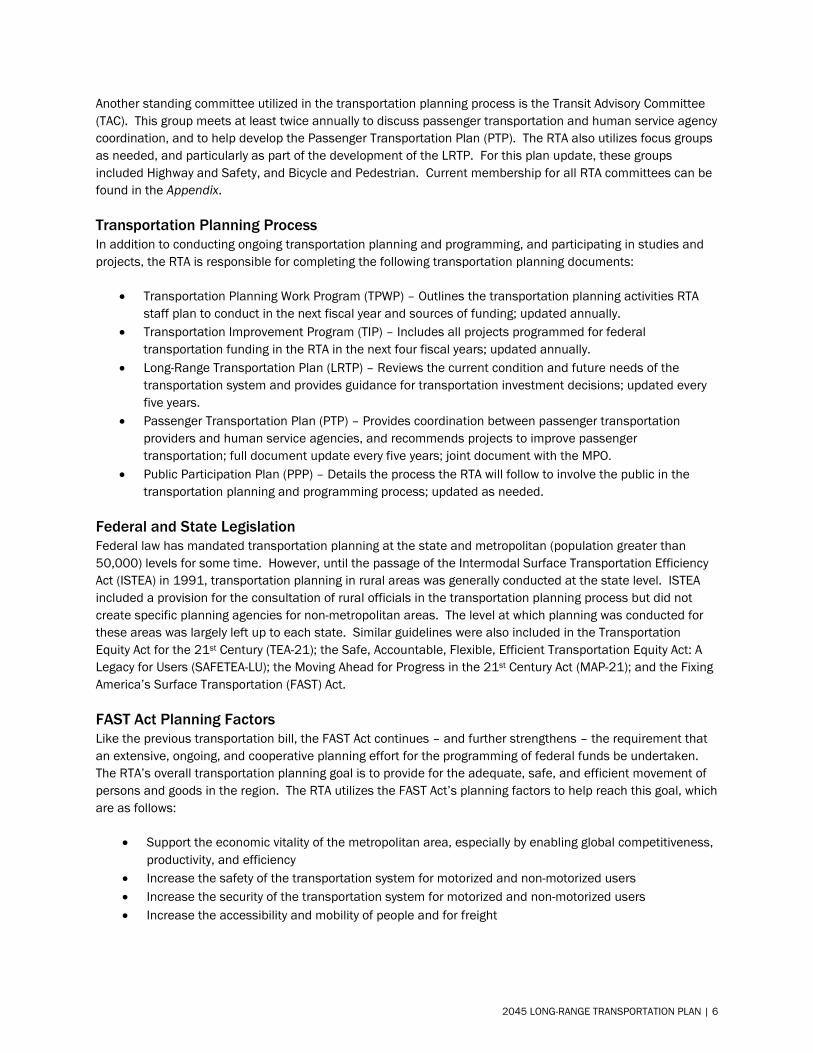
The Technical Committee consists of local planners, engineers, modal representatives, and interested parties. The Technical Committee has extensive knowledge of the area’s transportation system and advises the Policy Board but does not vote on policy issues. The Policy Board and Technical Committee generally meet jointly on a monthly basis. A subcommittee of the Technical Committee is the Transportation Alternatives Program Committee which generally meets once annually to discuss and program transportation alternatives projects.
Cedar River Parkway, Waverly
2045 LONG-RANGE TRANSPORTATION PLAN | 4
Waterloo
CedarFalls
Waverly
Hudson
Allison
Evansdale
Jesup
Sumner
IndependenceDike
Dumont
La PorteCity
Tripoli
Reinbeck
Raymond
Denver
Conrad
Greene
ShellRock
GrundyCenter
Aredale
Bristow Clarksville
Wellsburg
Parkersburg
Hazleton
Quasqueton
Dunkerton
Aurora
ElkRun Heights
Aplington
Stout
Rowley
Winthrop
Fairbank
Frederika
Brandon
NewHartford
Readlyn
Plainfield
Janesville
Holland
Gilbertville
Stanley
Beaman
Morrison
Lamont
New Hampton
Fredericksburg
Lawler
Alta Vista
NorthWashington
Bassett
Ionia
Nashua
Cedar River
Cedar River
South Fork
Maquoketa River
Wapsipinicon River
West Fork Cedar River
Shell Rock River
C57
D46
D52
C66
V49
V37
V62
D22
V43
D38
V27V25T75
D48
C55
V14
D20
D16
D35
C54
D19
D17
D18
V61
V51
D38
V51
V49
C66
D35
T71
C33
V56
V21
V14
V43V5C
V49V48
C50
V62
T77
C16
C28
V25
C50C50
V62
V5C
C57
D47
V62
V71
D16
V65
D22
D48
W33
W45
W35
W40
C64
W13
D20
D47
W13
D22
C64
D48
W45
D47
W45
W33
D47
D22
W35
C57 C57
C13
T47
C23
T25
C45
C51
C33
T24
C55
T55
T64
T16
T63
C65C67
T43
T19 T23 T33
T16
T47
C51
T55
C55
T24
T47T16
T63
C33
T16
C33
T55
B57
V56
B28
V48B54
V18
T76
V46
V21
V14
V17
B16
B44
V56
T76
V18
T76
V48
B22B22
T76
V14
B33
V64
D25T55
D19
D35
T29
S75
D17
T19D67
T37
T65
D65
D53 T45
T47
D55
T53
T13
T25
T69
T19
D17
T47
T13
T55
T19
D53
D35
D17
T65
BUTLER
GRUNDY
BREMER
BUCHANAN
BLACK HAWK
CHICKASAW
Map 1.1Iowa Northland Region
Boundary Map
0 105Miles
City BoundaryMetropolitan Planning Organization Study AreaHighwaysCounty Roads
This map does not represent a survey, no liability is assumed forthe accuracy of the data delineated herein, either expressed or implied by INRCOG.
© (August 2020) Please call 319-235-0311 to obtain permission for use.
2045 LONG-RANGE TRANSPORTATION PLAN | 5
Another standing committee utilized in the transportation planning process is the Transit Advisory Committee (TAC). This group meets at least twice annually to discuss passenger transportation and human service agency coordination, and to help develop the Passenger Transportation Plan (PTP). The RTA also utilizes focus groups as needed, and particularly as part of the development of the LRTP. For this plan update, these groups included Highway and Safety, and Bicycle and Pedestrian. Current membership for all RTA committees can be found in the Appendix.
Transportation Planning Process In addition to conducting ongoing transportation planning and programming, and participating in studies and projects, the RTA is responsible for completing the following transportation planning documents:
• Transportation Planning Work Program (TPWP) – Outlines the transportation planning activities RTAstaff plan to conduct in the next fiscal year and sources of funding; updated annually.
• Transportation Improvement Program (TIP) – Includes all projects programmed for federaltransportation funding in the RTA in the next four fiscal years; updated annually.
• Long-Range Transportation Plan (LRTP) – Reviews the current condition and future needs of thetransportation system and provides guidance for transportation investment decisions; updated everyfive years.
• Passenger Transportation Plan (PTP) – Provides coordination between passenger transportationproviders and human service agencies, and recommends projects to improve passengertransportation; full document update every five years; joint document with the MPO.
• Public Participation Plan (PPP) – Details the process the RTA will follow to involve the public in thetransportation planning and programming process; updated as needed.
Federal and State Legislation Federal law has mandated transportation planning at the state and metropolitan (population greater than 50,000) levels for some time. However, until the passage of the Intermodal Surface Transportation Efficiency Act (ISTEA) in 1991, transportation planning in rural areas was generally conducted at the state level. ISTEA included a provision for the consultation of rural officials in the transportation planning process but did not create specific planning agencies for non-metropolitan areas. The level at which planning was conducted for these areas was largely left up to each state. Similar guidelines were also included in the Transportation Equity Act for the 21st Century (TEA-21); the Safe, Accountable, Flexible, Efficient Transportation Equity Act: A Legacy for Users (SAFETEA-LU); the Moving Ahead for Progress in the 21st Century Act (MAP-21); and the Fixing America’s Surface Transportation (FAST) Act.
FAST Act Planning Factors Like the previous transportation bill, the FAST Act continues – and further strengthens – the requirement that an extensive, ongoing, and cooperative planning effort for the programming of federal funds be undertaken. The RTA’s overall transportation planning goal is to provide for the adequate, safe, and efficient movement of persons and goods in the region. The RTA utilizes the FAST Act’s planning factors to help reach this goal, which are as follows:
• Support the economic vitality of the metropolitan area, especially by enabling global competitiveness,productivity, and efficiency
• Increase the safety of the transportation system for motorized and non-motorized users• Increase the security of the transportation system for motorized and non-motorized users• Increase the accessibility and mobility of people and for freight
2045 LONG-RANGE TRANSPORTATION PLAN | 6
• Protect and enhance the environment, promote energy conservation, improve the quality of life, andpromote consistency between transportation improvements and State and local planned growth andeconomic development patterns
• Enhance the integration and connectivity of the transportation system, across and between modes,for people and freight
• Promote efficient system management and operation• Emphasize the preservation of the existing transportation system• Improve the resiliency and reliability of the transportation system and reduce or mitigate stormwater
impacts on surface transportation• Enhance travel and tourism
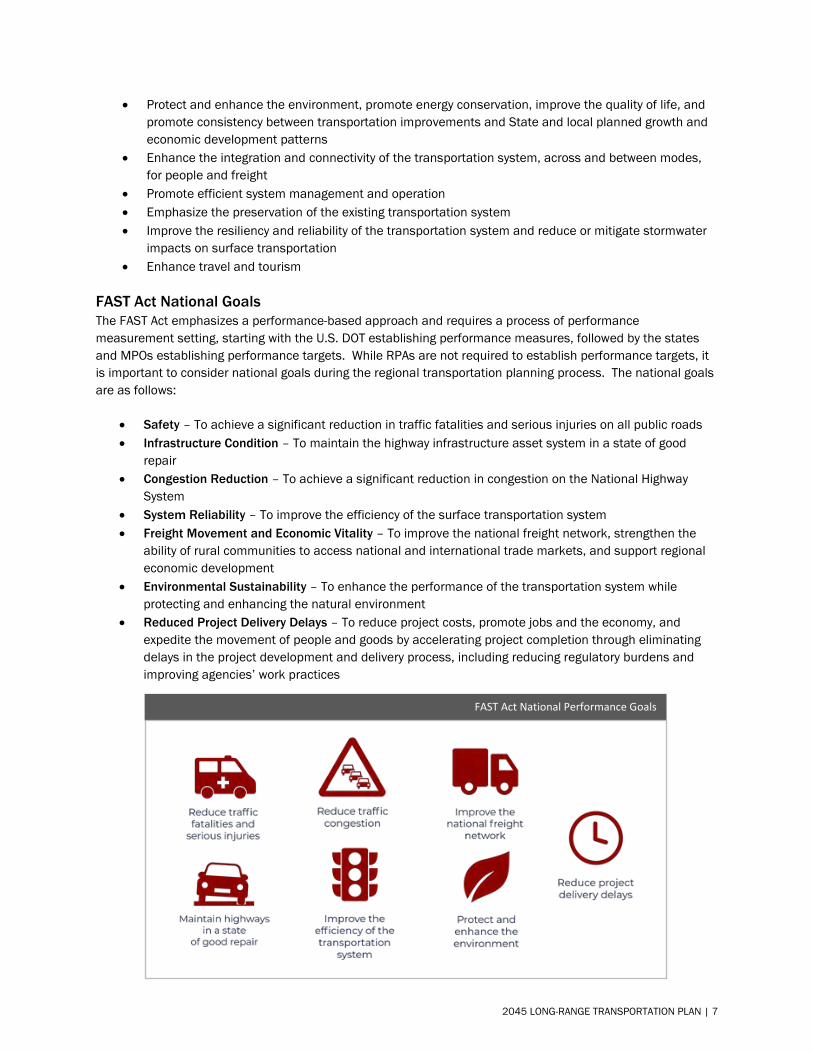
FAST Act National Goals The FAST Act emphasizes a performance-based approach and requires a process of performance measurement setting, starting with the U.S. DOT establishing performance measures, followed by the states and MPOs establishing performance targets. While RPAs are not required to establish performance targets, it is important to consider national goals during the regional transportation planning process. The national goals are as follows:
• Safety – To achieve a significant reduction in traffic fatalities and serious injuries on all public roads• Infrastructure Condition – To maintain the highway infrastructure asset system in a state of good
repair• Congestion Reduction – To achieve a significant reduction in congestion on the National Highway
System• System Reliability – To improve the efficiency of the surface transportation system• Freight Movement and Economic Vitality – To improve the national freight network, strengthen the
ability of rural communities to access national and international trade markets, and support regionaleconomic development
• Environmental Sustainability – To enhance the performance of the transportation system whileprotecting and enhancing the natural environment
• Reduced Project Delivery Delays – To reduce project costs, promote jobs and the economy, andexpedite the movement of people and goods by accelerating project completion through eliminatingdelays in the project development and delivery process, including reducing regulatory burdens andimproving agencies’ work practices
FAST Act National Performance Goals
2045 LONG-RANGE TRANSPORTATION PLAN | 7
State Transportation Plans The public is the primary beneficiary of the nation’s intermodal transportation system built to serve public mobility and productivity. Transportation decisions must be made in an environmentally sensitive way, using a comprehensive planning process that includes the public and considers land use, development, safety, and security. The vision of the Iowa DOT and the Transportation Commission is “A safe and efficient multimodal transportation system that enables the social and economic wellbeing of all Iowans, provides enhanced access and mobility for people and freight, and accommodates the unique needs of urban and rural areas in an environmentally conscious manner.” The Iowa DOT has adopted several plans to address federal requirements and guide transportation investments to achieve the system vision.
Iowa in Motion 2045 State Transportation Plan Adopted in 2017, the State Transportation Plan is a long-range document that addresses federal requirements and serves as a transportation investment guide for each transportation mode. This document is updated every five years in order to stay current with trends, forecasts, and factors that influence decision-making. The State Transportation Plan includes the following:
• Trends – An analysis of demographic, economic, passenger, and freight trends.• System condition – An overview of each mode within the transportation system.• Vision – A broad statement that captures the overall vision for Iowa’s future transportation system.• Investment areas – Four overarching areas within which actions are defined to implement the system
vision.• Strategies and improvement needs – Actions and initiatives to implement the vision.• Costs and revenues – An analysis of anticipated costs and revenues for each mode.• Implementation – A discussion related to addressing funding needs, programming future investments,
and continuous performance monitoring.
The prior Plan focused on policy issues and not on specific actionable items. The 2045 Plan provides specific strategies and improvement needs that can be implemented and revisited over time. Notable enhancements include extensive internal and external stakeholder and public input efforts throughout the plan development; and a multimodal action plan, with specific modal strategies and improvement needs.
Four principal investment areas with specific strategies and improvement types were identified to help achieve the system vision. The investment areas include:
• Stewardship through maintaining a state of goodrepair.
• Modification through rightsizing the system.• Optimization through improving operational efficiency and resiliency.• Transformation through increasing mobility and travel choices.
2045 LONG-RANGE TRANSPORTATION PLAN | 8
A wide range of strategies have been identified to achieve the vision. Strategies were derived from a variety of sources, including ongoing activities, existing plans, and stakeholder and public input. A total of 80 strategies were identified across the following categories:
• Asset management• Aviation• Bicycle/pedestrian• Bridge• Energy
• Freight• Highway• Public Transit• Rail• Safety
• Technology • Transportation System Management andOperation (TSMO)
A multi-pronged approach was used to help determine improvement needs across the multimodal system. For highways and bridges, a seven-layer analysis was conducted. The Primary Highway System was divided into 464 corridors for analysis, and needs were identified at the corridor level. A comprehensive matrix covering the entire Primary Highway System is included in the Plan. The matrix shows which needs were identified for each highway corridor. For aviation, bicycle and pedestrian, public transit, rail, and water, needs were derived from existing system plans for those modes or from updated analysis where warranted.
www.iowadot.gov/iowainmotion
Iowa Transportation Asset Management Plan 2019 Transportation asset management is a strategic approach to managing transportation infrastructure. It embodies a philosophy that is comprehensive, proactive, and long-term. The overall goals of asset management are to minimize long-term costs, extend the life of the transportation system, and improve the performance of the transportation system. Transportation Asset Management Plans (TAMP) act as a focal point for information about the state’s assets, management strategies, long-term expenditure forecasts, and business management processes. The Iowa DOT’s TAMP describes how the Iowa DOT manages its bridges and pavements throughout their lives. The document also connects the state transportation plan and system and modal plans to the Iowa DOT’s five-year Transportation Improvement Program. In addition to meeting federal requirements, this TAMP meets the following objectives:
• Defines clear links among agency goals, objectives, and decisions• Defines the relationship between proposed funding levels and expected results• Develops a long-term outlook for asset performance• Documents how decisions are supported by sound information• Develops a feedback loop from observed performance to subsequent planning and programming
decisions• Improves accountability for decision-making• Unifies existing data, business practices, and divisions to achieve asset management goals
2045 LONG-RANGE TRANSPORTATION PLAN | 9
Consistent with best practices nationally, the Iowa DOT’s asset management goals are to:
• Build, preserve, operate, maintain, upgrade, and enhance the transportation system more cost-effectively throughout its whole life.
• Improve performance of the transportation system.• Deliver to Iowa DOT’s customers the best value for every dollar spent.• Enhance Iowa DOT’s credibility and accountability in its stewardship of transportation assets.
www.iowadot.gov/systems_planning/Planning/Federal-Performance-Management-and-Asset-Management
Iowa Strategic Highway Safety Plan 2019 One method states conduct safety planning is through the development of a highway safety plan. A Strategic Highway Safety plan (SHSP) is a statewide-coordinated safety plan that provides a comprehensive framework for reducing highway fatalities and serious injuries on all public roads. The SHSP establishes statewide goals, objectives, and key emphasis areas developed in consultation with federal, state, local, and private sector safety stakeholders. The 2019 SHSP is the fourth statewide safety plan to be adopted in Iowa.
The 2019 SHSP was developed in consultation with the SHSP Implementation Team which is composed of individuals representing the E’s of safety – education, emergency medical services, enforcement, and engineering. These representatives provide updates on programs, policies, and education campaigns for their respective organizations, as well as data on the latest research for their area of expertise. For this update, the prioritization of Iowa’s 19 safety emphasis areas was supported by an analysis of crash data and an extensive statewide input process involving Iowa’s traffic safety stakeholders. The result of these efforts was the prioritization of eight of the safety emphasis areas that are now considered priority safety emphasis areas. For each of the priority safety emphasis areas, the Implementation Team identified strategies that provide the greatest opportunity to reduce fatalities and serious injuries. The eight priority safety emphasis areas are as follows:
• Lane departures and roadside collisions• Speed-related• Unprotected persons• Young drivers
• Intersections• Impairment involved• Older drivers• Distracted or inattentive drivers
Implementation of the priority safety emphasis areas and strategies will be carried out by the SHSP Implementation Team and broadly supported by traffic safety professionals from around the state. The implementation and progress of the plan will be evaluated on an annual basis of the five-year planning period ending December 2023. The ultimate goal of this plan is Zero Fatalities, however, interim annual goals aligning with the Highway Safety Improvement Program performance measures will be developed during the plan period. Although the Implementation Team is fully committed to reducing the number of fatalities and serious injuries on Iowa’s roadways, it recognizes that commitment pales in comparison to the cumulative impact every driver (fifth “E”) can have on the safety of Iowa’s roadways.
Although Zero Fatalities is Iowa’s long-term vision, the state also recognizes the need to establish short term goals in pursuit of this vision. In 2016, FHWA published the Highway Safety Improvement Program (HSIP) and
2045 LONG-RANGE TRANSPORTATION PLAN | 10
Safety Performance Management (Safety PM) Final Rules. As part of these rules, states are required to develop statewide targets annually for five safety performance measures. These targets serve as the short-term goals for the state.
www.iowadot.gov/traffic/shsp/home
Iowa State Freight Plan 2018 The Iowa DOT has developed a multimodal freight plan to address all modes of the freight transportation system and to incorporate freight considerations into the statewide transportation planning and programming process. The State Freight Plan serves as a platform for safe, efficient, and convenient freight transportation in the state. In recent years, the Iowa DOT has embarked on numerous freight planning activities to help achieve this objective. The State Freight Plan is a way to connect all of these initiatives and allow them to move forward toward a common goal of optimal freight transportation in the state. In addition, the Plan guides Iowa DOT’s investment decisions to maintain and improve the freight transportation system. This plan also:
• Aligns with the state transportation plan: Iowa in Motion 2045.• Meets the requirements of the FAST Act.• Supports national freight goals.
Each of Iowa’s freight-related initiatives plays a role in a collaborative planning and programming process. The tools and studies are utilized to develop system and modal plans, such as the State Freight Plan, which are consistent with the state transportation plan. Projects are then identified, studied, and programmed based on the findings and recommendations provided from each of these initiatives.
www.iowadot.gov/iowainmotion/files/Iowa-State-Freight-Plan-Update-2018.pdf
Iowa Public Transit 2050 Long Range Plan In 2020, the Iowa DOT adopted the Iowa Public Transit 2050 Long Range Plan. While the Iowa DOT has conducted specific planning efforts – Iowa Statewide Passenger Transportation Funding Study, Iowa Park and Ride System Plan – this Plan looks at the public transit system from a broader point of view. The Plan seeks to coordinate planning, programming, and technical assistance statewide to support transit operations at the local level. The goal is to provide specific strategies and improvements that can be implemented and revisited over time.
This Plan serves as a guide to assist the Iowa DOT in making informed public transit decisions for the state. The strategies and action items within the plan serve as the starting points for the implementation phase of the planning process. The transit plan will also be updated every five years in order to stay current with trends, forecasts, and factors that influence decision-making.
www.iowadot.gov/iowainmotion/Modal-Plans/Public-Transit-Plan
2045 LONG-RANGE TRANSPORTATION PLAN | 11
Performance-Based Planning and Programming The foundation of this Plan is built upon performance-based planning and programming. This approach provides a link between short-term management and long-range decisions about policies and investments made for the transportation system. The approach links specific strategies to help improve decision-making and provides accountability for following through on the plan. The building blocks for a performance-based planning process are goals, objectives, and performance measures which are described as:
• Goal – A broad statement that describes a desired end state.• Objective – A specific and measurable statement that supports achievement of a goal.• Performance measure – A metric used to assess progress toward meeting an objective.
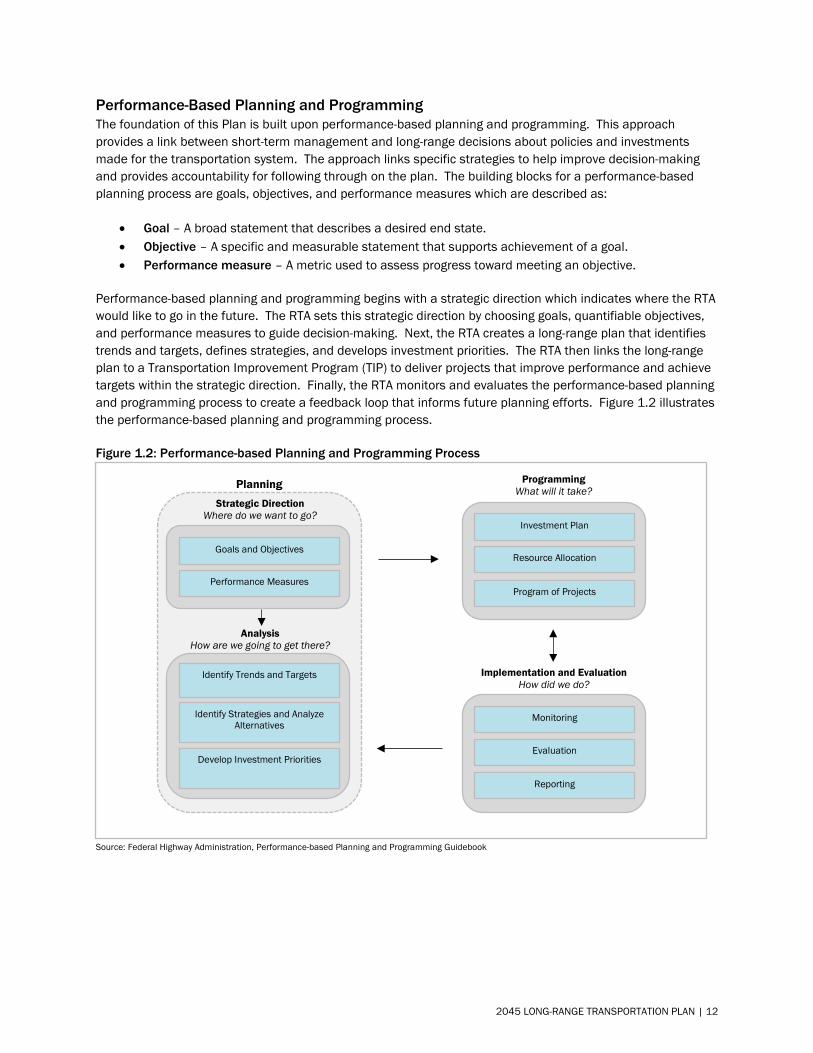
Performance-based planning and programming begins with a strategic direction which indicates where the RTA would like to go in the future. The RTA sets this strategic direction by choosing goals, quantifiable objectives, and performance measures to guide decision-making. Next, the RTA creates a long-range plan that identifies trends and targets, defines strategies, and develops investment priorities. The RTA then links the long-range plan to a Transportation Improvement Program (TIP) to deliver projects that improve performance and achieve targets within the strategic direction. Finally, the RTA monitors and evaluates the performance-based planning and programming process to create a feedback loop that informs future planning efforts. Figure 1.2 illustrates the performance-based planning and programming process.
Figure 1.2: Performance-based Planning and Programming Process
Source: Federal Highway Administration, Performance-based Planning and Programming Guidebook
Planning
Goals and Objectives
Performance Measures
Strategic Direction Where do we want to go?
Analysis How are we going to get there?
Identify Trends and Targets
Identify Strategies and Analyze Alternatives
Develop Investment Priorities
Investment Plan
Resource Allocation
Program of Projects
Programming What will it take?
Monitoring
Evaluation
Reporting
Implementation and Evaluation How did we do?
2045 LONG-RANGE TRANSPORTATION PLAN | 12
RTA Goals, Objectives, and Performance Measures The RTA identified four goals for the 2045 Long-Range Transportation Plan which are to:
• Increase the safety of the transportation system.• Strategically preserve the existing infrastructure.• Support an efficient transportation system.• Provide a high degree of multimodal accessibility and mobility.
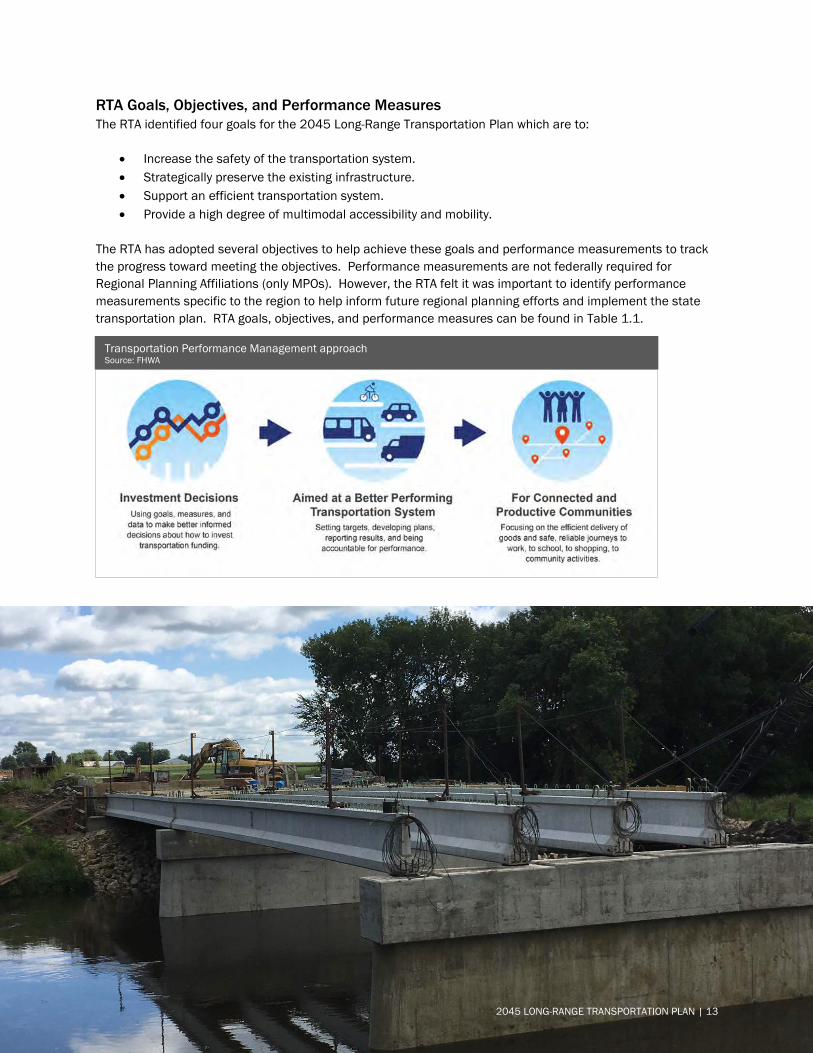
The RTA has adopted several objectives to help achieve these goals and performance measurements to track the progress toward meeting the objectives. Performance measurements are not federally required for Regional Planning Affiliations (only MPOs). However, the RTA felt it was important to identify performance measurements specific to the region to help inform future regional planning efforts and implement the state transportation plan. RTA goals, objectives, and performance measures can be found in Table 1.1.
Transportation Performance Management approach Source: FHWA
2045 LONG-RANGE TRANSPORTATION PLAN | 13
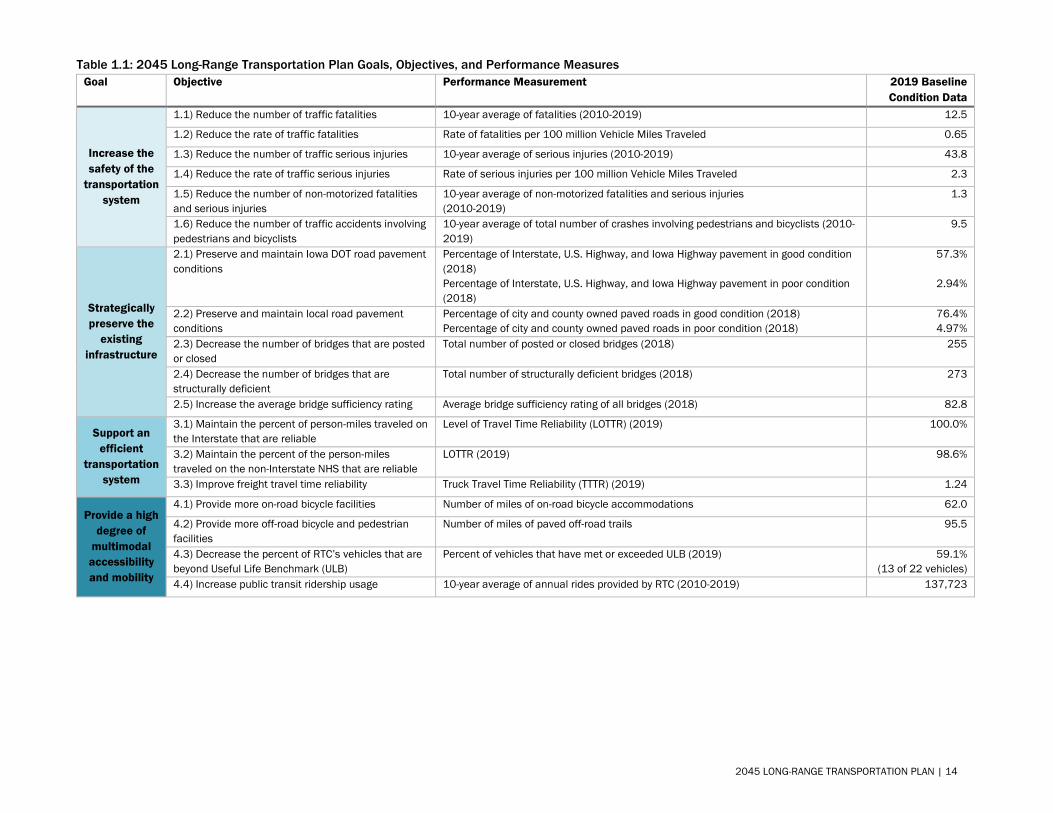
Table 1.1: 2045 Long-Range Transportation Plan Goals, Objectives, and Performance Measures Goal Objective Performance Measurement 2019 Baseline
Condition Data
Increase the safety of the
transportation system
1.1) Reduce the number of traffic fatalities 10-year average of fatalities (2010-2019) 12.5
1.2) Reduce the rate of traffic fatalities Rate of fatalities per 100 million Vehicle Miles Traveled 0.65
1.3) Reduce the number of traffic serious injuries 10-year average of serious injuries (2010-2019) 43.8
1.4) Reduce the rate of traffic serious injuries Rate of serious injuries per 100 million Vehicle Miles Traveled 2.3
1.5) Reduce the number of non-motorized fatalities and serious injuries
10-year average of non-motorized fatalities and serious injuries(2010-2019)
1.3
1.6) Reduce the number of traffic accidents involving pedestrians and bicyclists
10-year average of total number of crashes involving pedestrians and bicyclists (2010-2019)
9.5
Strategically preserve the
existing infrastructure
2.1) Preserve and maintain Iowa DOT road pavement conditions
Percentage of Interstate, U.S. Highway, and Iowa Highway pavement in good condition (2018) Percentage of Interstate, U.S. Highway, and Iowa Highway pavement in poor condition (2018)
57.3%
2.94%
2.2) Preserve and maintain local road pavement conditions
Percentage of city and county owned paved roads in good condition (2018) Percentage of city and county owned paved roads in poor condition (2018)
76.4% 4.97%
2.3) Decrease the number of bridges that are posted or closed
Total number of posted or closed bridges (2018) 255
2.4) Decrease the number of bridges that are structurally deficient
Total number of structurally deficient bridges (2018) 273
2.5) Increase the average bridge sufficiency rating Average bridge sufficiency rating of all bridges (2018) 82.8
Support an efficient
transportation system
3.1) Maintain the percent of person-miles traveled on the Interstate that are reliable
Level of Travel Time Reliability (LOTTR) (2019) 100.0%
3.2) Maintain the percent of the person-miles traveled on the non-Interstate NHS that are reliable
LOTTR (2019) 98.6%
3.3) Improve freight travel time reliability Truck Travel Time Reliability (TTTR) (2019) 1.24
Provide a high degree of
multimodal accessibility and mobility
4.1) Provide more on-road bicycle facilities Number of miles of on-road bicycle accommodations 62.0
4.2) Provide more off-road bicycle and pedestrian facilities
Number of miles of paved off-road trails 95.5
4.3) Decrease the percent of RTC’s vehicles that are beyond Useful Life Benchmark (ULB)
Percent of vehicles that have met or exceeded ULB (2019) 59.1% (13 of 22 vehicles)
4.4) Increase public transit ridership usage 10-year average of annual rides provided by RTC (2010-2019) 137,723
2045 LONG-RANGE TRANSPORTATION PLAN | 14

Chapter 2
Region Profile
2045 LONG-RANGE TRANSPORTATION PLAN | 15
Chapter 2 – Region Profile An understanding of the characteristics of the region is necessary to properly maintain the existing transportation system and plan for future needs, challenges, and opportunities. It is important to review existing conditions and anticipated trends of demographic and economic characteristics, as these elements directly affect the volume and type of transportation taking place and the infrastructure required to meet its demand. This chapter provides an overview of the existing characteristics influencing travel in the region.
Throughout this chapter, data is often discussed at the county level. It is important to note that transportation planning for the metropolitan area of Black Hawk County is conducted by the Metropolitan Planning Organization (MPO). However, county-level data for Black Hawk County includes the MPO study area. The metropolitan area is completely within the RTA and plays a large role in the dynamic of the region’s transportation system.
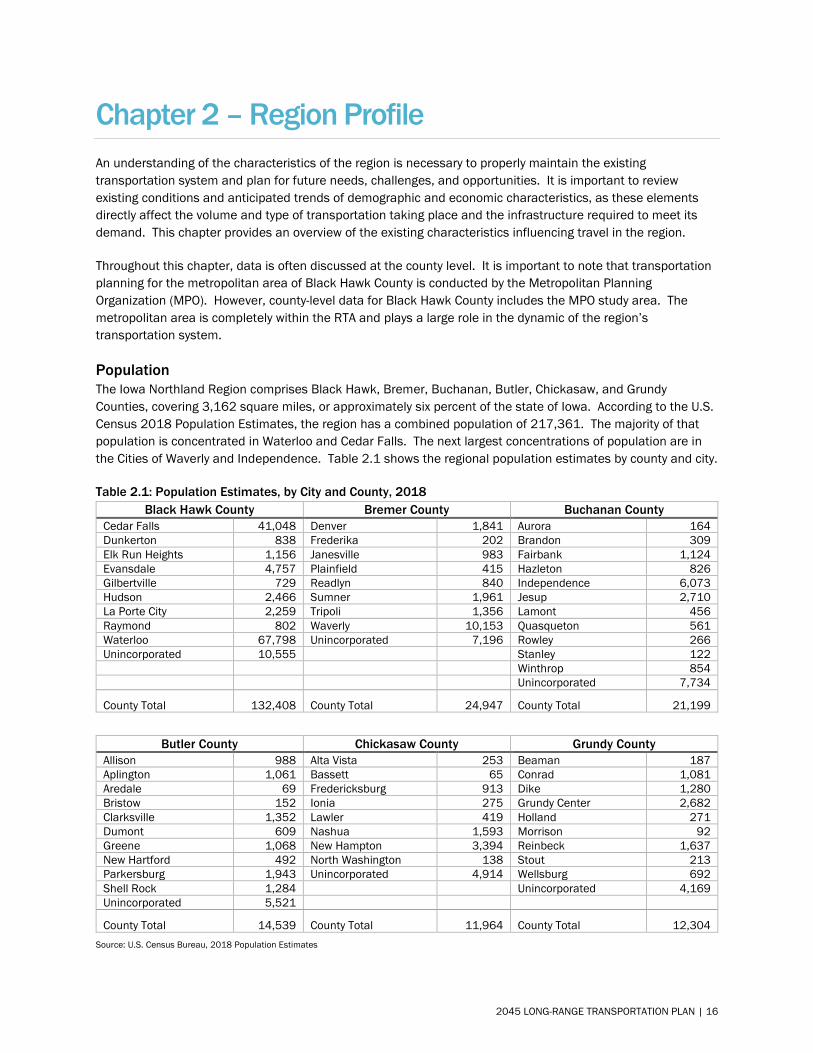
Population The Iowa Northland Region comprises Black Hawk, Bremer, Buchanan, Butler, Chickasaw, and Grundy Counties, covering 3,162 square miles, or approximately six percent of the state of Iowa. According to the U.S. Census 2018 Population Estimates, the region has a combined population of 217,361. The majority of that population is concentrated in Waterloo and Cedar Falls. The next largest concentrations of population are in the Cities of Waverly and Independence. Table 2.1 shows the regional population estimates by county and city.
Table 2.1: Population Estimates, by City and County, 2018 Black Hawk County Bremer County Buchanan County
Cedar Falls 41,048 Denver 1,841 Aurora 164 Dunkerton 838 Frederika 202 Brandon 309 Elk Run Heights 1,156 Janesville 983 Fairbank 1,124 Evansdale 4,757 Plainfield 415 Hazleton 826 Gilbertville 729 Readlyn 840 Independence 6,073 Hudson 2,466 Sumner 1,961 Jesup 2,710 La Porte City 2,259 Tripoli 1,356 Lamont 456 Raymond 802 Waverly 10,153 Quasqueton 561 Waterloo 67,798 Unincorporated 7,196 Rowley 266 Unincorporated 10,555 Stanley 122
Winthrop 854 Unincorporated 7,734
County Total 132,408 County Total 24,947 County Total 21,199
Butler County Chickasaw County Grundy County Allison 988 Alta Vista 253 Beaman 187 Aplington 1,061 Bassett 65 Conrad 1,081 Aredale 69 Fredericksburg 913 Dike 1,280 Bristow 152 Ionia 275 Grundy Center 2,682 Clarksville 1,352 Lawler 419 Holland 271 Dumont 609 Nashua 1,593 Morrison 92 Greene 1,068 New Hampton 3,394 Reinbeck 1,637 New Hartford 492 North Washington 138 Stout 213 Parkersburg 1,943 Unincorporated 4,914 Wellsburg 692 Shell Rock 1,284 Unincorporated 4,169 Unincorporated 5,521
County Total 14,539 County Total 11,964 County Total 12,304 Source: U.S. Census Bureau, 2018 Population Estimates
2045 LONG-RANGE TRANSPORTATION PLAN | 16
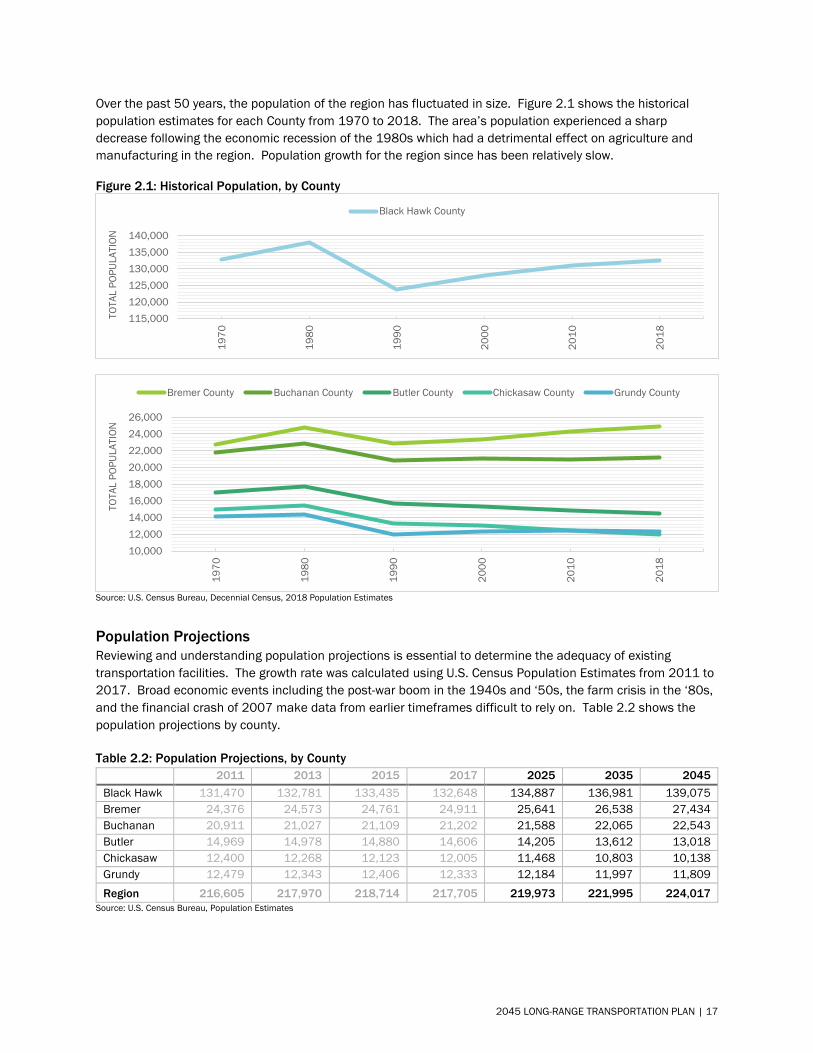
Over the past 50 years, the population of the region has fluctuated in size. Figure 2.1 shows the historical population estimates for each County from 1970 to 2018. The area’s population experienced a sharp decrease following the economic recession of the 1980s which had a detrimental effect on agriculture and manufacturing in the region. Population growth for the region since has been relatively slow.
Figure 2.1: Historical Population, by County
Source: U.S. Census Bureau, Decennial Census, 2018 Population Estimates
Population Projections Reviewing and understanding population projections is essential to determine the adequacy of existing transportation facilities. The growth rate was calculated using U.S. Census Population Estimates from 2011 to 2017. Broad economic events including the post-war boom in the 1940s and ‘50s, the farm crisis in the ‘80s, and the financial crash of 2007 make data from earlier timeframes difficult to rely on. Table 2.2 shows the population projections by county.
Table 2.2: Population Projections, by County 2011 2013 2015 2017 2025 2035 2045
Black Hawk 131,470 132,781 133,435 132,648 134,887 136,981 139,075 Bremer 24,376 24,573 24,761 24,911 25,641 26,538 27,434 Buchanan 20,911 21,027 21,109 21,202 21,588 22,065 22,543 Butler 14,969 14,978 14,880 14,606 14,205 13,612 13,018 Chickasaw 12,400 12,268 12,123 12,005 11,468 10,803 10,138 Grundy 12,479 12,343 12,406 12,333 12,184 11,997 11,809 Region 216,605 217,970 218,714 217,705 219,973 221,995 224,017
Source: U.S. Census Bureau, Population Estimates
115,000120,000125,000130,000135,000140,000
1970
1980
1990
2000
2010
2018
TOTA
L PO
PULA
TION
Black Hawk County
10,00012,00014,00016,00018,00020,00022,00024,00026,000
1970
1980
1990
2000
2010
2018
TOTA
L PO
PULA
TION
Bremer County Buchanan County Butler County Chickasaw County Grundy County
2045 LONG-RANGE TRANSPORTATION PLAN | 17
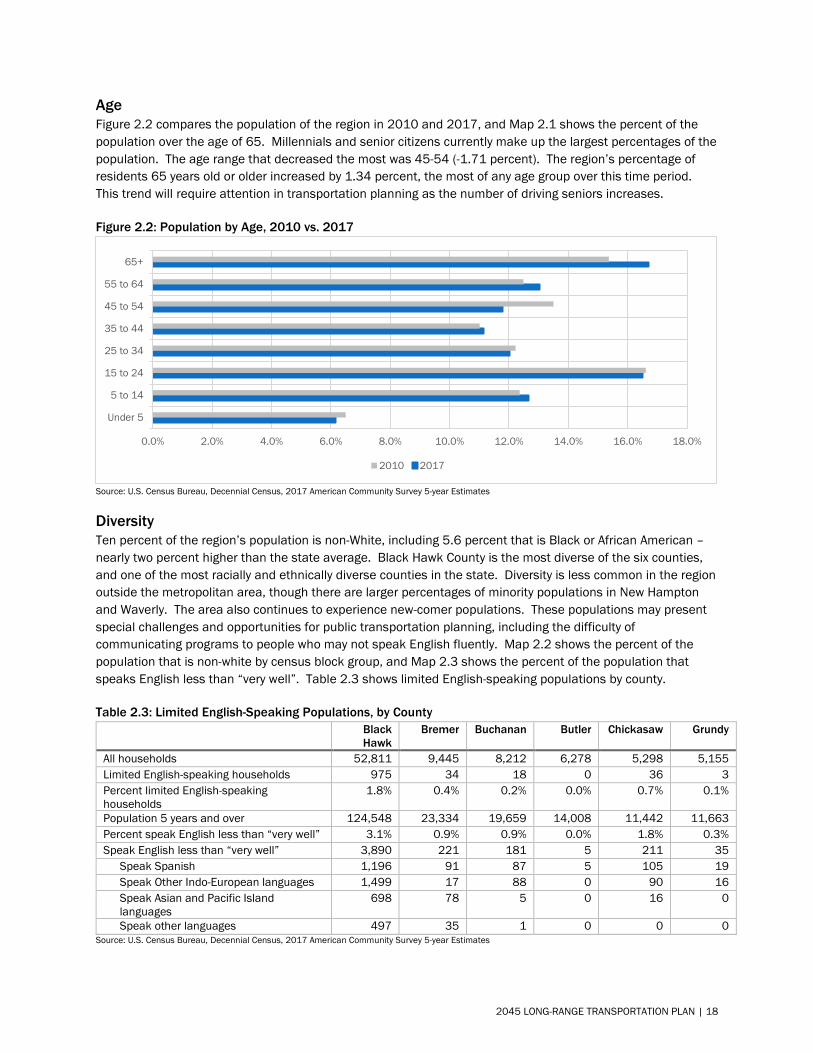
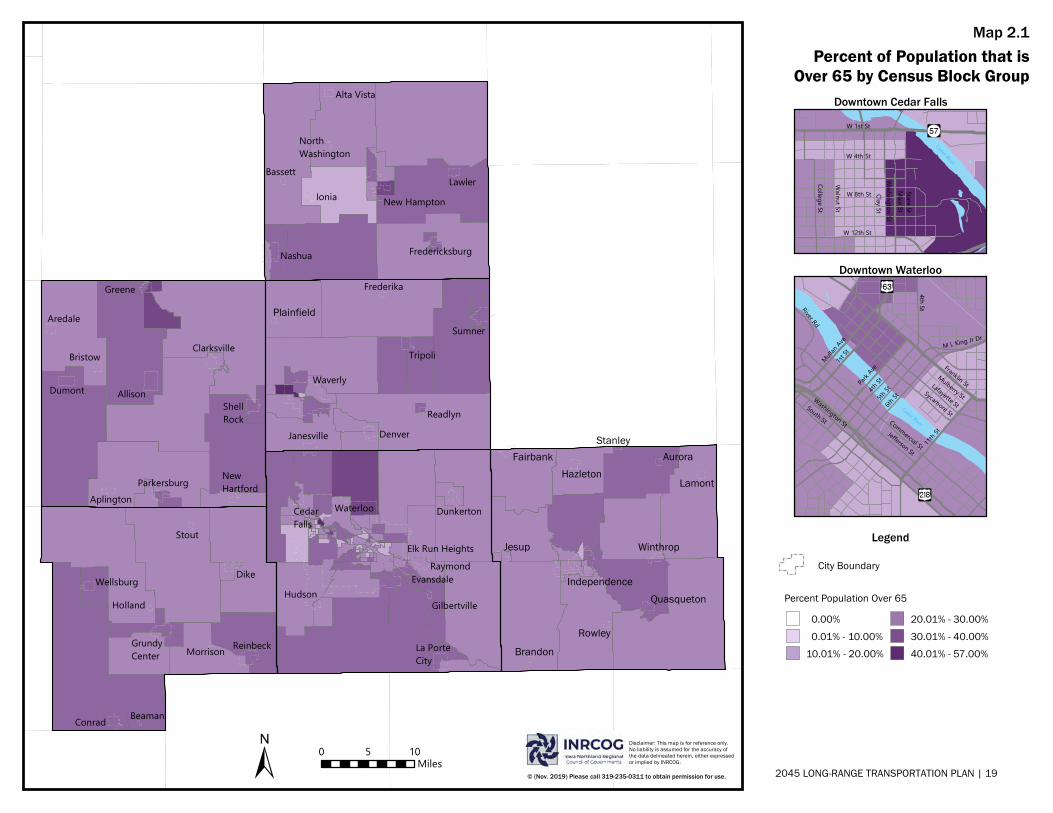
Age Figure 2.2 compares the population of the region in 2010 and 2017, and Map 2.1 shows the percent of the population over the age of 65. Millennials and senior citizens currently make up the largest percentages of the population. The age range that decreased the most was 45-54 (-1.71 percent). The region’s percentage of residents 65 years old or older increased by 1.34 percent, the most of any age group over this time period. This trend will require attention in transportation planning as the number of driving seniors increases.
Figure 2.2: Population by Age, 2010 vs. 2017
Source: U.S. Census Bureau, Decennial Census, 2017 American Community Survey 5-year Estimates
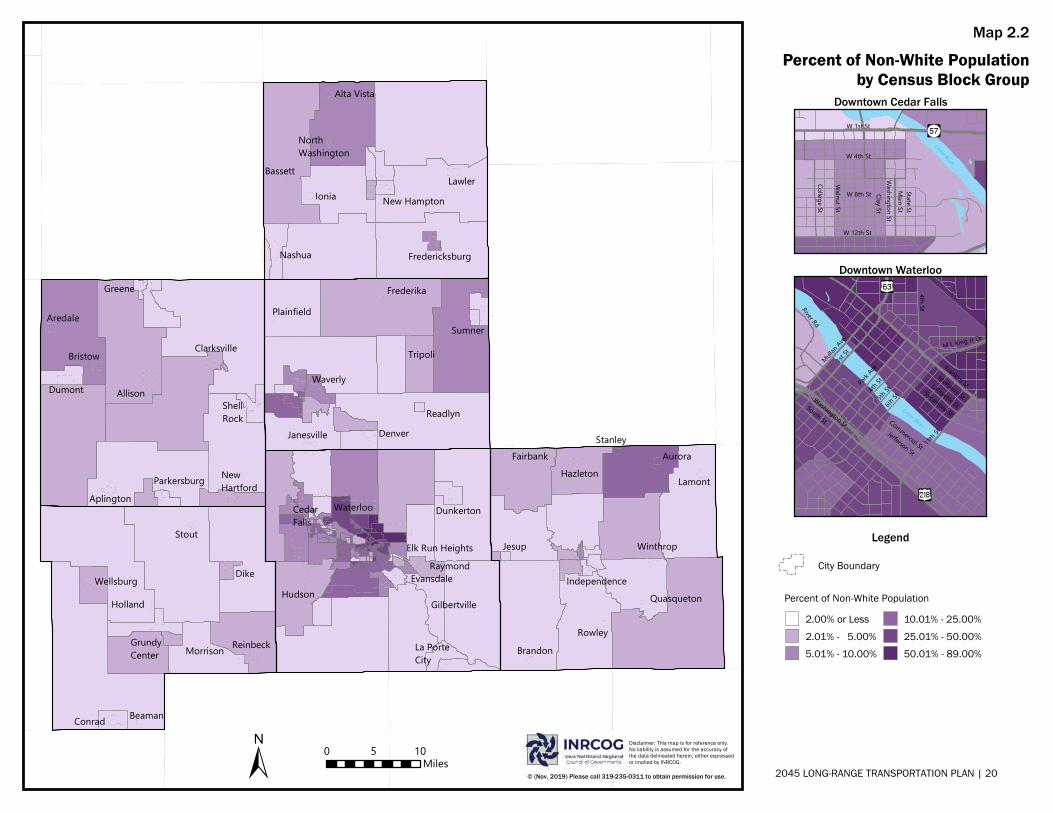
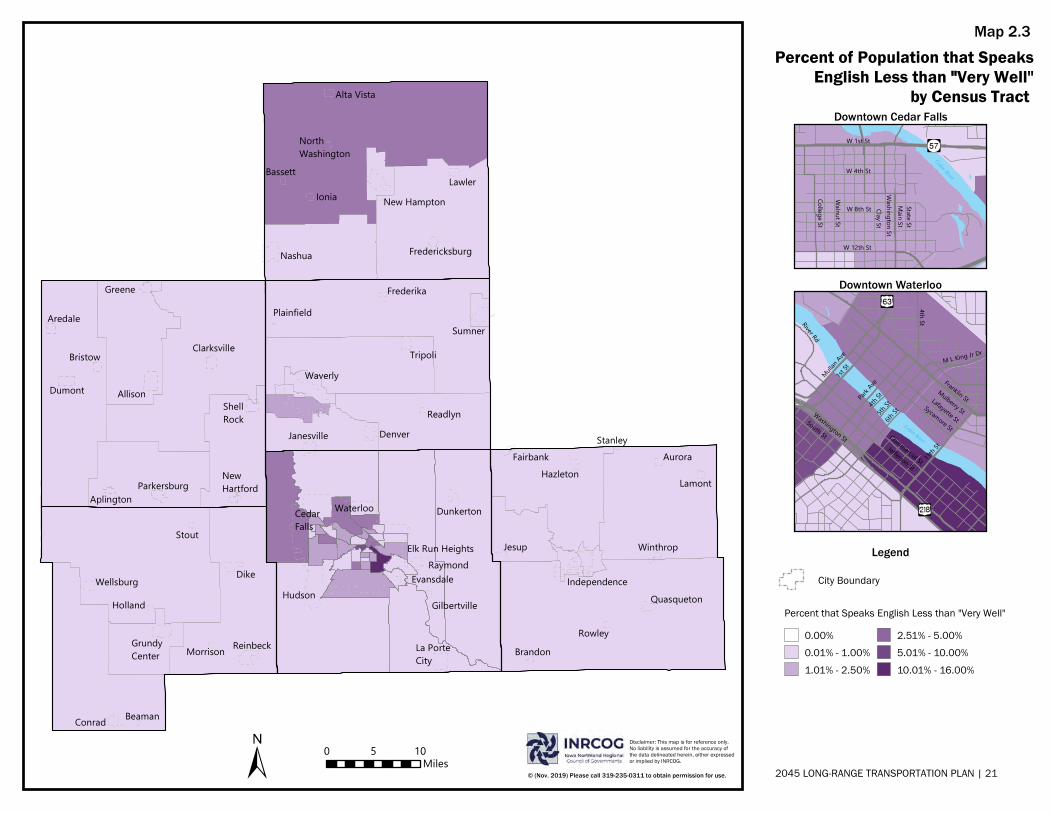
Diversity Ten percent of the region’s population is non-White, including 5.6 percent that is Black or African American – nearly two percent higher than the state average. Black Hawk County is the most diverse of the six counties, and one of the most racially and ethnically diverse counties in the state. Diversity is less common in the region outside the metropolitan area, though there are larger percentages of minority populations in New Hampton and Waverly. The area also continues to experience new-comer populations. These populations may present special challenges and opportunities for public transportation planning, including the difficulty of communicating programs to people who may not speak English fluently. Map 2.2 shows the percent of the population that is non-white by census block group, and Map 2.3 shows the percent of the population that speaks English less than “very well”. Table 2.3 shows limited English-speaking populations by county.
Table 2.3: Limited English-Speaking Populations, by County Black Hawk
Bremer Buchanan Butler Chickasaw Grundy
All households 52,811 9,445 8,212 6,278 5,298 5,155 Limited English-speaking households 975 34 18 0 36 3 Percent limited English-speaking households
1.8% 0.4% 0.2% 0.0% 0.7% 0.1%
Population 5 years and over 124,548 23,334 19,659 14,008 11,442 11,663 Percent speak English less than “very well” 3.1% 0.9% 0.9% 0.0% 1.8% 0.3% Speak English less than “very well” 3,890 221 181 5 211 35
Speak Spanish 1,196 91 87 5 105 19 Speak Other Indo-European languages 1,499 17 88 0 90 16 Speak Asian and Pacific Island languages
698 78 5 0 16 0
Speak other languages 497 35 1 0 0 0 Source: U.S. Census Bureau, Decennial Census, 2017 American Community Survey 5-year Estimates
0.0% 2.0% 4.0% 6.0% 8.0% 10.0% 12.0% 14.0% 16.0% 18.0%
Under 5
5 to 14
15 to 24
25 to 34
35 to 44
45 to 54
55 to 64
65+
2010 2017
2045 LONG-RANGE TRANSPORTATION PLAN | 18
WaterlooCedarFalls
Waverly
Hudson
Allison
Evansdale
Jesup
Sumner
IndependenceDike
Dumont
La PorteCity
Tripoli
Reinbeck
Raymond
Denver
Conrad
Greene
ShellRock
GrundyCenter
Aredale
Bristow Clarksville
Wellsburg
Parkersburg Hazleton
Quasqueton
Dunkerton
Aurora
Elk Run Heights
Aplington
Stout
Rowley
Winthrop
Fairbank
Frederika
Brandon
NewHartford
Readlyn
Plainfield
Janesville
Holland Gilbertville
Stanley
Beaman
Morrison
Lamont
New Hampton
Fredericksburg
Lawler
Alta Vista
NorthWashington
Bassett
Ionia
Nashua
0 105Miles
Map 2.1
0.00% 0.01% - 10.00%10.01% - 20.00%
20.01% - 30.00%30.01% - 40.00%40.01% - 57.00%
Percent of Population that isOver 65 by Census Block Group
W 1st St
W 4th St
W 12th St
Main StState St
Clay St
College St
Walnut St
Washington St
W 8th St
Cedar RiverDowntown Cedar Falls
Mulberry StLafayette St
Sycamore StCommercial St
Jefferson St
Washington St
South St
1st StMulla
n Ave
Park A
ve4th
St5th
St6th
St
11th S
t
Franklin St
M L King Jr Dr
4th StRiver Rd
Cedar River
Downtown Waterloo
Legend
Percent Population Over 65
City Boundary
© (Nov. 2019) Please call 319-235-0311 to obtain permission for use.
Disclaimer: This map is for reference only. No liability is assumed for the accuracy ofthe data delineated herein, either expressedor implied by INRCOG.
2045 LONG-RANGE TRANSPORTATION PLAN | 19
WaterlooCedarFalls
Waverly
Hudson
Allison
Evansdale
Jesup
Sumner
IndependenceDike
Dumont
La PorteCity
Tripoli
Reinbeck
Raymond
Denver
Conrad
Greene
ShellRock
GrundyCenter
Aredale
Bristow Clarksville
Wellsburg
Parkersburg Hazleton
Quasqueton
Dunkerton
Aurora
Elk Run Heights
Aplington
Stout
Rowley
Winthrop
Fairbank
Frederika
Brandon
NewHartford
Readlyn
Plainfield
Janesville
Holland Gilbertville
Stanley
Beaman
Morrison
Lamont
New Hampton
Fredericksburg
Lawler
Alta Vista
NorthWashington
Bassett
Ionia
Nashua
2.00% or Less2.01% - 5.00%5.01% - 10.00%
10.01% - 25.00%25.01% - 50.00%50.01% - 89.00%
0 105Miles
Map 2.2
Percent of Non-White Populationby Census Block Group
© (Nov. 2019) Please call 319-235-0311 to obtain permission for use.
Disclaimer: This map is for reference only. No liability is assumed for the accuracy ofthe data delineated herein, either expressedor implied by INRCOG.
W 1st St
W 4th St
W 12th St
Main StState St
Clay St
College St
Walnut St
Washington St
W 8th St
Cedar RiverDowntown Cedar Falls
Mulberry StLafayette St
Sycamore StCommercial St
Jefferson St
Washington St
South St
1st StMulla
n Ave
Park A
ve4th
St5th
St6th
St
11th S
t
Franklin St
M L King Jr Dr
4th StRiver Rd
Cedar River
Downtown Waterloo
Legend
Percent of Non-White Population
City Boundary
2045 LONG-RANGE TRANSPORTATION PLAN | 20
WaterlooCedarFalls
Waverly
Hudson
Allison
Evansdale
Jesup
Sumner
IndependenceDike
Dumont
La PorteCity
Tripoli
Reinbeck
Raymond
Denver
Conrad
Greene
ShellRock
GrundyCenter
Aredale
Bristow Clarksville
Wellsburg
ParkersburgHazleton
Quasqueton
Dunkerton
Aurora
Elk Run Heights
Aplington
Stout
Rowley
Winthrop
Fairbank
Frederika
Brandon
NewHartford
Readlyn
Plainfield
Janesville
Holland Gilbertville
Stanley
Beaman
Morrison
Lamont
New Hampton
Fredericksburg
Lawler
Alta Vista
NorthWashington
Bassett
Ionia
Nashua
0 105Miles
Map 2.3
Percent of Population that Speaks English Less than "Very Well"
by Census Tract
0.00%0.01% - 1.00%1.01% - 2.50%
2.51% - 5.00%5.01% - 10.00%10.01% - 16.00%
© (Nov. 2019) Please call 319-235-0311 to obtain permission for use.
Disclaimer: This map is for reference only. No liability is assumed for the accuracy ofthe data delineated herein, either expressedor implied by INRCOG.
Cedar River
W 1st St
W 4th St
W 12th St
Main StState St
Clay St
College St
Walnut St
Washington St
W 8th St
Downtown Cedar Falls
Mulberry StLafayette St
Sycamore StCommercial St
Jefferson St
Washington St
South St
1st StMulla
n Ave
Park A
ve4th
St5th
St6th
St
11th S
t
Franklin St
M L King Jr Dr
4th StRiver Rd
Cedar River
Downtown Waterloo
Legend
Percent that Speaks English Less than "Very Well"
City Boundary
2045 LONG-RANGE TRANSPORTATION PLAN | 21
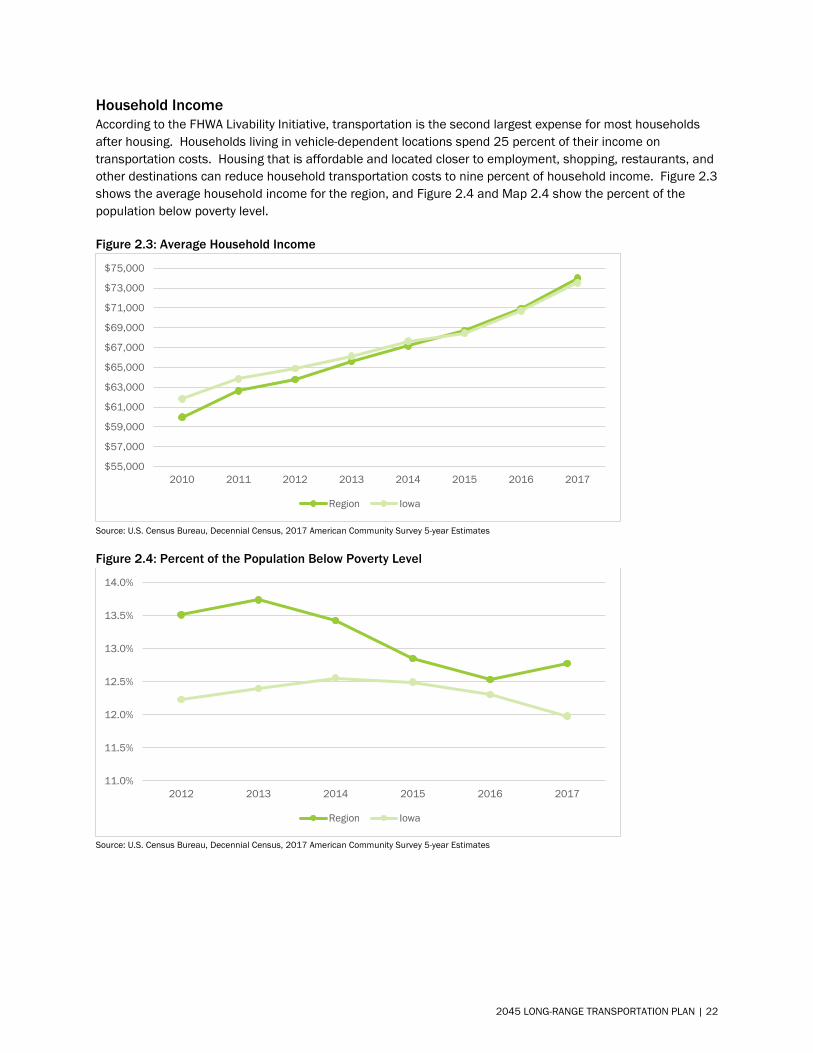
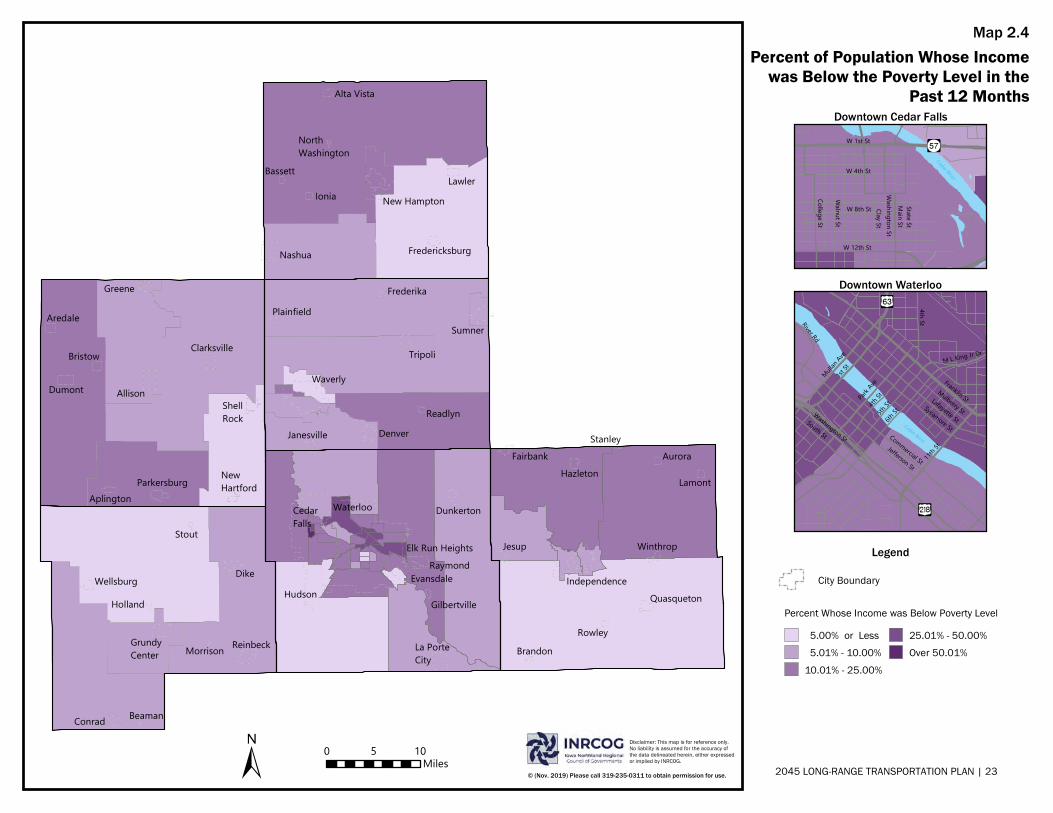
Household Income According to the FHWA Livability Initiative, transportation is the second largest expense for most households after housing. Households living in vehicle-dependent locations spend 25 percent of their income on transportation costs. Housing that is affordable and located closer to employment, shopping, restaurants, and other destinations can reduce household transportation costs to nine percent of household income. Figure 2.3 shows the average household income for the region, and Figure 2.4 and Map 2.4 show the percent of the population below poverty level.
Figure 2.3: Average Household Income
Source: U.S. Census Bureau, Decennial Census, 2017 American Community Survey 5-year Estimates
Figure 2.4: Percent of the Population Below Poverty Level
Source: U.S. Census Bureau, Decennial Census, 2017 American Community Survey 5-year Estimates
$55,000
$57,000
$59,000
$61,000
$63,000
$65,000
$67,000
$69,000
$71,000
$73,000
$75,000
2010 2011 2012 2013 2014 2015 2016 2017
Region Iowa
11.0%
11.5%
12.0%
12.5%
13.0%
13.5%
14.0%
2012 2013 2014 2015 2016 2017
Region Iowa
2045 LONG-RANGE TRANSPORTATION PLAN | 22
WaterlooCedarFalls
Waverly
Hudson
Allison
Evansdale
Jesup
Sumner
IndependenceDike
Dumont
La PorteCity
Tripoli
Reinbeck
Raymond
Denver
Conrad
Greene
ShellRock
GrundyCenter
Aredale
Bristow Clarksville
Wellsburg
Parkersburg Hazleton
Quasqueton
Dunkerton
Aurora
Elk Run Heights
Aplington
Stout
Rowley
Winthrop
Fairbank
Frederika
Brandon
NewHartford
Readlyn
Plainfield
Janesville
Holland Gilbertville
Stanley
Beaman
Morrison
Lamont
New Hampton
Fredericksburg
Lawler
Alta Vista
NorthWashington
Bassett
Ionia
Nashua
0 105Miles
Map 2.4
5.00% or Less 5.01% - 10.00%10.01% - 25.00%
25.01% - 50.00%Over 50.01%
Percent of Population Whose Incomewas Below the Poverty Level in the
Past 12 Months
© (Nov. 2019) Please call 319-235-0311 to obtain permission for use.
Disclaimer: This map is for reference only. No liability is assumed for the accuracy ofthe data delineated herein, either expressedor implied by INRCOG.
W 1st St
W 4th St
W 12th St
Main StState St
Clay St
College St
Walnut St
Washington St
W 8th St
Cedar River
Downtown Cedar Falls
Mulberry StLafayette St
Sycamore StCommercial St
Jefferson St
Washington St
South St
1st StMulla
n Ave
Park A
ve4th
St5th
St6th
St
11th S
t
Franklin St
M L King Jr Dr
4th StRiver Rd
Cedar River
Downtown Waterloo
Legend
Percent Whose Income was Below Poverty Level
City Boundary
2045 LONG-RANGE TRANSPORTATION PLAN | 23
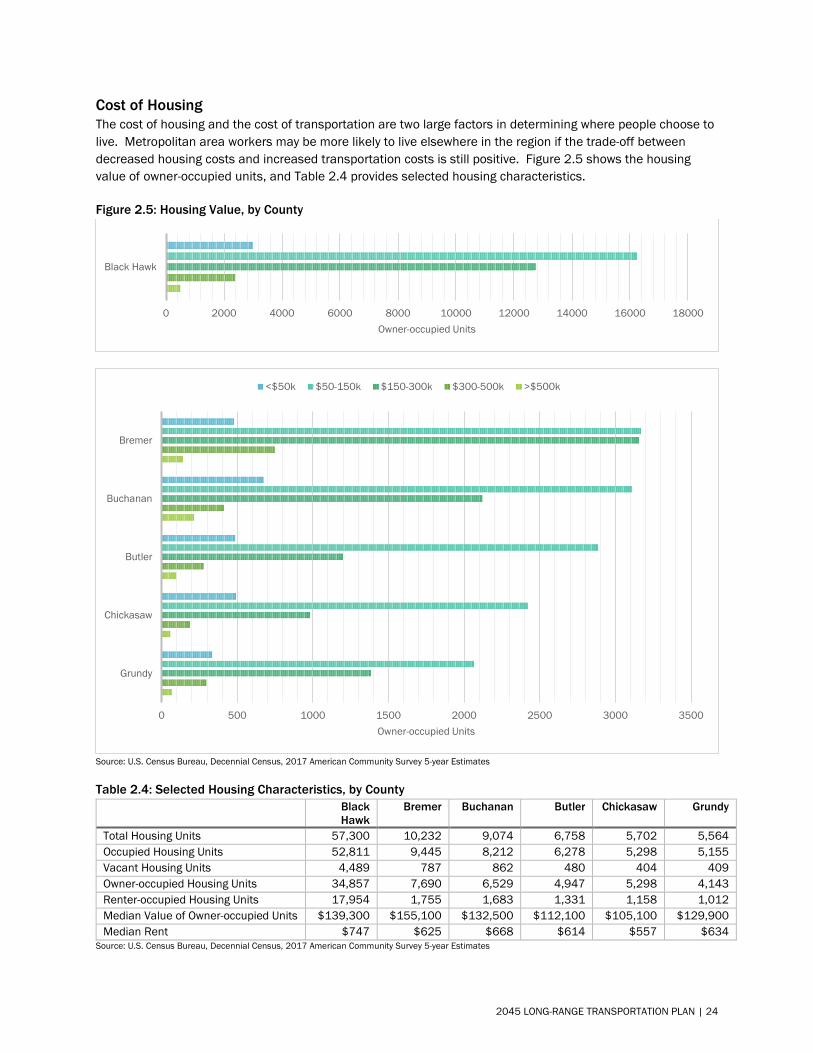
Cost of Housing The cost of housing and the cost of transportation are two large factors in determining where people choose to live. Metropolitan area workers may be more likely to live elsewhere in the region if the trade-off between decreased housing costs and increased transportation costs is still positive. Figure 2.5 shows the housing value of owner-occupied units, and Table 2.4 provides selected housing characteristics.
Figure 2.5: Housing Value, by County
Source: U.S. Census Bureau, Decennial Census, 2017 American Community Survey 5-year Estimates
Table 2.4: Selected Housing Characteristics, by County Black Hawk
Bremer Buchanan Butler Chickasaw Grundy
Total Housing Units 57,300 10,232 9,074 6,758 5,702 5,564 Occupied Housing Units 52,811 9,445 8,212 6,278 5,298 5,155 Vacant Housing Units 4,489 787 862 480 404 409 Owner-occupied Housing Units 34,857 7,690 6,529 4,947 5,298 4,143 Renter-occupied Housing Units 17,954 1,755 1,683 1,331 1,158 1,012 Median Value of Owner-occupied Units $139,300 $155,100 $132,500 $112,100 $105,100 $129,900 Median Rent $747 $625 $668 $614 $557 $634
Source: U.S. Census Bureau, Decennial Census, 2017 American Community Survey 5-year Estimates
0 2000 4000 6000 8000 10000 12000 14000 16000 18000
Black Hawk
Owner-occupied Units
0 500 1000 1500 2000 2500 3000 3500
Grundy
Chickasaw
Butler
Buchanan
Bremer
Owner-occupied Units
<$50k $50-150k $150-300k $300-500k >$500k
2045 LONG-RANGE TRANSPORTATION PLAN | 24
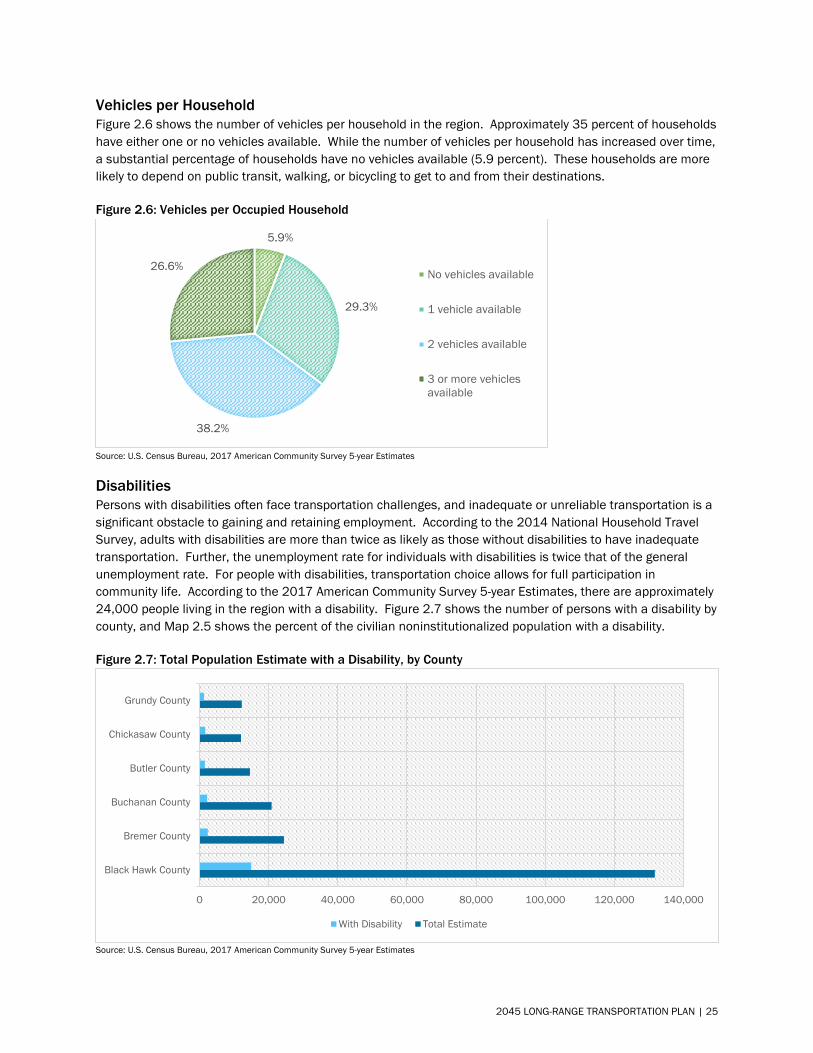
Vehicles per Household Figure 2.6 shows the number of vehicles per household in the region. Approximately 35 percent of households have either one or no vehicles available. While the number of vehicles per household has increased over time, a substantial percentage of households have no vehicles available (5.9 percent). These households are more likely to depend on public transit, walking, or bicycling to get to and from their destinations.
Figure 2.6: Vehicles per Occupied Household
Source: U.S. Census Bureau, 2017 American Community Survey 5-year Estimates
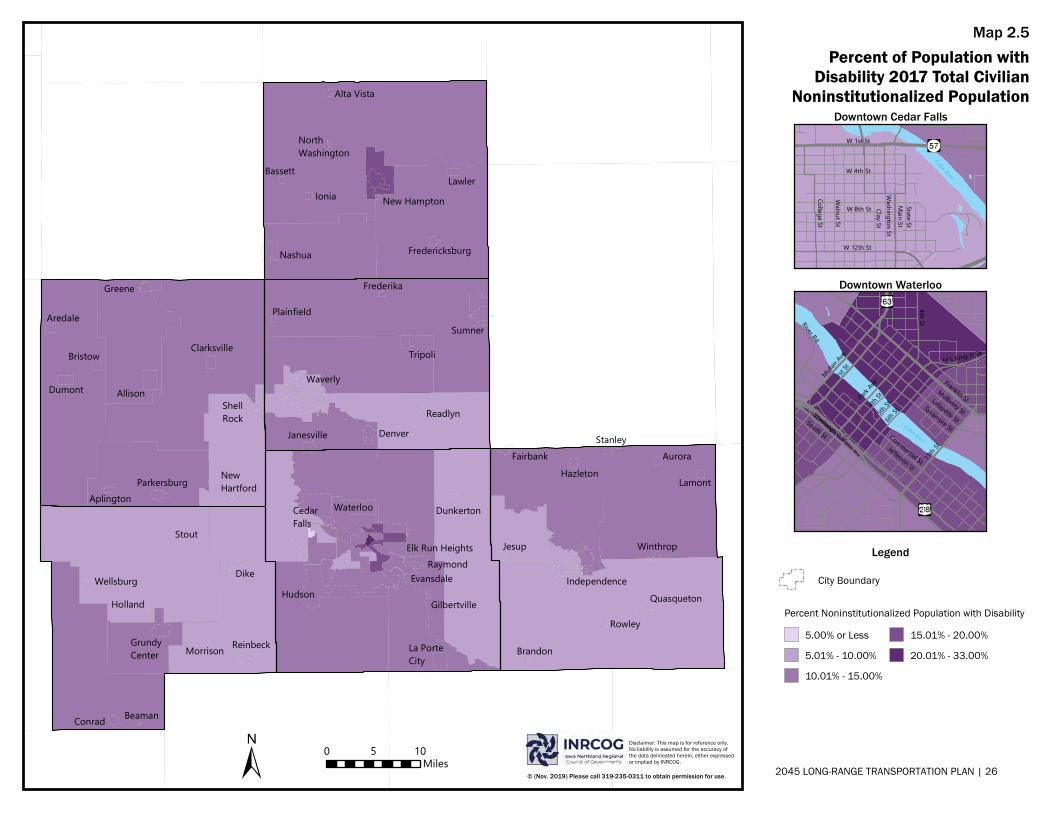
Disabilities Persons with disabilities often face transportation challenges, and inadequate or unreliable transportation is a significant obstacle to gaining and retaining employment. According to the 2014 National Household Travel Survey, adults with disabilities are more than twice as likely as those without disabilities to have inadequate transportation. Further, the unemployment rate for individuals with disabilities is twice that of the general unemployment rate. For people with disabilities, transportation choice allows for full participation in community life. According to the 2017 American Community Survey 5-year Estimates, there are approximately 24,000 people living in the region with a disability. Figure 2.7 shows the number of persons with a disability by county, and Map 2.5 shows the percent of the civilian noninstitutionalized population with a disability.
Figure 2.7: Total Population Estimate with a Disability, by County
Source: U.S. Census Bureau, 2017 American Community Survey 5-year Estimates
5.9%
29.3%
38.2%
26.6%No vehicles available
1 vehicle available
2 vehicles available
3 or more vehiclesavailable
0 20,000 40,000 60,000 80,000 100,000 120,000 140,000
Black Hawk County
Bremer County
Buchanan County
Butler County
Chickasaw County
Grundy County
With Disability Total Estimate
2045 LONG-RANGE TRANSPORTATION PLAN | 25
WaterlooCedarFalls
Waverly
Hudson
Allison
Evansdale
Jesup
Sumner
IndependenceDike
Dumont
La PorteCity
Tripoli
Reinbeck
Raymond
Denver
Conrad
Greene
ShellRock
GrundyCenter
Aredale
Bristow Clarksville
Wellsburg
Parkersburg Hazleton
Quasqueton
Dunkerton
Aurora
Elk Run Heights
Aplington
Stout
Rowley
Winthrop
Fairbank
Frederika
Brandon
NewHartford
Readlyn
Plainfield
Janesville
Holland Gilbertville
Stanley
Beaman
Morrison
Lamont
New Hampton
Fredericksburg
Lawler
Alta Vista
NorthWashington
Bassett
Ionia
Nashua
0 105Miles
Map 2.5
5.00% or Less5.01% - 10.00%10.01% - 15.00%
15.01% - 20.00%20.01% - 33.00%
Percent of Population withDisability 2017 Total Civilian
Noninstitutionalized Population
W 1st St
W 4th St
W 12th St
Main StState St
Clay St
College St
Walnut St
Washington St
W 8th St
Cedar River
Downtown Cedar Falls
Mulberry StLafayette St
Sycamore StCommercial St
Jefferson St
Washington St
South St
1st StMulla
n Ave
Park A
ve4th
St5th
St6th
St
11th S
t
Franklin St
M L King Jr Dr
4th StRiver Rd
Cedar River
Downtown Waterloo
Legend
Percent Noninstitutionalized Population with Disability
City Boundary
© (Nov. 2019) Please call 319-235-0311 to obtain permission for use.
Disclaimer: This map is for reference only. No liability is assumed for the accuracy ofthe data delineated herein, either expressedor implied by INRCOG.
2045 LONG-RANGE TRANSPORTATION PLAN | 26
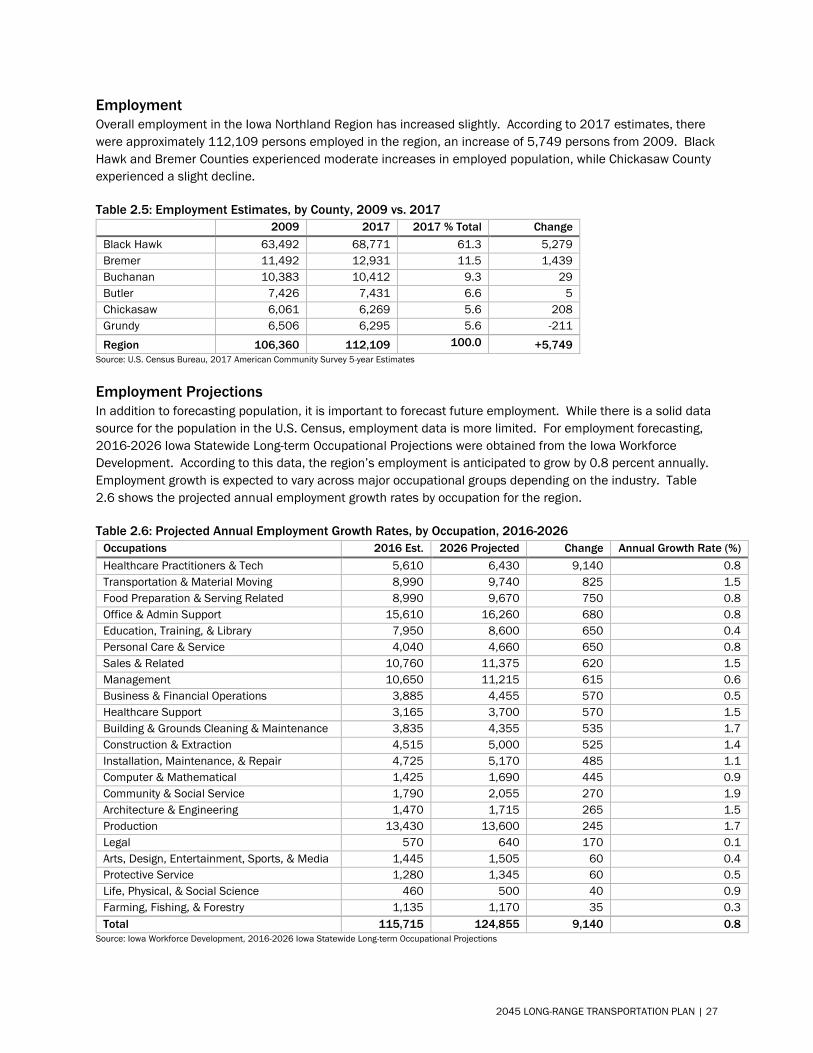
Employment Overall employment in the Iowa Northland Region has increased slightly. According to 2017 estimates, there were approximately 112,109 persons employed in the region, an increase of 5,749 persons from 2009. Black Hawk and Bremer Counties experienced moderate increases in employed population, while Chickasaw County experienced a slight decline.
Table 2.5: Employment Estimates, by County, 2009 vs. 2017 2009 2017 2017 % Total Change
Black Hawk 63,492 68,771 61.3 5,279 Bremer 11,492 12,931 11.5 1,439 Buchanan 10,383 10,412 9.3 29 Butler 7,426 7,431 6.6 5 Chickasaw 6,061 6,269 5.6 208 Grundy 6,506 6,295 5.6 -211Region 106,360 112,109 100.0 +5,749
Source: U.S. Census Bureau, 2017 American Community Survey 5-year Estimates
Employment Projections In addition to forecasting population, it is important to forecast future employment. While there is a solid data source for the population in the U.S. Census, employment data is more limited. For employment forecasting, 2016-2026 Iowa Statewide Long-term Occupational Projections were obtained from the Iowa Workforce Development. According to this data, the region’s employment is anticipated to grow by 0.8 percent annually. Employment growth is expected to vary across major occupational groups depending on the industry. Table 2.6 shows the projected annual employment growth rates by occupation for the region.
Table 2.6: Projected Annual Employment Growth Rates, by Occupation, 2016-2026 Occupations 2016 Est. 2026 Projected Change Annual Growth Rate (%) Healthcare Practitioners & Tech 5,610 6,430 9,140 0.8 Transportation & Material Moving 8,990 9,740 825 1.5 Food Preparation & Serving Related 8,990 9,670 750 0.8 Office & Admin Support 15,610 16,260 680 0.8 Education, Training, & Library 7,950 8,600 650 0.4 Personal Care & Service 4,040 4,660 650 0.8 Sales & Related 10,760 11,375 620 1.5 Management 10,650 11,215 615 0.6 Business & Financial Operations 3,885 4,455 570 0.5 Healthcare Support 3,165 3,700 570 1.5 Building & Grounds Cleaning & Maintenance 3,835 4,355 535 1.7 Construction & Extraction 4,515 5,000 525 1.4 Installation, Maintenance, & Repair 4,725 5,170 485 1.1 Computer & Mathematical 1,425 1,690 445 0.9 Community & Social Service 1,790 2,055 270 1.9 Architecture & Engineering 1,470 1,715 265 1.5 Production 13,430 13,600 245 1.7 Legal 570 640 170 0.1 Arts, Design, Entertainment, Sports, & Media 1,445 1,505 60 0.4 Protective Service 1,280 1,345 60 0.5 Life, Physical, & Social Science 460 500 40 0.9 Farming, Fishing, & Forestry 1,135 1,170 35 0.3 Total 115,715 124,855 9,140 0.8
Source: Iowa Workforce Development, 2016-2026 Iowa Statewide Long-term Occupational Projections
2045 LONG-RANGE TRANSPORTATION PLAN | 27
To project the number of employees in the region in 2045, the annual growth rate (0.8 percent) was applied to the 2026 total projected employees (124,855). The result was a total of 145,263 employees and an employment to population ratio of 0.64 in 2045. The 2017 jurisdictional percentages were used to determine each county’s share of the employment projections. Table 2.7 shows the employment projections for each county.
Table 2.7: Employment Projections, by County 2017 2045
Black Hawk 68,771 139,075 Bremer 12,931 27,434 Buchanan 10,412 22,543 Butler 7,431 13,018 Chickasaw 6,269 10,138 Grundy 6,295 11,809 Region 112,109 224,017
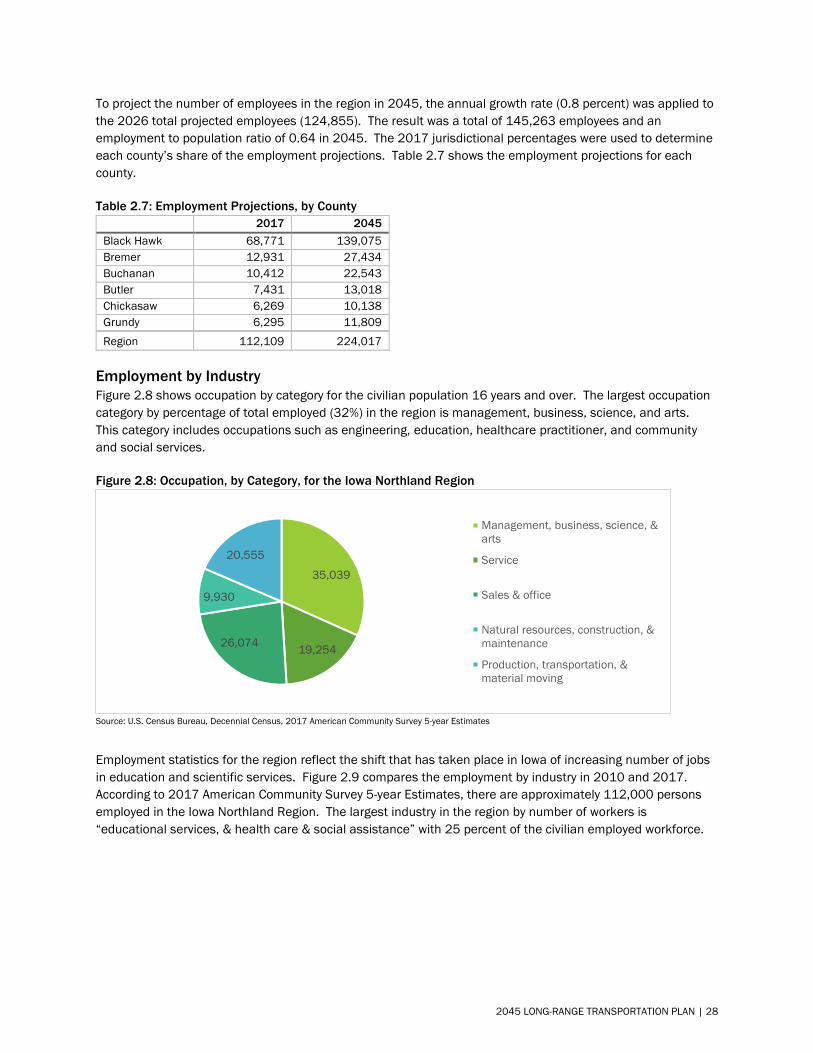
Employment by Industry Figure 2.8 shows occupation by category for the civilian population 16 years and over. The largest occupation category by percentage of total employed (32%) in the region is management, business, science, and arts. This category includes occupations such as engineering, education, healthcare practitioner, and community and social services.
Figure 2.8: Occupation, by Category, for the Iowa Northland Region
Source: U.S. Census Bureau, Decennial Census, 2017 American Community Survey 5-year Estimates
Employment statistics for the region reflect the shift that has taken place in Iowa of increasing number of jobs in education and scientific services. Figure 2.9 compares the employment by industry in 2010 and 2017. According to 2017 American Community Survey 5-year Estimates, there are approximately 112,000 persons employed in the Iowa Northland Region. The largest industry in the region by number of workers is “educational services, & health care & social assistance” with 25 percent of the civilian employed workforce.
35,039
19,25426,074
9,930
20,555
Management, business, science, &arts
Service
Sales & office
Natural resources, construction, &maintenance
Production, transportation, &material moving
2045 LONG-RANGE TRANSPORTATION PLAN | 28
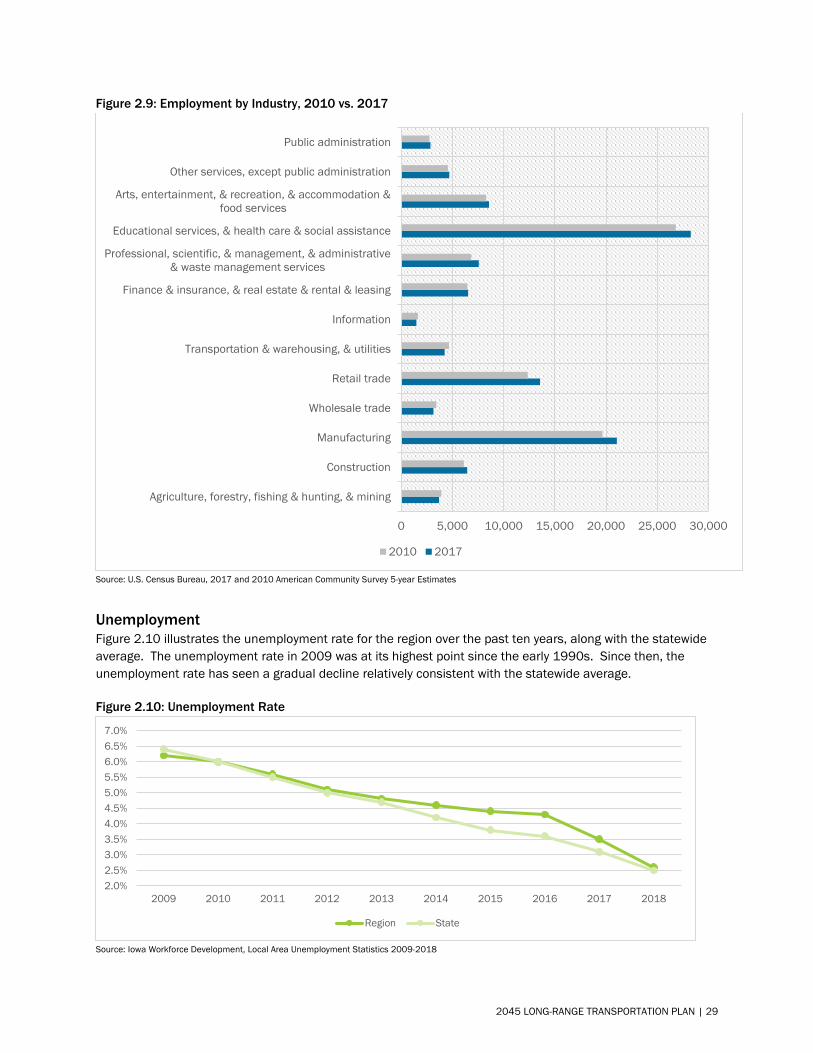
Figure 2.9: Employment by Industry, 2010 vs. 2017
Source: U.S. Census Bureau, 2017 and 2010 American Community Survey 5-year Estimates
Unemployment Figure 2.10 illustrates the unemployment rate for the region over the past ten years, along with the statewide average. The unemployment rate in 2009 was at its highest point since the early 1990s. Since then, the unemployment rate has seen a gradual decline relatively consistent with the statewide average.
Figure 2.10: Unemployment Rate
Source: Iowa Workforce Development, Local Area Unemployment Statistics 2009-2018
0 5,000 10,000 15,000 20,000 25,000 30,000
Agriculture, forestry, fishing & hunting, & mining
Construction
Manufacturing
Wholesale trade
Retail trade
Transportation & warehousing, & utilities
Information
Finance & insurance, & real estate & rental & leasing
Professional, scientific, & management, & administrative& waste management services
Educational services, & health care & social assistance
Arts, entertainment, & recreation, & accommodation &food services
Other services, except public administration
Public administration
2010 2017
2.0%2.5%3.0%3.5%4.0%4.5%5.0%5.5%6.0%6.5%7.0%
2009 2010 2011 2012 2013 2014 2015 2016 2017 2018
Region State
2045 LONG-RANGE TRANSPORTATION PLAN | 29
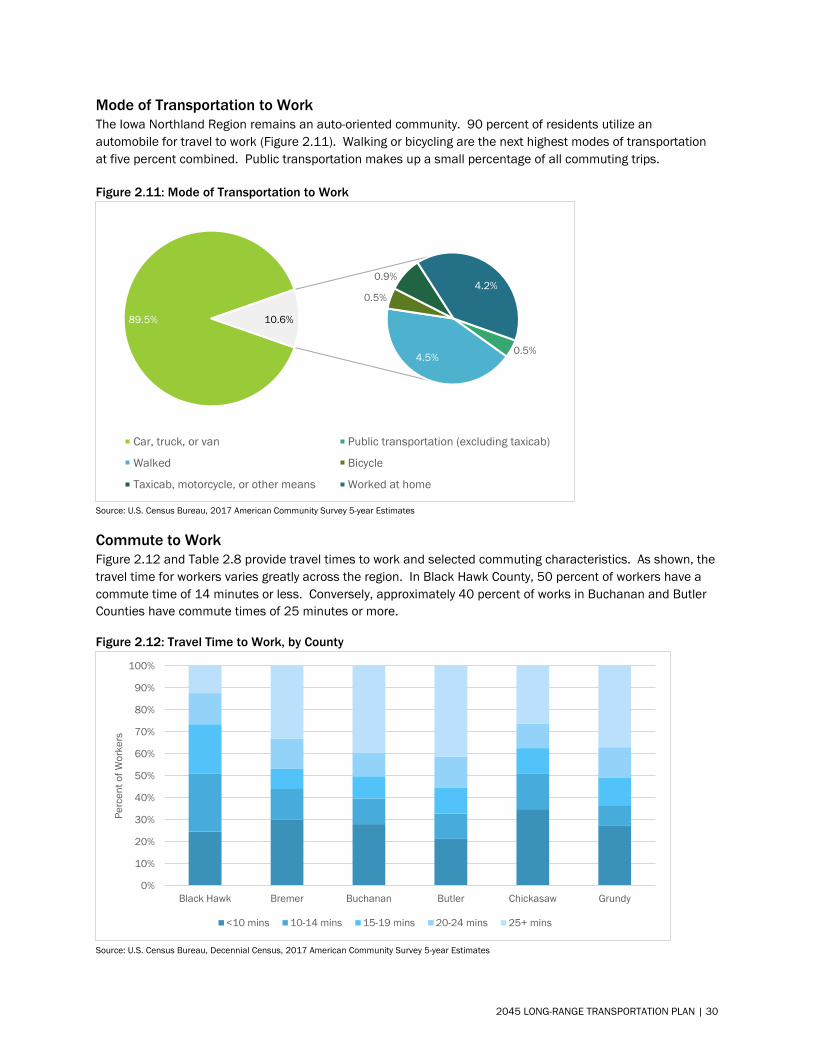
Mode of Transportation to Work The Iowa Northland Region remains an auto-oriented community. 90 percent of residents utilize an automobile for travel to work (Figure 2.11). Walking or bicycling are the next highest modes of transportation at five percent combined. Public transportation makes up a small percentage of all commuting trips.
Figure 2.11: Mode of Transportation to Work
Source: U.S. Census Bureau, 2017 American Community Survey 5-year Estimates
Commute to Work Figure 2.12 and Table 2.8 provide travel times to work and selected commuting characteristics. As shown, the travel time for workers varies greatly across the region. In Black Hawk County, 50 percent of workers have a commute time of 14 minutes or less. Conversely, approximately 40 percent of works in Buchanan and Butler Counties have commute times of 25 minutes or more.
Figure 2.12: Travel Time to Work, by County
Source: U.S. Census Bureau, Decennial Census, 2017 American Community Survey 5-year Estimates
89.5%
0.5%4.5%
0.5%
0.9%4.2%
10.6%
Car, truck, or van Public transportation (excluding taxicab)
Walked Bicycle
Taxicab, motorcycle, or other means Worked at home
0%
10%
20%
30%
40%
50%
60%
70%
80%
90%
100%
Black Hawk Bremer Buchanan Butler Chickasaw Grundy
Perc
ent o
f Wor
kers
<10 mins 10-14 mins 15-19 mins 20-24 mins 25+ mins
2045 LONG-RANGE TRANSPORTATION PLAN | 30
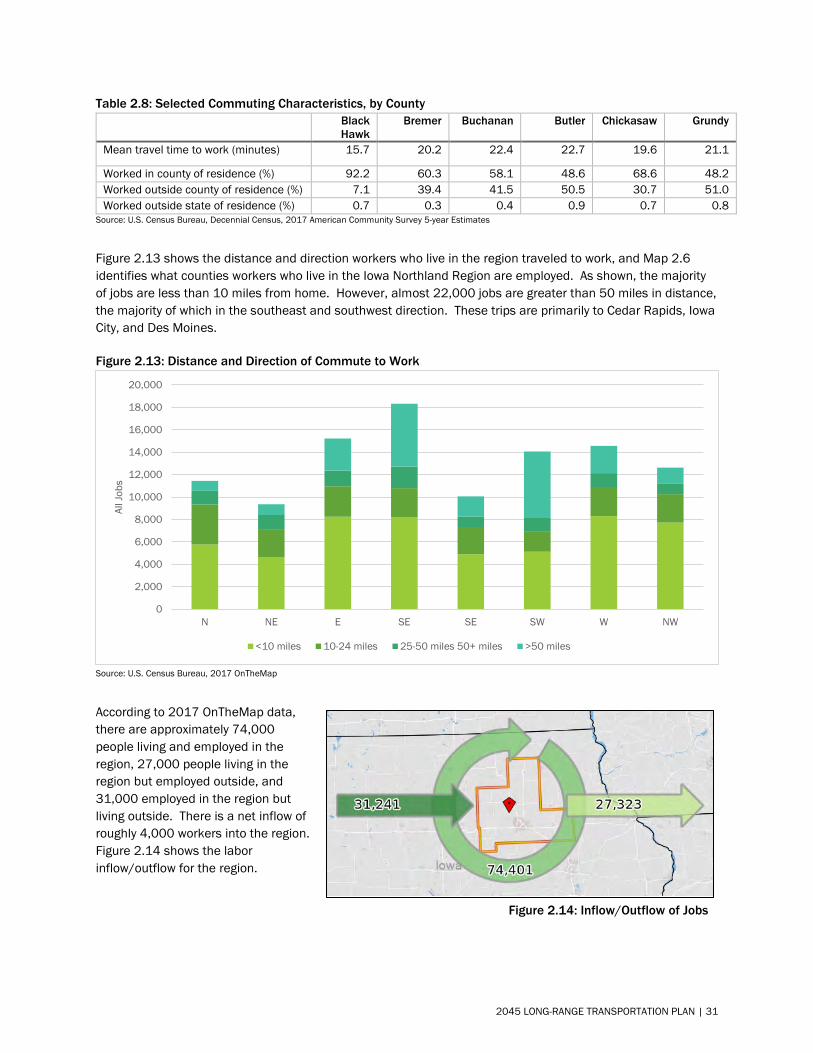
Table 2.8: Selected Commuting Characteristics, by County Black
Hawk Bremer Buchanan Butler Chickasaw Grundy
Mean travel time to work (minutes) 15.7 20.2 22.4 22.7 19.6 21.1
Worked in county of residence (%) 92.2 60.3 58.1 48.6 68.6 48.2 Worked outside county of residence (%) 7.1 39.4 41.5 50.5 30.7 51.0 Worked outside state of residence (%) 0.7 0.3 0.4 0.9 0.7 0.8
Source: U.S. Census Bureau, Decennial Census, 2017 American Community Survey 5-year Estimates
Figure 2.13 shows the distance and direction workers who live in the region traveled to work, and Map 2.6 identifies what counties workers who live in the Iowa Northland Region are employed. As shown, the majority of jobs are less than 10 miles from home. However, almost 22,000 jobs are greater than 50 miles in distance, the majority of which in the southeast and southwest direction. These trips are primarily to Cedar Rapids, Iowa City, and Des Moines.
Figure 2.13: Distance and Direction of Commute to Work
Source: U.S. Census Bureau, 2017 OnTheMap
According to 2017 OnTheMap data, there are approximately 74,000 people living and employed in the region, 27,000 people living in the region but employed outside, and 31,000 employed in the region but living outside. There is a net inflow of roughly 4,000 workers into the region. Figure 2.14 shows the labor inflow/outflow for the region.
0
2,000
4,000
6,000
8,000
10,000
12,000
14,000
16,000
18,000
20,000
N NE E SE SE SW W NW
All J
obs
<10 miles 10-24 miles 25-50 miles 50+ miles >50 miles
Figure 2.14: Inflow/Outflow of Jobs
2045 LONG-RANGE TRANSPORTATION PLAN | 31
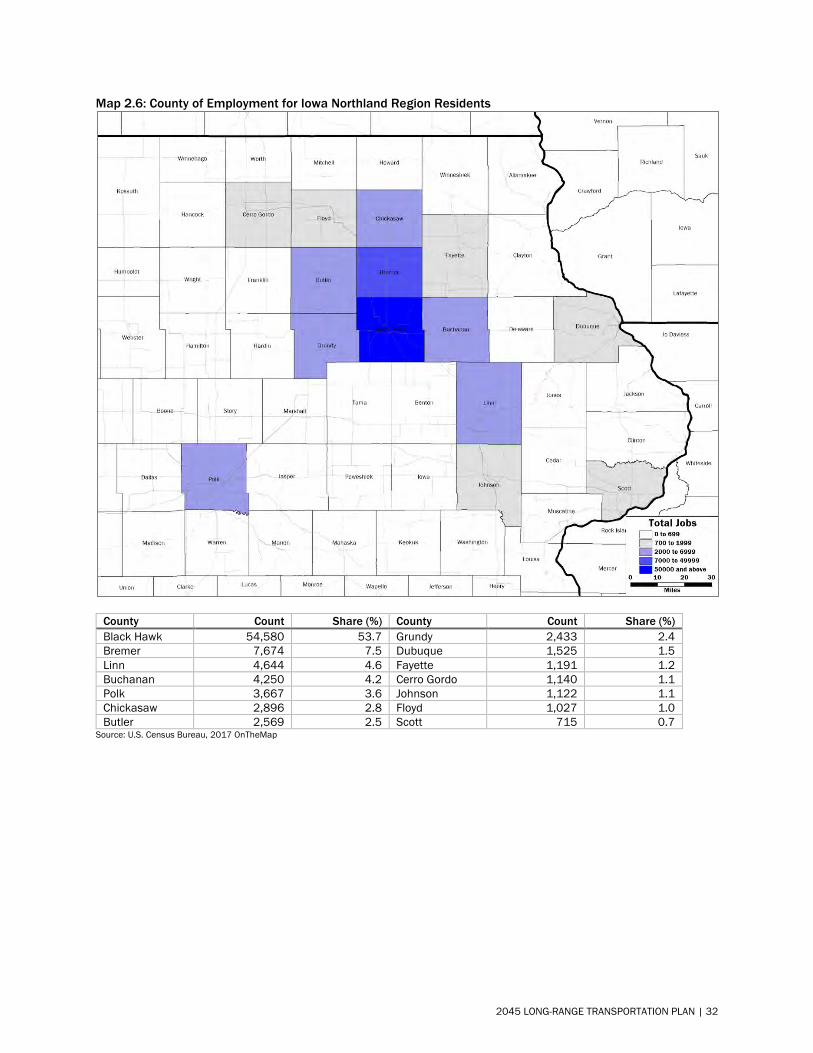
Map 2.6: County of Employment for Iowa Northland Region Residents
County Count Share (%) County Count Share (%) Black Hawk 54,580 53.7 Grundy 2,433 2.4 Bremer 7,674 7.5 Dubuque 1,525 1.5 Linn 4,644 4.6 Fayette 1,191 1.2 Buchanan 4,250 4.2 Cerro Gordo 1,140 1.1 Polk 3,667 3.6 Johnson 1,122 1.1 Chickasaw 2,896 2.8 Floyd 1,027 1.0 Butler 2,569 2.5 Scott 715 0.7
Source: U.S. Census Bureau, 2017 OnTheMap
2045 LONG-RANGE TRANSPORTATION PLAN | 32
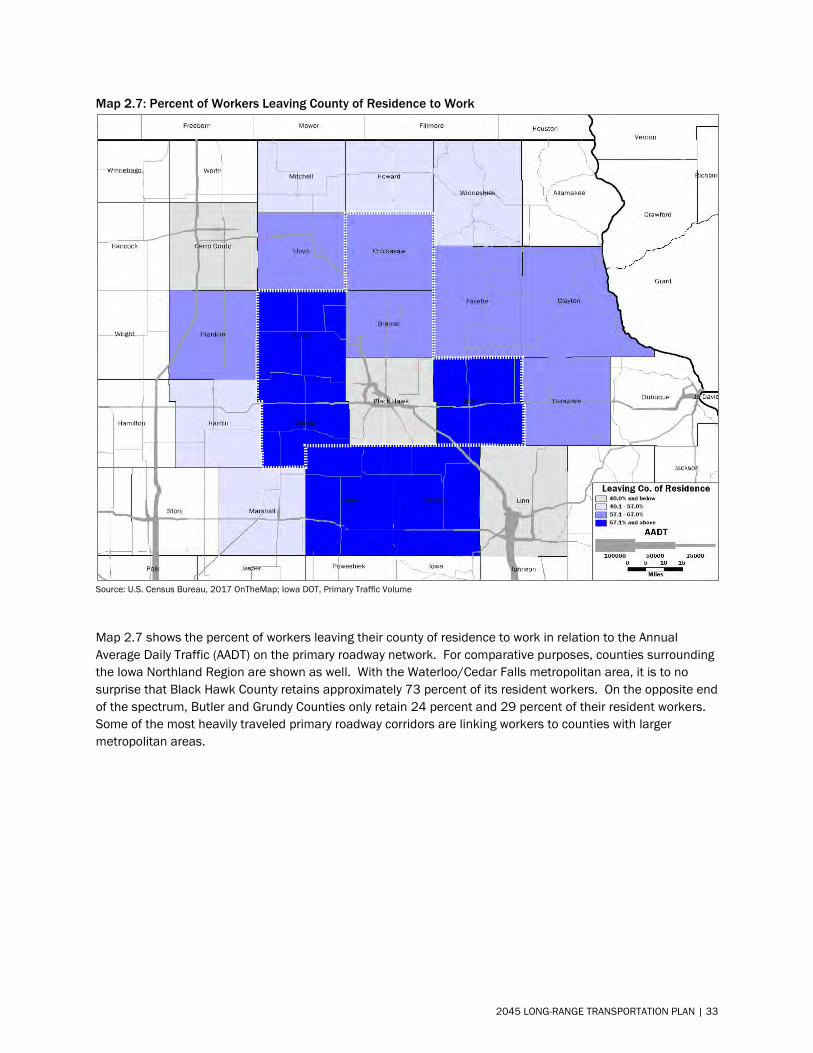
Map 2.7: Percent of Workers Leaving County of Residence to Work
Source: U.S. Census Bureau, 2017 OnTheMap; Iowa DOT, Primary Traffic Volume
Map 2.7 shows the percent of workers leaving their county of residence to work in relation to the Annual Average Daily Traffic (AADT) on the primary roadway network. For comparative purposes, counties surrounding the Iowa Northland Region are shown as well. With the Waterloo/Cedar Falls metropolitan area, it is to no surprise that Black Hawk County retains approximately 73 percent of its resident workers. On the opposite end of the spectrum, Butler and Grundy Counties only retain 24 percent and 29 percent of their resident workers. Some of the most heavily traveled primary roadway corridors are linking workers to counties with larger metropolitan areas.
2045 LONG-RANGE TRANSPORTATION PLAN | 33
Major Employers Table 2.9 lists the top 25 major employers in the region. Of these top employers, manufacturing, education, and health care are the top three industries by number of employees. The majority of these employers are located within the Waterloo/Cedar Falls metropolitan area, though some of the companies are scattered throughout the region.
Table 2.9: Major Employers in the Iowa Northland Region Company Industry Approximate
Employees John Deere Waterloo Operations Manufacturing 5,000 Tyson Fresh Meats Food Processing 2,980 MercyOne Health Care 2,669 University of Northern Iowa Education 1,811 Waterloo Community Schools Education 1,715 UnityPoint Health Health Care 1,499 Hy-Vee Foods Store (4) Grocery 1,325 Western Home Communities Health Care/Housing 1,052 CBE Companies, Inc. Financial 982 VGM Group Diversified 950 Cedar Falls Community Schools Education 849 Omega Cabinets, Ltd. Manufacturing 812 Omega Cabinet Manufacturing (2) Manufacturing 750 Martin Brothers Distributing Distribution 710 Hawkeye Community College Education 700 Central Rivers AEA Education 615 Wartburg College Education 559 CUNA Mutual Group Finance/Insurance 541 City of Waterloo Government 530 Veridian Credit Union Financial 513 Viking Pump Manufacturing 491 Black Hawk County Government 481 Waverly-Shell Rock Schools Education 479 The Isle Casino and Hotel Entertainment 456 Waverly Health Center Health Care 450
Source: Grow Cedar Valley, 2019 Cedar Valley Fact Sheet
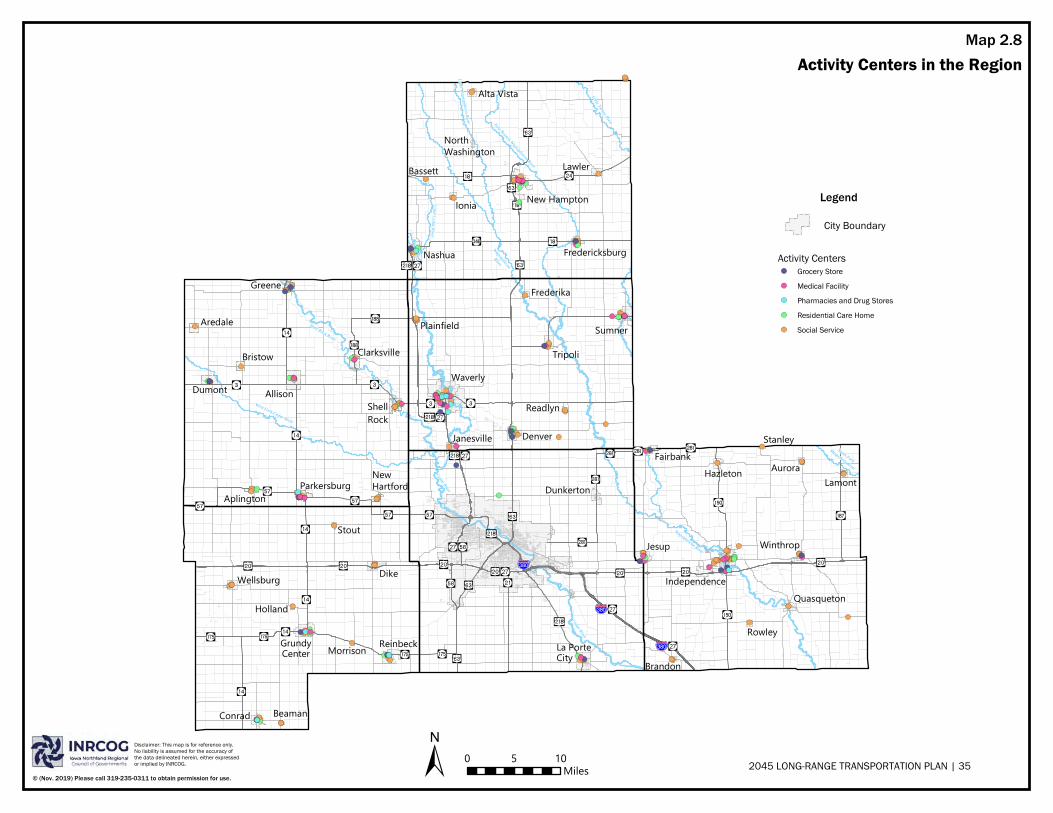
Activity Centers Outside of the cities of Waverly and Independence, the region is primarily rural in nature with small cities spread throughout. However, transportation destinations are not limited to the urbanized areas of the region. Map 2.8 identifies activity centers that are considered to be trip generators. Activity centers include grocery stores, residential care homes, social services, pharmacies, and medical facilities (hospitals, clinics, and dentists).
2045 LONG-RANGE TRANSPORTATION PLAN | 34
WaverlyAllison
Jesup
Sumner
IndependenceDike
Dumont
La PorteCity
Tripoli
Reinbeck
Denver
Conrad
Greene
ShellRock
GrundyCenter
Aredale
Bristow Clarksville
Wellsburg
ParkersburgHazleton
Quasqueton
DunkertonAurora
Aplington
Stout
Rowley
Winthrop
Fairbank
Frederika
Brandon
NewHartford
Readlyn
Plainfield
Janesville
Holland
Stanley
Beaman
Morrison
Lamont
New Hampton
Fredericksburg
Lawler
Alta Vista
NorthWashington
Bassett
Ionia
Nashua
Cedar River
Cedar River
South ForkMaquoketa River
Wapsipinicon River
West Fork Cedar River
Shell Rock River
Wapsipinicon
RiverEast Branch Wapsipinicon River
Little Wapsipinicon River
Little Turkey River
Little Cedar River
0 105Miles
Grocery StoreMedical FacilityPharmacies and Drug StoresResidential Care HomeSocial Service
Map 2.8Activity Centers in the Region
Legend
Activity Centers
City Boundary
© (Nov. 2019) Please call 319-235-0311 to obtain permission for use.
Disclaimer: This map is for reference only. No liability is assumed for the accuracy ofthe data delineated herein, either expressedor implied by INRCOG. 2045 LONG-RANGE TRANSPORTATION PLAN | 35
Chapter 3
Roads and Bridges
2045 LONG-RANGE TRANSPORTATION PLAN | 36
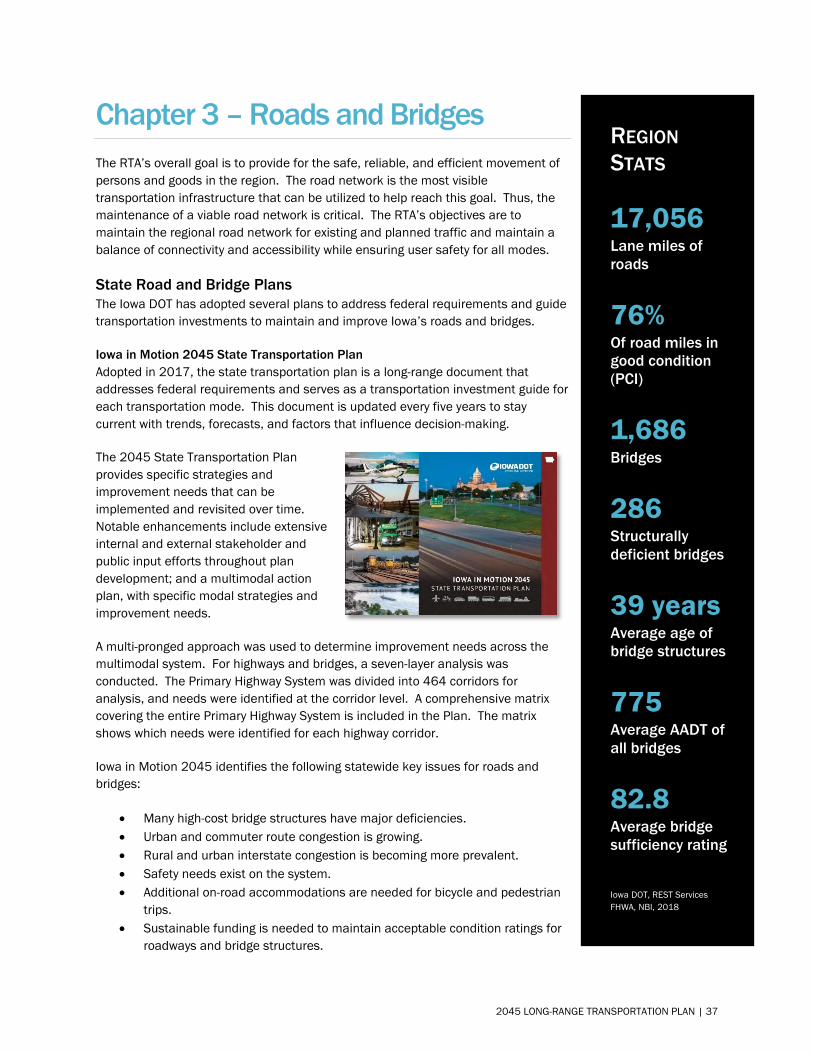
Chapter 3 – Roads and Bridges The RTA’s overall goal is to provide for the safe, reliable, and efficient movement of persons and goods in the region. The road network is the most visible transportation infrastructure that can be utilized to help reach this goal. Thus, the maintenance of a viable road network is critical. The RTA’s objectives are to maintain the regional road network for existing and planned traffic and maintain a balance of connectivity and accessibility while ensuring user safety for all modes.
State Road and Bridge Plans The Iowa DOT has adopted several plans to address federal requirements and guide transportation investments to maintain and improve Iowa’s roads and bridges.
Iowa in Motion 2045 State Transportation Plan Adopted in 2017, the state transportation plan is a long-range document that addresses federal requirements and serves as a transportation investment guide for each transportation mode. This document is updated every five years to stay current with trends, forecasts, and factors that influence decision-making.
The 2045 State Transportation Plan provides specific strategies and improvement needs that can be implemented and revisited over time. Notable enhancements include extensive internal and external stakeholder and public input efforts throughout plan development; and a multimodal action plan, with specific modal strategies and improvement needs.
A multi-pronged approach was used to determine improvement needs across the multimodal system. For highways and bridges, a seven-layer analysis was conducted. The Primary Highway System was divided into 464 corridors for analysis, and needs were identified at the corridor level. A comprehensive matrix covering the entire Primary Highway System is included in the Plan. The matrix shows which needs were identified for each highway corridor.
Iowa in Motion 2045 identifies the following statewide key issues for roads and bridges:
• Many high-cost bridge structures have major deficiencies.• Urban and commuter route congestion is growing.• Rural and urban interstate congestion is becoming more prevalent.• Safety needs exist on the system.• Additional on-road accommodations are needed for bicycle and pedestrian
trips. • Sustainable funding is needed to maintain acceptable condition ratings for
roadways and bridge structures.
REGION STATS
17,056 Lane miles of roads
76% Of road miles in good condition (PCI)
1,686 Bridges
286 Structurally deficient bridges
39 years Average age of bridge structures
775 Average AADT of all bridges
82.8 Average bridge sufficiency rating
Iowa DOT, REST Services FHWA, NBI, 2018
2045 LONG-RANGE TRANSPORTATION PLAN | 37
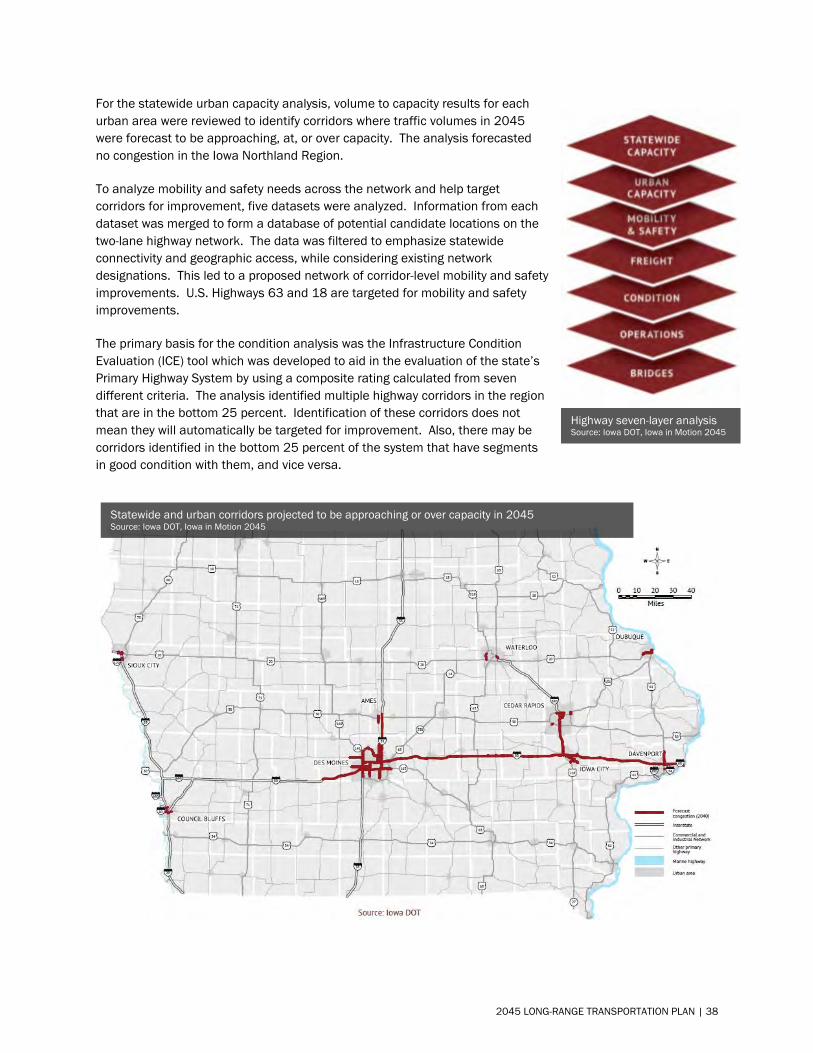
For the statewide urban capacity analysis, volume to capacity results for each urban area were reviewed to identify corridors where traffic volumes in 2045 were forecast to be approaching, at, or over capacity. The analysis forecasted no congestion in the Iowa Northland Region.
To analyze mobility and safety needs across the network and help target corridors for improvement, five datasets were analyzed. Information from each dataset was merged to form a database of potential candidate locations on the two-lane highway network. The data was filtered to emphasize statewide connectivity and geographic access, while considering existing network designations. This led to a proposed network of corridor-level mobility and safety improvements. U.S. Highways 63 and 18 are targeted for mobility and safety improvements.
The primary basis for the condition analysis was the Infrastructure Condition Evaluation (ICE) tool which was developed to aid in the evaluation of the state’s Primary Highway System by using a composite rating calculated from seven different criteria. The analysis identified multiple highway corridors in the region that are in the bottom 25 percent. Identification of these corridors does not mean they will automatically be targeted for improvement. Also, there may be corridors identified in the bottom 25 percent of the system that have segments in good condition with them, and vice versa.
Highway seven-layer analysis Source: Iowa DOT, Iowa in Motion 2045
Statewide and urban corridors projected to be approaching or over capacity in 2045 Source: Iowa DOT, Iowa in Motion 2045
2045 LONG-RANGE TRANSPORTATION PLAN | 38
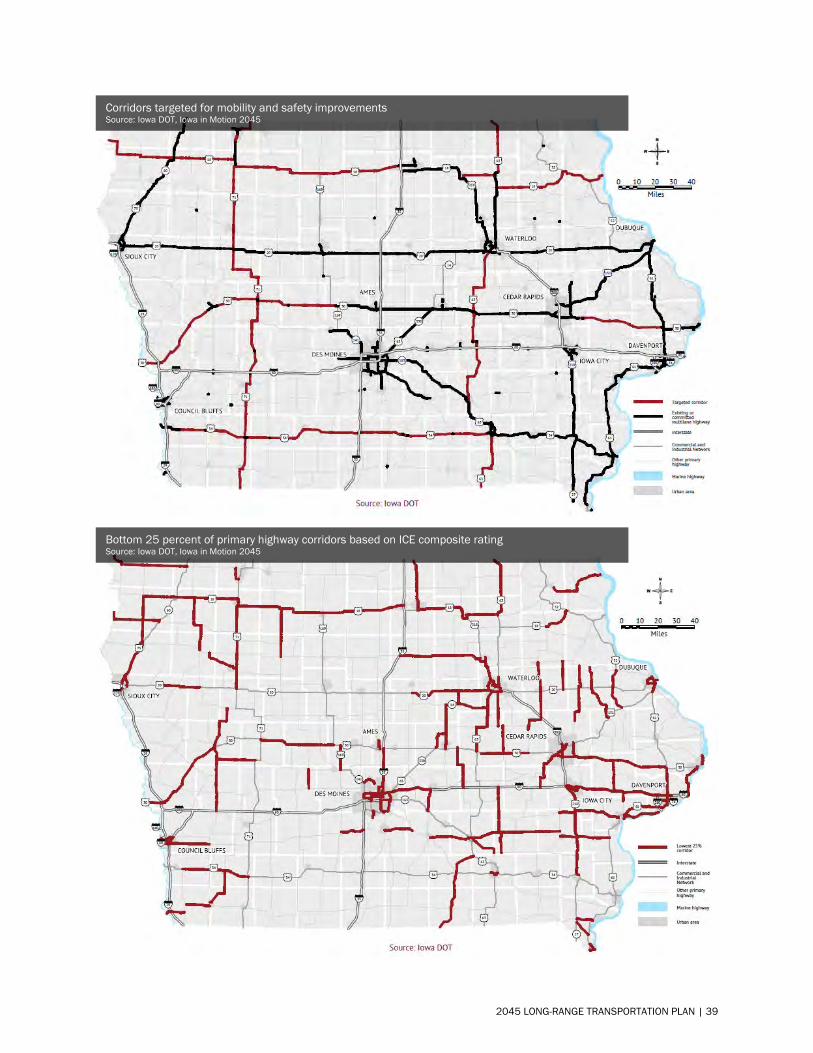
Corridors targeted for mobility and safety improvements Source: Iowa DOT, Iowa in Motion 2045
Bottom 25 percent of primary highway corridors based on ICE composite rating Source: Iowa DOT, Iowa in Motion 2045
2045 LONG-RANGE TRANSPORTATION PLAN | 39
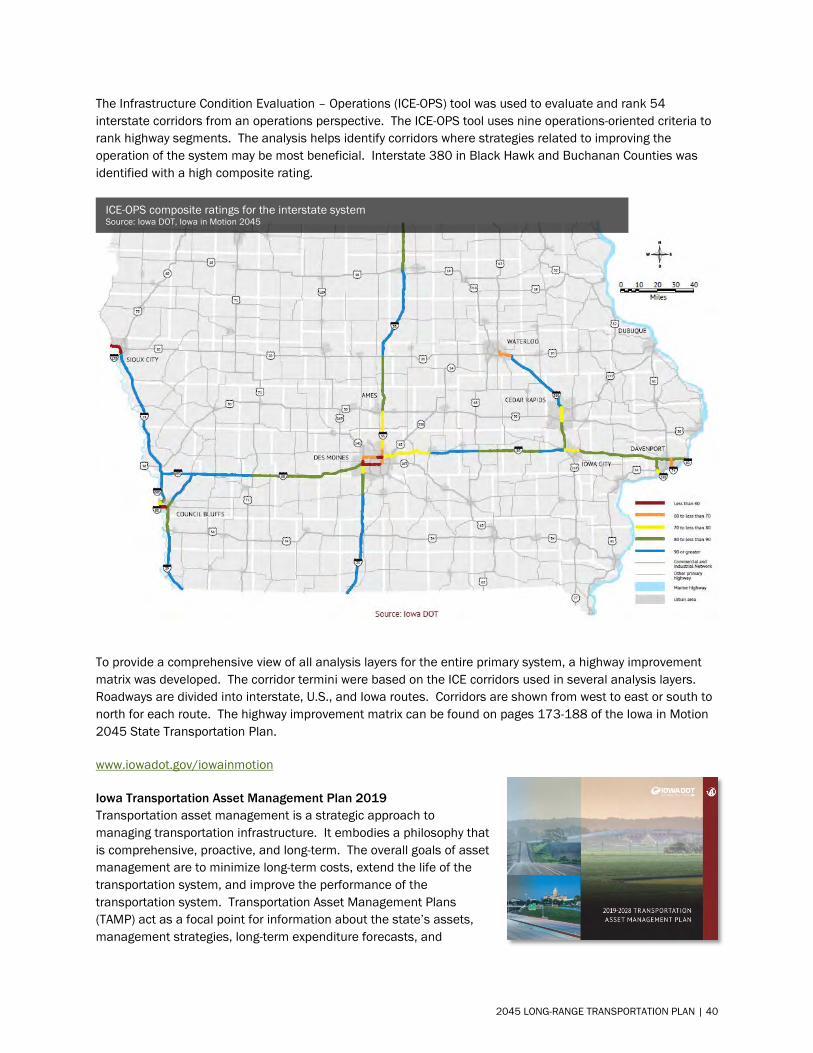
The Infrastructure Condition Evaluation – Operations (ICE-OPS) tool was used to evaluate and rank 54 interstate corridors from an operations perspective. The ICE-OPS tool uses nine operations-oriented criteria to rank highway segments. The analysis helps identify corridors where strategies related to improving the operation of the system may be most beneficial. Interstate 380 in Black Hawk and Buchanan Counties was identified with a high composite rating.
To provide a comprehensive view of all analysis layers for the entire primary system, a highway improvement matrix was developed. The corridor termini were based on the ICE corridors used in several analysis layers. Roadways are divided into interstate, U.S., and Iowa routes. Corridors are shown from west to east or south to north for each route. The highway improvement matrix can be found on pages 173-188 of the Iowa in Motion 2045 State Transportation Plan.
www.iowadot.gov/iowainmotion
Iowa Transportation Asset Management Plan 2019 Transportation asset management is a strategic approach to managing transportation infrastructure. It embodies a philosophy that is comprehensive, proactive, and long-term. The overall goals of asset management are to minimize long-term costs, extend the life of the transportation system, and improve the performance of the transportation system. Transportation Asset Management Plans (TAMP) act as a focal point for information about the state’s assets, management strategies, long-term expenditure forecasts, and
ICE-OPS composite ratings for the interstate system Source: Iowa DOT, Iowa in Motion 2045
2045 LONG-RANGE TRANSPORTATION PLAN | 40
business management processes. The Iowa DOT’s TAMP describes how the Iowa DOT manages its bridges and pavements throughout their lives. The TAMP also connects Iowa in Motion 2045 and system and modal plans to the Iowa DOT’s five-year Transportation Improvement Program.
www.iowadot.gov/systems_planning/Planning/Federal-Performance-Management-and-Asset-Management
Roadway Inventory The Iowa Northland Region road network comprises approximately 17,000 lane miles of roadway. The Federal Functional Classification (FFC) system groups highways and streets into classes according to the service they provide. Classifications are as follows:
• Arterials provide the highest level of mobility at the greatest vehicular speeds for the longestuninterrupted distances. Generally, these roadways have higher design standards and featuremultiple lanes with some degree of access control. The rural arterial network provides connectionsbetween metropolitan areas, cities, and bordering states. Arterials are divided into principal andminor, with principal arterials maintaining the highest speeds and longest uninterrupted distances.
• Collectors provide a mixture of mobility and land access. Collector streets provide an intraregionallevel of mobility by connecting the arterial network to local roadways. Rural collectors are subdividedinto major and minor.
• Local Streets represent the largest element of the road network in terms of mileage. Local streetsprovide the lowest level of mobility by accessing adjacent land use, serving local trip purposes, andconnecting to higher order roadways. Vehicular speeds are slower than on arterial or collector streets.
Map 3.1 shows the FFC of roads and delineates those highways and streets that are eligible for federal funding. Rural system roads must be classified as major collectors and above to be eligible for federal funding, and urban system roads (Independence and Waverly) must be classified as collectors and above. Federal funds can be utilized for pedestrian and bicycle accommodations along any roadway. In total, approximately 25 percent of the RTA’s roadway lane mileage is eligible for federal aid. Table 3.1 shows the distribution of roadway lane miles in the region by federal functional classification.
Table 3.1: Roadway Lane Miles, by Federal Functional Classification Interstate Other
Principal Arterial
Minor Arterial
Major Collector
Minor Collector
Local Total
Black Hawk 75.7 150.1 123.2 362.5 383.2 1,412.9 2,507.6 Bremer -- 334.8 114.6 295.3 244.8 1,723.0 2,712.5 Buchanan 40.8 213.3 88.0 525.0 489.0 1,857.4 3,213.5 Butler -- 70.9 157.4 418.4 413.7 2,047.6 3,108.0 Chickasaw -- 200.7 75.1 372.7 316.9 1,804.7 2,770.1 Grundy -- 210.8 90.0 387.1 414.9 1,641.7 2,744.5
Region 116.5 1,180.6 648.3 2,361.0 2,262.5 10,487.3 17,056.2 Source: Iowa DOT, Open Data Portal, Road Network Info
Figure 3.1 illustrates the distribution of roadways in the region by federal functional classification. Most of the network (61 percent) falls under the local classification. In contrast, Interstates, other principal arterials, and minor arterials comprise 11 percent of the total mileage. Table 3.2 shows the secondary road mileage by surface type.
2045 LONG-RANGE TRANSPORTATION PLAN | 41
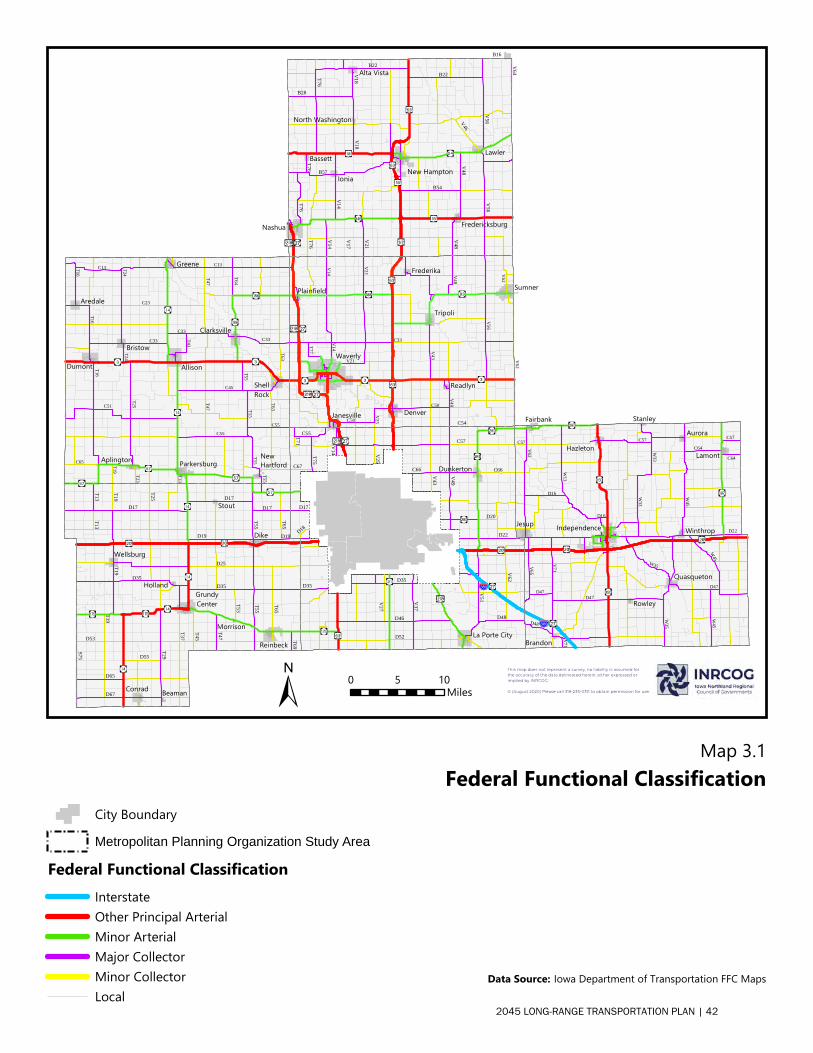
V56
V21
C33
V14
V43
C50
V49V48
V14
C50
V25
T77
V62
V62
V21
W45
D47
V71
V62
W35
W35
C57
V65
D16
W33
W13
C64
D48
V71
C64
D47
W45
D47
W45
C57
W33
D16
C57
D22
C51
C13 T24
C55
C45
C33
T16
T64T55
C33
T25
T55T55
C33
T55
C13T16
T16
T24
C55
T19
C23
T47T47
T33
T63
T43
T23
C65
T63
B57
V56
B28
V48
B54
V18
T76
V46
V21
V14
V17
B16
B22
V56
T76
V18
T76T76
V48
V14
B22 V64
D25T55
D19
D35
T29
S75
D17
T19D67
T37
T65
D65
D53
T45
T47
D55
T53
T25
T13T13 D17
D17
T19T19
T55
D35
T65T69
C57
D46
C66
D52
V51
V49
V37
V62
D22
V27V25
T75
D48
C55
V14
D20
D35
C54
V43
D19
D17
D18
C67 C66
D35
T71
La Porte City
Dunkerton
Janesville
IndependenceJesup
Quasqueton
Hazleton
Fairbank
Winthrop
Lamont
Aurora
Rowley
Brandon
Stanley
Dike
Reinbeck
GrundyCenter
Conrad
Wellsburg
Stout
Holland
Beaman
Morrison
AllisonDumont
Greene
ShellRock
Aredale
Clarksville
Bristow
ParkersburgAplington NewHartford
Waverly
Sumner
Denver
Tripoli
Frederika
Readlyn
Plainfield
Nashua
New Hampton
Lawler
Ionia
Alta Vista
Fredericksburg
Bassett
North Washington
0 105Miles
Map 3.1
City BoundaryMetropolitan Planning Organization Study Area
Federal Functional ClassificationInterstateOther Principal ArterialMinor ArterialMajor CollectorMinor CollectorLocal
Federal Functional Classification
Data Source: Iowa Department of Transportation FFC Maps
This map does not represent a survey, no liability is assumed forthe accuracy of the data delineated herein, either expressed or implied by INRCOG.
© (August 2020) Please call 319-235-0311 to obtain permission for use.
2045 LONG-RANGE TRANSPORTATION PLAN | 42
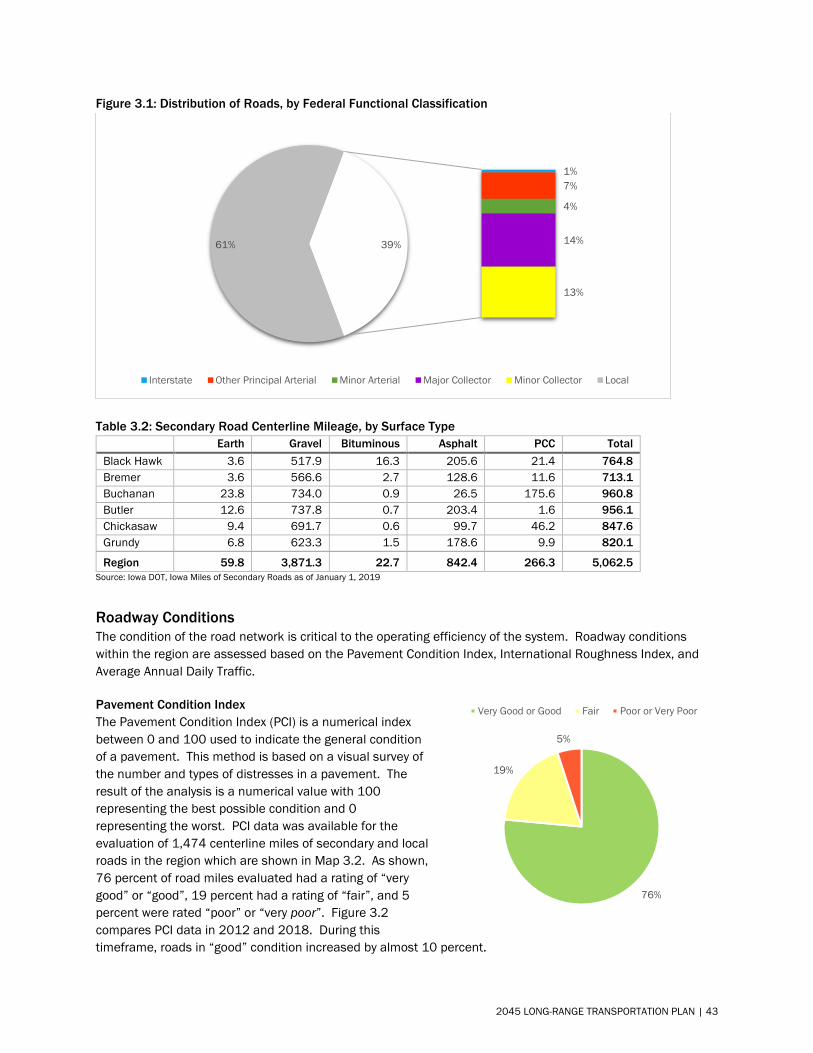
Figure 3.1: Distribution of Roads, by Federal Functional Classification
Table 3.2: Secondary Road Centerline Mileage, by Surface Type Earth Gravel Bituminous Asphalt PCC Total
Black Hawk 3.6 517.9 16.3 205.6 21.4 764.8 Bremer 3.6 566.6 2.7 128.6 11.6 713.1 Buchanan 23.8 734.0 0.9 26.5 175.6 960.8 Butler 12.6 737.8 0.7 203.4 1.6 956.1 Chickasaw 9.4 691.7 0.6 99.7 46.2 847.6 Grundy 6.8 623.3 1.5 178.6 9.9 820.1
Region 59.8 3,871.3 22.7 842.4 266.3 5,062.5 Source: Iowa DOT, Iowa Miles of Secondary Roads as of January 1, 2019
Roadway Conditions The condition of the road network is critical to the operating efficiency of the system. Roadway conditions within the region are assessed based on the Pavement Condition Index, International Roughness Index, and Average Annual Daily Traffic.
Pavement Condition Index The Pavement Condition Index (PCI) is a numerical index between 0 and 100 used to indicate the general condition of a pavement. This method is based on a visual survey of the number and types of distresses in a pavement. The result of the analysis is a numerical value with 100 representing the best possible condition and 0 representing the worst. PCI data was available for the evaluation of 1,474 centerline miles of secondary and local roads in the region which are shown in Map 3.2. As shown, 76 percent of road miles evaluated had a rating of “very good” or “good”, 19 percent had a rating of “fair”, and 5 percent were rated “poor” or “very poor”. Figure 3.2 compares PCI data in 2012 and 2018. During this timeframe, roads in “good” condition increased by almost 10 percent.
1%7%
4%
14%
13%
61% 39%
Interstate Other Principal Arterial Minor Arterial Major Collector Minor Collector Local
76%
19%
5%
Very Good or Good Fair Poor or Very Poor
2045 LONG-RANGE TRANSPORTATION PLAN | 43
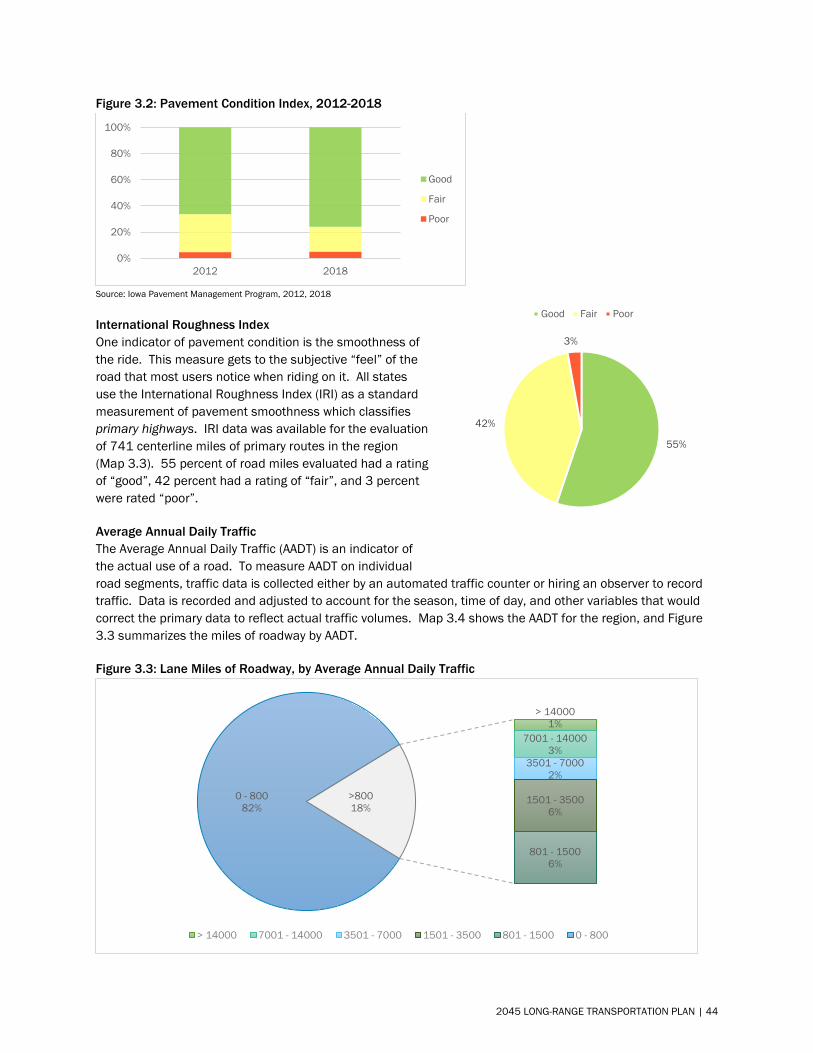
Figure 3.2: Pavement Condition Index, 2012-2018
Source: Iowa Pavement Management Program, 2012, 2018
International Roughness Index One indicator of pavement condition is the smoothness of the ride. This measure gets to the subjective “feel” of the road that most users notice when riding on it. All states use the International Roughness Index (IRI) as a standard measurement of pavement smoothness which classifies primary highways. IRI data was available for the evaluation of 741 centerline miles of primary routes in the region (Map 3.3). 55 percent of road miles evaluated had a rating of “good”, 42 percent had a rating of “fair”, and 3 percent were rated “poor”.
Average Annual Daily Traffic The Average Annual Daily Traffic (AADT) is an indicator of the actual use of a road. To measure AADT on individual road segments, traffic data is collected either by an automated traffic counter or hiring an observer to record traffic. Data is recorded and adjusted to account for the season, time of day, and other variables that would correct the primary data to reflect actual traffic volumes. Map 3.4 shows the AADT for the region, and Figure 3.3 summarizes the miles of roadway by AADT.
Figure 3.3: Lane Miles of Roadway, by Average Annual Daily Traffic
0%
20%
40%
60%
80%
100%
2012 2018
Good
Fair
Poor
> 140001%
7001 - 140003%
3501 - 70002%
1501 - 35006%
801 - 15006%
0 - 80082%
>80018%
> 14000 7001 - 14000 3501 - 7000 1501 - 3500 801 - 1500 0 - 800
55%
42%
3%
Good Fair Poor
2045 LONG-RANGE TRANSPORTATION PLAN | 44
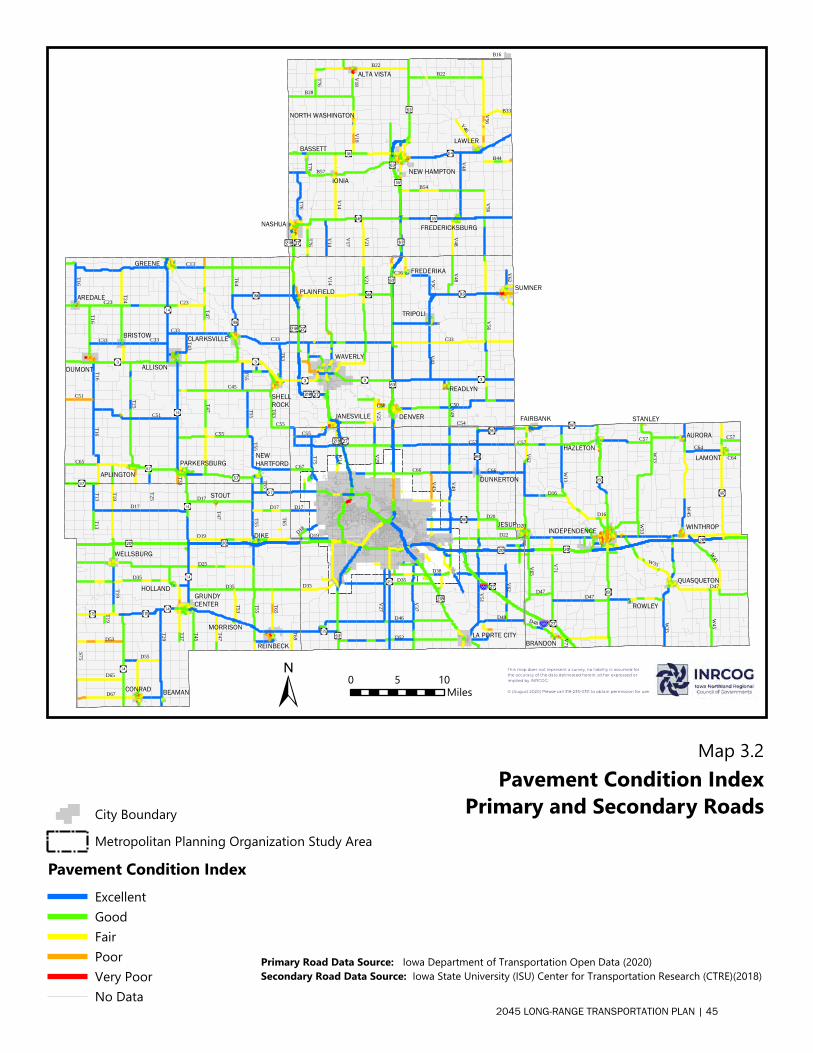
W45
D47
V71
V62
W35
W35
C57
V65
D16
W33
W13
C64
D48
V71
C64
D20
D47
W45
D47
W45
C57
W33
D16
C57
B57
V56
B28
V48
B54
V18
T76
V46
V21
V14
V17
B16
B22
V56
T76
V18
T76T76
V48
V14
B22
B33
B44
C33
V56
V21
V14
V43
V49V48
C50
V62
C16
V25
V5C
C50
C13
T47
C23
T25
C45
C51
C33
T24
C55
T55
T64
T16
T63
C65
T43T33
T63
T47
C33
T55T55
T16
C33
C51
C33
T16
C55
C23
T16
D25T55
D19
D35
T29
S75
D17
T19D67
T37
T65
D65
D53
T45
T47
D55
T53
T25
T13T13 D17
D17
T55
T19T19
T55
D35
T65T69
T47
C57
D46
C66
D52
V51
V49
V37
V62
D22
D38
V27V25
T75
D48
C55
V14
D20
D35
C54
V43
D19
D17
D18
C67 C66
D35
LA PORTE CITY
DUNKERTON
JANESVILLE
INDEPENDENCEJESUP
QUASQUETON
HAZLETON
FAIRBANK
WINTHROP
LAMONT
AURORA
ROWLEY
BRANDON
STANLEY
DIKE
REINBECK
GRUNDYCENTER
CONRAD
WELLSBURG
STOUT
HOLLAND
BEAMAN
MORRISON
ALLISONDUMONT
GREENE
SHELLROCK
AREDALE
CLARKSVILLEBRISTOW
PARKERSBURGAPLINGTON
NEWHARTFORD
WAVERLY
SUMNER
DENVER
TRIPOLI
FREDERIKA
READLYN
PLAINFIELD
NASHUA
NEW HAMPTON
LAWLER
IONIA
ALTA VISTA
FREDERICKSBURG
BASSETT
NORTH WASHINGTON
0 105Miles
Map 3.2
City BoundaryMetropolitan Planning Organization Study Area
Pavement Condition IndexExcellentGoodFairPoorVery PoorNo Data
Pavement Condition Index Primary and Secondary Roads
Primary Road Data Source: Iowa Department of Transportation Open Data (2020)Secondary Road Data Source: Iowa State University (ISU) Center for Transportation Research (CTRE)(2018)
This map does not represent a survey, no liability is assumed forthe accuracy of the data delineated herein, either expressed or implied by INRCOG.
© (August 2020) Please call 319-235-0311 to obtain permission for use.
2045 LONG-RANGE TRANSPORTATION PLAN | 45
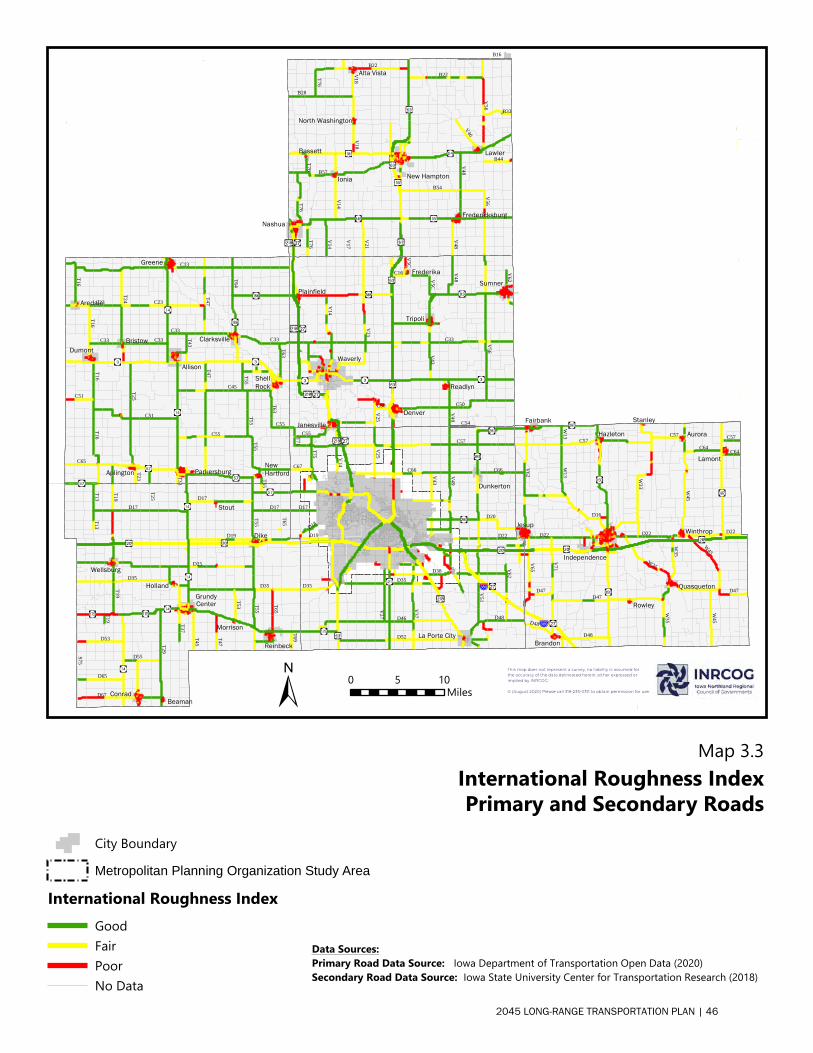
B57
V56
B28
V48
B54
V18
T76
V46
V21
V14
V17
B16
B22
V56
T76
V18
T76T76
V48
V14
B22
B33
B44
C33 V56
V21
V14
V43
V49V48
C50
V62
C16
V25
V5C
C50V5CC13
T47
C23
T25
C45
C51
C33
T24
C55
T55
T64
T16
T63
C65
T43T33
T63
T47
C33
T55T55
T16
C33
C51
C33
T16
C55
C23
T16
T23
D25T55
D19
D35
T29
S75
D17
T19D67
T37
T65
D65
D53 T45
T47
D55
T53
T25
T13T13 D17
D17
T55
T19T19
T55
D35
T65T69
C57
D46
C66
D52
V51
V49
V37
V62
D22
D38
V27V25
T75
D48
C55
V14
D20
D35
C54
V43
D19
D17
D18
C67 C66
D35
T71 C57
D47
V62 W33
V71
V65
D22
D48
W45
W35
C64
W13 C57
W13
D22
D48
D22
W35
W35
D47
W45
C57
D47
W45
D16
C64
La Porte City
Dunkerton
Janesville
Independence
Jesup
Quasqueton
HazletonFairbank
Winthrop
Lamont
Aurora
Rowley
Brandon
Stanley
Dike
Reinbeck
GrundyCenter
Conrad
Wellsburg
Stout
Holland
Beaman
Morrison
Allison
Dumont
Greene
ShellRock
Aredale
ClarksvilleBristow
ParkersburgAplingtonNewHartford
Waverly
Sumner
Denver
Tripoli
Frederika
Readlyn
Plainfield
Nashua
New Hampton
Lawler
Ionia
Alta Vista
Fredericksburg
Bassett
North Washington
0 105Miles
Map 3.3
City BoundaryMetropolitan Planning Organization Study Area
International Roughness IndexGoodFairPoorNo Data
International Roughness IndexPrimary and Secondary Roads
Data Sources:Primary Road Data Source: Iowa Department of Transportation Open Data (2020)Secondary Road Data Source: Iowa State University Center for Transportation Research (2018)
This map does not represent a survey, no liability is assumed forthe accuracy of the data delineated herein, either expressed or implied by INRCOG.
© (August 2020) Please call 319-235-0311 to obtain permission for use.
2045 LONG-RANGE TRANSPORTATION PLAN | 46
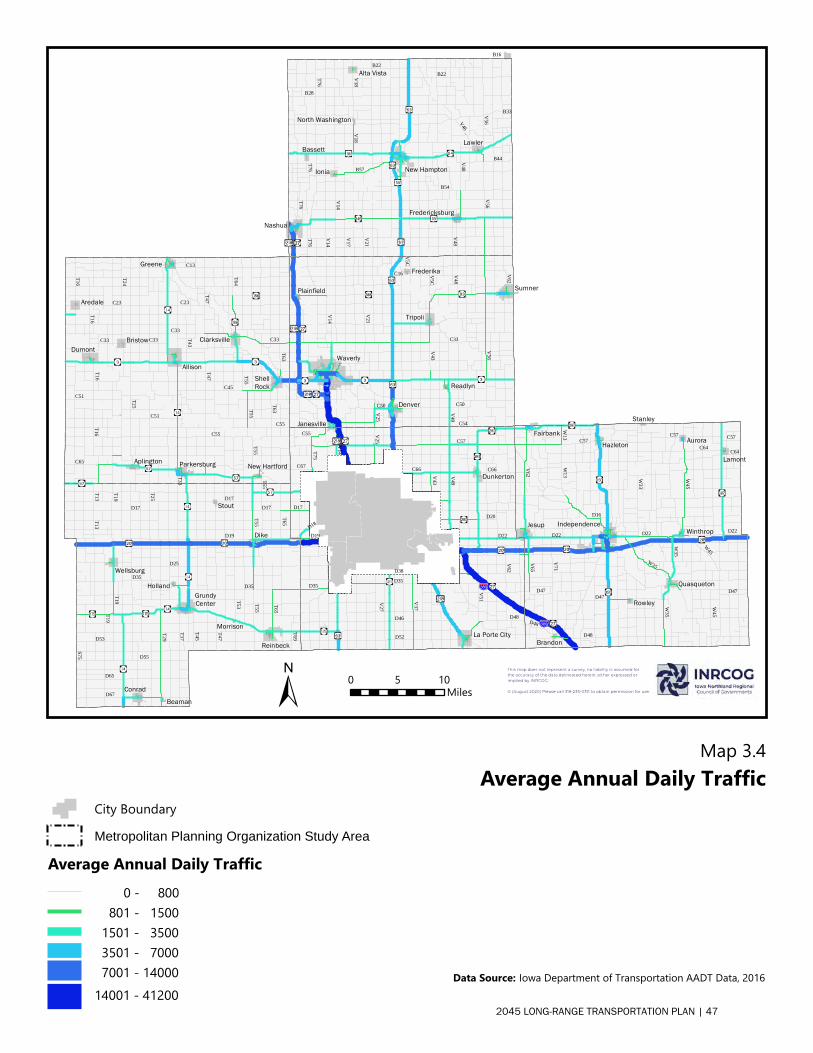
B57
V56
B28
V48
B54
V18
T76
V46
V21
V14
V17
B16
B22
V56
T76
V18
T76T76
V48
V14
B22
B33
B44
C33
V56
V21
V14
V43
V49V48
C50
V62
C16
V25
V5C
C50V5CC13
T47
C23
T25
C45
C51
C33
T24
C55
T55
T64
T16
T63
C65
T43T33
T63
T47
C33
T55T55
T16
C33
C51
C33
T16
C55
C23
T16
D25T55
D19
D35
T29
S75
D17
T19D67
T37
T65
D65
D53
T45
T47
D55
T53
T25
T13T13 D17
D17
T55
T19T19
T55
D35
T65T69
C57
D46
C66
D52
V51
V49
V37
V62
D22
D38
V27V25
T75
D48
C55
V14
D20
D35
C54
V43
D19
D17
D18
C67 C66
D35
C57
D47
V62 W33
V71
V65
D22
D48
W45
W35
C64
W13 C57
W13
D22
D48
D22
W35
W35
D47
W45
C57
D47
W45
D16
C64
La Porte City
Dunkerton
Janesville
IndependenceJesup
Quasqueton
HazletonFairbank
Winthrop
Lamont
Aurora
Rowley
Brandon
Stanley
Dike
Reinbeck
GrundyCenter
Conrad
Wellsburg
Stout
Holland
Beaman
Morrison
Allison
Dumont
Greene
ShellRock
Aredale
ClarksvilleBristow
ParkersburgAplington New Hartford
Waverly
Sumner
Denver
Tripoli
Frederika
Readlyn
Plainfield
Nashua
New Hampton
Lawler
Ionia
Alta Vista
Fredericksburg
Bassett
North Washington
0 105Miles
Map 3.4
City BoundaryMetropolitan Planning Organization Study Area
Average Annual Daily Traffic 0 - 800
801 - 1500 1501 - 3500 3501 - 7000 7001 - 1400014001 - 41200
Average Annual Daily Traffic
Data Source: Iowa Department of Transportation AADT Data, 2016
This map does not represent a survey, no liability is assumed forthe accuracy of the data delineated herein, either expressed or implied by INRCOG.
© (August 2020) Please call 319-235-0311 to obtain permission for use.
2045 LONG-RANGE TRANSPORTATION PLAN | 47
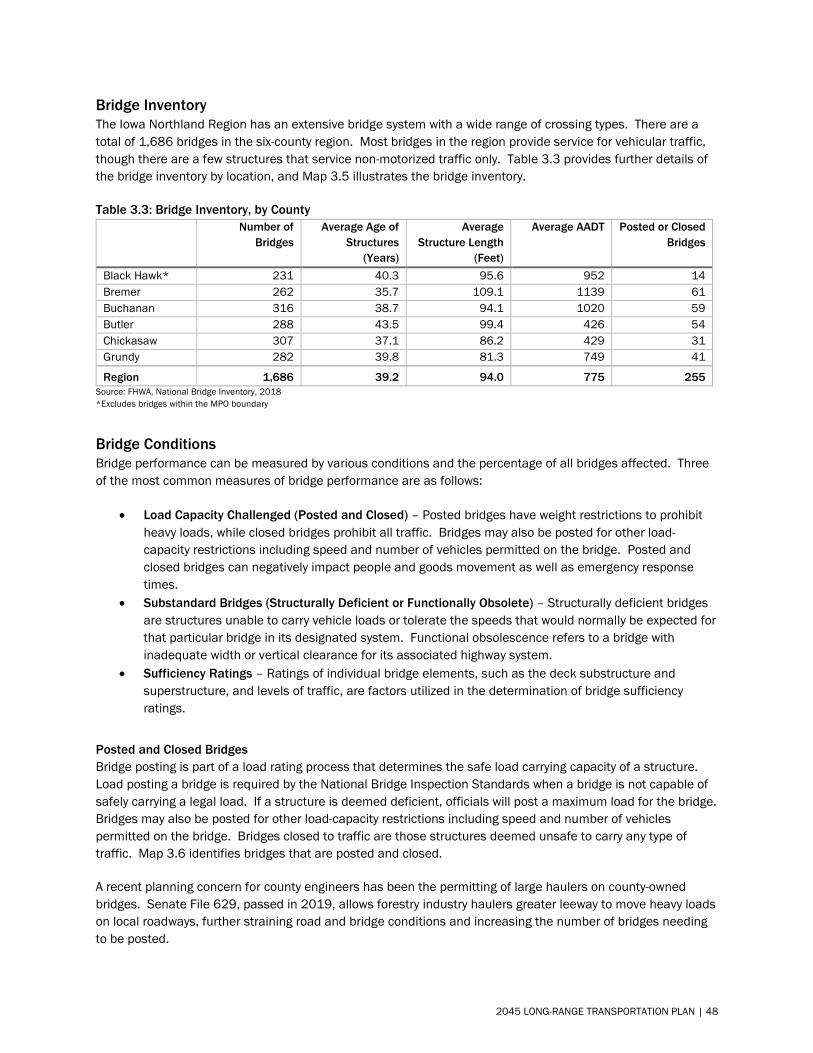
Bridge Inventory The Iowa Northland Region has an extensive bridge system with a wide range of crossing types. There are a total of 1,686 bridges in the six-county region. Most bridges in the region provide service for vehicular traffic, though there are a few structures that service non-motorized traffic only. Table 3.3 provides further details of the bridge inventory by location, and Map 3.5 illustrates the bridge inventory.
Table 3.3: Bridge Inventory, by County Number of
Bridges Average Age of
Structures (Years)
Average Structure Length
(Feet)
Average AADT Posted or Closed Bridges
Black Hawk* 231 40.3 95.6 952 14 Bremer 262 35.7 109.1 1139 61 Buchanan 316 38.7 94.1 1020 59 Butler 288 43.5 99.4 426 54 Chickasaw 307 37.1 86.2 429 31 Grundy 282 39.8 81.3 749 41
Region 1,686 39.2 94.0 775 255 Source: FHWA, National Bridge Inventory, 2018 *Excludes bridges within the MPO boundary
Bridge Conditions Bridge performance can be measured by various conditions and the percentage of all bridges affected. Three of the most common measures of bridge performance are as follows:
• Load Capacity Challenged (Posted and Closed) – Posted bridges have weight restrictions to prohibitheavy loads, while closed bridges prohibit all traffic. Bridges may also be posted for other load-capacity restrictions including speed and number of vehicles permitted on the bridge. Posted andclosed bridges can negatively impact people and goods movement as well as emergency responsetimes.
• Substandard Bridges (Structurally Deficient or Functionally Obsolete) – Structurally deficient bridgesare structures unable to carry vehicle loads or tolerate the speeds that would normally be expected forthat particular bridge in its designated system. Functional obsolescence refers to a bridge withinadequate width or vertical clearance for its associated highway system.
• Sufficiency Ratings – Ratings of individual bridge elements, such as the deck substructure andsuperstructure, and levels of traffic, are factors utilized in the determination of bridge sufficiencyratings.
Posted and Closed Bridges Bridge posting is part of a load rating process that determines the safe load carrying capacity of a structure. Load posting a bridge is required by the National Bridge Inspection Standards when a bridge is not capable of safely carrying a legal load. If a structure is deemed deficient, officials will post a maximum load for the bridge. Bridges may also be posted for other load-capacity restrictions including speed and number of vehicles permitted on the bridge. Bridges closed to traffic are those structures deemed unsafe to carry any type of traffic. Map 3.6 identifies bridges that are posted and closed.
A recent planning concern for county engineers has been the permitting of large haulers on county-owned bridges. Senate File 629, passed in 2019, allows forestry industry haulers greater leeway to move heavy loads on local roadways, further straining road and bridge conditions and increasing the number of bridges needing to be posted.
2045 LONG-RANGE TRANSPORTATION PLAN | 48
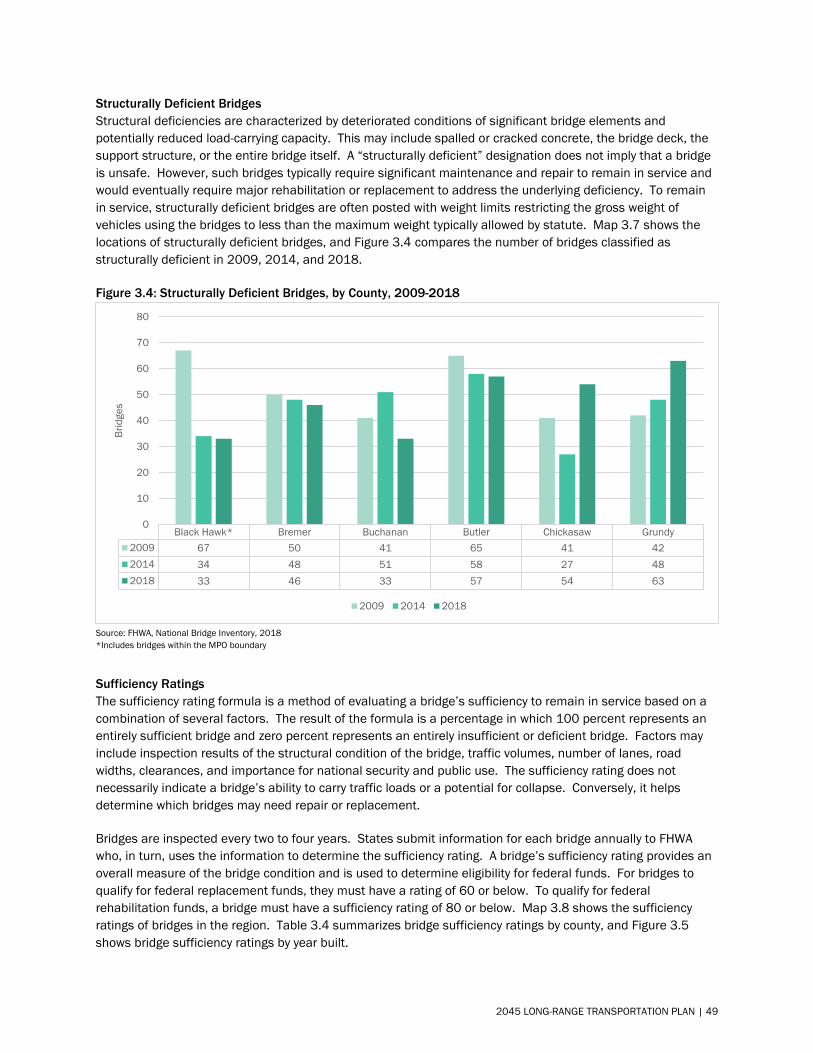
Structurally Deficient Bridges Structural deficiencies are characterized by deteriorated conditions of significant bridge elements and potentially reduced load-carrying capacity. This may include spalled or cracked concrete, the bridge deck, the support structure, or the entire bridge itself. A “structurally deficient” designation does not imply that a bridge is unsafe. However, such bridges typically require significant maintenance and repair to remain in service and would eventually require major rehabilitation or replacement to address the underlying deficiency. To remain in service, structurally deficient bridges are often posted with weight limits restricting the gross weight of vehicles using the bridges to less than the maximum weight typically allowed by statute. Map 3.7 shows the locations of structurally deficient bridges, and Figure 3.4 compares the number of bridges classified as structurally deficient in 2009, 2014, and 2018.
Figure 3.4: Structurally Deficient Bridges, by County, 2009-2018
Source: FHWA, National Bridge Inventory, 2018 *Includes bridges within the MPO boundary
Sufficiency Ratings The sufficiency rating formula is a method of evaluating a bridge’s sufficiency to remain in service based on a combination of several factors. The result of the formula is a percentage in which 100 percent represents an entirely sufficient bridge and zero percent represents an entirely insufficient or deficient bridge. Factors may include inspection results of the structural condition of the bridge, traffic volumes, number of lanes, road widths, clearances, and importance for national security and public use. The sufficiency rating does not necessarily indicate a bridge’s ability to carry traffic loads or a potential for collapse. Conversely, it helps determine which bridges may need repair or replacement.
Bridges are inspected every two to four years. States submit information for each bridge annually to FHWA who, in turn, uses the information to determine the sufficiency rating. A bridge’s sufficiency rating provides an overall measure of the bridge condition and is used to determine eligibility for federal funds. For bridges to qualify for federal replacement funds, they must have a rating of 60 or below. To qualify for federal rehabilitation funds, a bridge must have a sufficiency rating of 80 or below. Map 3.8 shows the sufficiency ratings of bridges in the region. Table 3.4 summarizes bridge sufficiency ratings by county, and Figure 3.5 shows bridge sufficiency ratings by year built.
Black Hawk* Bremer Buchanan Butler Chickasaw Grundy2009 67 50 41 65 41 422014 34 48 51 58 27 482018 33 46 33 57 54 63
0
10
20
30
40
50
60
70
80
Brid
ges
2009 2014 2018
2045 LONG-RANGE TRANSPORTATION PLAN | 49
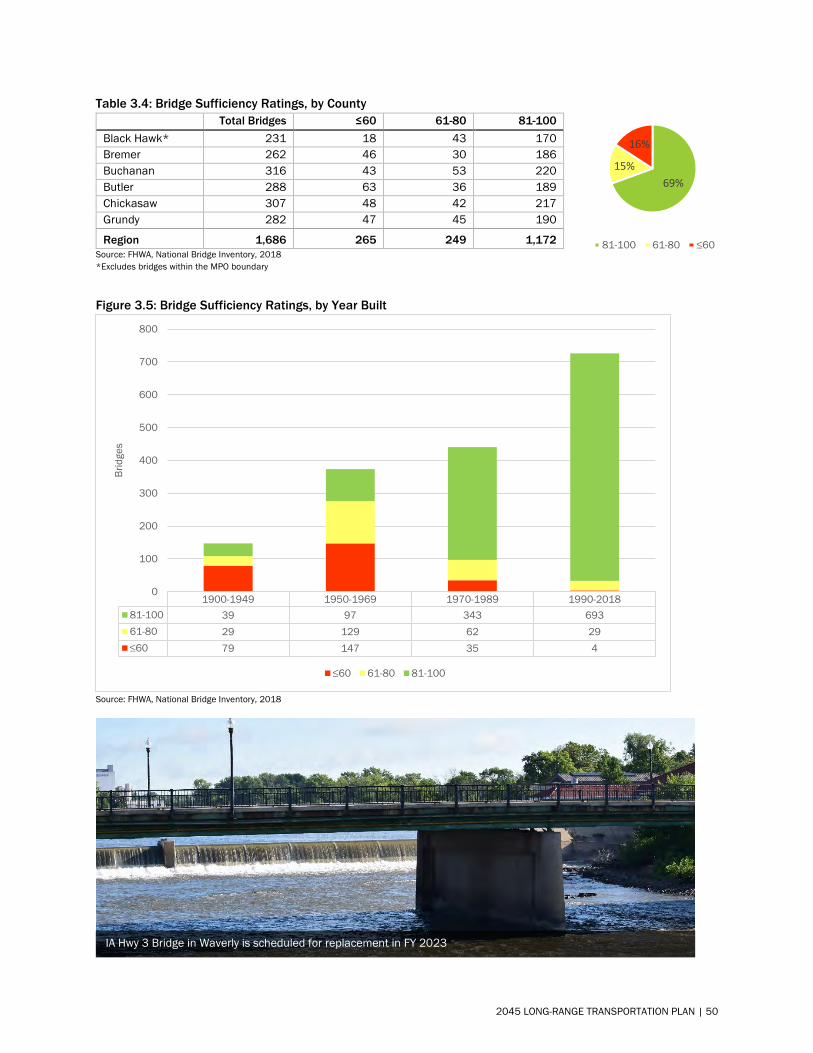
69%15%
16%
81-100 61-80 ≤60
Table 3.4: Bridge Sufficiency Ratings, by County
Source: FHWA, National Bridge Inventory, 2018 *Excludes bridges within the MPO boundary
Figure 3.5: Bridge Sufficiency Ratings, by Year Built
Source: FHWA, National Bridge Inventory, 2018
1900-1949 1950-1969 1970-1989 1990-201881-100 39 97 343 69361-80 29 129 62 29≤60 79 147 35 4
0
100
200
300
400
500
600
700
800
Brid
ges
≤60 61-80 81-100
Total Bridges ≤60 61-80 81-100Black Hawk* 231 18 43 170 Bremer 262 46 30 186 Buchanan 316 43 53 220 Butler 288 63 36 189 Chickasaw 307 48 42 217 Grundy 282 47 45 190
Region 1,686 265 249 1,172
IA Hwy 3 Bridge in Waverly is scheduled for replacement in FY 2023
2045 LONG-RANGE TRANSPORTATION PLAN | 50
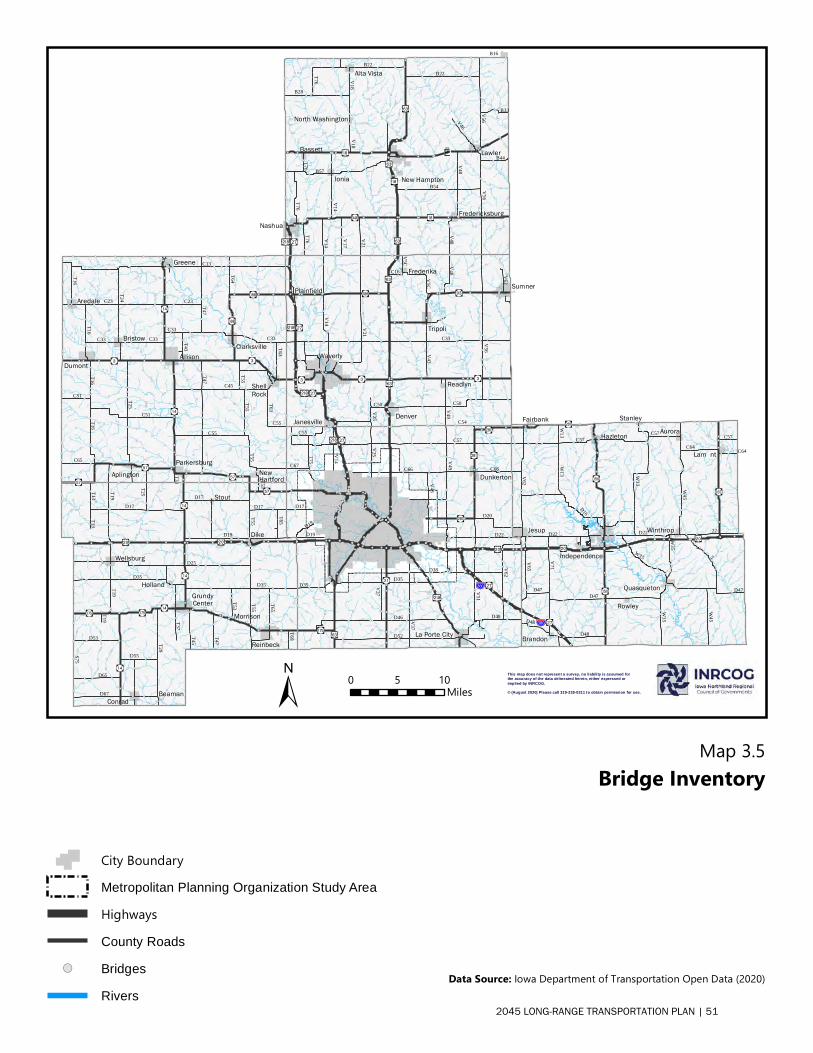
!(
!(
!(
!(!(
!(
!(
!(
!(
!(
!(
!(!(!(
!( !(!(
!(!(
!( !(
!(
!(
!(
!(
!(
!(
!(
!(
!(
!(
!(
!(
!(
!( !(!(!(!(
!(!( !(!(!( !(!(
!(!(
!(
!(
!(
!(
!(!(
!(
!(
!(
!(
!(!(!(!(
!( !(
!(
!(
!(
!(
!(
!(
!(
!( !(!( !(
!( !( !( !(!(!(
!(!( !(!(!(
!(!(
!(
!(
!(
!(!(!(!(
!(!(
!(!(
!( !(
!(
!(
!(
!(!(
!(!(
!(
!(
!(
!(
!(
!(
!( !(!(!(!(
!(!(!(
!(!(
!(
!(
!(
!(
!(
!(
!(
!(
!(
!(
!(
!(!(!(
!(!(!( !( !(
!(!(!(
!(
!(
!(
!(
!(!(!(
!(!(!(!( !( !(
!(!( !( !(!(!(!(!(
!(
!(
!(
!(
!(
!(
!(
!(
!(!( !(!(!(
!(
!(!(!(
!( !(
!(
!(
!(
!(!(
!(
!(
!(
!(
!(
!(
!(
!(
!(
!(
!(
!(
!(
!(
!(
!(
!(
!(
!(
!(
!(
!(
!(
!(
!(
!( !( !( !( !(!( !(
!(
!(
!(!(!(
!(
!(
!(
!(
!(
!(
!(
!(
!(
!(
!(
!(
!(
!(
!(
!(!(
!(
!(
!(
!(
!(
!(
!(
!( !( !(
!(!( !( !(
!(
!(
!( !(
!(
!(
!(!(
!(
!(
!(
!(
!(!(
!(
!(
!(!(
!(
!(
!(
!(
!(!(!(!(
!(!(!(!(
!(!(
!(
!(!(
!(
!(!( !(
!(
!(
!(
!(
!(
!(
!(
!(!(!(
!(
!(!(
!( !(
!(
!(
!(
!(
!(
!(
!(
!(
!(
!(
!(
!(
!( !( !(
!(
!(
!(
!(
!(
!(
!(
!(!(!(!(!(!(!(
!(
!(
!(
!(
!(
!(
!(
!(
!(
!(
!(
!(
!(!(!( !(!(
!(
!(!(
!( !(!( !(!(!(!(
!(
!(
!(
!(
!(
!(
!(
!(!(!(!( !(
!(
!(
!(!(
!(
!(
!(
!(!(
!(
!(
!(
!(
!(
!(
!(
!(!(!(!(
!(!(
!(!(
!(
!( !(!(!(
!(
!(!(
!(
!(
!(
!(
!(
!(
!(
!(
!(
!(!(
!(
!(
!(
!(
!(
!(
!(
!(
!(
!(
!(
!(
!(
!(
!(!(
!(!( !(
!(!( !(!(
!(
!(!(
!(!(
!(!(!(!(
!(!(
!(
!(
!(
!(
!(
!(
!(
!(
!(
!(
!(
!(
!(
!(
!(
!(
!(
!(!(
!(
!(
!(
!(
!(
!(
!(!(
!(
!(
!(
!(
!(
!(
!(
!(
!(
!( !(
!(
!(
!(
!(!(!(
!(
!(!(
!(
!(
!(
!(
!(
!(
!(
!(
!( !(
!(
!(
!(!(
!( !( !(!( !(
!(
!(
!(
!(
!(
!(
!(
!(!(
!( !(
!(!(
!(!(
!( !(!( !( !(!( !(!( !(!(
!(!( !(
!(!(!(
!(
!( !(
!(!(
!(
!( !(!( !( !(
!( !( !( !(
!(
!(
!(
!(
!(
!(
!(
!(
!(
!(
!(
!(
!(
!(
!(
!(
!(
!(
!(
!(
!(
!(
!(
!(
!(
!(
!(
!(
!(
!(
!(
!(
!(
!(
!(
!(
!(
!(
!(
!(
!( !(!(
!(
!(
!(
!(
!(
!(
!(
!(
!(
!(
!(
!(
!(
!(
!(
!(
!(
!(
!(
!(
!(
!(
!(
!(
!(
!(!( !(
!( !(
!( !(
!(!(!( !(
!(!(!(
!(
!(
!(
!(!(
!(
!(
!(
!(
!(
!(
!(
!(
!(
!(
!(!( !( !(!(
!(!(
!(
!(
!(
!(!(
!(
!(!(!(!(
!(
!(
!(
!(
!(
!(
!(
!(
!(
!(
!(
!(
!(
!(
!(
!(
!(
!(
!( !(
!(!(
!(
!(
!(
!( !(
!(
!(
!(
!(
!(
!(
!(
!(
!(
!(
!(
!(
!(
!(
!(
!(
!(
!(
!(
!(
!(
!(
!(
!(
!(
!(
!(!( !(!(!(!(
!(!(!( !( !( !(
!(
!(
!(!(
!(
!(!( !(!(!(
!(!( !(!(!(!( !( !(!(!(
!(
!(
!(
!(
!(
!(
!(
!(
!(
!(
!(
!(
!(
!(
!(
!(
!(
!(
!(
!(
!(
!(
!(
!(
!(
!(
!(
!(
!(
!(
!(
!(
!(
!(
!(!(
!(!(
!(
!(
!(
!(
!(
!(!( !(
!( !(!(
!(
!(!(
!(!(
!(
!(
!(
!(
!(
!(!( !( !(!( !(
!(!( !( !(
!( !( !(!(
!(
!(
!(
!(
!(
!( !(
!(!(
!(!( !(!(!(
!(!(!(
!(
!(
!(
!(!(
!(
!(
!(
!(
!(
!(
!(
!(
!(!( !( !(!(
!( !(!(
!(
!( !(!( !(!( !( !(!(
!(
!(!(
!(
!(
!(
!(
!(
!(
!(
!(
!(!(
!(
!( !(!(!(
!(
!(
!(!(
!(
!(
!(
!(
!(
!(!(
!(
!(!(
!(
!(
!(
!(
!(
!(
!(
!(
!(
!(
!(
!(
!(
!(
!(
!(
!(
!(!(
!(
!(
!(
!(
!(
!(
!(
!(
!(
!(
!(
!(!(
!(!(!(
!(
!(
!(
!(
!(
!(
!(
!(
!(
!(
!(
!(
!(!(
!(!(
!( !(
!(
!( !(
!(
!(
!(
!(
!(
!(!(
!(
!(
!(!(
!(!(
!(!( !(!(
!(
!(
!(
!(
!(
!(
!(
!(
!(
!(
!(
!(
!( !(!(
!(
!(
!(
!(!(
!(
!(
!(!(!(!(
!(
!(
!(
!(
!(
!(
!(
!( !(
!(
!(
!(!(!(
!(
!(!(
!(
!( !( !( !(
!(
!(
!( !(!(
!(
!(
!(
!(
!(!( !(
!(!(
!(
!(!(
!(
!(
!(
!(!(
!(
!( !(
!(
!(!(
!(
!(
!(!(
!(!(
!(
!( !(
!(!(!(
!(!(!(
!(
!(
!(
!(!(
!(
!(
!(
!(
!(
!(
!(
!( !(!(
!(!(
!(
!(
!(
!(
!(
!(!(!(
!(
!( !(
!(
!(
!(
!(
!( !(
!(
!(
!(
!(
!(
!(
!(
!(
!(
!(
!(!( !(
!(
!(
!(
!(
!(
!(
!(!(
!(!(
!(!(
!(
!(
!(!(
!(
!(
!(
!(
!(!(
!(!(
!(
!(
!(
!(
!(
!(!(
!(
!(
!(
!(
!(
!(!(
!(
!(
!(!(!(
!(!(
!(!(
!(
!( !(
!(
!(
!(!(
!(
!(!(
!(
!(
!(
!(
!(!(
!(!(
!(
!(
!(
!(
!(
!(!(
!(!(
!(!(
!(
!(
!(
!(
!(
!(
!(
!(
!(
!(
!(
!(!( !(
!(!( !(
!(
!(
!(!(
!(
!(
!( !(!(
!(
!(
!( !(!(
!(
!(
!(
!(
!(
!(
!(
!(
!( !( !(
!(
!(
!(
!(
!(
!(
!(
!(
!(
!(
!(
!(
!(!(
!(
!(
!(
!(
!(
!(
!(
!(
!(
!(!(
!(
!(
!(
!(
!(
!(
!(
!(
!(
!(!( !(!(!(
!(
!(
!(
!(
!(
!(
!(
!(
!(
!(
!(
!(
!(
!(!( !(!(
!(!( !(!( !( !(
!(
!(
!(!( !(!(
!(
!(
!(!(
!(
!(
!(
!(
!(
!(
!(
!(
!(
!(
!(
!(
!(
!(
!(
!(
!(!( !( !(!( !(!(!( !( !(
!(!(
!(
!(
!(
!(
!(
!(
!(!(
!(
!(
!(
!(
!(
!(
!(
!(
!(
!(
!(
!(
!(
!(
!(
!(
!(
!(
!(
!(
!(
!(
!(
!(
!(
!(
!(
!(!(!(
!(
!(
!(
!( !(!(
!(!( !(!( !(
!(
!(
!(
!(
!(
!(
!(
!(
!(
!(
!(
!(
!(
!(
!(
!(
!(
!(
!(
!(
!(
!(
!(
!( !( !(
!( !( !( !(
!(
!(
!(!(
!(
!(
!(
!(
!(
!(
!(
!(
!(
!(
!(
!(
!(
!(!(
!(!(!( !( !(!(!(
!(
!(
!( !(
!(
!(
!(
!(
!(
!(
!(
!(
!(!(
!( !( !(!( !(
!(
!(
!(
!(
!(
!(
!(
!( !(!(!(
!( !(!( !( !(
!(
!(
!(
!(
!(
!(
!(
!(
!(
!(!(
!(
!(
!(
!(
!(!(
!(
!(!(
!(
!(
!(
!( !(!(
!(
!(!( !(
!(!(!(
!(
!(
!(
!(!(
!(
!(
!(
!(
!(
!(
!(!(
!(
!(
!(
!(
!(
!(
!(
!(
!(
!(
!( !(
!(
!(
!(
!(
!(
!(
!(
!(
!(
!(
!(
!(
!(
!(!(!( !( !( !(
!(!(
!(
!(
!(
!(
!(
!(
!(
!(
!(
!(!( !(!(
!(!(
!(
!(
!(
!(
!(
!(
!(
!(
!(
!(
!( !(
!(
!(
!(
!(!(!(
!(
!(
!(
!(
!(
!(
!(
!(
!(
!(
!(
!(
!(
!(!(!(
!(!(
!(
!(
!( !(!(
!(!( !(
!(!(!(
!(
!( !(
!(
!(
!(
!(!(!(
!(
!( !( !( !(!(
!(
!(
!(
!(!(
!(
!(!(!(!(
!(!( !(
!(
!( !(
!(
!(!(
!(
!(
!(
!(
!(
!(
!(
!(!(!(!(!(
!(!(
!(
!(
!(
!(
!(
!(
!(
!(
!(!( !( !(
!(
!(
!(
!(
!(!(
!(
!(
!(
!(
!(
!(!(
!(
!(
!(!(!( !(!(
!(
!(
!(
!(
!(
!( !( !(
!(
!( !(
!(
!(
!(
!(
!(
!(
!(
!(
!(
!( !( !(
!(
!(
!(
!(
!(
!(
!(
!( !(
!(
!(
!(
!(
!(
!(
!(
!(
!(
!(
!(
!(
!(
!( !(
!(
!(
!(
!(
!(
!(
!(
!( !(
!(
!(
!( !(!(
!(
!(
!(
!(
!(
!(
!(
!(
!(
!(
!(
!(
!(
!(
!(
!(
!(
!(!(
!(
!(
!(
!(
!(
!(
!(
!(
!(
!(
!(
!(
!(
!(
!( !(
!( !( !(!(!(
!( !( !(!(
!(!(
!(
!(
!(
!(
!(
!(
!(
!(
!(
!(!(
!( !( !(!(
!( !(
!(!(
!( !( !(
!( !( !(!(
!(
!( !(!( !( !(
!(
!( !(
!(
!(
!(
!(
!(
!(!(!(!(!(!(!( !(!(!(!(!(
!(
!(
!(!(!( !(
!(
!(
!(
!(
!(
!(
!(
!(
!(
!(
!(
!(
!(
!(
!(
!(
!(
!(
!(
!(
!(
!(
!(
!(
!(
!(
!(
!(
!(
!(
!(
!(
!(
!(
!(!(
!(
!(
!(
!(
!(
!(
!(!(
!(
!(
!(
!(!(
!(!(!(
!(!(
!(
!(!(
!(!( !(
!(
!(
!(!(
!(!(
!(
!(!(
!(
!(
!(
!(
!(
!(
?å
Ip Ip
?È
A¦
?È
?È
A¦?È
?å
I¡
I¡
IoAó
Io
A@72K»
QË
Io
I¡
?È
A«
?¿?¿
?È
?å?å
?å
A«
Az
AÙ
IpIp
Az
A@72%&g(
Aª
I¡?¿?¿?¿
A@72K»
A@72K»
A« ?ø
I¡
A@72K»
AÙ
Ip
I¡A¦
?Ì
K»
A@72%&g(
AÙ
AÙ
B57
V56
B28
V48
B54
V18
T76
V46
V21
V14
V17
B16
B22
V56
T76
V18
T76T76
V48
V14
B22
B33
B44
C33 V56
V21
V14
V43
V49V48
C50
V62
C16
V25
V5C
C50V5CC13
T47
C23
T25
C45
C51
C33
T24
C55
T55
T64
T16
T63
C65
T43T33
T63
T47
C33
T55T55
T16
C33
C51
C33
T16 C55
C23
T16
D25T55
D19
D35
T29
S75
D17
T19D67
T37
T65
D65
D53 T45
T47
D55
T53
T25
T13T13 D17
D17
T55
T19T19
T55
D35
T65T69
C57
D46
C66
D52
V51
V49
V37
V62
D22
D38
V27V25T75
D48
C55
V14
D20
D35
C54
V43
D19
D17
D18
C67 C66
D35
C57
D47
V62
W33
V71
V65
22
D48
W45
W35
C64
W13 C57
W13
D22
D48
D22
W35
W35
D47
W45
C57
D47
5
D16
C64
La Porte City
Dunkerton
Janesville
Independence
Jesup
Quasqueton
Hazleton
Fairbank
Winthrop
Lam nt
Aurora
Rowley
Brandon
Stanley
Dike
Reinbeck
GrundyCenter
Conrad
Wellsburg
Stout
Holland
Beaman
Morrison
AllisonDumont
Greene
ShellRock
Aredale
ClarksvilleBristow
ParkersburgAplington New
Hartford
Waverly
Sumner
Denver
Tripoli
Frederika
Readlyn
Plainfield
Nashua
New Hampton
Lawler
Ionia
Alta Vista
Fredericksburg
Bassett
North Washington
± 0 105Miles
Map 3.5Bridge Inventory
City BoundaryMetropolitan Planning Organization Study Area
HighwaysCounty Roads
!( Bridges
Rivers
This map does not represent a survey, no liability is assumed forthe accuracy of the data delineated herein, either expressed or implied by INRCOG.© (August 2020) Please call 319-235-0311 to obtain permission for use.
Data Source: Iowa Department of Transportation Open
Data (2020)
2045 LONG-RANGE TRANSPORTATION PLAN | 51
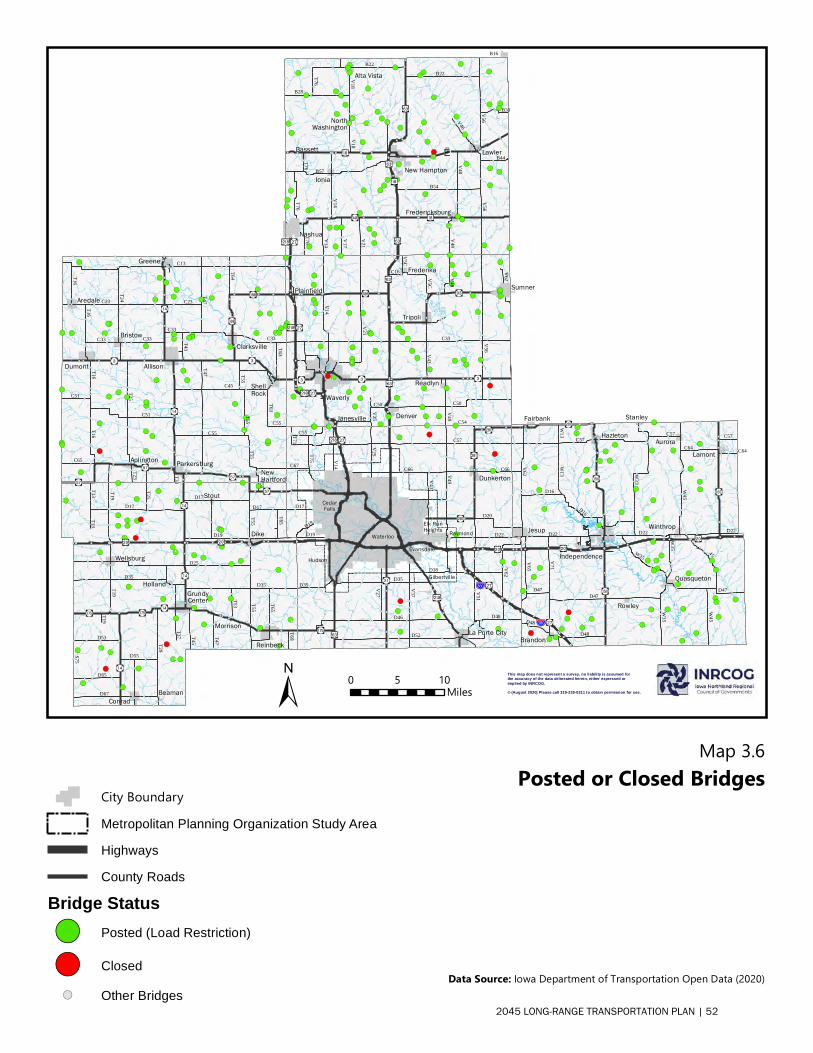
!(
!(
!(!(!(
!(
!(
!(
!(
!(
!(
!( !(!(
!( !(!(
!(!(
!( !(
!(
!(
!(
!(
!(
!(
!(
!(
!(
!(
!(
!(
!(
!( !( !(!(!(
!(!( !(!(!( !(!(
!(!(
!(!(
!(
!(
!(!(
!(
!(
!(
!(
!(!(!(!(
!(
!(
!(
!(
!(
!(
!( !(!( !(
!( !( !( !(!(!(
!(!( !(!( !(
!(!(
!(
!(
!(
!(!(!(!(
!(
!( !(!(
!( !(
!(
!(
!(!(
!(
!(!(
!(
!(
!(
!(
!(
!(
!( !(!(!(!(
!(!(!(
!(!(
!(
!(
!(
!(
!(
!(
!(
!(
!(
!(
!(
!(!(!(
!(!(!( !( !(
!(!(!(
!(
!(
!(
!(
!(!(!(
!(!(!(!( !( !(
!(!( !( !(!(!(!(!(
!(
!(
!(
!(
!(
!(
!(
!(
!(!( !(!(!(
!(
!(!(!(
!( !(
!(
!(
!(
!(!(
!(
!(
!(
!(
!(
!(
!(
!(
!(
!(
!(
!(
!(
!(
!(
!(
!(
!(
!(
!(
!(
!(
!( !( !( !( !(!( !(
!(!(
!(!(!(
!(
!(
!(
!(
!(
!(
!(
!(
!(
!(
!(
!(
!(
!(
!(
!(!(
!(
!(
!(
!(
!(
!(
!(
!( !( !(
!(!( !( !(
!(
!(
!( !(
!(
!(
!(!(
!(
!(
!(
!(
!(!(!( !(
!(!(!(!(
!(!(!(
!(
!(!( !(
!(
!(
!(
!(
!(
!(!(
!(!(!(
!(
!(!(
!( !(
!(
!(
!(
!(
!(
!(
!(
!(
!(
!(
!(
!(
!( !( !(
!(
!(
!(
!(
!(
!(
!(!(!(!(!(!( !(!(
!(
!(
!(
!(
!(
!(!(!(
!(!(
!(
!(!(!( !(!(
!( !(!(!( !(!(!(
!(
!(
!(
!(
!(
!(
!(
!(!(!(!( !(
!(
!(
!(
!(
!(
!(
!(
!(
!(
!(!(!(
!(!(
!( !(!(!(
!(
!(
!(
!(
!(
!(
!(
!(
!(
!(
!(
!(!(
!(
!(
!(
!(
!(
!(
!(
!(
!(
!(
!(
!(
!(
!(!(
!( !(
!(
!(
!(
!(!(
!(!(!(!(
!(!(
!(
!(
!(
!(
!(
!(
!(
!(
!(
!(
!(
!(
!(!(
!(
!(
!(
!(
!(
!(!(
!(
!(
!(
!(
!(
!(
!(
!(
!(
!( !(
!(
!(
!(
!(
!(
!(
!( !(
!(
!(
!(!(
!( !( !(!( !(
!(
!(
!(
!(
!(
!(
!(
!(!(
!( !(
!(!(!(!(!( !(!( !( !(!( !(!( !(!(
!(!( !(
!(!(!(
!(
!( !(
!(!(
!(
!( !( !( !( !(!( !( !( !(
!(
!(
!(
!(
!(
!(
!(
!(
!(
!(
!(
!(
!(
!(
!(
!(
!(
!(
!(
!(
!(
!(
!(
!(
!(
!( !(
!(
!(
!(
!(
!(
!(
!(
!(!( !(
!(!(
!(
!(
!(
!(
!(
!(
!(
!(
!(
!(
!(
!(
!(
!(
!(
!(
!(
!(
!(
!(
!(
!(
!(
!(!( !(
!( !(
!( !(!(!(!( !(
!(!(!(
!(
!(
!(
!(!(
!(
!(
!(
!(
!(
!(!(
!(
!(
!(
!(!( !( !(!(
!(!(
!(!(
!(
!(!(
!(
!(!(!(!(
!(
!(
!(
!(
!(
!(
!(
!(
!(
!(
!(
!(
!(
!(
!(
!(
!(
!(
!( !(
!(!(
!(
!(
!(
!( !(
!(
!(
!(
!(
!(
!(
!(
!(
!(
!(
!(
!(
!(
!(
!(
!(
!(
!(
!(
!(!( !(!(!(!(
!(!(!( !( !( !(
!(
!(!(
!(!( !(!(!(
!(!( !(!(!(!( !( !(!(!(
!(
!(
!(
!(
!(
!(
!(
!(
!(
!(
!(
!(
!(
!(
!(
!(
!(
!(
!(
!(
!(!(
!(
!(
!(
!(
!(
!(
!(
!(!(
!(!(
!(
!(
!(
!(
!(
!( !(!(
!( !(!(
!(
!(!(
!(!(
!(
!(
!(
!(
!(
!(!( !( !(!( !(
!(!( !( !(
!( !( !(!( !(
!(
!(
!(!( !(!(!(
!(
!(
!(
!(
!(
!(
!(
!(
!(
!(
!(
!(!( !( !(!(
!( !(!(
!(
!( !(!( !(!( !( !(!(
!(
!(
!(
!(
!( !(!(!(
!(!(
!(
!(
!(
!(
!(!(
!(
!(
!(
!(
!(
!(
!(
!(
!(
!(
!(
!(
!(
!(
!(
!(
!(
!(
!(
!(
!(
!(
!(
!(
!(
!(
!(
!(
!(
!(!(!(
!(
!(
!(
!(
!(
!(
!(
!(!(
!(!(
!( !(
!(
!( !(
!(
!(
!(
!(
!(
!(!(
!(
!(
!(!(
!(!(!( !(!(
!(
!(
!(
!(
!(
!(
!(
!(
!(
!( !(!(
!(
!(
!(
!(!(
!(
!(
!(!(!(!(
!(
!(
!(
!(
!(
!(
!(
!( !(
!(
!(
!(!(!(
!(!(
!(
!( !( !(
!(
!(
!( !(!(
!(
!(
!(
!(
!(!( !(
!(!(
!(
!(!(
!(
!(!(
!(
!( !(
!(
!(
!(
!(!(
!(!(
!( !(
!(!(!(
!(!(
!(
!(
!(
!(
!(
!(
!(
!(
!( !(!(
!(!(
!(
!(
!(
!(
!(
!(!(!(
!(
!( !(
!(!(!(
!(
!( !(
!(
!(
!(
!(
!(
!(
!( !(
!(!(
!(
!(
!(
!(!(
!(
!(
!( !(
!(!(
!(
!(
!(!(
!(!(
!(
!(
!(!(
!(
!(
!(
!(
!(
!(!(
!(
!(
!(!( !(
!(
!(
!(!(
!(
!(
!(
!(!(!(
!(!(
!(
!(
!(
!(
!(!(
!(!(
!(!(
!(
!(
!(
!(
!(
!(
!(
!(
!(
!(
!(
!(!( !(
!(!( !(
!(
!(
!(
!(
!( !(!(
!(
!(
!( !(!(
!(
!(
!(
!(
!(
!(
!(
!( !( !(
!(
!(
!(
!(
!(
!(
!(
!(
!(
!(
!(
!(!(
!(
!(
!(
!(
!(
!(
!(
!(
!(
!(!(
!(
!(
!(
!(
!(
!(
!(
!(!( !(!(!(
!(
!(
!(
!(
!(
!(
!(
!(
!(
!(
!(
!(
!(!( !(!(
!(
!(
!(
!(
!(
!(
!(!(
!(
!(
!(
!(
!(
!(
!(
!(
!(
!(
!(
!(
!(
!(
!(
!(!( !( !(!( !(!(!( !( !(
!(!(
!(
!(
!(
!(
!(
!(!(
!(
!(
!(
!(
!(
!(
!(
!(!(!(
!(
!(
!(
!( !(!(
!(!( !(!(
!(
!(
!(
!(
!(
!(
!(
!(
!(
!(
!(
!(
!(
!(
!(
!(
!(
!(
!(
!( !( !(
!( !( !( !(
!(
!(
!(!(
!(
!(
!(
!(
!(
!(!(
!(
!(
!(
!(
!(
!(
!(!(
!(!(!(!( !(!(!( !(
!(
!( !(
!(
!(
!(
!(
!(
!(
!(
!(
!(!(
!( !( !(!( !(
!(
!(
!(
!(
!(
!(
!(
!( !(!(!(
!( !(!( !( !(
!(
!(
!(
!(
!(
!(
!(
!(
!(
!(!(
!(
!(
!(
!(
!(!(
!(
!(
!(
!(
!( !(!(
!(
!(!( !(
!(!(!(
!(
!(
!(
!(
!(
!(!(
!(
!(
!(
!(
!(
!(
!(
!(
!(
!(
!(
!(
!(
!(
!(
!(
!(!(!( !( !( !(
!(
!(
!(
!(
!(
!(
!(!( !(!(
!(!(
!(
!(
!(
!(
!(
!(
!(
!(
!(
!(
!( !(
!(
!(
!(!(!(
!(
!(
!(
!(
!(
!(
!(
!(
!(
!(
!(
!(
!(
!(!(!(
!(!(
!(
!(
!( !(!(
!(!( !(
!(!(!(
!(
!( !(
!(
!(
!(
!(!( !(
!(
!(!( !(!(
!(
!(
!(
!(!(
!(
!(!(!(!( !(!( !(
!(
!( !(
!(
!(!(
!(
!(
!(
!(
!(
!(
!(
!(!(!(!(!(
!(!(
!(
!(
!(
!(
!(
!(
!(
!(
!(!( !( !(
!(
!(
!(
!(
!(
!(
!( !( !(
!(
!( !(
!(
!(
!(
!(
!(
!(
!(
!(
!(
!( !( !(
!(
!(
!(
!(
!(
!(
!(
!( !(
!(
!(
!(
!(
!(
!(
!(
!(
!(
!(
!( !(
!(
!(
!(
!(
!(
!(
!(
!(
!(
!(
!(
!( !(!(
!(
!(
!(
!(
!(
!(
!(
!(
!(
!(!(
!(
!(!(
!(
!(
!(
!(
!(
!(
!(
!(
!(
!(
!( !(
!( !( !(!(!(
!( !( !(!(
!(
!(
!(
!(!(
!( !( !(!(
!(!(
!(
!( !( !(
!( !( !(!(
!(
!( !(!( !( !(
!(
!( !(
!(
!(
!(
!(
!(!(!(!(!(!(!(!( !(
!(!(!(!(
!(!(
!(!(
!(!(!( !(
!(
!(
!(
!(
!(
!(
!(
!(
!(
!(
!(
!(
!(
!(
!(
!(
!(
!(
!(
!(
!(
!(
!(
!(
!(
!(
!(
!(
!(
!(
!(
!(
!(
!(
!(!(
!(
!(!(
!(
!(!(
!(!( !(
!(
!(
!(!(
!(
!(
!(
!(!(
!(
!(
!(
!(
!(
!(
?å
Ip Ip
?È
A¦
?È
?È
A¦?È
?å
I¡
I¡
IoAó
Io
A@72K»
QË
Io
I¡
?È
A«
?¿?¿
?È
?å?å
?å
A«
Az
AÙ
IpIp
Az
A@72%&g(
Aª
I¡?¿?¿?¿
A@72K»
A@72K»
A« ?ø
I¡
A@72K»
AÙ
Ip
I¡A¦
?Ì
K»
A@72%&g(
AÙ
AÙ
B57
V56
B28
V48
B54
V18
T76
V46
V21
V14
V17
B16
B22
V56
T76
V18
T76T76 V48
V14
B22
B33
B44
C33 V56
V21
V14
V43
V49V48
C50
V62
C16
V25
V5C
C50V5CC13
T47
C23
T25
C45
C51
C33
T24
C55
T55
T64
T16
T63
C65
T43T33
T63
T47
C33
T55T55
T16
C33
C51
C33
T16
C55
C23
T16
D25T55
D19
D35
T29
S75
D17
T19D67
T37
T65
D65
D53 T45
T47
D55
T53
T25
T13T13 D17
D17
T55
T19T19
T55
D35
T65T69
C57
D46
C66
D52
V51
V49
V37
V62
D22
D38
V27V25T75
D48
C55
V14
D20
D35
C54
V43
D19
D17
D18
C67 C66
D35
T71
T23
C57
D47
V62 W33
V71
V65
D22
D48
W45
W35
C64
W13 C57
W13
D22
D48
D22
W35
W35
D47
W45
C57
D47
45
D16
C64
D16
Waterloo
CedarFalls
HudsonEvansdale
La Porte City
Raymond
Dunkerton
Elk RunHeights
Janesville
Gilbertville
Independence
Jesup
Quasqueton
Hazleton
Fairbank
Winthrop
LamontAurora
Rowley
Brandon
Stanley
Dike
Reinbeck
GrundyCenter
Conrad
Wellsburg
Stout
Holland
Beaman
Morrison
AllisonDumont
Greene
ShellRock
Aredale
ClarksvilleBristow
ParkersburgAplingtonNewHartford
Waverly
Sumner
Denver
Tripoli
Frederika
Readlyn
Plainfield
Nashua
New Hampton
Lawler
Ionia
Alta Vista
Fredericksburg
Bassett
NorthWashington
K
± 0 105Miles
Map 3.6Posted or Closed Bridges
Data Source: Iowa Department of Transportation Open
Data (2020)
City BoundaryMetropolitan Planning Organization Study Area
Highways
County Roads
Bridge Status!( Posted (Load Restriction)
!( Closed
!( Other Bridges
This map does not represent a survey, no liability is assumed forthe accuracy of the data delineated herein, either expressed or implied by INRCOG.© (August 2020) Please call 319-235-0311 to obtain permission for use.
2045 LONG-RANGE TRANSPORTATION PLAN | 52
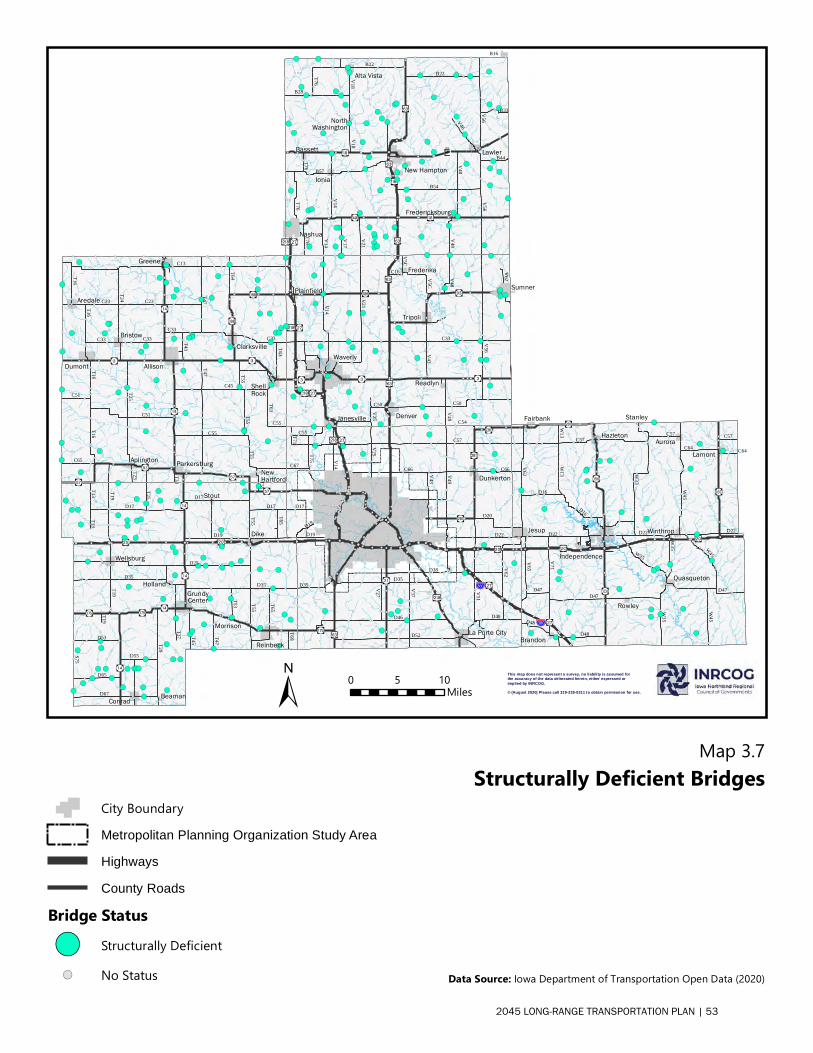
?å
Ip Ip
?È
A¦
?È
?È
A¦?È
?å
I¡
I¡
IoAó
Io
A@72K»
QË
Io
I¡
?È
A«
?¿?¿
?È
?å?å
?å
A«
Az
AÙ
IpIp
Az
A@72%&g(
Aª
I¡?¿?¿?¿
A@72K»
A@72K»
A« ?ø
I¡
A@72K»
AÙ
Ip
I¡A¦
?Ì
K»
A@72%&g(
AÙ
AÙ
!(
!(
!(
!(!(
!(
!(
!(
!(
!(
!(
!(!(!(
!( !(!(
!(!(
!( !(
!(
!(
!(
!(
!(
!(
!(
!(
!(
!(
!(
!(
!(
!( !(!(!(!(
!(!( !(!(!( !(!(
!(!(
!(
!(
!(
!(
!(!(
!(
!(
!(
!(
!(!(!(!(
!( !(
!(
!(
!(
!(
!(
!(
!(
!( !(!( !(
!( !( !( !(!(!(
!(!( !(!(!(
!(!(
!(
!(
!(
!(!(!(!(
!(!(
!(!(
!( !(
!(
!(
!(
!(!(
!(!(
!(
!(
!(
!(
!(
!(
!( !(!(!(!(
!(!(!(
!(!(
!(
!(
!(
!(
!(
!(
!(
!(
!(
!(
!(
!(!(!(
!(!(!( !( !(
!(!(!(
!(
!(
!(
!(
!(!(!(
!(!(!(!( !( !(
!(!( !( !(!(!(!(!(
!(
!(
!(
!(
!(
!(
!(
!(
!(!( !(!(!(
!(
!(!(!(
!( !(
!(
!(
!(
!(!(
!(
!(
!(
!(
!(
!(
!(
!(
!(
!(
!(
!(
!(
!(
!(
!(
!(
!(
!(
!(
!(
!(
!(
!(
!(
!( !( !( !( !(!( !(
!(
!(
!(!(!(
!(
!(
!(
!(
!(
!(
!(
!(
!(
!(
!(
!(
!(
!(
!(
!(!(
!(
!(
!(
!(
!(
!(
!(
!( !( !(
!(!( !( !(
!(
!(
!( !(
!(
!(
!(!(
!(
!(
!(
!(
!(!(
!(
!(
!(!(
!(
!(
!(
!(
!(!(!(!(
!(!(!(!(
!(!(
!(
!(!(
!(
!(!( !(
!(
!(
!(
!(
!(
!(
!(
!(!(!(
!(
!(!(
!( !(
!(
!(
!(
!(
!(
!(
!(
!(
!(
!(
!(
!(
!( !( !(
!(
!(
!(
!(
!(
!(
!(
!(!(!(!(!(!(!(
!(
!(
!(
!(
!(
!(
!(
!(
!(
!(
!(
!(
!(!(!( !(!(
!(
!(!(
!( !(!( !(!(!(!(
!(
!(
!(
!(
!(
!(
!(
!(!(!(!( !(
!(
!(
!(!(
!(
!(
!(
!(!(
!(
!(
!(
!(
!(
!(
!(
!(!(!(!(
!(!(
!(!(
!(
!( !(!(!(
!(
!(!(
!(
!(
!(
!(
!(
!(
!(
!(
!(
!(!(
!(
!(
!(
!(
!(
!(
!(
!(
!(
!(
!(
!(
!(
!(
!(!(
!(!( !(
!(!( !(!(
!(
!(!(
!(!(
!(!(!(!(
!(!(
!(
!(
!(
!(
!(
!(
!(
!(
!(
!(
!(
!(
!(
!(
!(
!(
!(
!(!(
!(
!(
!(
!(
!(
!(
!(!(
!(
!(
!(
!(
!(
!(
!(
!(
!(
!( !(
!(
!(
!(
!(!(!(
!(
!(!(
!(
!(
!(
!(
!(
!(
!(
!(
!( !(
!(
!(
!(!(
!( !( !(!( !(
!(
!(
!(
!(
!(
!(
!(
!(!(
!( !(
!(!(
!(!(
!( !(!( !( !(!( !(!( !(!(
!(!( !(
!(!(!(
!(
!( !(
!(!(
!(
!( !(!( !( !(
!( !( !( !(
!(
!(
!(
!(
!(
!(
!(
!(
!(
!(
!(
!(
!(
!(
!(
!(
!(
!(
!(
!(
!(
!(
!(
!(
!(
!(
!(
!(
!(
!(
!(
!(
!(
!(
!(
!(
!(
!(
!(
!(
!( !(!(
!(
!(
!(
!(
!(
!(
!(
!(
!(
!(
!(
!(
!(
!(
!(
!(
!(
!(
!(
!(
!(
!(
!(
!(
!(
!(!( !(
!( !(
!( !(
!(!(!( !(
!(!(!(
!(
!(
!(
!(!(
!(
!(
!(
!(
!(
!(
!(
!(
!(
!(
!(!( !( !(!(
!(!(
!(
!(
!(
!(!(
!(
!(!(!(!(
!(
!(
!(
!(
!(
!(
!(
!(
!(
!(
!(
!(
!(
!(
!(
!(
!(
!(
!( !(
!(!(
!(
!(
!(
!( !(
!(
!(
!(
!(
!(
!(
!(
!(
!(
!(
!(
!(
!(
!(
!(
!(
!(
!(
!(
!(
!(
!(
!(
!(
!(
!(
!(!( !(!(!(!(
!(!(!( !( !( !(
!(
!(
!(!(
!(
!(!( !(!(!(
!(!( !(!(!(!( !( !(!(!(
!(
!(
!(
!(
!(
!(
!(
!(
!(
!(
!(
!(
!(
!(
!(
!(
!(
!(
!(
!(
!(
!(
!(
!(
!(
!(
!(
!(
!(
!(
!(
!(
!(
!(
!(
!(!(
!(!(
!(
!(
!(
!(
!(
!(!( !(
!( !(!(
!(
!(!(
!(!(
!(
!(
!(
!(
!(
!(!( !( !(!( !(
!(!( !( !(
!( !( !(!(
!(
!(
!(
!(
!(
!( !(
!(!(
!(!( !(!(!(
!(!(!(
!(
!(
!(
!(!(
!(
!(
!(
!(
!(
!(
!(
!(
!(!( !( !(!(
!( !(!(
!(
!( !(!( !(!( !( !(!(
!(
!(!(
!(
!(
!(
!(
!(
!(
!(
!(
!(!(
!(
!( !(!(!(
!(
!(
!(!(
!(
!(
!(
!(
!(
!(!(
!(
!(!(
!(
!(
!(
!(
!(
!(
!(
!(
!(
!(
!(
!(
!(
!(
!(
!(
!(
!(!(
!(
!(
!(
!(
!(
!(
!(
!(
!(
!(
!(
!(!(
!(!(!(
!(
!(
!(
!(
!(
!(
!(
!(
!(
!(
!(
!(
!(!(
!(!(
!( !(
!(
!( !(
!(
!(
!(
!(
!(
!(!(
!(
!(
!(!(
!(!(
!(!( !(!(
!(
!(
!(
!(
!(
!(
!(
!(
!(
!(
!(
!(
!( !(!(
!(
!(
!(
!(!(
!(
!(
!(!(!(!(
!(
!(
!(
!(
!(
!(
!(
!( !(
!(
!(
!(
!(
!(!(
!(
!( !( !( !(
!(
!(
!( !(!(
!(
!(
!(
!(
!(!( !(
!(!(
!(
!(!(
!(
!(
!(
!(!(
!(
!( !(
!(
!(!(
!(
!(
!(!(
!(!(
!(
!( !(
!(!(!(
!(!(!(
!(
!(
!(
!(!(
!(
!(
!(
!(
!(
!(
!(
!( !(!(
!(!(
!(
!(
!(
!(
!(
!(!(!(
!(
!( !(
!(
!(
!(
!(
!( !(
!(
!(
!(
!(
!(
!(
!(
!(
!(
!(
!(!( !(
!(
!(
!(
!(
!(
!(
!(
!(!(
!(!(
!(
!(
!(!(
!(
!(
!(
!(
!(!(
!(!(
!(
!(
!(
!(
!(!(
!(
!(
!(
!(
!(
!(!(
!(
!(
!(!(!(
!(!(
!(!(
!(
!( !(
!(
!(
!(!(
!(
!(!(
!(
!(
!(
!(
!(!(
!(!(
!(
!(
!(
!(
!(
!(!(
!(!(
!(!(
!(
!(
!(
!(
!(
!(
!(
!(
!(
!(
!(
!(!( !(
!(!( !(
!(
!(
!(!(
!(
!(
!( !(!(
!(
!(
!( !(!(
!(
!(
!(
!(
!(
!(
!(
!(
!( !( !(
!(
!(
!(
!(
!(
!(
!(
!(
!(
!(
!(
!(
!(!(
!(
!(
!(
!(
!(
!(
!(
!(
!(
!(!(
!(
!(
!(
!(
!(
!(
!(
!(
!(
!(!( !(!(!(
!(
!(
!(
!(
!(
!(
!(
!(
!(
!(
!(
!(
!(
!(!( !(!(
!(!( !(!( !( !(
!(
!(
!(!( !(!(
!(
!(
!(!(
!(
!(
!(
!(
!(
!(
!(
!(
!(
!(
!(
!(
!(
!(
!(
!(
!(!( !( !(!( !(!(!( !( !(
!(!(
!(
!(
!(
!(
!(
!(
!(!(
!(
!(
!(
!(
!(
!(
!(
!(
!(
!(
!(
!(
!(
!(
!(
!(
!(
!(
!(
!(
!(
!(
!(
!(
!(
!(!(!(
!(
!(
!(
!( !(!(
!(!( !(!( !(
!(
!(
!(
!(
!(
!(
!(
!(
!(
!(
!(
!(
!(
!(
!(
!(
!(
!(
!(
!(
!(
!(
!(
!( !( !(
!( !( !( !(
!(
!(
!(!(
!(
!(
!(
!(
!(
!(
!(
!(
!(
!(
!(
!(
!(
!(!(
!(!(!( !( !(!(!(
!(
!(
!( !(
!(
!(
!(
!(
!(
!(
!(
!(
!(!(
!( !( !(!( !(
!(
!(
!(
!(
!(
!(
!(
!( !(!(!(
!( !(!( !( !(
!(
!(
!(
!(
!(
!(
!(
!(
!(
!(!(
!(
!(
!(
!(
!(!(
!(
!(!(
!(
!(
!(
!( !(!(
!(
!(!( !(
!(!(!(
!(
!(
!(
!(!(
!(
!(
!(
!(
!(
!(
!(!(
!(
!(
!(
!(
!(
!(
!(
!(
!(
!(
!( !(
!(
!(
!(
!(
!(
!(
!(
!(
!(
!(
!(
!(
!(
!(!(!( !( !( !(
!(!(
!(
!(
!(
!(
!(
!(
!(
!(
!(
!(!( !(!(
!(!(
!(
!(
!(
!(
!(
!(
!(
!(
!(
!(
!( !(
!(
!(
!(
!(!(!(
!(
!(
!(
!(
!(
!(
!(
!(
!(
!(
!(
!(
!(
!(!(!(
!(!(
!(
!(
!( !(!(
!(!( !(
!(!(!(
!(
!( !(
!(
!(
!(
!(!(!(
!(
!( !( !( !(!(
!(
!(
!(
!(!(
!(
!(!(!(!(
!(!( !(
!(
!( !(
!(
!(!(
!(
!(
!(
!(
!(
!(
!(
!(!(!(!(!(
!(!(
!(
!(
!(
!(
!(
!(
!(
!(
!(!( !( !(
!(
!(
!(
!(
!(!(
!(
!(
!(
!(
!(
!(!(
!(
!(
!(!(!( !(!(
!(
!(
!(
!(
!(
!( !( !(
!(
!( !(
!(
!(
!(
!(
!(
!(
!(
!(
!(
!( !( !(
!(
!(
!(
!(
!(
!(
!(
!(
!( !(
!(
!(
!(
!(
!(
!(
!(
!(
!(
!(
!(
!(
!(
!( !(
!(
!(
!(
!(
!(
!(
!(
!( !(
!(
!(
!( !(!(
!(
!(
!(
!(
!(
!(
!(
!(
!(
!(
!(
!(
!(
!(
!(
!(
!(
!(!(
!(
!(
!(
!(
!(
!(
!(
!(
!(
!(
!(
!(
!(
!(
!( !(
!( !( !(!(!(
!( !( !(!(
!(!(
!(
!(
!(
!(
!(
!(
!(
!(
!(
!(!(
!( !( !(!(
!( !(
!(!(
!( !( !(
!( !( !(!(
!(
!( !(!( !( !(
!(
!( !(
!(
!(
!(
!(
!(
!(!(!(!(!(!(!( !(!(!(!(!(
!(
!(
!(!(!( !(
!(
!(
!(
!(
!(
!(
!(
!(
!(
!(
!(
!(
!(
!(
!(
!(
!(
!(
!(
!(
!(
!(
!(
!(
!(
!(
!(
!(
!(
!(
!(
!(
!(
!(
!(!(
!(
!(
!(
!(
!(
!(
!(!(
!(
!(
!(
!(!(
!(!(!(
!(!(
!(
!(!(
!(!( !(
!(
!(
!(!(
!(!(
!(
!(!(
!(
!(
!(
!(
!(
!(
!(
!(
!(
!(
!( !(
!(
!(
!(
!(
!(
!(!(
!(
!(
!(
!(!( !(
!( !(
!(
!(
!(
!(!(
!(
!(
!(
!(
!( !(
!(!(
!( !(!(
!(
!(!(
!(
!(
!(
!(
!(
!(
!(
!(
!(
!( !(
!(
!(
!(
!(
!(
!(
!(
!(
!(
!(!(
!(
!(
!(
!(
!(
!(
!(!( !(
!(
!(!(
!(
!(
!(!(
!(
!(
!(
!(
!(
!(
!( !(
!(
!(
!(!(!(!(
!(
!(
!( !(
!(
!(
!(
!(
!(
!(
!(
!(
!(
!(
!(
!(
!( !(
!(
!(!(
!(
!(
!(
!(
!(
!(
!(
!(
!(
!(
!(!(
!(
!(
!(
!(
!(!(
!(
!(
!(
!(
!(
!(
!(
!(
!( !(
!( !(!(
!(!(
!(
!( !(!(
!(!(
!(
!(
!(
!(
!(
!(!(
!(
!(
!(
!(
!(
!(
!(
!(
!(
!(
!(!(
!(
!(
!(!(
!(
!(
!(
!(
!(
!(!( !(
!(
!(
!(
!(
!(!(
!(
!(
!(
!( !(!(
!(
!(
!(
!(
!(
!(
!(
!(
!(
!(
!(
!(
!(
!(
!(
!( !(
!( !(!( !( !(
!(
!(
!(!(
!(
!(!(
!(
!(!( !(
!(
!(
!(
!(
!(
!(
!(!(
!( !(
!(
!(
!(
!(
!(
!(!(
!(
!(!(
!(
!(
!(
!(
!(
!(
!(
!(
!(
!(
!(
!(!(
!(
!(
!(
!(
!(
!(!(
!(!(!( !(
!(
!(
!(
!(
!(
!(
!(
!(
!(
!(
!(
B57
V56
B28
V48
B54
V18
T76
V46
V21
V14
V17
B16
B22
V56
T76
V18
T76T76 V48
V14
B22
B33
B44
C33 V56
V21V14
V43
V49V48
C50
V62
C16
V25
V5C
C50V5CC13
T47
C23
T25
C45
C51
C33
T24
C55
T55
T64
T16
T63
C65
T43T33
T63
T47
C33
T55T55
T16
C33
C51
C33
T16
C55
C23
T16
D25T55
D19
D35
T29
S75
D17
T19D67
T37
T65
D65
D53 T45
T47
D55
T53
T25
T13T13 D17
D17
T55
T19T19
T55
D35
T65T69
C57
D46
C66
D52
V51
V49
V37
V62
D22
D38
V27V25T75
D48
C55
V14
D20
D35
C54
V43
D19
D17
D18
C67 C66
D35
T71
T23
C57
D47
V62 W33
V71
V65
D22
D48
W45
W35
C64
W13 C57
W13
D22
D48
D22
W35
W35
D47
W45
C57
D47
W45
D16
C64
D16
La Porte City
Dunkerton
Janesville
Independence
Jesup
Quasqueton
Hazleton
Fairbank
Winthrop
LamontAurora
Rowley
Brandon
Stanley
Dike
Reinbeck
GrundyCenter
Conrad
Wellsburg
Stout
Holland
Beaman
Morrison
AllisonDumont
Greene
ShellRock
Aredale
ClarksvilleBristow
ParkersburgAplingtonNewHartford
Waverly
Sumner
Denver
Tripoli
Frederika
Readlyn
Plainfield
Nashua
New Hampton
Lawler
Ionia
Alta Vista
Fredericksburg
Bassett
NorthWashington
± 0 105Miles
Map 3.7Structurally Deficient Bridges
Data Source: Iowa Department of Transportation Open Data (2020)
City BoundaryMetropolitan Planning Organization Study Area
Highways
County Roads
Bridge Status!( Structurally Deficient!( No Status
This map does not represent a survey, no liability is assumed forthe accuracy of the data delineated herein, either expressed or implied by INRCOG.© (August 2020) Please call 319-235-0311 to obtain permission for use.
2045 LONG-RANGE TRANSPORTATION PLAN | 53
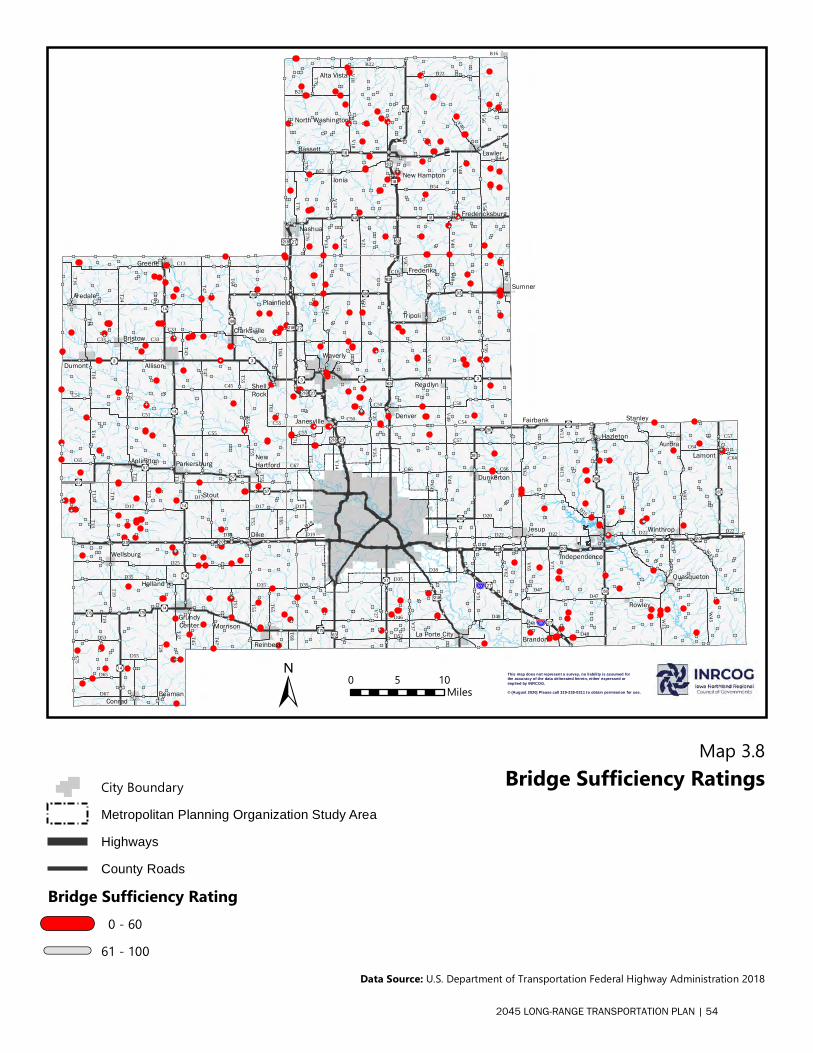
?å
Ip Ip
?È
A¦
?È
?È
A¦?È
?å
I¡
I¡
IoAó
Io
A@72K»
QË
Io
I¡
?È
A«
?¿?¿
?È
?å?å
?å
A«
Az
AÙ
IpIp
Az
A@72%&g(
Aª
I¡?¿?¿?¿
A@72K»
A@72K»
A« ?ø
I¡
A@72K»
AÙ
Ip
I¡A¦
?Ì
K»
A@72%&g(
AÙ
AÙ
B57
V56
B28
V48
B54
V18
T76
V46
V21
V14
V17
B16
B22
V56
T76
V18
T76T76 V48
V14
B22
B44
B33
C50
C33 V56
V21V14
V43
V49V48
C50
V62
C16
V25
V5C
C50V5CC13
T47
C23
T25
C45
C51
C33
T24
C55
T55
T64
T16
T63
C65
T43T33
T63
T47
C33
T55T55
T16
C33
C51
C33
T16
C55
C23
T16
T23
D25T55
D19
D35
T29
S75
D17
T19D67
T37
T65
D65
D53 T45
T47
D55
T53
T25
T13T13 D17
D17
T55
T19T19
T55
D35
T65T69
C57
D46
C66
D52
V51
V49
V37
V62
D22
D38
V27V25T75
D48
C55
V14
D20
D35
C54
V43
D19
D17
D18
C67 C66
D35
T71 C57
D47
V62 W33
V71
V65
D22
D48
W45W
35
C64
W13 C57
W13
D22
D48
D22
W35
W35
D47
W45
C57
D47
W45
D16
C64
La Porte City
Dunkerton
Janesville
Independence
Jesup
Quasqueton
Hazleton
Fairbank
Winthrop
LamontAurora
Rowley
Brandon
Stanley
Dike
Reinbeck
GrundyCenter
Conrad
Wellsburg
Stout
Holland
Beaman
Morrison
AllisonDumont
Greene
ShellRock
Aredale
ClarksvilleBristow
ParkersburgAplington NewHartford
Waverly
Sumner
Denver
Tripoli
Frederika
Readlyn
Plainfield
Nashua
New Hampton
Lawler
Ionia
Alta Vista
Fredericksburg
Bassett
North Washington
± 0 105Miles
Map 3.8Bridge Sufficiency Ratings
Data Source: U.S. Department of Transportation Federal Highway Administration 2018
City BoundaryMetropolitan Planning Organization Study Area
Highways
County Roads
Bridge Sufficiency Rating 0 - 6061 - 100
This map does not represent a survey, no liability is assumed forthe accuracy of the data delineated herein, either expressed or implied by INRCOG.© (August 2020) Please call 319-235-0311 to obtain permission for use.
2045 LONG-RANGE TRANSPORTATION PLAN | 54
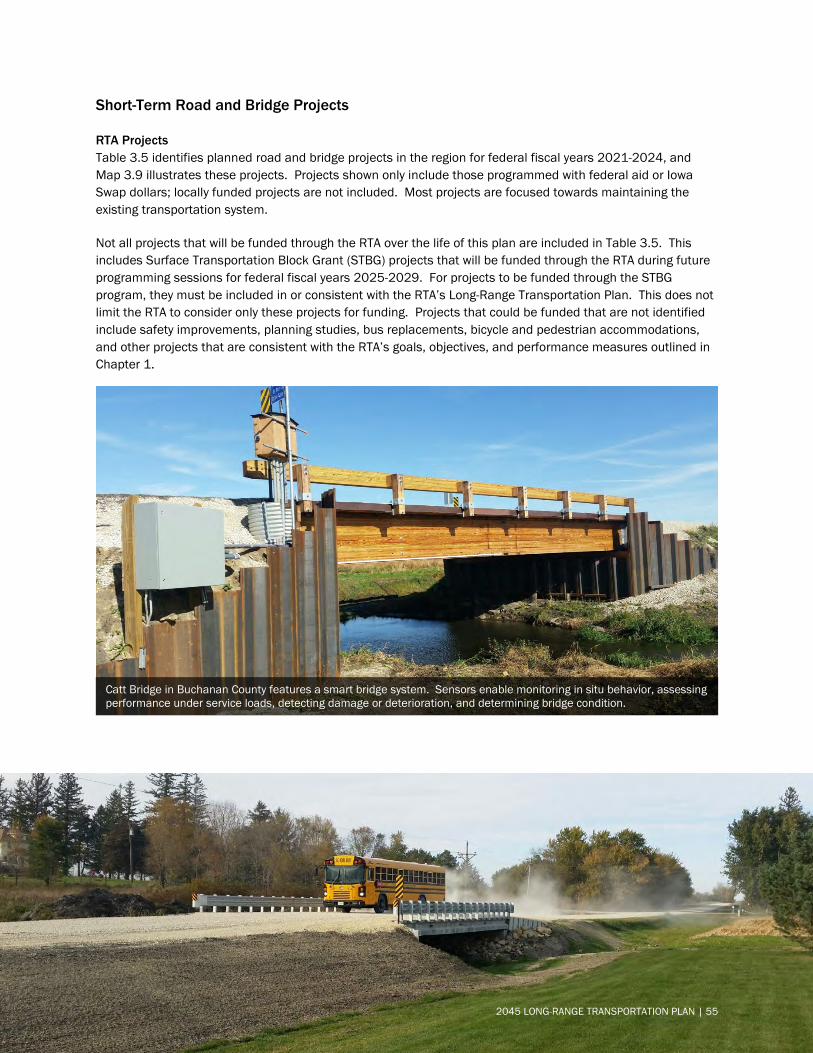
Short-Term Road and Bridge Projects
RTA Projects Table 3.5 identifies planned road and bridge projects in the region for federal fiscal years 2021-2024, and Map 3.9 illustrates these projects. Projects shown only include those programmed with federal aid or Iowa Swap dollars; locally funded projects are not included. Most projects are focused towards maintaining the existing transportation system.
Not all projects that will be funded through the RTA over the life of this plan are included in Table 3.5. This includes Surface Transportation Block Grant (STBG) projects that will be funded through the RTA during future programming sessions for federal fiscal years 2025-2029. For projects to be funded through the STBG program, they must be included in or consistent with the RTA’s Long-Range Transportation Plan. This does not limit the RTA to consider only these projects for funding. Projects that could be funded that are not identified include safety improvements, planning studies, bus replacements, bicycle and pedestrian accommodations, and other projects that are consistent with the RTA’s goals, objectives, and performance measures outlined in Chapter 1.
Catt Bridge in Buchanan County features a smart bridge system. Sensors enable monitoring in situ behavior, assessing performance under service loads, detecting damage or deterioration, and determining bridge condition.
2045 LONG-RANGE TRANSPORTATION PLAN | 55
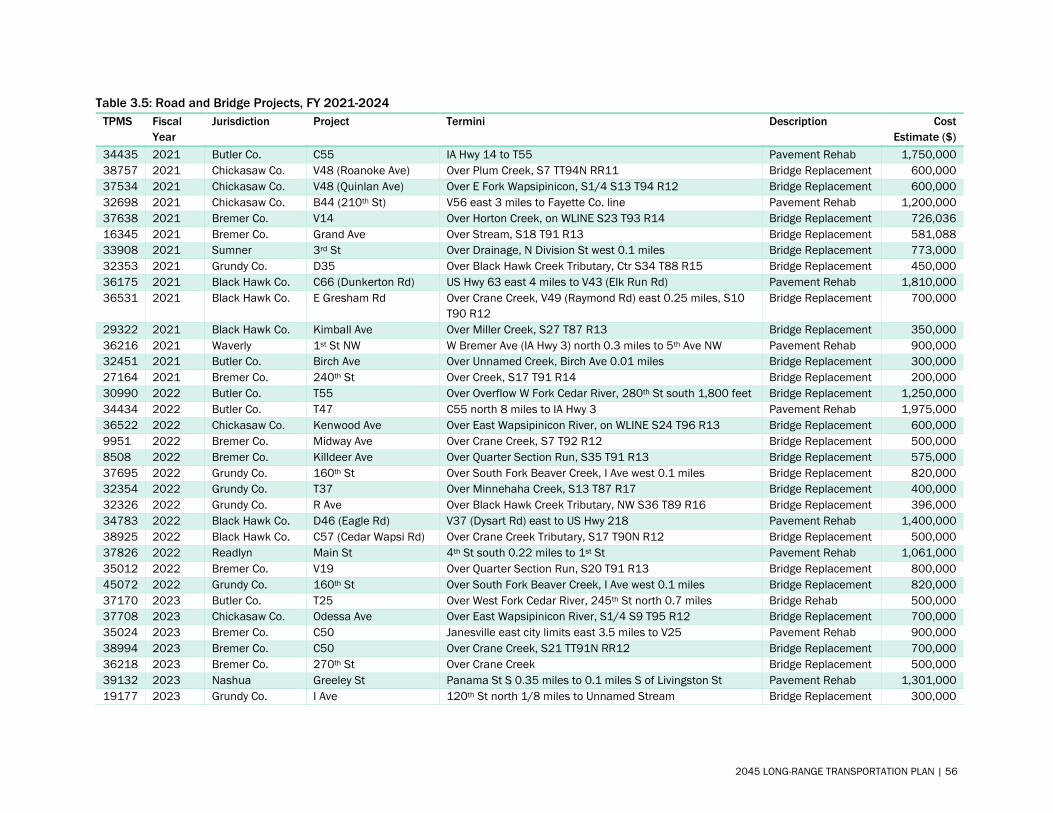
Table 3.5: Road and Bridge Projects, FY 2021-2024 TPMS Fiscal
Year Jurisdiction Project Termini Description Cost
Estimate ($) 34435 2021 Butler Co. C55 IA Hwy 14 to T55 Pavement Rehab 1,750,000 38757 2021 Chickasaw Co. V48 (Roanoke Ave) Over Plum Creek, S7 TT94N RR11 Bridge Replacement 600,000 37534 2021 Chickasaw Co. V48 (Quinlan Ave) Over E Fork Wapsipinicon, S1/4 S13 T94 R12 Bridge Replacement 600,000 32698 2021 Chickasaw Co. B44 (210th St) V56 east 3 miles to Fayette Co. line Pavement Rehab 1,200,000 37638 2021 Bremer Co. V14 Over Horton Creek, on WLINE S23 T93 R14 Bridge Replacement 726,036 16345 2021 Bremer Co. Grand Ave Over Stream, S18 T91 R13 Bridge Replacement 581,088 33908 2021 Sumner 3rd St Over Drainage, N Division St west 0.1 miles Bridge Replacement 773,000 32353 2021 Grundy Co. D35 Over Black Hawk Creek Tributary, Ctr S34 T88 R15 Bridge Replacement 450,000 36175 2021 Black Hawk Co. C66 (Dunkerton Rd) US Hwy 63 east 4 miles to V43 (Elk Run Rd) Pavement Rehab 1,810,000 36531 2021 Black Hawk Co. E Gresham Rd Over Crane Creek, V49 (Raymond Rd) east 0.25 miles, S10
T90 R12 Bridge Replacement 700,000
29322 2021 Black Hawk Co. Kimball Ave Over Miller Creek, S27 T87 R13 Bridge Replacement 350,000 36216 2021 Waverly 1st St NW W Bremer Ave (IA Hwy 3) north 0.3 miles to 5th Ave NW Pavement Rehab 900,000 32451 2021 Butler Co. Birch Ave Over Unnamed Creek, Birch Ave 0.01 miles Bridge Replacement 300,000 27164 2021 Bremer Co. 240th St Over Creek, S17 T91 R14 Bridge Replacement 200,000 30990 2022 Butler Co. T55 Over Overflow W Fork Cedar River, 280th St south 1,800 feet Bridge Replacement 1,250,000 34434 2022 Butler Co. T47 C55 north 8 miles to IA Hwy 3 Pavement Rehab 1,975,000 36522 2022 Chickasaw Co. Kenwood Ave Over East Wapsipinicon River, on WLINE S24 T96 R13 Bridge Replacement 600,000 9951 2022 Bremer Co. Midway Ave Over Crane Creek, S7 T92 R12 Bridge Replacement 500,000 8508 2022 Bremer Co. Killdeer Ave Over Quarter Section Run, S35 T91 R13 Bridge Replacement 575,000 37695 2022 Grundy Co. 160th St Over South Fork Beaver Creek, I Ave west 0.1 miles Bridge Replacement 820,000 32354 2022 Grundy Co. T37 Over Minnehaha Creek, S13 T87 R17 Bridge Replacement 400,000 32326 2022 Grundy Co. R Ave Over Black Hawk Creek Tributary, NW S36 T89 R16 Bridge Replacement 396,000 34783 2022 Black Hawk Co. D46 (Eagle Rd) V37 (Dysart Rd) east to US Hwy 218 Pavement Rehab 1,400,000 38925 2022 Black Hawk Co. C57 (Cedar Wapsi Rd) Over Crane Creek Tributary, S17 T90N R12 Bridge Replacement 500,000 37826 2022 Readlyn Main St 4th St south 0.22 miles to 1st St Pavement Rehab 1,061,000 35012 2022 Bremer Co. V19 Over Quarter Section Run, S20 T91 R13 Bridge Replacement 800,000 45072 2022 Grundy Co. 160th St Over South Fork Beaver Creek, I Ave west 0.1 miles Bridge Replacement 820,000 37170 2023 Butler Co. T25 Over West Fork Cedar River, 245th St north 0.7 miles Bridge Rehab 500,000 37708 2023 Chickasaw Co. Odessa Ave Over East Wapsipinicon River, S1/4 S9 T95 R12 Bridge Replacement 700,000 35024 2023 Bremer Co. C50 Janesville east city limits east 3.5 miles to V25 Pavement Rehab 900,000 38994 2023 Bremer Co. C50 Over Crane Creek, S21 TT91N RR12 Bridge Replacement 700,000 36218 2023 Bremer Co. 270th St Over Crane Creek Bridge Replacement 500,000 39132 2023 Nashua Greeley St Panama St S 0.35 miles to 0.1 miles S of Livingston St Pavement Rehab 1,301,000 19177 2023 Grundy Co. I Ave 120th St north 1/8 miles to Unnamed Stream Bridge Replacement 300,000
2045 LONG-RANGE TRANSPORTATION PLAN | 56

TPMS Fiscal Year
Jurisdiction Project Termini Description Cost Estimate ($)
34854 2023 Grundy Co. 225th St Over Branch Black Hawk Creek, L Ave west 0.4 miles Bridge Replacement 554,000 37697 2023 Grundy Co. 120th St Over Middle Fork Beaver Creek, S18 T89 R18 Bridge Replacement 262,000 37463 2023 Black Hawk Co. D46 (Eagle Rd) Over Miller Creek, NLINE S24 T87 R13 Bridge Replacement 525,000 39131 2023 Janesville 7th St Over Cedar River, Main St west 0.1 miles Bridge Replacement 5,700,000 37709 2023 Chickasaw Co. 180th St Over Crane Creek River, S32 T96 R11 Bridge Replacement 600,000 37171 2023 Butler Co. Cedar Ave Over Beaver Creek, 335th St north 0.6 miles Bridge Replacement 400,000 40191 2023 Butler Co. Jay Ave Over Small Stream, S21 T91 R17 Bridge Replacement 380,000 34855 2023 Grundy Co. D67 IA Hwy 14 west 5 miles to county line Pavement Rehab 1,925,000 37703 2024 Grundy Co. 160th St Over South Fork Beaver Creek, H Ave east 0.3 miles Bridge Replacement 720,000 36650 2024 Grundy Co. T Ave Over Branch Black Hawk Creek, S18 T88 R15 Bridge Replacement 507,000 37121 2024 Buchanan Co. 150th St Over Otter Creek, Indiana Ave west 0.1 miles Bridge Replacement 990,000 38995 2024 Bremer Co. V48 Over Stream, S24 TT93N RR12W Bridge Replacement 500,000 36494 2024 Chickasaw Co. V18 US Hwy 18 north 8.5 miles to Alta Vista south city limits Pavement Rehab 3,300,000 38950 2024 Chickasaw Co. B28 (140th St) Over Little Wapsipinicon River, SLINE S6 T96N R13W Bridge Replacement 1,400,000 38951 2024 Chickasaw Co. York Ave Over Small Stream, on WLINE S31 T94N R10W Bridge Replacement 250,000 44898 2024 Black Hawk Co. D38 (Poyner Rd) Over Indian Creek, S25 T88 R12 Bridge Replacement 600,000 37127 2024 Buchanan Co. D48 Over Lime Creek, Brandon city limits east 0.25 miles Bridge Replacement 1,525,000 40124 2024 Buchanan Co. W35 D22 to Quasqueton city limits Pavement Rehab 3,150,000
2045 LONG-RANGE TRANSPORTATION PLAN | 57

B57
V56
B28
V48
B54
V18
T76
V46
V21
V14
V17
B16
B22
V56
T76
V18
T76T76
V48
V14
B22
B33
B44
T71
C33 V56
V21
V14
V43
V49V48
C50
V62
C16
V25
V5C
C50V5C
C50
C13
T47
C23
T25
C45
C51
C33
T24
C55
T55
T64
T16
T63
C65
T43T33
T63
T47
C33
T55T55
T16
C33
C51
C33
T16
C55
C23
T16
T23
D25T55
D19
D35
T29
S75
D17
T19D67
T37
T65
D65
D53 T45
T47
D55
T53
T25
T13T13 D17
D17
T55
T19T19
T55
D35
T65T69
C57
D46
C66
D52
V51
V49
V37
V62
D22
D38
V27V25T75
D48
C55
V14
D20
D35
C54
V43
D19
D17
D18
C67 C66
D35
C57
D47
V62
W33
V71
V65
D22
D48
W45W
35
C64
W13 C57
W13
D22
D48
D22
W35
W35
D47
W45
C57
D47
W45
D16
C64
La Porte City
Dunkerton
Janesville
Independence
Jesup
Quasqueton
Hazleton
Fairbank
Winthrop
Lamont
Aurora
Rowley
Brandon
Stanley
Dike
Reinbeck
GrundyCenter
Conrad
Wellsburg
Stout
Holland
Beaman
Morrison
AllisonDumont
Greene
ShellRock
Aredale
ClarksvilleBristow
ParkersburgAplingtonNewHartford
Waverly
Sumner
Denver
Tripoli
Frederika
Readlyn
Plainfield
Nashua
NewHampton
Lawler
Ionia
AltaVista
Fredericksburg
Bassett
NorthWashington
BUTLER
GRUNDY
BREMER
BUCHANAN
BLACK HAWK
CHICKASAW
0 105Miles
Map 3.9City BoundaryMetropolitan Planning Organization Study AreaMajor Rivers
Road and Bridge Projects FY 2021-2024
This map does not represent a survey, no liability is assumed forthe accuracy of the data delineated herein, either expressed or implied by INRCOG.
© (August 2020) Please call 319-235-0311 to obtain permission for use.
Project YearFY 2021FY 2022FY 2023
FY 20242045 LONG-RANGE TRANSPORTATION PLAN | 58
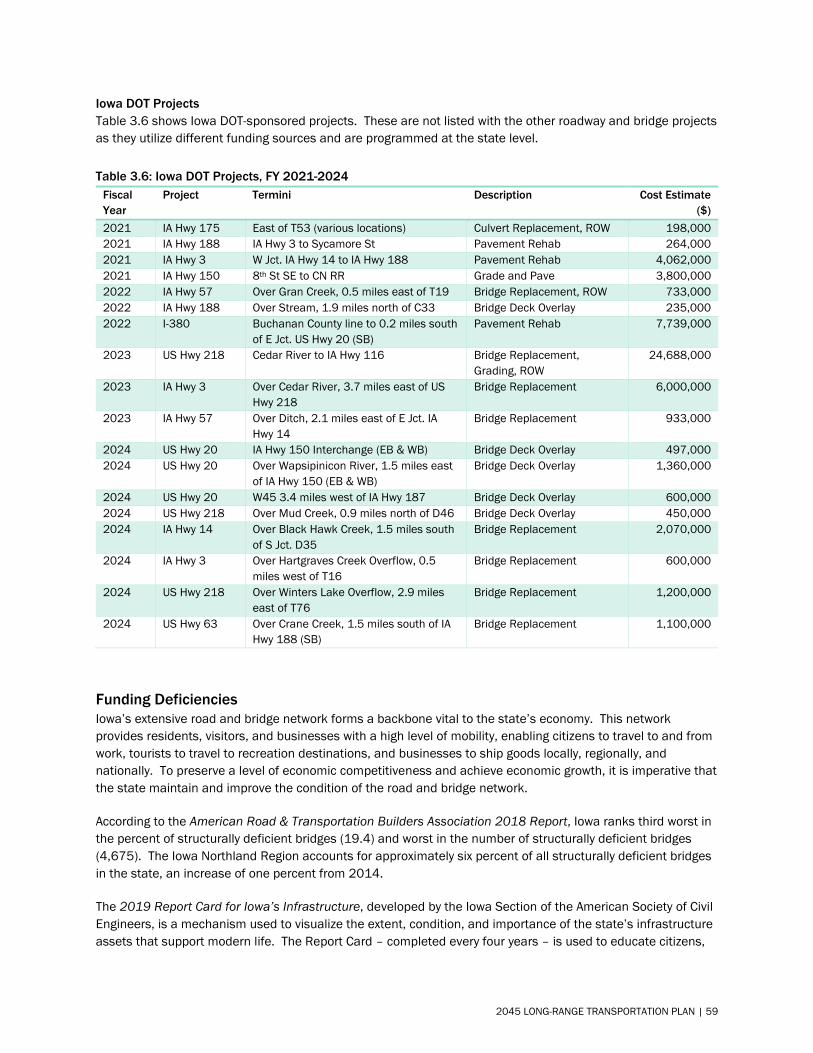
Iowa DOT Projects Table 3.6 shows Iowa DOT-sponsored projects. These are not listed with the other roadway and bridge projects as they utilize different funding sources and are programmed at the state level.
Table 3.6: Iowa DOT Projects, FY 2021-2024 Fiscal Year
Project Termini Description Cost Estimate ($)
2021 IA Hwy 175 East of T53 (various locations) Culvert Replacement, ROW 198,000 2021 IA Hwy 188 IA Hwy 3 to Sycamore St Pavement Rehab 264,000 2021 IA Hwy 3 W Jct. IA Hwy 14 to IA Hwy 188 Pavement Rehab 4,062,000 2021 IA Hwy 150 8th St SE to CN RR Grade and Pave 3,800,000 2022 IA Hwy 57 Over Gran Creek, 0.5 miles east of T19 Bridge Replacement, ROW 733,000 2022 IA Hwy 188 Over Stream, 1.9 miles north of C33 Bridge Deck Overlay 235,000 2022 I-380 Buchanan County line to 0.2 miles south
of E Jct. US Hwy 20 (SB) Pavement Rehab 7,739,000
2023 US Hwy 218 Cedar River to IA Hwy 116 Bridge Replacement, Grading, ROW
24,688,000
2023 IA Hwy 3 Over Cedar River, 3.7 miles east of US Hwy 218
Bridge Replacement 6,000,000
2023 IA Hwy 57 Over Ditch, 2.1 miles east of E Jct. IA Hwy 14
Bridge Replacement 933,000
2024 US Hwy 20 IA Hwy 150 Interchange (EB & WB) Bridge Deck Overlay 497,000 2024 US Hwy 20 Over Wapsipinicon River, 1.5 miles east
of IA Hwy 150 (EB & WB) Bridge Deck Overlay 1,360,000
2024 US Hwy 20 W45 3.4 miles west of IA Hwy 187 Bridge Deck Overlay 600,000 2024 US Hwy 218 Over Mud Creek, 0.9 miles north of D46 Bridge Deck Overlay 450,000 2024 IA Hwy 14 Over Black Hawk Creek, 1.5 miles south
of S Jct. D35 Bridge Replacement 2,070,000
2024 IA Hwy 3 Over Hartgraves Creek Overflow, 0.5 miles west of T16
Bridge Replacement 600,000
2024 US Hwy 218 Over Winters Lake Overflow, 2.9 miles east of T76
Bridge Replacement 1,200,000
2024 US Hwy 63 Over Crane Creek, 1.5 miles south of IA Hwy 188 (SB)
Bridge Replacement 1,100,000
Funding Deficiencies Iowa’s extensive road and bridge network forms a backbone vital to the state’s economy. This network provides residents, visitors, and businesses with a high level of mobility, enabling citizens to travel to and from work, tourists to travel to recreation destinations, and businesses to ship goods locally, regionally, and nationally. To preserve a level of economic competitiveness and achieve economic growth, it is imperative that the state maintain and improve the condition of the road and bridge network.
According to the American Road & Transportation Builders Association 2018 Report, Iowa ranks third worst in the percent of structurally deficient bridges (19.4) and worst in the number of structurally deficient bridges (4,675). The Iowa Northland Region accounts for approximately six percent of all structurally deficient bridges in the state, an increase of one percent from 2014.
The 2019 Report Card for Iowa’s Infrastructure, developed by the Iowa Section of the American Society of Civil Engineers, is a mechanism used to visualize the extent, condition, and importance of the state’s infrastructure assets that support modern life. The Report Card – completed every four years – is used to educate citizens,
2045 LONG-RANGE TRANSPORTATION PLAN | 59
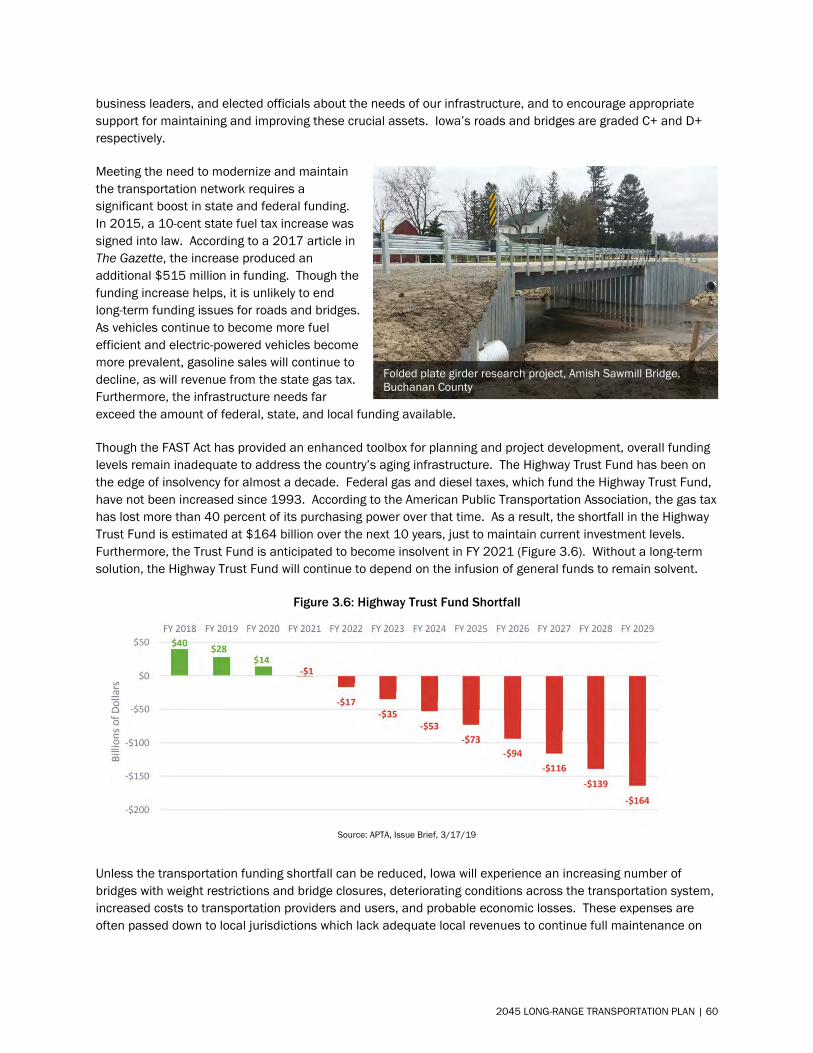
business leaders, and elected officials about the needs of our infrastructure, and to encourage appropriate support for maintaining and improving these crucial assets. Iowa’s roads and bridges are graded C+ and D+ respectively.
Meeting the need to modernize and maintain the transportation network requires a significant boost in state and federal funding. In 2015, a 10-cent state fuel tax increase was signed into law. According to a 2017 article in The Gazette, the increase produced an additional $515 million in funding. Though the funding increase helps, it is unlikely to end long-term funding issues for roads and bridges. As vehicles continue to become more fuel efficient and electric-powered vehicles become more prevalent, gasoline sales will continue to decline, as will revenue from the state gas tax. Furthermore, the infrastructure needs far exceed the amount of federal, state, and local funding available.
Though the FAST Act has provided an enhanced toolbox for planning and project development, overall funding levels remain inadequate to address the country’s aging infrastructure. The Highway Trust Fund has been on the edge of insolvency for almost a decade. Federal gas and diesel taxes, which fund the Highway Trust Fund, have not been increased since 1993. According to the American Public Transportation Association, the gas tax has lost more than 40 percent of its purchasing power over that time. As a result, the shortfall in the Highway Trust Fund is estimated at $164 billion over the next 10 years, just to maintain current investment levels. Furthermore, the Trust Fund is anticipated to become insolvent in FY 2021 (Figure 3.6). Without a long-term solution, the Highway Trust Fund will continue to depend on the infusion of general funds to remain solvent.
Figure 3.6: Highway Trust Fund Shortfall
Source: APTA, Issue Brief, 3/17/19
Unless the transportation funding shortfall can be reduced, Iowa will experience an increasing number of bridges with weight restrictions and bridge closures, deteriorating conditions across the transportation system, increased costs to transportation providers and users, and probable economic losses. These expenses are often passed down to local jurisdictions which lack adequate local revenues to continue full maintenance on
Folded plate girder research project, Amish Sawmill Bridge, Buchanan County
2045 LONG-RANGE TRANSPORTATION PLAN | 60
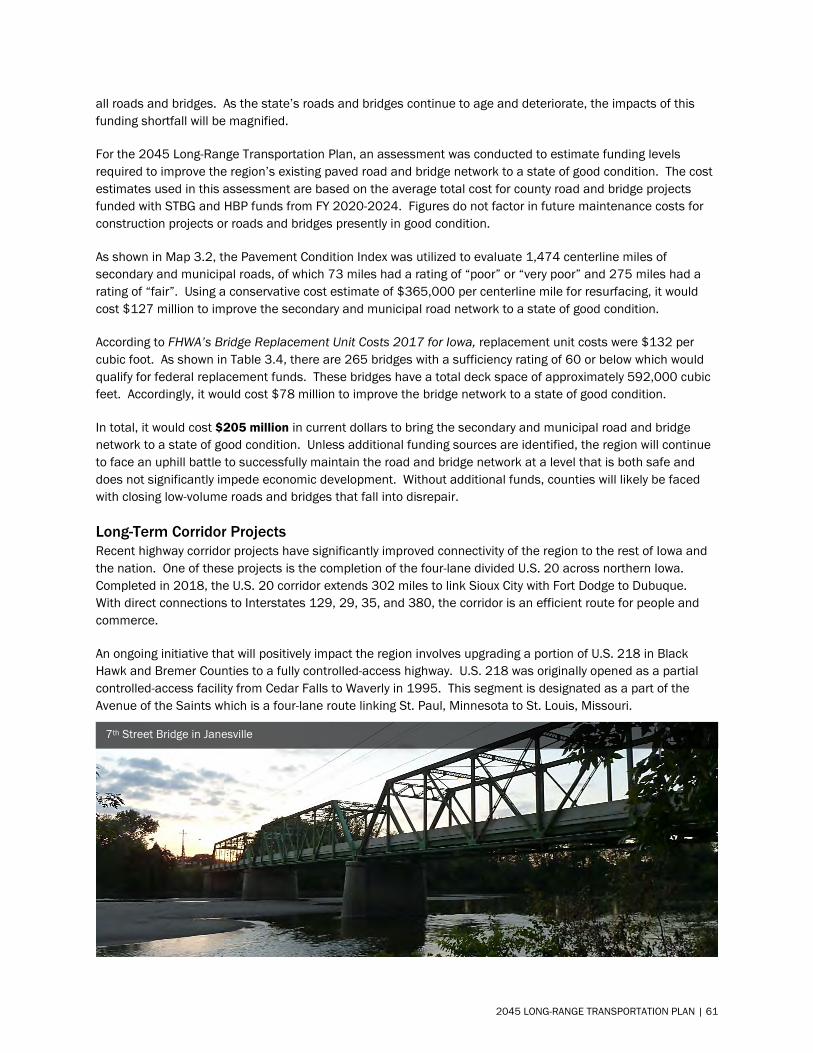
all roads and bridges. As the state’s roads and bridges continue to age and deteriorate, the impacts of this funding shortfall will be magnified.
For the 2045 Long-Range Transportation Plan, an assessment was conducted to estimate funding levels required to improve the region’s existing paved road and bridge network to a state of good condition. The cost estimates used in this assessment are based on the average total cost for county road and bridge projects funded with STBG and HBP funds from FY 2020-2024. Figures do not factor in future maintenance costs for construction projects or roads and bridges presently in good condition.
As shown in Map 3.2, the Pavement Condition Index was utilized to evaluate 1,474 centerline miles of secondary and municipal roads, of which 73 miles had a rating of “poor” or “very poor” and 275 miles had a rating of “fair”. Using a conservative cost estimate of $365,000 per centerline mile for resurfacing, it would cost $127 million to improve the secondary and municipal road network to a state of good condition.
According to FHWA’s Bridge Replacement Unit Costs 2017 for Iowa, replacement unit costs were $132 per cubic foot. As shown in Table 3.4, there are 265 bridges with a sufficiency rating of 60 or below which would qualify for federal replacement funds. These bridges have a total deck space of approximately 592,000 cubic feet. Accordingly, it would cost $78 million to improve the bridge network to a state of good condition.
In total, it would cost $205 million in current dollars to bring the secondary and municipal road and bridge network to a state of good condition. Unless additional funding sources are identified, the region will continue to face an uphill battle to successfully maintain the road and bridge network at a level that is both safe and does not significantly impede economic development. Without additional funds, counties will likely be faced with closing low-volume roads and bridges that fall into disrepair.
Long-Term Corridor Projects Recent highway corridor projects have significantly improved connectivity of the region to the rest of Iowa and the nation. One of these projects is the completion of the four-lane divided U.S. 20 across northern Iowa. Completed in 2018, the U.S. 20 corridor extends 302 miles to link Sioux City with Fort Dodge to Dubuque. With direct connections to Interstates 129, 29, 35, and 380, the corridor is an efficient route for people and commerce.
An ongoing initiative that will positively impact the region involves upgrading a portion of U.S. 218 in Black Hawk and Bremer Counties to a fully controlled-access highway. U.S. 218 was originally opened as a partial controlled-access facility from Cedar Falls to Waverly in 1995. This segment is designated as a part of the Avenue of the Saints which is a four-lane route linking St. Paul, Minnesota to St. Louis, Missouri.
7th Street Bridge in Janesville
2045 LONG-RANGE TRANSPORTATION PLAN | 61
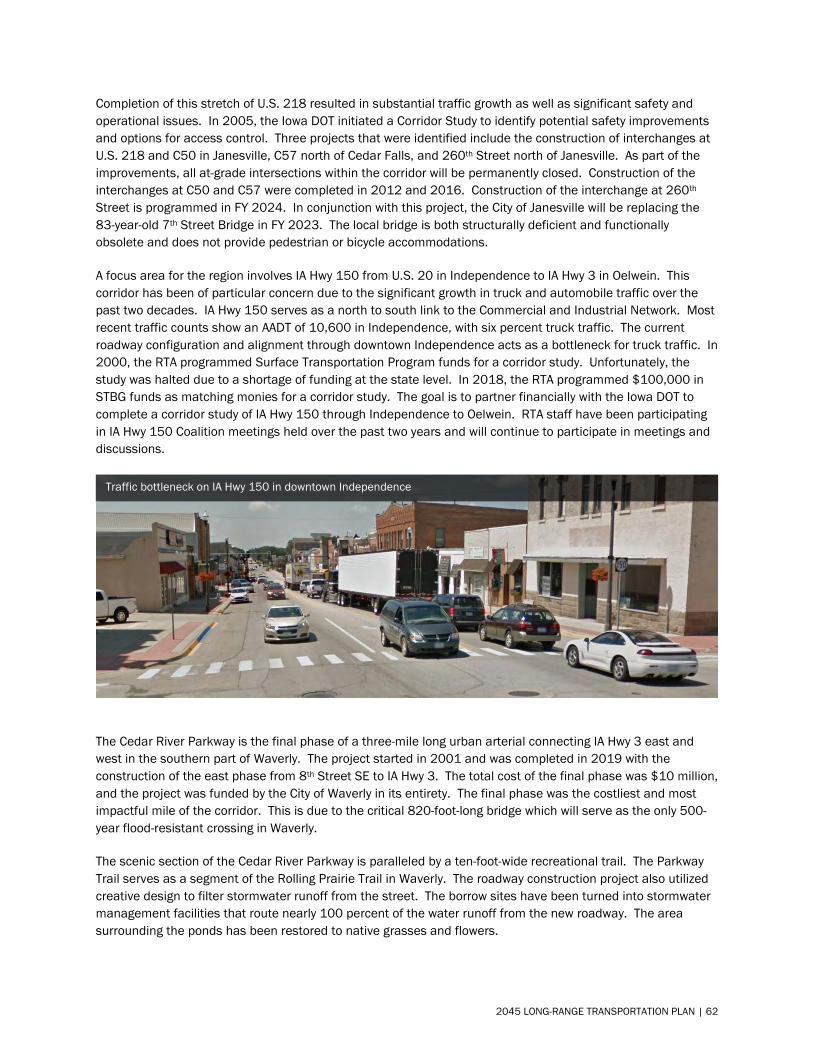
Completion of this stretch of U.S. 218 resulted in substantial traffic growth as well as significant safety and operational issues. In 2005, the Iowa DOT initiated a Corridor Study to identify potential safety improvements and options for access control. Three projects that were identified include the construction of interchanges at U.S. 218 and C50 in Janesville, C57 north of Cedar Falls, and 260th Street north of Janesville. As part of the improvements, all at-grade intersections within the corridor will be permanently closed. Construction of the interchanges at C50 and C57 were completed in 2012 and 2016. Construction of the interchange at 260th Street is programmed in FY 2024. In conjunction with this project, the City of Janesville will be replacing the 83-year-old 7th Street Bridge in FY 2023. The local bridge is both structurally deficient and functionallyobsolete and does not provide pedestrian or bicycle accommodations.
A focus area for the region involves IA Hwy 150 from U.S. 20 in Independence to IA Hwy 3 in Oelwein. This corridor has been of particular concern due to the significant growth in truck and automobile traffic over the past two decades. IA Hwy 150 serves as a north to south link to the Commercial and Industrial Network. Most recent traffic counts show an AADT of 10,600 in Independence, with six percent truck traffic. The current roadway configuration and alignment through downtown Independence acts as a bottleneck for truck traffic. In 2000, the RTA programmed Surface Transportation Program funds for a corridor study. Unfortunately, the study was halted due to a shortage of funding at the state level. In 2018, the RTA programmed $100,000 in STBG funds as matching monies for a corridor study. The goal is to partner financially with the Iowa DOT to complete a corridor study of IA Hwy 150 through Independence to Oelwein. RTA staff have been participating in IA Hwy 150 Coalition meetings held over the past two years and will continue to participate in meetings and discussions.
The Cedar River Parkway is the final phase of a three-mile long urban arterial connecting IA Hwy 3 east and west in the southern part of Waverly. The project started in 2001 and was completed in 2019 with the construction of the east phase from 8th Street SE to IA Hwy 3. The total cost of the final phase was $10 million, and the project was funded by the City of Waverly in its entirety. The final phase was the costliest and most impactful mile of the corridor. This is due to the critical 820-foot-long bridge which will serve as the only 500-year flood-resistant crossing in Waverly.
The scenic section of the Cedar River Parkway is paralleled by a ten-foot-wide recreational trail. The Parkway Trail serves as a segment of the Rolling Prairie Trail in Waverly. The roadway construction project also utilized creative design to filter stormwater runoff from the street. The borrow sites have been turned into stormwater management facilities that route nearly 100 percent of the water runoff from the new roadway. The area surrounding the ponds has been restored to native grasses and flowers.
Traffic bottleneck on IA Hwy 150 in downtown Independence
2045 LONG-RANGE TRANSPORTATION PLAN | 62
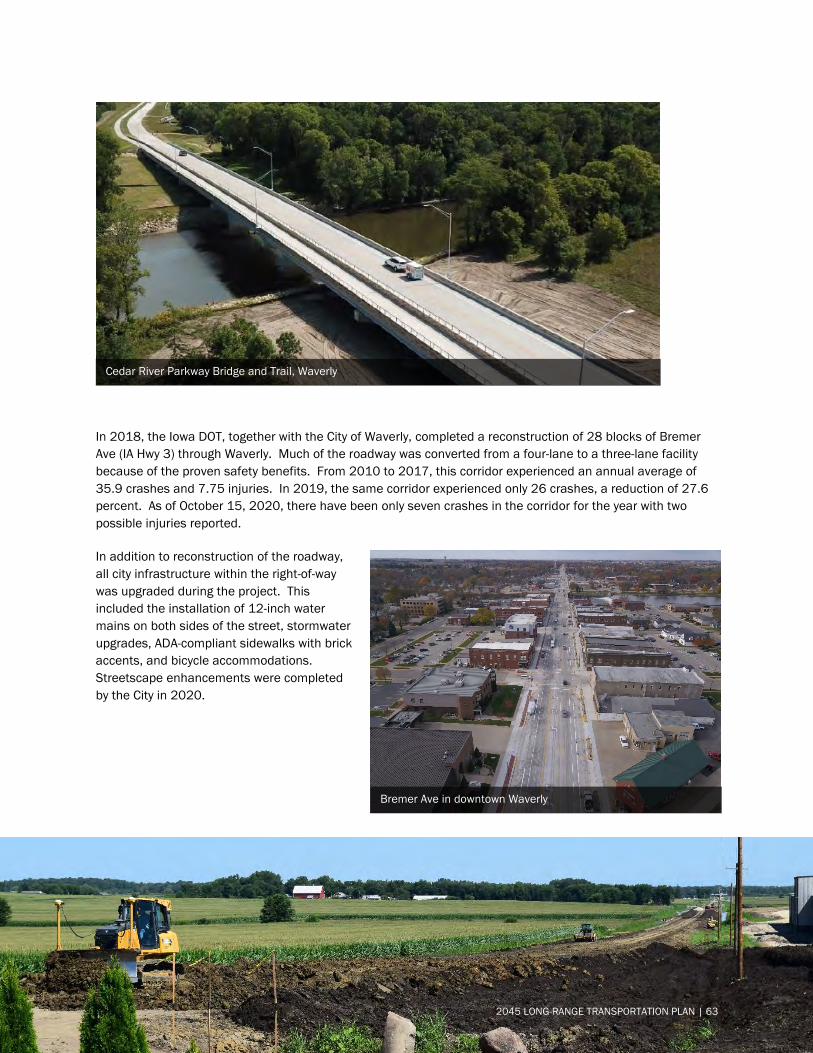
In 2018, the Iowa DOT, together with the City of Waverly, completed a reconstruction of 28 blocks of Bremer Ave (IA Hwy 3) through Waverly. Much of the roadway was converted from a four-lane to a three-lane facility because of the proven safety benefits. From 2010 to 2017, this corridor experienced an annual average of 35.9 crashes and 7.75 injuries. In 2019, the same corridor experienced only 26 crashes, a reduction of 27.6 percent. As of October 15, 2020, there have been only seven crashes in the corridor for the year with two possible injuries reported.
In addition to reconstruction of the roadway, all city infrastructure within the right-of-way was upgraded during the project. This included the installation of 12-inch water mains on both sides of the street, stormwater upgrades, ADA-compliant sidewalks with brick accents, and bicycle accommodations. Streetscape enhancements were completed by the City in 2020.
Cedar River Parkway Bridge and Trail, Waverly
Bremer Ave in downtown Waverly
2045 LONG-RANGE TRANSPORTATION PLAN | 63
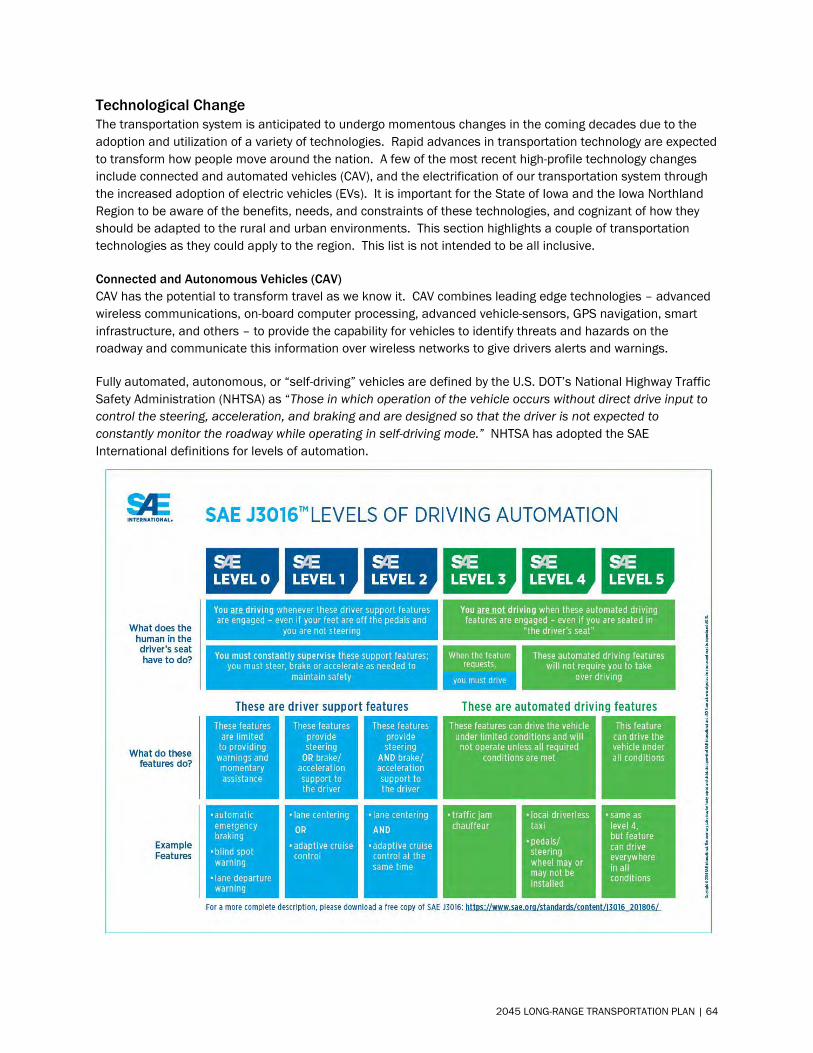
Technological Change The transportation system is anticipated to undergo momentous changes in the coming decades due to the adoption and utilization of a variety of technologies. Rapid advances in transportation technology are expected to transform how people move around the nation. A few of the most recent high-profile technology changes include connected and automated vehicles (CAV), and the electrification of our transportation system through the increased adoption of electric vehicles (EVs). It is important for the State of Iowa and the Iowa Northland Region to be aware of the benefits, needs, and constraints of these technologies, and cognizant of how they should be adapted to the rural and urban environments. This section highlights a couple of transportation technologies as they could apply to the region. This list is not intended to be all inclusive.
Connected and Autonomous Vehicles (CAV) CAV has the potential to transform travel as we know it. CAV combines leading edge technologies – advanced wireless communications, on-board computer processing, advanced vehicle-sensors, GPS navigation, smart infrastructure, and others – to provide the capability for vehicles to identify threats and hazards on the roadway and communicate this information over wireless networks to give drivers alerts and warnings.
Fully automated, autonomous, or “self-driving” vehicles are defined by the U.S. DOT’s National Highway Traffic Safety Administration (NHTSA) as “Those in which operation of the vehicle occurs without direct drive input to control the steering, acceleration, and braking and are designed so that the driver is not expected to constantly monitor the roadway while operating in self-driving mode.” NHTSA has adopted the SAE International definitions for levels of automation.
2045 LONG-RANGE TRANSPORTATION PLAN | 64
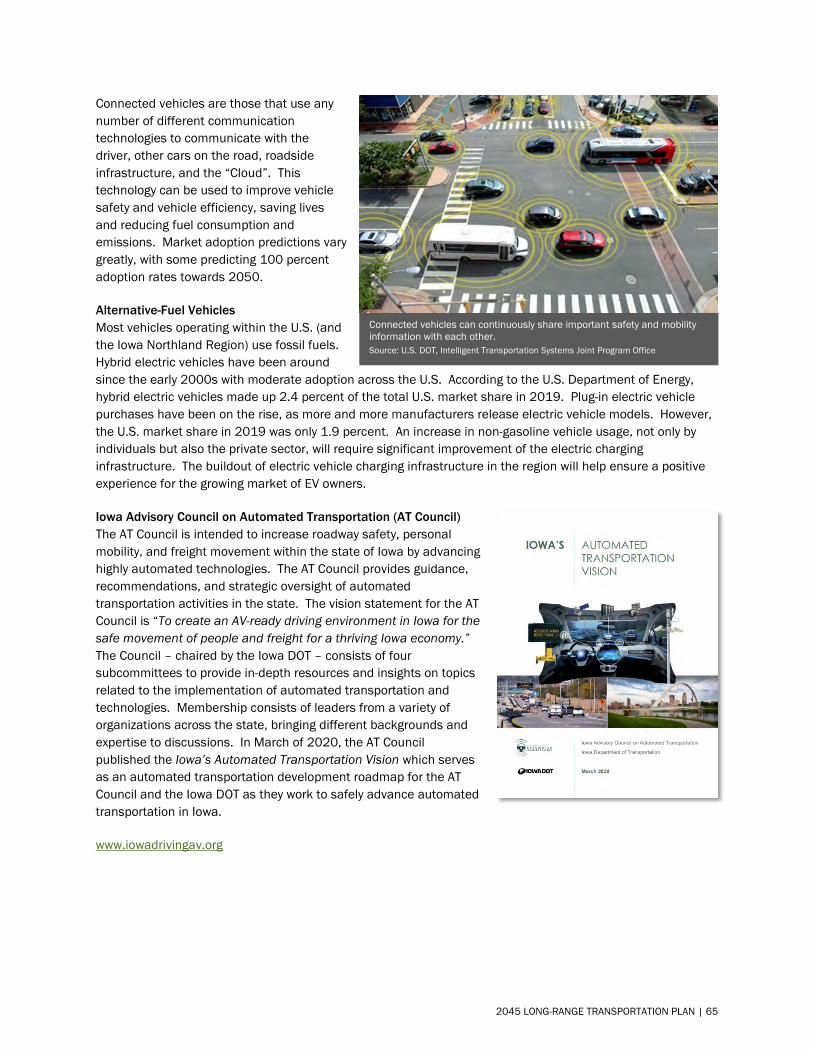
Connected vehicles are those that use any number of different communication technologies to communicate with the driver, other cars on the road, roadside infrastructure, and the “Cloud”. This technology can be used to improve vehicle safety and vehicle efficiency, saving lives and reducing fuel consumption and emissions. Market adoption predictions vary greatly, with some predicting 100 percent adoption rates towards 2050.
Alternative-Fuel Vehicles Most vehicles operating within the U.S. (and the Iowa Northland Region) use fossil fuels. Hybrid electric vehicles have been around since the early 2000s with moderate adoption across the U.S. According to the U.S. Department of Energy, hybrid electric vehicles made up 2.4 percent of the total U.S. market share in 2019. Plug-in electric vehicle purchases have been on the rise, as more and more manufacturers release electric vehicle models. However, the U.S. market share in 2019 was only 1.9 percent. An increase in non-gasoline vehicle usage, not only by individuals but also the private sector, will require significant improvement of the electric charging infrastructure. The buildout of electric vehicle charging infrastructure in the region will help ensure a positive experience for the growing market of EV owners.
Iowa Advisory Council on Automated Transportation (AT Council) The AT Council is intended to increase roadway safety, personal mobility, and freight movement within the state of Iowa by advancing highly automated technologies. The AT Council provides guidance, recommendations, and strategic oversight of automated transportation activities in the state. The vision statement for the AT Council is “To create an AV-ready driving environment in Iowa for the safe movement of people and freight for a thriving Iowa economy.” The Council – chaired by the Iowa DOT – consists of four subcommittees to provide in-depth resources and insights on topics related to the implementation of automated transportation and technologies. Membership consists of leaders from a variety of organizations across the state, bringing different backgrounds and expertise to discussions. In March of 2020, the AT Council published the Iowa’s Automated Transportation Vision which serves as an automated transportation development roadmap for the AT Council and the Iowa DOT as they work to safely advance automated transportation in Iowa.
www.iowadrivingav.org
Connected vehicles can continuously share important safety and mobility information with each other. Source: U.S. DOT, Intelligent Transportation Systems Joint Program Office
2045 LONG-RANGE TRANSPORTATION PLAN | 65
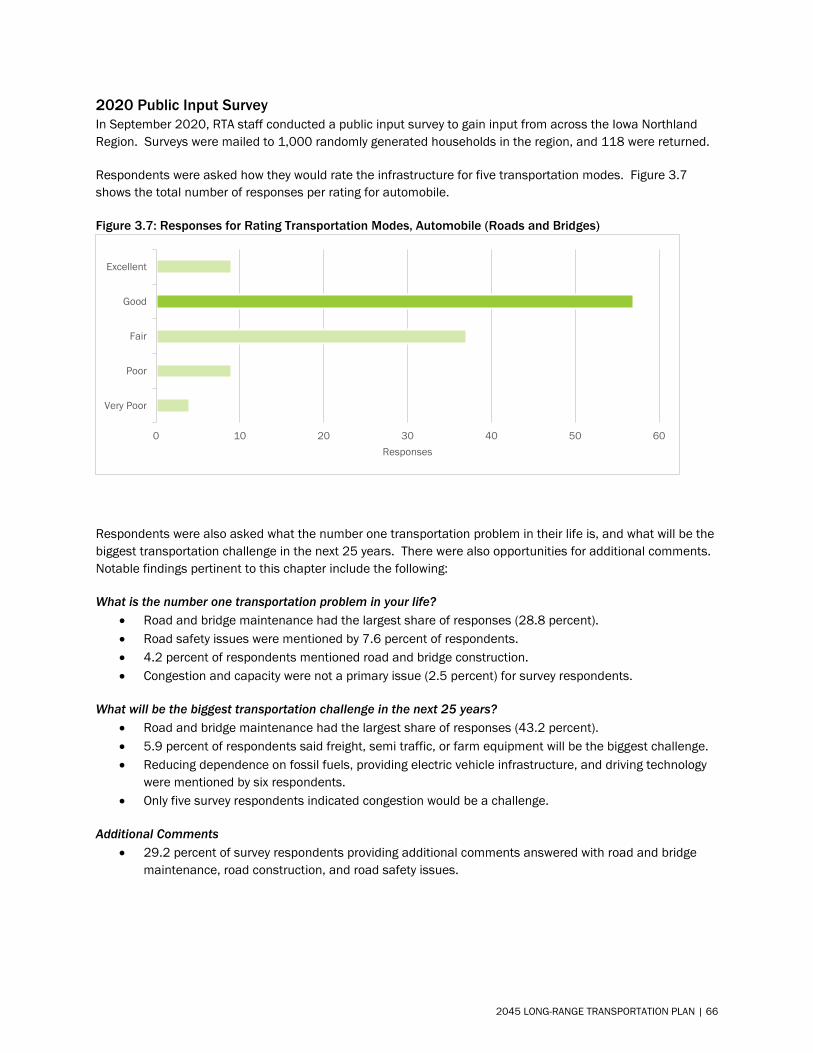
2020 Public Input Survey In September 2020, RTA staff conducted a public input survey to gain input from across the Iowa Northland Region. Surveys were mailed to 1,000 randomly generated households in the region, and 118 were returned.
Respondents were asked how they would rate the infrastructure for five transportation modes. Figure 3.7 shows the total number of responses per rating for automobile.
Figure 3.7: Responses for Rating Transportation Modes, Automobile (Roads and Bridges)
Respondents were also asked what the number one transportation problem in their life is, and what will be the biggest transportation challenge in the next 25 years. There were also opportunities for additional comments. Notable findings pertinent to this chapter include the following:
What is the number one transportation problem in your life? • Road and bridge maintenance had the largest share of responses (28.8 percent).• Road safety issues were mentioned by 7.6 percent of respondents.• 4.2 percent of respondents mentioned road and bridge construction.• Congestion and capacity were not a primary issue (2.5 percent) for survey respondents.
What will be the biggest transportation challenge in the next 25 years? • Road and bridge maintenance had the largest share of responses (43.2 percent).• 5.9 percent of respondents said freight, semi traffic, or farm equipment will be the biggest challenge.• Reducing dependence on fossil fuels, providing electric vehicle infrastructure, and driving technology
were mentioned by six respondents.• Only five survey respondents indicated congestion would be a challenge.
Additional Comments • 29.2 percent of survey respondents providing additional comments answered with road and bridge
maintenance, road construction, and road safety issues.
Very Poor
Poor
Fair
Good
Excellent
0 10 20 30 40 50 60Responses
2045 LONG-RANGE TRANSPORTATION PLAN | 66
Chapter 4
Transit
2045 LONG-RANGE TRANSPORTATION PLAN | 67
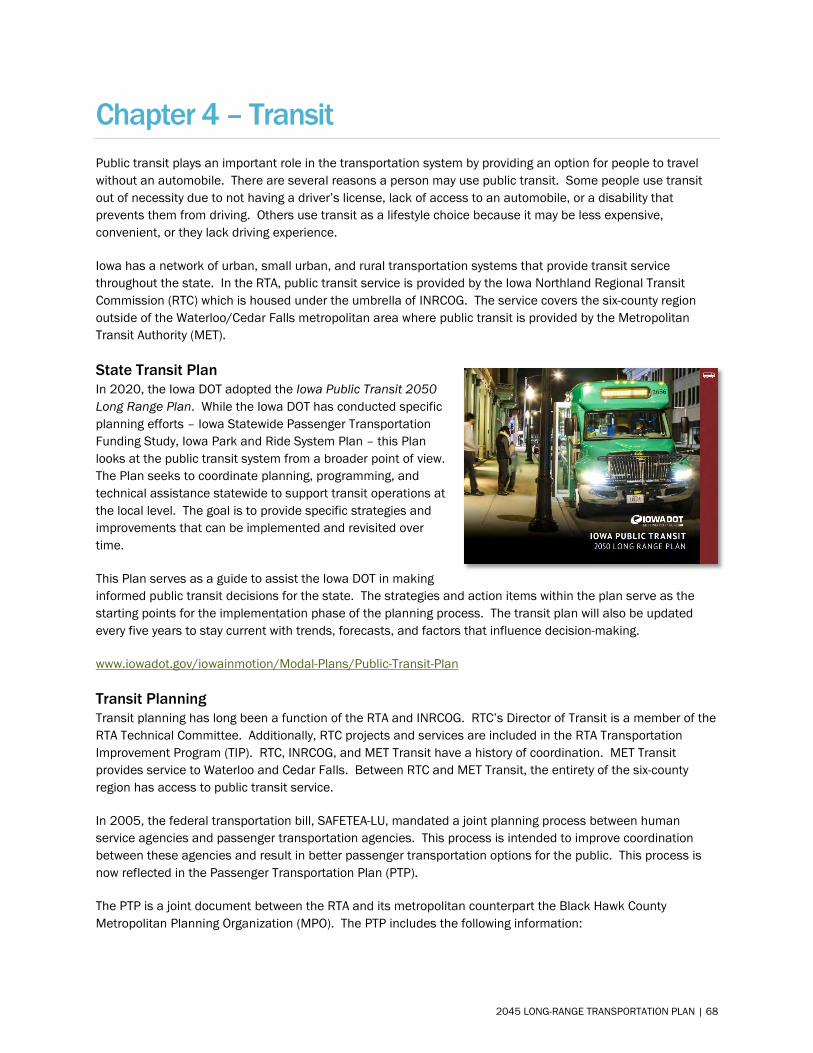
Chapter 4 – Transit Public transit plays an important role in the transportation system by providing an option for people to travel without an automobile. There are several reasons a person may use public transit. Some people use transit out of necessity due to not having a driver’s license, lack of access to an automobile, or a disability that prevents them from driving. Others use transit as a lifestyle choice because it may be less expensive, convenient, or they lack driving experience.
Iowa has a network of urban, small urban, and rural transportation systems that provide transit service throughout the state. In the RTA, public transit service is provided by the Iowa Northland Regional Transit Commission (RTC) which is housed under the umbrella of INRCOG. The service covers the six-county region outside of the Waterloo/Cedar Falls metropolitan area where public transit is provided by the Metropolitan Transit Authority (MET).
State Transit Plan In 2020, the Iowa DOT adopted the Iowa Public Transit 2050 Long Range Plan. While the Iowa DOT has conducted specific planning efforts – Iowa Statewide Passenger Transportation Funding Study, Iowa Park and Ride System Plan – this Plan looks at the public transit system from a broader point of view. The Plan seeks to coordinate planning, programming, and technical assistance statewide to support transit operations at the local level. The goal is to provide specific strategies and improvements that can be implemented and revisited over time.
This Plan serves as a guide to assist the Iowa DOT in making informed public transit decisions for the state. The strategies and action items within the plan serve as the starting points for the implementation phase of the planning process. The transit plan will also be updated every five years to stay current with trends, forecasts, and factors that influence decision-making.
www.iowadot.gov/iowainmotion/Modal-Plans/Public-Transit-Plan
Transit Planning Transit planning has long been a function of the RTA and INRCOG. RTC’s Director of Transit is a member of the RTA Technical Committee. Additionally, RTC projects and services are included in the RTA Transportation Improvement Program (TIP). RTC, INRCOG, and MET Transit have a history of coordination. MET Transit provides service to Waterloo and Cedar Falls. Between RTC and MET Transit, the entirety of the six-county region has access to public transit service.
In 2005, the federal transportation bill, SAFETEA-LU, mandated a joint planning process between human service agencies and passenger transportation agencies. This process is intended to improve coordination between these agencies and result in better passenger transportation options for the public. This process is now reflected in the Passenger Transportation Plan (PTP).
The PTP is a joint document between the RTA and its metropolitan counterpart the Black Hawk County Metropolitan Planning Organization (MPO). The PTP includes the following information:
2045 LONG-RANGE TRANSPORTATION PLAN | 68
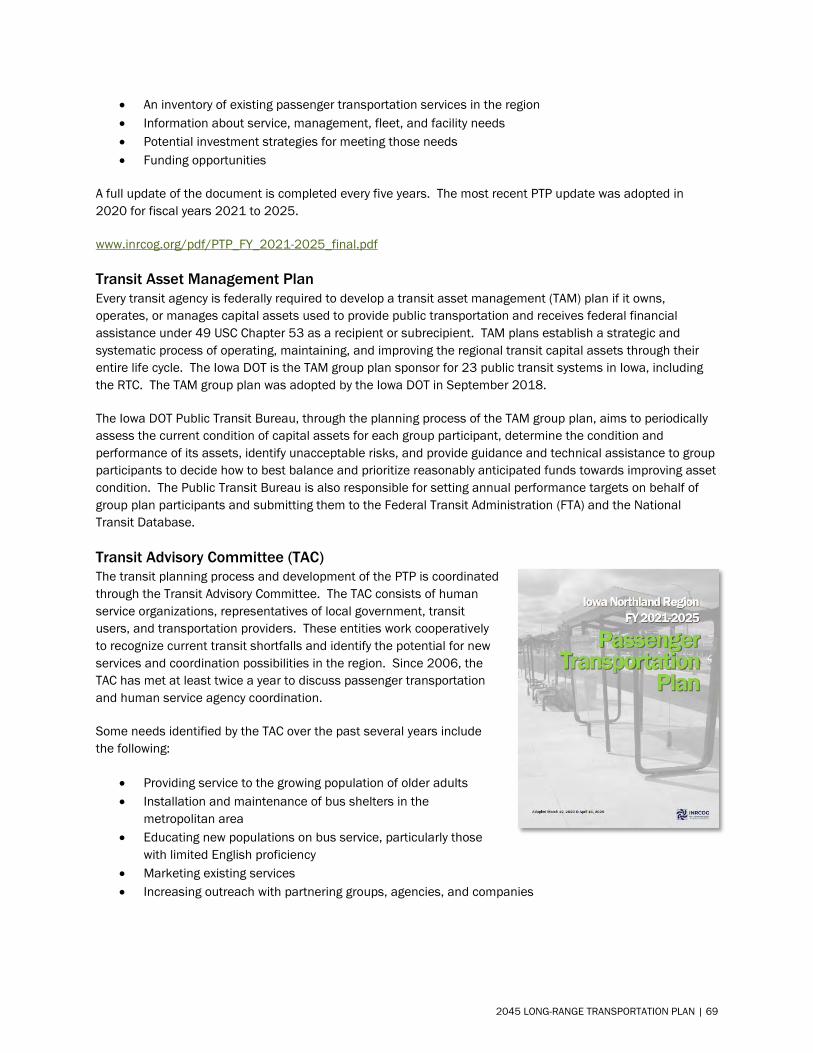
• An inventory of existing passenger transportation services in the region• Information about service, management, fleet, and facility needs• Potential investment strategies for meeting those needs• Funding opportunities
A full update of the document is completed every five years. The most recent PTP update was adopted in 2020 for fiscal years 2021 to 2025.
www.inrcog.org/pdf/PTP_FY_2021-2025_final.pdf
Transit Asset Management Plan Every transit agency is federally required to develop a transit asset management (TAM) plan if it owns, operates, or manages capital assets used to provide public transportation and receives federal financial assistance under 49 USC Chapter 53 as a recipient or subrecipient. TAM plans establish a strategic and systematic process of operating, maintaining, and improving the regional transit capital assets through their entire life cycle. The Iowa DOT is the TAM group plan sponsor for 23 public transit systems in Iowa, including the RTC. The TAM group plan was adopted by the Iowa DOT in September 2018.
The Iowa DOT Public Transit Bureau, through the planning process of the TAM group plan, aims to periodically assess the current condition of capital assets for each group participant, determine the condition and performance of its assets, identify unacceptable risks, and provide guidance and technical assistance to group participants to decide how to best balance and prioritize reasonably anticipated funds towards improving asset condition. The Public Transit Bureau is also responsible for setting annual performance targets on behalf of group plan participants and submitting them to the Federal Transit Administration (FTA) and the National Transit Database.
Transit Advisory Committee (TAC) The transit planning process and development of the PTP is coordinated through the Transit Advisory Committee. The TAC consists of human service organizations, representatives of local government, transit users, and transportation providers. These entities work cooperatively to recognize current transit shortfalls and identify the potential for new services and coordination possibilities in the region. Since 2006, the TAC has met at least twice a year to discuss passenger transportation and human service agency coordination.
Some needs identified by the TAC over the past several years include the following:
• Providing service to the growing population of older adults• Installation and maintenance of bus shelters in the
metropolitan area• Educating new populations on bus service, particularly those
with limited English proficiency• Marketing existing services• Increasing outreach with partnering groups, agencies, and companies
2045 LONG-RANGE TRANSPORTATION PLAN | 69
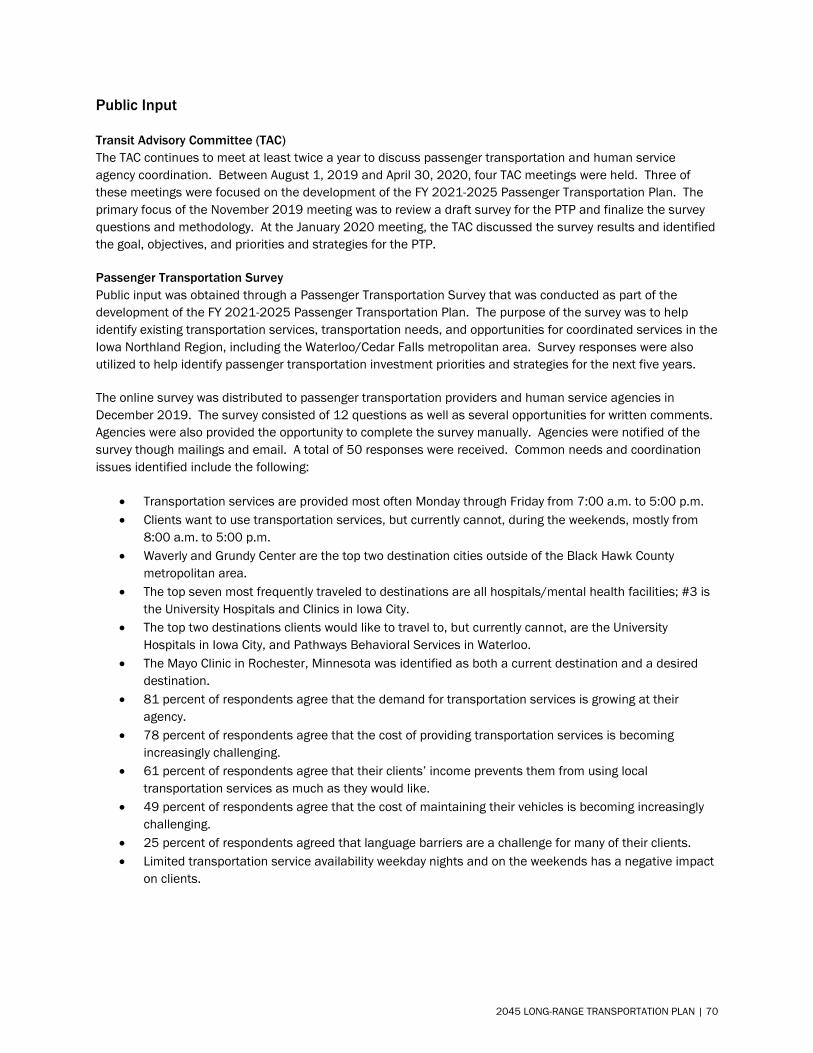
Public Input
Transit Advisory Committee (TAC) The TAC continues to meet at least twice a year to discuss passenger transportation and human service agency coordination. Between August 1, 2019 and April 30, 2020, four TAC meetings were held. Three of these meetings were focused on the development of the FY 2021-2025 Passenger Transportation Plan. The primary focus of the November 2019 meeting was to review a draft survey for the PTP and finalize the survey questions and methodology. At the January 2020 meeting, the TAC discussed the survey results and identified the goal, objectives, and priorities and strategies for the PTP.
Passenger Transportation Survey Public input was obtained through a Passenger Transportation Survey that was conducted as part of the development of the FY 2021-2025 Passenger Transportation Plan. The purpose of the survey was to help identify existing transportation services, transportation needs, and opportunities for coordinated services in the Iowa Northland Region, including the Waterloo/Cedar Falls metropolitan area. Survey responses were also utilized to help identify passenger transportation investment priorities and strategies for the next five years.
The online survey was distributed to passenger transportation providers and human service agencies in December 2019. The survey consisted of 12 questions as well as several opportunities for written comments. Agencies were also provided the opportunity to complete the survey manually. Agencies were notified of the survey though mailings and email. A total of 50 responses were received. Common needs and coordination issues identified include the following:
• Transportation services are provided most often Monday through Friday from 7:00 a.m. to 5:00 p.m.• Clients want to use transportation services, but currently cannot, during the weekends, mostly from
8:00 a.m. to 5:00 p.m.• Waverly and Grundy Center are the top two destination cities outside of the Black Hawk County
metropolitan area.• The top seven most frequently traveled to destinations are all hospitals/mental health facilities; #3 is
the University Hospitals and Clinics in Iowa City.• The top two destinations clients would like to travel to, but currently cannot, are the University
Hospitals in Iowa City, and Pathways Behavioral Services in Waterloo.• The Mayo Clinic in Rochester, Minnesota was identified as both a current destination and a desired
destination.• 81 percent of respondents agree that the demand for transportation services is growing at their
agency.• 78 percent of respondents agree that the cost of providing transportation services is becoming
increasingly challenging.• 61 percent of respondents agree that their clients’ income prevents them from using local
transportation services as much as they would like.• 49 percent of respondents agree that the cost of maintaining their vehicles is becoming increasingly
challenging.• 25 percent of respondents agreed that language barriers are a challenge for many of their clients.• Limited transportation service availability weekday nights and on the weekends has a negative impact
on clients.
2045 LONG-RANGE TRANSPORTATION PLAN | 70
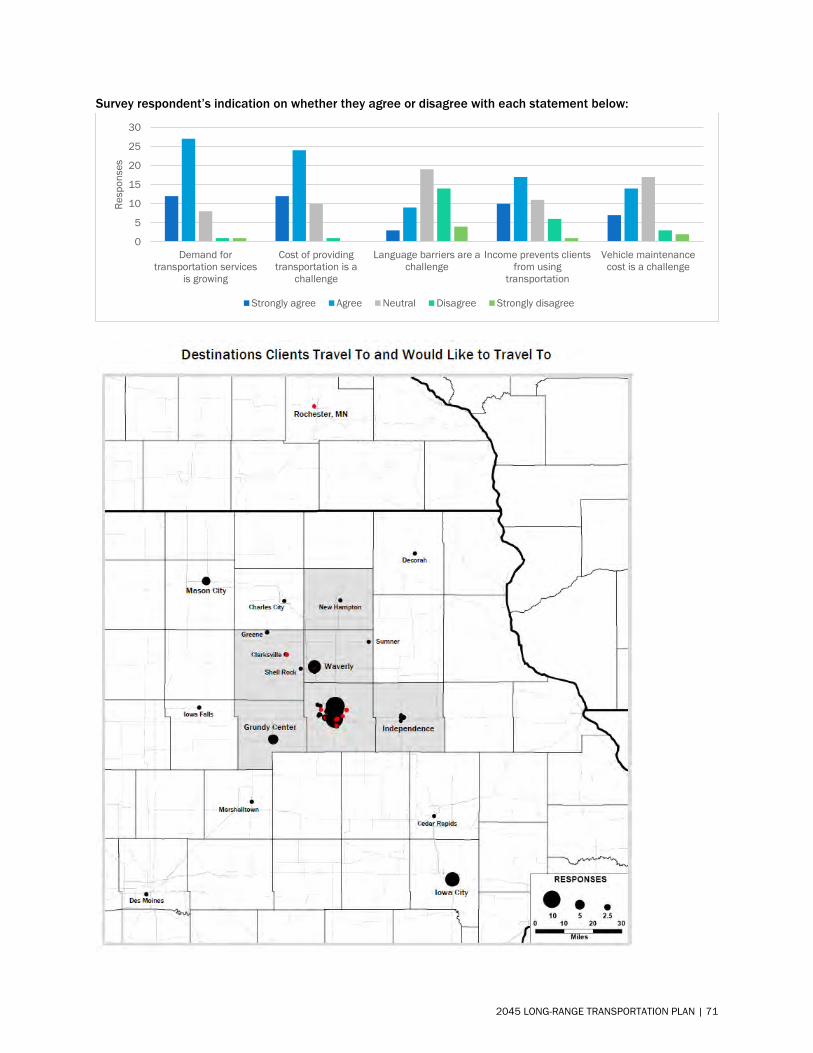
Survey respondent’s indication on whether they agree or disagree with each statement below:
0
5
10
15
20
25
30
Demand fortransportation services
is growing
Cost of providingtransportation is a
challenge
Language barriers are achallenge
Income prevents clientsfrom using
transportation
Vehicle maintenancecost is a challenge
Resp
onse
s
Strongly agree Agree Neutral Disagree Strongly disagree
2045 LONG-RANGE TRANSPORTATION PLAN | 71
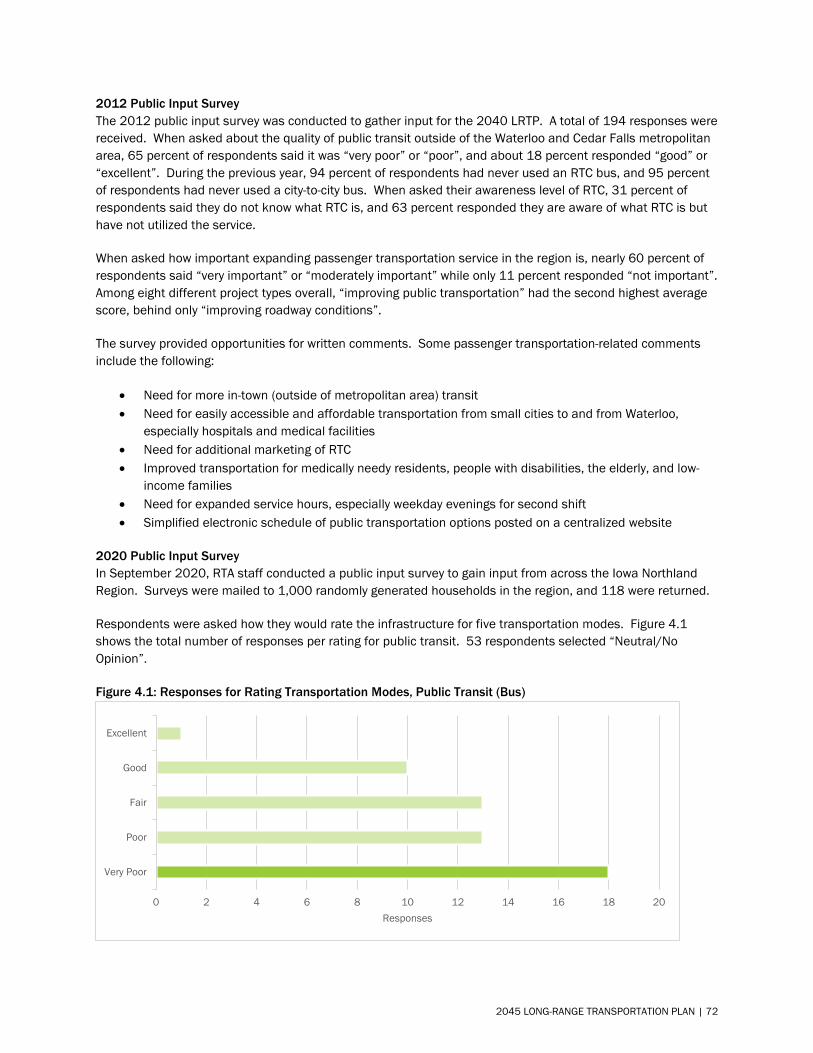
2012 Public Input Survey The 2012 public input survey was conducted to gather input for the 2040 LRTP. A total of 194 responses were received. When asked about the quality of public transit outside of the Waterloo and Cedar Falls metropolitan area, 65 percent of respondents said it was “very poor” or “poor”, and about 18 percent responded “good” or “excellent”. During the previous year, 94 percent of respondents had never used an RTC bus, and 95 percent of respondents had never used a city-to-city bus. When asked their awareness level of RTC, 31 percent of respondents said they do not know what RTC is, and 63 percent responded they are aware of what RTC is but have not utilized the service.
When asked how important expanding passenger transportation service in the region is, nearly 60 percent of respondents said “very important” or “moderately important” while only 11 percent responded “not important”. Among eight different project types overall, “improving public transportation” had the second highest average score, behind only “improving roadway conditions”.
The survey provided opportunities for written comments. Some passenger transportation-related comments include the following:
• Need for more in-town (outside of metropolitan area) transit• Need for easily accessible and affordable transportation from small cities to and from Waterloo,
especially hospitals and medical facilities• Need for additional marketing of RTC• Improved transportation for medically needy residents, people with disabilities, the elderly, and low-
income families• Need for expanded service hours, especially weekday evenings for second shift• Simplified electronic schedule of public transportation options posted on a centralized website
2020 Public Input Survey In September 2020, RTA staff conducted a public input survey to gain input from across the Iowa Northland Region. Surveys were mailed to 1,000 randomly generated households in the region, and 118 were returned.
Respondents were asked how they would rate the infrastructure for five transportation modes. Figure 4.1 shows the total number of responses per rating for public transit. 53 respondents selected “Neutral/No Opinion”.
Figure 4.1: Responses for Rating Transportation Modes, Public Transit (Bus)
Very Poor
Poor
Fair
Good
Excellent
0 2 4 6 8 10 12 14 16 18 20Responses
2045 LONG-RANGE TRANSPORTATION PLAN | 72
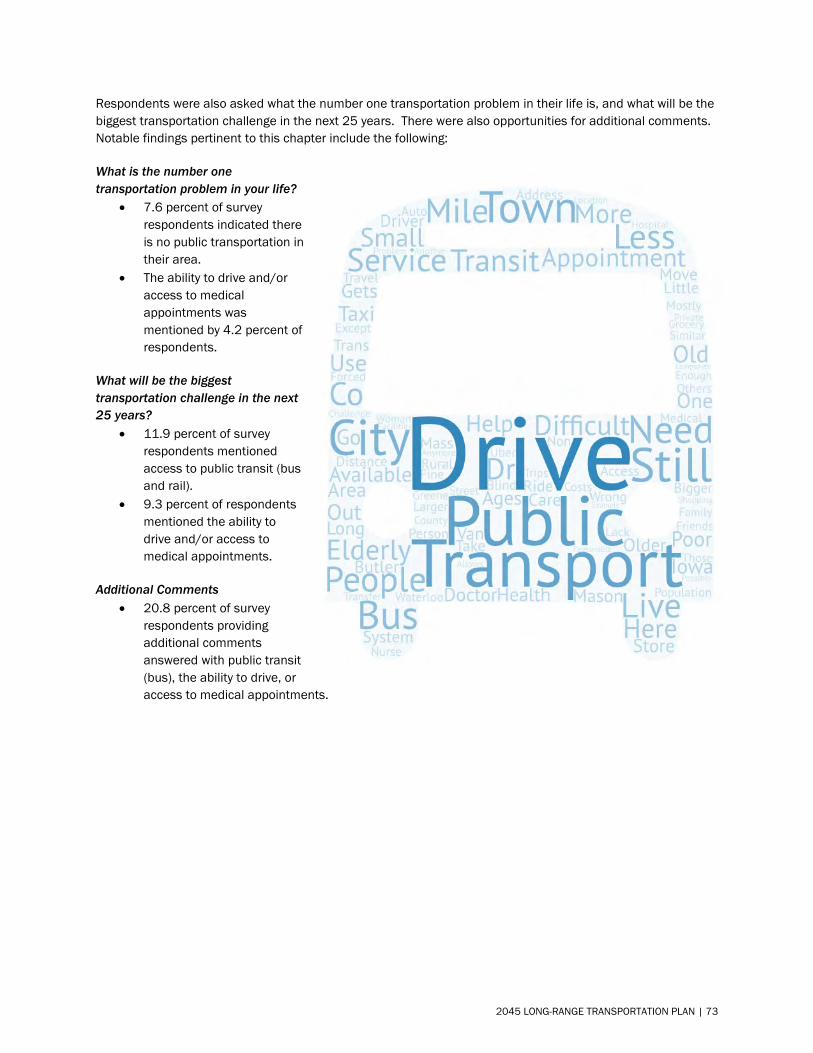
Respondents were also asked what the number one transportation problem in their life is, and what will be the biggest transportation challenge in the next 25 years. There were also opportunities for additional comments. Notable findings pertinent to this chapter include the following:
What is the number one transportation problem in your life?
• 7.6 percent of survey respondents indicated there is no public transportation in their area.
• The ability to drive and/or access to medical appointments was mentioned by 4.2 percent of respondents.
What will be the biggest transportation challenge in the next 25 years?
• 11.9 percent of survey respondents mentioned access to public transit (bus and rail).
• 9.3 percent of respondents mentioned the ability to drive and/or access to medical appointments.
Additional Comments • 20.8 percent of survey
respondents providing additional comments answered with public transit (bus), the ability to drive, or access to medical appointments.
2045 LONG-RANGE TRANSPORTATION PLAN | 73
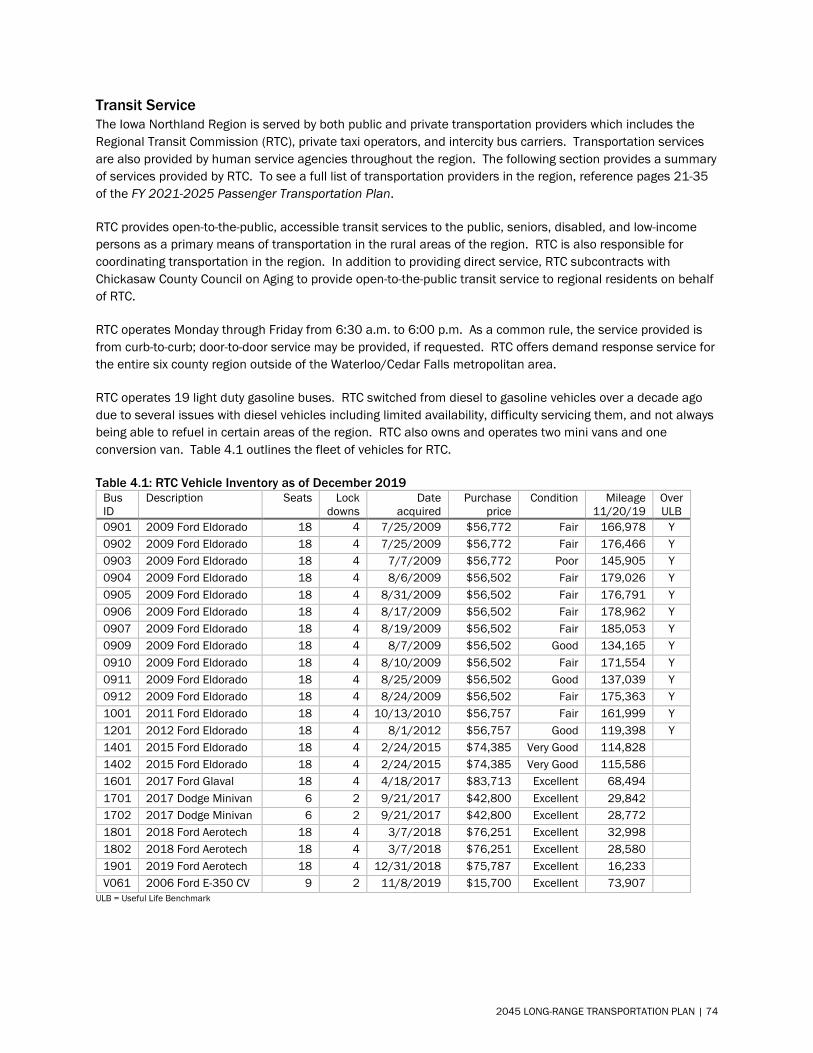
Transit Service The Iowa Northland Region is served by both public and private transportation providers which includes the Regional Transit Commission (RTC), private taxi operators, and intercity bus carriers. Transportation services are also provided by human service agencies throughout the region. The following section provides a summary of services provided by RTC. To see a full list of transportation providers in the region, reference pages 21-35 of the FY 2021-2025 Passenger Transportation Plan.
RTC provides open-to-the-public, accessible transit services to the public, seniors, disabled, and low-income persons as a primary means of transportation in the rural areas of the region. RTC is also responsible for coordinating transportation in the region. In addition to providing direct service, RTC subcontracts with Chickasaw County Council on Aging to provide open-to-the-public transit service to regional residents on behalf of RTC.
RTC operates Monday through Friday from 6:30 a.m. to 6:00 p.m. As a common rule, the service provided is from curb-to-curb; door-to-door service may be provided, if requested. RTC offers demand response service for the entire six county region outside of the Waterloo/Cedar Falls metropolitan area.
RTC operates 19 light duty gasoline buses. RTC switched from diesel to gasoline vehicles over a decade ago due to several issues with diesel vehicles including limited availability, difficulty servicing them, and not always being able to refuel in certain areas of the region. RTC also owns and operates two mini vans and one conversion van. Table 4.1 outlines the fleet of vehicles for RTC.
Table 4.1: RTC Vehicle Inventory as of December 2019 Bus ID
Description Seats Lock downs
Date acquired
Purchase price
Condition Mileage 11/20/19
Over ULB
0901 2009 Ford Eldorado 18 4 7/25/2009 $56,772 Fair 166,978 Y 0902 2009 Ford Eldorado 18 4 7/25/2009 $56,772 Fair 176,466 Y 0903 2009 Ford Eldorado 18 4 7/7/2009 $56,772 Poor 145,905 Y 0904 2009 Ford Eldorado 18 4 8/6/2009 $56,502 Fair 179,026 Y 0905 2009 Ford Eldorado 18 4 8/31/2009 $56,502 Fair 176,791 Y 0906 2009 Ford Eldorado 18 4 8/17/2009 $56,502 Fair 178,962 Y 0907 2009 Ford Eldorado 18 4 8/19/2009 $56,502 Fair 185,053 Y 0909 2009 Ford Eldorado 18 4 8/7/2009 $56,502 Good 134,165 Y 0910 2009 Ford Eldorado 18 4 8/10/2009 $56,502 Fair 171,554 Y 0911 2009 Ford Eldorado 18 4 8/25/2009 $56,502 Good 137,039 Y 0912 2009 Ford Eldorado 18 4 8/24/2009 $56,502 Fair 175,363 Y 1001 2011 Ford Eldorado 18 4 10/13/2010 $56,757 Fair 161,999 Y 1201 2012 Ford Eldorado 18 4 8/1/2012 $56,757 Good 119,398 Y 1401 2015 Ford Eldorado 18 4 2/24/2015 $74,385 Very Good 114,828 1402 2015 Ford Eldorado 18 4 2/24/2015 $74,385 Very Good 115,586 1601 2017 Ford Glaval 18 4 4/18/2017 $83,713 Excellent 68,494 1701 2017 Dodge Minivan 6 2 9/21/2017 $42,800 Excellent 29,842 1702 2017 Dodge Minivan 6 2 9/21/2017 $42,800 Excellent 28,772 1801 2018 Ford Aerotech 18 4 3/7/2018 $76,251 Excellent 32,998 1802 2018 Ford Aerotech 18 4 3/7/2018 $76,251 Excellent 28,580 1901 2019 Ford Aerotech 18 4 12/31/2018 $75,787 Excellent 16,233 V061 2006 Ford E-350 CV 9 2 11/8/2019 $15,700 Excellent 73,907
ULB = Useful Life Benchmark
2045 LONG-RANGE TRANSPORTATION PLAN | 74
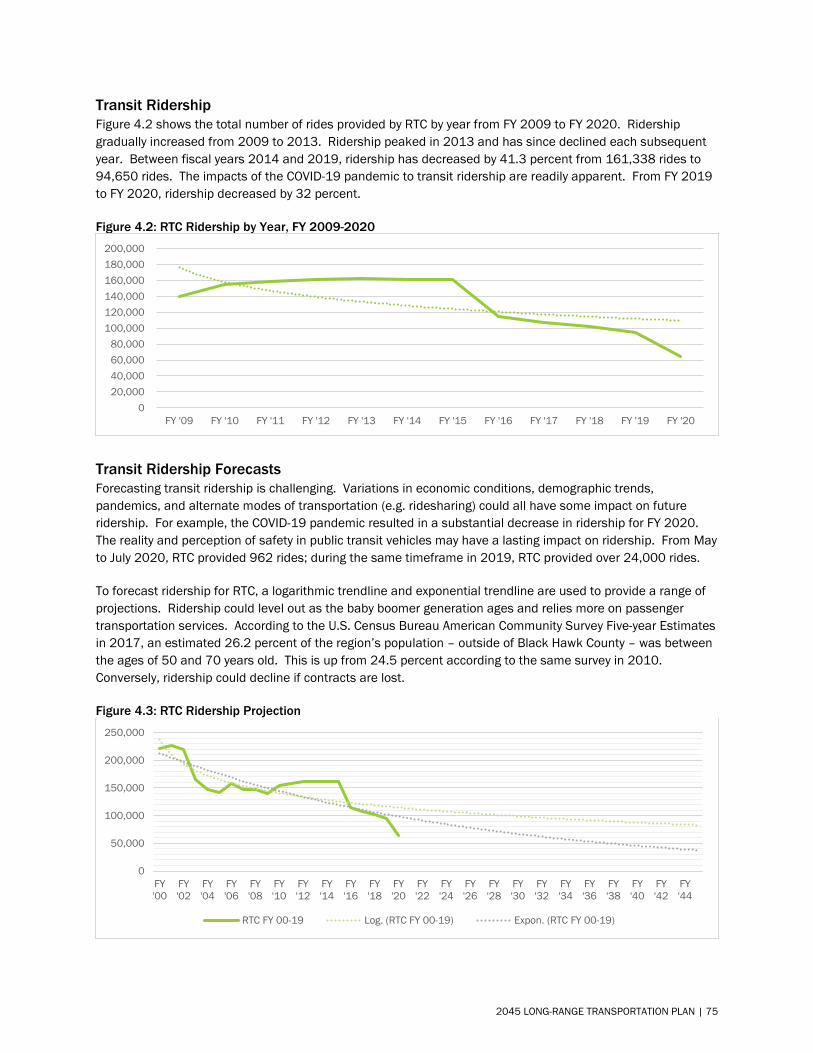
Transit Ridership Figure 4.2 shows the total number of rides provided by RTC by year from FY 2009 to FY 2020. Ridership gradually increased from 2009 to 2013. Ridership peaked in 2013 and has since declined each subsequent year. Between fiscal years 2014 and 2019, ridership has decreased by 41.3 percent from 161,338 rides to 94,650 rides. The impacts of the COVID-19 pandemic to transit ridership are readily apparent. From FY 2019 to FY 2020, ridership decreased by 32 percent.
Figure 4.2: RTC Ridership by Year, FY 2009-2020
Transit Ridership Forecasts Forecasting transit ridership is challenging. Variations in economic conditions, demographic trends, pandemics, and alternate modes of transportation (e.g. ridesharing) could all have some impact on future ridership. For example, the COVID-19 pandemic resulted in a substantial decrease in ridership for FY 2020. The reality and perception of safety in public transit vehicles may have a lasting impact on ridership. From May to July 2020, RTC provided 962 rides; during the same timeframe in 2019, RTC provided over 24,000 rides.
To forecast ridership for RTC, a logarithmic trendline and exponential trendline are used to provide a range of projections. Ridership could level out as the baby boomer generation ages and relies more on passenger transportation services. According to the U.S. Census Bureau American Community Survey Five-year Estimates in 2017, an estimated 26.2 percent of the region’s population – outside of Black Hawk County – was between the ages of 50 and 70 years old. This is up from 24.5 percent according to the same survey in 2010. Conversely, ridership could decline if contracts are lost.
Figure 4.3: RTC Ridership Projection
020,00040,00060,00080,000
100,000120,000140,000160,000180,000200,000
FY '09 FY '10 FY '11 FY '12 FY '13 FY '14 FY '15 FY '16 FY '17 FY '18 FY '19 FY '20
0
50,000
100,000
150,000
200,000
250,000
FY'00
FY'02
FY'04
FY'06
FY'08
FY'10
FY'12
FY'14
FY'16
FY'18
FY'20
FY'22
FY'24
FY'26
FY'28
FY'30
FY'32
FY'34
FY'36
FY'38
FY'40
FY'42
FY'44
RTC FY 00-19 Log. (RTC FY 00-19) Expon. (RTC FY 00-19)
2045 LONG-RANGE TRANSPORTATION PLAN | 75
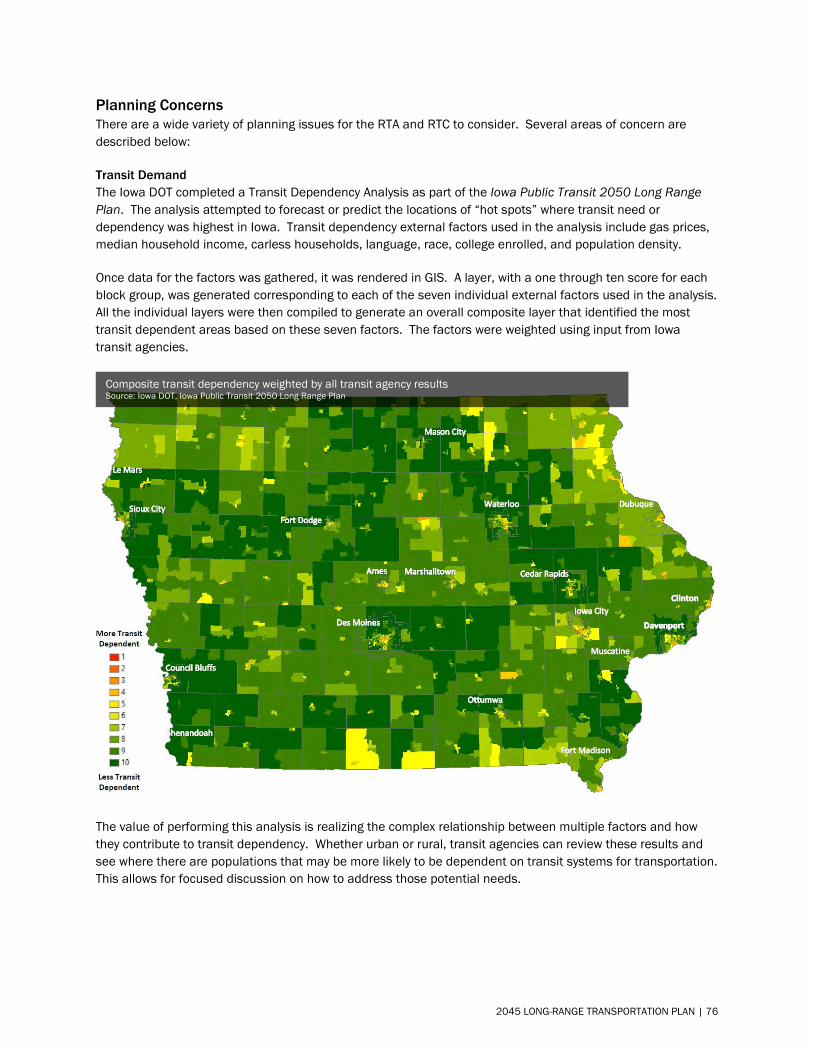
Planning Concerns There are a wide variety of planning issues for the RTA and RTC to consider. Several areas of concern are described below:
Transit Demand The Iowa DOT completed a Transit Dependency Analysis as part of the Iowa Public Transit 2050 Long Range Plan. The analysis attempted to forecast or predict the locations of “hot spots” where transit need or dependency was highest in Iowa. Transit dependency external factors used in the analysis include gas prices, median household income, carless households, language, race, college enrolled, and population density.
Once data for the factors was gathered, it was rendered in GIS. A layer, with a one through ten score for each block group, was generated corresponding to each of the seven individual external factors used in the analysis. All the individual layers were then compiled to generate an overall composite layer that identified the most transit dependent areas based on these seven factors. The factors were weighted using input from Iowa transit agencies.
The value of performing this analysis is realizing the complex relationship between multiple factors and how they contribute to transit dependency. Whether urban or rural, transit agencies can review these results and see where there are populations that may be more likely to be dependent on transit systems for transportation. This allows for focused discussion on how to address those potential needs.
Composite transit dependency weighted by all transit agency results Source: Iowa DOT, Iowa Public Transit 2050 Long Range Plan
2045 LONG-RANGE TRANSPORTATION PLAN | 76
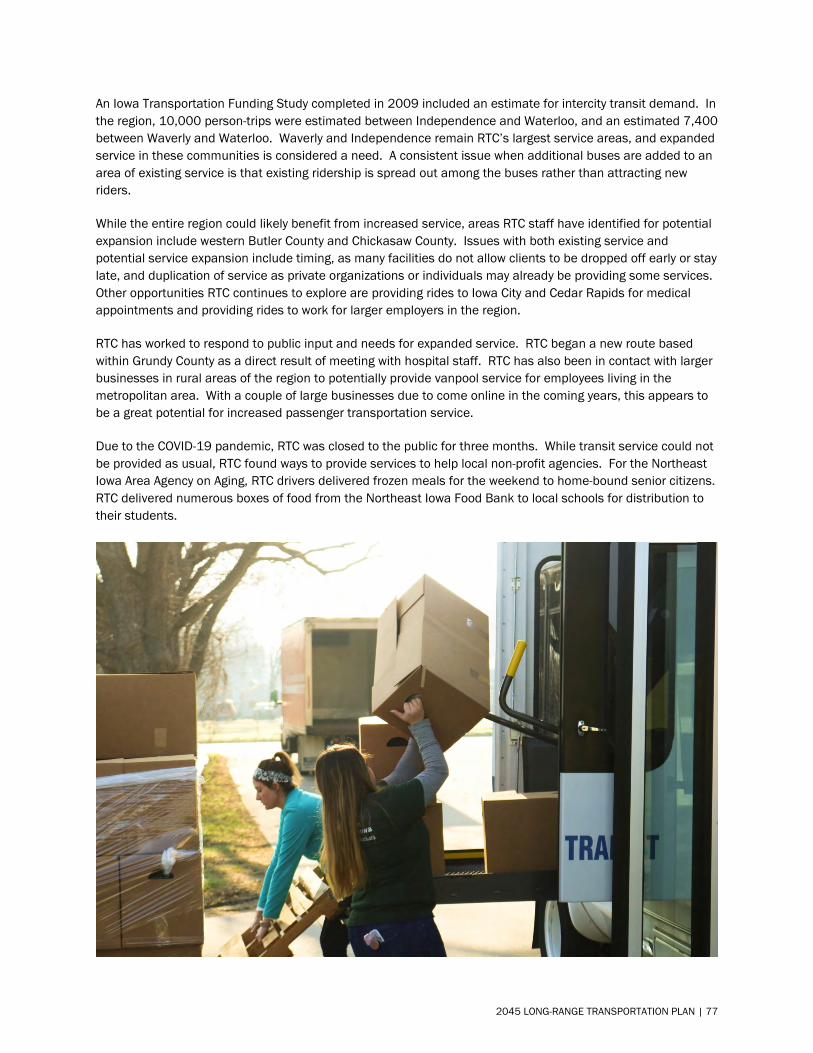
An Iowa Transportation Funding Study completed in 2009 included an estimate for intercity transit demand. In the region, 10,000 person-trips were estimated between Independence and Waterloo, and an estimated 7,400 between Waverly and Waterloo. Waverly and Independence remain RTC’s largest service areas, and expanded service in these communities is considered a need. A consistent issue when additional buses are added to an area of existing service is that existing ridership is spread out among the buses rather than attracting new riders.
While the entire region could likely benefit from increased service, areas RTC staff have identified for potential expansion include western Butler County and Chickasaw County. Issues with both existing service and potential service expansion include timing, as many facilities do not allow clients to be dropped off early or stay late, and duplication of service as private organizations or individuals may already be providing some services. Other opportunities RTC continues to explore are providing rides to Iowa City and Cedar Rapids for medical appointments and providing rides to work for larger employers in the region.
RTC has worked to respond to public input and needs for expanded service. RTC began a new route based within Grundy County as a direct result of meeting with hospital staff. RTC has also been in contact with larger businesses in rural areas of the region to potentially provide vanpool service for employees living in the metropolitan area. With a couple of large businesses due to come online in the coming years, this appears to be a great potential for increased passenger transportation service.
Due to the COVID-19 pandemic, RTC was closed to the public for three months. While transit service could not be provided as usual, RTC found ways to provide services to help local non-profit agencies. For the Northeast Iowa Area Agency on Aging, RTC drivers delivered frozen meals for the weekend to home-bound senior citizens. RTC delivered numerous boxes of food from the Northeast Iowa Food Bank to local schools for distribution to their students.
2045 LONG-RANGE TRANSPORTATION PLAN | 77
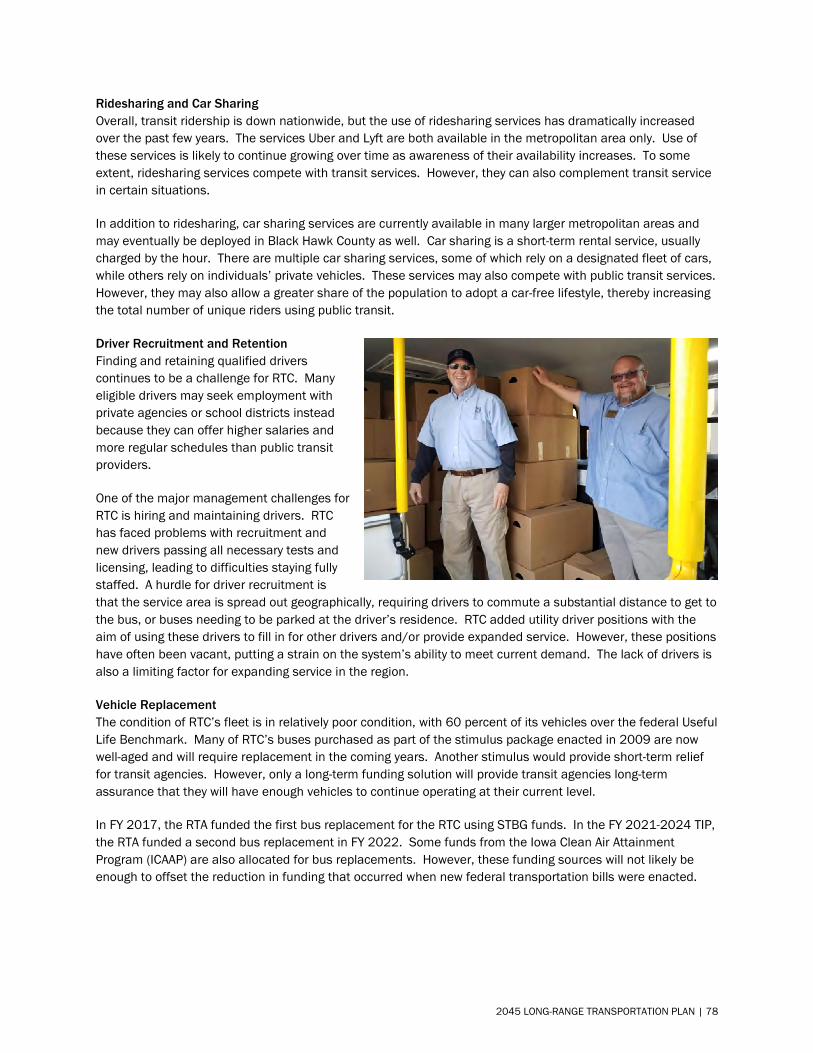
Ridesharing and Car Sharing Overall, transit ridership is down nationwide, but the use of ridesharing services has dramatically increased over the past few years. The services Uber and Lyft are both available in the metropolitan area only. Use of these services is likely to continue growing over time as awareness of their availability increases. To some extent, ridesharing services compete with transit services. However, they can also complement transit service in certain situations.
In addition to ridesharing, car sharing services are currently available in many larger metropolitan areas and may eventually be deployed in Black Hawk County as well. Car sharing is a short-term rental service, usually charged by the hour. There are multiple car sharing services, some of which rely on a designated fleet of cars, while others rely on individuals’ private vehicles. These services may also compete with public transit services. However, they may also allow a greater share of the population to adopt a car-free lifestyle, thereby increasing the total number of unique riders using public transit.
Driver Recruitment and Retention Finding and retaining qualified drivers continues to be a challenge for RTC. Many eligible drivers may seek employment with private agencies or school districts instead because they can offer higher salaries and more regular schedules than public transit providers.
One of the major management challenges for RTC is hiring and maintaining drivers. RTC has faced problems with recruitment and new drivers passing all necessary tests and licensing, leading to difficulties staying fully staffed. A hurdle for driver recruitment is that the service area is spread out geographically, requiring drivers to commute a substantial distance to get to the bus, or buses needing to be parked at the driver’s residence. RTC added utility driver positions with the aim of using these drivers to fill in for other drivers and/or provide expanded service. However, these positions have often been vacant, putting a strain on the system’s ability to meet current demand. The lack of drivers is also a limiting factor for expanding service in the region.
Vehicle Replacement The condition of RTC’s fleet is in relatively poor condition, with 60 percent of its vehicles over the federal Useful Life Benchmark. Many of RTC’s buses purchased as part of the stimulus package enacted in 2009 are now well-aged and will require replacement in the coming years. Another stimulus would provide short-term relief for transit agencies. However, only a long-term funding solution will provide transit agencies long-term assurance that they will have enough vehicles to continue operating at their current level.
In FY 2017, the RTA funded the first bus replacement for the RTC using STBG funds. In the FY 2021-2024 TIP, the RTA funded a second bus replacement in FY 2022. Some funds from the Iowa Clean Air Attainment Program (ICAAP) are also allocated for bus replacements. However, these funding sources will not likely be enough to offset the reduction in funding that occurred when new federal transportation bills were enacted.
2045 LONG-RANGE TRANSPORTATION PLAN | 78
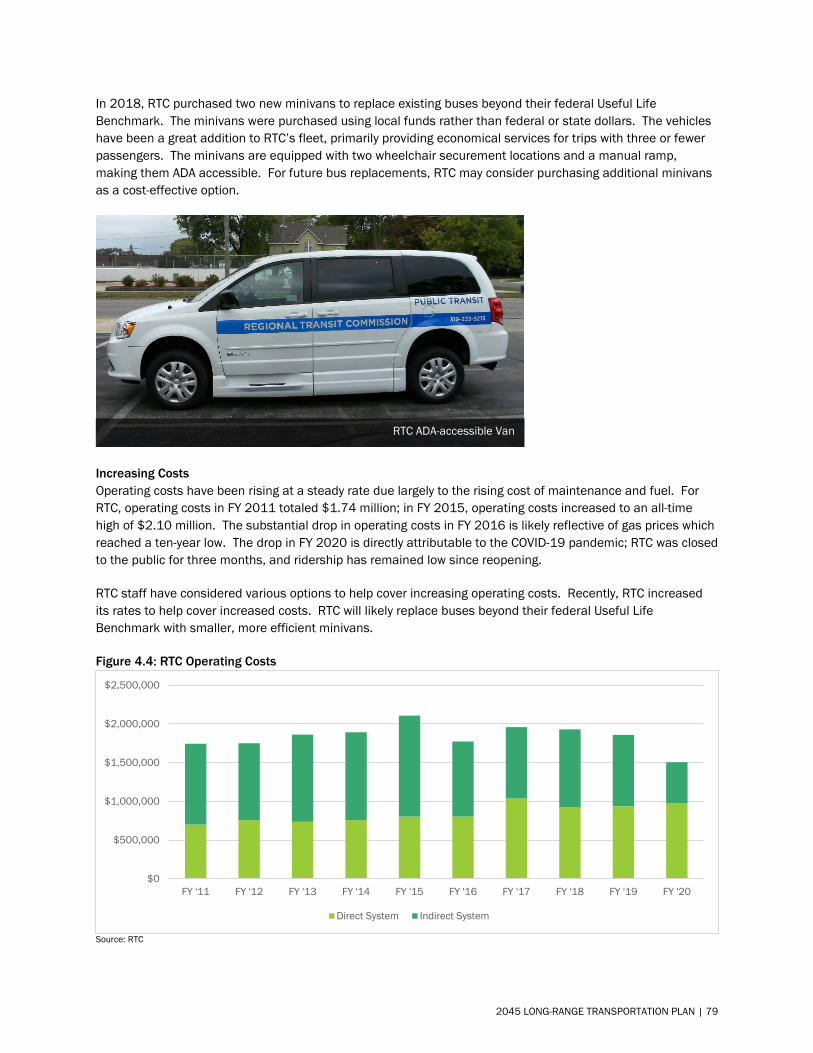
In 2018, RTC purchased two new minivans to replace existing buses beyond their federal Useful Life Benchmark. The minivans were purchased using local funds rather than federal or state dollars. The vehicles have been a great addition to RTC’s fleet, primarily providing economical services for trips with three or fewer passengers. The minivans are equipped with two wheelchair securement locations and a manual ramp, making them ADA accessible. For future bus replacements, RTC may consider purchasing additional minivans as a cost-effective option.
Increasing Costs Operating costs have been rising at a steady rate due largely to the rising cost of maintenance and fuel. For RTC, operating costs in FY 2011 totaled $1.74 million; in FY 2015, operating costs increased to an all-time high of $2.10 million. The substantial drop in operating costs in FY 2016 is likely reflective of gas prices which reached a ten-year low. The drop in FY 2020 is directly attributable to the COVID-19 pandemic; RTC was closed to the public for three months, and ridership has remained low since reopening.
RTC staff have considered various options to help cover increasing operating costs. Recently, RTC increased its rates to help cover increased costs. RTC will likely replace buses beyond their federal Useful Life Benchmark with smaller, more efficient minivans.
Figure 4.4: RTC Operating Costs
Source: RTC
$0
$500,000
$1,000,000
$1,500,000
$2,000,000
$2,500,000
FY '11 FY '12 FY '13 FY '14 FY '15 FY '16 FY '17 FY '18 FY '19 FY '20
Direct System Indirect System
RTC ADA-accessible Van
2045 LONG-RANGE TRANSPORTATION PLAN | 79
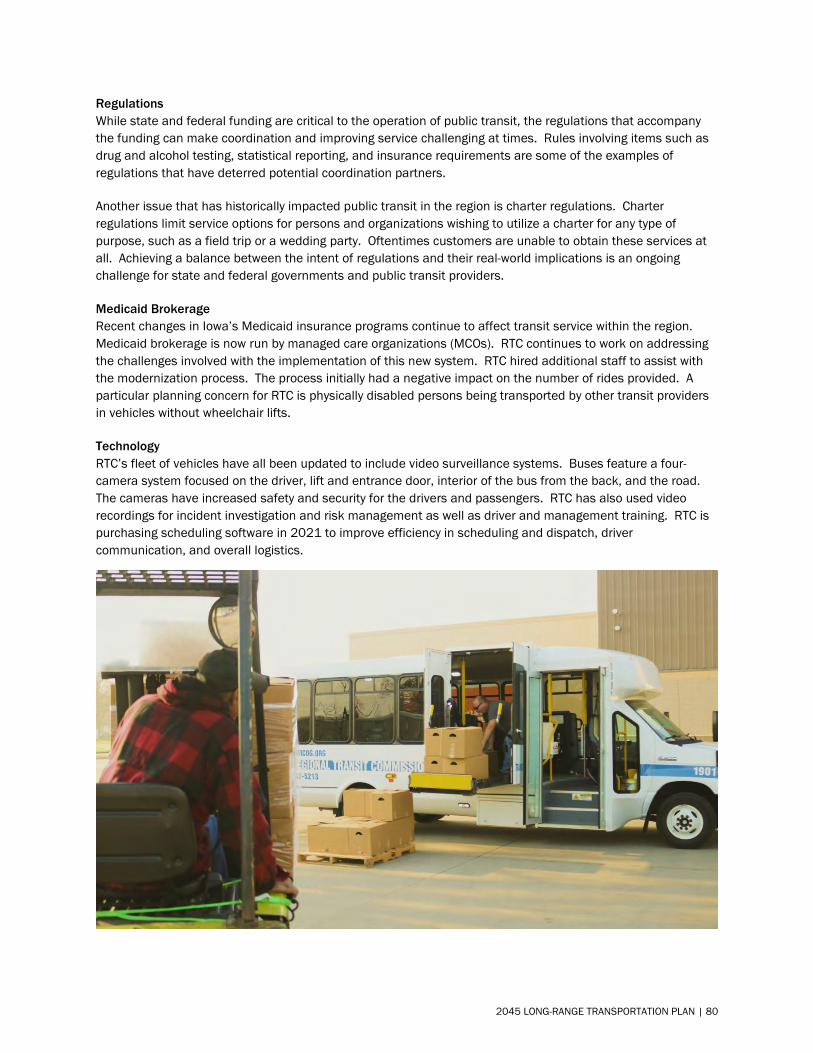
Regulations While state and federal funding are critical to the operation of public transit, the regulations that accompany the funding can make coordination and improving service challenging at times. Rules involving items such as drug and alcohol testing, statistical reporting, and insurance requirements are some of the examples of regulations that have deterred potential coordination partners.
Another issue that has historically impacted public transit in the region is charter regulations. Charter regulations limit service options for persons and organizations wishing to utilize a charter for any type of purpose, such as a field trip or a wedding party. Oftentimes customers are unable to obtain these services at all. Achieving a balance between the intent of regulations and their real-world implications is an ongoing challenge for state and federal governments and public transit providers.
Medicaid Brokerage Recent changes in Iowa’s Medicaid insurance programs continue to affect transit service within the region. Medicaid brokerage is now run by managed care organizations (MCOs). RTC continues to work on addressing the challenges involved with the implementation of this new system. RTC hired additional staff to assist with the modernization process. The process initially had a negative impact on the number of rides provided. A particular planning concern for RTC is physically disabled persons being transported by other transit providers in vehicles without wheelchair lifts.
Technology RTC’s fleet of vehicles have all been updated to include video surveillance systems. Buses feature a four-camera system focused on the driver, lift and entrance door, interior of the bus from the back, and the road. The cameras have increased safety and security for the drivers and passengers. RTC has also used video recordings for incident investigation and risk management as well as driver and management training. RTC is purchasing scheduling software in 2021 to improve efficiency in scheduling and dispatch, driver communication, and overall logistics.
2045 LONG-RANGE TRANSPORTATION PLAN | 80
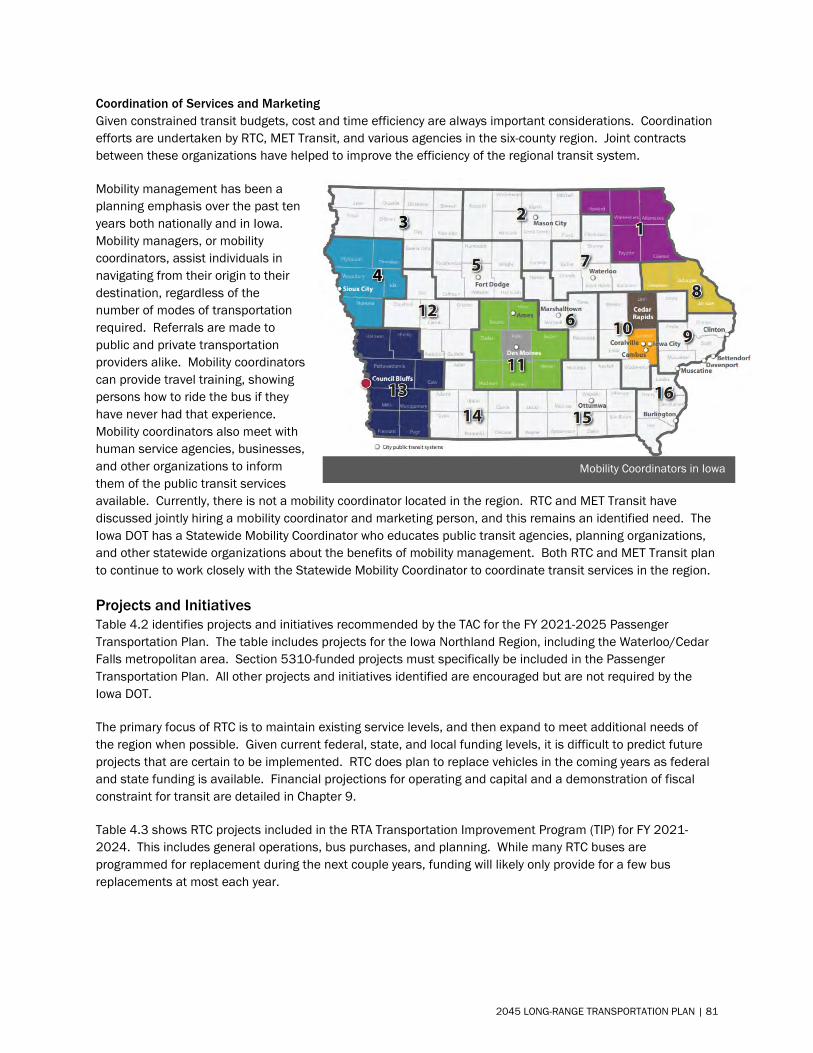
Coordination of Services and Marketing Given constrained transit budgets, cost and time efficiency are always important considerations. Coordination efforts are undertaken by RTC, MET Transit, and various agencies in the six-county region. Joint contracts between these organizations have helped to improve the efficiency of the regional transit system.
Mobility management has been a planning emphasis over the past ten years both nationally and in Iowa. Mobility managers, or mobility coordinators, assist individuals in navigating from their origin to their destination, regardless of the number of modes of transportation required. Referrals are made to public and private transportation providers alike. Mobility coordinators can provide travel training, showing persons how to ride the bus if they have never had that experience. Mobility coordinators also meet with human service agencies, businesses, and other organizations to inform them of the public transit services available. Currently, there is not a mobility coordinator located in the region. RTC and MET Transit have discussed jointly hiring a mobility coordinator and marketing person, and this remains an identified need. The Iowa DOT has a Statewide Mobility Coordinator who educates public transit agencies, planning organizations, and other statewide organizations about the benefits of mobility management. Both RTC and MET Transit plan to continue to work closely with the Statewide Mobility Coordinator to coordinate transit services in the region.
Projects and Initiatives Table 4.2 identifies projects and initiatives recommended by the TAC for the FY 2021-2025 Passenger Transportation Plan. The table includes projects for the Iowa Northland Region, including the Waterloo/Cedar Falls metropolitan area. Section 5310-funded projects must specifically be included in the Passenger Transportation Plan. All other projects and initiatives identified are encouraged but are not required by the Iowa DOT.
The primary focus of RTC is to maintain existing service levels, and then expand to meet additional needs of the region when possible. Given current federal, state, and local funding levels, it is difficult to predict future projects that are certain to be implemented. RTC does plan to replace vehicles in the coming years as federal and state funding is available. Financial projections for operating and capital and a demonstration of fiscal constraint for transit are detailed in Chapter 9.
Table 4.3 shows RTC projects included in the RTA Transportation Improvement Program (TIP) for FY 2021-2024. This includes general operations, bus purchases, and planning. While many RTC buses are programmed for replacement during the next couple years, funding will likely only provide for a few bus replacements at most each year.
Mobility Coordinators in Iowa
2045 LONG-RANGE TRANSPORTATION PLAN | 81
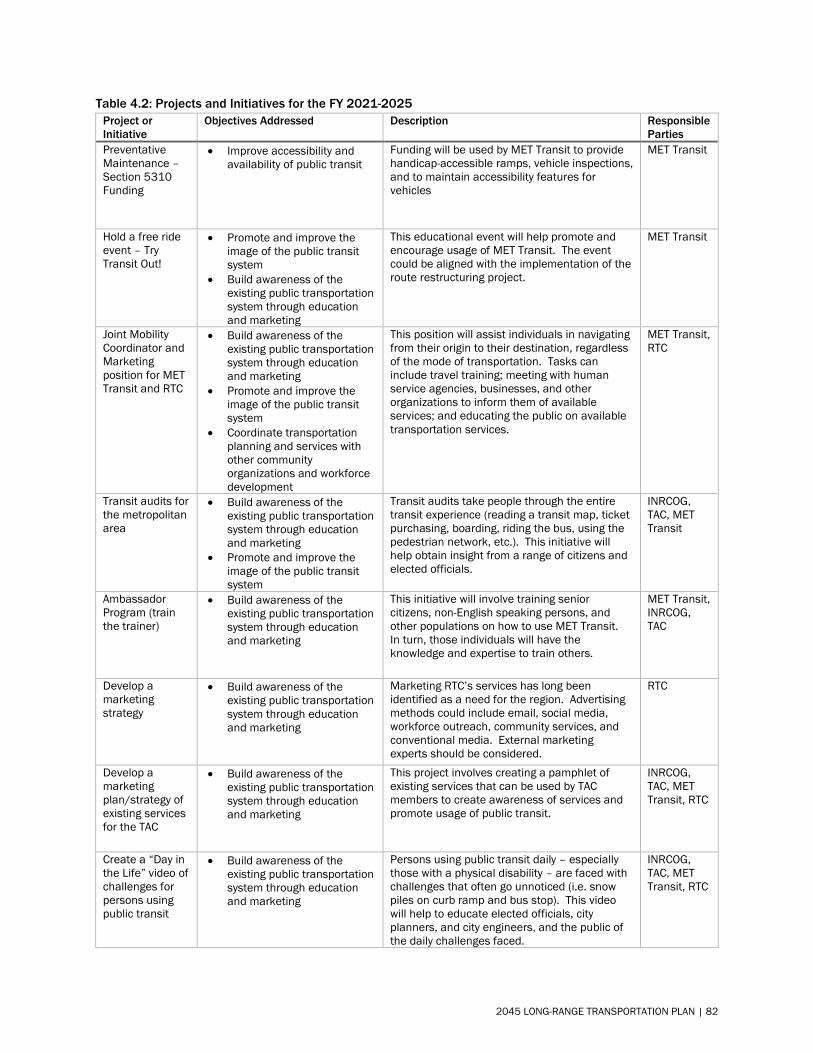
Table 4.2: Projects and Initiatives for the FY 2021-2025 Project or Initiative
Objectives Addressed Description Responsible Parties
Preventative Maintenance – Section 5310 Funding
• Improve accessibility andavailability of public transit
Funding will be used by MET Transit to provide handicap-accessible ramps, vehicle inspections, and to maintain accessibility features for vehicles
MET Transit
Hold a free ride event – Try Transit Out!
• Promote and improve theimage of the public transitsystem
• Build awareness of theexisting public transportationsystem through educationand marketing
This educational event will help promote and encourage usage of MET Transit. The event could be aligned with the implementation of the route restructuring project.
MET Transit
Joint Mobility Coordinator and Marketing position for MET Transit and RTC
• Build awareness of theexisting public transportationsystem through educationand marketing
• Promote and improve theimage of the public transitsystem
• Coordinate transportationplanning and services withother communityorganizations and workforcedevelopment
This position will assist individuals in navigating from their origin to their destination, regardless of the mode of transportation. Tasks can include travel training; meeting with human service agencies, businesses, and other organizations to inform them of available services; and educating the public on available transportation services.
MET Transit, RTC
Transit audits for the metropolitan area
• Build awareness of theexisting public transportationsystem through educationand marketing
• Promote and improve theimage of the public transitsystem
Transit audits take people through the entire transit experience (reading a transit map, ticket purchasing, boarding, riding the bus, using the pedestrian network, etc.). This initiative will help obtain insight from a range of citizens and elected officials.
INRCOG, TAC, MET Transit
Ambassador Program (train the trainer)
• Build awareness of theexisting public transportationsystem through educationand marketing
This initiative will involve training senior citizens, non-English speaking persons, and other populations on how to use MET Transit. In turn, those individuals will have the knowledge and expertise to train others.
MET Transit, INRCOG, TAC
Develop a marketing strategy
• Build awareness of theexisting public transportationsystem through educationand marketing
Marketing RTC’s services has long been identified as a need for the region. Advertising methods could include email, social media, workforce outreach, community services, and conventional media. External marketing experts should be considered.
RTC
Develop a marketing plan/strategy of existing services for the TAC
• Build awareness of theexisting public transportationsystem through educationand marketing
This project involves creating a pamphlet of existing services that can be used by TAC members to create awareness of services and promote usage of public transit.
INRCOG, TAC, MET Transit, RTC
Create a “Day in the Life” video of challenges for persons using public transit
• Build awareness of theexisting public transportationsystem through educationand marketing
Persons using public transit daily – especially those with a physical disability – are faced with challenges that often go unnoticed (i.e. snow piles on curb ramp and bus stop). This video will help to educate elected officials, city planners, and city engineers, and the public of the daily challenges faced.
INRCOG, TAC, MET Transit, RTC
2045 LONG-RANGE TRANSPORTATION PLAN | 82
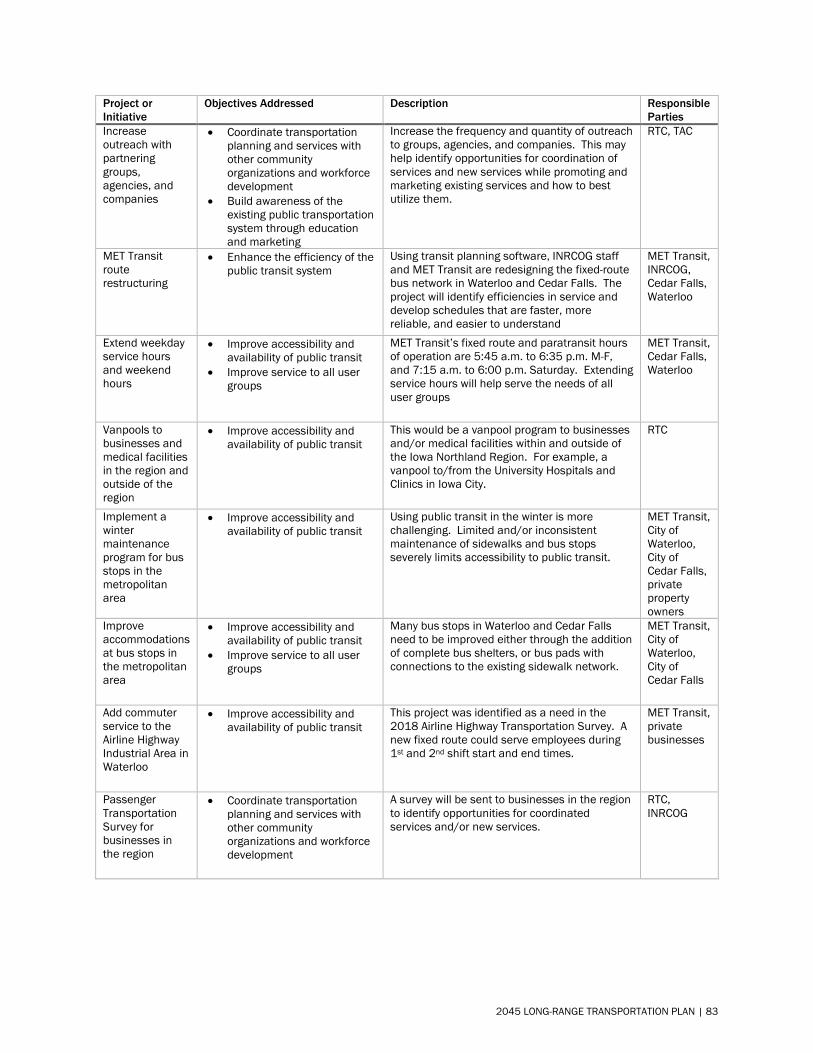
Project or Initiative
Objectives Addressed Description Responsible Parties
Increase outreach with partnering groups, agencies, and companies
• Coordinate transportationplanning and services withother communityorganizations and workforcedevelopment
• Build awareness of theexisting public transportationsystem through educationand marketing
Increase the frequency and quantity of outreach to groups, agencies, and companies. This may help identify opportunities for coordination of services and new services while promoting and marketing existing services and how to best utilize them.
RTC, TAC
MET Transit route restructuring
• Enhance the efficiency of thepublic transit system
Using transit planning software, INRCOG staff and MET Transit are redesigning the fixed-route bus network in Waterloo and Cedar Falls. The project will identify efficiencies in service and develop schedules that are faster, more reliable, and easier to understand
MET Transit, INRCOG, Cedar Falls, Waterloo
Extend weekday service hours and weekend hours
• Improve accessibility andavailability of public transit
• Improve service to all usergroups
MET Transit’s fixed route and paratransit hours of operation are 5:45 a.m. to 6:35 p.m. M-F, and 7:15 a.m. to 6:00 p.m. Saturday. Extending service hours will help serve the needs of all user groups
MET Transit, Cedar Falls, Waterloo
Vanpools to businesses and medical facilities in the region and outside of the region
• Improve accessibility andavailability of public transit
This would be a vanpool program to businesses and/or medical facilities within and outside of the Iowa Northland Region. For example, a vanpool to/from the University Hospitals and Clinics in Iowa City.
RTC
Implement a winter maintenance program for bus stops in the metropolitan area
• Improve accessibility andavailability of public transit
Using public transit in the winter is more challenging. Limited and/or inconsistent maintenance of sidewalks and bus stops severely limits accessibility to public transit.
MET Transit, City of Waterloo, City of Cedar Falls, private property owners
Improve accommodations at bus stops in the metropolitan area
• Improve accessibility andavailability of public transit
• Improve service to all usergroups
Many bus stops in Waterloo and Cedar Falls need to be improved either through the addition of complete bus shelters, or bus pads with connections to the existing sidewalk network.
MET Transit, City of Waterloo, City of Cedar Falls
Add commuter service to the Airline Highway Industrial Area in Waterloo
• Improve accessibility andavailability of public transit
This project was identified as a need in the 2018 Airline Highway Transportation Survey. A new fixed route could serve employees during 1st and 2nd shift start and end times.
MET Transit, private businesses
Passenger Transportation Survey for businesses in the region
• Coordinate transportationplanning and services withother communityorganizations and workforcedevelopment
A survey will be sent to businesses in the region to identify opportunities for coordinated services and/or new services.
RTC, INRCOG
2045 LONG-RANGE TRANSPORTATION PLAN | 83
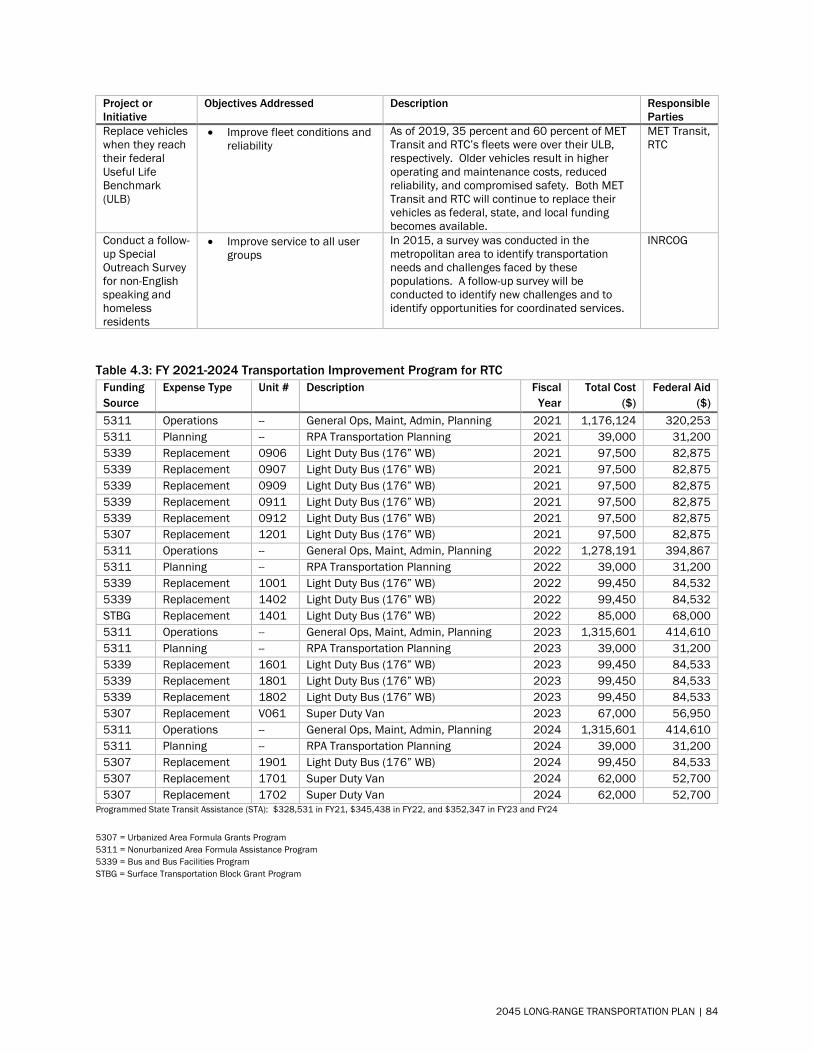
Project or Initiative
Objectives Addressed Description Responsible Parties
Replace vehicles when they reach their federal Useful Life Benchmark (ULB)
• Improve fleet conditions andreliability
As of 2019, 35 percent and 60 percent of MET Transit and RTC’s fleets were over their ULB, respectively. Older vehicles result in higher operating and maintenance costs, reduced reliability, and compromised safety. Both MET Transit and RTC will continue to replace their vehicles as federal, state, and local funding becomes available.
MET Transit, RTC
Conduct a follow-up Special Outreach Survey for non-English speaking and homeless residents
• Improve service to all usergroups
In 2015, a survey was conducted in the metropolitan area to identify transportation needs and challenges faced by these populations. A follow-up survey will be conducted to identify new challenges and to identify opportunities for coordinated services.
INRCOG
Table 4.3: FY 2021-2024 Transportation Improvement Program for RTC Funding Source
Expense Type Unit # Description Fiscal Year
Total Cost ($)
Federal Aid ($)
5311 Operations -- General Ops, Maint, Admin, Planning 2021 1,176,124 320,253 5311 Planning -- RPA Transportation Planning 2021 39,000 31,200 5339 Replacement 0906 Light Duty Bus (176” WB) 2021 97,500 82,875 5339 Replacement 0907 Light Duty Bus (176” WB) 2021 97,500 82,875 5339 Replacement 0909 Light Duty Bus (176” WB) 2021 97,500 82,875 5339 Replacement 0911 Light Duty Bus (176” WB) 2021 97,500 82,875 5339 Replacement 0912 Light Duty Bus (176” WB) 2021 97,500 82,875 5307 Replacement 1201 Light Duty Bus (176” WB) 2021 97,500 82,875 5311 Operations -- General Ops, Maint, Admin, Planning 2022 1,278,191 394,867 5311 Planning -- RPA Transportation Planning 2022 39,000 31,200 5339 Replacement 1001 Light Duty Bus (176” WB) 2022 99,450 84,532 5339 Replacement 1402 Light Duty Bus (176” WB) 2022 99,450 84,532 STBG Replacement 1401 Light Duty Bus (176” WB) 2022 85,000 68,000 5311 Operations -- General Ops, Maint, Admin, Planning 2023 1,315,601 414,610 5311 Planning -- RPA Transportation Planning 2023 39,000 31,200 5339 Replacement 1601 Light Duty Bus (176” WB) 2023 99,450 84,533 5339 Replacement 1801 Light Duty Bus (176” WB) 2023 99,450 84,533 5339 Replacement 1802 Light Duty Bus (176” WB) 2023 99,450 84,533 5307 Replacement V061 Super Duty Van 2023 67,000 56,950 5311 Operations -- General Ops, Maint, Admin, Planning 2024 1,315,601 414,610 5311 Planning -- RPA Transportation Planning 2024 39,000 31,200 5307 Replacement 1901 Light Duty Bus (176” WB) 2024 99,450 84,533 5307 Replacement 1701 Super Duty Van 2024 62,000 52,700 5307 Replacement 1702 Super Duty Van 2024 62,000 52,700
Programmed State Transit Assistance (STA): $328,531 in FY21, $345,438 in FY22, and $352,347 in FY23 and FY24
5307 = Urbanized Area Formula Grants Program 5311 = Nonurbanized Area Formula Assistance Program 5339 = Bus and Bus Facilities Program STBG = Surface Transportation Block Grant Program
2045 LONG-RANGE TRANSPORTATION PLAN | 84
Chapter 5
Bicycle and Pedestrian
2045 LONG-RANGE TRANSPORTATION PLAN | 85
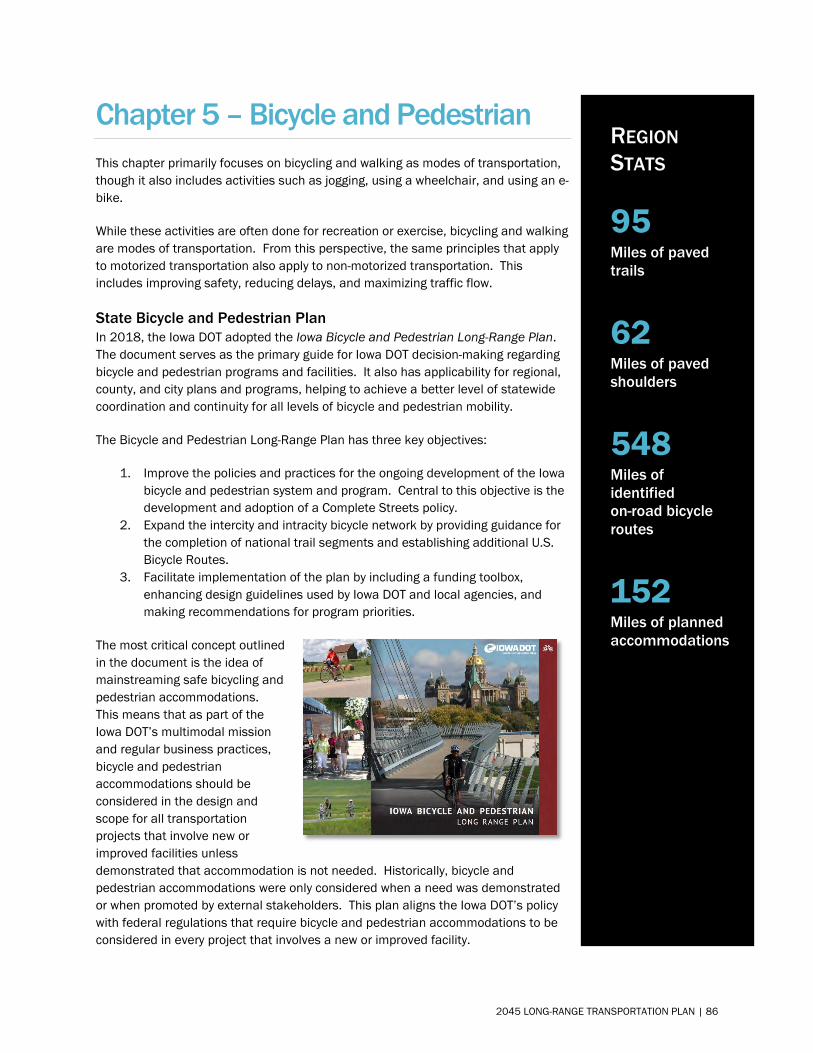
Chapter 5 – Bicycle and Pedestrian This chapter primarily focuses on bicycling and walking as modes of transportation, though it also includes activities such as jogging, using a wheelchair, and using an e-bike.
While these activities are often done for recreation or exercise, bicycling and walking are modes of transportation. From this perspective, the same principles that apply to motorized transportation also apply to non-motorized transportation. This includes improving safety, reducing delays, and maximizing traffic flow.
State Bicycle and Pedestrian Plan In 2018, the Iowa DOT adopted the Iowa Bicycle and Pedestrian Long-Range Plan. The document serves as the primary guide for Iowa DOT decision-making regarding bicycle and pedestrian programs and facilities. It also has applicability for regional, county, and city plans and programs, helping to achieve a better level of statewide coordination and continuity for all levels of bicycle and pedestrian mobility.
The Bicycle and Pedestrian Long-Range Plan has three key objectives:
1. Improve the policies and practices for the ongoing development of the Iowabicycle and pedestrian system and program. Central to this objective is thedevelopment and adoption of a Complete Streets policy.
2. Expand the intercity and intracity bicycle network by providing guidance forthe completion of national trail segments and establishing additional U.S.Bicycle Routes.
3. Facilitate implementation of the plan by including a funding toolbox,enhancing design guidelines used by Iowa DOT and local agencies, andmaking recommendations for program priorities.
The most critical concept outlined in the document is the idea of mainstreaming safe bicycling and pedestrian accommodations. This means that as part of the Iowa DOT’s multimodal mission and regular business practices, bicycle and pedestrian accommodations should be considered in the design and scope for all transportation projects that involve new or improved facilities unless demonstrated that accommodation is not needed. Historically, bicycle and pedestrian accommodations were only considered when a need was demonstrated or when promoted by external stakeholders. This plan aligns the Iowa DOT’s policy with federal regulations that require bicycle and pedestrian accommodations to be considered in every project that involves a new or improved facility.
REGION STATS
95 Miles of paved trails
62 Miles of paved shoulders
548 Miles of identified on-road bicycle routes
152 Miles of planned accommodations
2045 LONG-RANGE TRANSPORTATION PLAN | 86
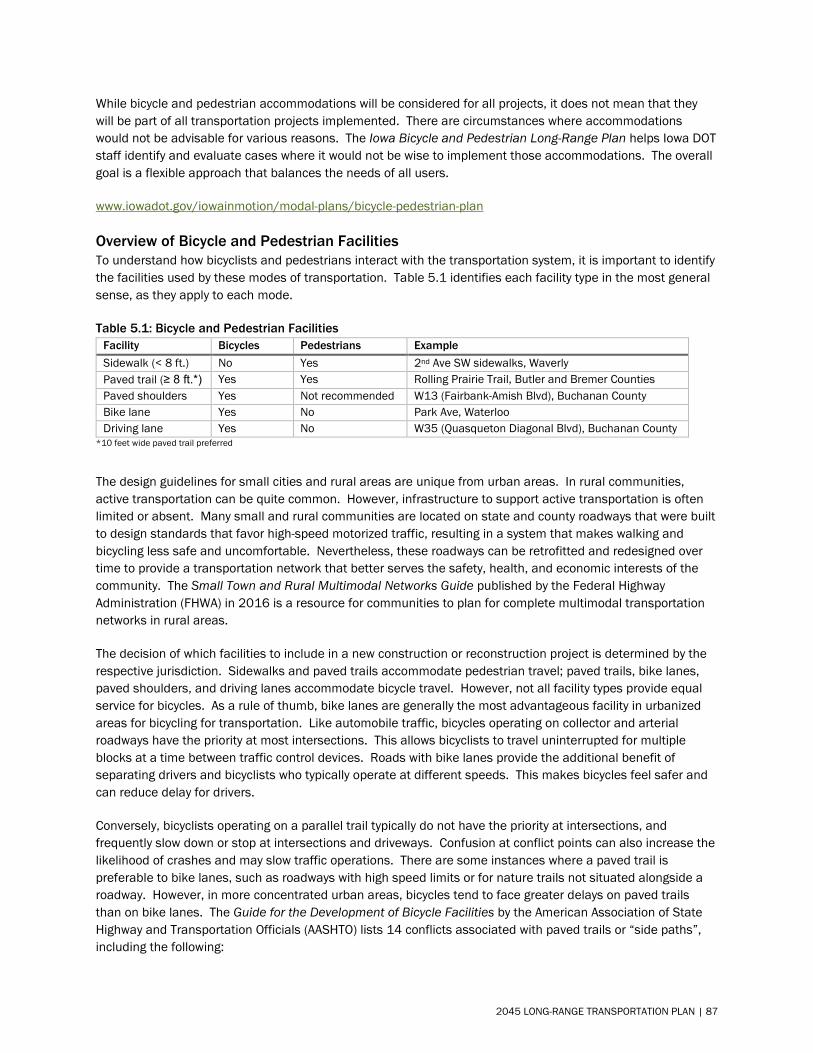
While bicycle and pedestrian accommodations will be considered for all projects, it does not mean that they will be part of all transportation projects implemented. There are circumstances where accommodations would not be advisable for various reasons. The Iowa Bicycle and Pedestrian Long-Range Plan helps Iowa DOT staff identify and evaluate cases where it would not be wise to implement those accommodations. The overall goal is a flexible approach that balances the needs of all users.
www.iowadot.gov/iowainmotion/modal-plans/bicycle-pedestrian-plan
Overview of Bicycle and Pedestrian Facilities To understand how bicyclists and pedestrians interact with the transportation system, it is important to identify the facilities used by these modes of transportation. Table 5.1 identifies each facility type in the most general sense, as they apply to each mode.
Table 5.1: Bicycle and Pedestrian Facilities Facility Bicycles Pedestrians Example Sidewalk (< 8 ft.) No Yes 2nd Ave SW sidewalks, Waverly Paved trail (≥ 8 ft.*) Yes Yes Rolling Prairie Trail, Butler and Bremer Counties Paved shoulders Yes Not recommended W13 (Fairbank-Amish Blvd), Buchanan County Bike lane Yes No Park Ave, Waterloo Driving lane Yes No W35 (Quasqueton Diagonal Blvd), Buchanan County
*10 feet wide paved trail preferred
The design guidelines for small cities and rural areas are unique from urban areas. In rural communities, active transportation can be quite common. However, infrastructure to support active transportation is often limited or absent. Many small and rural communities are located on state and county roadways that were built to design standards that favor high-speed motorized traffic, resulting in a system that makes walking and bicycling less safe and uncomfortable. Nevertheless, these roadways can be retrofitted and redesigned over time to provide a transportation network that better serves the safety, health, and economic interests of the community. The Small Town and Rural Multimodal Networks Guide published by the Federal Highway Administration (FHWA) in 2016 is a resource for communities to plan for complete multimodal transportation networks in rural areas.
The decision of which facilities to include in a new construction or reconstruction project is determined by the respective jurisdiction. Sidewalks and paved trails accommodate pedestrian travel; paved trails, bike lanes, paved shoulders, and driving lanes accommodate bicycle travel. However, not all facility types provide equal service for bicycles. As a rule of thumb, bike lanes are generally the most advantageous facility in urbanized areas for bicycling for transportation. Like automobile traffic, bicycles operating on collector and arterial roadways have the priority at most intersections. This allows bicyclists to travel uninterrupted for multiple blocks at a time between traffic control devices. Roads with bike lanes provide the additional benefit of separating drivers and bicyclists who typically operate at different speeds. This makes bicycles feel safer and can reduce delay for drivers.
Conversely, bicyclists operating on a parallel trail typically do not have the priority at intersections, and frequently slow down or stop at intersections and driveways. Confusion at conflict points can also increase the likelihood of crashes and may slow traffic operations. There are some instances where a paved trail is preferable to bike lanes, such as roadways with high speed limits or for nature trails not situated alongside a roadway. However, in more concentrated urban areas, bicycles tend to face greater delays on paved trails than on bike lanes. The Guide for the Development of Bicycle Facilities by the American Association of State Highway and Transportation Officials (AASHTO) lists 14 conflicts associated with paved trails or “side paths”, including the following:
2045 LONG-RANGE TRANSPORTATION PLAN | 87
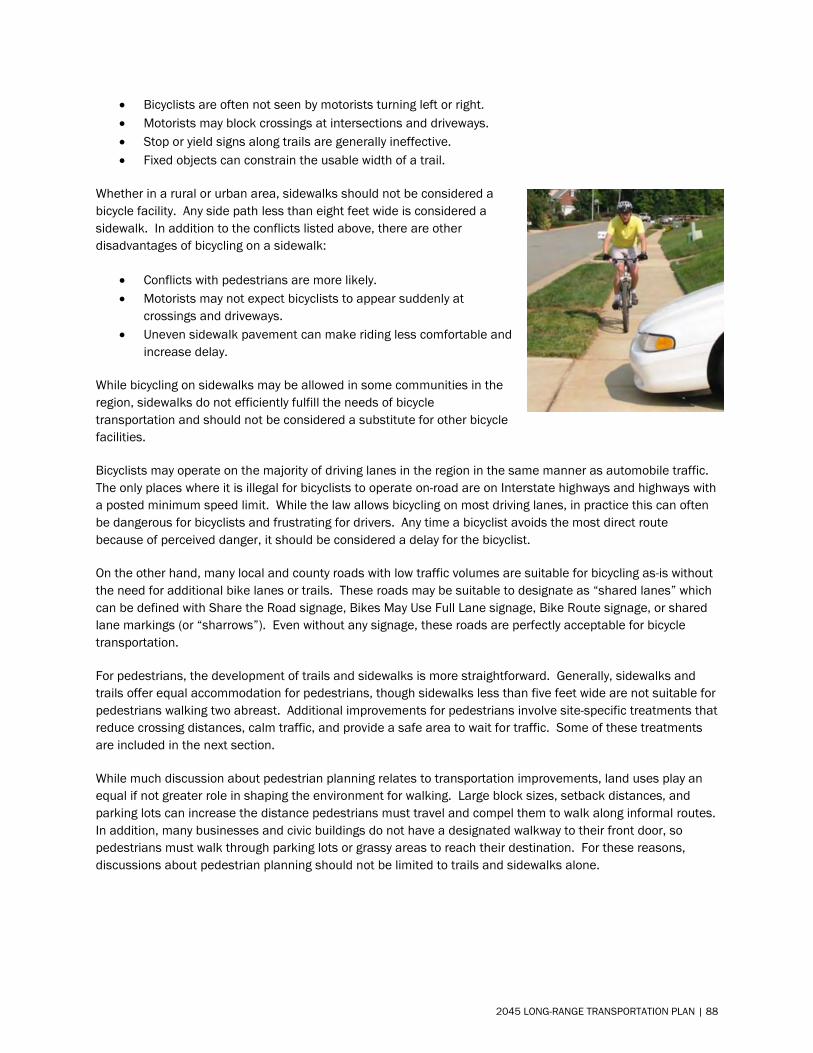
• Bicyclists are often not seen by motorists turning left or right.• Motorists may block crossings at intersections and driveways.• Stop or yield signs along trails are generally ineffective.• Fixed objects can constrain the usable width of a trail.
Whether in a rural or urban area, sidewalks should not be considered a bicycle facility. Any side path less than eight feet wide is considered a sidewalk. In addition to the conflicts listed above, there are other disadvantages of bicycling on a sidewalk:
• Conflicts with pedestrians are more likely.• Motorists may not expect bicyclists to appear suddenly at
crossings and driveways.• Uneven sidewalk pavement can make riding less comfortable and
increase delay.
While bicycling on sidewalks may be allowed in some communities in the region, sidewalks do not efficiently fulfill the needs of bicycle transportation and should not be considered a substitute for other bicycle facilities.
Bicyclists may operate on the majority of driving lanes in the region in the same manner as automobile traffic. The only places where it is illegal for bicyclists to operate on-road are on Interstate highways and highways with a posted minimum speed limit. While the law allows bicycling on most driving lanes, in practice this can often be dangerous for bicyclists and frustrating for drivers. Any time a bicyclist avoids the most direct route because of perceived danger, it should be considered a delay for the bicyclist.
On the other hand, many local and county roads with low traffic volumes are suitable for bicycling as-is without the need for additional bike lanes or trails. These roads may be suitable to designate as “shared lanes” which can be defined with Share the Road signage, Bikes May Use Full Lane signage, Bike Route signage, or shared lane markings (or “sharrows”). Even without any signage, these roads are perfectly acceptable for bicycle transportation.
For pedestrians, the development of trails and sidewalks is more straightforward. Generally, sidewalks and trails offer equal accommodation for pedestrians, though sidewalks less than five feet wide are not suitable for pedestrians walking two abreast. Additional improvements for pedestrians involve site-specific treatments that reduce crossing distances, calm traffic, and provide a safe area to wait for traffic. Some of these treatments are included in the next section.
While much discussion about pedestrian planning relates to transportation improvements, land uses play an equal if not greater role in shaping the environment for walking. Large block sizes, setback distances, and parking lots can increase the distance pedestrians must travel and compel them to walk along informal routes. In addition, many businesses and civic buildings do not have a designated walkway to their front door, so pedestrians must walk through parking lots or grassy areas to reach their destination. For these reasons, discussions about pedestrian planning should not be limited to trails and sidewalks alone.
2045 LONG-RANGE TRANSPORTATION PLAN | 88
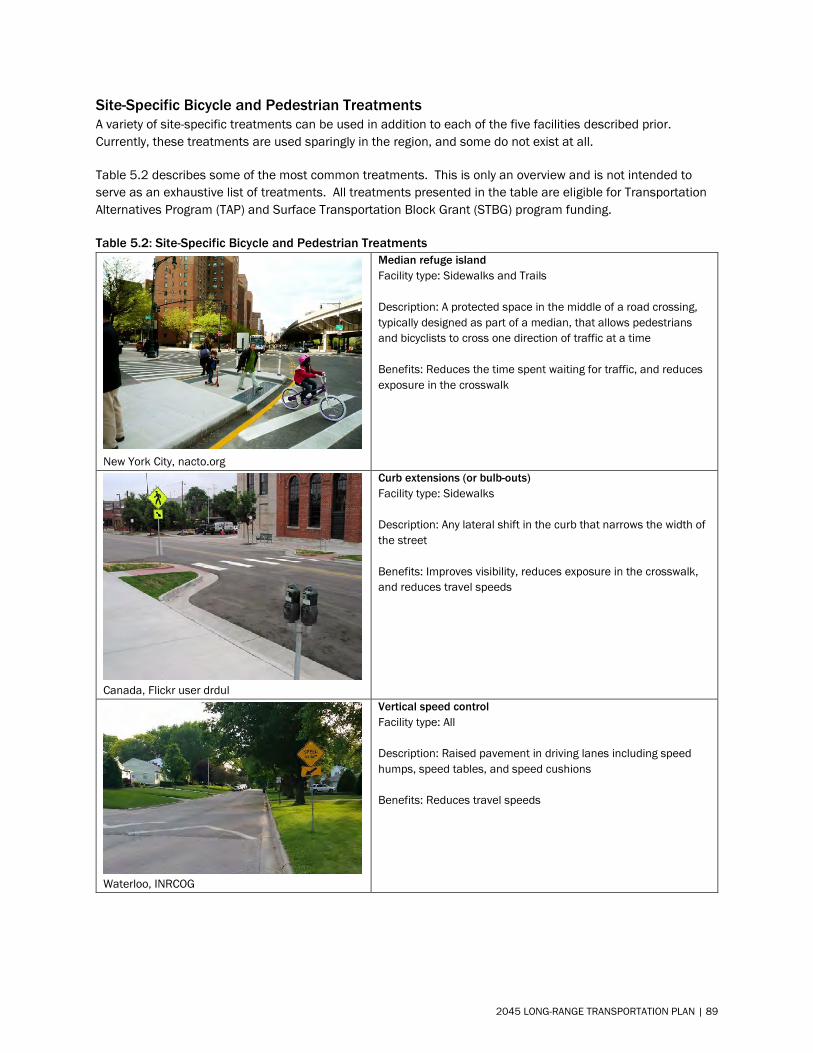
Site-Specific Bicycle and Pedestrian Treatments A variety of site-specific treatments can be used in addition to each of the five facilities described prior. Currently, these treatments are used sparingly in the region, and some do not exist at all.
Table 5.2 describes some of the most common treatments. This is only an overview and is not intended to serve as an exhaustive list of treatments. All treatments presented in the table are eligible for Transportation Alternatives Program (TAP) and Surface Transportation Block Grant (STBG) program funding.
Table 5.2: Site-Specific Bicycle and Pedestrian Treatments
New York City, nacto.org
Median refuge island Facility type: Sidewalks and Trails
Description: A protected space in the middle of a road crossing, typically designed as part of a median, that allows pedestrians and bicyclists to cross one direction of traffic at a time
Benefits: Reduces the time spent waiting for traffic, and reduces exposure in the crosswalk
Canada, Flickr user drdul
Curb extensions (or bulb-outs) Facility type: Sidewalks
Description: Any lateral shift in the curb that narrows the width of the street
Benefits: Improves visibility, reduces exposure in the crosswalk, and reduces travel speeds
Waterloo, INRCOG
Vertical speed control Facility type: All
Description: Raised pavement in driving lanes including speed humps, speed tables, and speed cushions
Benefits: Reduces travel speeds
2045 LONG-RANGE TRANSPORTATION PLAN | 89
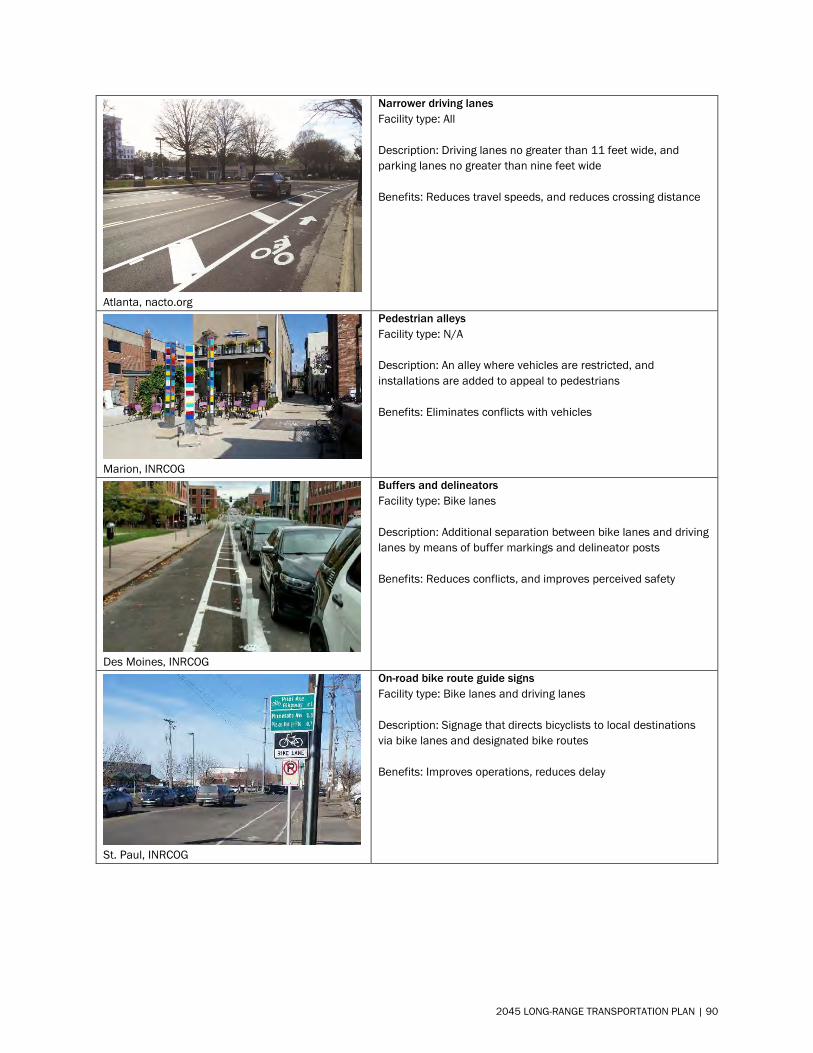
Atlanta, nacto.org
Narrower driving lanes Facility type: All
Description: Driving lanes no greater than 11 feet wide, and parking lanes no greater than nine feet wide
Benefits: Reduces travel speeds, and reduces crossing distance
Marion, INRCOG
Pedestrian alleys Facility type: N/A
Description: An alley where vehicles are restricted, and installations are added to appeal to pedestrians
Benefits: Eliminates conflicts with vehicles
Des Moines, INRCOG
Buffers and delineators Facility type: Bike lanes
Description: Additional separation between bike lanes and driving lanes by means of buffer markings and delineator posts
Benefits: Reduces conflicts, and improves perceived safety
St. Paul, INRCOG
On-road bike route guide signs Facility type: Bike lanes and driving lanes
Description: Signage that directs bicyclists to local destinations via bike lanes and designated bike routes
Benefits: Improves operations, reduces delay
2045 LONG-RANGE TRANSPORTATION PLAN | 90
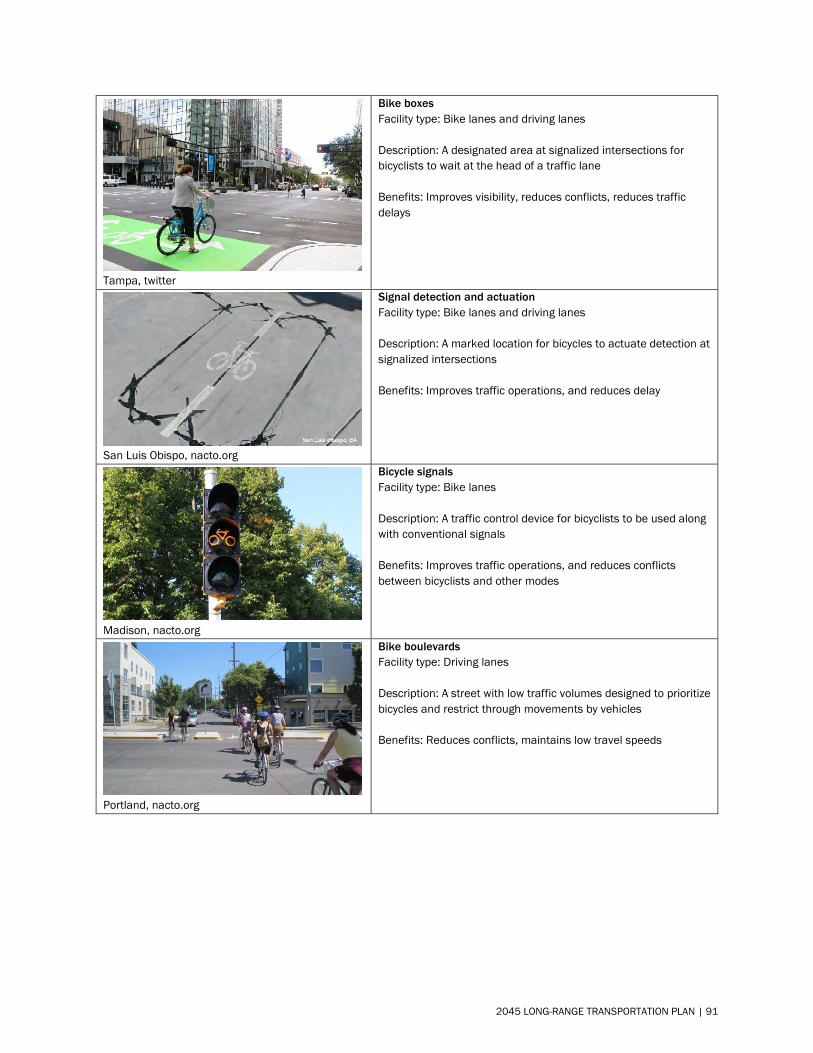
Tampa, twitter
Bike boxes Facility type: Bike lanes and driving lanes Description: A designated area at signalized intersections for bicyclists to wait at the head of a traffic lane Benefits: Improves visibility, reduces conflicts, reduces traffic delays
San Luis Obispo, nacto.org
Signal detection and actuation Facility type: Bike lanes and driving lanes Description: A marked location for bicycles to actuate detection at signalized intersections Benefits: Improves traffic operations, and reduces delay
Madison, nacto.org
Bicycle signals Facility type: Bike lanes Description: A traffic control device for bicyclists to be used along with conventional signals Benefits: Improves traffic operations, and reduces conflicts between bicyclists and other modes
Portland, nacto.org
Bike boulevards Facility type: Driving lanes Description: A street with low traffic volumes designed to prioritize bicycles and restrict through movements by vehicles Benefits: Reduces conflicts, maintains low travel speeds
2045 LONG-RANGE TRANSPORTATION PLAN | 91
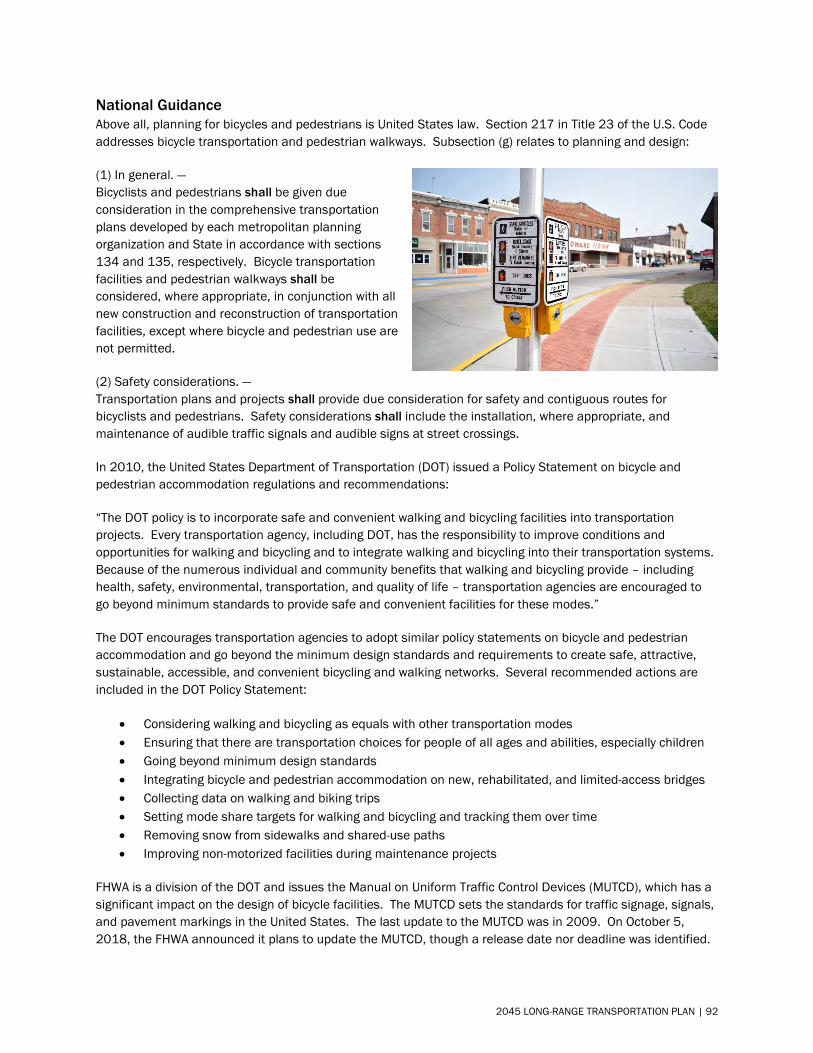
National Guidance Above all, planning for bicycles and pedestrians is United States law. Section 217 in Title 23 of the U.S. Code addresses bicycle transportation and pedestrian walkways. Subsection (g) relates to planning and design:
(1) In general. —Bicyclists and pedestrians shall be given dueconsideration in the comprehensive transportationplans developed by each metropolitan planningorganization and State in accordance with sections134 and 135, respectively. Bicycle transportationfacilities and pedestrian walkways shall beconsidered, where appropriate, in conjunction with allnew construction and reconstruction of transportationfacilities, except where bicycle and pedestrian use arenot permitted.
(2) Safety considerations. —Transportation plans and projects shall provide due consideration for safety and contiguous routes forbicyclists and pedestrians. Safety considerations shall include the installation, where appropriate, andmaintenance of audible traffic signals and audible signs at street crossings.
In 2010, the United States Department of Transportation (DOT) issued a Policy Statement on bicycle and pedestrian accommodation regulations and recommendations:
“The DOT policy is to incorporate safe and convenient walking and bicycling facilities into transportation projects. Every transportation agency, including DOT, has the responsibility to improve conditions and opportunities for walking and bicycling and to integrate walking and bicycling into their transportation systems. Because of the numerous individual and community benefits that walking and bicycling provide – including health, safety, environmental, transportation, and quality of life – transportation agencies are encouraged to go beyond minimum standards to provide safe and convenient facilities for these modes.”
The DOT encourages transportation agencies to adopt similar policy statements on bicycle and pedestrian accommodation and go beyond the minimum design standards and requirements to create safe, attractive, sustainable, accessible, and convenient bicycling and walking networks. Several recommended actions are included in the DOT Policy Statement:
• Considering walking and bicycling as equals with other transportation modes• Ensuring that there are transportation choices for people of all ages and abilities, especially children• Going beyond minimum design standards• Integrating bicycle and pedestrian accommodation on new, rehabilitated, and limited-access bridges• Collecting data on walking and biking trips• Setting mode share targets for walking and bicycling and tracking them over time• Removing snow from sidewalks and shared-use paths• Improving non-motorized facilities during maintenance projects
FHWA is a division of the DOT and issues the Manual on Uniform Traffic Control Devices (MUTCD), which has a significant impact on the design of bicycle facilities. The MUTCD sets the standards for traffic signage, signals, and pavement markings in the United States. The last update to the MUTCD was in 2009. On October 5, 2018, the FHWA announced it plans to update the MUTCD, though a release date nor deadline was identified.
2045 LONG-RANGE TRANSPORTATION PLAN | 92
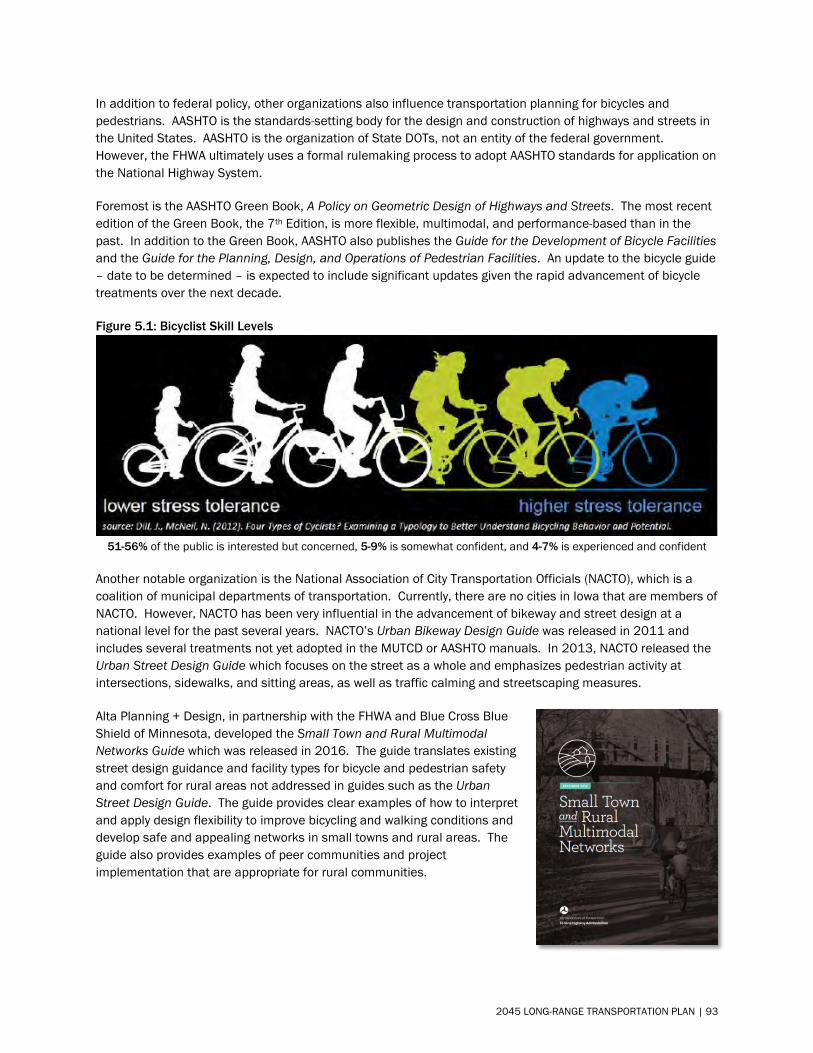
In addition to federal policy, other organizations also influence transportation planning for bicycles and pedestrians. AASHTO is the standards-setting body for the design and construction of highways and streets in the United States. AASHTO is the organization of State DOTs, not an entity of the federal government. However, the FHWA ultimately uses a formal rulemaking process to adopt AASHTO standards for application on the National Highway System.
Foremost is the AASHTO Green Book, A Policy on Geometric Design of Highways and Streets. The most recent edition of the Green Book, the 7th Edition, is more flexible, multimodal, and performance-based than in the past. In addition to the Green Book, AASHTO also publishes the Guide for the Development of Bicycle Facilities and the Guide for the Planning, Design, and Operations of Pedestrian Facilities. An update to the bicycle guide – date to be determined – is expected to include significant updates given the rapid advancement of bicycletreatments over the next decade.
Figure 5.1: Bicyclist Skill Levels
51-56% of the public is interested but concerned, 5-9% is somewhat confident, and 4-7% is experienced and confident
Another notable organization is the National Association of City Transportation Officials (NACTO), which is a coalition of municipal departments of transportation. Currently, there are no cities in Iowa that are members of NACTO. However, NACTO has been very influential in the advancement of bikeway and street design at a national level for the past several years. NACTO’s Urban Bikeway Design Guide was released in 2011 and includes several treatments not yet adopted in the MUTCD or AASHTO manuals. In 2013, NACTO released the Urban Street Design Guide which focuses on the street as a whole and emphasizes pedestrian activity at intersections, sidewalks, and sitting areas, as well as traffic calming and streetscaping measures.
Alta Planning + Design, in partnership with the FHWA and Blue Cross Blue Shield of Minnesota, developed the Small Town and Rural Multimodal Networks Guide which was released in 2016. The guide translates existing street design guidance and facility types for bicycle and pedestrian safety and comfort for rural areas not addressed in guides such as the Urban Street Design Guide. The guide provides clear examples of how to interpret and apply design flexibility to improve bicycling and walking conditions and develop safe and appealing networks in small towns and rural areas. The guide also provides examples of peer communities and project implementation that are appropriate for rural communities.
2045 LONG-RANGE TRANSPORTATION PLAN | 93
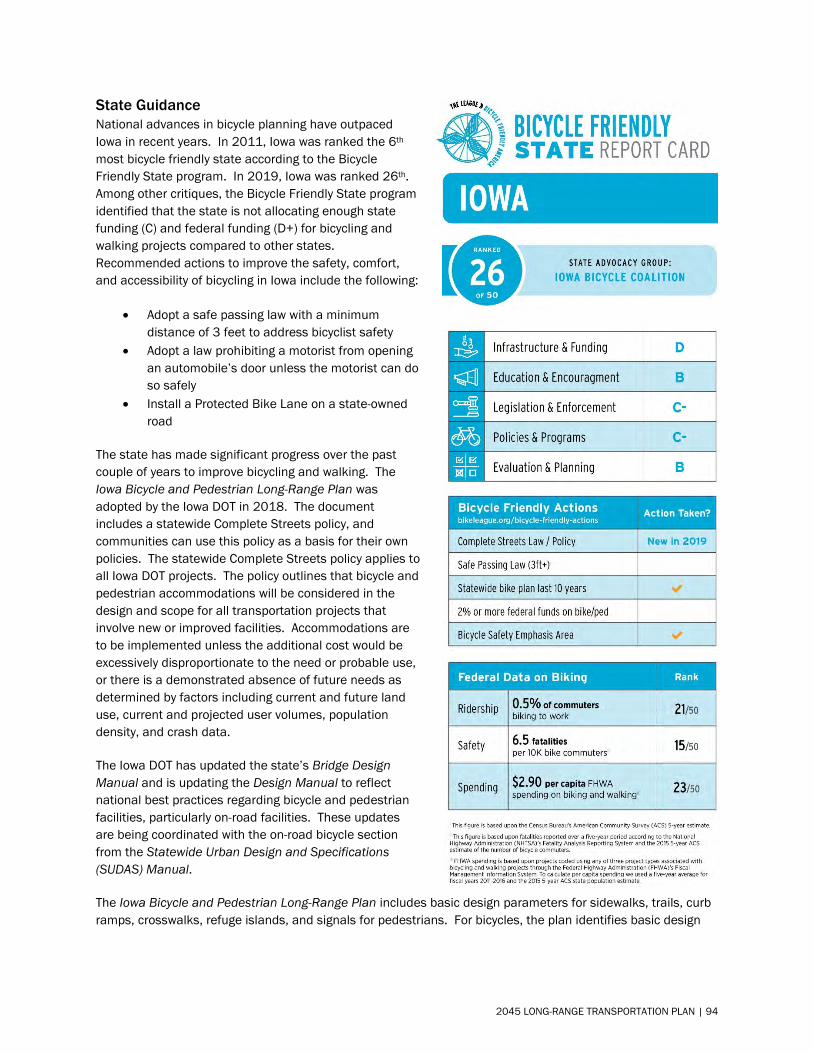
State Guidance National advances in bicycle planning have outpaced Iowa in recent years. In 2011, Iowa was ranked the 6th most bicycle friendly state according to the Bicycle Friendly State program. In 2019, Iowa was ranked 26th. Among other critiques, the Bicycle Friendly State program identified that the state is not allocating enough state funding (C) and federal funding (D+) for bicycling and walking projects compared to other states. Recommended actions to improve the safety, comfort, and accessibility of bicycling in Iowa include the following:
• Adopt a safe passing law with a minimumdistance of 3 feet to address bicyclist safety
• Adopt a law prohibiting a motorist from openingan automobile’s door unless the motorist can doso safely
• Install a Protected Bike Lane on a state-ownedroad
The state has made significant progress over the past couple of years to improve bicycling and walking. The Iowa Bicycle and Pedestrian Long-Range Plan was adopted by the Iowa DOT in 2018. The document includes a statewide Complete Streets policy, and communities can use this policy as a basis for their own policies. The statewide Complete Streets policy applies to all Iowa DOT projects. The policy outlines that bicycle and pedestrian accommodations will be considered in the design and scope for all transportation projects that involve new or improved facilities. Accommodations are to be implemented unless the additional cost would be excessively disproportionate to the need or probable use, or there is a demonstrated absence of future needs as determined by factors including current and future land use, current and projected user volumes, population density, and crash data.
The Iowa DOT has updated the state’s Bridge Design Manual and is updating the Design Manual to reflect national best practices regarding bicycle and pedestrian facilities, particularly on-road facilities. These updates are being coordinated with the on-road bicycle section from the Statewide Urban Design and Specifications (SUDAS) Manual.
The Iowa Bicycle and Pedestrian Long-Range Plan includes basic design parameters for sidewalks, trails, curb ramps, crosswalks, refuge islands, and signals for pedestrians. For bicycles, the plan identifies basic design
2045 LONG-RANGE TRANSPORTATION PLAN | 94
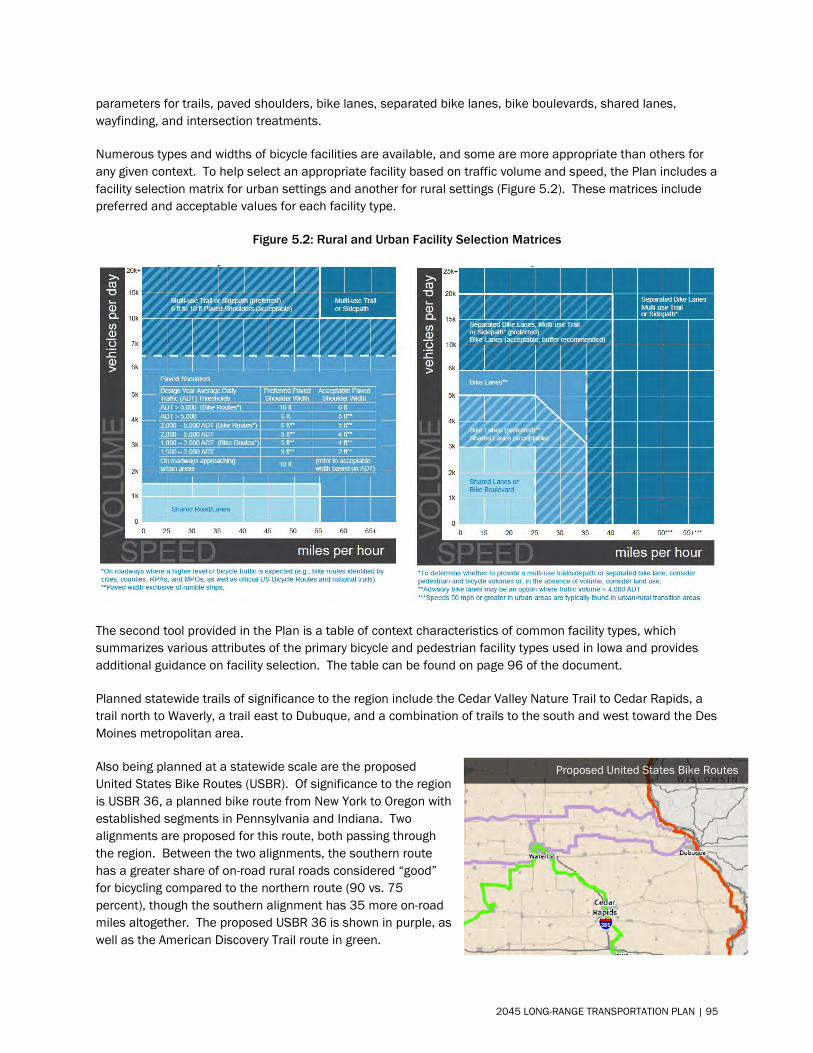
parameters for trails, paved shoulders, bike lanes, separated bike lanes, bike boulevards, shared lanes, wayfinding, and intersection treatments.
Numerous types and widths of bicycle facilities are available, and some are more appropriate than others for any given context. To help select an appropriate facility based on traffic volume and speed, the Plan includes a facility selection matrix for urban settings and another for rural settings (Figure 5.2). These matrices include preferred and acceptable values for each facility type.
Figure 5.2: Rural and Urban Facility Selection Matrices
The second tool provided in the Plan is a table of context characteristics of common facility types, which summarizes various attributes of the primary bicycle and pedestrian facility types used in Iowa and provides additional guidance on facility selection. The table can be found on page 96 of the document.
Planned statewide trails of significance to the region include the Cedar Valley Nature Trail to Cedar Rapids, a trail north to Waverly, a trail east to Dubuque, and a combination of trails to the south and west toward the Des Moines metropolitan area.
Also being planned at a statewide scale are the proposed United States Bike Routes (USBR). Of significance to the region is USBR 36, a planned bike route from New York to Oregon with established segments in Pennsylvania and Indiana. Two alignments are proposed for this route, both passing through the region. Between the two alignments, the southern route has a greater share of on-road rural roads considered “good” for bicycling compared to the northern route (90 vs. 75 percent), though the southern alignment has 35 more on-road miles altogether. The proposed USBR 36 is shown in purple, as well as the American Discovery Trail route in green.
Proposed United States Bike Routes
2045 LONG-RANGE TRANSPORTATION PLAN | 95
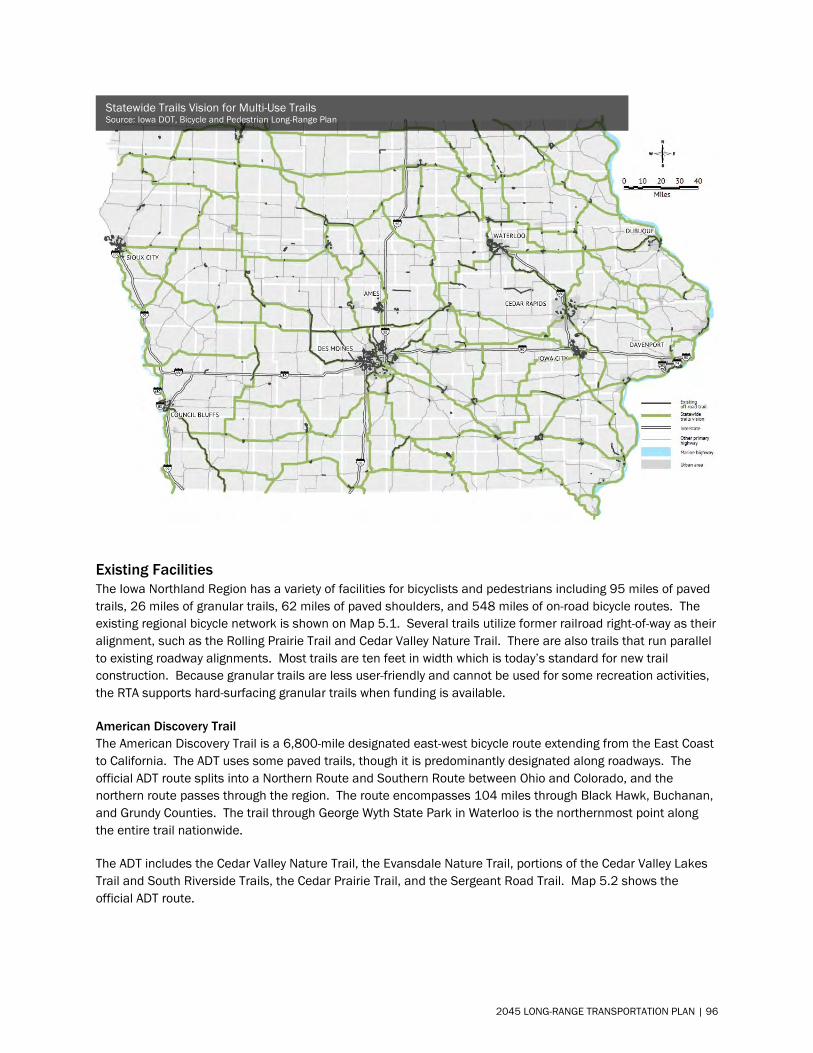
Existing Facilities The Iowa Northland Region has a variety of facilities for bicyclists and pedestrians including 95 miles of paved trails, 26 miles of granular trails, 62 miles of paved shoulders, and 548 miles of on-road bicycle routes. The existing regional bicycle network is shown on Map 5.1. Several trails utilize former railroad right-of-way as their alignment, such as the Rolling Prairie Trail and Cedar Valley Nature Trail. There are also trails that run parallel to existing roadway alignments. Most trails are ten feet in width which is today’s standard for new trail construction. Because granular trails are less user-friendly and cannot be used for some recreation activities, the RTA supports hard-surfacing granular trails when funding is available.
American Discovery Trail The American Discovery Trail is a 6,800-mile designated east-west bicycle route extending from the East Coast to California. The ADT uses some paved trails, though it is predominantly designated along roadways. The official ADT route splits into a Northern Route and Southern Route between Ohio and Colorado, and the northern route passes through the region. The route encompasses 104 miles through Black Hawk, Buchanan, and Grundy Counties. The trail through George Wyth State Park in Waterloo is the northernmost point along the entire trail nationwide.
The ADT includes the Cedar Valley Nature Trail, the Evansdale Nature Trail, portions of the Cedar Valley Lakes Trail and South Riverside Trails, the Cedar Prairie Trail, and the Sergeant Road Trail. Map 5.2 shows the official ADT route.
Statewide Trails Vision for Multi-Use Trails Source: Iowa DOT, Bicycle and Pedestrian Long-Range Plan
2045 LONG-RANGE TRANSPORTATION PLAN | 96
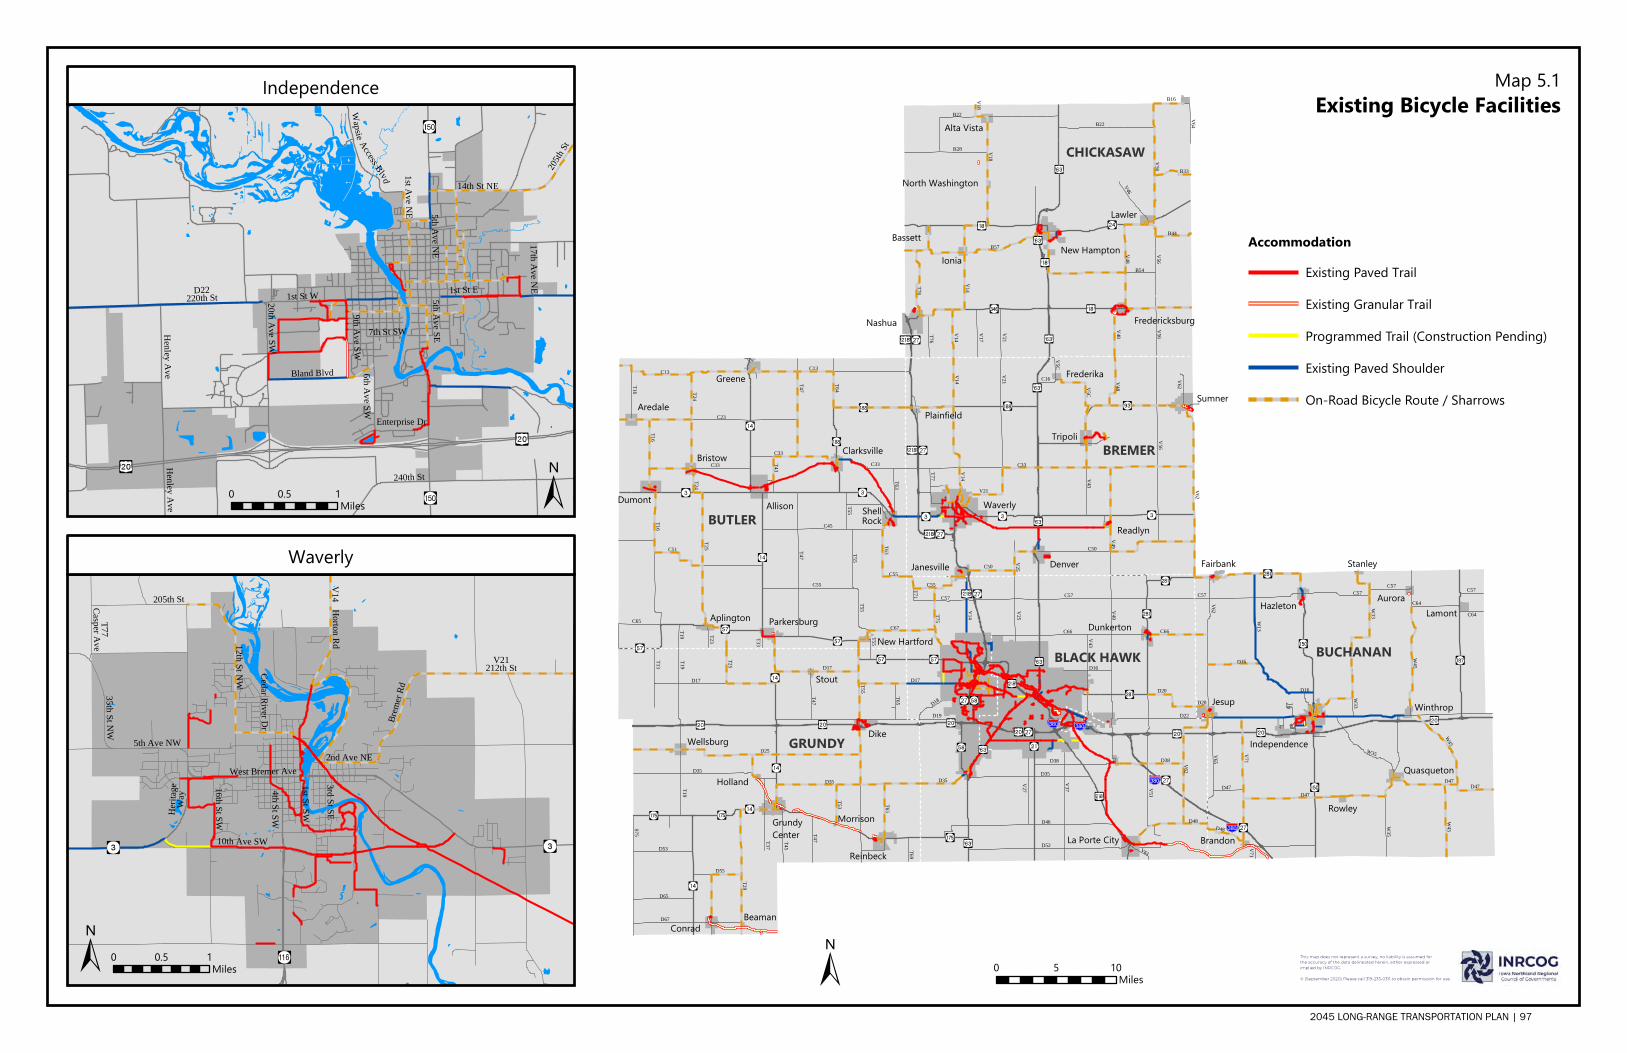
V56
T76
V18
V56
V18
V48
B22
V14
V64
B57
B16
B54
T45
B22
V56
B28
V48
T37
V46
T76
B44
V14
V17
B33
C57
D46
V49
V51
V37
C66
D35
D48
T75
D19
D17
D38
D35
D38
C66
V43
D16
C57
D20
D22
V62
C55
V25
V61
V14
D52
V27
D18T71
V56
V21
C33
V14
V43
C50
V49V48
V14
C50
V25
T77
V62
V62
V21
C16
V5C
V5C
W45
D47
V71
V62
W35
W35
C57
V65
D16
W33
W13
C64
D48
V71
C64
D20
D47
W45
D47
V21
W45
C57
W33
D16
C57 C57
D47
C51
C13
T24
C55
C45
C33
T16
T64
T55
C33
T25
T55T55
C33
T55
C13
T16
T16
T24
C55
T19
C23
T65
T47T47
T33
T63
C67
T43
T53
T23
C65
T25
T63
D17
T65
T29
D35
D25
T19
D65
T47
T13
T69
D55
D17
D35
S75
T55
D67
T47
D53
T19
BUTLER
GRUNDY
BREMER
BUCHANANBLACK HAWK
CHICKASAW
La Porte City
Dunkerton
Janesville
Waverly
Sumner
Denver
Tripoli
Frederika
Readlyn
Plainfield
Independence
Jesup
Quasqueton
Hazleton
Winthrop
AuroraLamont
Fairbank
Rowley
Brandon
Stanley
AllisonDumontShellRock
Greene
Clarksville
Aredale
Bristow
ParkersburgAplington
New Hartford
Nashua
New Hampton
Lawler
Ionia
Alta Vista
Fredericksburg
Bassett
North Washington
Dike
Reinbeck
GrundyCenter
Conrad
Wellsburg
Stout
Holland
Beaman
Morrison
Existing Bicycle Facilities
0 105Miles
D22220th St 1st St W 1st St E
6th Ave SW
5th Ave NE
Henley Ave
Bland Blvd
14th St NE
205th S
t
240th St
Wapsie Access Blvd
9th Ave SW
Enterprise Dr
20th Ave SW
5th Ave SE7th St SW
1st Ave NE
17th Ave NE
Henley Ave
V21212th St
12th St NW
5th Ave NW
205th St
4th St SW
Horton Rd
Brem
er Rd35th St NW
West Bremer Ave
16th St SW
10th Ave SW
Herita
geWa
y
1st St SW
3rd St SE
Cedar River Dr
2nd Ave NE
V14
T77Casper Ave
Independence
Waverly
0 10.5Miles
0 10.5Miles
AccommodationExisting Paved Trail
Existing Granular Trail
Programmed Trail (Construction Pending)
Existing Paved Shoulder
On-Road Bicycle Route / Sharrows
Map 5.1
This map does not represent a survey, no liability is assumed forthe accuracy of the data delineated herein, either expressed or implied by INRCOG.
© (September 2020) Please call 319-235-0311 to obtain permission for use.
2045 LONG-RANGE TRANSPORTATION PLAN | 97
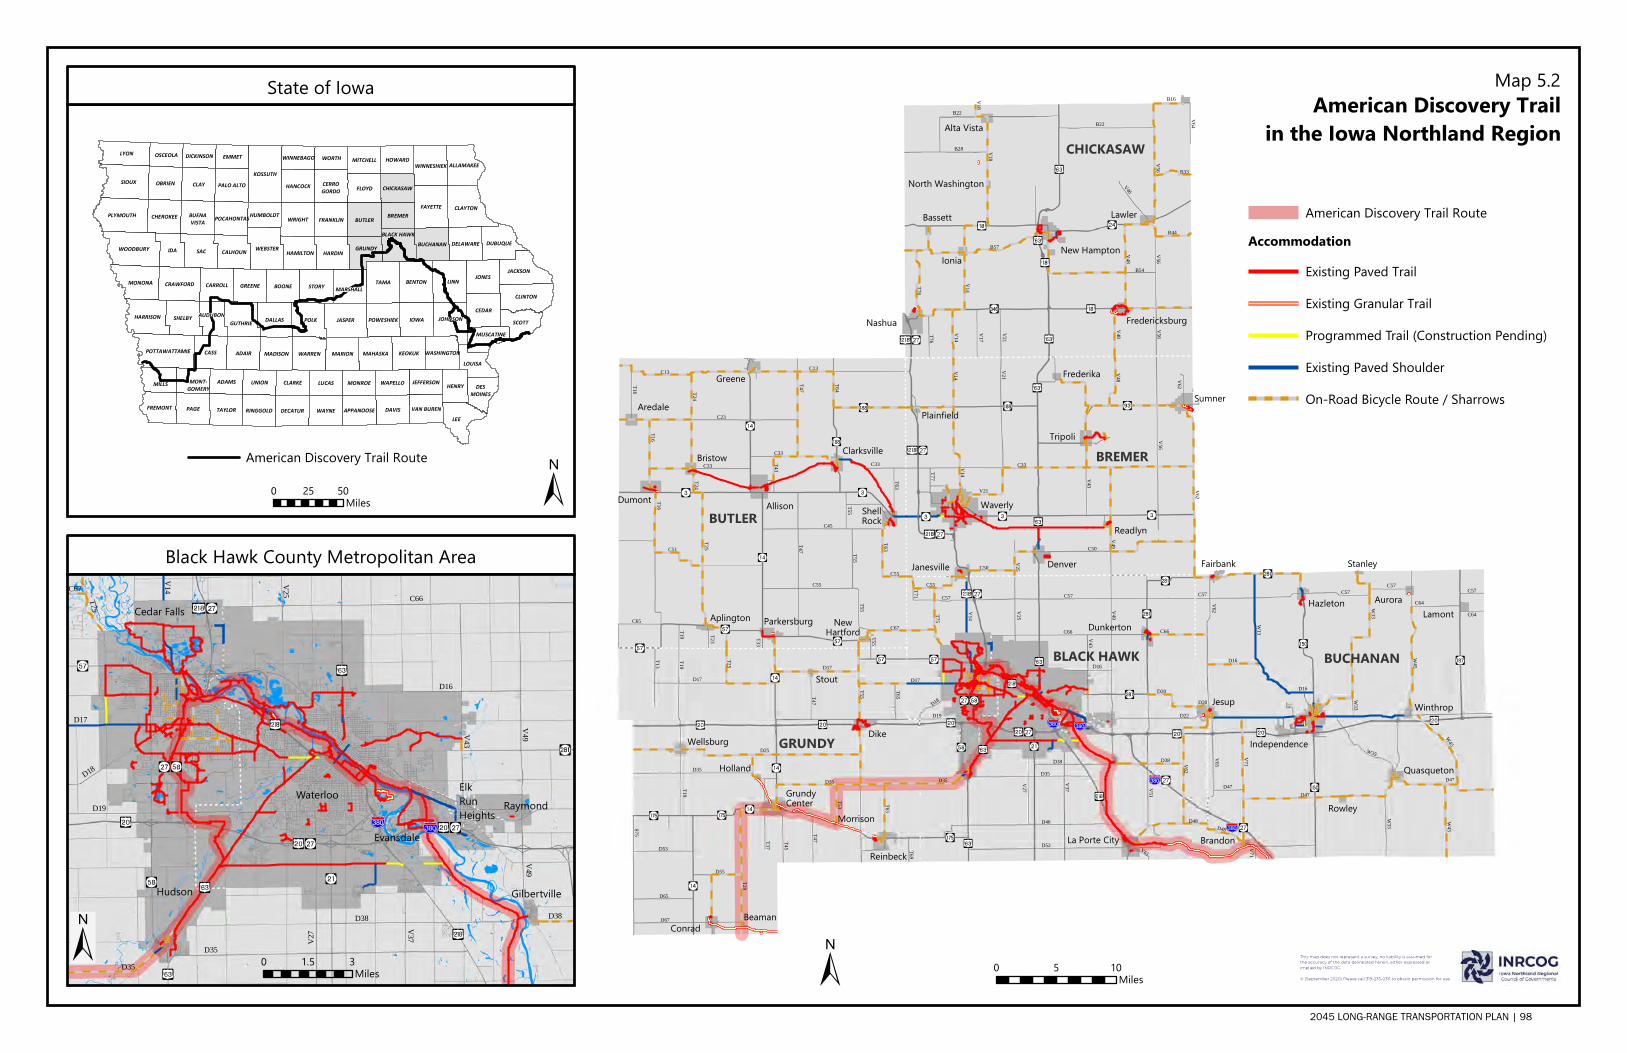
V56
T76
V18
V56
V18
V48
B22
V14
V64
B57
B16
B54
T45
B22
V56
B28
V48
T37
V46
T76
B44
V14
V17
B33
C57
D46
V49
V51
V37
C66
D35
D48
T75
D19
D17
D38
D35
D38
C66
V43
D16
C57
D20
D22
V62
C55
V25
V61
V14
D52
V27
D18T71
V56
V21
C33
V14
V43
C50
V49V48
V14
C50
V25
T77
V62
V62
V21
W45
D47
V71
V62
W35
W35
C57
V65
D16
W33
W13
C64
D48
V71
C64
D20
D47
W45
D47
V21
W45
C57
W33
D16
C57C57
C51
C13
T24
C55
C45
C33
T16
T64
T55
C33
T25
T55T55
C33
T55
C13
T16
T16
T24
C55
T19
C23
T65
T47T47
T33
T63
C67
T43
T53
T23
C65
T25
T63
D17
T65
T29
D35
D25
T19
D65
T47
T13
T69
D55
D17
D35
S75
T55
D67
T47
D53
T19
BUTLER
GRUNDY
BREMER
BUCHANANBLACK HAWK
CHICKASAW
La Porte City
Dunkerton
Janesville
Waverly
Sumner
Denver
Tripoli
Frederika
Readlyn
Plainfield
Independence
Jesup
Quasqueton
Hazleton
Winthrop
AuroraLamont
Fairbank
Rowley
Brandon
Stanley
AllisonDumontShellRock
Greene
Clarksville
Aredale
Bristow
ParkersburgAplington NewHartford
Nashua
New Hampton
Lawler
Ionia
Alta Vista
Fredericksburg
Bassett
North Washington
Dike
Reinbeck
GrundyCenter
Conrad
Wellsburg
Stout
Holland
Beaman
Morrison
American Discovery Trailin the Iowa Northland Region
0 105Miles
LEE
SAC
LINN
SIOUX
IDA
TAMA
CLAY
CASS
POLK
LYON
KOSSUTH
JASPER IOWA
PAGE
JONES
ADAIR
STORY
CEDAR
FAYETTE CLAYTON
BENTON
DAVIS
CLINTON
SHELBY
BOONE
DALLAS
FLOYD
BUTLER
WEBSTER
PLYMOUTH
MILLS
OBRIEN
SCOTT
GREENEJACKSON
WOODBURY HARDIN
MONONA
KEOKUK
WRIGHT
WAYNETAYLOR
LUCAS
GUTHRIEHARRISON
MARION
JOHNSON
HENRY
CARROLL
WARREN
UNION
CRAWFORD
DUBUQUE
FRANKLIN
HANCOCK
CALHOUN
CLARKE
GRUNDY
LOUISA
DECATUR
MADISON
ADAMS
MAHASKA
CHEROKEE
ALLAMAKEEWINNESHIEK
POTTAWATTAMIE
EMMET
HAMILTON
MARSHALL
BREMER
WORTH
FREMONT
DELAWARE
PALO ALTO
RINGGOLD
HOWARD
POWESHIEK
BUCHANAN
MITCHELL
MONROE WAPELLO
OSCEOLA
BLACK HAWK
CHICKASAW
APPANOOSE VAN BUREN
JEFFERSON
MUSCATINE
HUMBOLDT
DICKINSON WINNEBAGO
BUENAVISTA
AUDUBON
POCAHONTAS
WASHINGTON
CERROGORDO
DESMOINES
MONT-GOMERY
State of Iowa
0 5025Miles
American Discovery Trail RouteAccommodation
Existing Paved Trail
Existing Granular Trail
Programmed Trail (Construction Pending)
Existing Paved Shoulder
On-Road Bicycle Route / Sharrows
Map 5.2
American Discovery Trail Route
Black Hawk County Metropolitan Area
Hudson
Waterloo
Gilbertville
Cedar Falls
RaymondElkRunHeights
Evansdale
C66
V43
D38
V49
D16
D35
V37V27
D19
T75
V25
D18
D17
V14C67
D35
V49
D38
0 31.5Miles
This map does not represent a survey, no liability is assumed forthe accuracy of the data delineated herein, either expressed or implied by INRCOG.
© (September 2020) Please call 319-235-0311 to obtain permission for use.
2045 LONG-RANGE TRANSPORTATION PLAN | 98
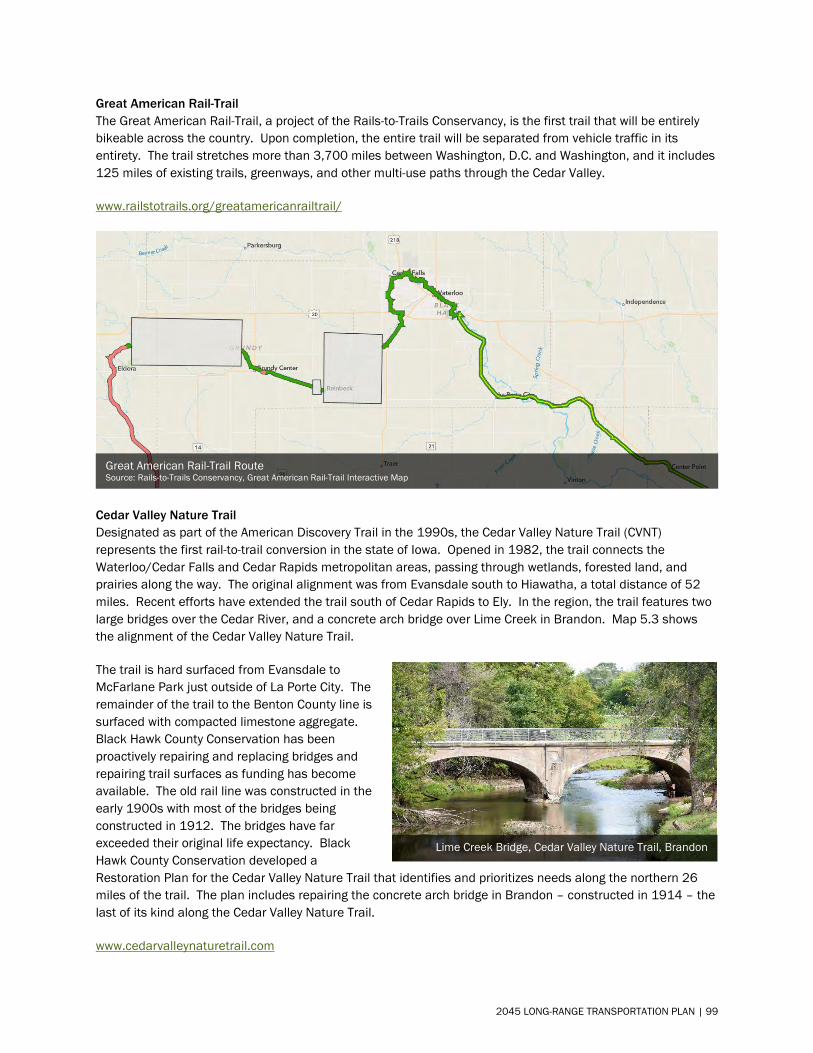
Great American Rail-Trail The Great American Rail-Trail, a project of the Rails-to-Trails Conservancy, is the first trail that will be entirely bikeable across the country. Upon completion, the entire trail will be separated from vehicle traffic in its entirety. The trail stretches more than 3,700 miles between Washington, D.C. and Washington, and it includes 125 miles of existing trails, greenways, and other multi-use paths through the Cedar Valley.
www.railstotrails.org/greatamericanrailtrail/
Cedar Valley Nature Trail Designated as part of the American Discovery Trail in the 1990s, the Cedar Valley Nature Trail (CVNT) represents the first rail-to-trail conversion in the state of Iowa. Opened in 1982, the trail connects the Waterloo/Cedar Falls and Cedar Rapids metropolitan areas, passing through wetlands, forested land, and prairies along the way. The original alignment was from Evansdale south to Hiawatha, a total distance of 52 miles. Recent efforts have extended the trail south of Cedar Rapids to Ely. In the region, the trail features two large bridges over the Cedar River, and a concrete arch bridge over Lime Creek in Brandon. Map 5.3 shows the alignment of the Cedar Valley Nature Trail.
The trail is hard surfaced from Evansdale to McFarlane Park just outside of La Porte City. The remainder of the trail to the Benton County line is surfaced with compacted limestone aggregate. Black Hawk County Conservation has been proactively repairing and replacing bridges and repairing trail surfaces as funding has become available. The old rail line was constructed in the early 1900s with most of the bridges being constructed in 1912. The bridges have far exceeded their original life expectancy. Black Hawk County Conservation developed a Restoration Plan for the Cedar Valley Nature Trail that identifies and prioritizes needs along the northern 26 miles of the trail. The plan includes repairing the concrete arch bridge in Brandon – constructed in 1914 – the last of its kind along the Cedar Valley Nature Trail.
www.cedarvalleynaturetrail.com
Great American Rail-Trail Route Source: Rails-to-Trails Conservancy, Great American Rail-Trail Interactive Map
Lime Creek Bridge, Cedar Valley Nature Trail, Brandon
2045 LONG-RANGE TRANSPORTATION PLAN | 99
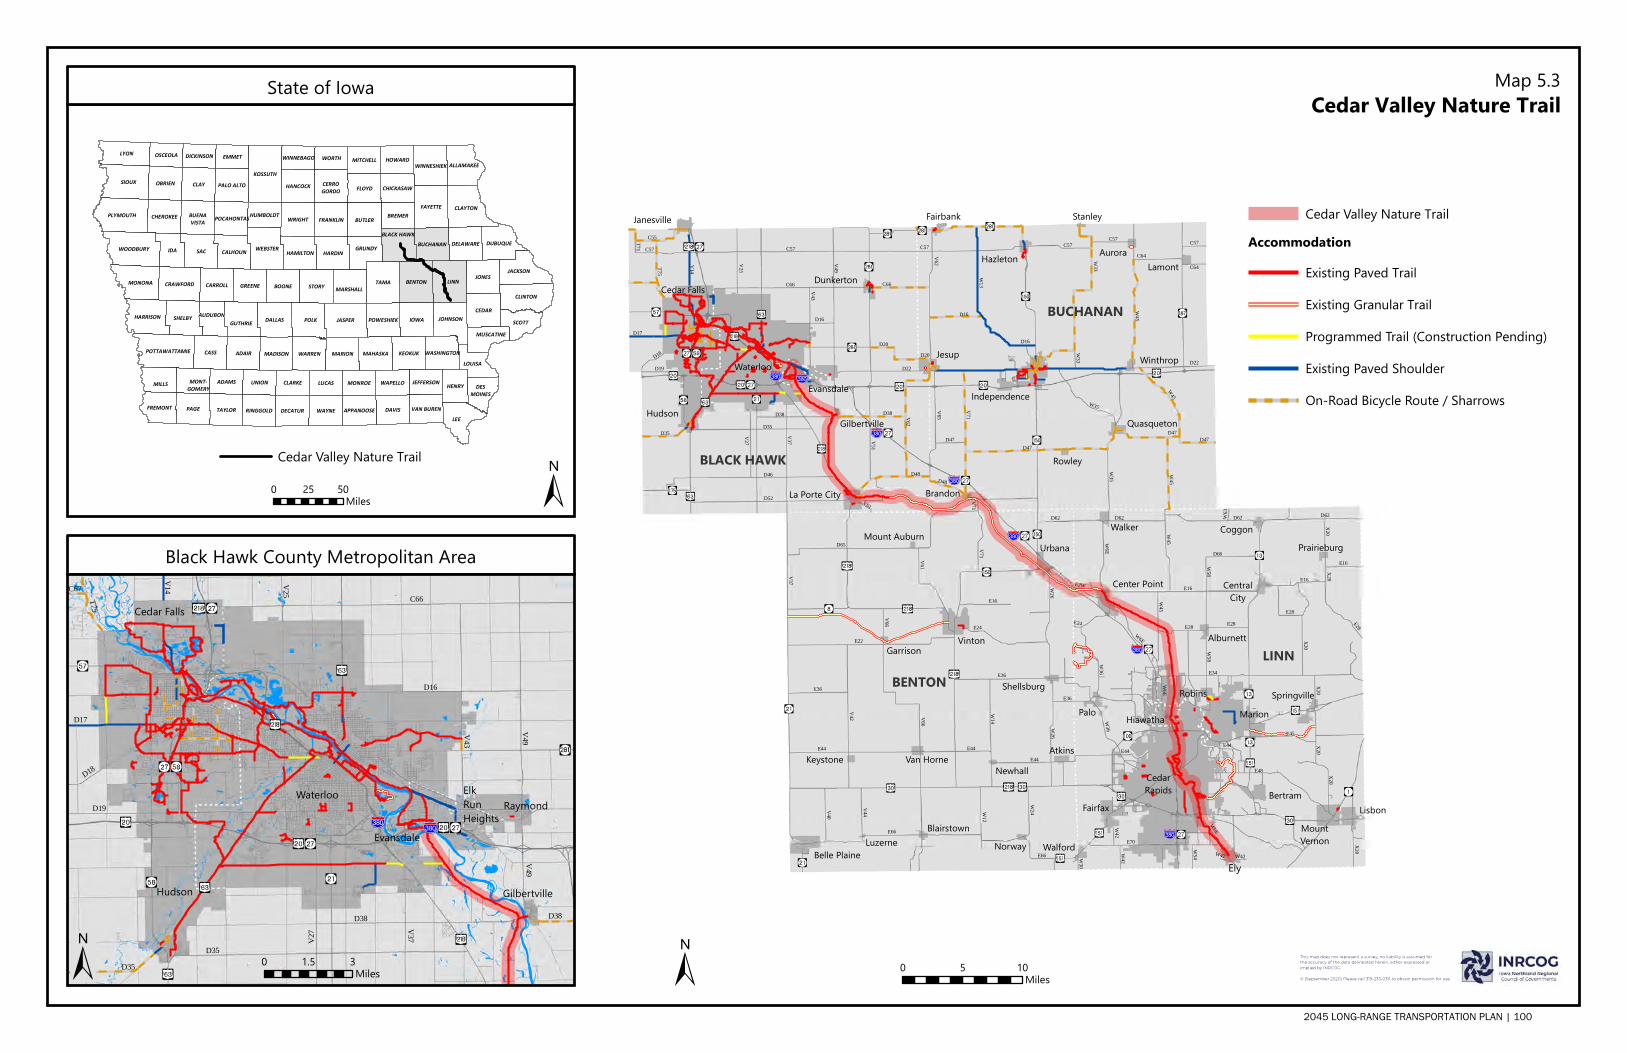
C57
D46
V49
V51
V37
C66
D35
D48
T75
D19
D17
D38
D35
D38
C66
V43
D16
C57
D20
D22
V62
C55
V25
V61
V14
D52
V27
D18
T71
W45
D47
V71
V62
W35
W35
C57
V65
D16
W33
W13
C64
D48
V71
C64
D20
D47
W45
D47
W45
C57
W33
D16
C57C57
D22
D47
BUCHANAN
BLACK HAWK
BENTONLINN
Waterloo
Cedar Falls
Hudson
Evansdale
La Porte City
Dunkerton
Janesville
Gilbertville
Independence
Jesup
Quasqueton
Hazleton
Winthrop
AuroraLamont
Fairbank
Rowley
Brandon
Stanley
D65
W26
E22
V42
E44
V37
W14
E24
E66
V61
E36
V71
E16
W12
V40
V44
W24
D62
V66
E36
E44
E36
V66
E44
E66
W26
E34
E16
E70
E48
D62W
36
E45
W45
W58
W6E
E44
E28
D66
X20
E2W
W54
W42
W30
W63
E24E28
E44
X20
D62
W45
E28
W42
E28
W58
W6E
W36
X20X20
X20
E16
D62
W6E
X20
E16
W42
X20W42
W6EVinton
Belle Plaine
Urbana
AtkinsVan Horne
Shellsburg
NorwayBlairstown
Keystone
Garrison
Newhall
Mount Auburn
Luzerne
CedarRapids
MarionRobins
Ely
Hiawatha
LisbonFairfax
Palo
MountVernon
Center Point
Bertram
Walker
Alburnett
Coggon
CentralCity
Springville
Walford
Prairieburg
Cedar Valley Nature Trail
0 105Miles
LEE
SAC
LINN
SIOUX
IDA
TAMA
CLAY
CASS
POLK
LYON
KOSSUTH
JASPER IOWA
PAGE
JONES
ADAIR
STORY
CEDAR
FAYETTE CLAYTON
BENTON
DAVIS
CLINTON
SHELBY
BOONE
DALLAS
FLOYD
BUTLER
WEBSTER
PLYMOUTH
MILLS
OBRIEN
SCOTT
GREENEJACKSON
WOODBURY HARDIN
MONONA
KEOKUK
WRIGHT
WAYNETAYLOR
LUCAS
GUTHRIEHARRISON
MARION
JOHNSON
HENRY
CARROLL
WARREN
UNION
CRAWFORD
DUBUQUE
FRANKLIN
HANCOCK
CALHOUN
CLARKE
GRUNDY
LOUISA
DECATUR
MADISON
ADAMS
MAHASKA
CHEROKEE
ALLAMAKEEWINNESHIEK
POTTAWATTAMIE
EMMET
HAMILTON
MARSHALL
BREMER
WORTH
FREMONT
DELAWARE
PALO ALTO
RINGGOLD
HOWARD
POWESHIEK
BUCHANAN
MITCHELL
MONROE WAPELLO
OSCEOLA
BLACK HAWK
CHICKASAW
APPANOOSE VAN BUREN
JEFFERSON
MUSCATINE
HUMBOLDT
DICKINSON WINNEBAGO
BUENAVISTA
AUDUBON
POCAHONTAS
WASHINGTON
CERROGORDO
DESMOINES
MONT-GOMERY
State of Iowa
0 5025Miles
Cedar Valley Nature TrailAccommodation
Existing Paved Trail
Existing Granular Trail
Programmed Trail (Construction Pending)
Existing Paved Shoulder
On-Road Bicycle Route / Sharrows
Map 5.3
Cedar Valley Nature Trail
Black Hawk County Metropolitan Area
Hudson
Waterloo
Gilbertville
Cedar Falls
RaymondElkRunHeights
Evansdale
C66
V43
D38
V49
D16
D35
V37V27
D19
T75
V25
D18
D17
V14C67
D35
V49
D38
0 31.5Miles
This map does not represent a survey, no liability is assumed forthe accuracy of the data delineated herein, either expressed or implied by INRCOG.
© (September 2020) Please call 319-235-0311 to obtain permission for use.
2045 LONG-RANGE TRANSPORTATION PLAN | 100
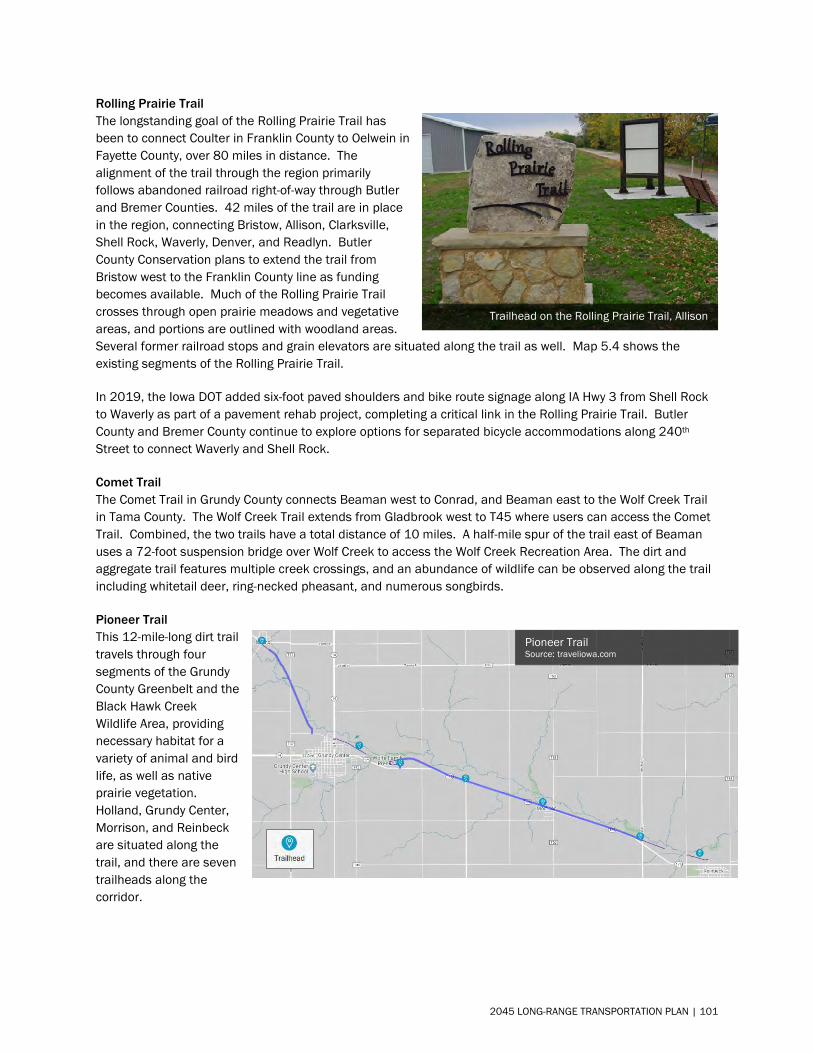
Rolling Prairie Trail The longstanding goal of the Rolling Prairie Trail has been to connect Coulter in Franklin County to Oelwein in Fayette County, over 80 miles in distance. The alignment of the trail through the region primarily follows abandoned railroad right-of-way through Butler and Bremer Counties. 42 miles of the trail are in place in the region, connecting Bristow, Allison, Clarksville, Shell Rock, Waverly, Denver, and Readlyn. Butler County Conservation plans to extend the trail from Bristow west to the Franklin County line as funding becomes available. Much of the Rolling Prairie Trail crosses through open prairie meadows and vegetative areas, and portions are outlined with woodland areas. Several former railroad stops and grain elevators are situated along the trail as well. Map 5.4 shows the existing segments of the Rolling Prairie Trail.
In 2019, the Iowa DOT added six-foot paved shoulders and bike route signage along IA Hwy 3 from Shell Rock to Waverly as part of a pavement rehab project, completing a critical link in the Rolling Prairie Trail. Butler County and Bremer County continue to explore options for separated bicycle accommodations along 240th Street to connect Waverly and Shell Rock.
Comet Trail The Comet Trail in Grundy County connects Beaman west to Conrad, and Beaman east to the Wolf Creek Trail in Tama County. The Wolf Creek Trail extends from Gladbrook west to T45 where users can access the Comet Trail. Combined, the two trails have a total distance of 10 miles. A half-mile spur of the trail east of Beaman uses a 72-foot suspension bridge over Wolf Creek to access the Wolf Creek Recreation Area. The dirt and aggregate trail features multiple creek crossings, and an abundance of wildlife can be observed along the trail including whitetail deer, ring-necked pheasant, and numerous songbirds.
Pioneer Trail This 12-mile-long dirt trail travels through four segments of the Grundy County Greenbelt and the Black Hawk Creek Wildlife Area, providing necessary habitat for a variety of animal and bird life, as well as native prairie vegetation. Holland, Grundy Center, Morrison, and Reinbeck are situated along the trail, and there are seven trailheads along the corridor.
Trailhead on the Rolling Prairie Trail, Allison
Pioneer Trail Source: traveliowa.com
2045 LONG-RANGE TRANSPORTATION PLAN | 101
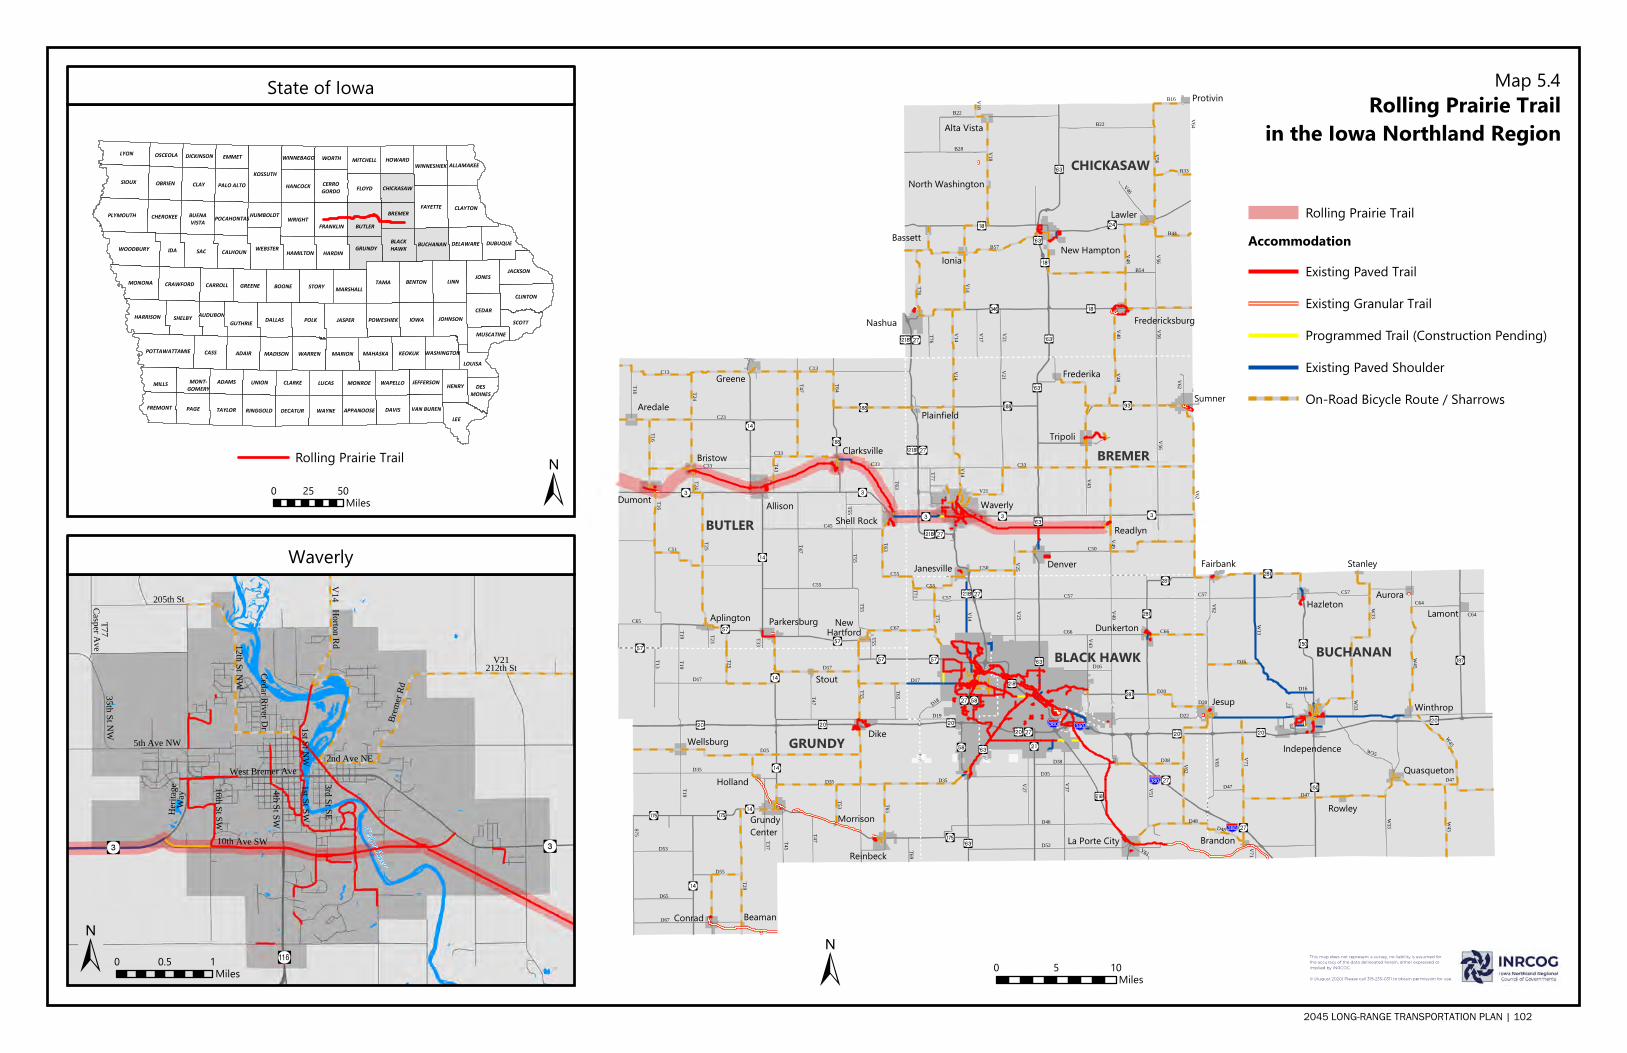
V56
T76
V18
V56
V18
V48
B22
V14
V64
B57
B16
B54
T45
B22
V56
B28
V48
T37
V46
T76
B44
V14
V17
B33
C57
D46
V49
V51
V37
C66
D35
D48
T75
D19
D17
D38
D35
D38
C66
V43
D16
C57
D20
D22
V62
C55
V25
V61
V14
D52
V27
D18T71
V56
V21
C33
V14
V43
C50
V49V48
V14
C50
V25
T77
V62
V62
V21
W45
D47
V71
V62
W35
W35
C57
V65
D16
W33
W13
C64
D48
V71
C64
D20
D47
W45
D47
V21
W45
C57
W33
D16
C51
C13
T24
C55
C45
C33
T16
T64
T55
C33
T25
T55T55
C33
T55
C13
T16
T16
T24
C55
T19
C23
T65
T47T47
T33
T63
C67
T43
T53
T23
C65
T25
T63
D17
T65
T29
D35
D25
T19
D65
T47
T13
T69
D55
D17
D35
S75
T55
D67
T47
D53
T19
BUTLER
GRUNDY
BREMER
BUCHANANBLACK HAWK
CHICKASAW
La Porte City
Dunkerton
Janesville
Waverly
Sumner
Denver
Tripoli
Frederika
Readlyn
Plainfield
Independence
Jesup
Quasqueton
Hazleton
Winthrop
AuroraLamont
Fairbank
Rowley
Brandon
Stanley
AllisonDumontShell Rock
Greene
Clarksville
Aredale
Bristow
ParkersburgAplington NewHartford
Nashua
New Hampton
Lawler
Ionia
Alta Vista
Fredericksburg
Protivin
Bassett
North Washington
Dike
Reinbeck
GrundyCenter
Conrad
Wellsburg
Stout
Holland
Beaman
Morrison
Rolling Prairie Trailin the Iowa Northland Region
0 105Miles
LEE
SAC
LINN
SIOUX
IDA
TAMA
CLAY
CASS
POLK
LYON
KOSSUTH
JASPER IOWA
PAGE
JONES
ADAIR
STORY
CEDAR
FAYETTE CLAYTON
BENTON
DAVIS
CLINTON
SHELBY
BOONE
DALLAS
FLOYD
BUTLER
WEBSTER
PLYMOUTH
MILLS
OBRIEN
SCOTT
GREENEJACKSON
WOODBURY HARDIN
MONONA
KEOKUK
WRIGHT
WAYNETAYLOR
LUCAS
GUTHRIEHARRISON
MARION
JOHNSON
HENRY
CARROLL
WARREN
UNION
CRAWFORD
DUBUQUE
FRANKLIN
HANCOCK
CALHOUN
CLARKE
GRUNDY
LOUISA
DECATUR
MADISON
ADAMS
MAHASKA
CHEROKEE
ALLAMAKEEWINNESHIEK
POTTAWATTAMIE
EMMET
HAMILTON
MARSHALL
BREMER
WORTH
FREMONT
DELAWARE
PALO ALTO
RINGGOLD
HOWARD
POWESHIEK
BUCHANAN
MITCHELL
MONROE WAPELLO
OSCEOLA
BLACKHAWK
CHICKASAW
APPANOOSE VAN BUREN
JEFFERSON
MUSCATINE
HUMBOLDT
DICKINSON WINNEBAGO
BUENAVISTA
AUDUBON
POCAHONTAS
WASHINGTON
CERROGORDO
DESMOINES
MONT-GOMERY
State of Iowa
0 5025Miles
Rolling Prairie TrailAccommodation
Existing Paved Trail
Existing Granular Trail
Programmed Trail (Construction Pending)
Existing Paved Shoulder
On-Road Bicycle Route / Sharrows
Map 5.4
Rolling Prairie Trail
V21212th St
12th St NW
5th Ave NW
205th St
4th St SW
Horton Rd
Brem
er Rd35th St NW
West Bremer Ave
16th St SW
10th Ave SW
Herita
geWa
y
1st St SW1st St NW
3rd St SE
Cedar River Dr
2nd Ave NE
V14
T77Casper Ave
Cedar River
Waverly
0 10.5Miles
This map does not represent a survey, no liability is assumed forthe accuracy of the data delineated herein, either expressed or implied by INRCOG.
© (August 2020) Please call 319-235-0311 to obtain permission for use.
2045 LONG-RANGE TRANSPORTATION PLAN | 102
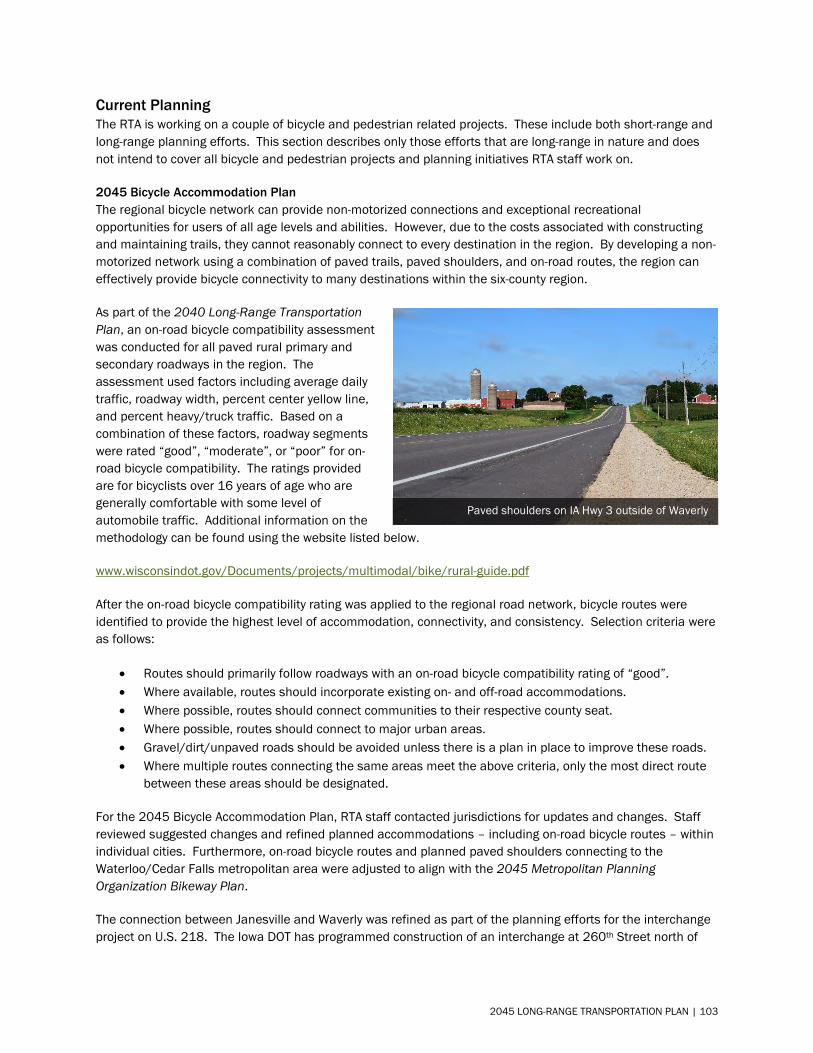
Current Planning The RTA is working on a couple of bicycle and pedestrian related projects. These include both short-range and long-range planning efforts. This section describes only those efforts that are long-range in nature and does not intend to cover all bicycle and pedestrian projects and planning initiatives RTA staff work on.
2045 Bicycle Accommodation Plan The regional bicycle network can provide non-motorized connections and exceptional recreational opportunities for users of all age levels and abilities. However, due to the costs associated with constructing and maintaining trails, they cannot reasonably connect to every destination in the region. By developing a non-motorized network using a combination of paved trails, paved shoulders, and on-road routes, the region can effectively provide bicycle connectivity to many destinations within the six-county region.
As part of the 2040 Long-Range Transportation Plan, an on-road bicycle compatibility assessment was conducted for all paved rural primary and secondary roadways in the region. The assessment used factors including average daily traffic, roadway width, percent center yellow line, and percent heavy/truck traffic. Based on a combination of these factors, roadway segments were rated “good”, “moderate”, or “poor” for on-road bicycle compatibility. The ratings provided are for bicyclists over 16 years of age who are generally comfortable with some level of automobile traffic. Additional information on the methodology can be found using the website listed below.
www.wisconsindot.gov/Documents/projects/multimodal/bike/rural-guide.pdf
After the on-road bicycle compatibility rating was applied to the regional road network, bicycle routes were identified to provide the highest level of accommodation, connectivity, and consistency. Selection criteria were as follows:
• Routes should primarily follow roadways with an on-road bicycle compatibility rating of “good”.• Where available, routes should incorporate existing on- and off-road accommodations.• Where possible, routes should connect communities to their respective county seat.• Where possible, routes should connect to major urban areas.• Gravel/dirt/unpaved roads should be avoided unless there is a plan in place to improve these roads.• Where multiple routes connecting the same areas meet the above criteria, only the most direct route
between these areas should be designated.
For the 2045 Bicycle Accommodation Plan, RTA staff contacted jurisdictions for updates and changes. Staff reviewed suggested changes and refined planned accommodations – including on-road bicycle routes – within individual cities. Furthermore, on-road bicycle routes and planned paved shoulders connecting to the Waterloo/Cedar Falls metropolitan area were adjusted to align with the 2045 Metropolitan Planning Organization Bikeway Plan.
The connection between Janesville and Waverly was refined as part of the planning efforts for the interchange project on U.S. 218. The Iowa DOT has programmed construction of an interchange at 260th Street north of
Paved shoulders on IA Hwy 3 outside of Waverly
2045 LONG-RANGE TRANSPORTATION PLAN | 103

Janesville in FY 2024. As part of the project, a series of frontage roads with paved shoulders will be incorporated to provide local access to two subdivisions and the City of Janesville from the north. This leaves a two-mile gap between Janesville and Waverly. A separated paved trail has been identified from 260th Street north to 29th Avenue SW in Waverly to complete the connection. As shown, users would be able to travel from Cedar Falls to Waverly using paved trails, paved shoulders, and on-road bicycle routes.
The 2045 Regional Bicycle Accommodation Plan is shown on Map 5.5. The RTA has chosen to continue its focus on three types of facilities: on-road bicycle routes, paved shoulders, and paved trails. Many paved shoulder projects were identified by county engineers and are typically targeted towards roadways planned for resurfacing within the lifetime of this plan. Most planned trails shown are not along roadways, but rather are connecting existing trail segments or recreation areas.
Full implementation of the Regional Bicycle Accommodation Plan would result in a continuous bicycle network of 885 miles of accommodations, as detailed below.
Table 5.3: Mileage of Existing and Planned Bicycle Accommodations Existing Miles Planned Miles Total
On-Road Bicycle Routes 548.5 -- 548.5 Paved Shoulders/Bike Lanes 62.0 63.9 125.9 Paved Trails 95.5 *88.2 183.7 Granular Trails 26.5 -- 26.5
Total 732.5 152.1 884.6 *Includes 0.6 miles of programmed trails in FY 2021-2024
On-road bicycle routes do not require additional infrastructure improvements. In their existing state, these roads have been identified as the most accommodating routes as is. Portions of identified on-road bicycle routes may have compatibility issues, but still provide the most accommodating route available with existing infrastructure. Individual jurisdictions are encouraged to address compatibility issues along roadways during the reconstruction or resurfacing of these segments. However, this plan neither suggests nor implies that individual jurisdictions be required to add any further improvements to these roadways.
Share the Road signage on W35, Buchanan County (on-road bicycle route)
2045 LONG-RANGE TRANSPORTATION PLAN | 104
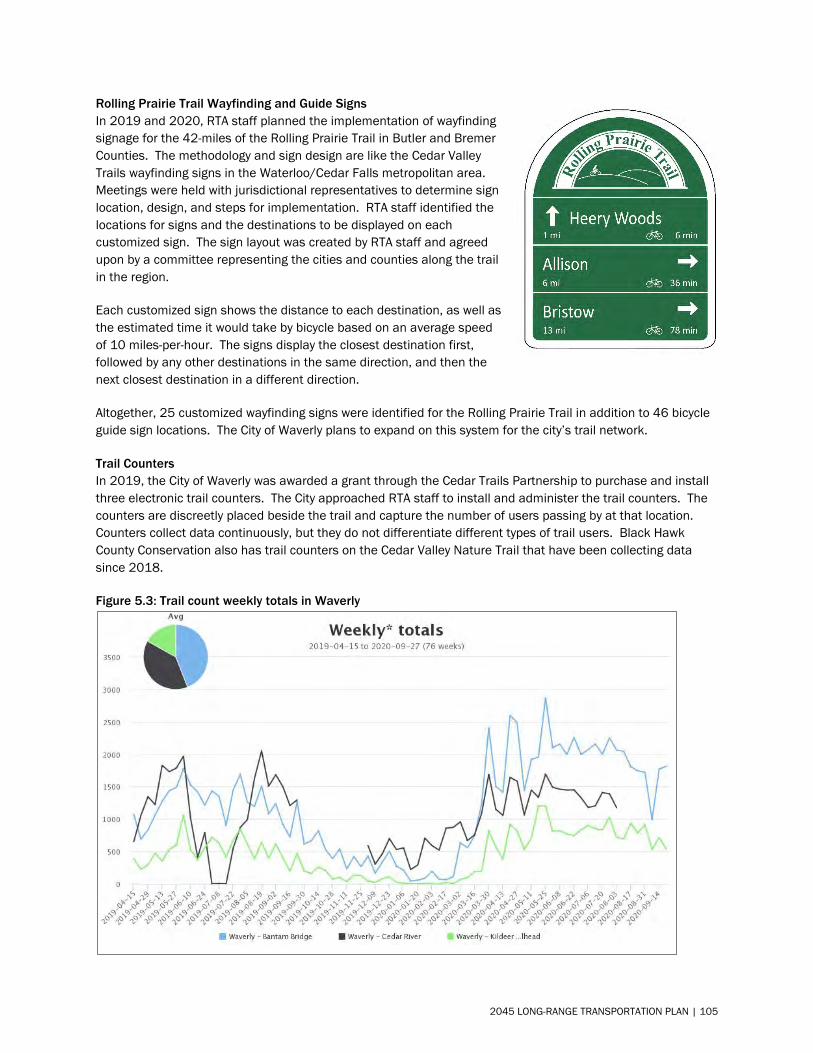
Rolling Prairie Trail Wayfinding and Guide Signs In 2019 and 2020, RTA staff planned the implementation of wayfinding signage for the 42-miles of the Rolling Prairie Trail in Butler and Bremer Counties. The methodology and sign design are like the Cedar Valley Trails wayfinding signs in the Waterloo/Cedar Falls metropolitan area. Meetings were held with jurisdictional representatives to determine sign location, design, and steps for implementation. RTA staff identified the locations for signs and the destinations to be displayed on each customized sign. The sign layout was created by RTA staff and agreed upon by a committee representing the cities and counties along the trail in the region.
Each customized sign shows the distance to each destination, as well as the estimated time it would take by bicycle based on an average speed of 10 miles-per-hour. The signs display the closest destination first, followed by any other destinations in the same direction, and then the next closest destination in a different direction.
Altogether, 25 customized wayfinding signs were identified for the Rolling Prairie Trail in addition to 46 bicycle guide sign locations. The City of Waverly plans to expand on this system for the city’s trail network.
Trail Counters In 2019, the City of Waverly was awarded a grant through the Cedar Trails Partnership to purchase and install three electronic trail counters. The City approached RTA staff to install and administer the trail counters. The counters are discreetly placed beside the trail and capture the number of users passing by at that location. Counters collect data continuously, but they do not differentiate different types of trail users. Black Hawk County Conservation also has trail counters on the Cedar Valley Nature Trail that have been collecting data since 2018.
Figure 5.3: Trail count weekly totals in Waverly
2045 LONG-RANGE TRANSPORTATION PLAN | 105
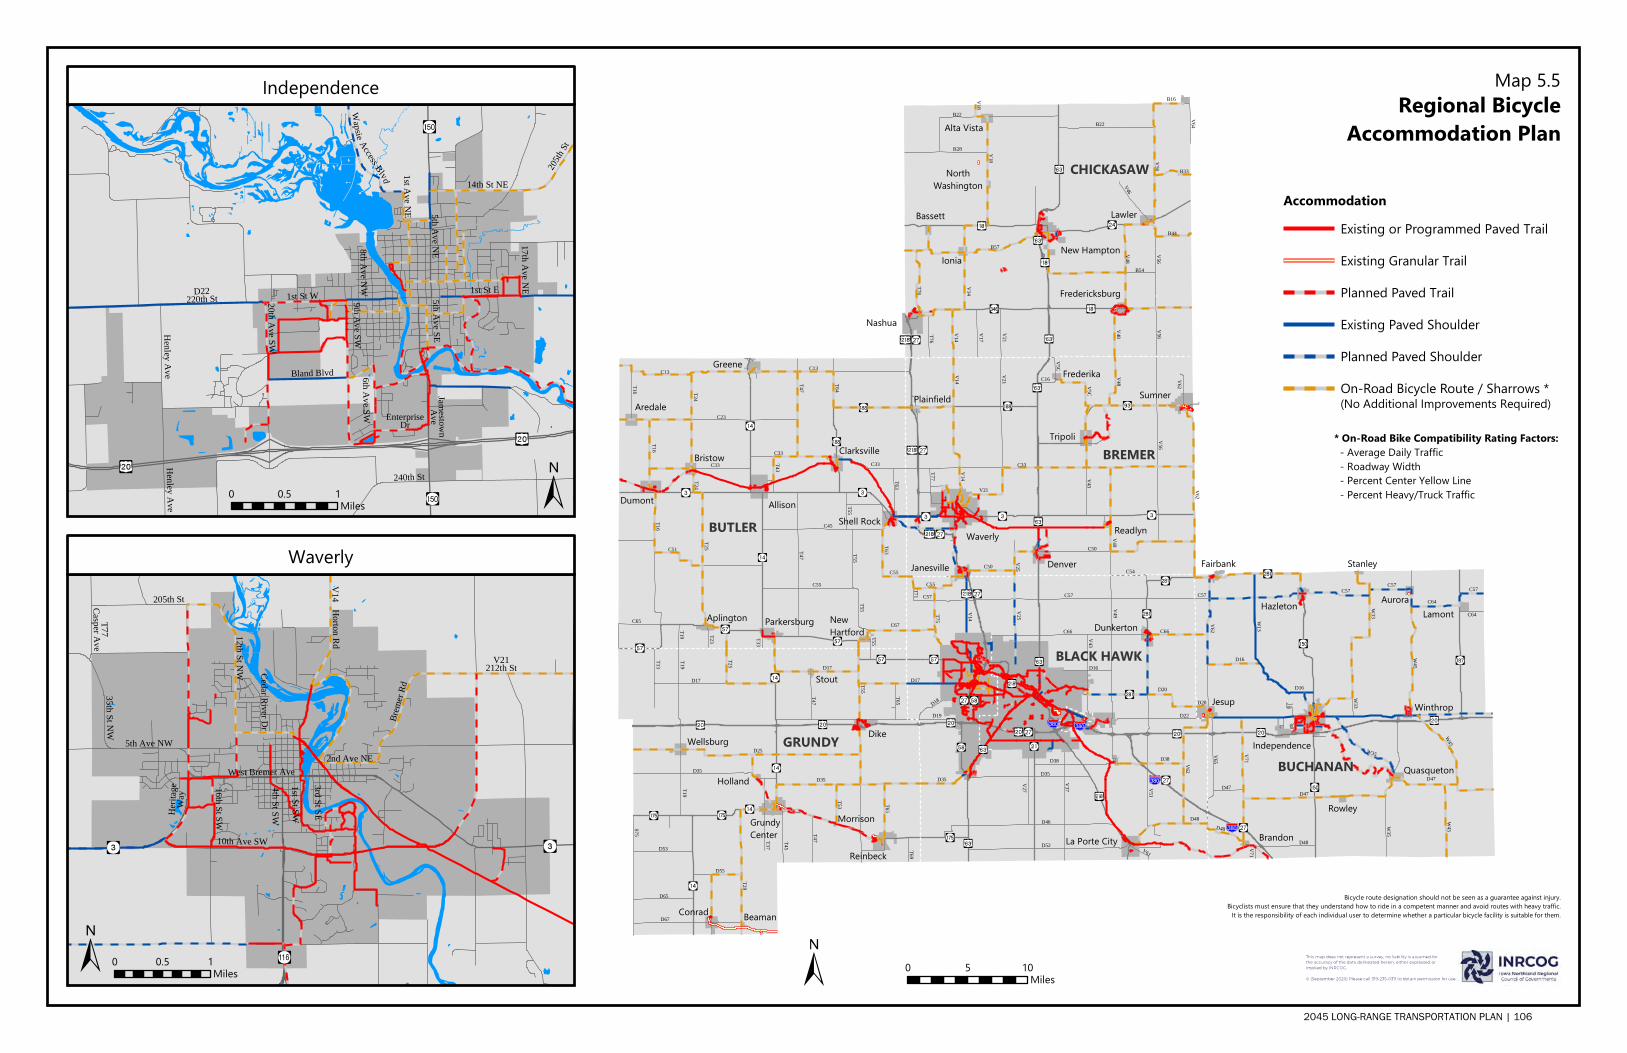
V56
T76
V18
V56
V18
V48
B22
V14
V64
B57
B16
B54
T45
B22
V56
B28
V48
T37
V46
T76
B44
V14
V17
B33
C57
D46
V49
V51
V37
C66
D35
D48
T75
D19
D17
D38
D35
D38
C66
V43
D16
C57
D20
D22
V62
C55
V25
V61
V14
D52
V27
D18T71
V56
V21
C33
V14
V43
C50
V49V48
V14
C50
V25
T77
V62
V62
V21
C54V5C
V5C
C16
W45
D47
V71
V62
W35
W35
C57
V65
D16
W33
W13
C64
D48
V71
C64
D20
D47
W45
D47
V21
W45
C57
W33
D16
C57 C57
D48
C51
C13
T24
C55
C45
C33
T16
T64
T55
C33
T25
T55T55
C33
T55
C13
T16
T16
T24
C55
T19
C23
T65
T47T47
T33
T63
C67
T43
T53
T23
C65
T25
T63
D17
T65
T29
D35
D25
T19
D65
T47
T13
T69
D55
D17
D35
S75
T55
D67
T47
D53
T19
BUTLER
GRUNDY
BREMER
BUCHANAN
BLACK HAWK
CHICKASAW
La Porte City
Dunkerton
Janesville
Waverly
Sumner
Denver
Tripoli
Frederika
Readlyn
Plainfield
Independence
Jesup
Quasqueton
Hazleton
Winthrop
AuroraLamont
Fairbank
Rowley
Brandon
Stanley
AllisonDumontShell Rock
Greene
Clarksville
Aredale
Bristow
ParkersburgAplington NewHartford
Nashua
New Hampton
Lawler
Ionia
Alta Vista
Fredericksburg
Bassett
NorthWashington
Dike
Reinbeck
GrundyCenter
Conrad
Wellsburg
Stout
Holland
Beaman
Morrison
Regional BicycleAccommodation Plan
0 105Miles
D22220th St 1st St W 1st St E
6th Ave SW
5th Ave NE
Henley Ave
Bland Blvd
14th St NE
205th S
t
JamestownAve
240th St
Wapsie Access Blvd
9th Ave SW
EnterpriseDr
20th Ave SW
8 th Ave NW
5th Ave SE
1st Ave NE
17th Ave NE
Henley Ave
V21212th St
12th St NW
5th Ave NW
205th St
4th St SW
Horton Rd
Brem
er Rd35th St NW
West Bremer Ave
16th St SW
10th Ave SW
Herita
geWa
y
1st St SW
3rd St SE
Cedar River Dr
2nd Ave NE
V14
T77Casper Ave
Independence
Waverly
0 10.5Miles
0 10.5Miles
AccommodationExisting or Programmed Paved Trail
Existing Granular Trail
Planned Paved Trail
Existing Paved Shoulder
Planned Paved Shoulder
On-Road Bicycle Route / Sharrows *
Map 5.5
Bicycle route designation should not be seen as a guarantee against injury.Bicyclists must ensure that they understand how to ride in a competent manner and avoid routes with heavy traffic.
It is the responsibility of each individual user to determine whether a particular bicycle facility is suitable for them.
* On-Road Bike Compatibility Rating Factors:- Average Daily Traffic- Roadway Width- Percent Center Yellow Line- Percent Heavy/Truck Traffic
(No Additional Improvements Required)
This map does not represent a survey, no liability is assumed forthe accuracy of the data delineated herein, either expressed or implied by INRCOG.
© (September 2020) Please call 319-235-0311 to obtain permission for use.
2045 LONG-RANGE TRANSPORTATION PLAN | 106
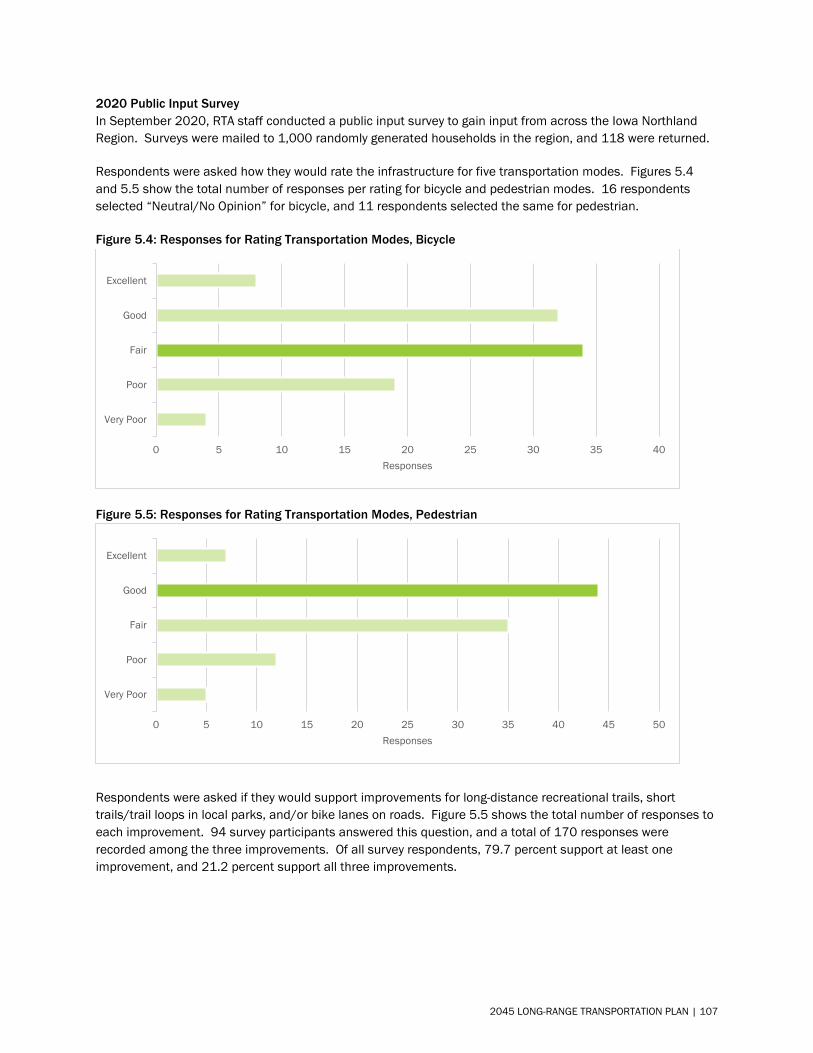
2020 Public Input Survey In September 2020, RTA staff conducted a public input survey to gain input from across the Iowa Northland Region. Surveys were mailed to 1,000 randomly generated households in the region, and 118 were returned.
Respondents were asked how they would rate the infrastructure for five transportation modes. Figures 5.4 and 5.5 show the total number of responses per rating for bicycle and pedestrian modes. 16 respondents selected “Neutral/No Opinion” for bicycle, and 11 respondents selected the same for pedestrian.
Figure 5.4: Responses for Rating Transportation Modes, Bicycle
Figure 5.5: Responses for Rating Transportation Modes, Pedestrian
Respondents were asked if they would support improvements for long-distance recreational trails, short trails/trail loops in local parks, and/or bike lanes on roads. Figure 5.5 shows the total number of responses to each improvement. 94 survey participants answered this question, and a total of 170 responses were recorded among the three improvements. Of all survey respondents, 79.7 percent support at least one improvement, and 21.2 percent support all three improvements.
Very Poor
Poor
Fair
Good
Excellent
0 5 10 15 20 25 30 35 40Responses
Very Poor
Poor
Fair
Good
Excellent
0 5 10 15 20 25 30 35 40 45 50Responses
2045 LONG-RANGE TRANSPORTATION PLAN | 107
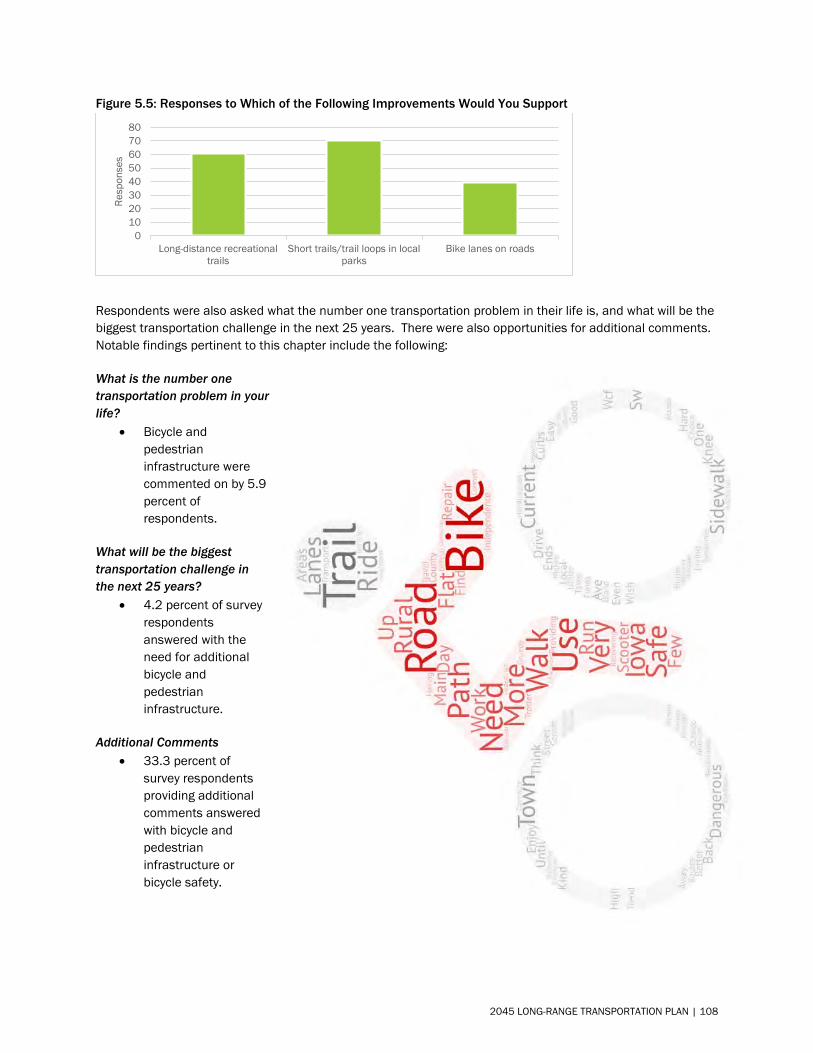
Figure 5.5: Responses to Which of the Following Improvements Would You Support
Respondents were also asked what the number one transportation problem in their life is, and what will be the biggest transportation challenge in the next 25 years. There were also opportunities for additional comments. Notable findings pertinent to this chapter include the following:
What is the number one transportation problem in your life?
• Bicycle andpedestrianinfrastructure werecommented on by 5.9percent ofrespondents.
What will be the biggest transportation challenge in the next 25 years?
• 4.2 percent of surveyrespondentsanswered with theneed for additionalbicycle andpedestrianinfrastructure.
Additional Comments • 33.3 percent of
survey respondentsproviding additionalcomments answeredwith bicycle andpedestrianinfrastructure orbicycle safety.
Long-distance recreationaltrails
Short trails/trail loops in localparks
Bike lanes on roads0
1020304050607080
Resp
onse
s
2045 LONG-RANGE TRANSPORTATION PLAN | 108
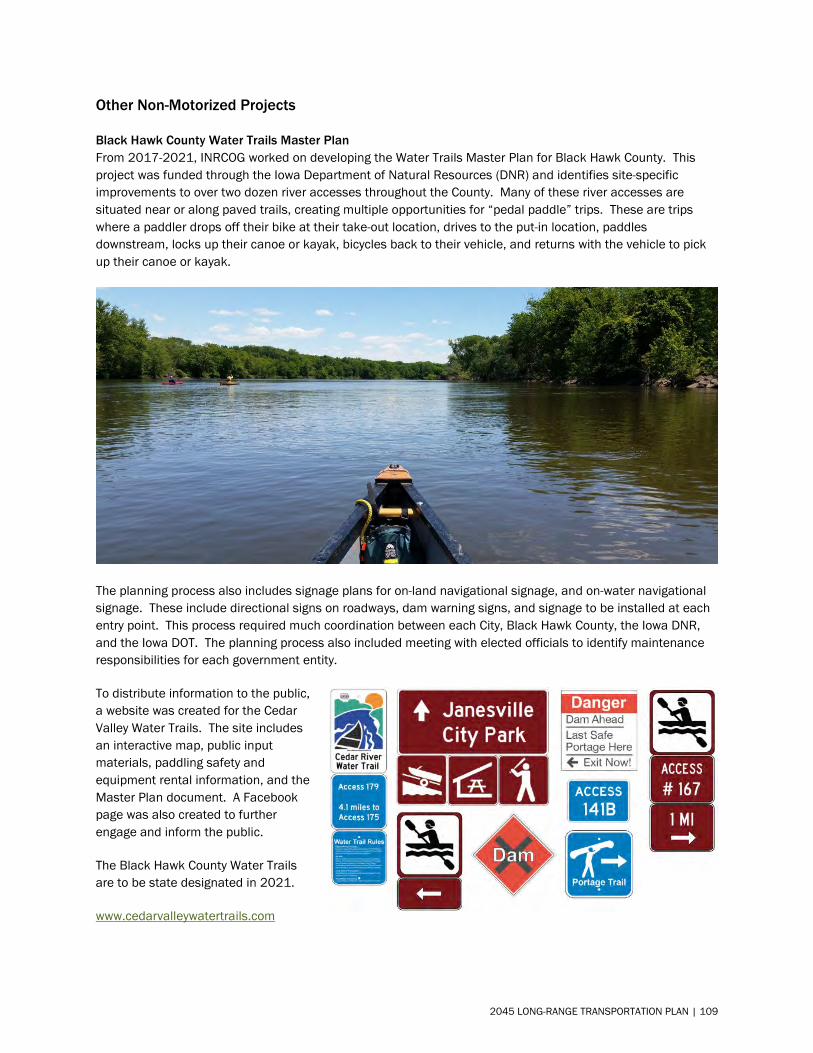
Other Non-Motorized Projects
Black Hawk County Water Trails Master Plan From 2017-2021, INRCOG worked on developing the Water Trails Master Plan for Black Hawk County. This project was funded through the Iowa Department of Natural Resources (DNR) and identifies site-specific improvements to over two dozen river accesses throughout the County. Many of these river accesses are situated near or along paved trails, creating multiple opportunities for “pedal paddle” trips. These are trips where a paddler drops off their bike at their take-out location, drives to the put-in location, paddles downstream, locks up their canoe or kayak, bicycles back to their vehicle, and returns with the vehicle to pick up their canoe or kayak.
The planning process also includes signage plans for on-land navigational signage, and on-water navigational signage. These include directional signs on roadways, dam warning signs, and signage to be installed at each entry point. This process required much coordination between each City, Black Hawk County, the Iowa DNR, and the Iowa DOT. The planning process also included meeting with elected officials to identify maintenance responsibilities for each government entity.
To distribute information to the public, a website was created for the Cedar Valley Water Trails. The site includes an interactive map, public input materials, paddling safety and equipment rental information, and the Master Plan document. A Facebook page was also created to further engage and inform the public.
The Black Hawk County Water Trails are to be state designated in 2021.
www.cedarvalleywatertrails.com
2045 LONG-RANGE TRANSPORTATION PLAN | 109
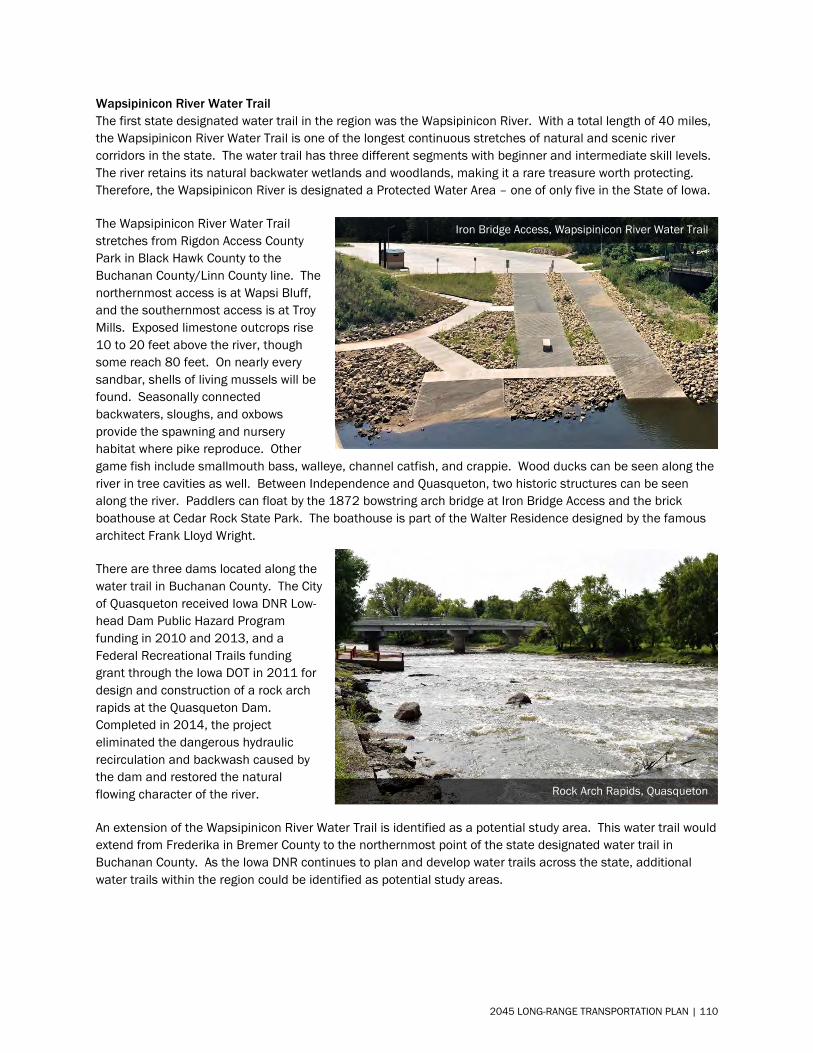
Wapsipinicon River Water Trail The first state designated water trail in the region was the Wapsipinicon River. With a total length of 40 miles, the Wapsipinicon River Water Trail is one of the longest continuous stretches of natural and scenic river corridors in the state. The water trail has three different segments with beginner and intermediate skill levels. The river retains its natural backwater wetlands and woodlands, making it a rare treasure worth protecting. Therefore, the Wapsipinicon River is designated a Protected Water Area – one of only five in the State of Iowa.
The Wapsipinicon River Water Trail stretches from Rigdon Access County Park in Black Hawk County to the Buchanan County/Linn County line. The northernmost access is at Wapsi Bluff, and the southernmost access is at Troy Mills. Exposed limestone outcrops rise 10 to 20 feet above the river, though some reach 80 feet. On nearly every sandbar, shells of living mussels will be found. Seasonally connected backwaters, sloughs, and oxbows provide the spawning and nursery habitat where pike reproduce. Other game fish include smallmouth bass, walleye, channel catfish, and crappie. Wood ducks can be seen along the river in tree cavities as well. Between Independence and Quasqueton, two historic structures can be seen along the river. Paddlers can float by the 1872 bowstring arch bridge at Iron Bridge Access and the brick boathouse at Cedar Rock State Park. The boathouse is part of the Walter Residence designed by the famous architect Frank Lloyd Wright.
There are three dams located along the water trail in Buchanan County. The City of Quasqueton received Iowa DNR Low-head Dam Public Hazard Program funding in 2010 and 2013, and a Federal Recreational Trails funding grant through the Iowa DOT in 2011 for design and construction of a rock arch rapids at the Quasqueton Dam. Completed in 2014, the project eliminated the dangerous hydraulic recirculation and backwash caused by the dam and restored the natural flowing character of the river.
An extension of the Wapsipinicon River Water Trail is identified as a potential study area. This water trail would extend from Frederika in Bremer County to the northernmost point of the state designated water trail in Buchanan County. As the Iowa DNR continues to plan and develop water trails across the state, additional water trails within the region could be identified as potential study areas.
Iron Bridge Access, Wapsipinicon River Water Trail
Rock Arch Rapids, Quasqueton
2045 LONG-RANGE TRANSPORTATION PLAN | 110
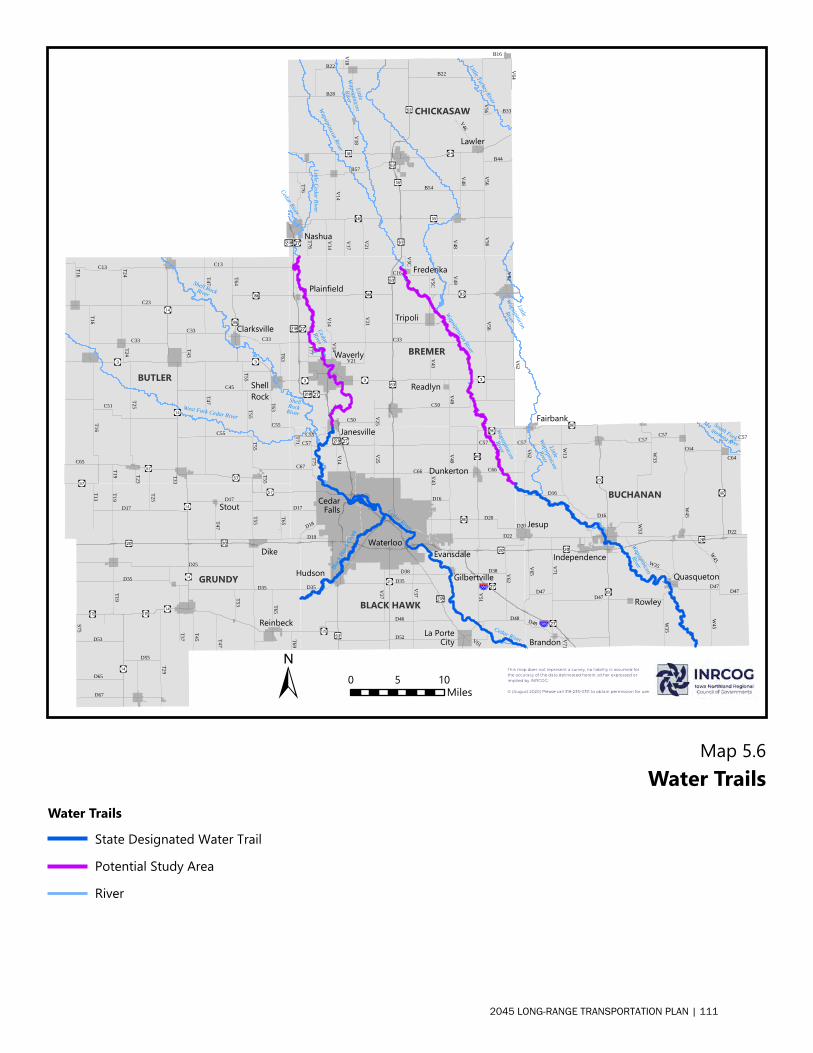
Waterloo
CedarFalls
Waverly
HudsonEvansdale
Jesup
IndependenceDike
La PorteCity
Tripoli
Reinbeck
ShellRock
Clarksville
Quasqueton
Dunkerton
Stout
Rowley
Fairbank
Frederika
Brandon
Readlyn
Plainfield
Janesville
Gilbertville
Lawler
Nashua
V56
T76
V18
V56
V18
V48
B22
V14
V64
B57
B16
B54
T45
B22
V56
B28
V48
T37
V46
T76
B44
V14V17
B33
C57
D46
V49
V51
V37
C66
D35
D48
T75
D19
D17
D38
D35
D38
C66
V43
D16
C57
D20
D22
V62
C55V25
V61
V14
D52
V27
D18T71
V56
V21
C33
V14
V43
C50
V49V48
V14
C50
V25
T77
V62V62
V21
V5C
V5C
C16
W45
D47
V71
V62
W35
W35
C57
V65
D16
W33
W13
C64
D48
V71
C64
D20
D47
W45
D47
V21
W45
C57
W33
D16
C57 C57
D22
D47
C51
C13 T24
C55
C45
C33
T16
T64T55
C33
T25
T55T55
C33
T55
C13T16
T16
T24
C55
T19
C23
T65
T47T47
T33
T63
C67
T43
T53
T23
C65
T25
T63
D17
T65
T29
D35
D25
T19
D65
T47
T13
T69
D55
D17
D35
S75
T55
D67
T47
D53
T19
Cedar River
Wapsipinicon
River
Cedar River
Black
Hawk
Creek
Wapsipinicon River
ShellRockRiver
CedarRiver
Little
Wapsipinicon
River
Wapsipinicon
River
Little
Wapsipinicon
River
South Fork
Ma quoketa River
Shell RockRiver
West Fork Cedar River
Wapsipinicon River
LittleWapsipinicon
River
Little Turkey River
Little Cedar River
Cedar River
BUTLER
GRUNDY
BREMER
BUCHANAN
BLACK HAWK
CHICKASAW
0 105Miles
Map 5.6
Water TrailsState Designated Water TrailPotential Study AreaRiver
Water Trails
This map does not represent a survey, no liability is assumed forthe accuracy of the data delineated herein, either expressed or implied by INRCOG.
© (August 2020) Please call 319-235-0311 to obtain permission for use.
2045 LONG-RANGE TRANSPORTATION PLAN | 111
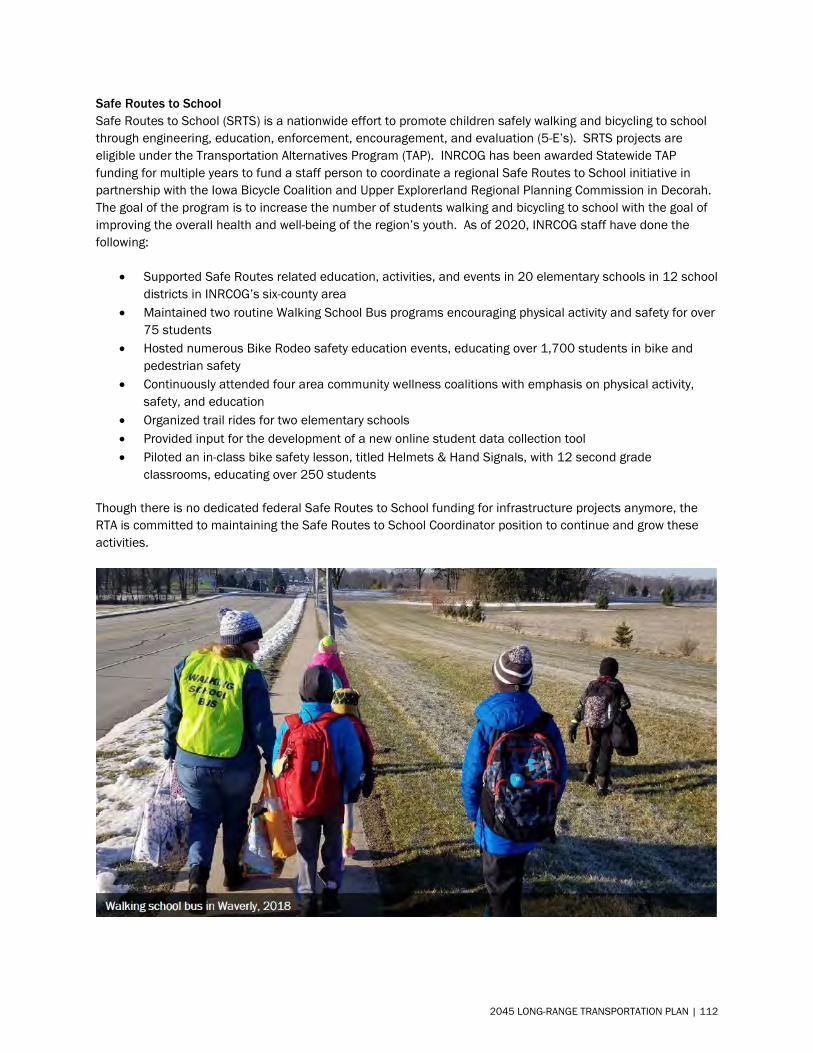
Safe Routes to School Safe Routes to School (SRTS) is a nationwide effort to promote children safely walking and bicycling to school through engineering, education, enforcement, encouragement, and evaluation (5-E’s). SRTS projects are eligible under the Transportation Alternatives Program (TAP). INRCOG has been awarded Statewide TAP funding for multiple years to fund a staff person to coordinate a regional Safe Routes to School initiative in partnership with the Iowa Bicycle Coalition and Upper Explorerland Regional Planning Commission in Decorah. The goal of the program is to increase the number of students walking and bicycling to school with the goal of improving the overall health and well-being of the region’s youth. As of 2020, INRCOG staff have done the following:
• Supported Safe Routes related education, activities, and events in 20 elementary schools in 12 schooldistricts in INRCOG’s six-county area
• Maintained two routine Walking School Bus programs encouraging physical activity and safety for over75 students
• Hosted numerous Bike Rodeo safety education events, educating over 1,700 students in bike andpedestrian safety
• Continuously attended four area community wellness coalitions with emphasis on physical activity,safety, and education
• Organized trail rides for two elementary schools• Provided input for the development of a new online student data collection tool• Piloted an in-class bike safety lesson, titled Helmets & Hand Signals, with 12 second grade
classrooms, educating over 250 students
Though there is no dedicated federal Safe Routes to School funding for infrastructure projects anymore, the RTA is committed to maintaining the Safe Routes to School Coordinator position to continue and grow these activities.
2045 LONG-RANGE TRANSPORTATION PLAN | 112
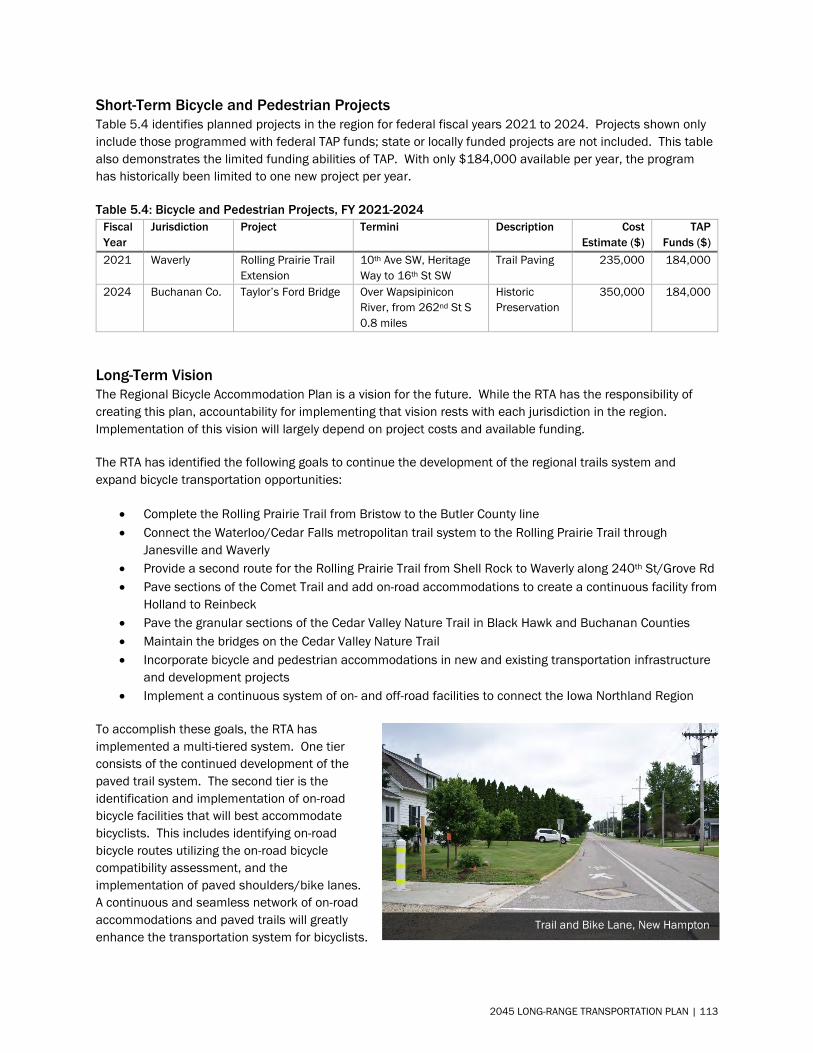
Short-Term Bicycle and Pedestrian Projects Table 5.4 identifies planned projects in the region for federal fiscal years 2021 to 2024. Projects shown only include those programmed with federal TAP funds; state or locally funded projects are not included. This table also demonstrates the limited funding abilities of TAP. With only $184,000 available per year, the program has historically been limited to one new project per year.
Table 5.4: Bicycle and Pedestrian Projects, FY 2021-2024 Fiscal Year
Jurisdiction Project Termini Description Cost Estimate ($)
TAP Funds ($)
2021 Waverly Rolling Prairie Trail Extension
10th Ave SW, Heritage Way to 16th St SW
Trail Paving 235,000 184,000
2024 Buchanan Co. Taylor’s Ford Bridge Over Wapsipinicon River, from 262nd St S 0.8 miles
Historic Preservation
350,000 184,000
Long-Term Vision The Regional Bicycle Accommodation Plan is a vision for the future. While the RTA has the responsibility of creating this plan, accountability for implementing that vision rests with each jurisdiction in the region. Implementation of this vision will largely depend on project costs and available funding.
The RTA has identified the following goals to continue the development of the regional trails system and expand bicycle transportation opportunities:
• Complete the Rolling Prairie Trail from Bristow to the Butler County line• Connect the Waterloo/Cedar Falls metropolitan trail system to the Rolling Prairie Trail through
Janesville and Waverly• Provide a second route for the Rolling Prairie Trail from Shell Rock to Waverly along 240th St/Grove Rd• Pave sections of the Comet Trail and add on-road accommodations to create a continuous facility from
Holland to Reinbeck• Pave the granular sections of the Cedar Valley Nature Trail in Black Hawk and Buchanan Counties• Maintain the bridges on the Cedar Valley Nature Trail• Incorporate bicycle and pedestrian accommodations in new and existing transportation infrastructure
and development projects• Implement a continuous system of on- and off-road facilities to connect the Iowa Northland Region
To accomplish these goals, the RTA has implemented a multi-tiered system. One tier consists of the continued development of the paved trail system. The second tier is the identification and implementation of on-road bicycle facilities that will best accommodate bicyclists. This includes identifying on-road bicycle routes utilizing the on-road bicycle compatibility assessment, and the implementation of paved shoulders/bike lanes. A continuous and seamless network of on-road accommodations and paved trails will greatly enhance the transportation system for bicyclists.
Trail and Bike Lane, New Hampton
2045 LONG-RANGE TRANSPORTATION PLAN | 113
Chapter 6
Freight
2045 LONG-RANGE TRANSPORTATION PLAN | 114
Chapter 6 – Freight Freight Background The economic success of a region depends largely on its multimodal freight networks and connections to the rest of the world, and its ability to facilitate the movement of people and goods across and within its boundaries. There are several modes of transportation that are utilized for this purpose and are important components of this Plan. Increased competition in today’s global economy often rewards those regions that actively plan for and pursue seamless transportation systems which depend on efficient connections between all modes of travel, including modes designed specifically for freight movements.
The focus of this chapter is to explore freight and multimodal transportation which often overlap. Multimodal can have several meanings with regard to transportation; it can mean specific containers designed to be transferred from one mode to another, such as truck to rail; it can mean freight or passenger trips that utilize more than one mode of transportation. The movement of freight frequently involves a number of steps and potentially multiple modes of transportation. There are four modes of freight transportation available in the region – truck, rail, air, and pipeline. The region does not contain any navigable waterways.
Freight transportation planning is critical in that the amount of freight transported continues to grow, thus placing substantial demands on the transportation system. Due to increasing truck traffic, highways and county roads are showing increased deterioration and requiring repair and replacement sooner than anticipated. Rail lines may not be able to handle the size and weight of today’s cargo and may be near capacity in areas. Pipelines are vital for the movement of oil and natural gas, and air cargo remains the quickest way to move a product across the country or world.
The significance of planning for multimodal networks and the importance of freight transportation has been emphasized by past federal transportation bills and continues with the FAST Act. Three of the FAST Act’s planning factors targeted towards the multimodal system and freight are:
• Support the economic vitality of the metropolitan area, especially byenabling global competitiveness, productivity, and efficiency.
• Increase the accessibility and mobility of people and for freight.• Enhance the integration and connectivity of the transportation system,
across and between modes, for people and freight.
The overall goal of the multimodal network, and planning for such, is to ensure the efficient and safe transport of persons and goods using the mode which is most beneficial given individual circumstances. To meet this goal, the connectivity and accessibility from all available modes is a critical factor in planning for the future transportation network of the region.
REGION STATS
230 Transportation and warehousing businesses1
12 Miles of active rail lines2
69 Road-rail incidents over the past 20 years3
585 Miles of active pipeline4
1U.S. Census Bureau, 2017 American Community Survey 5-year Estimates
2Iowa DOT, REST Services, Active Rail Lines, 2018
3Federal Railroad Administration, Accident Data as reported by Railroads
4U.S. DOT Pipeline and Hazardous Materials Safety Administration, National Pipeline Mapping System
2045 LONG-RANGE TRANSPORTATION PLAN | 115
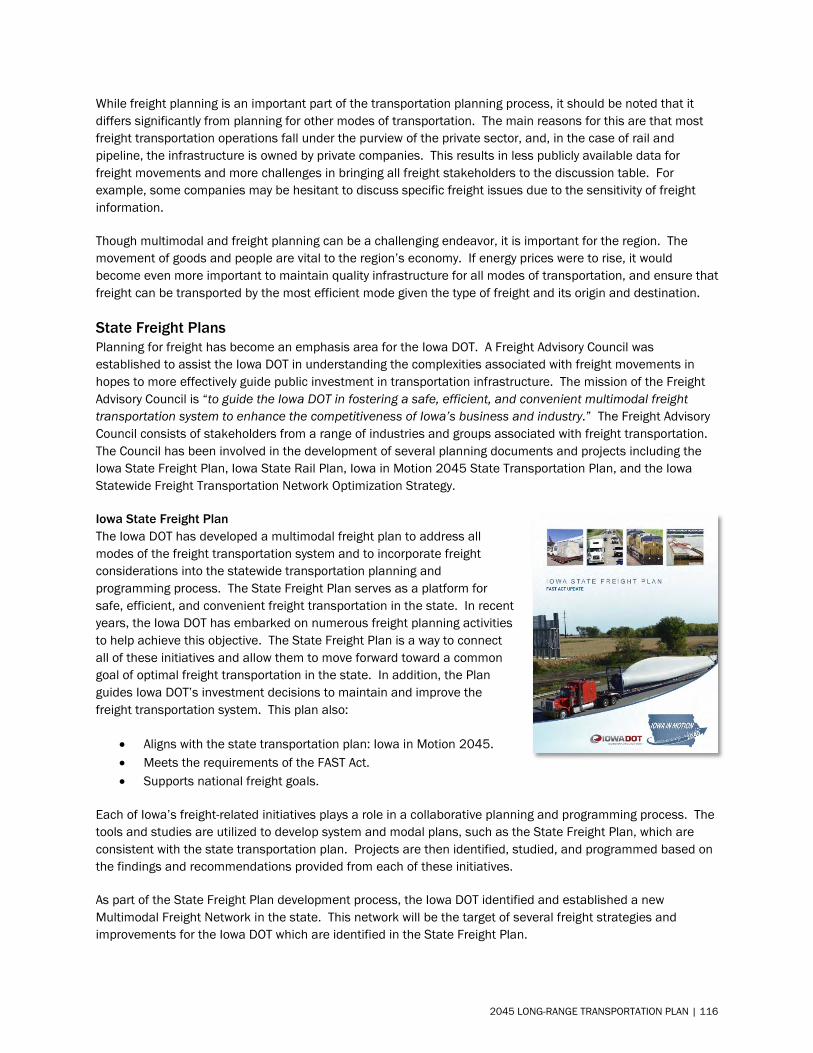
While freight planning is an important part of the transportation planning process, it should be noted that it differs significantly from planning for other modes of transportation. The main reasons for this are that most freight transportation operations fall under the purview of the private sector, and, in the case of rail and pipeline, the infrastructure is owned by private companies. This results in less publicly available data for freight movements and more challenges in bringing all freight stakeholders to the discussion table. For example, some companies may be hesitant to discuss specific freight issues due to the sensitivity of freight information.
Though multimodal and freight planning can be a challenging endeavor, it is important for the region. The movement of goods and people are vital to the region’s economy. If energy prices were to rise, it would become even more important to maintain quality infrastructure for all modes of transportation, and ensure that freight can be transported by the most efficient mode given the type of freight and its origin and destination.
State Freight Plans Planning for freight has become an emphasis area for the Iowa DOT. A Freight Advisory Council was established to assist the Iowa DOT in understanding the complexities associated with freight movements in hopes to more effectively guide public investment in transportation infrastructure. The mission of the Freight Advisory Council is “to guide the Iowa DOT in fostering a safe, efficient, and convenient multimodal freight transportation system to enhance the competitiveness of Iowa’s business and industry.” The Freight Advisory Council consists of stakeholders from a range of industries and groups associated with freight transportation. The Council has been involved in the development of several planning documents and projects including the Iowa State Freight Plan, Iowa State Rail Plan, Iowa in Motion 2045 State Transportation Plan, and the Iowa Statewide Freight Transportation Network Optimization Strategy.
Iowa State Freight Plan The Iowa DOT has developed a multimodal freight plan to address all modes of the freight transportation system and to incorporate freight considerations into the statewide transportation planning and programming process. The State Freight Plan serves as a platform for safe, efficient, and convenient freight transportation in the state. In recent years, the Iowa DOT has embarked on numerous freight planning activities to help achieve this objective. The State Freight Plan is a way to connect all of these initiatives and allow them to move forward toward a common goal of optimal freight transportation in the state. In addition, the Plan guides Iowa DOT’s investment decisions to maintain and improve the freight transportation system. This plan also:
• Aligns with the state transportation plan: Iowa in Motion 2045.• Meets the requirements of the FAST Act.• Supports national freight goals.
Each of Iowa’s freight-related initiatives plays a role in a collaborative planning and programming process. The tools and studies are utilized to develop system and modal plans, such as the State Freight Plan, which are consistent with the state transportation plan. Projects are then identified, studied, and programmed based on the findings and recommendations provided from each of these initiatives.
As part of the State Freight Plan development process, the Iowa DOT identified and established a new Multimodal Freight Network in the state. This network will be the target of several freight strategies and improvements for the Iowa DOT which are identified in the State Freight Plan.
2045 LONG-RANGE TRANSPORTATION PLAN | 116
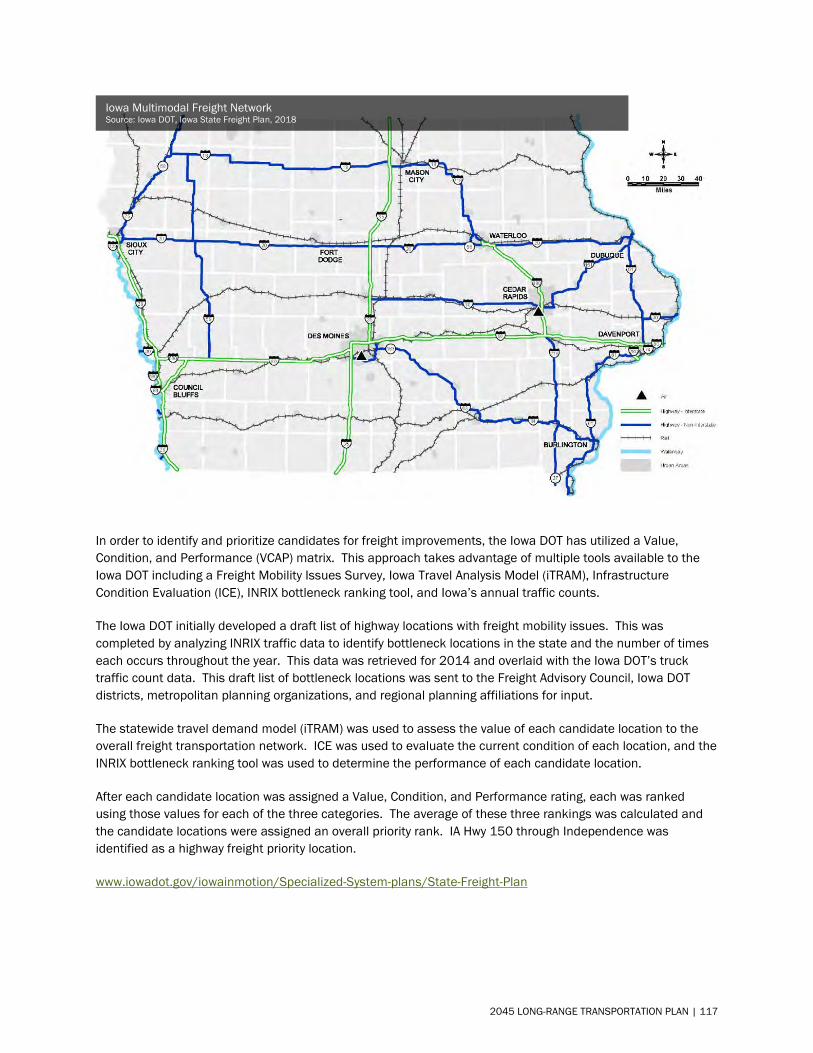
In order to identify and prioritize candidates for freight improvements, the Iowa DOT has utilized a Value, Condition, and Performance (VCAP) matrix. This approach takes advantage of multiple tools available to the Iowa DOT including a Freight Mobility Issues Survey, Iowa Travel Analysis Model (iTRAM), Infrastructure Condition Evaluation (ICE), INRIX bottleneck ranking tool, and Iowa’s annual traffic counts.
The Iowa DOT initially developed a draft list of highway locations with freight mobility issues. This was completed by analyzing INRIX traffic data to identify bottleneck locations in the state and the number of times each occurs throughout the year. This data was retrieved for 2014 and overlaid with the Iowa DOT’s truck traffic count data. This draft list of bottleneck locations was sent to the Freight Advisory Council, Iowa DOT districts, metropolitan planning organizations, and regional planning affiliations for input.
The statewide travel demand model (iTRAM) was used to assess the value of each candidate location to the overall freight transportation network. ICE was used to evaluate the current condition of each location, and the INRIX bottleneck ranking tool was used to determine the performance of each candidate location.
After each candidate location was assigned a Value, Condition, and Performance rating, each was ranked using those values for each of the three categories. The average of these three rankings was calculated and the candidate locations were assigned an overall priority rank. IA Hwy 150 through Independence was identified as a highway freight priority location.
www.iowadot.gov/iowainmotion/Specialized-System-plans/State-Freight-Plan
Iowa Multimodal Freight Network Source: Iowa DOT, Iowa State Freight Plan, 2018
2045 LONG-RANGE TRANSPORTATION PLAN | 117
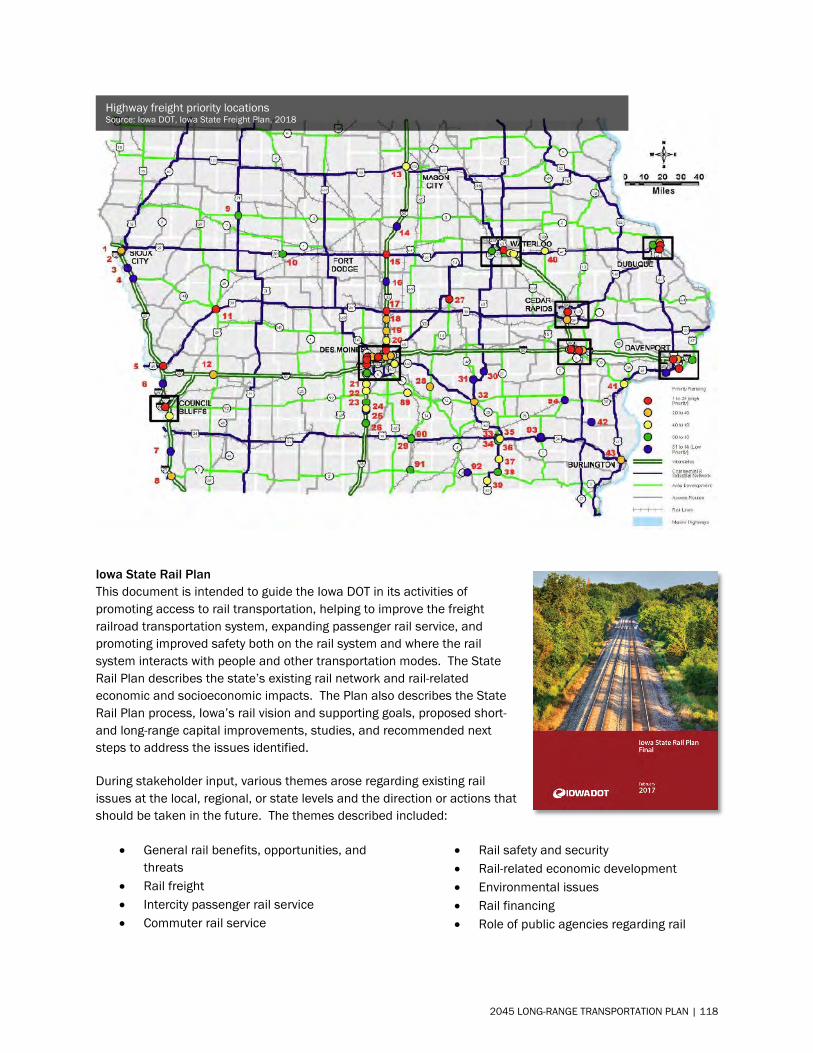
Iowa State Rail Plan This document is intended to guide the Iowa DOT in its activities of promoting access to rail transportation, helping to improve the freight railroad transportation system, expanding passenger rail service, and promoting improved safety both on the rail system and where the rail system interacts with people and other transportation modes. The State Rail Plan describes the state’s existing rail network and rail-related economic and socioeconomic impacts. The Plan also describes the State Rail Plan process, Iowa’s rail vision and supporting goals, proposed short- and long-range capital improvements, studies, and recommended next steps to address the issues identified.
During stakeholder input, various themes arose regarding existing rail issues at the local, regional, or state levels and the direction or actions that should be taken in the future. The themes described included:
• General rail benefits, opportunities, andthreats
• Rail freight• Intercity passenger rail service• Commuter rail service
• Rail safety and security• Rail-related economic development• Environmental issues• Rail financing• Role of public agencies regarding rail
Highway freight priority locations Source: Iowa DOT, Iowa State Freight Plan, 2018
2045 LONG-RANGE TRANSPORTATION PLAN | 118
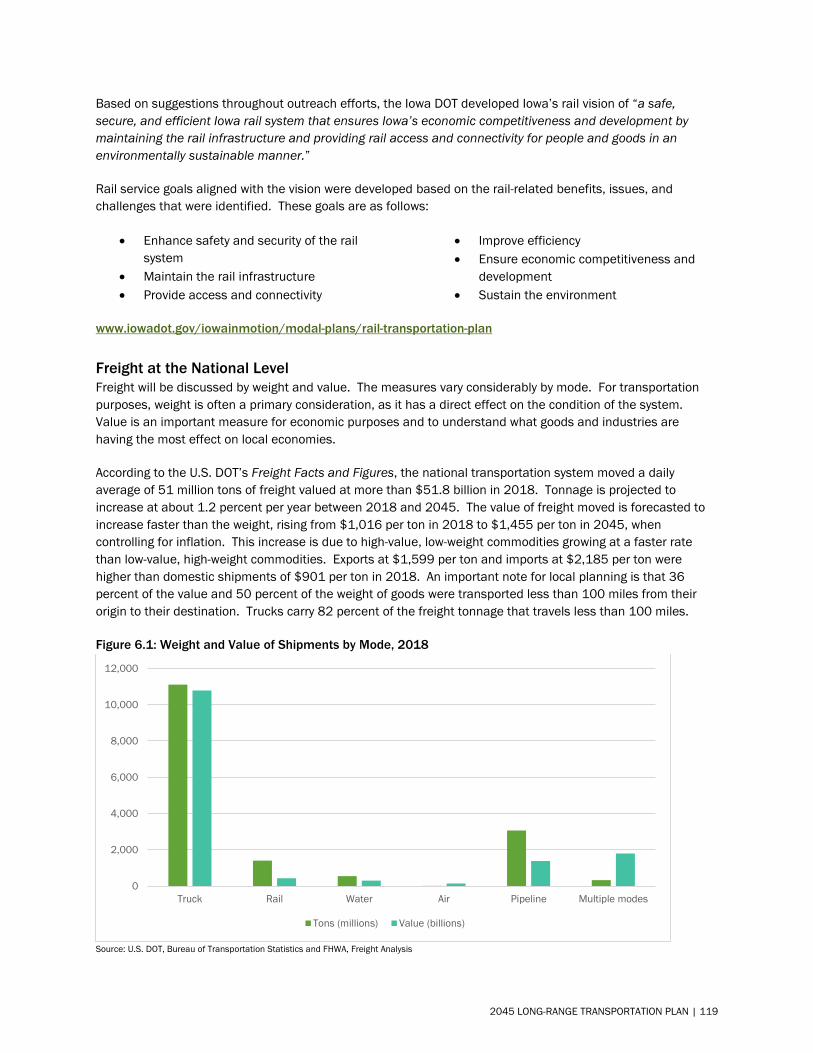
Based on suggestions throughout outreach efforts, the Iowa DOT developed Iowa’s rail vision of “a safe, secure, and efficient Iowa rail system that ensures Iowa’s economic competitiveness and development by maintaining the rail infrastructure and providing rail access and connectivity for people and goods in an environmentally sustainable manner.”
Rail service goals aligned with the vision were developed based on the rail-related benefits, issues, and challenges that were identified. These goals are as follows:
• Enhance safety and security of the rail system
• Maintain the rail infrastructure • Provide access and connectivity
• Improve efficiency • Ensure economic competitiveness and
development • Sustain the environment
www.iowadot.gov/iowainmotion/modal-plans/rail-transportation-plan Freight at the National Level Freight will be discussed by weight and value. The measures vary considerably by mode. For transportation purposes, weight is often a primary consideration, as it has a direct effect on the condition of the system. Value is an important measure for economic purposes and to understand what goods and industries are having the most effect on local economies.
According to the U.S. DOT’s Freight Facts and Figures, the national transportation system moved a daily average of 51 million tons of freight valued at more than $51.8 billion in 2018. Tonnage is projected to increase at about 1.2 percent per year between 2018 and 2045. The value of freight moved is forecasted to increase faster than the weight, rising from $1,016 per ton in 2018 to $1,455 per ton in 2045, when controlling for inflation. This increase is due to high-value, low-weight commodities growing at a faster rate than low-value, high-weight commodities. Exports at $1,599 per ton and imports at $2,185 per ton were higher than domestic shipments of $901 per ton in 2018. An important note for local planning is that 36 percent of the value and 50 percent of the weight of goods were transported less than 100 miles from their origin to their destination. Trucks carry 82 percent of the freight tonnage that travels less than 100 miles.
Figure 6.1: Weight and Value of Shipments by Mode, 2018
Source: U.S. DOT, Bureau of Transportation Statistics and FHWA, Freight Analysis
0
2,000
4,000
6,000
8,000
10,000
12,000
Truck Rail Water Air Pipeline Multiple modes
Tons (millions) Value (billions)
2045 LONG-RANGE TRANSPORTATION PLAN | 119
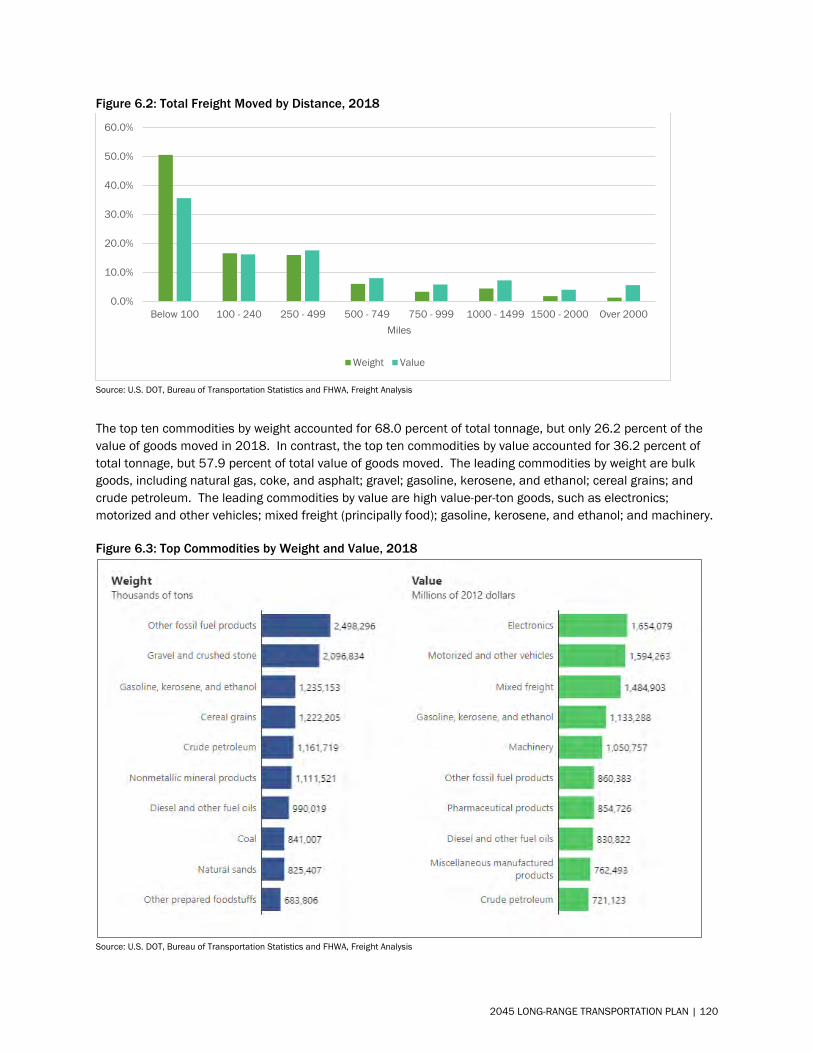
Figure 6.2: Total Freight Moved by Distance, 2018
Source: U.S. DOT, Bureau of Transportation Statistics and FHWA, Freight Analysis
The top ten commodities by weight accounted for 68.0 percent of total tonnage, but only 26.2 percent of the value of goods moved in 2018. In contrast, the top ten commodities by value accounted for 36.2 percent of total tonnage, but 57.9 percent of total value of goods moved. The leading commodities by weight are bulk goods, including natural gas, coke, and asphalt; gravel; gasoline, kerosene, and ethanol; cereal grains; and crude petroleum. The leading commodities by value are high value-per-ton goods, such as electronics; motorized and other vehicles; mixed freight (principally food); gasoline, kerosene, and ethanol; and machinery.
Figure 6.3: Top Commodities by Weight and Value, 2018
Source: U.S. DOT, Bureau of Transportation Statistics and FHWA, Freight Analysis
0.0%
10.0%
20.0%
30.0%
40.0%
50.0%
60.0%
Below 100 100 - 240 250 - 499 500 - 749 750 - 999 1000 - 1499 1500 - 2000 Over 2000Miles
Weight Value
2045 LONG-RANGE TRANSPORTATION PLAN | 120
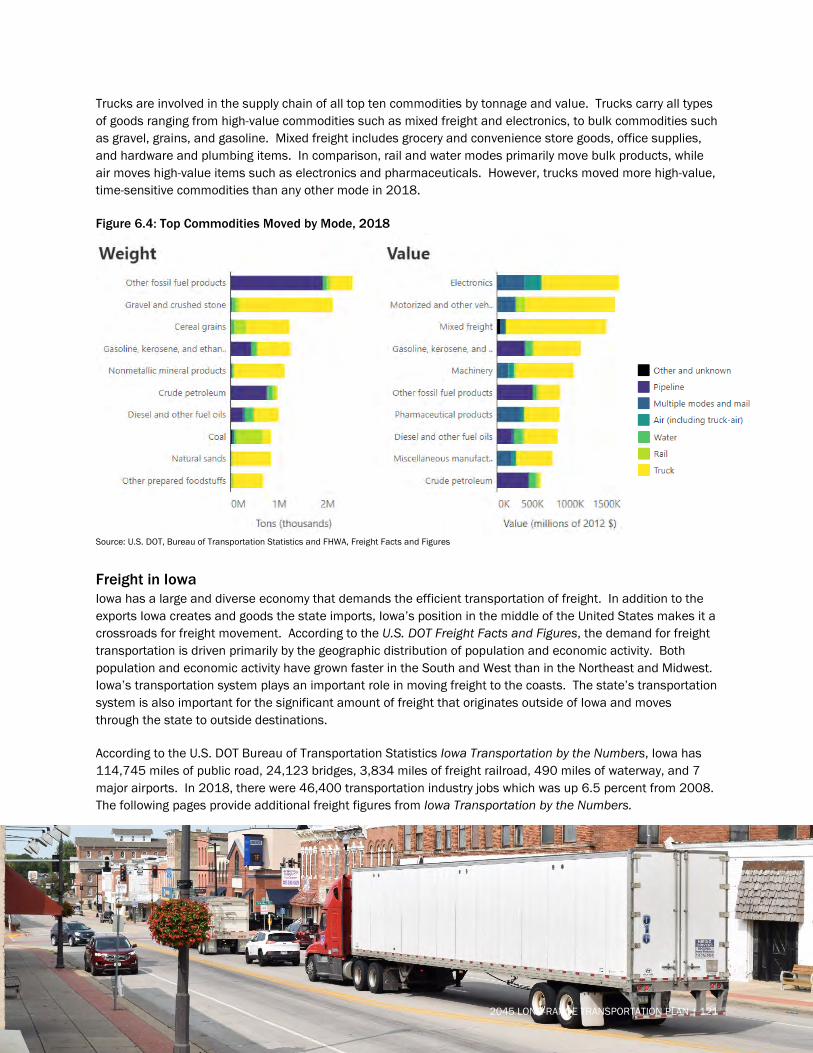
Trucks are involved in the supply chain of all top ten commodities by tonnage and value. Trucks carry all types of goods ranging from high-value commodities such as mixed freight and electronics, to bulk commodities such as gravel, grains, and gasoline. Mixed freight includes grocery and convenience store goods, office supplies, and hardware and plumbing items. In comparison, rail and water modes primarily move bulk products, while air moves high-value items such as electronics and pharmaceuticals. However, trucks moved more high-value, time-sensitive commodities than any other mode in 2018.
Figure 6.4: Top Commodities Moved by Mode, 2018
Source: U.S. DOT, Bureau of Transportation Statistics and FHWA, Freight Facts and Figures
Freight in Iowa Iowa has a large and diverse economy that demands the efficient transportation of freight. In addition to the exports Iowa creates and goods the state imports, Iowa’s position in the middle of the United States makes it a crossroads for freight movement. According to the U.S. DOT Freight Facts and Figures, the demand for freight transportation is driven primarily by the geographic distribution of population and economic activity. Both population and economic activity have grown faster in the South and West than in the Northeast and Midwest. Iowa’s transportation system plays an important role in moving freight to the coasts. The state’s transportation system is also important for the significant amount of freight that originates outside of Iowa and moves through the state to outside destinations.
According to the U.S. DOT Bureau of Transportation Statistics Iowa Transportation by the Numbers, Iowa has 114,745 miles of public road, 24,123 bridges, 3,834 miles of freight railroad, 490 miles of waterway, and 7 major airports. In 2018, there were 46,400 transportation industry jobs which was up 6.5 percent from 2008. The following pages provide additional freight figures from Iowa Transportation by the Numbers.
2045 LONG-RANGE TRANSPORTATION PLAN | 121
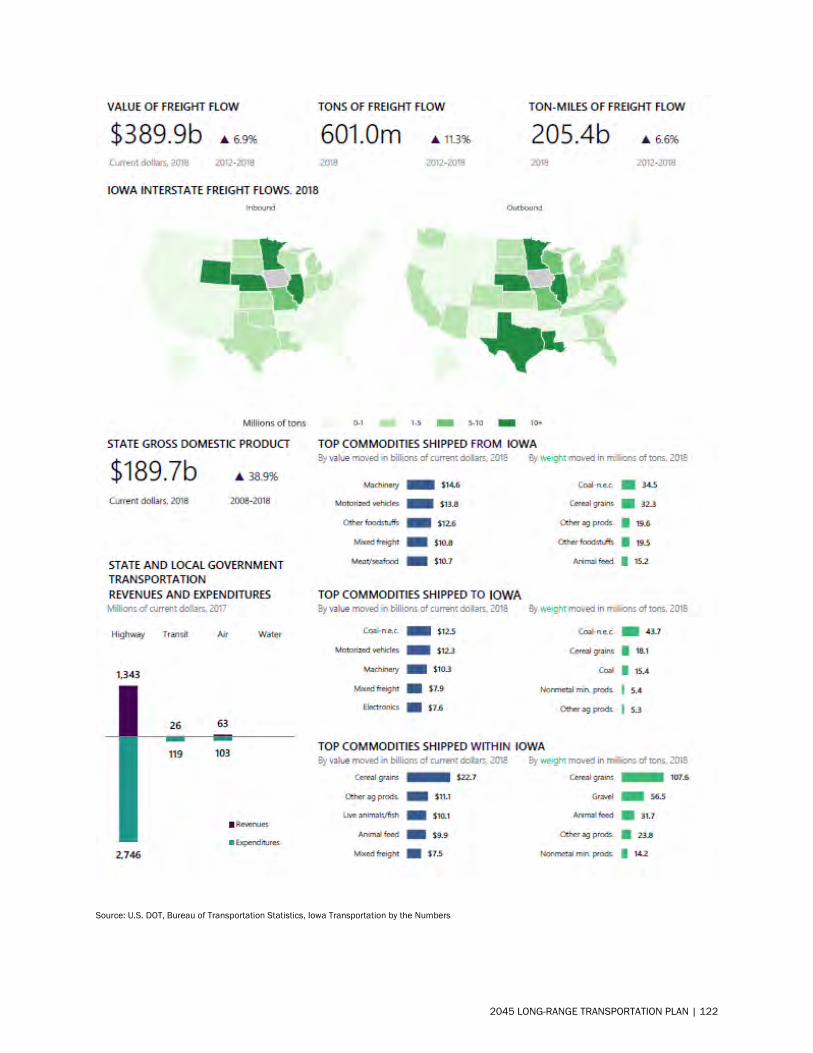
Source: U.S. DOT, Bureau of Transportation Statistics, Iowa Transportation by the Numbers
2045 LONG-RANGE TRANSPORTATION PLAN | 122
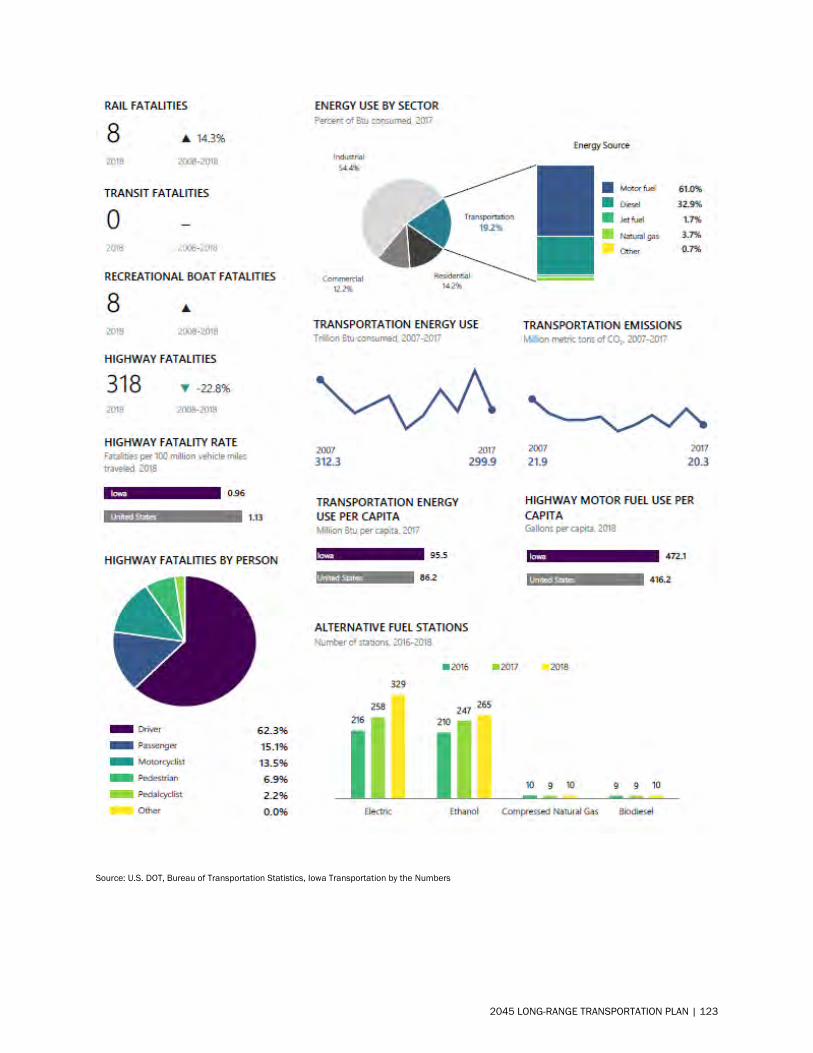
Source: U.S. DOT, Bureau of Transportation Statistics, Iowa Transportation by the Numbers
2045 LONG-RANGE TRANSPORTATION PLAN | 123
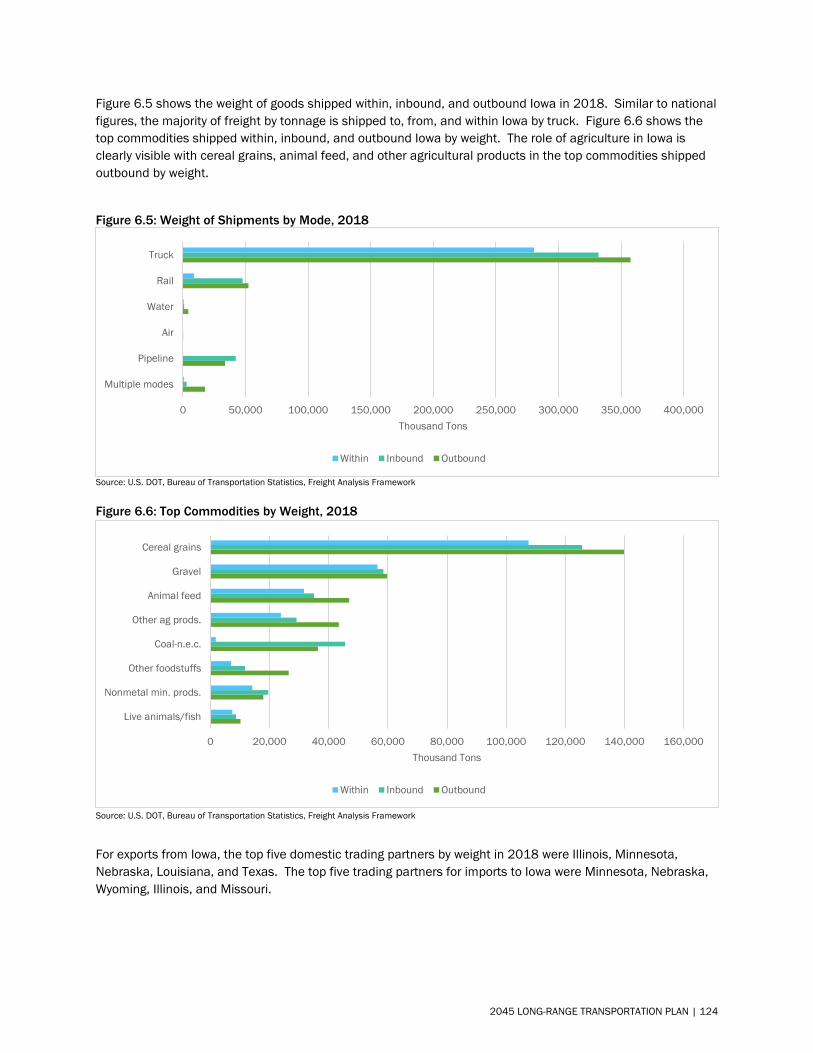
Figure 6.5 shows the weight of goods shipped within, inbound, and outbound Iowa in 2018. Similar to national figures, the majority of freight by tonnage is shipped to, from, and within Iowa by truck. Figure 6.6 shows the top commodities shipped within, inbound, and outbound Iowa by weight. The role of agriculture in Iowa is clearly visible with cereal grains, animal feed, and other agricultural products in the top commodities shipped outbound by weight.
Figure 6.5: Weight of Shipments by Mode, 2018
Source: U.S. DOT, Bureau of Transportation Statistics, Freight Analysis Framework
Figure 6.6: Top Commodities by Weight, 2018
Source: U.S. DOT, Bureau of Transportation Statistics, Freight Analysis Framework
For exports from Iowa, the top five domestic trading partners by weight in 2018 were Illinois, Minnesota, Nebraska, Louisiana, and Texas. The top five trading partners for imports to Iowa were Minnesota, Nebraska, Wyoming, Illinois, and Missouri.
0 50,000 100,000 150,000 200,000 250,000 300,000 350,000 400,000
Multiple modes
Pipeline
Air
Water
Rail
Truck
Thousand Tons
Within Inbound Outbound
0 20,000 40,000 60,000 80,000 100,000 120,000 140,000 160,000
Live animals/fish
Nonmetal min. prods.
Other foodstuffs
Coal-n.e.c.
Other ag prods.
Animal feed
Gravel
Cereal grains
Thousand Tons
Within Inbound Outbound
2045 LONG-RANGE TRANSPORTATION PLAN | 124
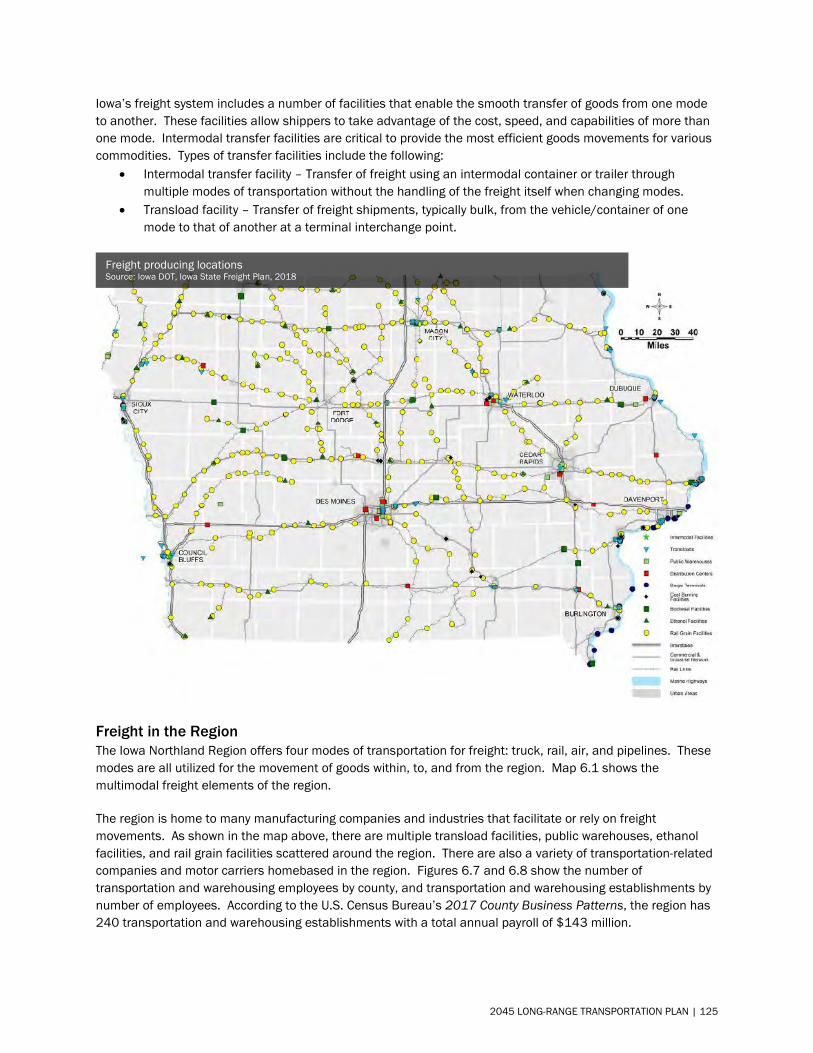
Iowa’s freight system includes a number of facilities that enable the smooth transfer of goods from one mode to another. These facilities allow shippers to take advantage of the cost, speed, and capabilities of more than one mode. Intermodal transfer facilities are critical to provide the most efficient goods movements for various commodities. Types of transfer facilities include the following:
• Intermodal transfer facility – Transfer of freight using an intermodal container or trailer throughmultiple modes of transportation without the handling of the freight itself when changing modes.
• Transload facility – Transfer of freight shipments, typically bulk, from the vehicle/container of onemode to that of another at a terminal interchange point.
Freight in the Region The Iowa Northland Region offers four modes of transportation for freight: truck, rail, air, and pipelines. These modes are all utilized for the movement of goods within, to, and from the region. Map 6.1 shows the multimodal freight elements of the region.
The region is home to many manufacturing companies and industries that facilitate or rely on freight movements. As shown in the map above, there are multiple transload facilities, public warehouses, ethanol facilities, and rail grain facilities scattered around the region. There are also a variety of transportation-related companies and motor carriers homebased in the region. Figures 6.7 and 6.8 show the number of transportation and warehousing employees by county, and transportation and warehousing establishments by number of employees. According to the U.S. Census Bureau’s 2017 County Business Patterns, the region has 240 transportation and warehousing establishments with a total annual payroll of $143 million.
Freight producing locations Source: Iowa DOT, Iowa State Freight Plan, 2018
2045 LONG-RANGE TRANSPORTATION PLAN | 125
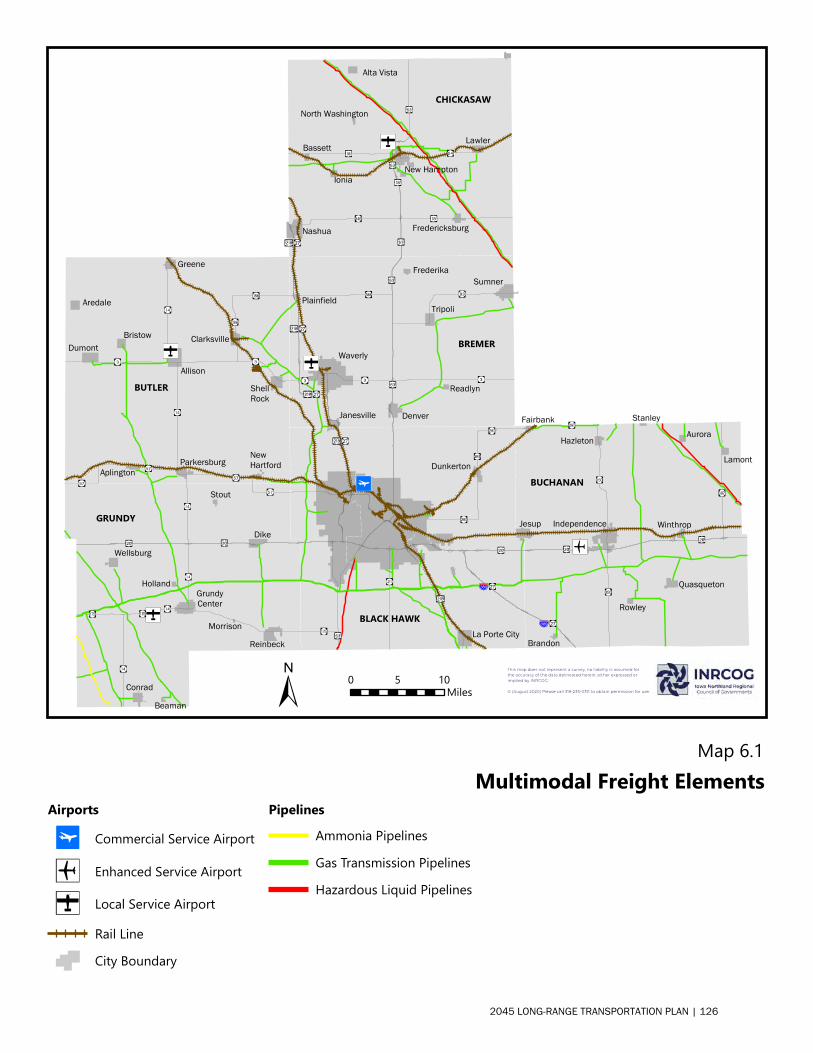
La Porte City
Dunkerton
Janesville
IndependenceJesup
Quasqueton
Hazleton
Fairbank
Winthrop
Lamont
Aurora
Rowley
Brandon
Stanley
Dike
Reinbeck
GrundyCenter
Conrad
Wellsburg
Stout
Holland
Beaman
Morrison
Allison
Dumont
Greene
ShellRock
Aredale
ClarksvilleBristow
ParkersburgAplington
NewHartford
Waverly
Sumner
Denver
Tripoli
Frederika
Readlyn
Plainfield
Nashua
New Hampton
Lawler
Ionia
Alta Vista
Fredericksburg
Bassett
North Washington
BUTLER
GRUNDY
BREMER
BUCHANAN
BLACK HAWK
CHICKASAW
0 105Miles
Map 6.1
AirportsCommercial Service Airport
Enhanced Service Airport
Local Service AirportRail LineCity Boundary
PipelinesAmmonia PipelinesGas Transmission PipelinesHazardous Liquid Pipelines
Multimodal Freight Elements
This map does not represent a survey, no liability is assumed forthe accuracy of the data delineated herein, either expressed or implied by INRCOG.
© (August 2020) Please call 319-235-0311 to obtain permission for use.
2045 LONG-RANGE TRANSPORTATION PLAN | 126
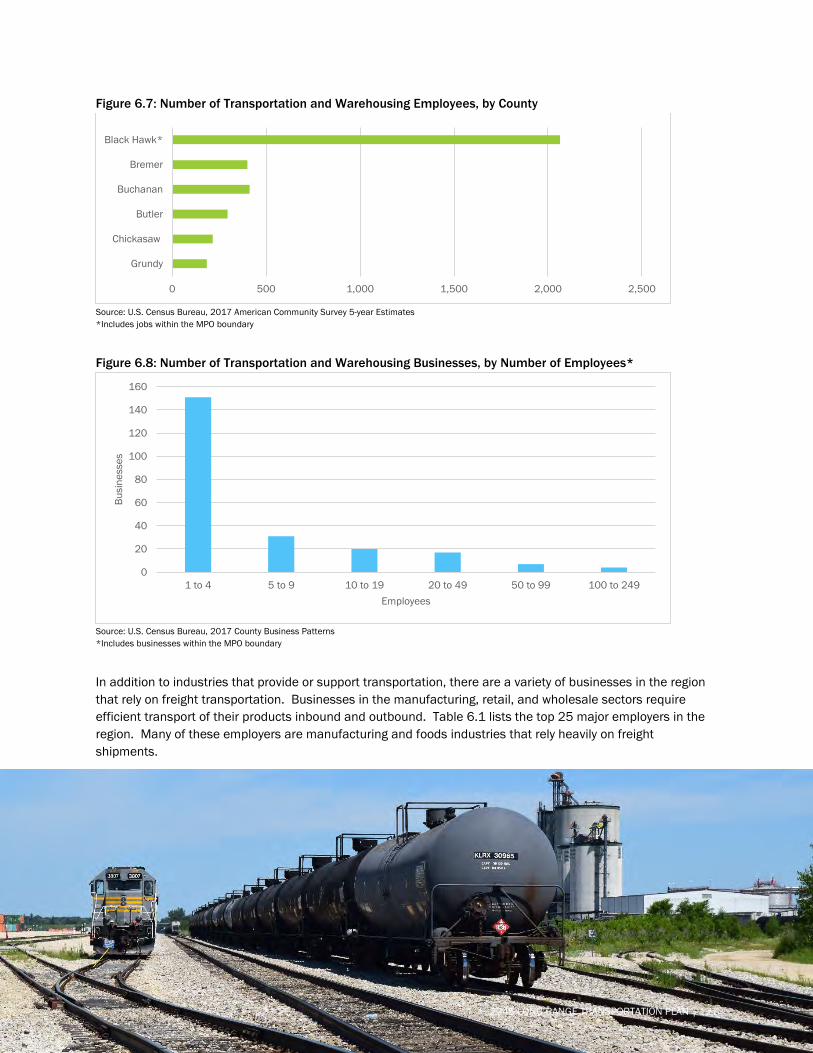
Figure 6.7: Number of Transportation and Warehousing Employees, by County
Source: U.S. Census Bureau, 2017 American Community Survey 5-year Estimates *Includes jobs within the MPO boundary
Figure 6.8: Number of Transportation and Warehousing Businesses, by Number of Employees*
Source: U.S. Census Bureau, 2017 County Business Patterns *Includes businesses within the MPO boundary
In addition to industries that provide or support transportation, there are a variety of businesses in the region that rely on freight transportation. Businesses in the manufacturing, retail, and wholesale sectors require efficient transport of their products inbound and outbound. Table 6.1 lists the top 25 major employers in the region. Many of these employers are manufacturing and foods industries that rely heavily on freight shipments.
0 500 1,000 1,500 2,000 2,500
Grundy
Chickasaw
Butler
Buchanan
Bremer
Black Hawk*
0
20
40
60
80
100
120
140
160
1 to 4 5 to 9 10 to 19 20 to 49 50 to 99 100 to 249
Busi
ness
es
Employees
2045 LONG-RANGE TRANSPORTATION PLAN | 127
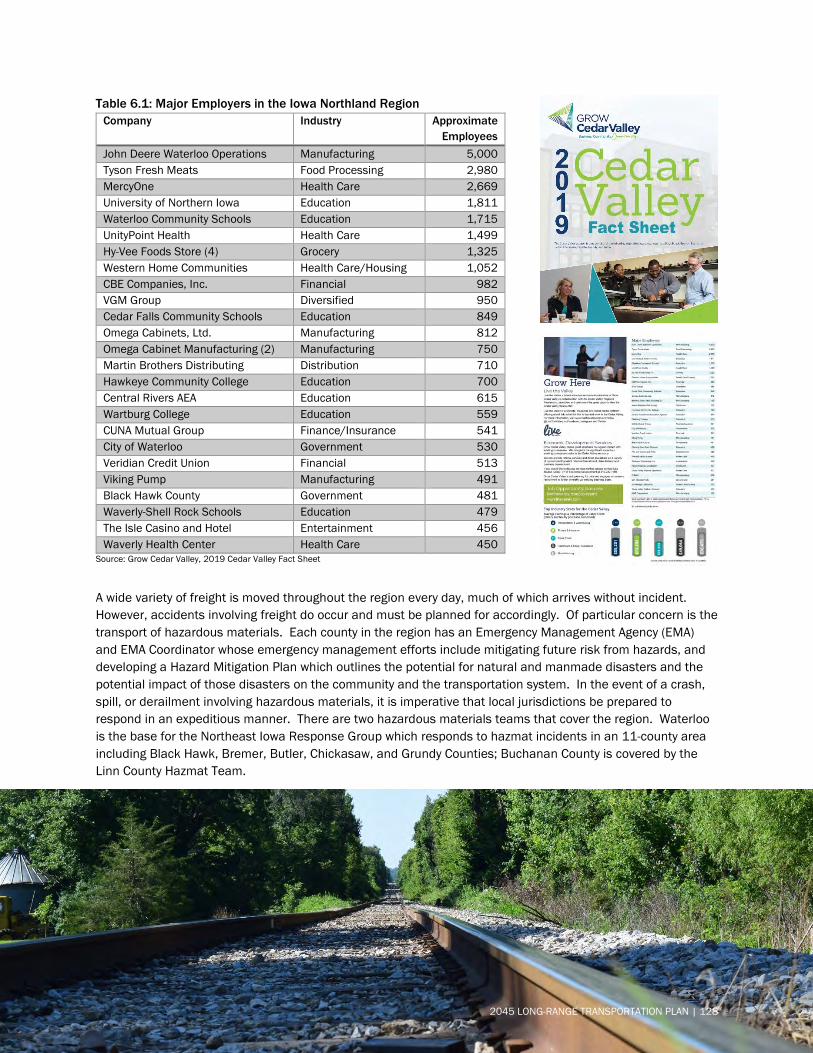
Table 6.1: Major Employers in the Iowa Northland Region Company Industry Approximate
Employees John Deere Waterloo Operations Manufacturing 5,000 Tyson Fresh Meats Food Processing 2,980 MercyOne Health Care 2,669 University of Northern Iowa Education 1,811 Waterloo Community Schools Education 1,715 UnityPoint Health Health Care 1,499 Hy-Vee Foods Store (4) Grocery 1,325 Western Home Communities Health Care/Housing 1,052 CBE Companies, Inc. Financial 982 VGM Group Diversified 950 Cedar Falls Community Schools Education 849 Omega Cabinets, Ltd. Manufacturing 812 Omega Cabinet Manufacturing (2) Manufacturing 750 Martin Brothers Distributing Distribution 710 Hawkeye Community College Education 700 Central Rivers AEA Education 615 Wartburg College Education 559 CUNA Mutual Group Finance/Insurance 541 City of Waterloo Government 530 Veridian Credit Union Financial 513 Viking Pump Manufacturing 491 Black Hawk County Government 481 Waverly-Shell Rock Schools Education 479 The Isle Casino and Hotel Entertainment 456 Waverly Health Center Health Care 450
Source: Grow Cedar Valley, 2019 Cedar Valley Fact Sheet
A wide variety of freight is moved throughout the region every day, much of which arrives without incident. However, accidents involving freight do occur and must be planned for accordingly. Of particular concern is the transport of hazardous materials. Each county in the region has an Emergency Management Agency (EMA) and EMA Coordinator whose emergency management efforts include mitigating future risk from hazards, and developing a Hazard Mitigation Plan which outlines the potential for natural and manmade disasters and the potential impact of those disasters on the community and the transportation system. In the event of a crash, spill, or derailment involving hazardous materials, it is imperative that local jurisdictions be prepared to respond in an expeditious manner. There are two hazardous materials teams that cover the region. Waterloo is the base for the Northeast Iowa Response Group which responds to hazmat incidents in an 11-county area including Black Hawk, Bremer, Butler, Chickasaw, and Grundy Counties; Buchanan County is covered by the Linn County Hazmat Team.
2045 LONG-RANGE TRANSPORTATION PLAN | 128
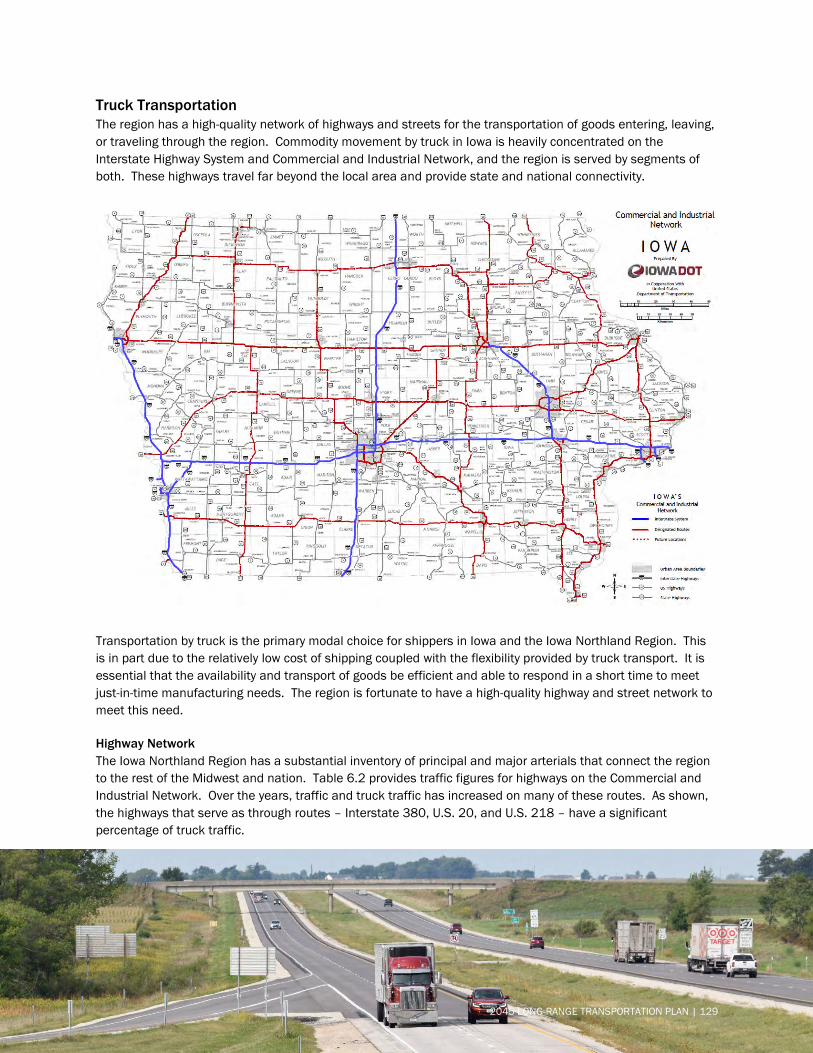
Truck Transportation The region has a high-quality network of highways and streets for the transportation of goods entering, leaving, or traveling through the region. Commodity movement by truck in Iowa is heavily concentrated on the Interstate Highway System and Commercial and Industrial Network, and the region is served by segments of both. These highways travel far beyond the local area and provide state and national connectivity.
Transportation by truck is the primary modal choice for shippers in Iowa and the Iowa Northland Region. This is in part due to the relatively low cost of shipping coupled with the flexibility provided by truck transport. It is essential that the availability and transport of goods be efficient and able to respond in a short time to meet just-in-time manufacturing needs. The region is fortunate to have a high-quality highway and street network to meet this need.
Highway Network The Iowa Northland Region has a substantial inventory of principal and major arterials that connect the region to the rest of the Midwest and nation. Table 6.2 provides traffic figures for highways on the Commercial and Industrial Network. Over the years, traffic and truck traffic has increased on many of these routes. As shown, the highways that serve as through routes – Interstate 380, U.S. 20, and U.S. 218 – have a significant percentage of truck traffic.
2045 LONG-RANGE TRANSPORTATION PLAN | 129
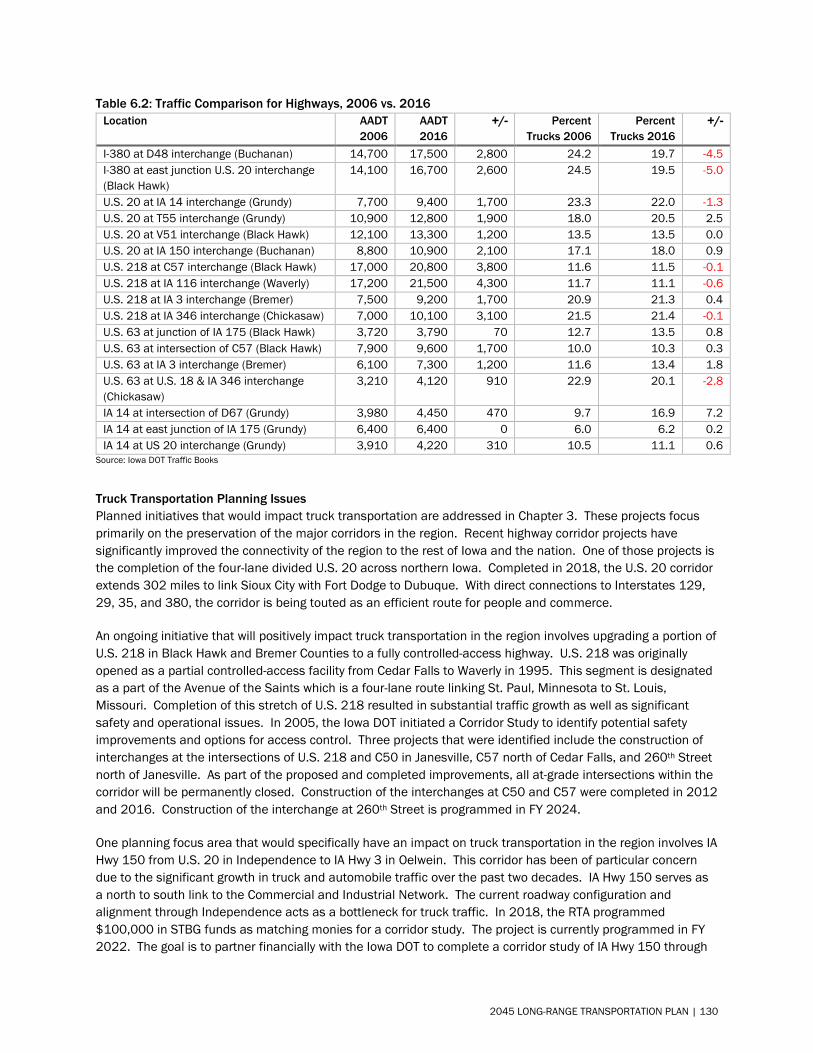
Table 6.2: Traffic Comparison for Highways, 2006 vs. 2016 Location AADT
2006 AADT 2016
+/- Percent Trucks 2006
Percent Trucks 2016
+/-
I-380 at D48 interchange (Buchanan) 14,700 17,500 2,800 24.2 19.7 -4.5I-380 at east junction U.S. 20 interchange(Black Hawk)
14,100 16,700 2,600 24.5 19.5 -5.0
U.S. 20 at IA 14 interchange (Grundy) 7,700 9,400 1,700 23.3 22.0 -1.3U.S. 20 at T55 interchange (Grundy) 10,900 12,800 1,900 18.0 20.5 2.5 U.S. 20 at V51 interchange (Black Hawk) 12,100 13,300 1,200 13.5 13.5 0.0 U.S. 20 at IA 150 interchange (Buchanan) 8,800 10,900 2,100 17.1 18.0 0.9 U.S. 218 at C57 interchange (Black Hawk) 17,000 20,800 3,800 11.6 11.5 -0.1U.S. 218 at IA 116 interchange (Waverly) 17,200 21,500 4,300 11.7 11.1 -0.6U.S. 218 at IA 3 interchange (Bremer) 7,500 9,200 1,700 20.9 21.3 0.4 U.S. 218 at IA 346 interchange (Chickasaw) 7,000 10,100 3,100 21.5 21.4 -0.1U.S. 63 at junction of IA 175 (Black Hawk) 3,720 3,790 70 12.7 13.5 0.8 U.S. 63 at intersection of C57 (Black Hawk) 7,900 9,600 1,700 10.0 10.3 0.3 U.S. 63 at IA 3 interchange (Bremer) 6,100 7,300 1,200 11.6 13.4 1.8 U.S. 63 at U.S. 18 & IA 346 interchange (Chickasaw)
3,210 4,120 910 22.9 20.1 -2.8
IA 14 at intersection of D67 (Grundy) 3,980 4,450 470 9.7 16.9 7.2 IA 14 at east junction of IA 175 (Grundy) 6,400 6,400 0 6.0 6.2 0.2 IA 14 at US 20 interchange (Grundy) 3,910 4,220 310 10.5 11.1 0.6
Source: Iowa DOT Traffic Books
Truck Transportation Planning Issues Planned initiatives that would impact truck transportation are addressed in Chapter 3. These projects focus primarily on the preservation of the major corridors in the region. Recent highway corridor projects have significantly improved the connectivity of the region to the rest of Iowa and the nation. One of those projects is the completion of the four-lane divided U.S. 20 across northern Iowa. Completed in 2018, the U.S. 20 corridor extends 302 miles to link Sioux City with Fort Dodge to Dubuque. With direct connections to Interstates 129, 29, 35, and 380, the corridor is being touted as an efficient route for people and commerce.
An ongoing initiative that will positively impact truck transportation in the region involves upgrading a portion of U.S. 218 in Black Hawk and Bremer Counties to a fully controlled-access highway. U.S. 218 was originally opened as a partial controlled-access facility from Cedar Falls to Waverly in 1995. This segment is designated as a part of the Avenue of the Saints which is a four-lane route linking St. Paul, Minnesota to St. Louis, Missouri. Completion of this stretch of U.S. 218 resulted in substantial traffic growth as well as significant safety and operational issues. In 2005, the Iowa DOT initiated a Corridor Study to identify potential safety improvements and options for access control. Three projects that were identified include the construction of interchanges at the intersections of U.S. 218 and C50 in Janesville, C57 north of Cedar Falls, and 260th Street north of Janesville. As part of the proposed and completed improvements, all at-grade intersections within the corridor will be permanently closed. Construction of the interchanges at C50 and C57 were completed in 2012 and 2016. Construction of the interchange at 260th Street is programmed in FY 2024.
One planning focus area that would specifically have an impact on truck transportation in the region involves IA Hwy 150 from U.S. 20 in Independence to IA Hwy 3 in Oelwein. This corridor has been of particular concern due to the significant growth in truck and automobile traffic over the past two decades. IA Hwy 150 serves as a north to south link to the Commercial and Industrial Network. The current roadway configuration and alignment through Independence acts as a bottleneck for truck traffic. In 2018, the RTA programmed $100,000 in STBG funds as matching monies for a corridor study. The project is currently programmed in FY 2022. The goal is to partner financially with the Iowa DOT to complete a corridor study of IA Hwy 150 through
2045 LONG-RANGE TRANSPORTATION PLAN | 130
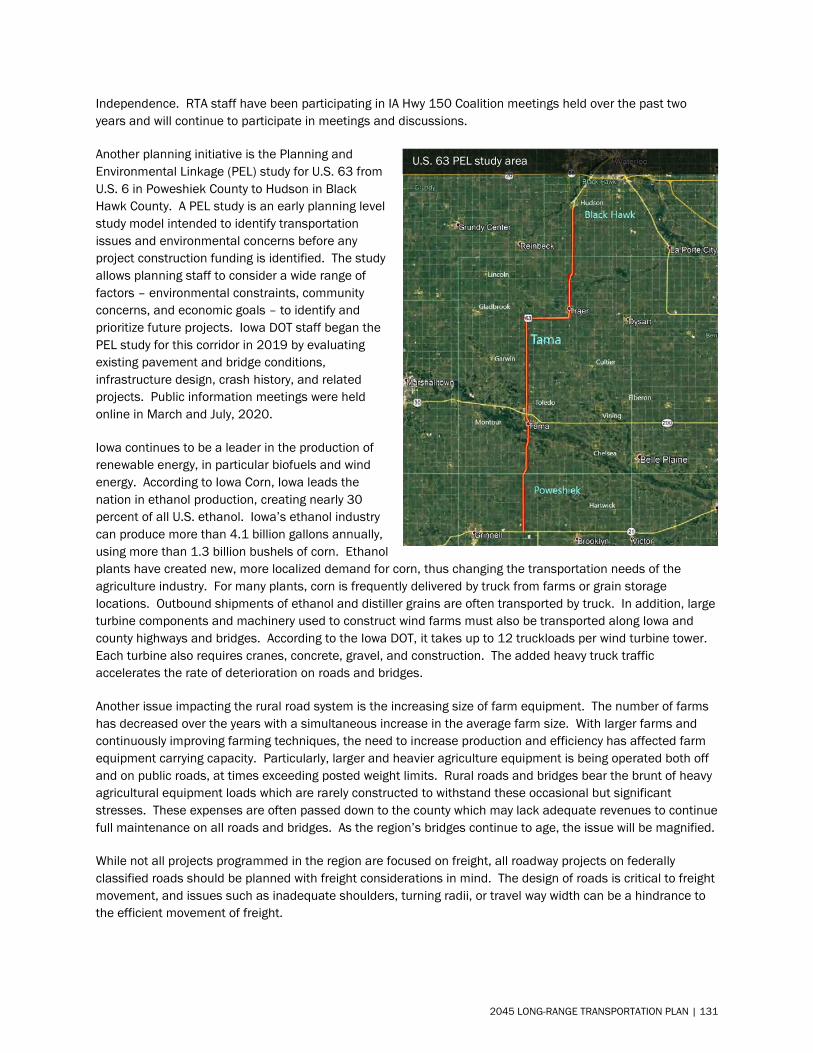
Independence. RTA staff have been participating in IA Hwy 150 Coalition meetings held over the past two years and will continue to participate in meetings and discussions.
Another planning initiative is the Planning and Environmental Linkage (PEL) study for U.S. 63 from U.S. 6 in Poweshiek County to Hudson in Black Hawk County. A PEL study is an early planning level study model intended to identify transportation issues and environmental concerns before any project construction funding is identified. The study allows planning staff to consider a wide range of factors – environmental constraints, community concerns, and economic goals – to identify and prioritize future projects. Iowa DOT staff began the PEL study for this corridor in 2019 by evaluating existing pavement and bridge conditions, infrastructure design, crash history, and related projects. Public information meetings were held online in March and July, 2020.
Iowa continues to be a leader in the production of renewable energy, in particular biofuels and wind energy. According to Iowa Corn, Iowa leads the nation in ethanol production, creating nearly 30 percent of all U.S. ethanol. Iowa’s ethanol industry can produce more than 4.1 billion gallons annually, using more than 1.3 billion bushels of corn. Ethanol plants have created new, more localized demand for corn, thus changing the transportation needs of the agriculture industry. For many plants, corn is frequently delivered by truck from farms or grain storage locations. Outbound shipments of ethanol and distiller grains are often transported by truck. In addition, large turbine components and machinery used to construct wind farms must also be transported along Iowa and county highways and bridges. According to the Iowa DOT, it takes up to 12 truckloads per wind turbine tower. Each turbine also requires cranes, concrete, gravel, and construction. The added heavy truck traffic accelerates the rate of deterioration on roads and bridges.
Another issue impacting the rural road system is the increasing size of farm equipment. The number of farms has decreased over the years with a simultaneous increase in the average farm size. With larger farms and continuously improving farming techniques, the need to increase production and efficiency has affected farm equipment carrying capacity. Particularly, larger and heavier agriculture equipment is being operated both off and on public roads, at times exceeding posted weight limits. Rural roads and bridges bear the brunt of heavy agricultural equipment loads which are rarely constructed to withstand these occasional but significant stresses. These expenses are often passed down to the county which may lack adequate revenues to continue full maintenance on all roads and bridges. As the region’s bridges continue to age, the issue will be magnified.
While not all projects programmed in the region are focused on freight, all roadway projects on federally classified roads should be planned with freight considerations in mind. The design of roads is critical to freight movement, and issues such as inadequate shoulders, turning radii, or travel way width can be a hindrance to the efficient movement of freight.
U.S. 63 PEL study area
2045 LONG-RANGE TRANSPORTATION PLAN | 131
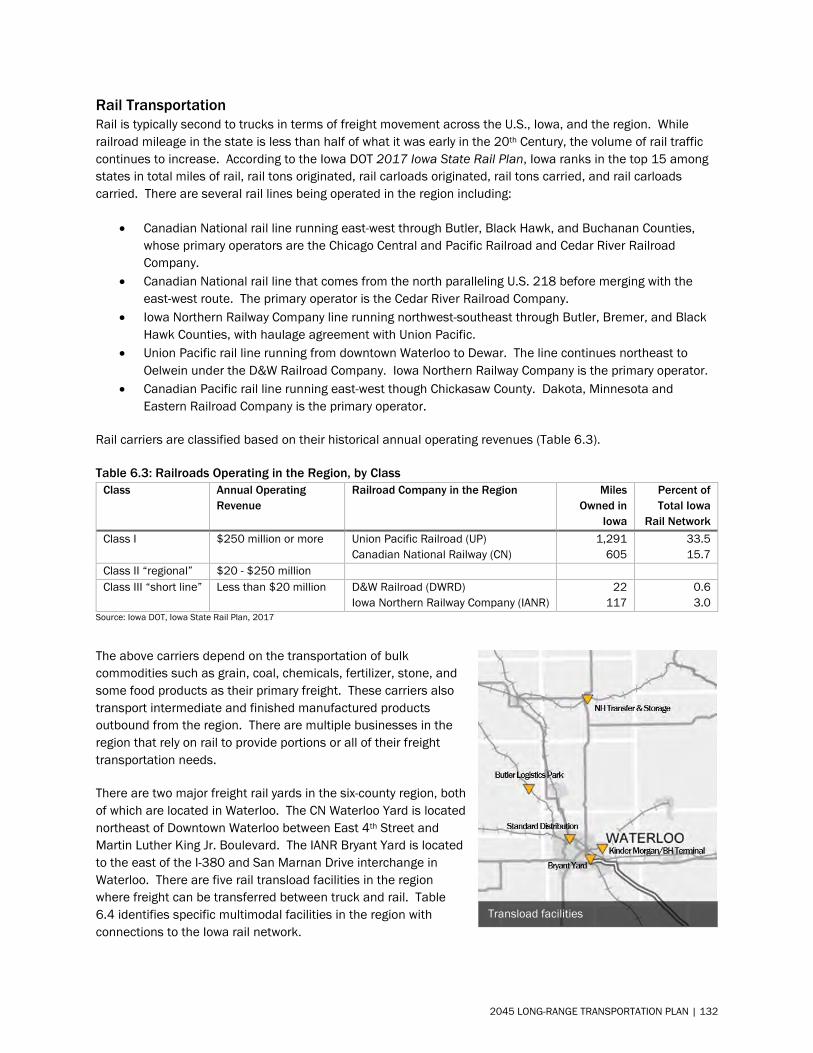
Rail Transportation Rail is typically second to trucks in terms of freight movement across the U.S., Iowa, and the region. While railroad mileage in the state is less than half of what it was early in the 20th Century, the volume of rail traffic continues to increase. According to the Iowa DOT 2017 Iowa State Rail Plan, Iowa ranks in the top 15 among states in total miles of rail, rail tons originated, rail carloads originated, rail tons carried, and rail carloads carried. There are several rail lines being operated in the region including:
• Canadian National rail line running east-west through Butler, Black Hawk, and Buchanan Counties,whose primary operators are the Chicago Central and Pacific Railroad and Cedar River RailroadCompany.
• Canadian National rail line that comes from the north paralleling U.S. 218 before merging with theeast-west route. The primary operator is the Cedar River Railroad Company.
• Iowa Northern Railway Company line running northwest-southeast through Butler, Bremer, and BlackHawk Counties, with haulage agreement with Union Pacific.
• Union Pacific rail line running from downtown Waterloo to Dewar. The line continues northeast toOelwein under the D&W Railroad Company. Iowa Northern Railway Company is the primary operator.
• Canadian Pacific rail line running east-west though Chickasaw County. Dakota, Minnesota andEastern Railroad Company is the primary operator.
Rail carriers are classified based on their historical annual operating revenues (Table 6.3).
Table 6.3: Railroads Operating in the Region, by Class Class Annual Operating
Revenue Railroad Company in the Region Miles
Owned in Iowa
Percent of Total Iowa
Rail Network Class I $250 million or more Union Pacific Railroad (UP)
Canadian National Railway (CN) 1,291
605 33.5 15.7
Class II “regional” $20 - $250 million Class III “short line” Less than $20 million D&W Railroad (DWRD)
Iowa Northern Railway Company (IANR) 22
117 0.6 3.0
Source: Iowa DOT, Iowa State Rail Plan, 2017
The above carriers depend on the transportation of bulk commodities such as grain, coal, chemicals, fertilizer, stone, and some food products as their primary freight. These carriers also transport intermediate and finished manufactured products outbound from the region. There are multiple businesses in the region that rely on rail to provide portions or all of their freight transportation needs.
There are two major freight rail yards in the six-county region, both of which are located in Waterloo. The CN Waterloo Yard is located northeast of Downtown Waterloo between East 4th Street and Martin Luther King Jr. Boulevard. The IANR Bryant Yard is located to the east of the I-380 and San Marnan Drive interchange in Waterloo. There are five rail transload facilities in the region where freight can be transferred between truck and rail. Table 6.4 identifies specific multimodal facilities in the region with connections to the Iowa rail network.
Transload facilities
2045 LONG-RANGE TRANSPORTATION PLAN | 132
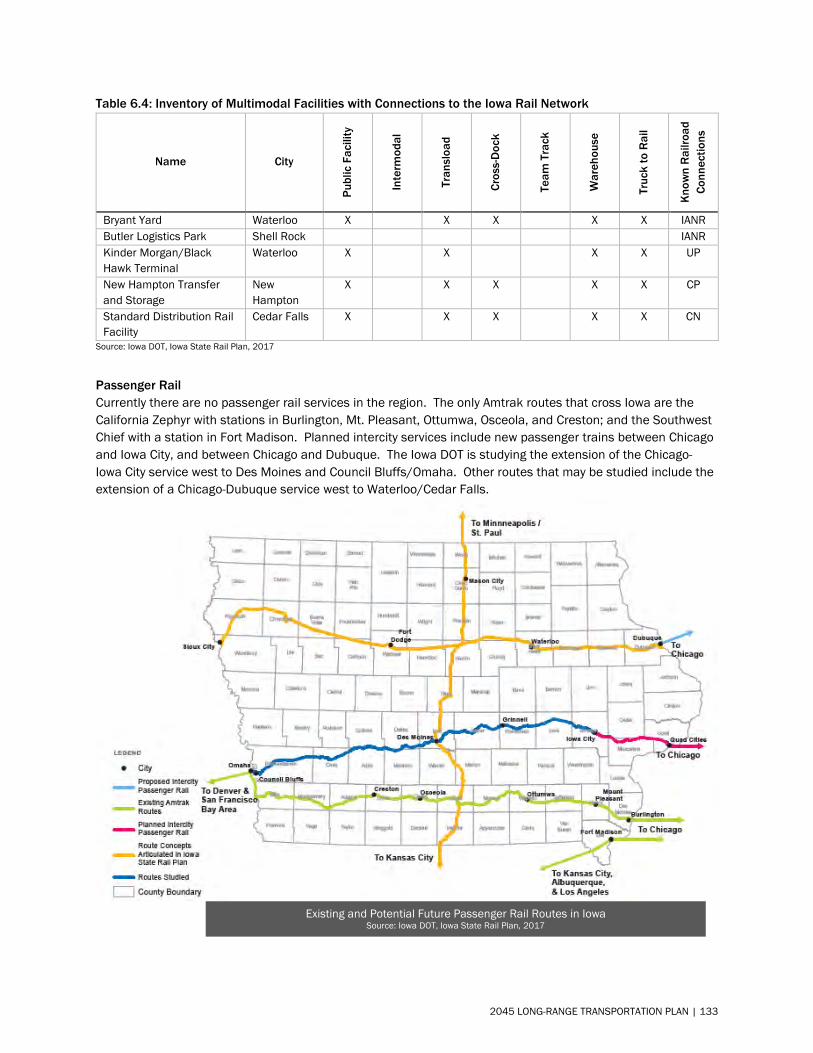
Table 6.4: Inventory of Multimodal Facilities with Connections to the Iowa Rail Network
Name City
Publ
ic F
acili
ty
Inte
rmod
al
Tran
sloa
d
Cros
s-D
ock
Team
Tra
ck
War
ehou
se
Truc
k to
Rai
l
Know
n R
ailro
ad
Conn
ectio
ns
Bryant Yard Waterloo X X X X X IANR Butler Logistics Park Shell Rock IANR Kinder Morgan/Black Hawk Terminal
Waterloo X X X X UP
New Hampton Transfer and Storage
New Hampton
X X X X X CP
Standard Distribution Rail Facility
Cedar Falls X X X X X CN
Source: Iowa DOT, Iowa State Rail Plan, 2017
Passenger Rail Currently there are no passenger rail services in the region. The only Amtrak routes that cross Iowa are the California Zephyr with stations in Burlington, Mt. Pleasant, Ottumwa, Osceola, and Creston; and the Southwest Chief with a station in Fort Madison. Planned intercity services include new passenger trains between Chicago and Iowa City, and between Chicago and Dubuque. The Iowa DOT is studying the extension of the Chicago-Iowa City service west to Des Moines and Council Bluffs/Omaha. Other routes that may be studied include the extension of a Chicago-Dubuque service west to Waterloo/Cedar Falls.
Existing and Potential Future Passenger Rail Routes in Iowa Source: Iowa DOT, Iowa State Rail Plan, 2017
2045 LONG-RANGE TRANSPORTATION PLAN | 133
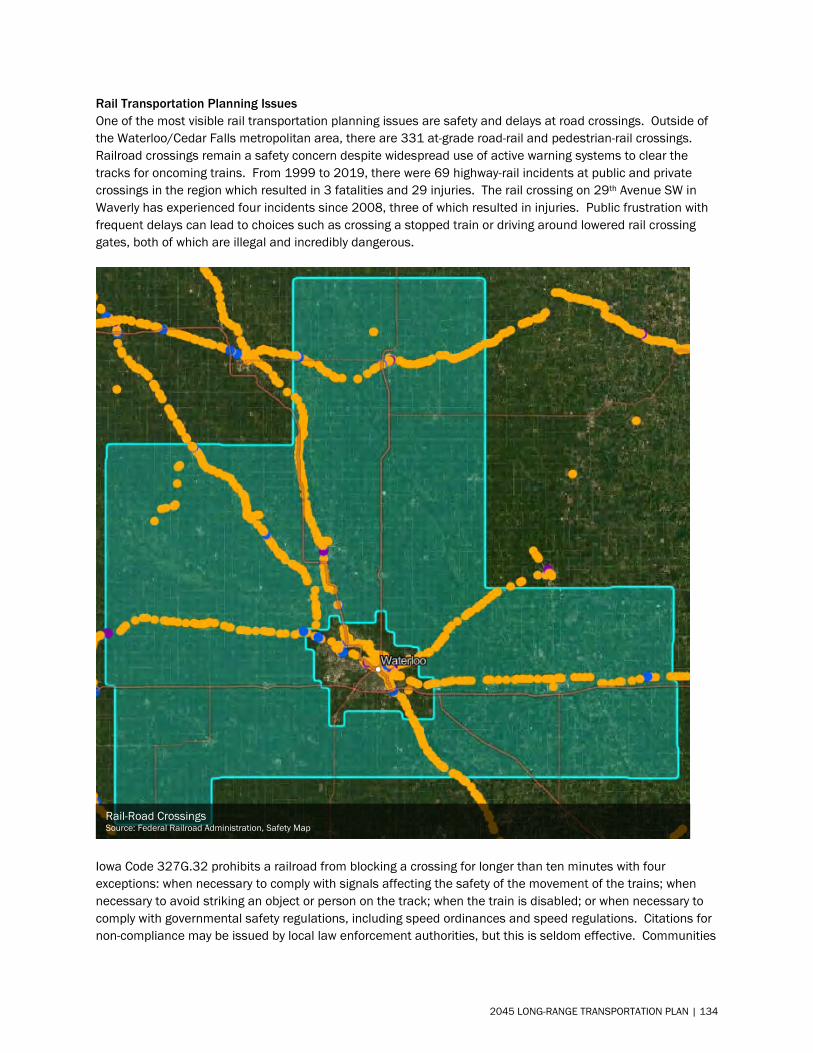
Rail Transportation Planning Issues One of the most visible rail transportation planning issues are safety and delays at road crossings. Outside of the Waterloo/Cedar Falls metropolitan area, there are 331 at-grade road-rail and pedestrian-rail crossings. Railroad crossings remain a safety concern despite widespread use of active warning systems to clear the tracks for oncoming trains. From 1999 to 2019, there were 69 highway-rail incidents at public and private crossings in the region which resulted in 3 fatalities and 29 injuries. The rail crossing on 29th Avenue SW in Waverly has experienced four incidents since 2008, three of which resulted in injuries. Public frustration with frequent delays can lead to choices such as crossing a stopped train or driving around lowered rail crossing gates, both of which are illegal and incredibly dangerous.
Iowa Code 327G.32 prohibits a railroad from blocking a crossing for longer than ten minutes with four exceptions: when necessary to comply with signals affecting the safety of the movement of the trains; when necessary to avoid striking an object or person on the track; when the train is disabled; or when necessary to comply with governmental safety regulations, including speed ordinances and speed regulations. Citations for non-compliance may be issued by local law enforcement authorities, but this is seldom effective. Communities
Rail-Road Crossings Source: Federal Railroad Administration, Safety Map
2045 LONG-RANGE TRANSPORTATION PLAN | 134
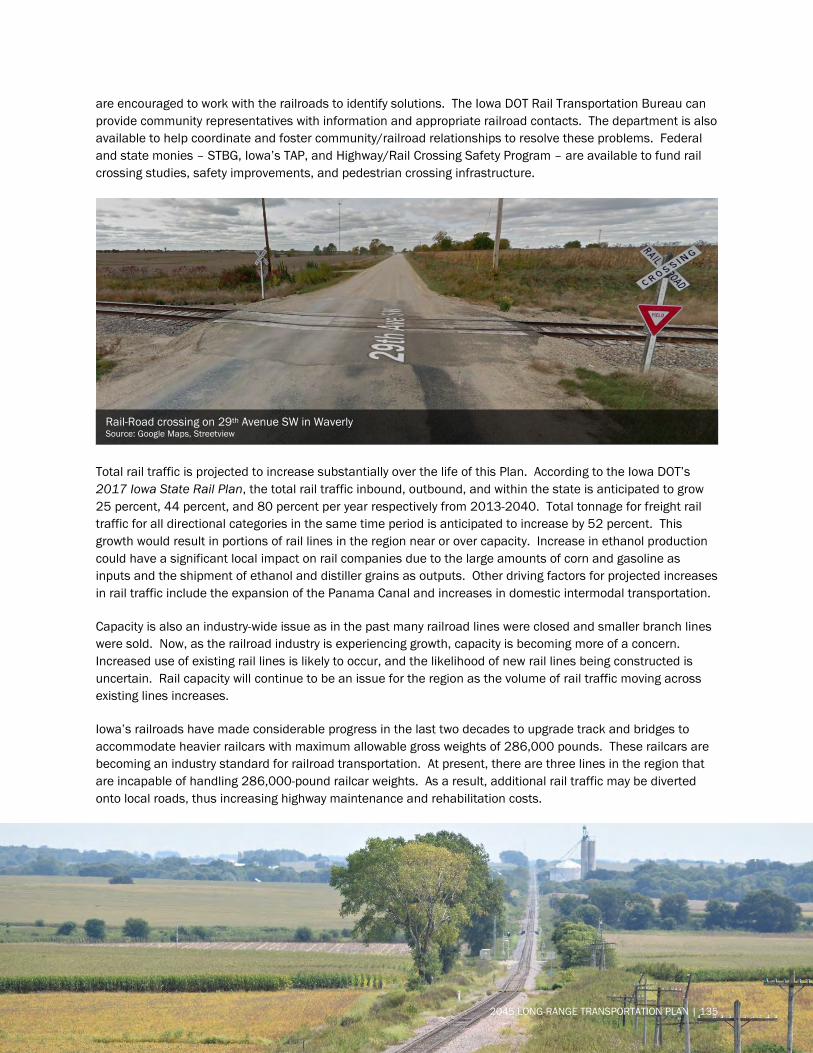
are encouraged to work with the railroads to identify solutions. The Iowa DOT Rail Transportation Bureau can provide community representatives with information and appropriate railroad contacts. The department is also available to help coordinate and foster community/railroad relationships to resolve these problems. Federal and state monies – STBG, Iowa’s TAP, and Highway/Rail Crossing Safety Program – are available to fund rail crossing studies, safety improvements, and pedestrian crossing infrastructure.
Total rail traffic is projected to increase substantially over the life of this Plan. According to the Iowa DOT’s 2017 Iowa State Rail Plan, the total rail traffic inbound, outbound, and within the state is anticipated to grow 25 percent, 44 percent, and 80 percent per year respectively from 2013-2040. Total tonnage for freight rail traffic for all directional categories in the same time period is anticipated to increase by 52 percent. This growth would result in portions of rail lines in the region near or over capacity. Increase in ethanol production could have a significant local impact on rail companies due to the large amounts of corn and gasoline as inputs and the shipment of ethanol and distiller grains as outputs. Other driving factors for projected increases in rail traffic include the expansion of the Panama Canal and increases in domestic intermodal transportation.
Capacity is also an industry-wide issue as in the past many railroad lines were closed and smaller branch lines were sold. Now, as the railroad industry is experiencing growth, capacity is becoming more of a concern. Increased use of existing rail lines is likely to occur, and the likelihood of new rail lines being constructed is uncertain. Rail capacity will continue to be an issue for the region as the volume of rail traffic moving across existing lines increases.
Iowa’s railroads have made considerable progress in the last two decades to upgrade track and bridges to accommodate heavier railcars with maximum allowable gross weights of 286,000 pounds. These railcars are becoming an industry standard for railroad transportation. At present, there are three lines in the region that are incapable of handling 286,000-pound railcar weights. As a result, additional rail traffic may be diverted onto local roads, thus increasing highway maintenance and rehabilitation costs.
Rail-Road crossing on 29th Avenue SW in Waverly Source: Google Maps, Streetview
2045 LONG-RANGE TRANSPORTATION PLAN | 135
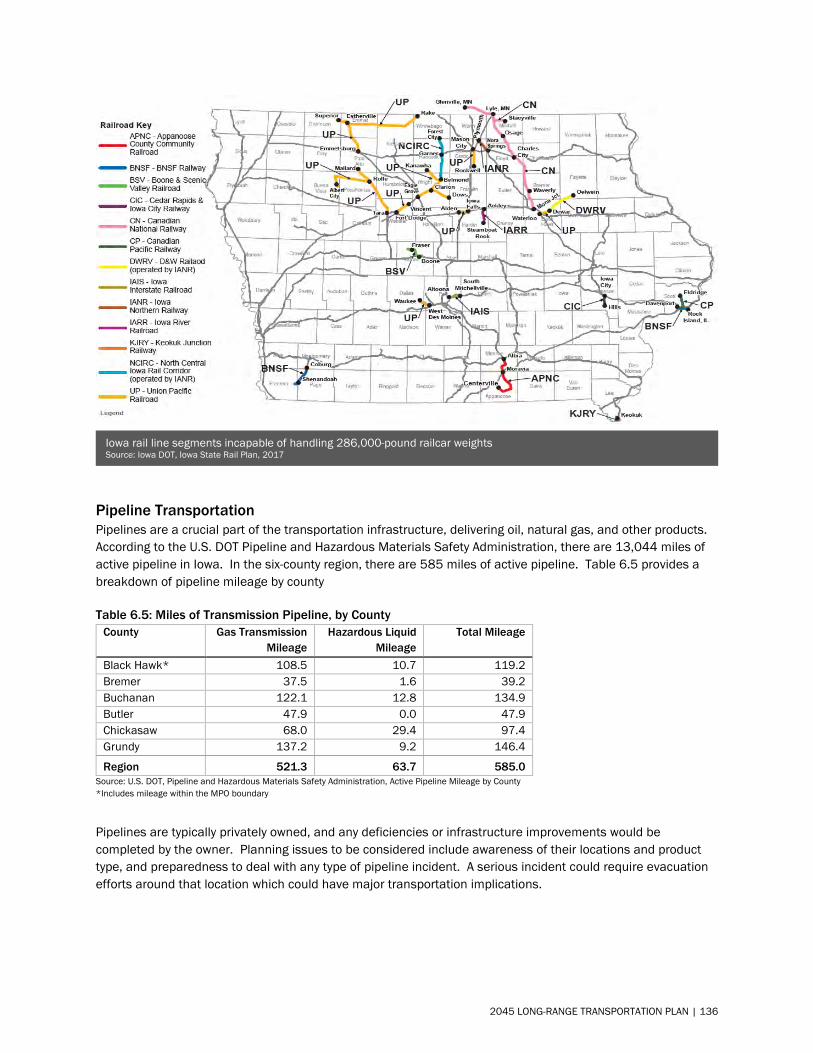
Pipeline Transportation Pipelines are a crucial part of the transportation infrastructure, delivering oil, natural gas, and other products. According to the U.S. DOT Pipeline and Hazardous Materials Safety Administration, there are 13,044 miles of active pipeline in Iowa. In the six-county region, there are 585 miles of active pipeline. Table 6.5 provides a breakdown of pipeline mileage by county
Table 6.5: Miles of Transmission Pipeline, by County County Gas Transmission
Mileage Hazardous Liquid
Mileage Total Mileage
Black Hawk* 108.5 10.7 119.2 Bremer 37.5 1.6 39.2 Buchanan 122.1 12.8 134.9 Butler 47.9 0.0 47.9 Chickasaw 68.0 29.4 97.4 Grundy 137.2 9.2 146.4
Region 521.3 63.7 585.0 Source: U.S. DOT, Pipeline and Hazardous Materials Safety Administration, Active Pipeline Mileage by County *Includes mileage within the MPO boundary
Pipelines are typically privately owned, and any deficiencies or infrastructure improvements would be completed by the owner. Planning issues to be considered include awareness of their locations and product type, and preparedness to deal with any type of pipeline incident. A serious incident could require evacuation efforts around that location which could have major transportation implications.
Iowa rail line segments incapable of handling 286,000-pound railcar weights Source: Iowa DOT, Iowa State Rail Plan, 2017
2045 LONG-RANGE TRANSPORTATION PLAN | 136
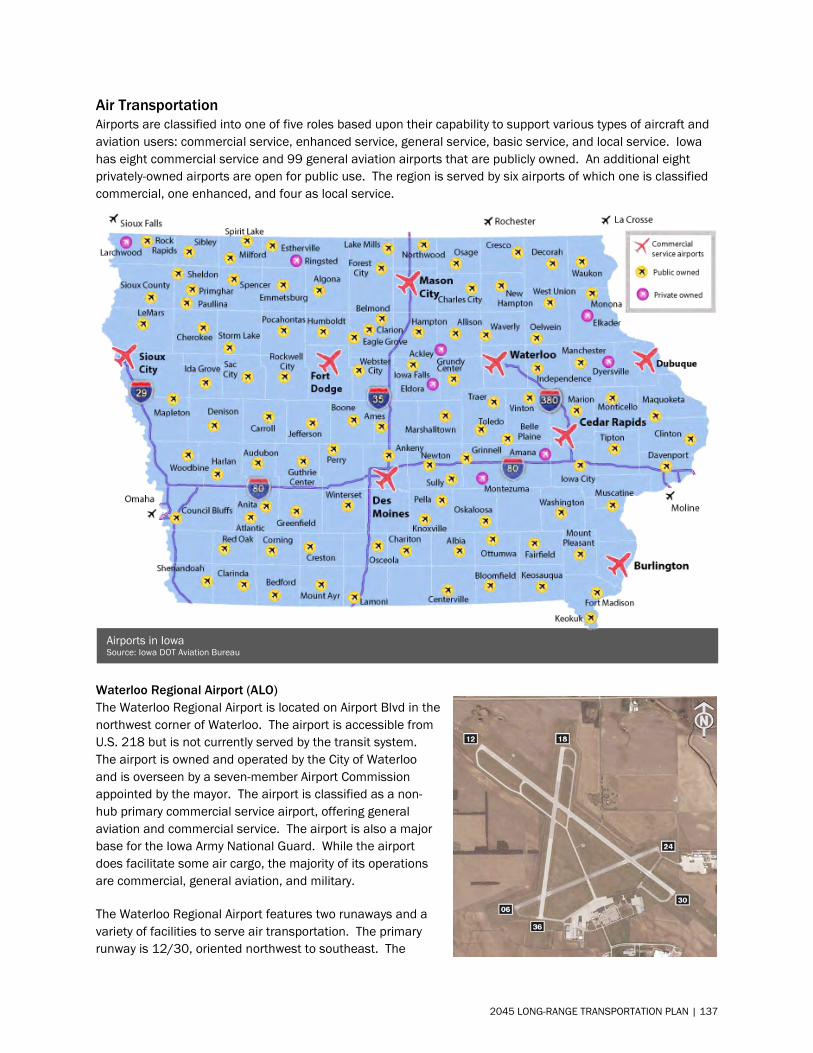
Air Transportation Airports are classified into one of five roles based upon their capability to support various types of aircraft and aviation users: commercial service, enhanced service, general service, basic service, and local service. Iowa has eight commercial service and 99 general aviation airports that are publicly owned. An additional eight privately-owned airports are open for public use. The region is served by six airports of which one is classified commercial, one enhanced, and four as local service.
Waterloo Regional Airport (ALO) The Waterloo Regional Airport is located on Airport Blvd in the northwest corner of Waterloo. The airport is accessible from U.S. 218 but is not currently served by the transit system. The airport is owned and operated by the City of Waterloo and is overseen by a seven-member Airport Commission appointed by the mayor. The airport is classified as a non-hub primary commercial service airport, offering general aviation and commercial service. The airport is also a major base for the Iowa Army National Guard. While the airport does facilitate some air cargo, the majority of its operations are commercial, general aviation, and military.
The Waterloo Regional Airport features two runaways and a variety of facilities to serve air transportation. The primary runway is 12/30, oriented northwest to southeast. The
Airports in Iowa Source: Iowa DOT Aviation Bureau
2045 LONG-RANGE TRANSPORTATION PLAN | 137
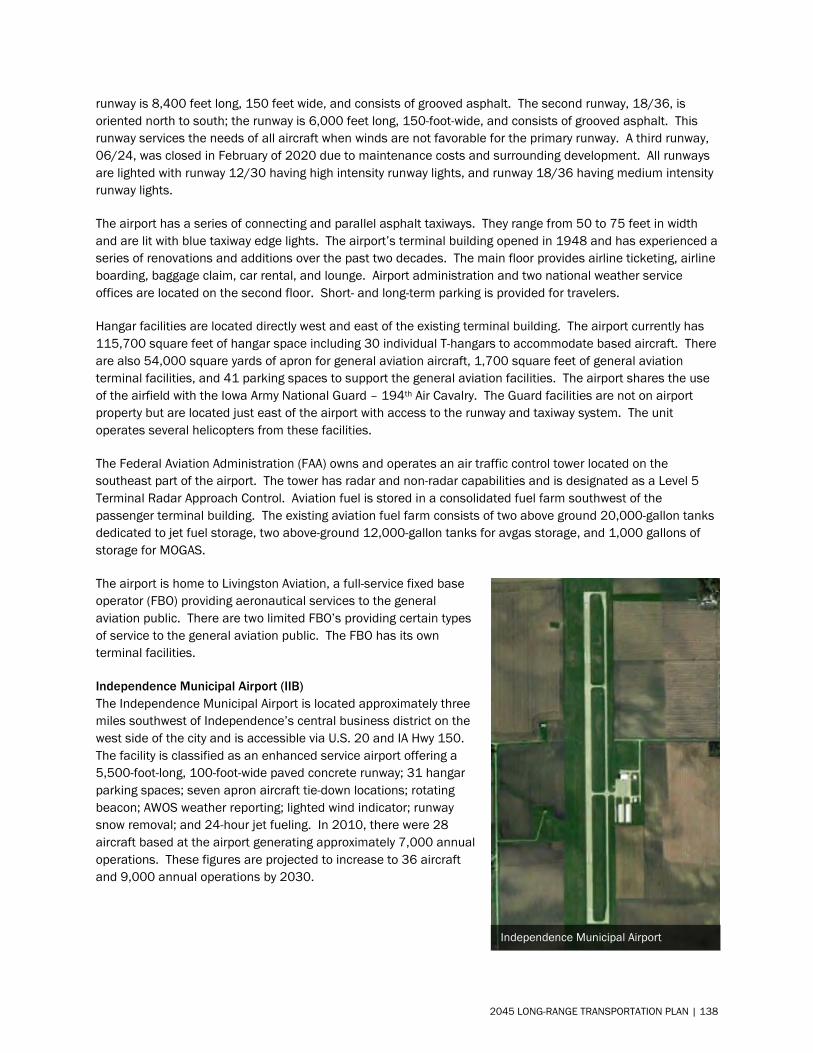
runway is 8,400 feet long, 150 feet wide, and consists of grooved asphalt. The second runway, 18/36, is oriented north to south; the runway is 6,000 feet long, 150-foot-wide, and consists of grooved asphalt. This runway services the needs of all aircraft when winds are not favorable for the primary runway. A third runway, 06/24, was closed in February of 2020 due to maintenance costs and surrounding development. All runways are lighted with runway 12/30 having high intensity runway lights, and runway 18/36 having medium intensity runway lights.
The airport has a series of connecting and parallel asphalt taxiways. They range from 50 to 75 feet in width and are lit with blue taxiway edge lights. The airport’s terminal building opened in 1948 and has experienced a series of renovations and additions over the past two decades. The main floor provides airline ticketing, airline boarding, baggage claim, car rental, and lounge. Airport administration and two national weather service offices are located on the second floor. Short- and long-term parking is provided for travelers.
Hangar facilities are located directly west and east of the existing terminal building. The airport currently has 115,700 square feet of hangar space including 30 individual T-hangars to accommodate based aircraft. There are also 54,000 square yards of apron for general aviation aircraft, 1,700 square feet of general aviation terminal facilities, and 41 parking spaces to support the general aviation facilities. The airport shares the use of the airfield with the Iowa Army National Guard – 194th Air Cavalry. The Guard facilities are not on airport property but are located just east of the airport with access to the runway and taxiway system. The unit operates several helicopters from these facilities.
The Federal Aviation Administration (FAA) owns and operates an air traffic control tower located on the southeast part of the airport. The tower has radar and non-radar capabilities and is designated as a Level 5 Terminal Radar Approach Control. Aviation fuel is stored in a consolidated fuel farm southwest of the passenger terminal building. The existing aviation fuel farm consists of two above ground 20,000-gallon tanks dedicated to jet fuel storage, two above-ground 12,000-gallon tanks for avgas storage, and 1,000 gallons of storage for MOGAS.
The airport is home to Livingston Aviation, a full-service fixed base operator (FBO) providing aeronautical services to the general aviation public. There are two limited FBO’s providing certain types of service to the general aviation public. The FBO has its own terminal facilities.
Independence Municipal Airport (IIB) The Independence Municipal Airport is located approximately three miles southwest of Independence’s central business district on the west side of the city and is accessible via U.S. 20 and IA Hwy 150. The facility is classified as an enhanced service airport offering a 5,500-foot-long, 100-foot-wide paved concrete runway; 31 hangar parking spaces; seven apron aircraft tie-down locations; rotating beacon; AWOS weather reporting; lighted wind indicator; runway snow removal; and 24-hour jet fueling. In 2010, there were 28 aircraft based at the airport generating approximately 7,000 annual operations. These figures are projected to increase to 36 aircraft and 9,000 annual operations by 2030.
Independence Municipal Airport
2045 LONG-RANGE TRANSPORTATION PLAN | 138
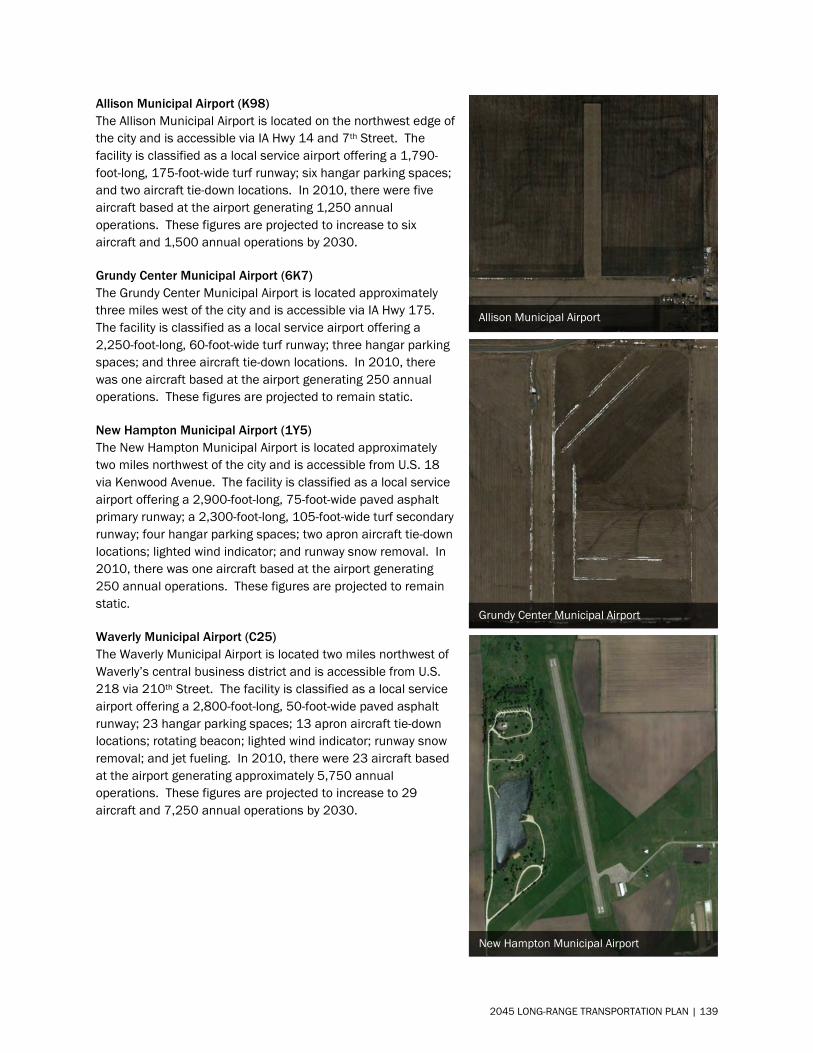
Allison Municipal Airport (K98) The Allison Municipal Airport is located on the northwest edge of the city and is accessible via IA Hwy 14 and 7th Street. The facility is classified as a local service airport offering a 1,790-foot-long, 175-foot-wide turf runway; six hangar parking spaces; and two aircraft tie-down locations. In 2010, there were five aircraft based at the airport generating 1,250 annual operations. These figures are projected to increase to six aircraft and 1,500 annual operations by 2030.
Grundy Center Municipal Airport (6K7) The Grundy Center Municipal Airport is located approximately three miles west of the city and is accessible via IA Hwy 175. The facility is classified as a local service airport offering a 2,250-foot-long, 60-foot-wide turf runway; three hangar parking spaces; and three aircraft tie-down locations. In 2010, there was one aircraft based at the airport generating 250 annual operations. These figures are projected to remain static.
New Hampton Municipal Airport (1Y5) The New Hampton Municipal Airport is located approximately two miles northwest of the city and is accessible from U.S. 18 via Kenwood Avenue. The facility is classified as a local service airport offering a 2,900-foot-long, 75-foot-wide paved asphalt primary runway; a 2,300-foot-long, 105-foot-wide turf secondary runway; four hangar parking spaces; two apron aircraft tie-down locations; lighted wind indicator; and runway snow removal. In 2010, there was one aircraft based at the airport generating 250 annual operations. These figures are projected to remain static.
Waverly Municipal Airport (C25) The Waverly Municipal Airport is located two miles northwest of Waverly’s central business district and is accessible from U.S. 218 via 210th Street. The facility is classified as a local service airport offering a 2,800-foot-long, 50-foot-wide paved asphalt runway; 23 hangar parking spaces; 13 apron aircraft tie-down locations; rotating beacon; lighted wind indicator; runway snow removal; and jet fueling. In 2010, there were 23 aircraft based at the airport generating approximately 5,750 annual operations. These figures are projected to increase to 29 aircraft and 7,250 annual operations by 2030.
Grundy Center Municipal Airport
New Hampton Municipal Airport
Allison Municipal Airport
2045 LONG-RANGE TRANSPORTATION PLAN | 139
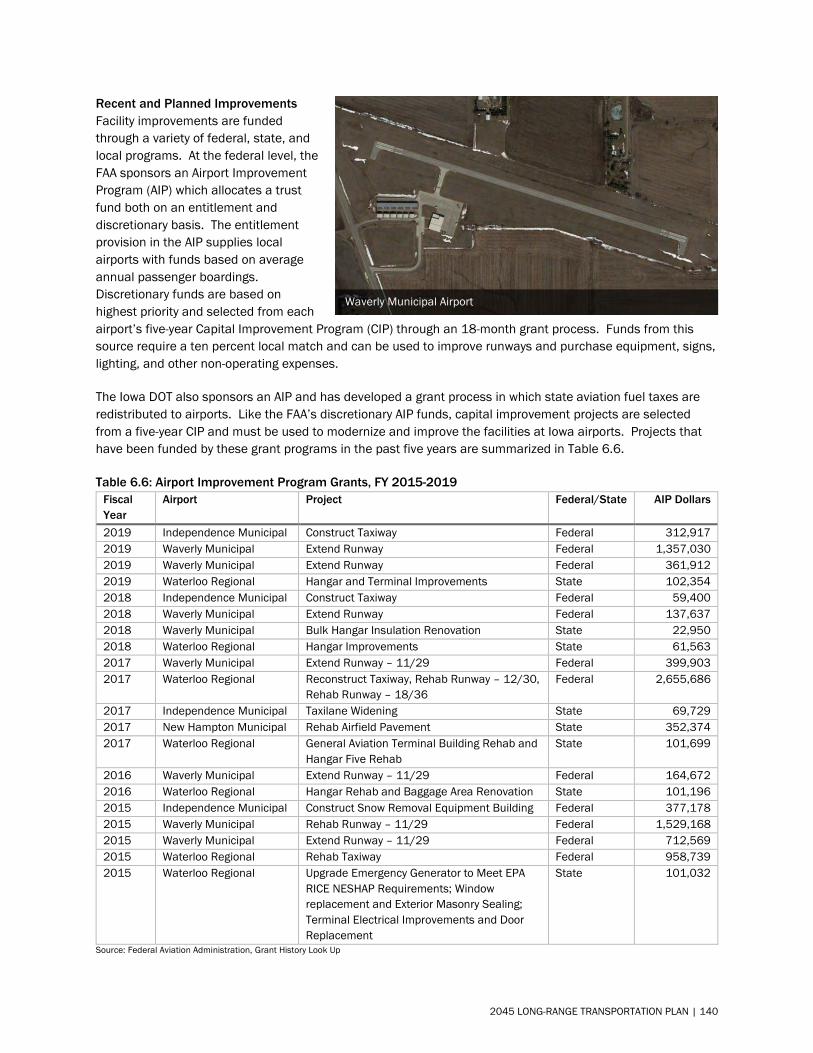
Recent and Planned Improvements Facility improvements are funded through a variety of federal, state, and local programs. At the federal level, the FAA sponsors an Airport Improvement Program (AIP) which allocates a trust fund both on an entitlement and discretionary basis. The entitlement provision in the AIP supplies local airports with funds based on average annual passenger boardings. Discretionary funds are based on highest priority and selected from each airport’s five-year Capital Improvement Program (CIP) through an 18-month grant process. Funds from this source require a ten percent local match and can be used to improve runways and purchase equipment, signs, lighting, and other non-operating expenses.
The Iowa DOT also sponsors an AIP and has developed a grant process in which state aviation fuel taxes are redistributed to airports. Like the FAA’s discretionary AIP funds, capital improvement projects are selected from a five-year CIP and must be used to modernize and improve the facilities at Iowa airports. Projects that have been funded by these grant programs in the past five years are summarized in Table 6.6.
Table 6.6: Airport Improvement Program Grants, FY 2015-2019 Fiscal Year
Airport Project Federal/State AIP Dollars
2019 Independence Municipal Construct Taxiway Federal 312,917 2019 Waverly Municipal Extend Runway Federal 1,357,030 2019 Waverly Municipal Extend Runway Federal 361,912 2019 Waterloo Regional Hangar and Terminal Improvements State 102,354 2018 Independence Municipal Construct Taxiway Federal 59,400 2018 Waverly Municipal Extend Runway Federal 137,637 2018 Waverly Municipal Bulk Hangar Insulation Renovation State 22,950 2018 Waterloo Regional Hangar Improvements State 61,563 2017 Waverly Municipal Extend Runway – 11/29 Federal 399,903 2017 Waterloo Regional Reconstruct Taxiway, Rehab Runway – 12/30,
Rehab Runway – 18/36 Federal 2,655,686
2017 Independence Municipal Taxilane Widening State 69,729 2017 New Hampton Municipal Rehab Airfield Pavement State 352,374 2017 Waterloo Regional General Aviation Terminal Building Rehab and
Hangar Five Rehab State 101,699
2016 Waverly Municipal Extend Runway – 11/29 Federal 164,672 2016 Waterloo Regional Hangar Rehab and Baggage Area Renovation State 101,196 2015 Independence Municipal Construct Snow Removal Equipment Building Federal 377,178 2015 Waverly Municipal Rehab Runway – 11/29 Federal 1,529,168 2015 Waverly Municipal Extend Runway – 11/29 Federal 712,569 2015 Waterloo Regional Rehab Taxiway Federal 958,739 2015 Waterloo Regional Upgrade Emergency Generator to Meet EPA
RICE NESHAP Requirements; Window replacement and Exterior Masonry Sealing; Terminal Electrical Improvements and Door Replacement
State 101,032
Source: Federal Aviation Administration, Grant History Look Up
Waverly Municipal Airport
2045 LONG-RANGE TRANSPORTATION PLAN | 140

Commercial Service Waterloo Regional Airport is currently served by American Airlines with two daily flights to and from Chicago O’Hare. In 2018, American Airlines signed a two-year contract extension to continue providing twice daily flights through the federal Essential Air Service program. American Airlines, which has been Waterloo’s sole carrier since 2012, provides flights on 50-seat regional jets operated through the regional brand American Eagle. Figure 6.9 shows annual commercial enplanements at the Waterloo Regional Airport over the past ten years.
Figure 6.9: Annual Enplanements, Waterloo Regional Airport
Source: Federal Aviation Administration, Passenger Boarding for U.S. Airports *Out of 558 airports
Air Transportation Planning Issues Issues that have impacted the region in recent years include the limited jet service at the Waterloo Regional Airport, and the lack of service to multiple destinations. Currently, there are two regional jet flights per day, both to and from Chicago. The airport has completed a true market study and leakage analysis to determine the size and characteristics of the airport’s catchment area true market.
In the past decade, the aviation industry has experienced a steady increase in air traffic. According to the FAA Aerospace Forecast FY 2020-2040, system enplanements are forecast to grow at an average annual rate of 2.0 percent a year. Aviation demand is driven by economic activity, and a growing U.S. and world economy provides the basis for aviation to grow over the long run. The COVID-19 pandemic had an extreme and almost immediate effect on the airline industry. According to S&P Global, worldwide air passenger traffic for 2020 dropped 60-70 percent compared to 2019. Experts predict a gradual recovery to pre-COVID-19 traffic levels by 2024.
All modes of transportation have risks and safety concerns associated with them, and aviation is no different. Establishing compatible land uses around airports helps reduce the safety concerns for airport operations and persons located in close proximity to the airport. According to the National Transportation Safety Board (NTSB), the highest number of aircraft accidents occur on airport property; the vast majority of off-airport accidents occur within five miles of the airport runway, most of which occur within one mile of the airport. The primary goal of airport land use compatibility planning is to temper some of the risk by eliminating safety hazards surrounding airports. INRCOG staff facilitated the update of airport zoning ordinances for the Waterloo Regional Airport and Independence Municipal Airport, and the creation of a new airport zoning ordinance for the Grundy Center Airport. Each ordinance creates a three-dimensional set of regulations that limit land uses in certain areas around each airport, in particular at the end of each runway.
305310315320325330335340345350
0
5,000
10,000
15,000
20,000
25,000
30,000
2010 2011 2012 2013 2014 2015 2016 2017 2018 2019
Nat
iona
l Ran
k
Enpl
anem
ents
Axis Title
CY Enplanements Rank*
2045 LONG-RANGE TRANSPORTATION PLAN | 141
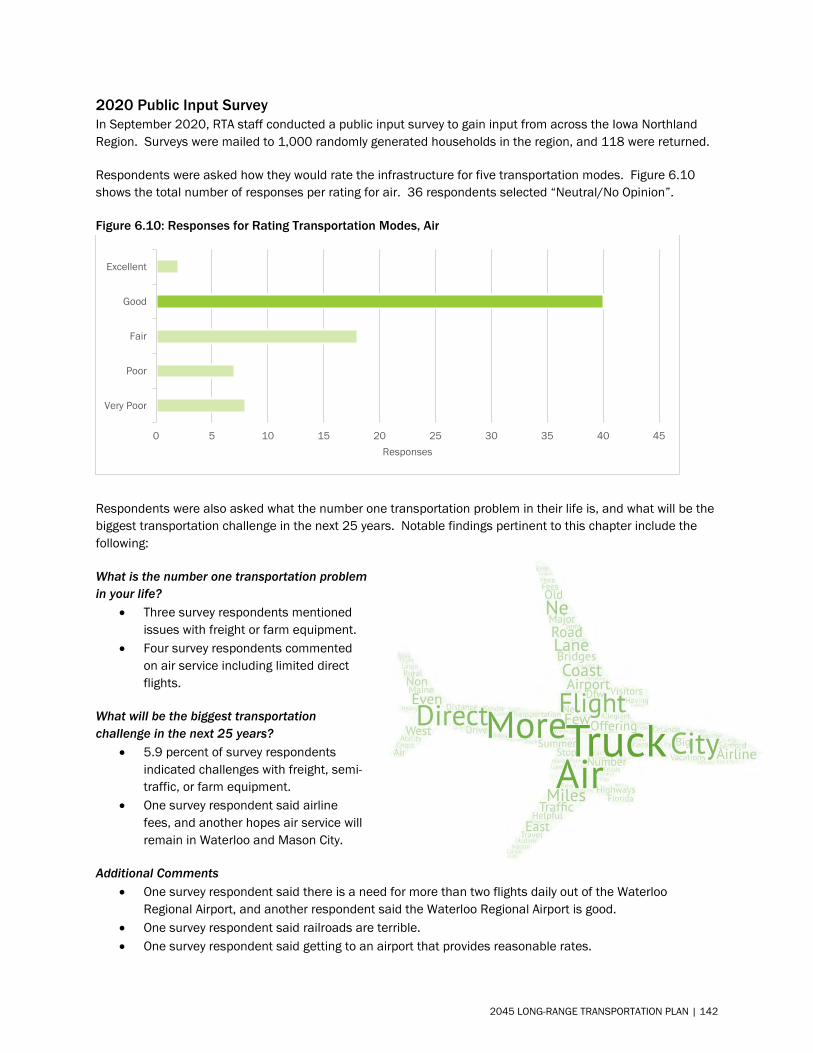
2020 Public Input Survey In September 2020, RTA staff conducted a public input survey to gain input from across the Iowa Northland Region. Surveys were mailed to 1,000 randomly generated households in the region, and 118 were returned.
Respondents were asked how they would rate the infrastructure for five transportation modes. Figure 6.10 shows the total number of responses per rating for air. 36 respondents selected “Neutral/No Opinion”.
Figure 6.10: Responses for Rating Transportation Modes, Air
Respondents were also asked what the number one transportation problem in their life is, and what will be the biggest transportation challenge in the next 25 years. Notable findings pertinent to this chapter include the following:
What is the number one transportation problem in your life?
• Three survey respondents mentionedissues with freight or farm equipment.
• Four survey respondents commentedon air service including limited directflights.
What will be the biggest transportation challenge in the next 25 years?
• 5.9 percent of survey respondentsindicated challenges with freight, semi-traffic, or farm equipment.
• One survey respondent said airlinefees, and another hopes air service willremain in Waterloo and Mason City.
Additional Comments • One survey respondent said there is a need for more than two flights daily out of the Waterloo
Regional Airport, and another respondent said the Waterloo Regional Airport is good.• One survey respondent said railroads are terrible.• One survey respondent said getting to an airport that provides reasonable rates.
Very Poor
Poor
Fair
Good
Excellent
0 5 10 15 20 25 30 35 40 45Responses
2045 LONG-RANGE TRANSPORTATION PLAN | 142
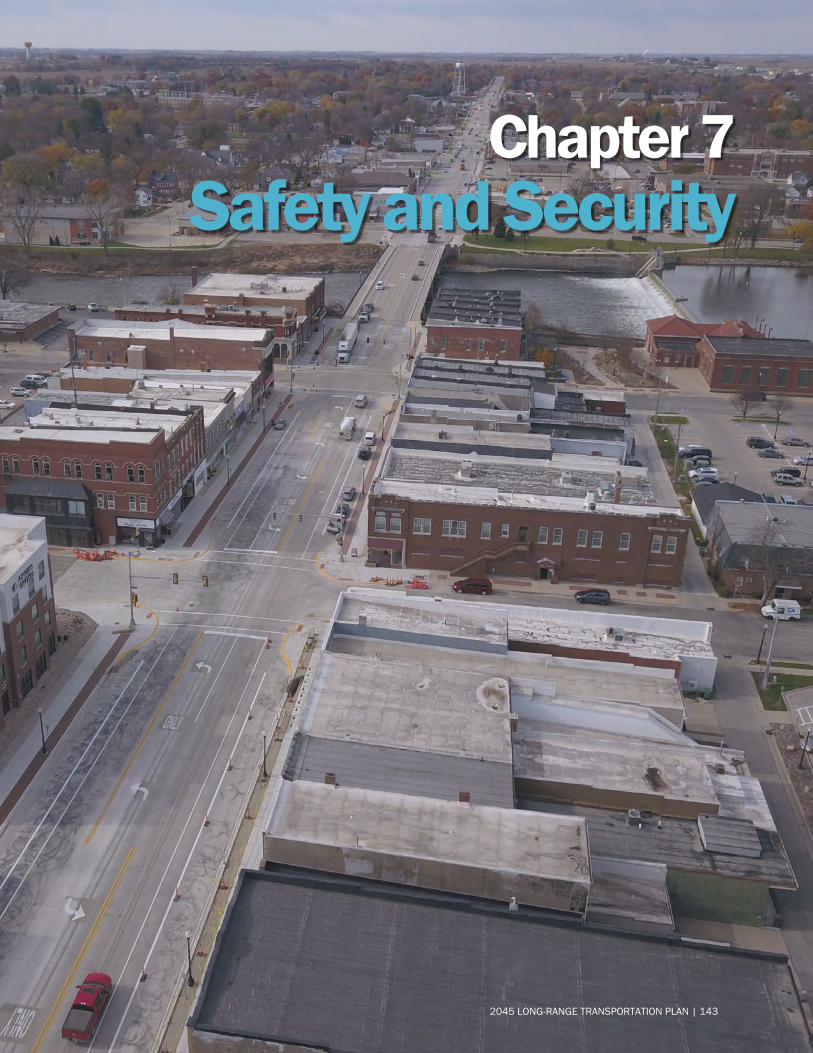
Chapter 7
Safety and Security
2045 LONG-RANGE TRANSPORTATION PLAN | 143
Chapter 7 – Safety and Security National Crash Background According to the National Highway Traffic Safety Administration (NHTSA), 36,560 people were killed in traffic crashes in 2018, a 2.4 percent decrease from 2017. The decrease in traffic deaths came as people drove even more. Estimated vehicle miles traveled increased by 0.3 percent from 2017 to 2018, while the fatality rate per 100 million vehicle miles traveled (VMT) decreased by over three percent, the lowest fatality rate since 2014. However, 6,283 pedestrians died, a more than three percent increase, and the most deaths since 1990; and 857 bicyclists were killed, a more than six percent increase.
Over the past 40 years, there has been a general downward trend in traffic fatalities. Safety programs such as those increasing seat belt use and reducing impaired driving have substantially lowered the traffic fatalities. In 2018, drunk driving fatalities dropped by four percent, accounting for 29 percent of 2018 traffic deaths – the lowest percentage since 1982 when NHTSA started reporting alcohol data.
Vehicle improvements such as air bags and electronic stability control have also contributed greatly to the reduction of traffic deaths on public roads. In 2018, there was a ten percent decrease in passenger vehicle occupants killed in rollover crashes.
Over the past ten years, the number of traffic deaths in urban areas has increased – surpassing deaths in rural areas since 2016. Among the fatal crash types that have risen since 2009 in urban areas, pedestrian deaths are up 69 percent, bicyclist fatalities increased 48 percent, and motorcycle deaths are up 33 percent.
Iowa Crash Statistics For Iowa, the number of traffic fatalities has decreased substantially over time, though 2016 experienced the most traffic fatalities since 2008. In 2019, there were 336 fatalities on Iowa’s roadways, an increase of 5.3 percent over 2018. Figure 7.1 shows the historical trend of traffic fatalities in Iowa, and Figure 7.2 provides additional fatality statistics for the state.
From 2010 to 2019, the number of non-motorist fatalities has been trending up, while non-motorist serious injuries have trended downward. On average, there are 28 fatalities and 116 serious injuries involving non-motorists each year. Rural areas continue to experience a disproportionate number of traffic fatalities. Over the past ten years, 31 percent of all crashes have occurred in rural areas, accounting for 70 percent of all fatalities.
REGION STATS
12 People killed in crashes each year
43 People suffer major injuries from crashes each year
3.4% Of crashes involve drivers under the influence of alcohol
Every 6.8 hours A crash occurs
30% Of crashes are animal related
10-year statistics 2010-2019
https://icat.iowadot.gov
2045 LONG-RANGE TRANSPORTATION PLAN | 144
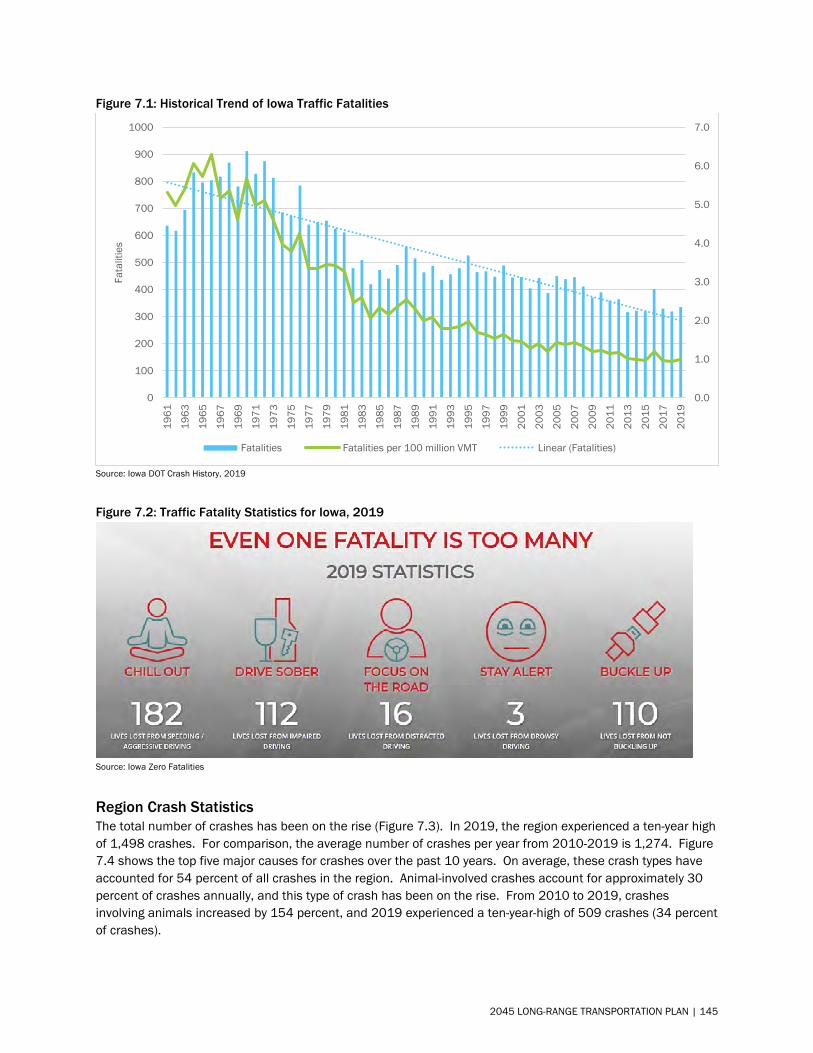
Figure 7.1: Historical Trend of Iowa Traffic Fatalities
Source: Iowa DOT Crash History, 2019
Figure 7.2: Traffic Fatality Statistics for Iowa, 2019
Source: Iowa Zero Fatalities
Region Crash Statistics The total number of crashes has been on the rise (Figure 7.3). In 2019, the region experienced a ten-year high of 1,498 crashes. For comparison, the average number of crashes per year from 2010-2019 is 1,274. Figure 7.4 shows the top five major causes for crashes over the past 10 years. On average, these crash types have accounted for 54 percent of all crashes in the region. Animal-involved crashes account for approximately 30 percent of crashes annually, and this type of crash has been on the rise. From 2010 to 2019, crashes involving animals increased by 154 percent, and 2019 experienced a ten-year-high of 509 crashes (34 percent of crashes).
0.0
1.0
2.0
3.0
4.0
5.0
6.0
7.0
0
100
200
300
400
500
600
700
800
900
1000
1961
1963
1965
1967
1969
1971
1973
1975
1977
1979
1981
1983
1985
1987
1989
1991
1993
1995
1997
1999
2001
2003
2005
2007
2009
2011
2013
2015
2017
2019
Fata
litie
s
Fatalities Fatalities per 100 million VMT Linear (Fatalities)
2045 LONG-RANGE TRANSPORTATION PLAN | 145
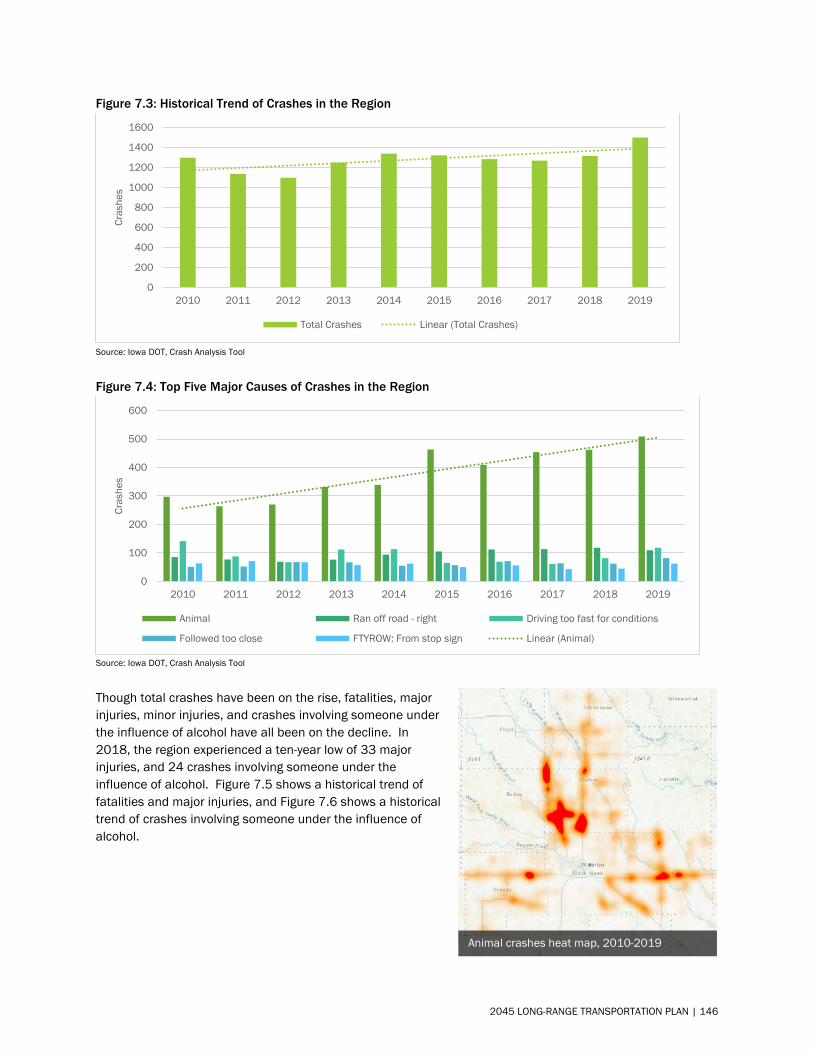
Figure 7.3: Historical Trend of Crashes in the Region
Source: Iowa DOT, Crash Analysis Tool
Figure 7.4: Top Five Major Causes of Crashes in the Region
Source: Iowa DOT, Crash Analysis Tool
Though total crashes have been on the rise, fatalities, major injuries, minor injuries, and crashes involving someone under the influence of alcohol have all been on the decline. In 2018, the region experienced a ten-year low of 33 major injuries, and 24 crashes involving someone under the influence of alcohol. Figure 7.5 shows a historical trend of fatalities and major injuries, and Figure 7.6 shows a historical trend of crashes involving someone under the influence of alcohol.
0
200
400
600
800
1000
1200
1400
1600
2010 2011 2012 2013 2014 2015 2016 2017 2018 2019
Cras
hes
Total Crashes Linear (Total Crashes)
0
100
200
300
400
500
600
2010 2011 2012 2013 2014 2015 2016 2017 2018 2019
Cras
hes
Animal Ran off road - right Driving too fast for conditions
Followed too close FTYROW: From stop sign Linear (Animal)
Animal crashes heat map, 2010-2019
2045 LONG-RANGE TRANSPORTATION PLAN | 146
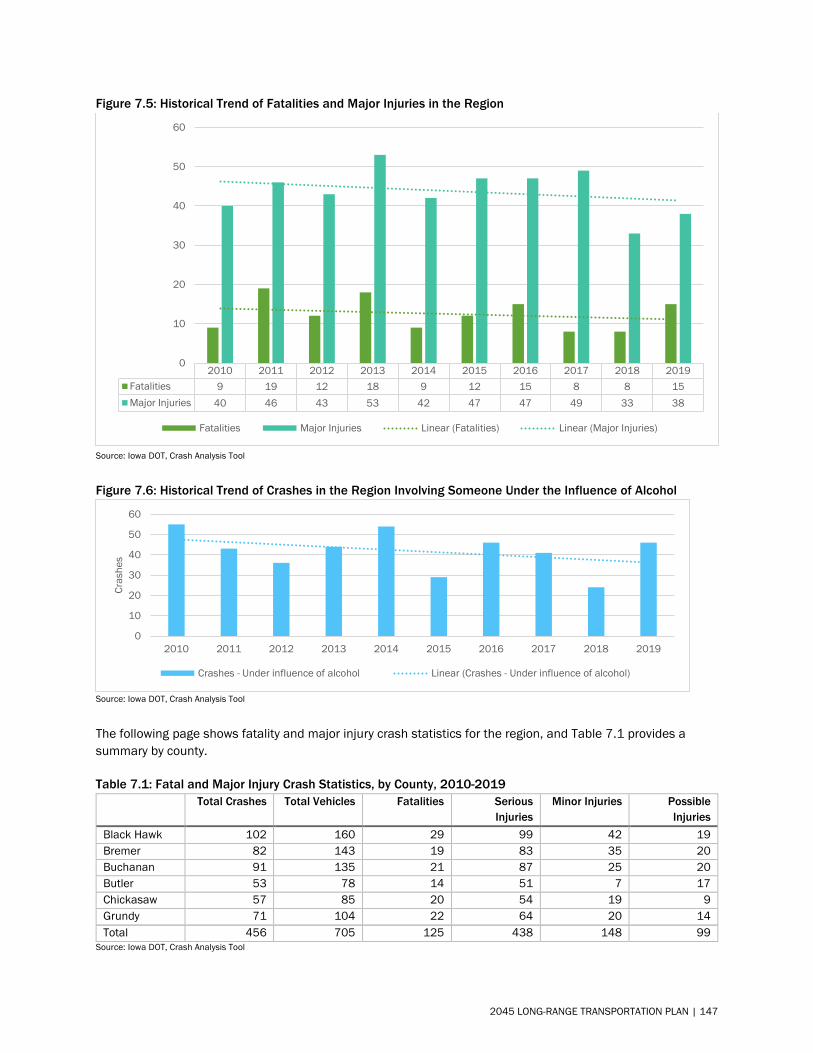
Figure 7.5: Historical Trend of Fatalities and Major Injuries in the Region
Source: Iowa DOT, Crash Analysis Tool
Figure 7.6: Historical Trend of Crashes in the Region Involving Someone Under the Influence of Alcohol
Source: Iowa DOT, Crash Analysis Tool
The following page shows fatality and major injury crash statistics for the region, and Table 7.1 provides a summary by county.
Table 7.1: Fatal and Major Injury Crash Statistics, by County, 2010-2019 Total Crashes Total Vehicles Fatalities Serious
Injuries Minor Injuries Possible
Injuries Black Hawk 102 160 29 99 42 19 Bremer 82 143 19 83 35 20 Buchanan 91 135 21 87 25 20 Butler 53 78 14 51 7 17 Chickasaw 57 85 20 54 19 9 Grundy 71 104 22 64 20 14 Total 456 705 125 438 148 99
Source: Iowa DOT, Crash Analysis Tool
2010 2011 2012 2013 2014 2015 2016 2017 2018 2019Fatalities 9 19 12 18 9 12 15 8 8 15Major Injuries 40 46 43 53 42 47 47 49 33 38
0
10
20
30
40
50
60
Fatalities Major Injuries Linear (Fatalities) Linear (Major Injuries)
0
10
20
30
40
50
60
2010 2011 2012 2013 2014 2015 2016 2017 2018 2019
Cras
hes
Crashes - Under influence of alcohol Linear (Crashes - Under influence of alcohol)
2045 LONG-RANGE TRANSPORTATION PLAN | 147

Map 7.1: Fatal and Major Injury Crashes, 2010-2019
Source: Iowa DOT, Crash Analysis Tool
Additional Information: • Top five major causes: (68) Crossed centerline (undivided), (52) Ran off road – right, (40)
Swerving/Evasive Action, (36) Ran off road – left, (29) FTYROW: From stop sign• 54 percent or crashes were non-collision (single vehicle)• 71 percent of crashes were in dry conditions• Property Damage Total: $7,304,207
2045 LONG-RANGE TRANSPORTATION PLAN | 148
Safety Plans and Efforts The Iowa DOT has been involved in several initiatives related to improving safety. There is an abundance of crash information and several tools for users located on the Iowa DOT website, as well as documents and plans outlining safety efforts.
Iowa Strategic Highway Safety Plan 2019 One method States conduct safety planning is through the development of a highway safety plan. A Strategic Highway Safety Plan (SHSP) is a statewide-coordinated safety plan that provides a comprehensive framework for reducing highway fatalities and serious injuries on all public roads. The SHSP establishes statewide goals, objectives, and key emphasis areas developed in consultation with federal, state, local, and private sector safety stakeholders. The 2019 SHSP is the fourth statewide safety plan to be adopted in Iowa.
The 2019 SHSP was developed in consultation with the SHSP Implementation Team which is composed of individuals representing the E’s of safety – education, emergency medical services, enforcement, and engineering. These representatives provide updates on programs, policies, and educational campaigns for their respective organizations, as well as data on the latest research for their area of expertise. For this update, the prioritization of Iowa’s 18 safety emphasis areas was supported by an analysis of crash data and an extensive statewide input process involving Iowa’s traffic safety stakeholders. The result of these efforts was the prioritization of eight of the safety emphasis areas that are now considered priority safety emphasis areas. For each of the priority safety emphasis areas, the Implementation Team identified strategies that provide the greatest opportunity to reduce fatalities and serious injuries. The eight priority safety emphasis areas are as follows:
• Lane departures and roadside collisions• Speed-related• Unprotected persons• Young drivers
• Intersections• Impairment involved• Older drivers• Distracted or inattentive drivers
Implementation of the priority safety emphasis areas and strategies will be carried out by the SHSP Implementation Team and broadly supported by traffic safety professionals from around the state. The implementation and progress of the plan will be evaluated on an annual basis of the five-year planning period ending December 2023. The goal of this plan is Zero Fatalities, however, interim annual goals aligning with the Highway Safety Improvement Program performance measures will be developed during the plan period. Although the Implementation Team is fully committed to reducing the number of fatalities and serious injuries on Iowa’s roadways, it recognizes that commitment pales in comparison to the cumulative impact every driver (fifth “E”) can have on the safety of Iowa’s roadways.
Although Zero Fatalities is Iowa’s long-term vision, the state also recognizes the need to establish short term goals in pursuit of this vision. In 2016, FHWA published the Highway Safety Improvement Program (HSIP) and Safety Performance Management (Safety PM) Final Rules. As part of these rules, states are required to develop statewide targets annually for five safety performance measures. These targets serve as the short-term goals for the state.
www.iowadot.gov/traffic/shsp/home
2045 LONG-RANGE TRANSPORTATION PLAN | 149
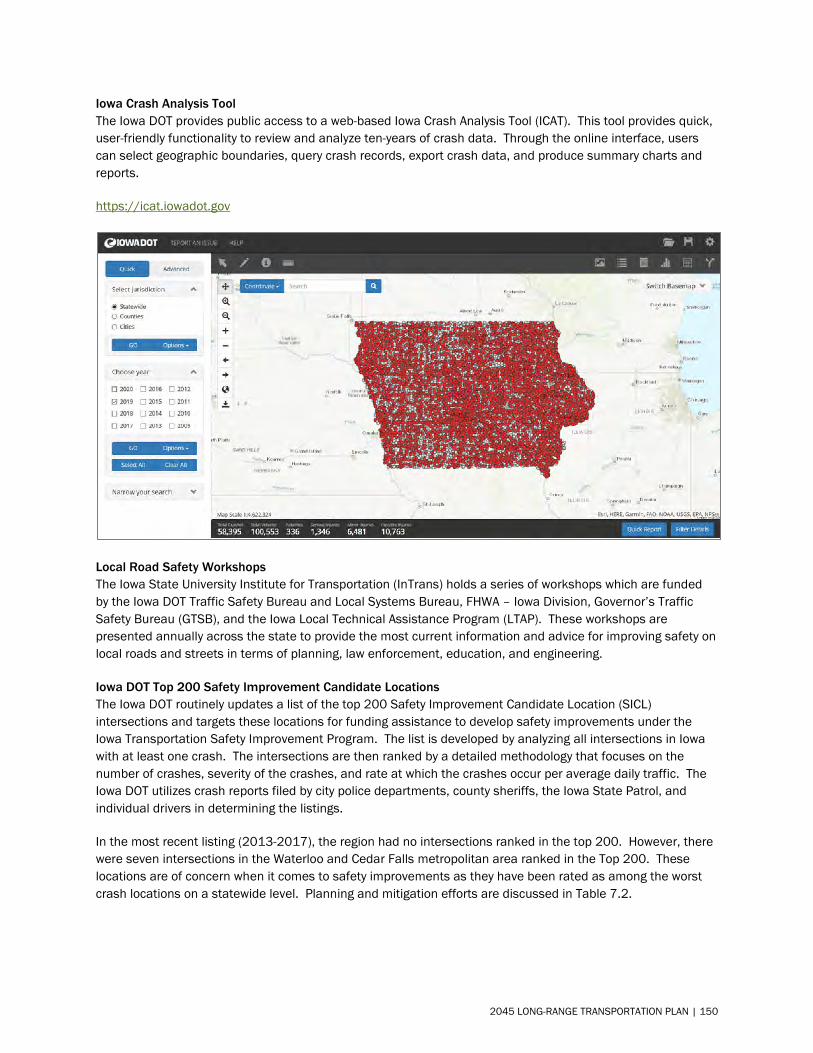
Iowa Crash Analysis Tool The Iowa DOT provides public access to a web-based Iowa Crash Analysis Tool (ICAT). This tool provides quick, user-friendly functionality to review and analyze ten-years of crash data. Through the online interface, users can select geographic boundaries, query crash records, export crash data, and produce summary charts and reports.
https://icat.iowadot.gov
Local Road Safety Workshops The Iowa State University Institute for Transportation (InTrans) holds a series of workshops which are funded by the Iowa DOT Traffic Safety Bureau and Local Systems Bureau, FHWA – Iowa Division, Governor’s Traffic Safety Bureau (GTSB), and the Iowa Local Technical Assistance Program (LTAP). These workshops are presented annually across the state to provide the most current information and advice for improving safety on local roads and streets in terms of planning, law enforcement, education, and engineering.
Iowa DOT Top 200 Safety Improvement Candidate Locations The Iowa DOT routinely updates a list of the top 200 Safety Improvement Candidate Location (SICL) intersections and targets these locations for funding assistance to develop safety improvements under the Iowa Transportation Safety Improvement Program. The list is developed by analyzing all intersections in Iowa with at least one crash. The intersections are then ranked by a detailed methodology that focuses on the number of crashes, severity of the crashes, and rate at which the crashes occur per average daily traffic. The Iowa DOT utilizes crash reports filed by city police departments, county sheriffs, the Iowa State Patrol, and individual drivers in determining the listings.
In the most recent listing (2013-2017), the region had no intersections ranked in the top 200. However, there were seven intersections in the Waterloo and Cedar Falls metropolitan area ranked in the Top 200. These locations are of concern when it comes to safety improvements as they have been rated as among the worst crash locations on a statewide level. Planning and mitigation efforts are discussed in Table 7.2.
2045 LONG-RANGE TRANSPORTATION PLAN | 150
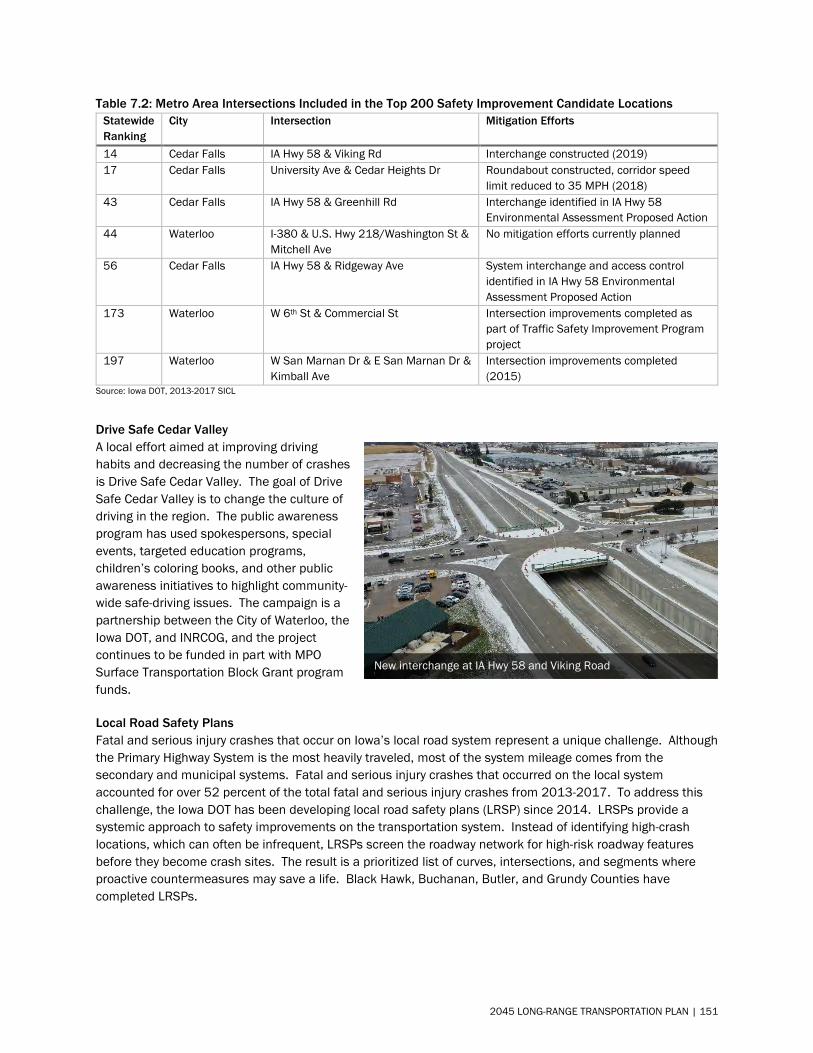
Table 7.2: Metro Area Intersections Included in the Top 200 Safety Improvement Candidate Locations Statewide Ranking
City Intersection Mitigation Efforts
14 Cedar Falls IA Hwy 58 & Viking Rd Interchange constructed (2019) 17 Cedar Falls University Ave & Cedar Heights Dr Roundabout constructed, corridor speed
limit reduced to 35 MPH (2018) 43 Cedar Falls IA Hwy 58 & Greenhill Rd Interchange identified in IA Hwy 58
Environmental Assessment Proposed Action 44 Waterloo I-380 & U.S. Hwy 218/Washington St &
Mitchell AveNo mitigation efforts currently planned
56 Cedar Falls IA Hwy 58 & Ridgeway Ave System interchange and access control identified in IA Hwy 58 Environmental Assessment Proposed Action
173 Waterloo W 6th St & Commercial St Intersection improvements completed as part of Traffic Safety Improvement Program project
197 Waterloo W San Marnan Dr & E San Marnan Dr & Kimball Ave
Intersection improvements completed (2015)
Source: Iowa DOT, 2013-2017 SICL
Drive Safe Cedar Valley A local effort aimed at improving driving habits and decreasing the number of crashes is Drive Safe Cedar Valley. The goal of Drive Safe Cedar Valley is to change the culture of driving in the region. The public awareness program has used spokespersons, special events, targeted education programs, children’s coloring books, and other public awareness initiatives to highlight community-wide safe-driving issues. The campaign is a partnership between the City of Waterloo, the Iowa DOT, and INRCOG, and the project continues to be funded in part with MPO Surface Transportation Block Grant program funds.
Local Road Safety Plans Fatal and serious injury crashes that occur on Iowa’s local road system represent a unique challenge. Although the Primary Highway System is the most heavily traveled, most of the system mileage comes from the secondary and municipal systems. Fatal and serious injury crashes that occurred on the local system accounted for over 52 percent of the total fatal and serious injury crashes from 2013-2017. To address this challenge, the Iowa DOT has been developing local road safety plans (LRSP) since 2014. LRSPs provide a systemic approach to safety improvements on the transportation system. Instead of identifying high-crash locations, which can often be infrequent, LRSPs screen the roadway network for high-risk roadway features before they become crash sites. The result is a prioritized list of curves, intersections, and segments where proactive countermeasures may save a life. Black Hawk, Buchanan, Butler, and Grundy Counties have completed LRSPs.
New interchange at IA Hwy 58 and Viking Road
2045 LONG-RANGE TRANSPORTATION PLAN | 151
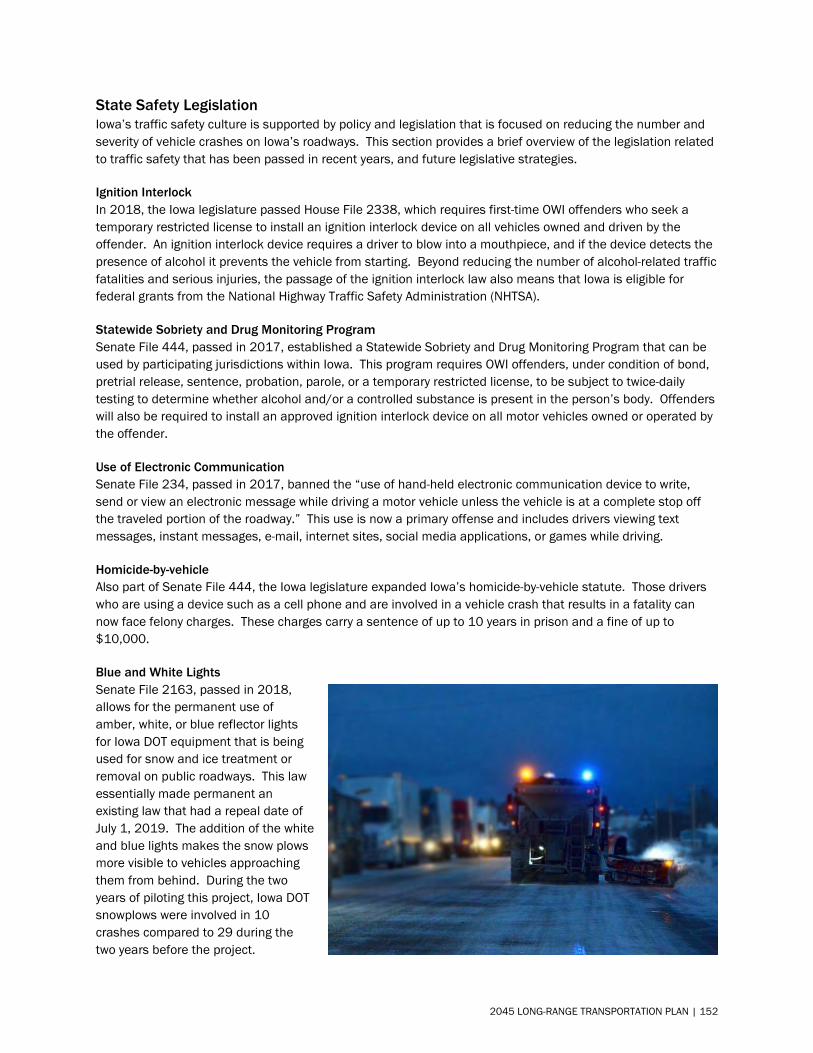
State Safety Legislation Iowa’s traffic safety culture is supported by policy and legislation that is focused on reducing the number and severity of vehicle crashes on Iowa’s roadways. This section provides a brief overview of the legislation related to traffic safety that has been passed in recent years, and future legislative strategies.
Ignition Interlock In 2018, the Iowa legislature passed House File 2338, which requires first-time OWI offenders who seek a temporary restricted license to install an ignition interlock device on all vehicles owned and driven by the offender. An ignition interlock device requires a driver to blow into a mouthpiece, and if the device detects the presence of alcohol it prevents the vehicle from starting. Beyond reducing the number of alcohol-related traffic fatalities and serious injuries, the passage of the ignition interlock law also means that Iowa is eligible for federal grants from the National Highway Traffic Safety Administration (NHTSA).
Statewide Sobriety and Drug Monitoring Program Senate File 444, passed in 2017, established a Statewide Sobriety and Drug Monitoring Program that can be used by participating jurisdictions within Iowa. This program requires OWI offenders, under condition of bond, pretrial release, sentence, probation, parole, or a temporary restricted license, to be subject to twice-daily testing to determine whether alcohol and/or a controlled substance is present in the person’s body. Offenders will also be required to install an approved ignition interlock device on all motor vehicles owned or operated by the offender.
Use of Electronic Communication Senate File 234, passed in 2017, banned the “use of hand-held electronic communication device to write, send or view an electronic message while driving a motor vehicle unless the vehicle is at a complete stop off the traveled portion of the roadway.” This use is now a primary offense and includes drivers viewing text messages, instant messages, e-mail, internet sites, social media applications, or games while driving.
Homicide-by-vehicle Also part of Senate File 444, the Iowa legislature expanded Iowa’s homicide-by-vehicle statute. Those drivers who are using a device such as a cell phone and are involved in a vehicle crash that results in a fatality can now face felony charges. These charges carry a sentence of up to 10 years in prison and a fine of up to $10,000.
Blue and White Lights Senate File 2163, passed in 2018, allows for the permanent use of amber, white, or blue reflector lights for Iowa DOT equipment that is being used for snow and ice treatment or removal on public roadways. This law essentially made permanent an existing law that had a repeal date of July 1, 2019. The addition of the white and blue lights makes the snow plows more visible to vehicles approaching them from behind. During the two years of piloting this project, Iowa DOT snowplows were involved in 10 crashes compared to 29 during the two years before the project.
2045 LONG-RANGE TRANSPORTATION PLAN | 152
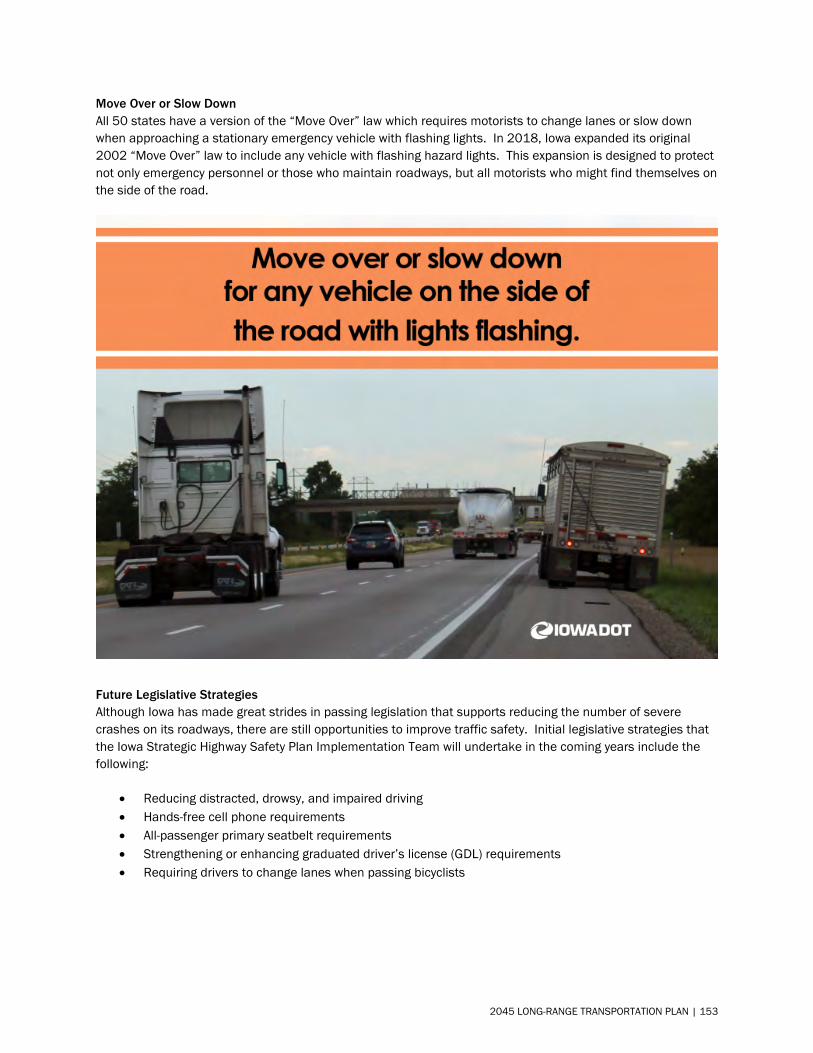
Move Over or Slow Down All 50 states have a version of the “Move Over” law which requires motorists to change lanes or slow down when approaching a stationary emergency vehicle with flashing lights. In 2018, Iowa expanded its original 2002 “Move Over” law to include any vehicle with flashing hazard lights. This expansion is designed to protect not only emergency personnel or those who maintain roadways, but all motorists who might find themselves on the side of the road.
Future Legislative Strategies Although Iowa has made great strides in passing legislation that supports reducing the number of severe crashes on its roadways, there are still opportunities to improve traffic safety. Initial legislative strategies that the Iowa Strategic Highway Safety Plan Implementation Team will undertake in the coming years include the following:
• Reducing distracted, drowsy, and impaired driving • Hands-free cell phone requirements • All-passenger primary seatbelt requirements • Strengthening or enhancing graduated driver’s license (GDL) requirements • Requiring drivers to change lanes when passing bicyclists
2045 LONG-RANGE TRANSPORTATION PLAN | 153
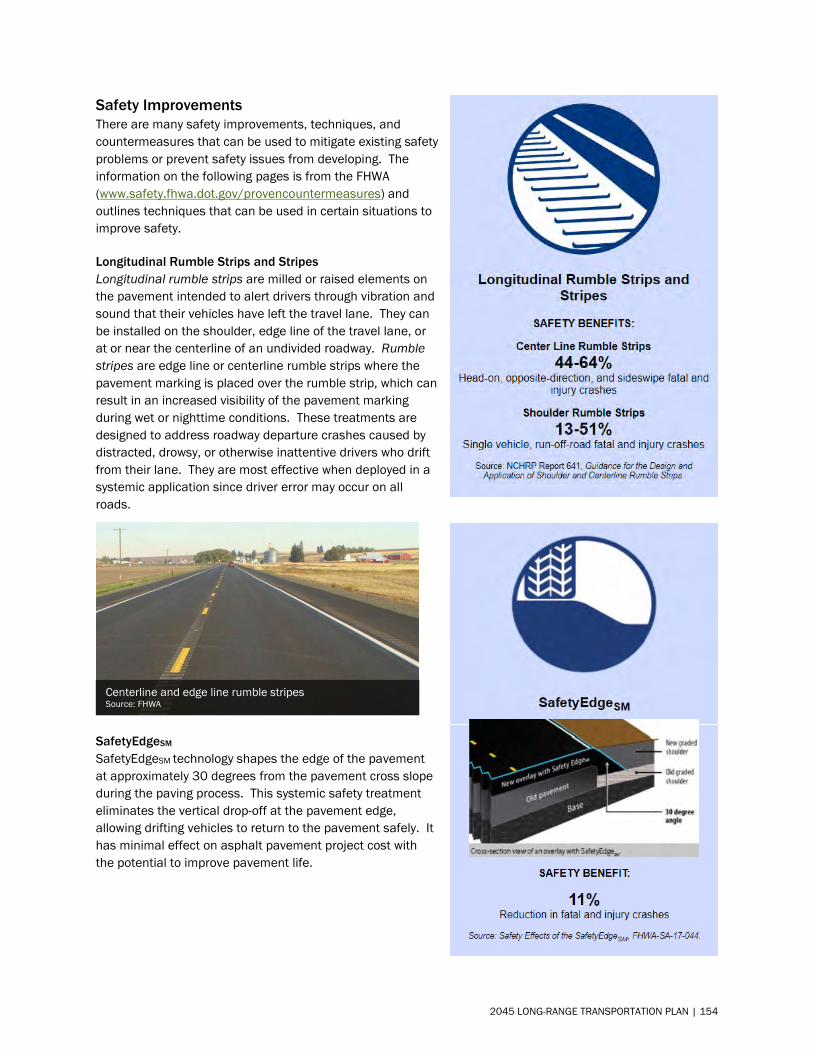
Safety Improvements There are many safety improvements, techniques, and countermeasures that can be used to mitigate existing safety problems or prevent safety issues from developing. The information on the following pages is from the FHWA (www.safety.fhwa.dot.gov/provencountermeasures) and outlines techniques that can be used in certain situations to improve safety.
Longitudinal Rumble Strips and Stripes Longitudinal rumble strips are milled or raised elements on the pavement intended to alert drivers through vibration and sound that their vehicles have left the travel lane. They can be installed on the shoulder, edge line of the travel lane, or at or near the centerline of an undivided roadway. Rumble stripes are edge line or centerline rumble strips where the pavement marking is placed over the rumble strip, which can result in an increased visibility of the pavement marking during wet or nighttime conditions. These treatments are designed to address roadway departure crashes caused by distracted, drowsy, or otherwise inattentive drivers who drift from their lane. They are most effective when deployed in a systemic application since driver error may occur on all roads.
SafetyEdgeSM SafetyEdgeSM technology shapes the edge of the pavement at approximately 30 degrees from the pavement cross slope during the paving process. This systemic safety treatment eliminates the vertical drop-off at the pavement edge, allowing drifting vehicles to return to the pavement safely. It has minimal effect on asphalt pavement project cost with the potential to improve pavement life.
Centerline and edge line rumble stripes Source: FHWA
2045 LONG-RANGE TRANSPORTATION PLAN | 154
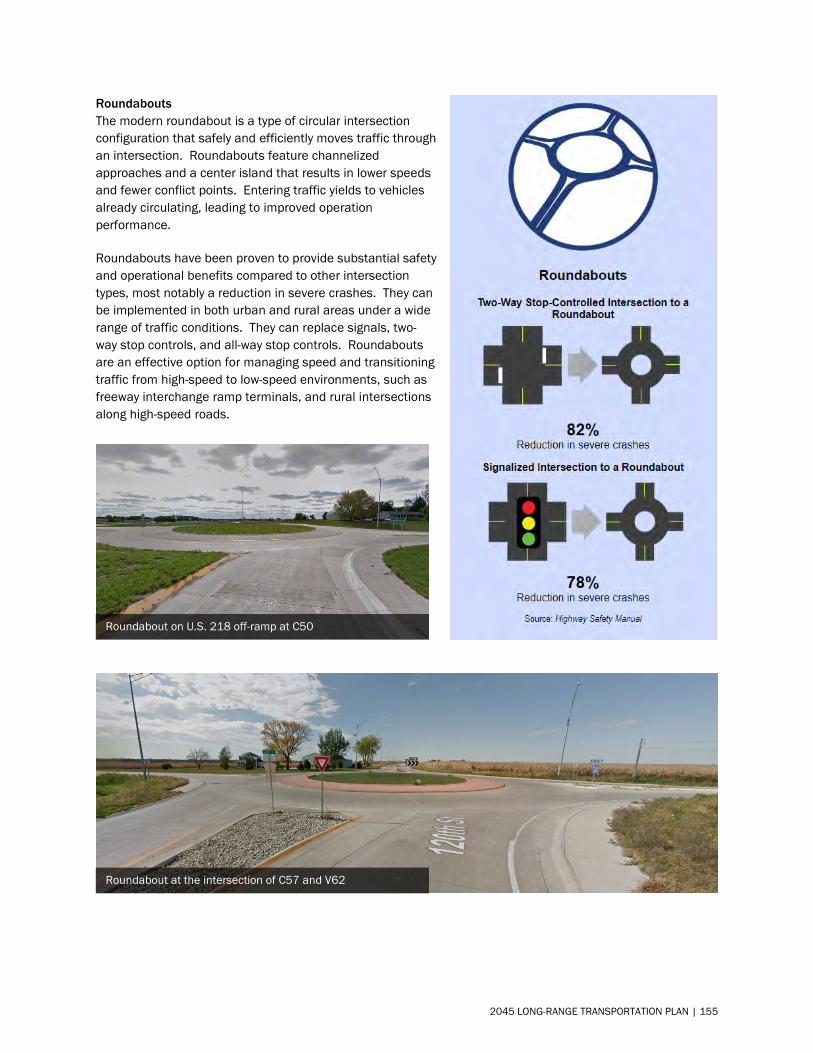
Roundabouts The modern roundabout is a type of circular intersection configuration that safely and efficiently moves traffic through an intersection. Roundabouts feature channelized approaches and a center island that results in lower speeds and fewer conflict points. Entering traffic yields to vehicles already circulating, leading to improved operation performance.
Roundabouts have been proven to provide substantial safety and operational benefits compared to other intersection types, most notably a reduction in severe crashes. They can be implemented in both urban and rural areas under a wide range of traffic conditions. They can replace signals, two-way stop controls, and all-way stop controls. Roundabouts are an effective option for managing speed and transitioning traffic from high-speed to low-speed environments, such as freeway interchange ramp terminals, and rural intersections along high-speed roads.
Roundabout on U.S. 218 off-ramp at C50
Roundabout at the intersection of C57 and V62
2045 LONG-RANGE TRANSPORTATION PLAN | 155
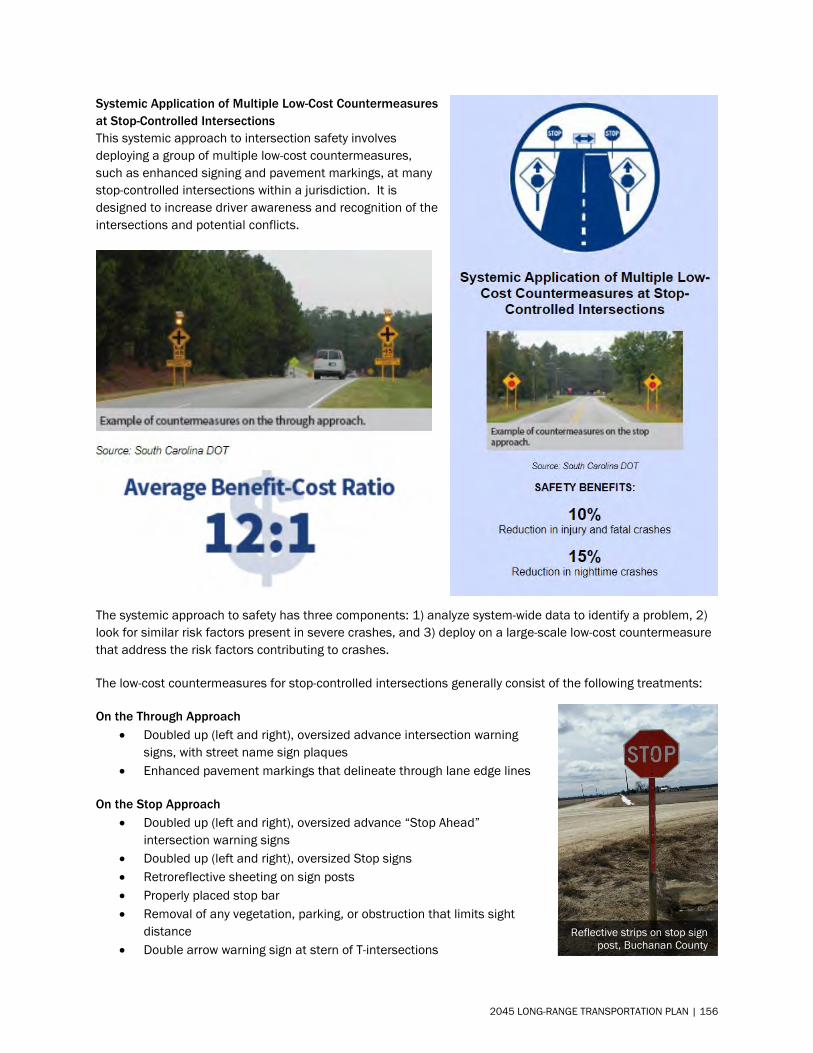
Systemic Application of Multiple Low-Cost Countermeasures at Stop-Controlled Intersections This systemic approach to intersection safety involves deploying a group of multiple low-cost countermeasures, such as enhanced signing and pavement markings, at many stop-controlled intersections within a jurisdiction. It is designed to increase driver awareness and recognition of the intersections and potential conflicts.
The systemic approach to safety has three components: 1) analyze system-wide data to identify a problem, 2) look for similar risk factors present in severe crashes, and 3) deploy on a large-scale low-cost countermeasure that address the risk factors contributing to crashes.
The low-cost countermeasures for stop-controlled intersections generally consist of the following treatments:
On the Through Approach • Doubled up (left and right), oversized advance intersection warning
signs, with street name sign plaques • Enhanced pavement markings that delineate through lane edge lines
On the Stop Approach • Doubled up (left and right), oversized advance “Stop Ahead”
intersection warning signs • Doubled up (left and right), oversized Stop signs • Retroreflective sheeting on sign posts • Properly placed stop bar • Removal of any vegetation, parking, or obstruction that limits sight
distance • Double arrow warning sign at stern of T-intersections
Reflective strips on stop sign post, Buchanan County
2045 LONG-RANGE TRANSPORTATION PLAN | 156

Roadside Design Improvements at Curves Roadside design improvements at curves is a strategy encompassing several treatments that target the high-risk environment along the outside of horizontal curves. These treatments prevent roadway departure fatalities by giving vehicles the opportunity to recover safely and by reducing crash severity.
Roadside design improvements can be implemented alone or in combination and are particularly recommended at horizontal curves – where data indicates a higher-risk for roadway departure fatalities – and where cost effectiveness can be maximized.
Roadside Design Improvements to Provide for a Safe Recovery In cases where a vehicle leaves the roadway, strategic roadside design elements, including clear zone addition or widening, slope flattening, and shoulder addition or widening, can provide drivers with an opportunity to regain control and re-enter the roadway.
• A clear zone is an unobstructed, traversable areabeyond the edge of the through traveled way for therecovery of errant vehicles. Clear zones are free ofrigid fixed objects such as trees and utility cabinetsor poles.
• Slope flattening reduces the steepness of the sideslope to increase drivers’ ability to keep the vehiclestable, regain control of the vehicle, and avoidobstacles.
• Adding or widening shoulders gives drivers morerecovery area to regain control in the event of aroadway departure.
Roadside Design Improvements to Reduce Crash Severity Since not all roadside hazards can be removed at curves, installing roadside barriers to shield unmovable objects or embankments may be an appropriate treatment. Roadside barriers come in three forms:
• Cable barrier is a flexible barrier made from wire rope supported between frangible posts.• Guardrail is a semi-rigid barrier, usually either a steel box beam or W-beam. These deflect less than
flexible barriers, so they can be located closer to objects where space is limited.• Concrete barrier is a rigid barrier that does not deflect. These are typically reserved for use on divided
roadways.
2045 LONG-RANGE TRANSPORTATION PLAN | 157
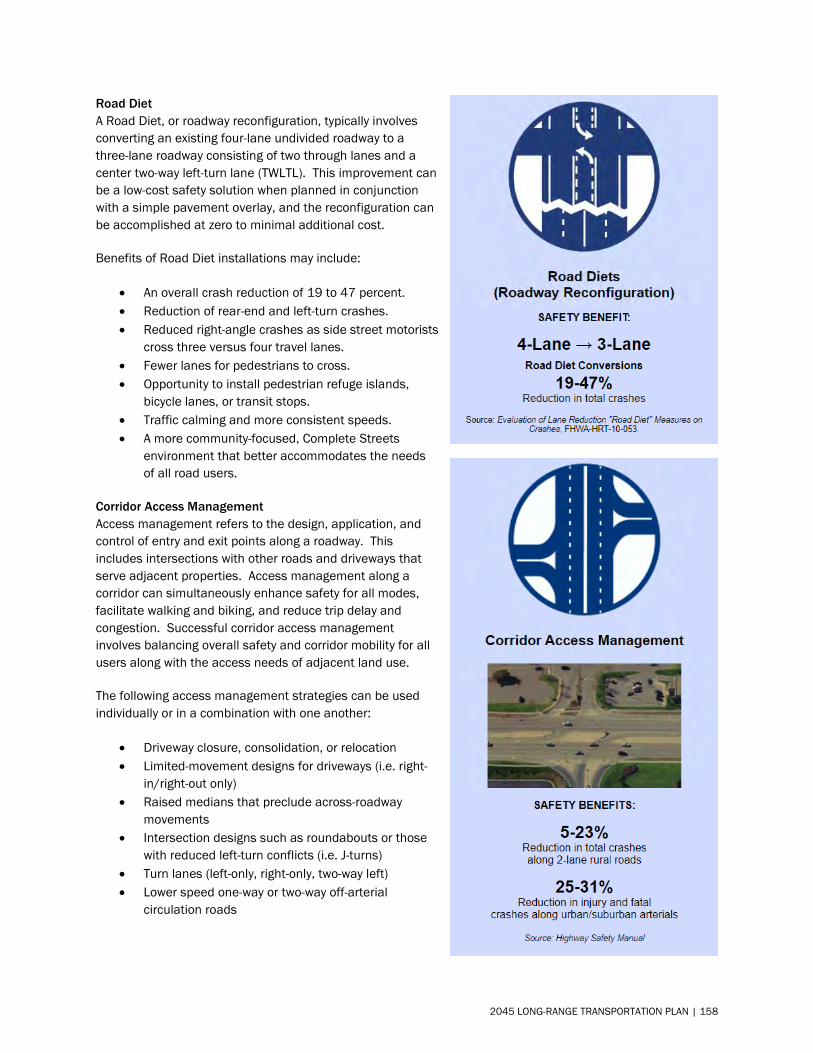
Road Diet A Road Diet, or roadway reconfiguration, typically involves converting an existing four-lane undivided roadway to a three-lane roadway consisting of two through lanes and a center two-way left-turn lane (TWLTL). This improvement can be a low-cost safety solution when planned in conjunction with a simple pavement overlay, and the reconfiguration can be accomplished at zero to minimal additional cost.
Benefits of Road Diet installations may include:
• An overall crash reduction of 19 to 47 percent.• Reduction of rear-end and left-turn crashes.• Reduced right-angle crashes as side street motorists
cross three versus four travel lanes.• Fewer lanes for pedestrians to cross.• Opportunity to install pedestrian refuge islands,
bicycle lanes, or transit stops.• Traffic calming and more consistent speeds.• A more community-focused, Complete Streets
environment that better accommodates the needsof all road users.
Corridor Access Management Access management refers to the design, application, and control of entry and exit points along a roadway. This includes intersections with other roads and driveways that serve adjacent properties. Access management along a corridor can simultaneously enhance safety for all modes, facilitate walking and biking, and reduce trip delay and congestion. Successful corridor access management involves balancing overall safety and corridor mobility for all users along with the access needs of adjacent land use.
The following access management strategies can be used individually or in a combination with one another:
• Driveway closure, consolidation, or relocation• Limited-movement designs for driveways (i.e. right-
in/right-out only)• Raised medians that preclude across-roadway
movements• Intersection designs such as roundabouts or those
with reduced left-turn conflicts (i.e. J-turns)• Turn lanes (left-only, right-only, two-way left)• Lower speed one-way or two-way off-arterial
circulation roads
2045 LONG-RANGE TRANSPORTATION PLAN | 158
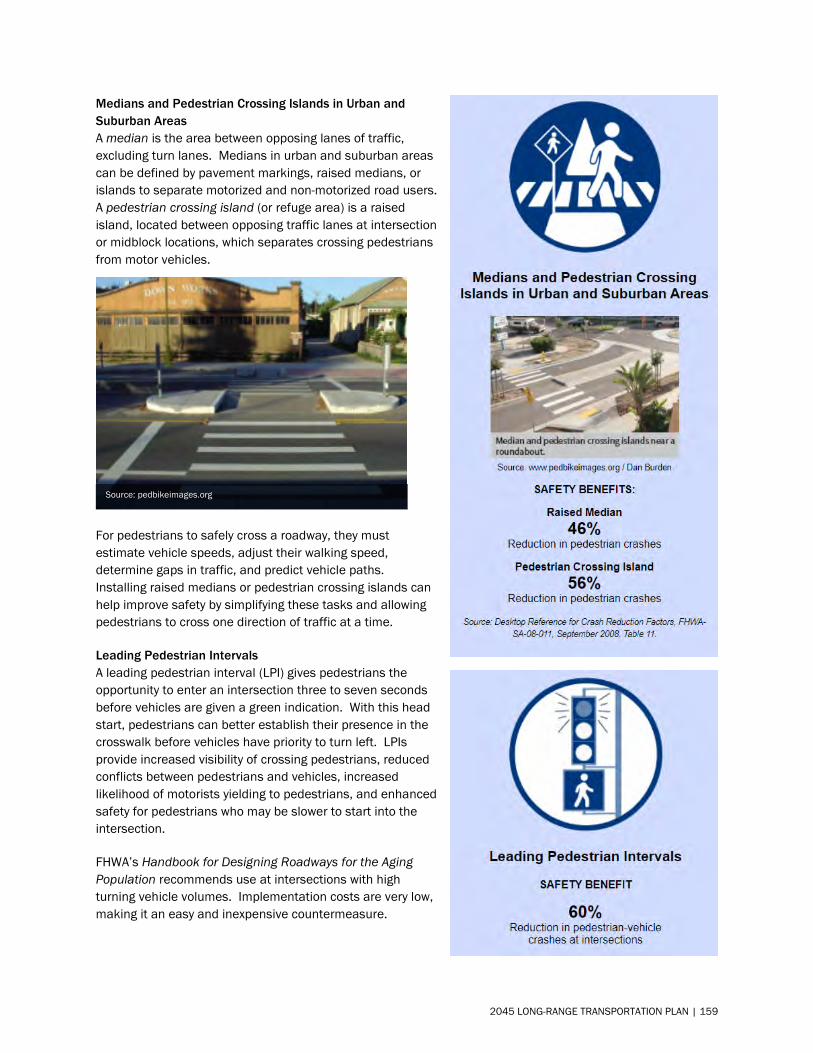
Medians and Pedestrian Crossing Islands in Urban and Suburban Areas A median is the area between opposing lanes of traffic, excluding turn lanes. Medians in urban and suburban areas can be defined by pavement markings, raised medians, or islands to separate motorized and non-motorized road users. A pedestrian crossing island (or refuge area) is a raised island, located between opposing traffic lanes at intersection or midblock locations, which separates crossing pedestrians from motor vehicles.
For pedestrians to safely cross a roadway, they must estimate vehicle speeds, adjust their walking speed, determine gaps in traffic, and predict vehicle paths. Installing raised medians or pedestrian crossing islands can help improve safety by simplifying these tasks and allowing pedestrians to cross one direction of traffic at a time.
Leading Pedestrian Intervals A leading pedestrian interval (LPI) gives pedestrians the opportunity to enter an intersection three to seven seconds before vehicles are given a green indication. With this head start, pedestrians can better establish their presence in the crosswalk before vehicles have priority to turn left. LPIs provide increased visibility of crossing pedestrians, reduced conflicts between pedestrians and vehicles, increased likelihood of motorists yielding to pedestrians, and enhanced safety for pedestrians who may be slower to start into the intersection.
FHWA’s Handbook for Designing Roadways for the Aging Population recommends use at intersections with high turning vehicle volumes. Implementation costs are very low, making it an easy and inexpensive countermeasure.
Source: pedbikeimages.org
2045 LONG-RANGE TRANSPORTATION PLAN | 159
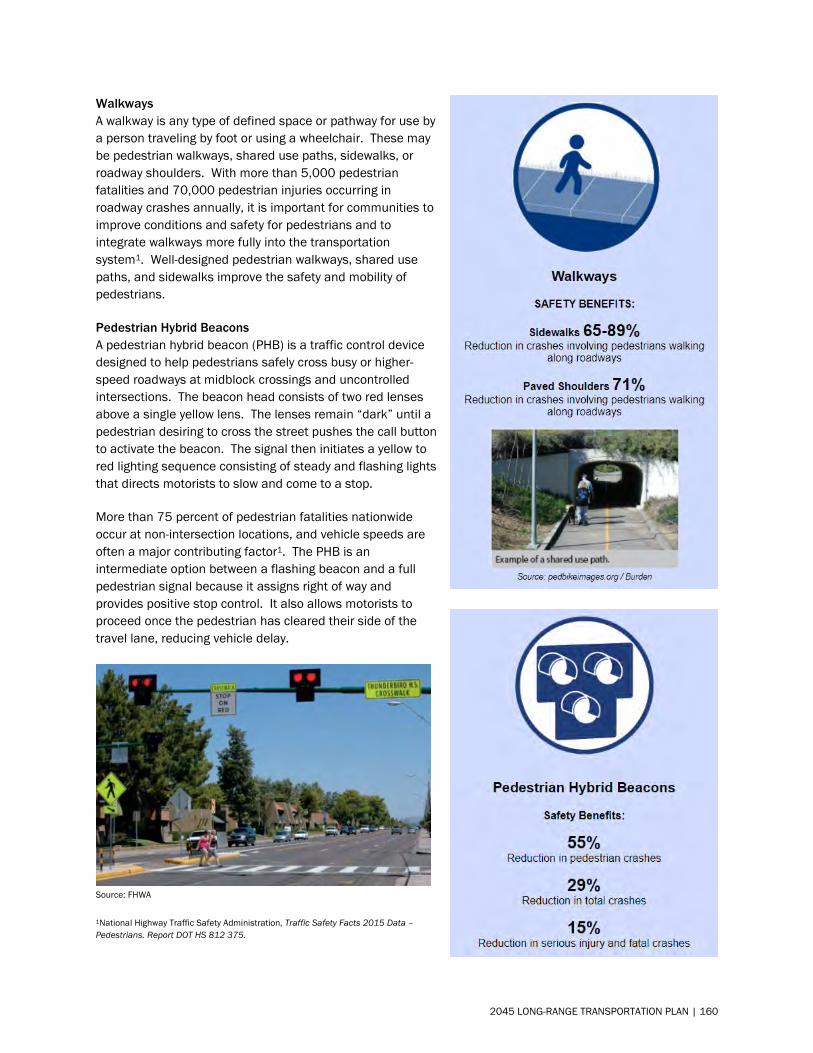
Walkways A walkway is any type of defined space or pathway for use by a person traveling by foot or using a wheelchair. These may be pedestrian walkways, shared use paths, sidewalks, or roadway shoulders. With more than 5,000 pedestrian fatalities and 70,000 pedestrian injuries occurring in roadway crashes annually, it is important for communities to improve conditions and safety for pedestrians and to integrate walkways more fully into the transportation system1. Well-designed pedestrian walkways, shared use paths, and sidewalks improve the safety and mobility of pedestrians.
Pedestrian Hybrid Beacons A pedestrian hybrid beacon (PHB) is a traffic control device designed to help pedestrians safely cross busy or higher-speed roadways at midblock crossings and uncontrolled intersections. The beacon head consists of two red lenses above a single yellow lens. The lenses remain “dark” until a pedestrian desiring to cross the street pushes the call button to activate the beacon. The signal then initiates a yellow to red lighting sequence consisting of steady and flashing lights that directs motorists to slow and come to a stop.
More than 75 percent of pedestrian fatalities nationwide occur at non-intersection locations, and vehicle speeds are often a major contributing factor1. The PHB is an intermediate option between a flashing beacon and a full pedestrian signal because it assigns right of way and provides positive stop control. It also allows motorists to proceed once the pedestrian has cleared their side of the travel lane, reducing vehicle delay.
Source: FHWA
1National Highway Traffic Safety Administration, Traffic Safety Facts 2015 Data – Pedestrians. Report DOT HS 812 375.
2045 LONG-RANGE TRANSPORTATION PLAN | 160
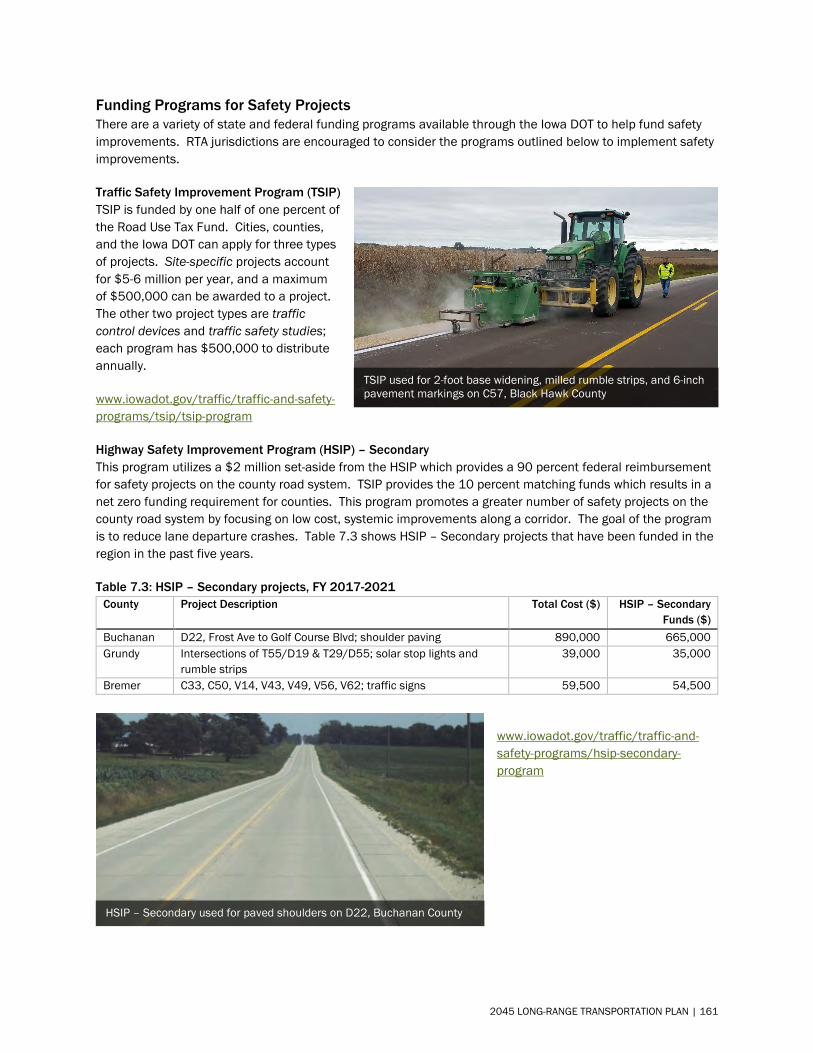
Funding Programs for Safety Projects There are a variety of state and federal funding programs available through the Iowa DOT to help fund safety improvements. RTA jurisdictions are encouraged to consider the programs outlined below to implement safety improvements.
Traffic Safety Improvement Program (TSIP) TSIP is funded by one half of one percent of the Road Use Tax Fund. Cities, counties, and the Iowa DOT can apply for three types of projects. Site-specific projects account for $5-6 million per year, and a maximum of $500,000 can be awarded to a project. The other two project types are traffic control devices and traffic safety studies; each program has $500,000 to distribute annually.
www.iowadot.gov/traffic/traffic-and-safety-programs/tsip/tsip-program
Highway Safety Improvement Program (HSIP) – Secondary This program utilizes a $2 million set-aside from the HSIP which provides a 90 percent federal reimbursement for safety projects on the county road system. TSIP provides the 10 percent matching funds which results in a net zero funding requirement for counties. This program promotes a greater number of safety projects on the county road system by focusing on low cost, systemic improvements along a corridor. The goal of the program is to reduce lane departure crashes. Table 7.3 shows HSIP – Secondary projects that have been funded in the region in the past five years.
Table 7.3: HSIP – Secondary projects, FY 2017-2021 County Project Description Total Cost ($) HSIP – Secondary
Funds ($) Buchanan D22, Frost Ave to Golf Course Blvd; shoulder paving 890,000 665,000 Grundy Intersections of T55/D19 & T29/D55; solar stop lights and
rumble strips 39,000 35,000
Bremer C33, C50, V14, V43, V49, V56, V62; traffic signs 59,500 54,500
www.iowadot.gov/traffic/traffic-and-safety-programs/hsip-secondary-program
TSIP used for 2-foot base widening, milled rumble strips, and 6-inch pavement markings on C57, Black Hawk County
HSIP – Secondary used for paved shoulders on D22, Buchanan County
2045 LONG-RANGE TRANSPORTATION PLAN | 161
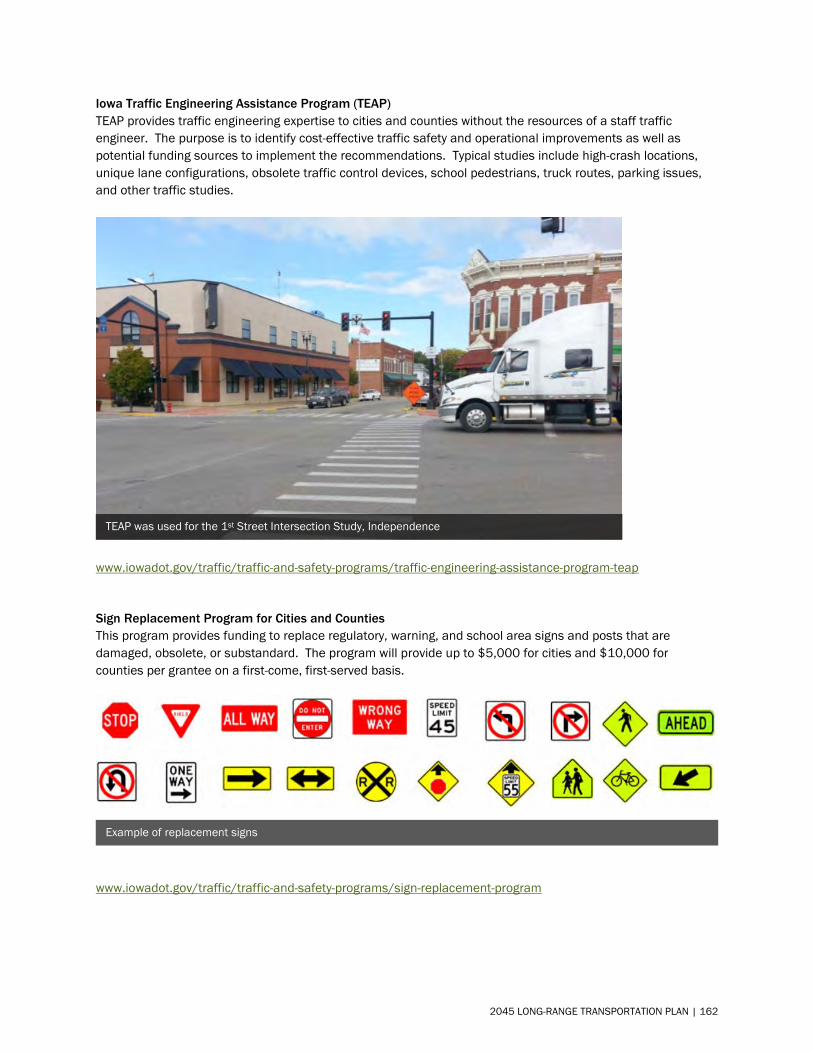
Iowa Traffic Engineering Assistance Program (TEAP) TEAP provides traffic engineering expertise to cities and counties without the resources of a staff traffic engineer. The purpose is to identify cost-effective traffic safety and operational improvements as well as potential funding sources to implement the recommendations. Typical studies include high-crash locations, unique lane configurations, obsolete traffic control devices, school pedestrians, truck routes, parking issues, and other traffic studies.
www.iowadot.gov/traffic/traffic-and-safety-programs/traffic-engineering-assistance-program-teap
Sign Replacement Program for Cities and Counties This program provides funding to replace regulatory, warning, and school area signs and posts that are damaged, obsolete, or substandard. The program will provide up to $5,000 for cities and $10,000 for counties per grantee on a first-come, first-served basis.
www.iowadot.gov/traffic/traffic-and-safety-programs/sign-replacement-program
Example of replacement signs
TEAP was used for the 1st Street Intersection Study, Independence
2045 LONG-RANGE TRANSPORTATION PLAN | 162
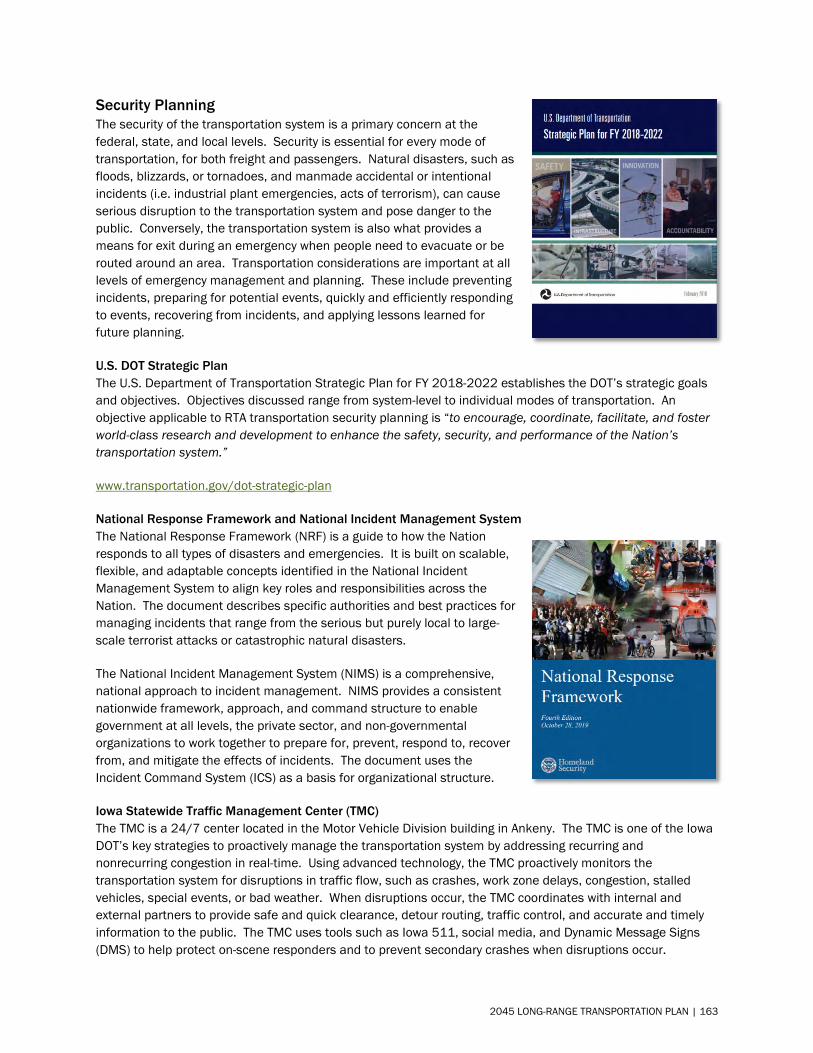
Security Planning The security of the transportation system is a primary concern at the federal, state, and local levels. Security is essential for every mode of transportation, for both freight and passengers. Natural disasters, such as floods, blizzards, or tornadoes, and manmade accidental or intentional incidents (i.e. industrial plant emergencies, acts of terrorism), can cause serious disruption to the transportation system and pose danger to the public. Conversely, the transportation system is also what provides a means for exit during an emergency when people need to evacuate or be routed around an area. Transportation considerations are important at all levels of emergency management and planning. These include preventing incidents, preparing for potential events, quickly and efficiently responding to events, recovering from incidents, and applying lessons learned for future planning.
U.S. DOT Strategic Plan The U.S. Department of Transportation Strategic Plan for FY 2018-2022 establishes the DOT’s strategic goals and objectives. Objectives discussed range from system-level to individual modes of transportation. An objective applicable to RTA transportation security planning is “to encourage, coordinate, facilitate, and foster world-class research and development to enhance the safety, security, and performance of the Nation’s transportation system.”
www.transportation.gov/dot-strategic-plan
National Response Framework and National Incident Management System The National Response Framework (NRF) is a guide to how the Nation responds to all types of disasters and emergencies. It is built on scalable, flexible, and adaptable concepts identified in the National Incident Management System to align key roles and responsibilities across the Nation. The document describes specific authorities and best practices for managing incidents that range from the serious but purely local to large-scale terrorist attacks or catastrophic natural disasters.
The National Incident Management System (NIMS) is a comprehensive, national approach to incident management. NIMS provides a consistent nationwide framework, approach, and command structure to enable government at all levels, the private sector, and non-governmental organizations to work together to prepare for, prevent, respond to, recover from, and mitigate the effects of incidents. The document uses the Incident Command System (ICS) as a basis for organizational structure.
Iowa Statewide Traffic Management Center (TMC) The TMC is a 24/7 center located in the Motor Vehicle Division building in Ankeny. The TMC is one of the Iowa DOT’s key strategies to proactively manage the transportation system by addressing recurring and nonrecurring congestion in real-time. Using advanced technology, the TMC proactively monitors the transportation system for disruptions in traffic flow, such as crashes, work zone delays, congestion, stalled vehicles, special events, or bad weather. When disruptions occur, the TMC coordinates with internal and external partners to provide safe and quick clearance, detour routing, traffic control, and accurate and timely information to the public. The TMC uses tools such as Iowa 511, social media, and Dynamic Message Signs (DMS) to help protect on-scene responders and to prevent secondary crashes when disruptions occur.
2045 LONG-RANGE TRANSPORTATION PLAN | 163

Intelligent Transportation Systems (ITS) There are several ITS safety and security activities undertaken by the Iowa DOT. This includes the Iowa 511 Traveler Information System which provides citizens with real-time information on roadway travel conditions, incidents, and construction activities. The 511 system can be accessed via phone, web, or mobile application and provides a way to quickly communicate with the traveling public. Many metropolitan areas have cameras on major routes and speed sensors that monitor congestion. The first installation of cameras and speed sensors in the region were part of the Interstate 380 reconstruction project in 2012. Since then, the Iowa DOT has expanded the system to include U.S. 218 and U.S. 20. In 2020, the Iowa DOT launched an updated web application with additional features and layers.
www.511ia.org
Another ITS activity undertaken by the Iowa DOT is the use of dynamic message signs (DMS). Large overhead signs can be found throughout the state on many interstates and primary highways. These signs can be used to communicate information to drivers on weather, incidents, diversions, Amber Alerts, public reminders, and other topics. DMS have been installed in the Waterloo and Cedar Falls metropolitan area on U.S. 218, U.S. 20, and Interstate 380.
Every Monday since 2013, the Iowa DOT has been utilizing dynamic message signs across the state to provide a safety message and the number of people who have been killed on Iowa’s roads so far in the year. “Message Monday” is meant to increase awareness, change driver behavior, and reduce accidents and fatalities. To make messages more memorable, movie quotes, song lyrics, and puns are used, and no message is reused. The Iowa DOT also has a Transportation Matters Blog where each Message Monday is discussed and additional information and tips for motorist safety are provided.
www.ia.zerofatalities.com
2045 LONG-RANGE TRANSPORTATION PLAN | 164
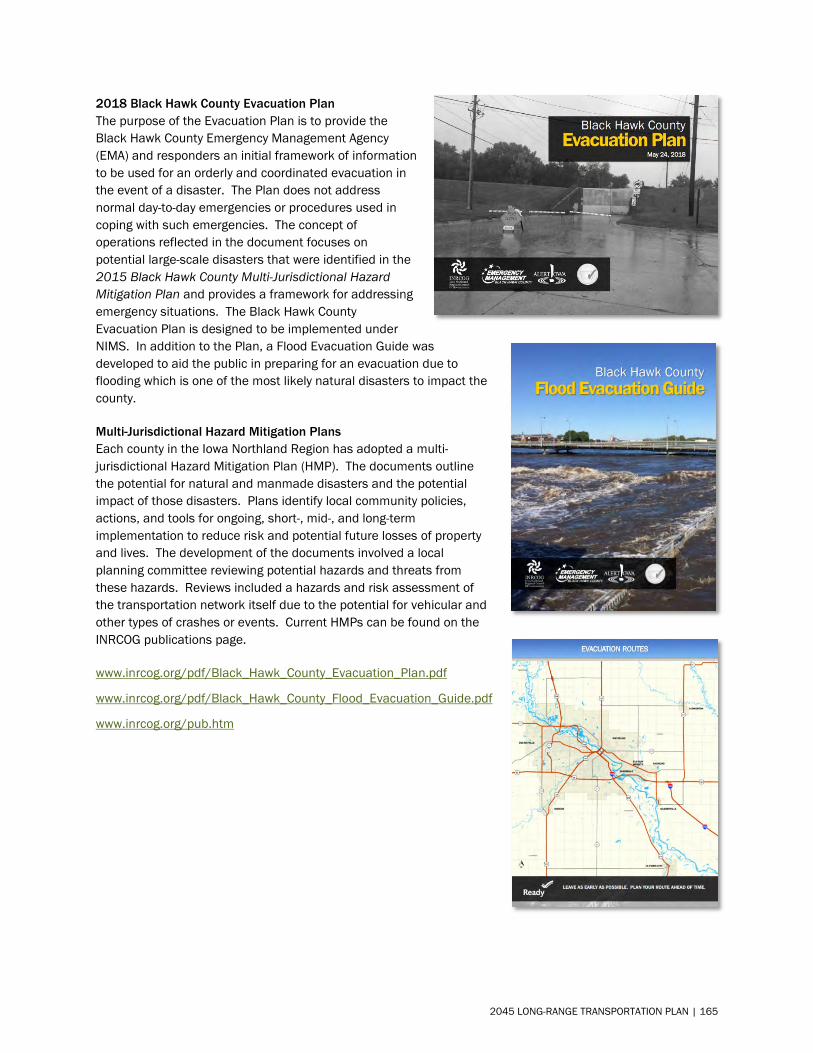
2018 Black Hawk County Evacuation Plan The purpose of the Evacuation Plan is to provide the Black Hawk County Emergency Management Agency (EMA) and responders an initial framework of information to be used for an orderly and coordinated evacuation in the event of a disaster. The Plan does not address normal day-to-day emergencies or procedures used in coping with such emergencies. The concept of operations reflected in the document focuses on potential large-scale disasters that were identified in the 2015 Black Hawk County Multi-Jurisdictional Hazard Mitigation Plan and provides a framework for addressing emergency situations. The Black Hawk County Evacuation Plan is designed to be implemented under NIMS. In addition to the Plan, a Flood Evacuation Guide was developed to aid the public in preparing for an evacuation due to flooding which is one of the most likely natural disasters to impact the county.
Multi-Jurisdictional Hazard Mitigation Plans Each county in the Iowa Northland Region has adopted a multi-jurisdictional Hazard Mitigation Plan (HMP). The documents outline the potential for natural and manmade disasters and the potential impact of those disasters. Plans identify local community policies, actions, and tools for ongoing, short-, mid-, and long-term implementation to reduce risk and potential future losses of property and lives. The development of the documents involved a local planning committee reviewing potential hazards and threats from these hazards. Reviews included a hazards and risk assessment of the transportation network itself due to the potential for vehicular and other types of crashes or events. Current HMPs can be found on the INRCOG publications page.
www.inrcog.org/pdf/Black_Hawk_County_Evacuation_Plan.pdf
www.inrcog.org/pdf/Black_Hawk_County_Flood_Evacuation_Guide.pdf
www.inrcog.org/pub.htm
2045 LONG-RANGE TRANSPORTATION PLAN | 165

2020 Public Input Survey In September 2020, RTA staff conducted a public input survey to gain input from across the Iowa Northland Region. Surveys were mailed to 1,000 randomly generated households in the region, and a total of 118 were returned.
Respondents were also asked what the number one transportation problem in their life is, and what will be the biggest transportation challenge in the next 25 years. Notable findings pertinent to this chapter include the following:
What is the number one transportation problem in your life? • 9.3 percent of survey respondents reported a safety issue (road, railroad crossing, bicycle, and
pedestrian).
What will be the biggest transportation challenge in the next 25 years? • Two respondents said safety would be the biggest challenge.
Additional Comments • One survey respondent said to add continuous centerline rumble strips.• One survey respondent mentioned on-road bicycle safety and an acquaintance being hit by a vehicle
that failed to move over.• Five survey respondents perceived biking on road to be dangerous.
2045 LONG-RANGE TRANSPORTATION PLAN | 166
Chapter 8
Environmental Review
2045 LONG-RANGE TRANSPORTATION PLAN | 167
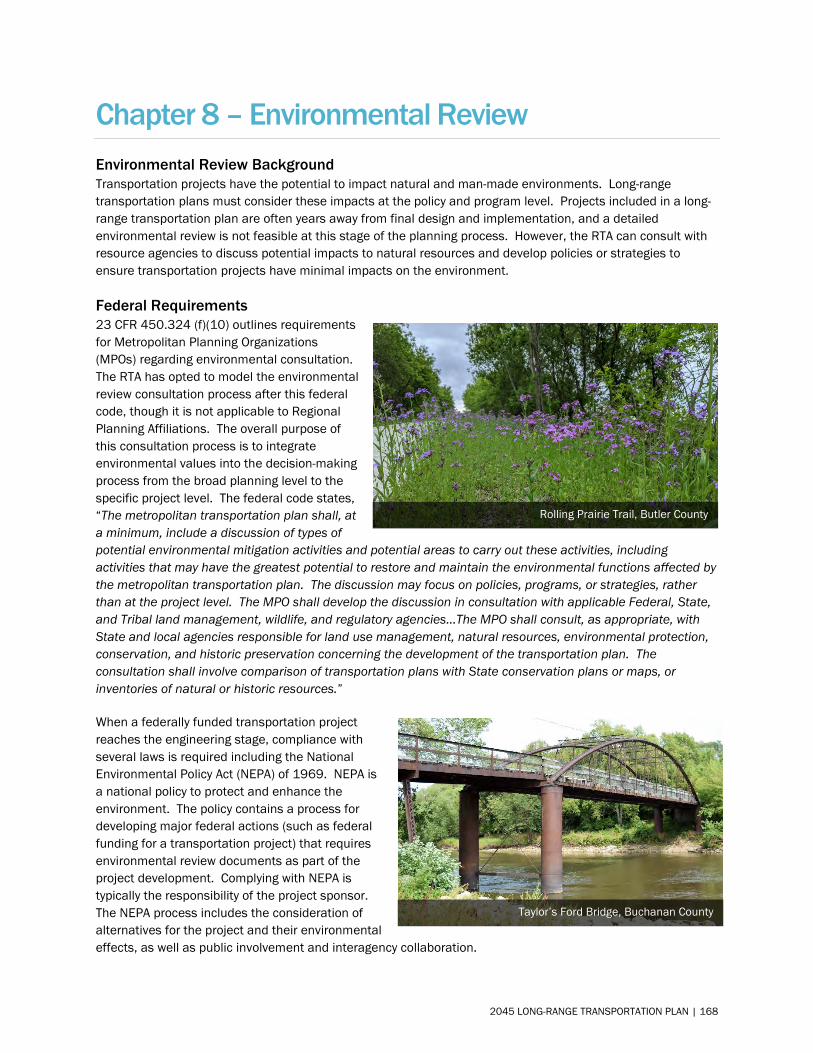
Chapter 8 – Environmental Review Environmental Review Background Transportation projects have the potential to impact natural and man-made environments. Long-range transportation plans must consider these impacts at the policy and program level. Projects included in a long-range transportation plan are often years away from final design and implementation, and a detailed environmental review is not feasible at this stage of the planning process. However, the RTA can consult with resource agencies to discuss potential impacts to natural resources and develop policies or strategies to ensure transportation projects have minimal impacts on the environment.
Federal Requirements 23 CFR 450.324 (f)(10) outlines requirements for Metropolitan Planning Organizations (MPOs) regarding environmental consultation. The RTA has opted to model the environmental review consultation process after this federal code, though it is not applicable to Regional Planning Affiliations. The overall purpose of this consultation process is to integrate environmental values into the decision-making process from the broad planning level to the specific project level. The federal code states, “The metropolitan transportation plan shall, at a minimum, include a discussion of types of potential environmental mitigation activities and potential areas to carry out these activities, including activities that may have the greatest potential to restore and maintain the environmental functions affected by the metropolitan transportation plan. The discussion may focus on policies, programs, or strategies, rather than at the project level. The MPO shall develop the discussion in consultation with applicable Federal, State, and Tribal land management, wildlife, and regulatory agencies…The MPO shall consult, as appropriate, with State and local agencies responsible for land use management, natural resources, environmental protection, conservation, and historic preservation concerning the development of the transportation plan. The consultation shall involve comparison of transportation plans with State conservation plans or maps, or inventories of natural or historic resources.”
When a federally funded transportation project reaches the engineering stage, compliance with several laws is required including the National Environmental Policy Act (NEPA) of 1969. NEPA is a national policy to protect and enhance the environment. The policy contains a process for developing major federal actions (such as federal funding for a transportation project) that requires environmental review documents as part of the project development. Complying with NEPA is typically the responsibility of the project sponsor. The NEPA process includes the consideration of alternatives for the project and their environmental effects, as well as public involvement and interagency collaboration.
Rolling Prairie Trail, Butler County
Taylor’s Ford Bridge, Buchanan County
2045 LONG-RANGE TRANSPORTATION PLAN | 168
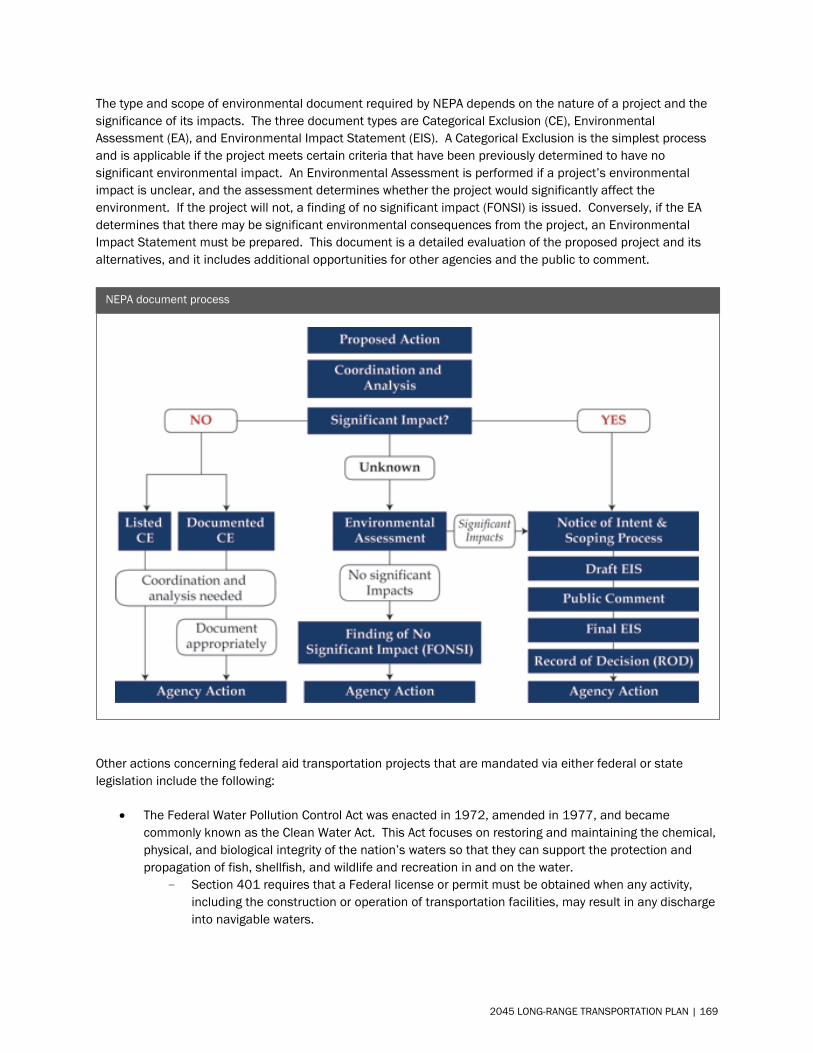
The type and scope of environmental document required by NEPA depends on the nature of a project and the significance of its impacts. The three document types are Categorical Exclusion (CE), Environmental Assessment (EA), and Environmental Impact Statement (EIS). A Categorical Exclusion is the simplest process and is applicable if the project meets certain criteria that have been previously determined to have no significant environmental impact. An Environmental Assessment is performed if a project’s environmental impact is unclear, and the assessment determines whether the project would significantly affect the environment. If the project will not, a finding of no significant impact (FONSI) is issued. Conversely, if the EA determines that there may be significant environmental consequences from the project, an Environmental Impact Statement must be prepared. This document is a detailed evaluation of the proposed project and its alternatives, and it includes additional opportunities for other agencies and the public to comment.
Other actions concerning federal aid transportation projects that are mandated via either federal or state legislation include the following:
• The Federal Water Pollution Control Act was enacted in 1972, amended in 1977, and becamecommonly known as the Clean Water Act. This Act focuses on restoring and maintaining the chemical,physical, and biological integrity of the nation’s waters so that they can support the protection andpropagation of fish, shellfish, and wildlife and recreation in and on the water.
Section 401 requires that a Federal license or permit must be obtained when any activity,including the construction or operation of transportation facilities, may result in any discharge into navigable waters.
NEPA document process
2045 LONG-RANGE TRANSPORTATION PLAN | 169

Section 404 permits may be issued after adequate opportunity for public comment for thedischarge of dredged or fill material into the navigable waters at specified disposal sites.
National Pollutant Discharge Elimination System (NPDES) permit program controls waterpollution by regulating point sources that discharge pollutants into any surface waters. Iowa is authorized to approve NPDES permits, regulate federal facilities, approve pretreatment programs, and approve general permits.
• The Endangered Species Act of 1973addressed the fact that variousspecies of fish, wildlife, and plantshave been rendered extinct because ofeconomic growth and developmentuntampered by adequate concern andconservation. This Act seeks toconserve endangered and threatenedspecies and to resolve water resourceissues in concert with the conservationof endangered species.
Section 7 addressesinteragency cooperation and consultation to ensure that any transportation project authorized, funded, or carried out is not likely to jeopardize the continued existence of any endangered species or threatened species or result in the destruction or adverse modification of habitat of such species.
The U.S. Department of Transportation Act of 1966 included a special provision to preservethe beauty and integrity of publicly owned parks and recreation areas, waterfowl and wildlife refuges, and historic sites considered to have national, state, or local significance.
Section 4(f) mandates that FHWA and State DOTs cannot approve the use of land from asignificant publicly owned park, recreation area, wildlife or waterfowl refuge, or any significant historic site unless there is no feasible and prudent alternative to the use of land, and the transportation project includes all possible planning to minimize harm to the property.
• The National Historic Preservation Act of 1966 focuses on using measures, including financial andtechnical assistance, to preserve our prehistoric and historic resources and fulfill the social, economic,and other requirements of present and future generations. Section 106 requires that prior to theapproval of any federal funds for a transportation project, a detailed assessment must be undertakenwhich considers the project’s impact on any district, site, building, structure, or object that is includedin or eligible for inclusion in the National register.
Iowa State Code and Administrative Code have several legislative mandates concerning the environment including the following:
• Sovereign Lands Construction Permit– requires that a person, association,or corporation shall not build or erectany pier, wharf, sluice, piling, wall,fence, obstruction, building, orstructure of any kind upon or over anystate-owned land or water without firstobtaining a written permit.
Lime Creek Bridge, Cedar Valley Nature Trail, Brandon
Iron Bridge Access, Wapsipinicon River Water Trail
2045 LONG-RANGE TRANSPORTATION PLAN | 170
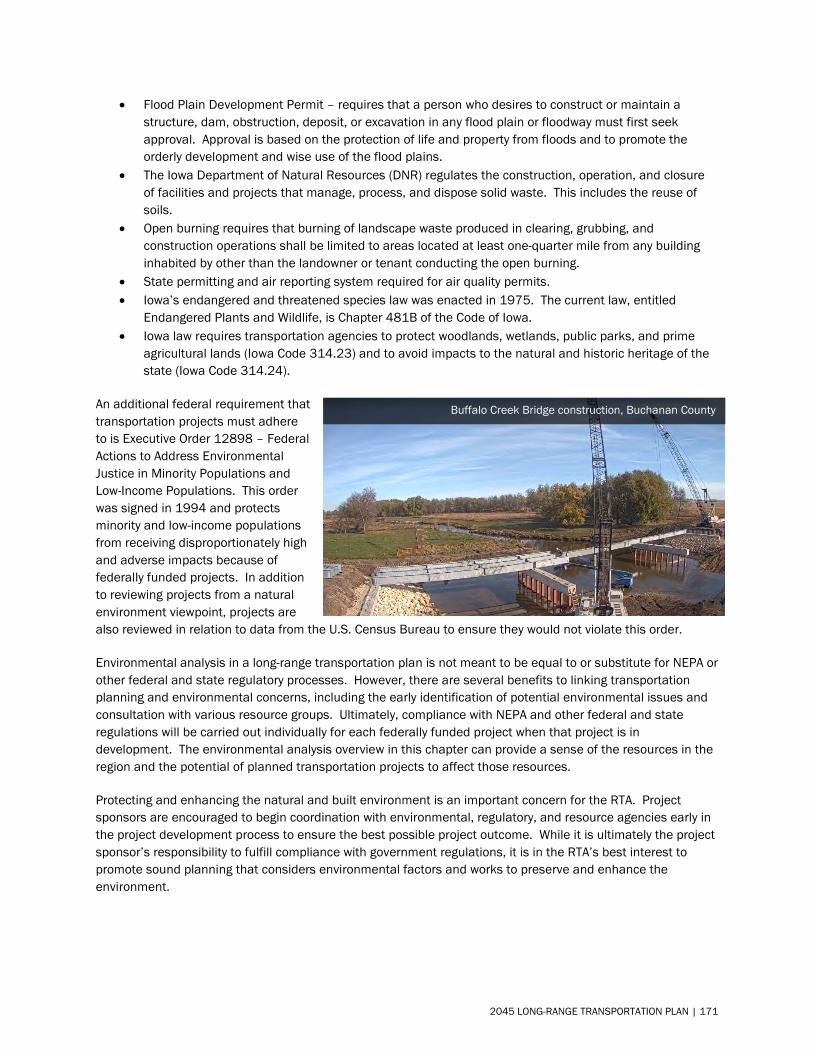
• Flood Plain Development Permit – requires that a person who desires to construct or maintain astructure, dam, obstruction, deposit, or excavation in any flood plain or floodway must first seekapproval. Approval is based on the protection of life and property from floods and to promote theorderly development and wise use of the flood plains.
• The Iowa Department of Natural Resources (DNR) regulates the construction, operation, and closureof facilities and projects that manage, process, and dispose solid waste. This includes the reuse ofsoils.
• Open burning requires that burning of landscape waste produced in clearing, grubbing, andconstruction operations shall be limited to areas located at least one-quarter mile from any buildinginhabited by other than the landowner or tenant conducting the open burning.
• State permitting and air reporting system required for air quality permits.• Iowa’s endangered and threatened species law was enacted in 1975. The current law, entitled
Endangered Plants and Wildlife, is Chapter 481B of the Code of Iowa.• Iowa law requires transportation agencies to protect woodlands, wetlands, public parks, and prime
agricultural lands (Iowa Code 314.23) and to avoid impacts to the natural and historic heritage of thestate (Iowa Code 314.24).
An additional federal requirement that transportation projects must adhere to is Executive Order 12898 – Federal Actions to Address Environmental Justice in Minority Populations and Low-Income Populations. This order was signed in 1994 and protects minority and low-income populations from receiving disproportionately high and adverse impacts because of federally funded projects. In addition to reviewing projects from a natural environment viewpoint, projects are also reviewed in relation to data from the U.S. Census Bureau to ensure they would not violate this order.
Environmental analysis in a long-range transportation plan is not meant to be equal to or substitute for NEPA or other federal and state regulatory processes. However, there are several benefits to linking transportation planning and environmental concerns, including the early identification of potential environmental issues and consultation with various resource groups. Ultimately, compliance with NEPA and other federal and state regulations will be carried out individually for each federally funded project when that project is in development. The environmental analysis overview in this chapter can provide a sense of the resources in the region and the potential of planned transportation projects to affect those resources.
Protecting and enhancing the natural and built environment is an important concern for the RTA. Project sponsors are encouraged to begin coordination with environmental, regulatory, and resource agencies early in the project development process to ensure the best possible project outcome. While it is ultimately the project sponsor’s responsibility to fulfill compliance with government regulations, it is in the RTA’s best interest to promote sound planning that considers environmental factors and works to preserve and enhance the environment.
Buffalo Creek Bridge construction, Buchanan County
2045 LONG-RANGE TRANSPORTATION PLAN | 171
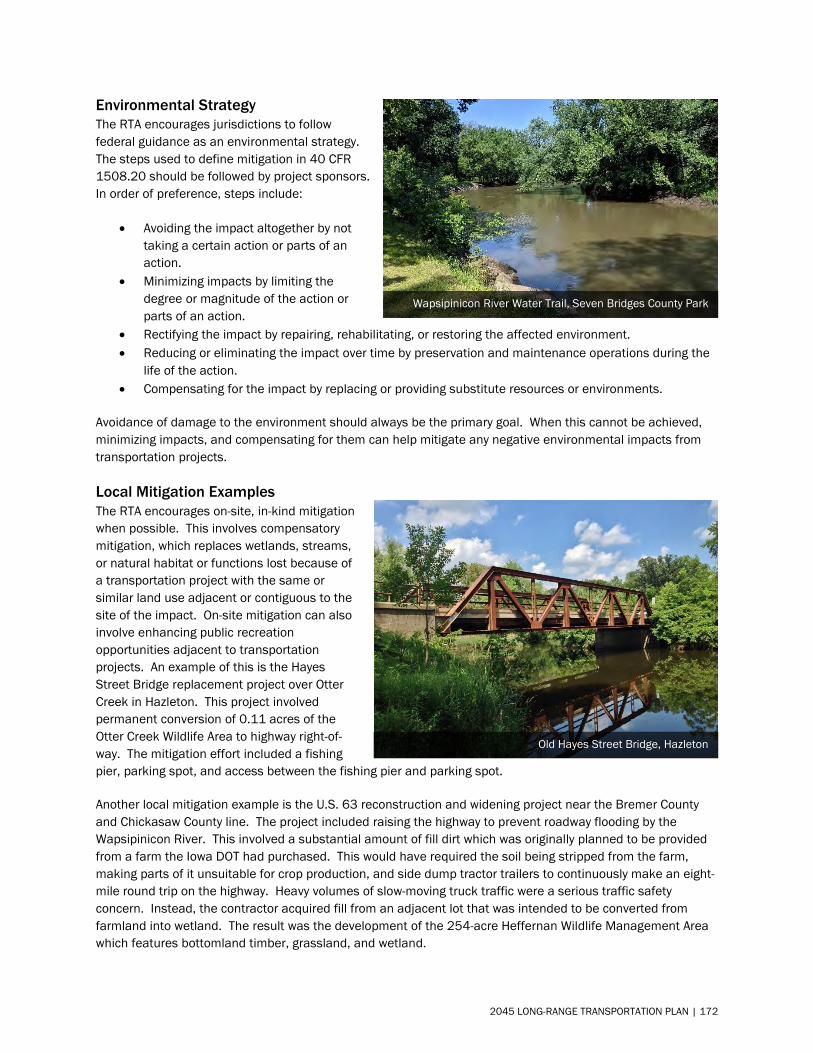
Environmental Strategy The RTA encourages jurisdictions to follow federal guidance as an environmental strategy. The steps used to define mitigation in 40 CFR 1508.20 should be followed by project sponsors. In order of preference, steps include:
• Avoiding the impact altogether by nottaking a certain action or parts of anaction.
• Minimizing impacts by limiting thedegree or magnitude of the action orparts of an action.
• Rectifying the impact by repairing, rehabilitating, or restoring the affected environment.• Reducing or eliminating the impact over time by preservation and maintenance operations during the
life of the action.• Compensating for the impact by replacing or providing substitute resources or environments.
Avoidance of damage to the environment should always be the primary goal. When this cannot be achieved, minimizing impacts, and compensating for them can help mitigate any negative environmental impacts from transportation projects.
Local Mitigation Examples The RTA encourages on-site, in-kind mitigation when possible. This involves compensatory mitigation, which replaces wetlands, streams, or natural habitat or functions lost because of a transportation project with the same or similar land use adjacent or contiguous to the site of the impact. On-site mitigation can also involve enhancing public recreation opportunities adjacent to transportation projects. An example of this is the Hayes Street Bridge replacement project over Otter Creek in Hazleton. This project involved permanent conversion of 0.11 acres of the Otter Creek Wildlife Area to highway right-of-way. The mitigation effort included a fishing pier, parking spot, and access between the fishing pier and parking spot.
Another local mitigation example is the U.S. 63 reconstruction and widening project near the Bremer County and Chickasaw County line. The project included raising the highway to prevent roadway flooding by the Wapsipinicon River. This involved a substantial amount of fill dirt which was originally planned to be provided from a farm the Iowa DOT had purchased. This would have required the soil being stripped from the farm, making parts of it unsuitable for crop production, and side dump tractor trailers to continuously make an eight-mile round trip on the highway. Heavy volumes of slow-moving truck traffic were a serious traffic safety concern. Instead, the contractor acquired fill from an adjacent lot that was intended to be converted from farmland into wetland. The result was the development of the 254-acre Heffernan Wildlife Management Area which features bottomland timber, grassland, and wetland.
Old Hayes Street Bridge, Hazleton
Wapsipinicon River Water Trail, Seven Bridges County Park
2045 LONG-RANGE TRANSPORTATION PLAN | 172
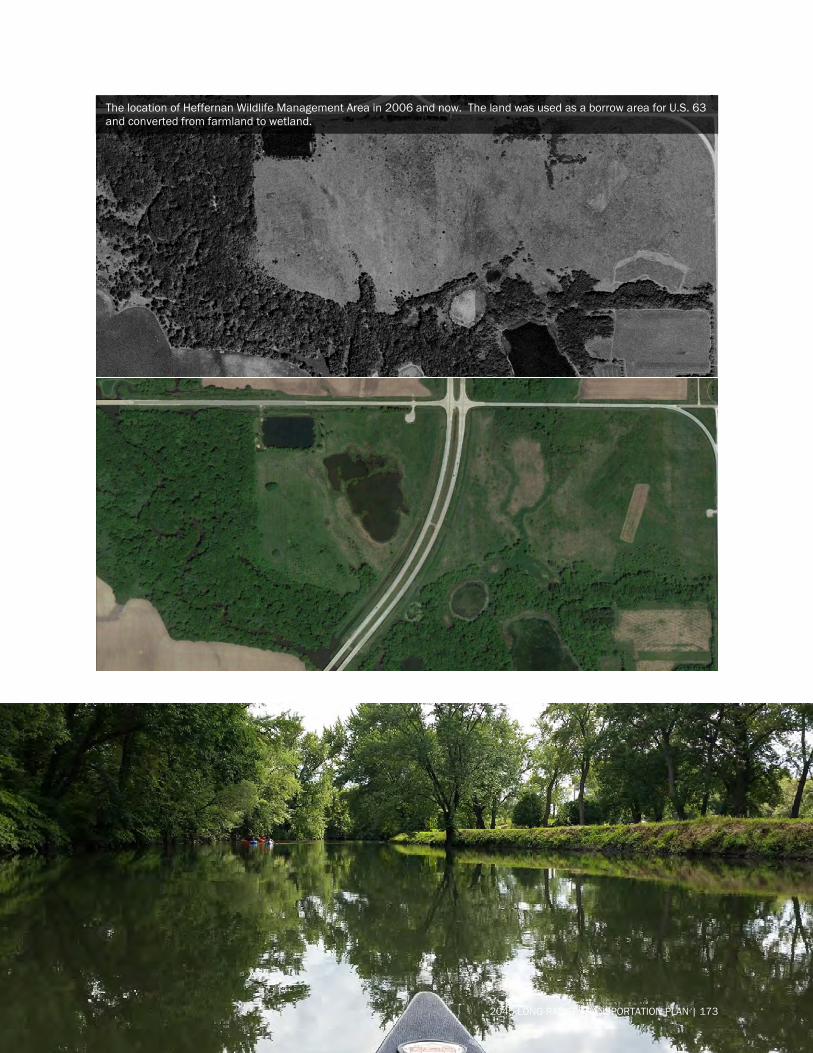
The location of Heffernan Wildlife Management Area in 2006 and now. The land was used as a borrow area for U.S. 63 and converted from farmland to wetland.
2045 LONG-RANGE TRANSPORTATION PLAN | 173
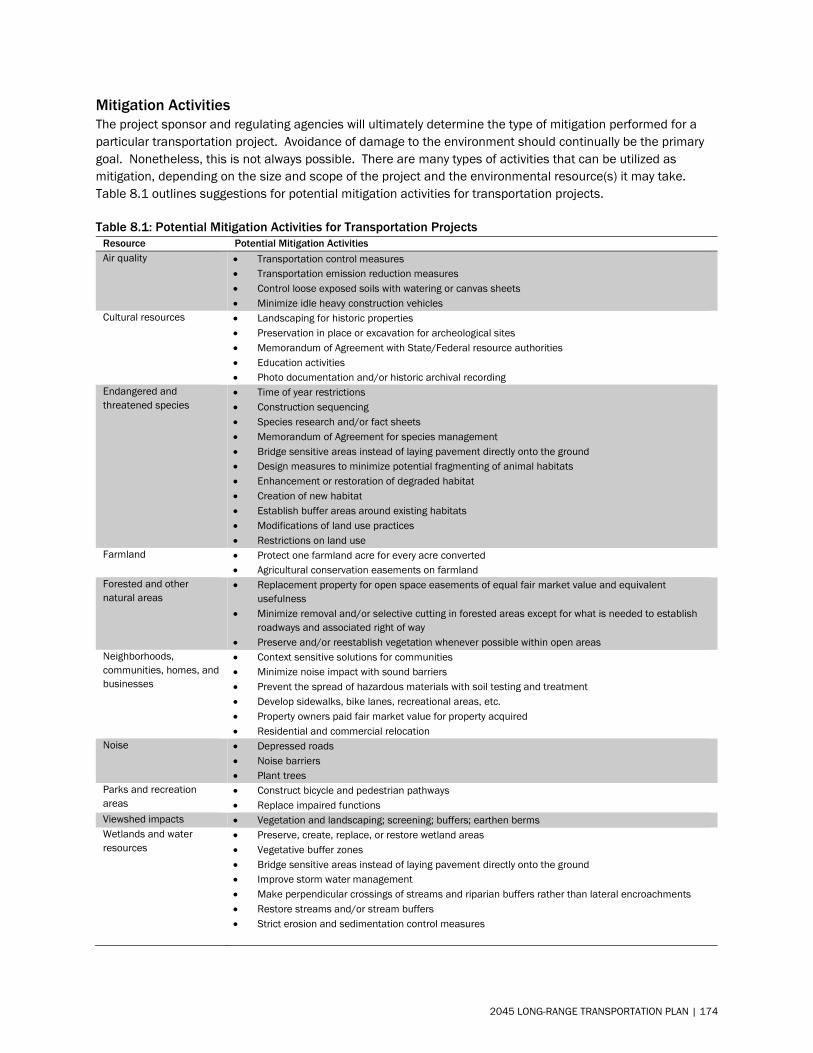
Mitigation Activities The project sponsor and regulating agencies will ultimately determine the type of mitigation performed for a particular transportation project. Avoidance of damage to the environment should continually be the primary goal. Nonetheless, this is not always possible. There are many types of activities that can be utilized as mitigation, depending on the size and scope of the project and the environmental resource(s) it may take. Table 8.1 outlines suggestions for potential mitigation activities for transportation projects.
Table 8.1: Potential Mitigation Activities for Transportation Projects Resource Potential Mitigation Activities Air quality • Transportation control measures
• Transportation emission reduction measures • Control loose exposed soils with watering or canvas sheets • Minimize idle heavy construction vehicles
Cultural resources • Landscaping for historic properties • Preservation in place or excavation for archeological sites • Memorandum of Agreement with State/Federal resource authorities • Education activities • Photo documentation and/or historic archival recording
Endangered and threatened species
• Time of year restrictions • Construction sequencing• Species research and/or fact sheets • Memorandum of Agreement for species management • Bridge sensitive areas instead of laying pavement directly onto the ground • Design measures to minimize potential fragmenting of animal habitats • Enhancement or restoration of degraded habitat • Creation of new habitat • Establish buffer areas around existing habitats • Modifications of land use practices • Restrictions on land use
Farmland • Protect one farmland acre for every acre converted • Agricultural conservation easements on farmland
Forested and other natural areas
• Replacement property for open space easements of equal fair market value and equivalentusefulness
• Minimize removal and/or selective cutting in forested areas except for what is needed to establishroadways and associated right of way
• Preserve and/or reestablish vegetation whenever possible within open areas Neighborhoods, communities, homes, and businesses
• Context sensitive solutions for communities • Minimize noise impact with sound barriers • Prevent the spread of hazardous materials with soil testing and treatment• Develop sidewalks, bike lanes, recreational areas, etc. • Property owners paid fair market value for property acquired • Residential and commercial relocation
Noise • Depressed roads • Noise barriers • Plant trees
Parks and recreation areas
• Construct bicycle and pedestrian pathways • Replace impaired functions
Viewshed impacts • Vegetation and landscaping; screening; buffers; earthen berms Wetlands and water resources
• Preserve, create, replace, or restore wetland areas • Vegetative buffer zones • Bridge sensitive areas instead of laying pavement directly onto the ground • Improve storm water management • Make perpendicular crossings of streams and riparian buffers rather than lateral encroachments • Restore streams and/or stream buffers • Strict erosion and sedimentation control measures
2045 LONG-RANGE TRANSPORTATION PLAN | 174
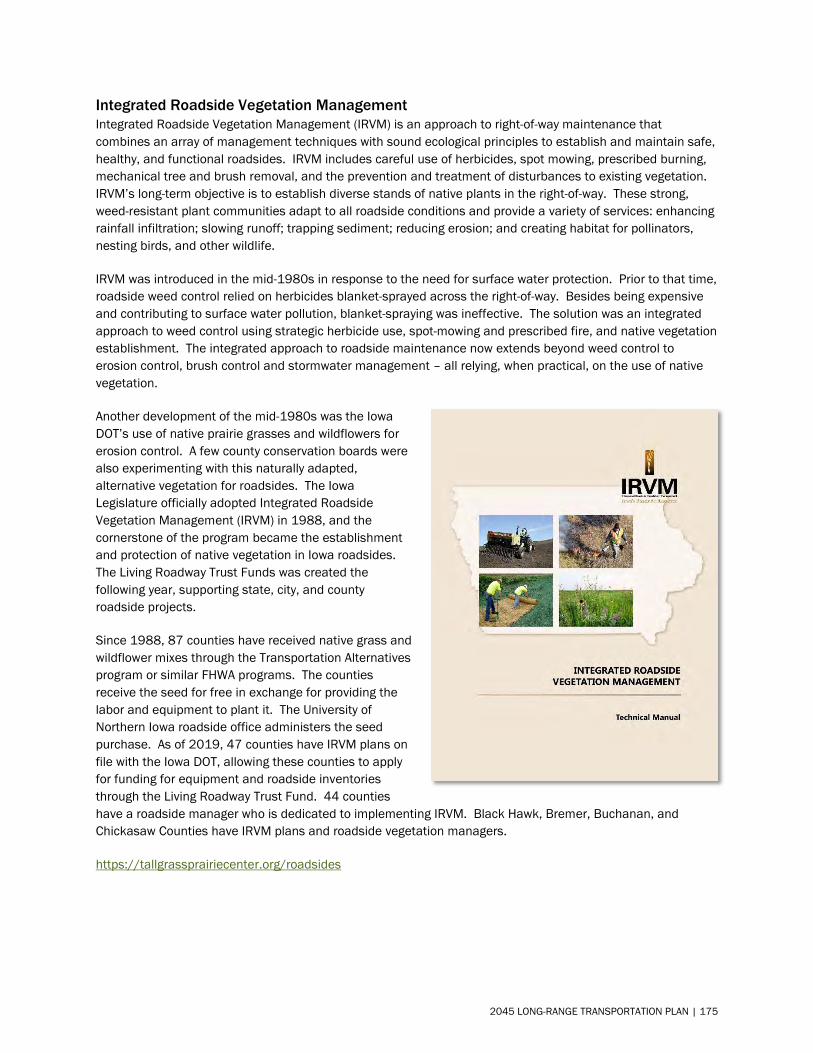
Integrated Roadside Vegetation Management Integrated Roadside Vegetation Management (IRVM) is an approach to right-of-way maintenance that combines an array of management techniques with sound ecological principles to establish and maintain safe, healthy, and functional roadsides. IRVM includes careful use of herbicides, spot mowing, prescribed burning, mechanical tree and brush removal, and the prevention and treatment of disturbances to existing vegetation. IRVM’s long-term objective is to establish diverse stands of native plants in the right-of-way. These strong, weed-resistant plant communities adapt to all roadside conditions and provide a variety of services: enhancing rainfall infiltration; slowing runoff; trapping sediment; reducing erosion; and creating habitat for pollinators, nesting birds, and other wildlife.
IRVM was introduced in the mid-1980s in response to the need for surface water protection. Prior to that time, roadside weed control relied on herbicides blanket-sprayed across the right-of-way. Besides being expensive and contributing to surface water pollution, blanket-spraying was ineffective. The solution was an integrated approach to weed control using strategic herbicide use, spot-mowing and prescribed fire, and native vegetation establishment. The integrated approach to roadside maintenance now extends beyond weed control to erosion control, brush control and stormwater management – all relying, when practical, on the use of native vegetation.
Another development of the mid-1980s was the Iowa DOT’s use of native prairie grasses and wildflowers for erosion control. A few county conservation boards were also experimenting with this naturally adapted, alternative vegetation for roadsides. The Iowa Legislature officially adopted Integrated Roadside Vegetation Management (IRVM) in 1988, and the cornerstone of the program became the establishment and protection of native vegetation in Iowa roadsides. The Living Roadway Trust Funds was created the following year, supporting state, city, and county roadside projects.
Since 1988, 87 counties have received native grass and wildflower mixes through the Transportation Alternatives program or similar FHWA programs. The counties receive the seed for free in exchange for providing the labor and equipment to plant it. The University of Northern Iowa roadside office administers the seed purchase. As of 2019, 47 counties have IRVM plans on file with the Iowa DOT, allowing these counties to apply for funding for equipment and roadside inventories through the Living Roadway Trust Fund. 44 counties have a roadside manager who is dedicated to implementing IRVM. Black Hawk, Bremer, Buchanan, and Chickasaw Counties have IRVM plans and roadside vegetation managers.
https://tallgrassprairiecenter.org/roadsides
2045 LONG-RANGE TRANSPORTATION PLAN | 175

Environmental Analysis A general environmental analysis was conducted to raise environmental awareness early in the project development process and to provide the public and decision makers with an overview of potential environmental impacts. To conduct this analysis, GIS software was used to create a database of environment-related layers. Online interactive maps have also been identified for jurisdictions to utilize as well. This is not an exhaustive list of resources but rather a starting point to review some of the most common environmental concerns. Some types of environmental data are generally available at the section level, and detailed information is not available without a more in-depth review.
Table 8.2: Environmental Analysis Layers Layer Data Source Major Water Sources Iowa Department of Natural Resources Watersheds Iowa Department of Natural Resources Impaired Waters Iowa Department of Natural Resources Floodplains Iowa Department of Natural Resources Wetlands Iowa Department of Natural Resources Historic Sites Iowa Office of the State Archaeologist Public Lands Local jurisdictions Cemeteries Iowa Department of Natural Resources Environmentally Sensitive Areas Iowa Department of Natural Resources Threatened and Endangered Species Iowa Department of Natural Resources
Since the transportation planning activities of the Iowa Northland Region are conducted at a regional level, this section does not provide a detailed analysis of individual projects within the Plan; rather, it is meant to create awareness of possible environmental impacts to consider early in the planning process. The NEPA process must be completed and other applicable federal and state regulations must be met for each project before any federal funds for transportation improvements are expended for construction.
The majority of road and bridge projects identified in this Plan are resurfacing or reconstruction projects and will likely occur within existing right-of-way with minimal environmental impacts. A project could end up requiring additional right-of-way than currently planned, or have a different alignment in final design, in which case other environmental impacts may be observed. Regardless, this environmental analysis provides a starting point for discussion of potential environmental effects of proposed transportation projects.
2045 LONG-RANGE TRANSPORTATION PLAN | 176
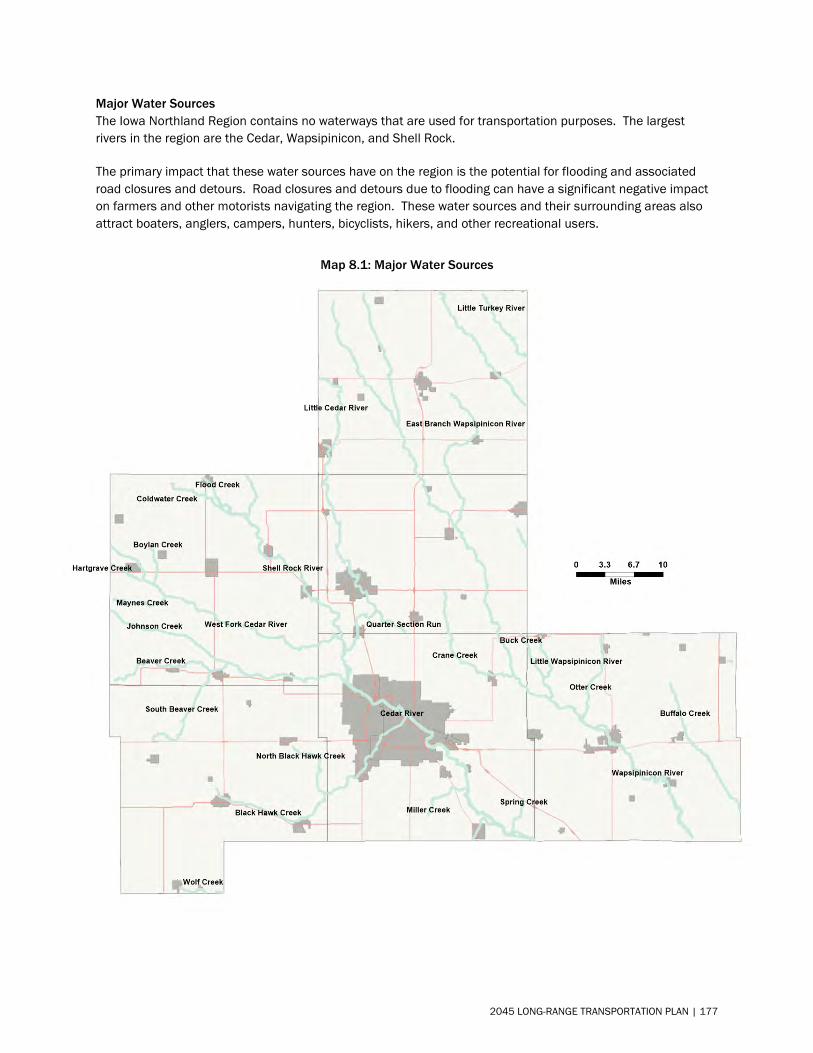
Major Water Sources The Iowa Northland Region contains no waterways that are used for transportation purposes. The largest rivers in the region are the Cedar, Wapsipinicon, and Shell Rock.
The primary impact that these water sources have on the region is the potential for flooding and associated road closures and detours. Road closures and detours due to flooding can have a significant negative impact on farmers and other motorists navigating the region. These water sources and their surrounding areas also attract boaters, anglers, campers, hunters, bicyclists, hikers, and other recreational users.
Map 8.1: Major Water Sources
2045 LONG-RANGE TRANSPORTATION PLAN | 177
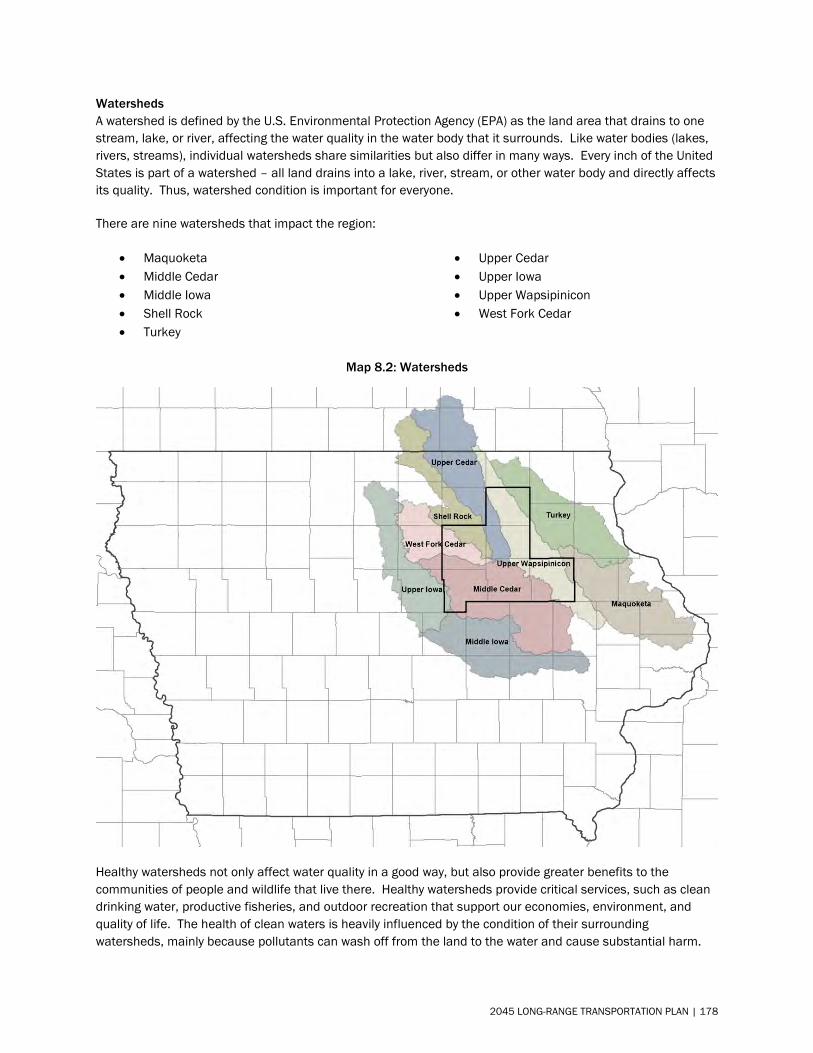
Watersheds A watershed is defined by the U.S. Environmental Protection Agency (EPA) as the land area that drains to one stream, lake, or river, affecting the water quality in the water body that it surrounds. Like water bodies (lakes, rivers, streams), individual watersheds share similarities but also differ in many ways. Every inch of the United States is part of a watershed – all land drains into a lake, river, stream, or other water body and directly affects its quality. Thus, watershed condition is important for everyone.
There are nine watersheds that impact the region:
• Maquoketa• Middle Cedar• Middle Iowa• Shell Rock• Turkey
• Upper Cedar• Upper Iowa• Upper Wapsipinicon• West Fork Cedar
Map 8.2: Watersheds
Healthy watersheds not only affect water quality in a good way, but also provide greater benefits to the communities of people and wildlife that live there. Healthy watersheds provide critical services, such as clean drinking water, productive fisheries, and outdoor recreation that support our economies, environment, and quality of life. The health of clean waters is heavily influenced by the condition of their surrounding watersheds, mainly because pollutants can wash off from the land to the water and cause substantial harm.
2045 LONG-RANGE TRANSPORTATION PLAN | 178
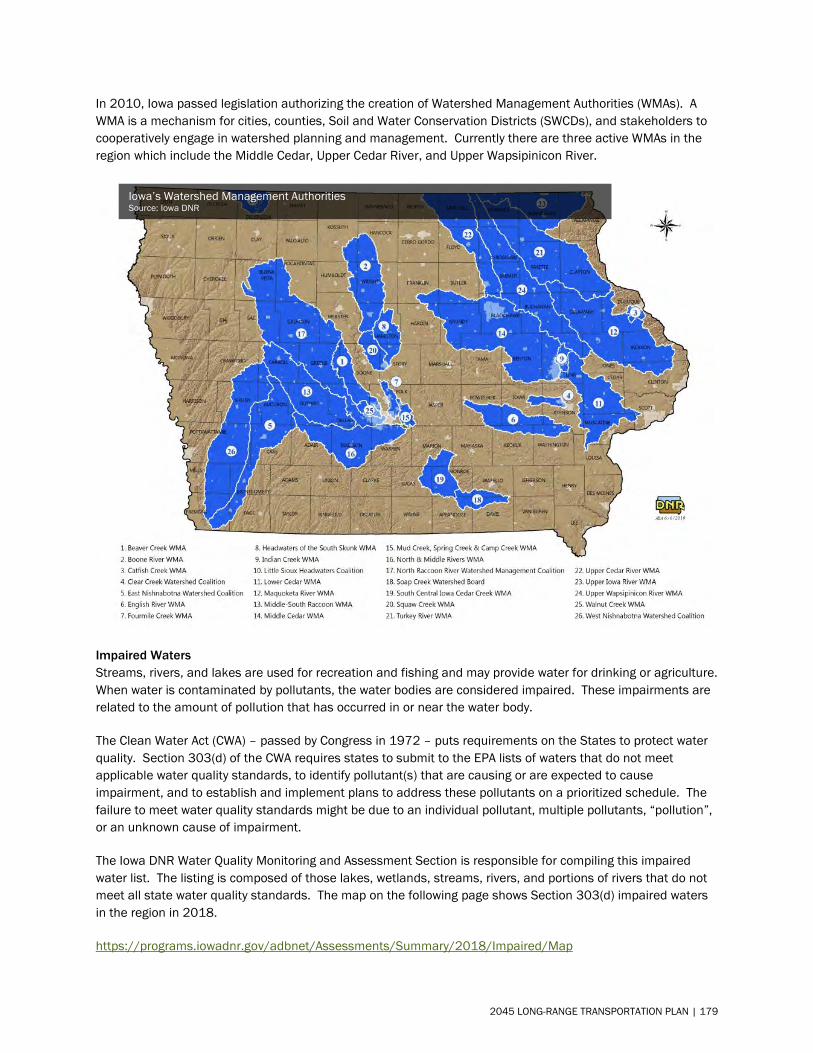
In 2010, Iowa passed legislation authorizing the creation of Watershed Management Authorities (WMAs). A WMA is a mechanism for cities, counties, Soil and Water Conservation Districts (SWCDs), and stakeholders to cooperatively engage in watershed planning and management. Currently there are three active WMAs in the region which include the Middle Cedar, Upper Cedar River, and Upper Wapsipinicon River.
Impaired Waters Streams, rivers, and lakes are used for recreation and fishing and may provide water for drinking or agriculture. When water is contaminated by pollutants, the water bodies are considered impaired. These impairments are related to the amount of pollution that has occurred in or near the water body.
The Clean Water Act (CWA) – passed by Congress in 1972 – puts requirements on the States to protect water quality. Section 303(d) of the CWA requires states to submit to the EPA lists of waters that do not meet applicable water quality standards, to identify pollutant(s) that are causing or are expected to cause impairment, and to establish and implement plans to address these pollutants on a prioritized schedule. The failure to meet water quality standards might be due to an individual pollutant, multiple pollutants, “pollution”, or an unknown cause of impairment.
The Iowa DNR Water Quality Monitoring and Assessment Section is responsible for compiling this impaired water list. The listing is composed of those lakes, wetlands, streams, rivers, and portions of rivers that do not meet all state water quality standards. The map on the following page shows Section 303(d) impaired waters in the region in 2018.
https://programs.iowadnr.gov/adbnet/Assessments/Summary/2018/Impaired/Map
Iowa’s Watershed Management Authorities Source: Iowa DNR
2045 LONG-RANGE TRANSPORTATION PLAN | 179
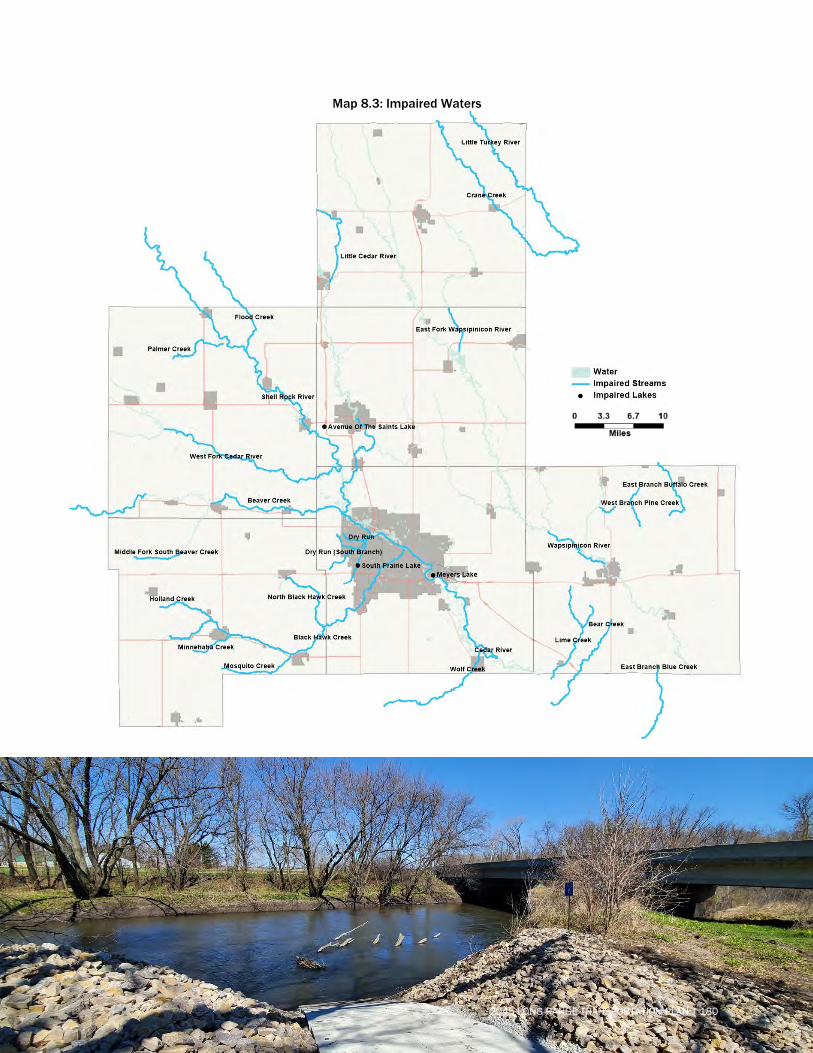
Map 8.3: Impaired Waters
2045 LONG-RANGE TRANSPORTATION PLAN | 180
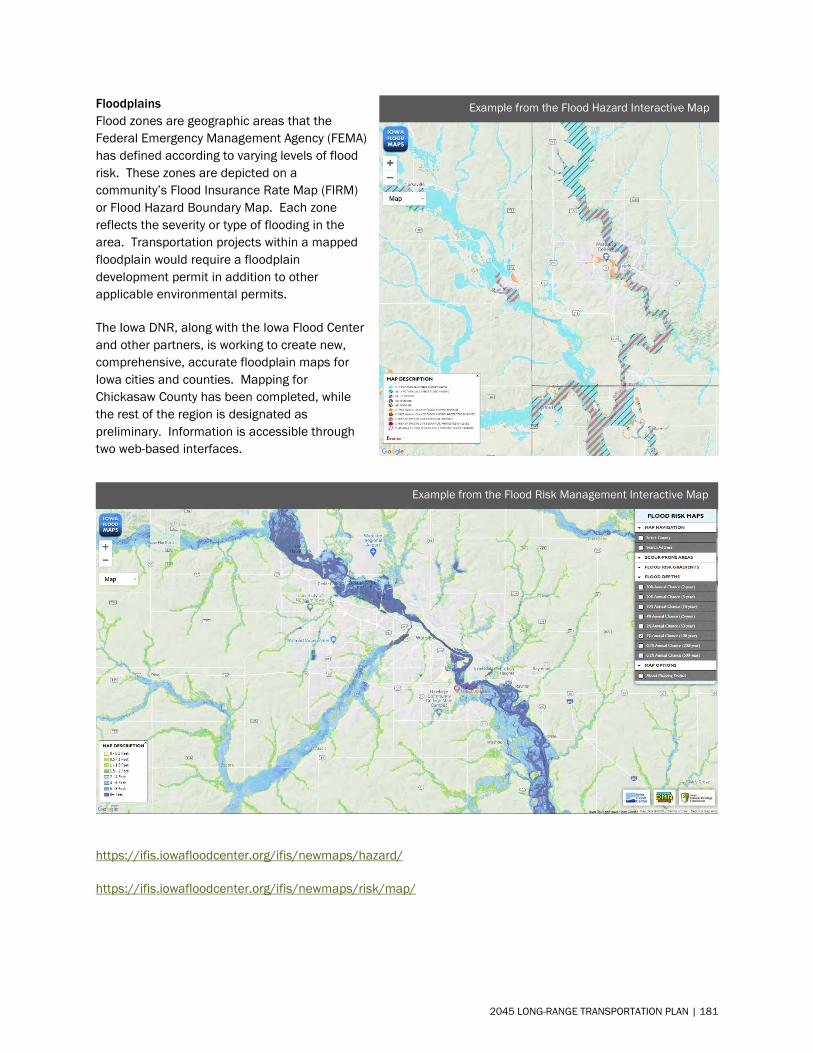
Floodplains Flood zones are geographic areas that the Federal Emergency Management Agency (FEMA) has defined according to varying levels of flood risk. These zones are depicted on a community’s Flood Insurance Rate Map (FIRM) or Flood Hazard Boundary Map. Each zone reflects the severity or type of flooding in the area. Transportation projects within a mapped floodplain would require a floodplain development permit in addition to other applicable environmental permits.
The Iowa DNR, along with the Iowa Flood Center and other partners, is working to create new, comprehensive, accurate floodplain maps for Iowa cities and counties. Mapping for Chickasaw County has been completed, while the rest of the region is designated as preliminary. Information is accessible through two web-based interfaces.
https://ifis.iowafloodcenter.org/ifis/newmaps/hazard/
https://ifis.iowafloodcenter.org/ifis/newmaps/risk/map/
Example from the Flood Hazard Interactive Map
Example from the Flood Risk Management Interactive Map
2045 LONG-RANGE TRANSPORTATION PLAN | 181
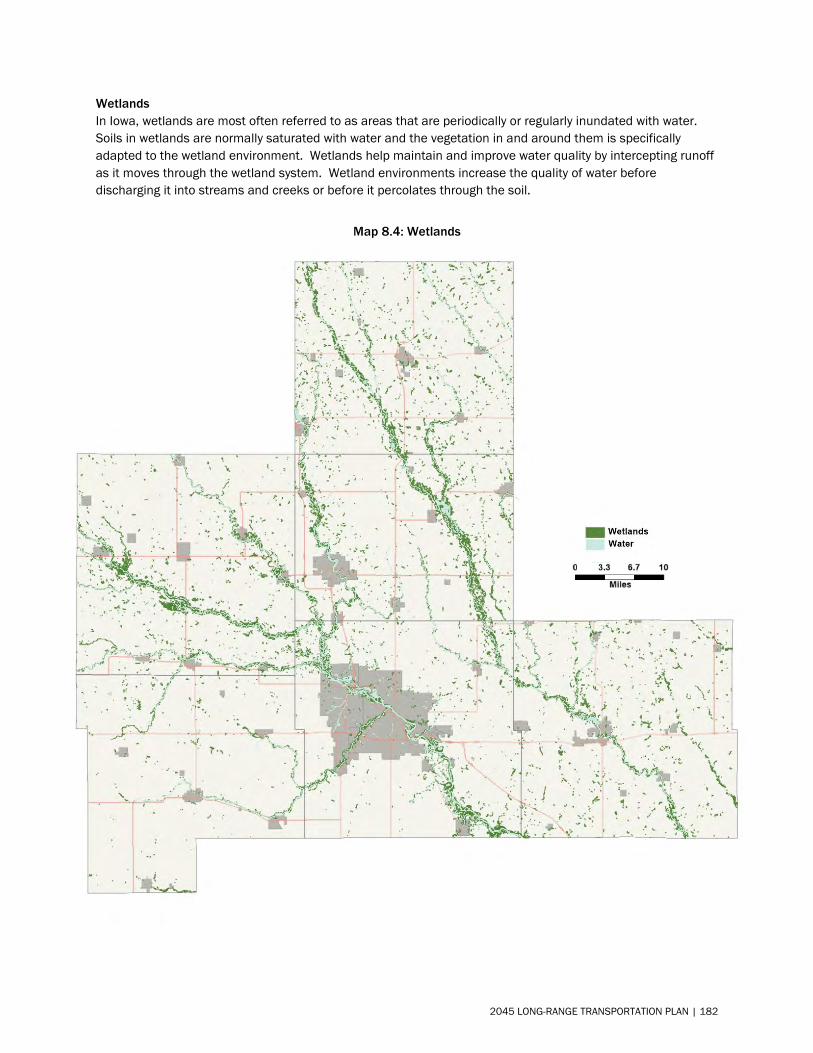
Wetlands In Iowa, wetlands are most often referred to as areas that are periodically or regularly inundated with water. Soils in wetlands are normally saturated with water and the vegetation in and around them is specifically adapted to the wetland environment. Wetlands help maintain and improve water quality by intercepting runoff as it moves through the wetland system. Wetland environments increase the quality of water before discharging it into streams and creeks or before it percolates through the soil.
Map 8.4: Wetlands
2045 LONG-RANGE TRANSPORTATION PLAN | 182
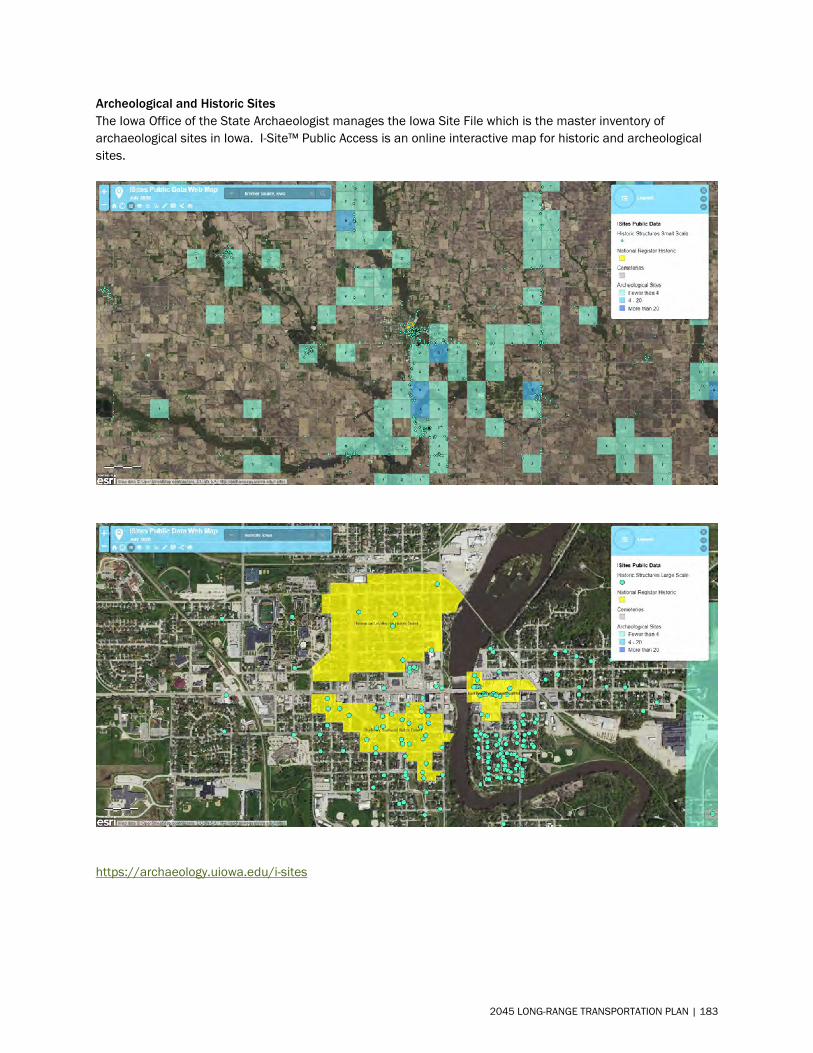
Archeological and Historic Sites The Iowa Office of the State Archaeologist manages the Iowa Site File which is the master inventory of archaeological sites in Iowa. I-Site™ Public Access is an online interactive map for historic and archeological sites.
https://archaeology.uiowa.edu/i-sites
2045 LONG-RANGE TRANSPORTATION PLAN | 183
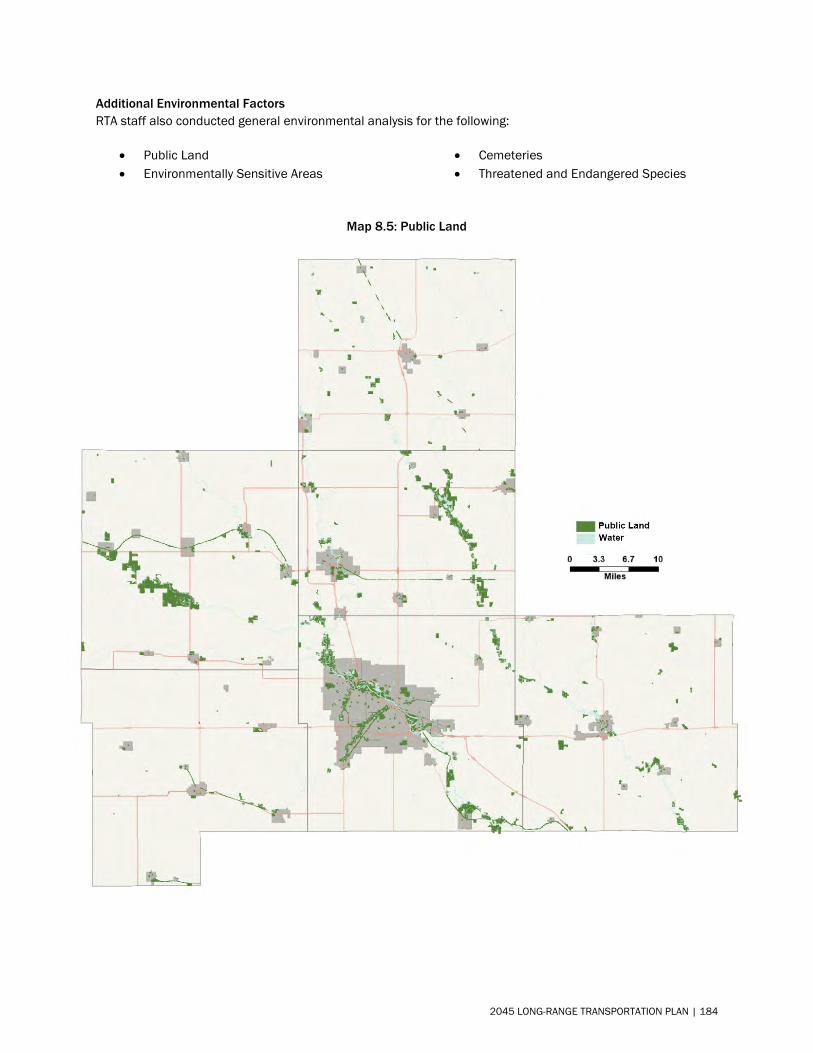
Additional Environmental Factors RTA staff also conducted general environmental analysis for the following:
• Public Land• Environmentally Sensitive Areas
• Cemeteries• Threatened and Endangered Species
Map 8.5: Public Land
2045 LONG-RANGE TRANSPORTATION PLAN | 184
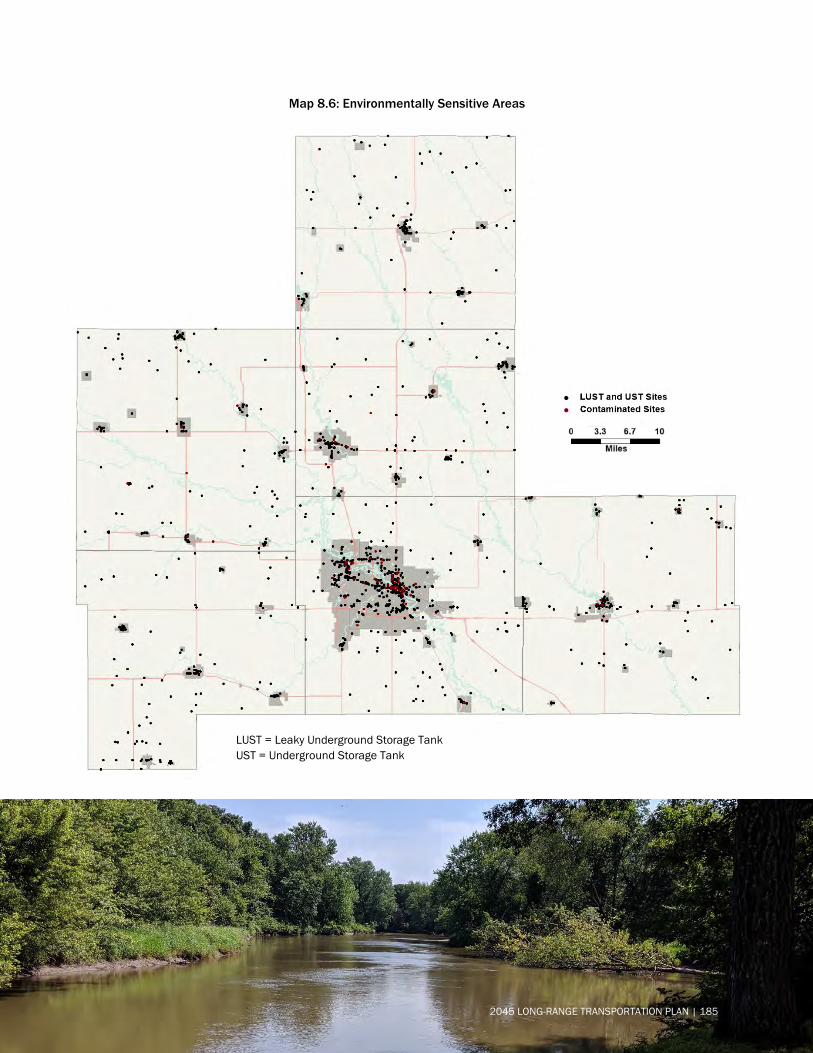
Map 8.6: Environmentally Sensitive Areas
LUST = Leaky Underground Storage Tank UST = Underground Storage Tank
2045 LONG-RANGE TRANSPORTATION PLAN | 185
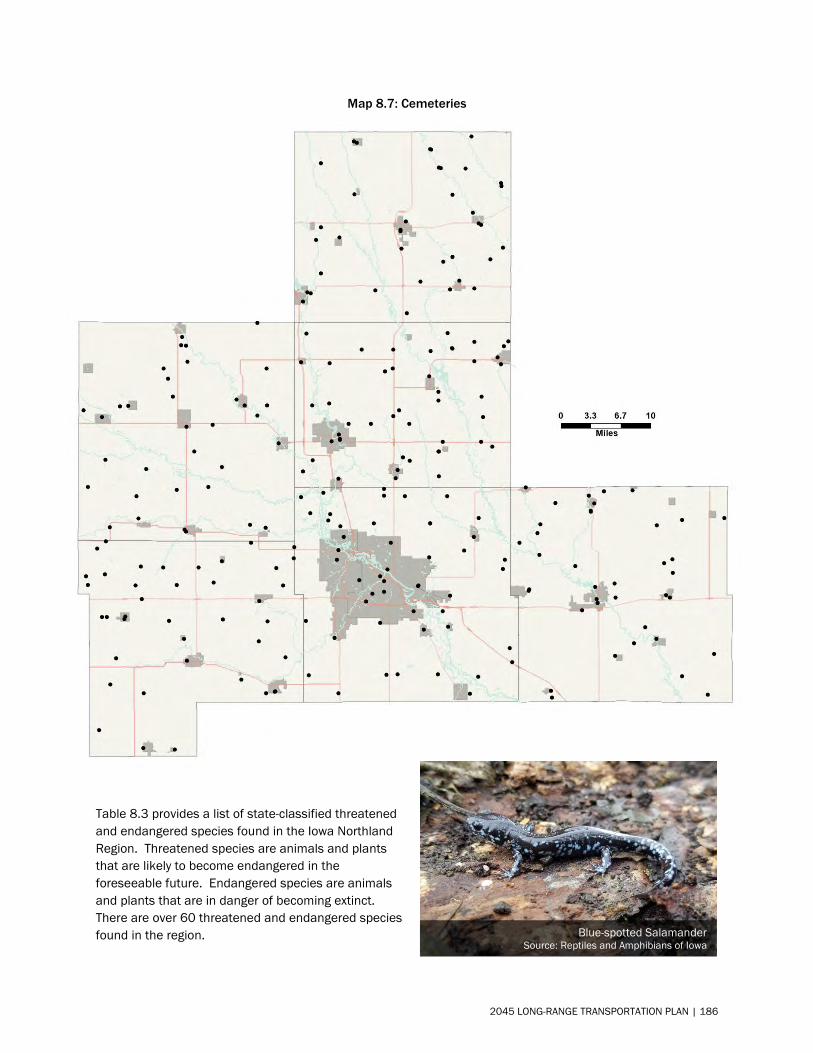
Map 8.7: Cemeteries
Table 8.3 provides a list of state-classified threatened and endangered species found in the Iowa Northland Region. Threatened species are animals and plants that are likely to become endangered in the foreseeable future. Endangered species are animals and plants that are in danger of becoming extinct. There are over 60 threatened and endangered species found in the region. Blue-spotted Salamander
Source: Reptiles and Amphibians of Iowa
2045 LONG-RANGE TRANSPORTATION PLAN | 186
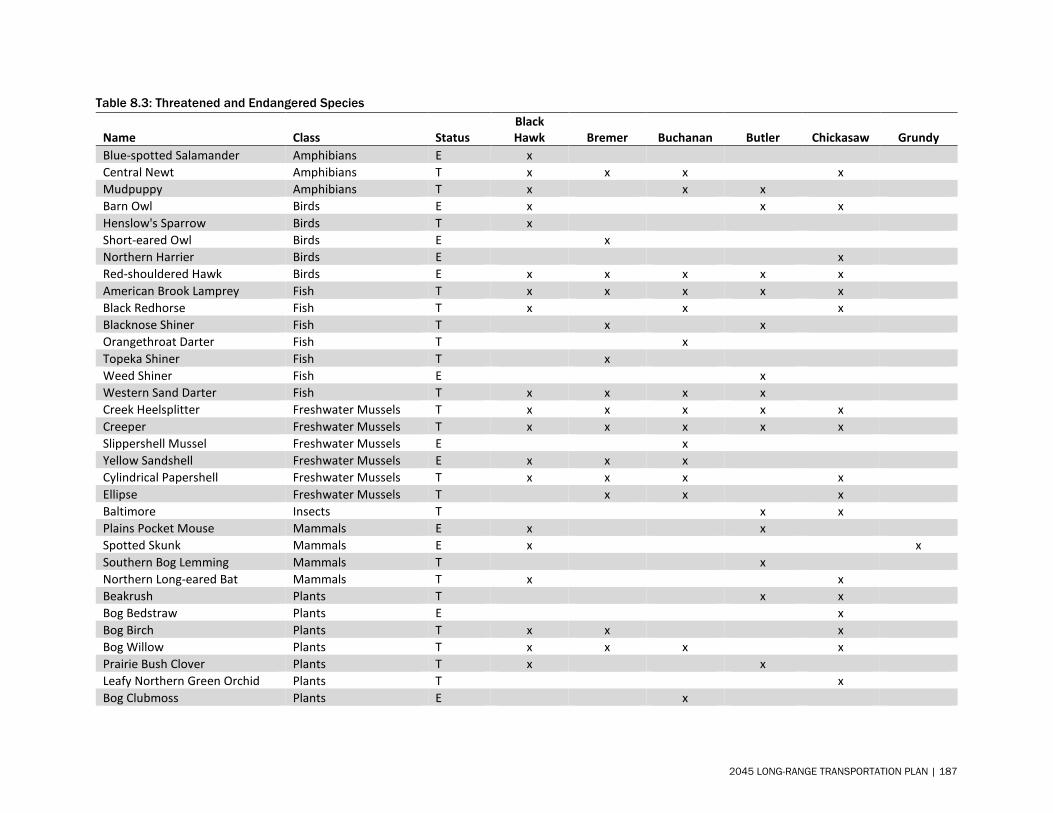
Table 8.3: Threatened and Endangered Species
Name Class Status Black Hawk Bremer Buchanan Butler Chickasaw Grundy
Blue-spotted Salamander Amphibians E x Central Newt Amphibians T x x x x Mudpuppy Amphibians T x x x Barn Owl Birds E x x x Henslow's Sparrow Birds T x Short-eared Owl Birds E x Northern Harrier Birds E x Red-shouldered Hawk Birds E x x x x x American Brook Lamprey Fish T x x x x x Black Redhorse Fish T x x x Blacknose Shiner Fish T x x Orangethroat Darter Fish T x Topeka Shiner Fish T x Weed Shiner Fish E x Western Sand Darter Fish T x x x x Creek Heelsplitter Freshwater Mussels T x x x x x Creeper Freshwater Mussels T x x x x x Slippershell Mussel Freshwater Mussels E x Yellow Sandshell Freshwater Mussels E x x x Cylindrical Papershell Freshwater Mussels T x x x x Ellipse Freshwater Mussels T x x x Baltimore Insects T x x Plains Pocket Mouse Mammals E x x Spotted Skunk Mammals E x x Southern Bog Lemming Mammals T x Northern Long-eared Bat Mammals T x x Beakrush Plants T x x Bog Bedstraw Plants E x Bog Birch Plants T x x x Bog Willow Plants T x x x x Prairie Bush Clover Plants T x x Leafy Northern Green Orchid Plants T x Bog Clubmoss Plants E x
2045 LONG-RANGE TRANSPORTATION PLAN | 187
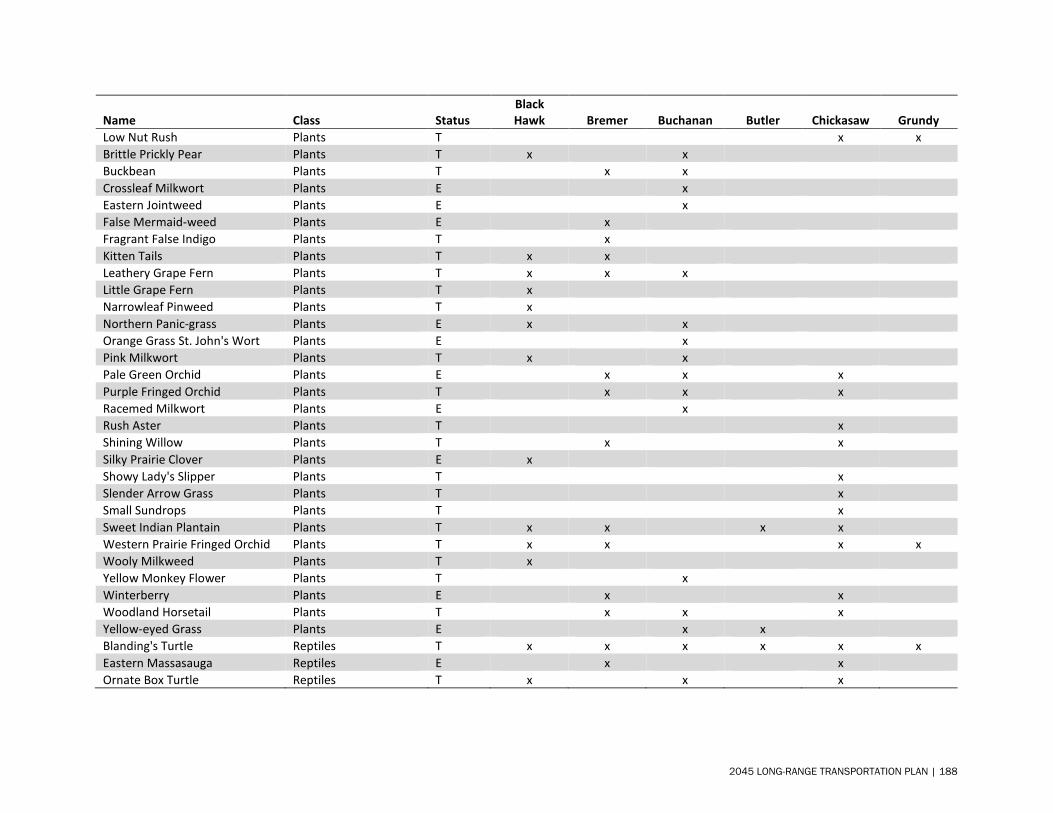
Name Class Status Black Hawk Bremer Buchanan Butler Chickasaw Grundy
Low Nut Rush Plants T x x Brittle Prickly Pear Plants T x x Buckbean Plants T x x Crossleaf Milkwort Plants E x Eastern Jointweed Plants E x False Mermaid-weed Plants E x Fragrant False Indigo Plants T x Kitten Tails Plants T x x Leathery Grape Fern Plants T x x x Little Grape Fern Plants T x Narrowleaf Pinweed Plants T x Northern Panic-grass Plants E x x Orange Grass St. John's Wort Plants E x Pink Milkwort Plants T x x Pale Green Orchid Plants E x x x Purple Fringed Orchid Plants T x x x Racemed Milkwort Plants E x Rush Aster Plants T x Shining Willow Plants T x x Silky Prairie Clover Plants E x Showy Lady's Slipper Plants T x Slender Arrow Grass Plants T x Small Sundrops Plants T x Sweet Indian Plantain Plants T x x x x Western Prairie Fringed Orchid Plants T x x x x Wooly Milkweed Plants T x Yellow Monkey Flower Plants T x Winterberry Plants E x x Woodland Horsetail Plants T x x x Yellow-eyed Grass Plants E x x Blanding's Turtle Reptiles T x x x x x x Eastern Massasauga Reptiles E x x Ornate Box Turtle Reptiles T x x x
2045 LONG-RANGE TRANSPORTATION PLAN | 188
Consultation Several Federal, State, Tribal, and local government agencies were notified when the draft LRTP document was available for review and comment. Feedback on topics relevant to their field of expertise was requested. Agencies notified include the following:
• Black Hawk County Conservation• Bremer County Conservation• Buchanan County Conservation• Butler County Conservation• Chickasaw County Conservation• Grundy County Conservation• Black Hawk County Emergency
Management• Bremer County Emergency Management• Buchanan County Emergency
Management• Butler County Emergency Management• Chickasaw County Emergency
Management• Grundy County Emergency Management• Black Hawk County REAP Committee• Grow Cedar Valley• Hawkeye Community College• Iowa Department of Agriculture and Land
Stewardship• Iowa Department on Aging• Iowa Department for the Blind• Iowa Department of Cultural Affairs• Iowa Department of Education• Iowa Department of Human Rights• Iowa Department of Human Services• Iowa Department of Natural Resources• Iowa Department of Public Health• Iowa Department of Public Safety
• Iowa Department of Transportation,Systems Planning Bureau
• Iowa Department of Transportation,District 2
• Iowa Department of Veterans’ Affairs• Iowa Economic Development Authority• Iowa Homeland Security and Emergency
Management• Iowa Northland Regional Transit
Commission• Iowa Tourism Board• Iowa Utilities Board• Iowa Workforce Development• Office of the State Archaeologist• Sac & Fox Tribe of the Mississippi• State Historical Society of Iowa• Transit Advisory Committee• University of Northern Iowa• U.S. Army Corps of Engineers, Rock Island
District• U.S. Environmental Protection Agency,
Region 7• U.S. Department of Agriculture – Natural
Resources Conservation Service• U.S. Department of the Interior Bureau of
Indian Affairs, Midwest Regional Office• U.S. Fish and Wildlife Service, Illinois-Iowa
Field Office
University of Minnesota College of Veterinary Medicine, The Raptor Center 2045 LONG-RANGE TRANSPORTATION PLAN | 189
Chapter 9
Financial Analysis
2045 LONG-RANGE TRANSPORTATION PLAN | 190
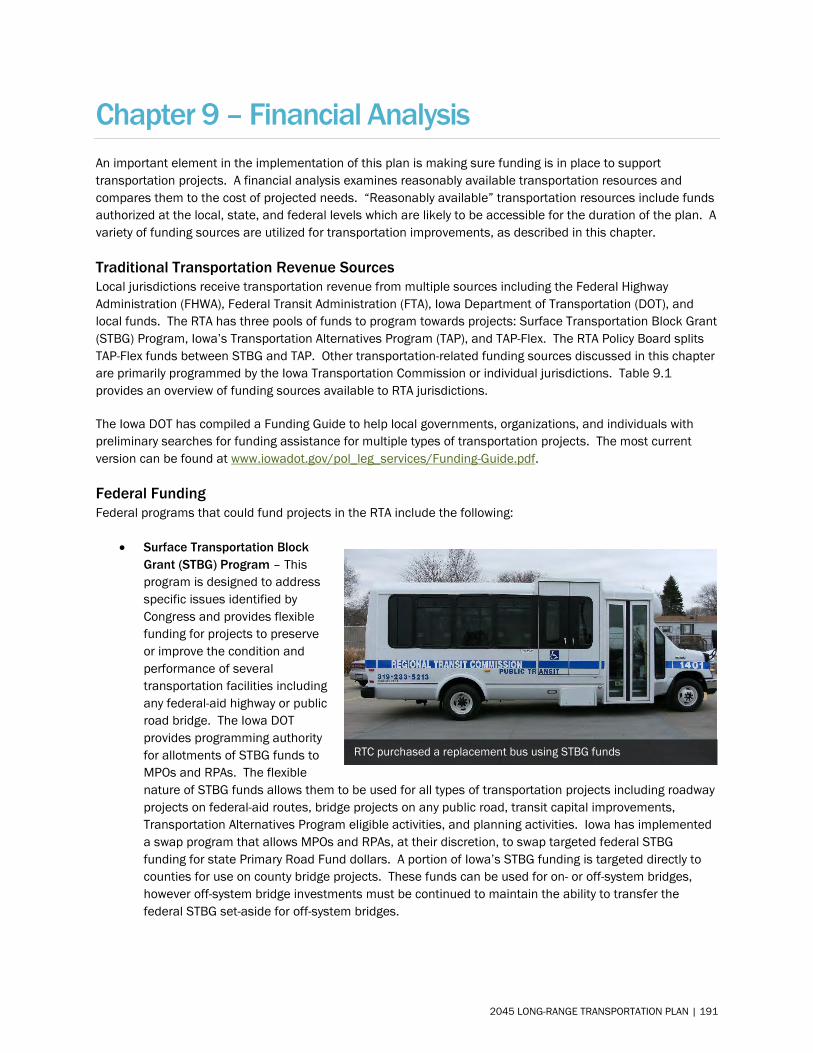
Chapter 9 – Financial Analysis An important element in the implementation of this plan is making sure funding is in place to support transportation projects. A financial analysis examines reasonably available transportation resources and compares them to the cost of projected needs. “Reasonably available” transportation resources include funds authorized at the local, state, and federal levels which are likely to be accessible for the duration of the plan. A variety of funding sources are utilized for transportation improvements, as described in this chapter.
Traditional Transportation Revenue Sources Local jurisdictions receive transportation revenue from multiple sources including the Federal Highway Administration (FHWA), Federal Transit Administration (FTA), Iowa Department of Transportation (DOT), and local funds. The RTA has three pools of funds to program towards projects: Surface Transportation Block Grant (STBG) Program, Iowa’s Transportation Alternatives Program (TAP), and TAP-Flex. The RTA Policy Board splits TAP-Flex funds between STBG and TAP. Other transportation-related funding sources discussed in this chapter are primarily programmed by the Iowa Transportation Commission or individual jurisdictions. Table 9.1 provides an overview of funding sources available to RTA jurisdictions.
The Iowa DOT has compiled a Funding Guide to help local governments, organizations, and individuals with preliminary searches for funding assistance for multiple types of transportation projects. The most current version can be found at www.iowadot.gov/pol_leg_services/Funding-Guide.pdf.
Federal Funding Federal programs that could fund projects in the RTA include the following:
• Surface Transportation BlockGrant (STBG) Program – Thisprogram is designed to addressspecific issues identified byCongress and provides flexiblefunding for projects to preserveor improve the condition andperformance of severaltransportation facilities includingany federal-aid highway or publicroad bridge. The Iowa DOTprovides programming authorityfor allotments of STBG funds to MPOs and RPAs. The flexiblenature of STBG funds allows them to be used for all types of transportation projects including roadwayprojects on federal-aid routes, bridge projects on any public road, transit capital improvements,Transportation Alternatives Program eligible activities, and planning activities. Iowa has implementeda swap program that allows MPOs and RPAs, at their discretion, to swap targeted federal STBGfunding for state Primary Road Fund dollars. A portion of Iowa’s STBG funding is targeted directly tocounties for use on county bridge projects. These funds can be used for on- or off-system bridges,however off-system bridge investments must be continued to maintain the ability to transfer thefederal STBG set-aside for off-system bridges.
RTC purchased a replacement bus using STBG funds
2045 LONG-RANGE TRANSPORTATION PLAN | 191
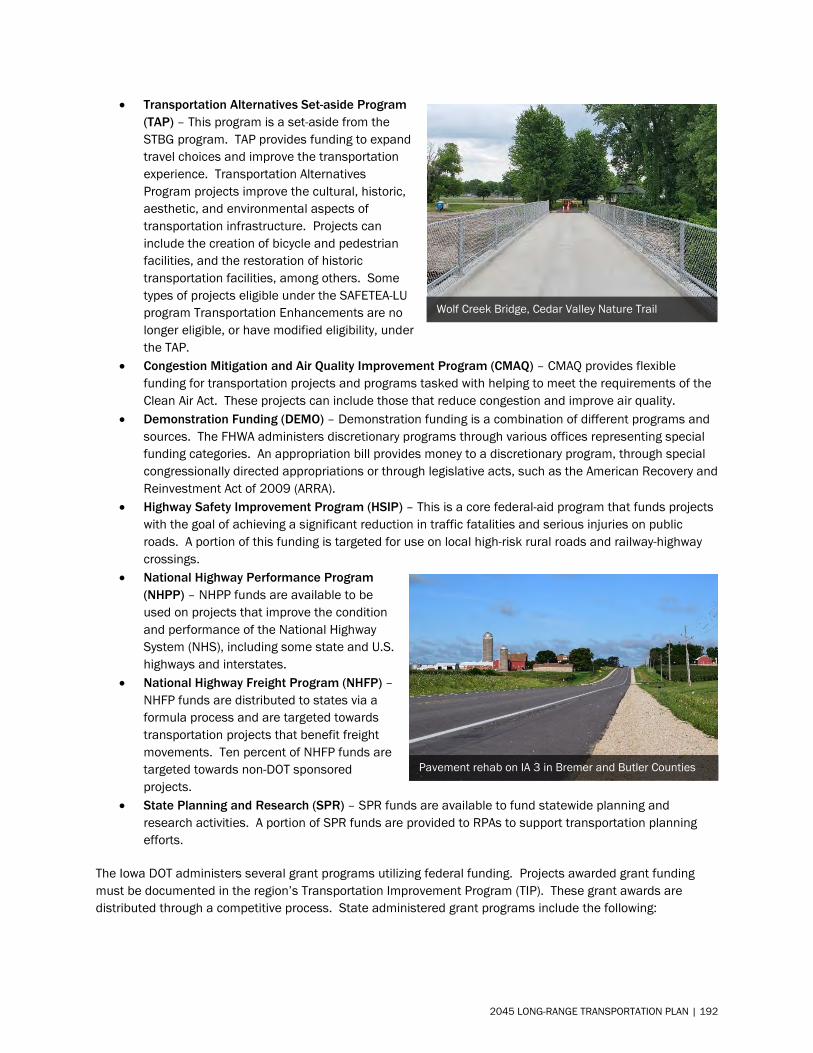
• Transportation Alternatives Set-aside Program(TAP) – This program is a set-aside from theSTBG program. TAP provides funding to expandtravel choices and improve the transportationexperience. Transportation AlternativesProgram projects improve the cultural, historic,aesthetic, and environmental aspects oftransportation infrastructure. Projects caninclude the creation of bicycle and pedestrianfacilities, and the restoration of historictransportation facilities, among others. Sometypes of projects eligible under the SAFETEA-LUprogram Transportation Enhancements are nolonger eligible, or have modified eligibility, underthe TAP.
• Congestion Mitigation and Air Quality Improvement Program (CMAQ) – CMAQ provides flexiblefunding for transportation projects and programs tasked with helping to meet the requirements of theClean Air Act. These projects can include those that reduce congestion and improve air quality.
• Demonstration Funding (DEMO) – Demonstration funding is a combination of different programs andsources. The FHWA administers discretionary programs through various offices representing specialfunding categories. An appropriation bill provides money to a discretionary program, through specialcongressionally directed appropriations or through legislative acts, such as the American Recovery andReinvestment Act of 2009 (ARRA).
• Highway Safety Improvement Program (HSIP) – This is a core federal-aid program that funds projectswith the goal of achieving a significant reduction in traffic fatalities and serious injuries on publicroads. A portion of this funding is targeted for use on local high-risk rural roads and railway-highwaycrossings.
• National Highway Performance Program(NHPP) – NHPP funds are available to beused on projects that improve the conditionand performance of the National HighwaySystem (NHS), including some state and U.S.highways and interstates.
• National Highway Freight Program (NHFP) –NHFP funds are distributed to states via aformula process and are targeted towardstransportation projects that benefit freightmovements. Ten percent of NHFP funds aretargeted towards non-DOT sponsoredprojects.
• State Planning and Research (SPR) – SPR funds are available to fund statewide planning andresearch activities. A portion of SPR funds are provided to RPAs to support transportation planningefforts.
The Iowa DOT administers several grant programs utilizing federal funding. Projects awarded grant funding must be documented in the region’s Transportation Improvement Program (TIP). These grant awards are distributed through a competitive process. State administered grant programs include the following:
Wolf Creek Bridge, Cedar Valley Nature Trail
Pavement rehab on IA 3 in Bremer and Butler Counties
2045 LONG-RANGE TRANSPORTATION PLAN | 192
• City Bridge Program – A portion of STBG funding dedicated to local bridge projects is set aside for thefunding of bridge projects within cities. STBG funding is swapped for Primary Road Fund dollars.Eligible projects need to be classified as structurally deficient or functionally obsolete. Projects arerated and prioritized by the Iowa DOT Local Systems Bureau with awards based upon criteria identifiedin the application process. Projects can receive up to $1 million.
• Highway Safety Improvement Program – Secondary (HSIP-Secondary) – This program is funded usinga portion of Iowa’s HSIP apportionment and funds safety projects on rural roadways. Federal HSIPfunding targeted towards these local projects is swapped for Primary Road Fund dollars.
• Iowa Clean Air Attainment Program (ICAAP) – ICAAP funds projects that maximize emissionreductions through traffic flow improvements, reduced vehicle-miles of travel, and reduced single-occupancy vehicle trips. This program uses $4 million of Iowa’s CMAQ apportionment. Fundingtargeted towards local road or bridge construction projects is eligible to be swapped.
• Federal Recreational Trails Program – This program provides federal funding for both motorized andnon-motorized trail projects and is funded through a takedown from Iowa’s TAP funding. The decisionto participate in this program is made annually by the Iowa Transportation Commission.
• Iowa’s Transportation Alternatives Program – This program targets STBG funding to MPOs and RPAsto award to locally sponsored projects that expand travel choices and improve the motorized and non-motorized transportation experience.
There are also several federal transit programs that provide funding. The largest amount of funding is distributed, by formula, to state and large metropolitan areas. Other program funds are discretionary, and some are earmarked for specific projects. Program funds include the following:
• Metropolitan Transportation Planning Program (5303 and 5305) – FTA provides funding for thisprogram to the state based on its urbanized area populations. The funds are dedicated to supporttransportation planning projects in urbanized areas with more than 50,000 persons.
• Statewide Transportation Planning Program (Section 5304 and 5305) – These funds come to thestate based on population and are used to support transportation planning projects in non-urbanizedareas. They are combined with Section 5311 funds and allocated among Iowa’s RPAs.
• Urbanized Area Formula Grants Program (Section 5307) – FTA provides transit operating, planning,and capital assistance funds directly to local recipients in urbanized areas with populations between50,000 and 200,000. Assistance amounts are based on population and density figures and transitperformance factors for larger areas.
• Bus and Bus Facilities Program (Section 5339) – This formula program provides federal assistancefor major capital needs, such as fleet replacement and construction of transit facilities. All transitsystems in the state are eligible for his program.
• Enhanced Mobility of Seniors and Individuals with Disabilities Program (Section 5310) – Funding isprovided through this program to increase mobility for the elderly and persons with disabilities. Part ofthe funding is administered along with the non-urbanized funding with the remaining funds allocatedamong urbanized transit systems in areas with a population of less than 200,000. Urbanized areaswith more than 200,000 in population receive a direct allocation.
• Non-urbanized Area Formula Assistance Program (Section 5311) – This program provides capital andoperating assistance for rural and small urban transit systems. Fifteen percent of these funds areallocated to intercity bus projects. A portion of the funding is also allocated to support rural transitplanning. The remaining funds are combined with the rural portion (30 percent) of Section 5310funds and allocated among regional and small urban transit systems based on their relativeperformance in the prior year.
• Rural Transit Assistance Program (Section 5311(b)(3)) – This funding is used for statewide trainingevents and to support transit funding fellowships for regional and small urban transit staff or planners.
2045 LONG-RANGE TRANSPORTATION PLAN | 193
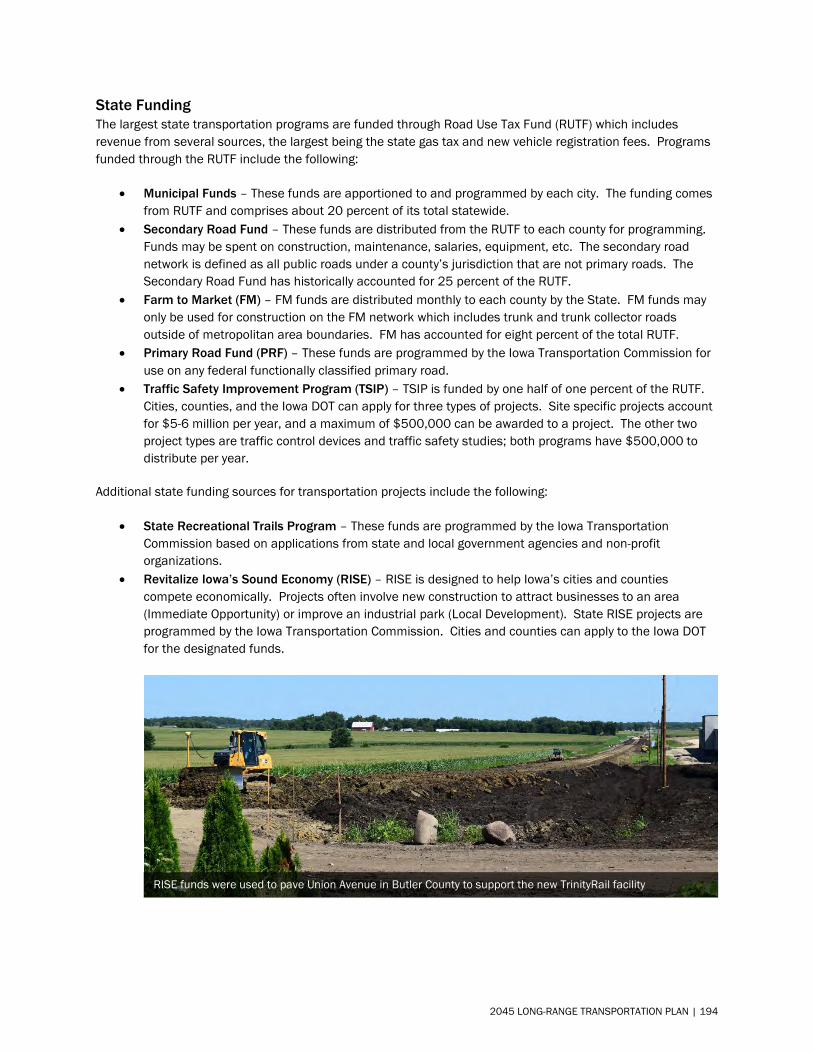
State Funding The largest state transportation programs are funded through Road Use Tax Fund (RUTF) which includes revenue from several sources, the largest being the state gas tax and new vehicle registration fees. Programs funded through the RUTF include the following:
• Municipal Funds – These funds are apportioned to and programmed by each city. The funding comesfrom RUTF and comprises about 20 percent of its total statewide.
• Secondary Road Fund – These funds are distributed from the RUTF to each county for programming.Funds may be spent on construction, maintenance, salaries, equipment, etc. The secondary roadnetwork is defined as all public roads under a county’s jurisdiction that are not primary roads. TheSecondary Road Fund has historically accounted for 25 percent of the RUTF.
• Farm to Market (FM) – FM funds are distributed monthly to each county by the State. FM funds mayonly be used for construction on the FM network which includes trunk and trunk collector roadsoutside of metropolitan area boundaries. FM has accounted for eight percent of the total RUTF.
• Primary Road Fund (PRF) – These funds are programmed by the Iowa Transportation Commission foruse on any federal functionally classified primary road.
• Traffic Safety Improvement Program (TSIP) – TSIP is funded by one half of one percent of the RUTF.Cities, counties, and the Iowa DOT can apply for three types of projects. Site specific projects accountfor $5-6 million per year, and a maximum of $500,000 can be awarded to a project. The other twoproject types are traffic control devices and traffic safety studies; both programs have $500,000 todistribute per year.
Additional state funding sources for transportation projects include the following:
• State Recreational Trails Program – These funds are programmed by the Iowa TransportationCommission based on applications from state and local government agencies and non-profitorganizations.
• Revitalize Iowa’s Sound Economy (RISE) – RISE is designed to help Iowa’s cities and countiescompete economically. Projects often involve new construction to attract businesses to an area(Immediate Opportunity) or improve an industrial park (Local Development). State RISE projects areprogrammed by the Iowa Transportation Commission. Cities and counties can apply to the Iowa DOTfor the designated funds.
RISE funds were used to pave Union Avenue in Butler County to support the new TrinityRail facility
2045 LONG-RANGE TRANSPORTATION PLAN | 194

• Traffic Engineering AssistanceProgram (TEAP) – Trafficengineering consultants areretained by the Iowa DOT and areavailable to local governments asrequested for candidate projectson a first-come/first-served basis.The purpose is to identify cost-effective traffic safety andoperational improvements aswell as potential funding sourcesto implement therecommendations. Typical studies include high-crash locations, unique lane configurations, obsolete traffic control devices, school pedestrians, truck routes, parking issues, and other traffic studies.
• Community Attraction and Tourism (CAT) – CAT was created to assist projects that will providerecreational, cultural, entertainment, and educational attractions. Administered through the IowaEconomic Development Authority (IEDA), this program is intended to help position a community to takeadvantage of economic development opportunities in tourism and strengthen a community’scompetitiveness as a place to workand live. Eligible projects include theconstruction of recreational trails withsubstantial regional or statewideeconomic impact.
• Resource Enhancement andProtection (REAP) – Administeredthrough the Iowa Department ofNatural Resources (DNR), thisstatewide program invests in theenhancement and protection of thestate’s natural and cultural resources.Funding is available annually to citiesthrough statewide competitive grants.Recreational trails are eligible, thoughthey are typically funded as part of alarger project with environmental orpark enhancement benefits.
There are also state funds for transit which include the following:
• State Transit Assistance (STA) – All public transit systems are eligible for this funding. These fundscan be used by the public transit system for operating, capital, or planning expenses related to theprovision of open-to-the-public passenger transportation. Most of the funds received in a fiscal yearare distributed to individual transit systems based on a formula using performance statistics from themost recent available year.
• STA Coordination Special Projects – These funds aid the startup of new services that have beenidentified as needs by health, employment, or human services agencies participating in the passengertransportation planning process.
TEAP was used for the 1st Street Intersection Study, Independence
New Hampton Trail, funded through REAP
2045 LONG-RANGE TRANSPORTATION PLAN | 195
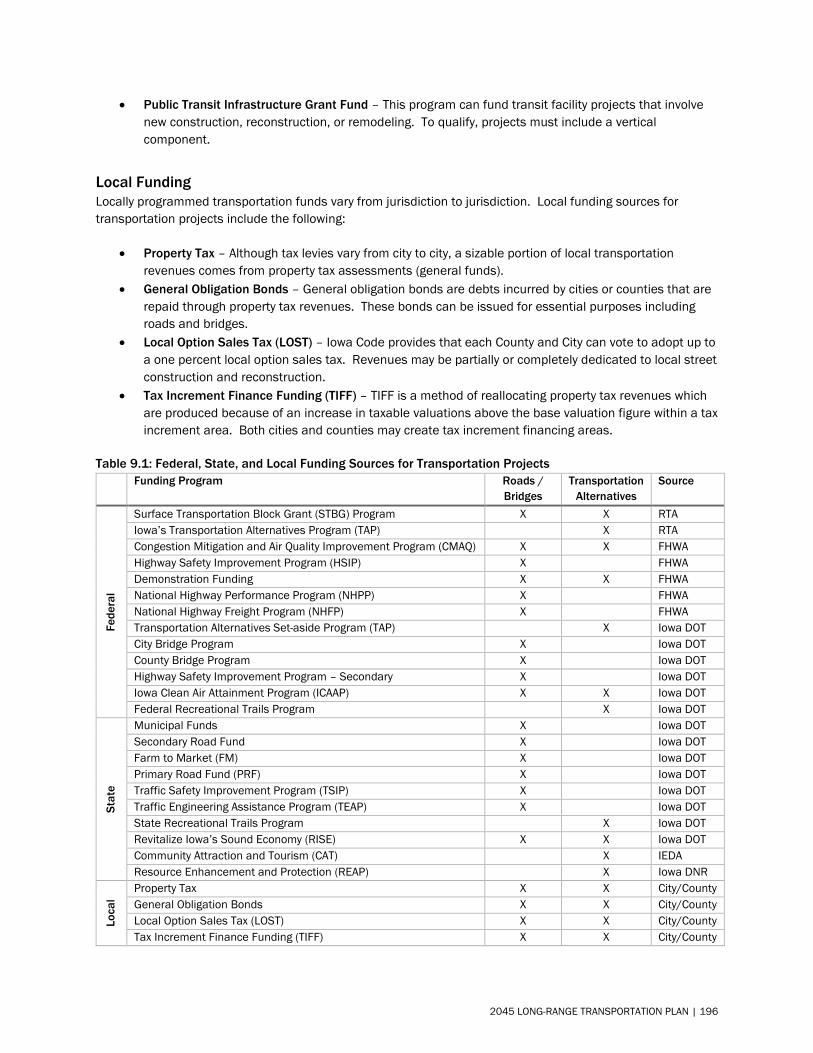
• Public Transit Infrastructure Grant Fund – This program can fund transit facility projects that involvenew construction, reconstruction, or remodeling. To qualify, projects must include a verticalcomponent.
Local Funding Locally programmed transportation funds vary from jurisdiction to jurisdiction. Local funding sources for transportation projects include the following:
• Property Tax – Although tax levies vary from city to city, a sizable portion of local transportationrevenues comes from property tax assessments (general funds).
• General Obligation Bonds – General obligation bonds are debts incurred by cities or counties that arerepaid through property tax revenues. These bonds can be issued for essential purposes includingroads and bridges.
• Local Option Sales Tax (LOST) – Iowa Code provides that each County and City can vote to adopt up toa one percent local option sales tax. Revenues may be partially or completely dedicated to local streetconstruction and reconstruction.
• Tax Increment Finance Funding (TIFF) – TIFF is a method of reallocating property tax revenues whichare produced because of an increase in taxable valuations above the base valuation figure within a taxincrement area. Both cities and counties may create tax increment financing areas.
Table 9.1: Federal, State, and Local Funding Sources for Transportation Projects Funding Program Roads /
Bridges Transportation
Alternatives Source
Fede
ral
Surface Transportation Block Grant (STBG) Program X X RTA Iowa’s Transportation Alternatives Program (TAP) X RTA Congestion Mitigation and Air Quality Improvement Program (CMAQ) X X FHWA Highway Safety Improvement Program (HSIP) X FHWA Demonstration Funding X X FHWA National Highway Performance Program (NHPP) X FHWA National Highway Freight Program (NHFP) X FHWA Transportation Alternatives Set-aside Program (TAP) X Iowa DOT City Bridge Program X Iowa DOT County Bridge Program X Iowa DOT Highway Safety Improvement Program – Secondary X Iowa DOT Iowa Clean Air Attainment Program (ICAAP) X X Iowa DOT Federal Recreational Trails Program X Iowa DOT
Stat
e
Municipal Funds X Iowa DOT Secondary Road Fund X Iowa DOT Farm to Market (FM) X Iowa DOT Primary Road Fund (PRF) X Iowa DOT Traffic Safety Improvement Program (TSIP) X Iowa DOT Traffic Engineering Assistance Program (TEAP) X Iowa DOT State Recreational Trails Program X Iowa DOT Revitalize Iowa’s Sound Economy (RISE) X X Iowa DOT Community Attraction and Tourism (CAT) X IEDA Resource Enhancement and Protection (REAP) X Iowa DNR
Loca
l
Property Tax X X City/County General Obligation Bonds X X City/County Local Option Sales Tax (LOST) X X City/County Tax Increment Finance Funding (TIFF) X X City/County
2045 LONG-RANGE TRANSPORTATION PLAN | 196
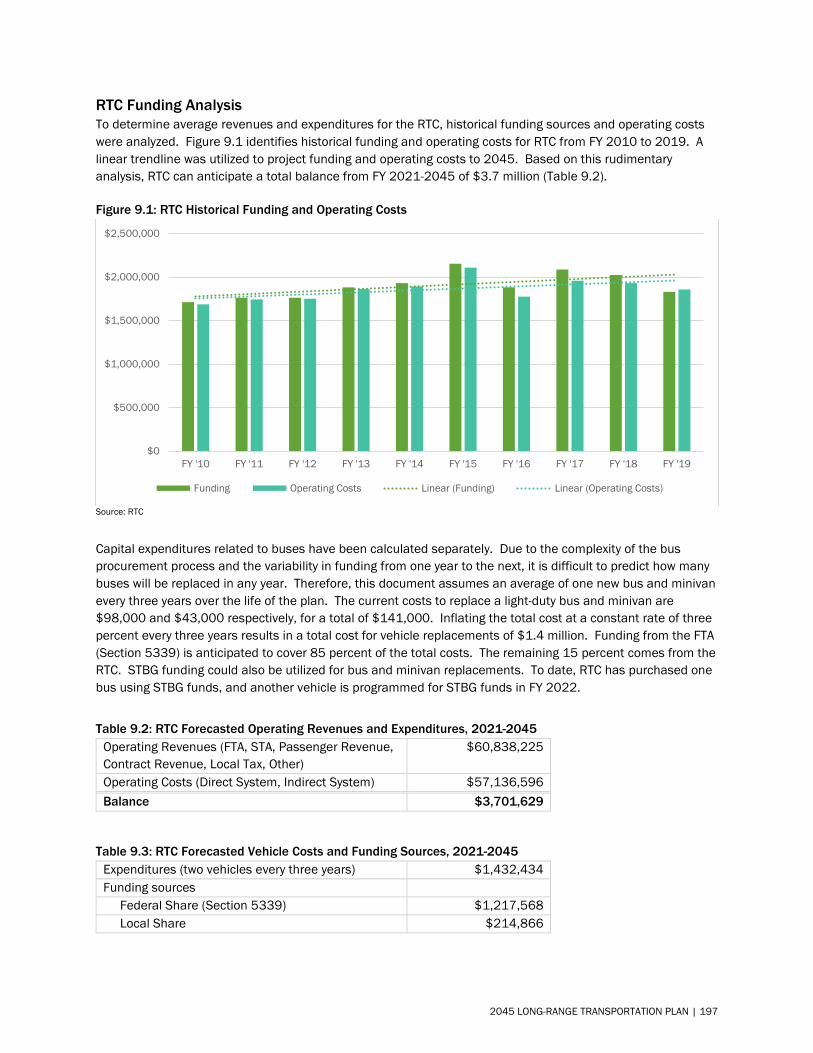
RTC Funding Analysis To determine average revenues and expenditures for the RTC, historical funding sources and operating costs were analyzed. Figure 9.1 identifies historical funding and operating costs for RTC from FY 2010 to 2019. A linear trendline was utilized to project funding and operating costs to 2045. Based on this rudimentary analysis, RTC can anticipate a total balance from FY 2021-2045 of $3.7 million (Table 9.2).
Figure 9.1: RTC Historical Funding and Operating Costs
Source: RTC
Capital expenditures related to buses have been calculated separately. Due to the complexity of the bus procurement process and the variability in funding from one year to the next, it is difficult to predict how many buses will be replaced in any year. Therefore, this document assumes an average of one new bus and minivan every three years over the life of the plan. The current costs to replace a light-duty bus and minivan are $98,000 and $43,000 respectively, for a total of $141,000. Inflating the total cost at a constant rate of three percent every three years results in a total cost for vehicle replacements of $1.4 million. Funding from the FTA (Section 5339) is anticipated to cover 85 percent of the total costs. The remaining 15 percent comes from the RTC. STBG funding could also be utilized for bus and minivan replacements. To date, RTC has purchased one bus using STBG funds, and another vehicle is programmed for STBG funds in FY 2022.
Table 9.2: RTC Forecasted Operating Revenues and Expenditures, 2021-2045 Operating Revenues (FTA, STA, Passenger Revenue, Contract Revenue, Local Tax, Other)
$60,838,225
Operating Costs (Direct System, Indirect System) $57,136,596 Balance $3,701,629
Table 9.3: RTC Forecasted Vehicle Costs and Funding Sources, 2021-2045 Expenditures (two vehicles every three years) $1,432,434 Funding sources Federal Share (Section 5339) $1,217,568 Local Share $214,866
$0
$500,000
$1,000,000
$1,500,000
$2,000,000
$2,500,000
FY '10 FY '11 FY '12 FY '13 FY '14 FY '15 FY '16 FY '17 FY '18 FY '19
Funding Operating Costs Linear (Funding) Linear (Operating Costs)
2045 LONG-RANGE TRANSPORTATION PLAN | 197
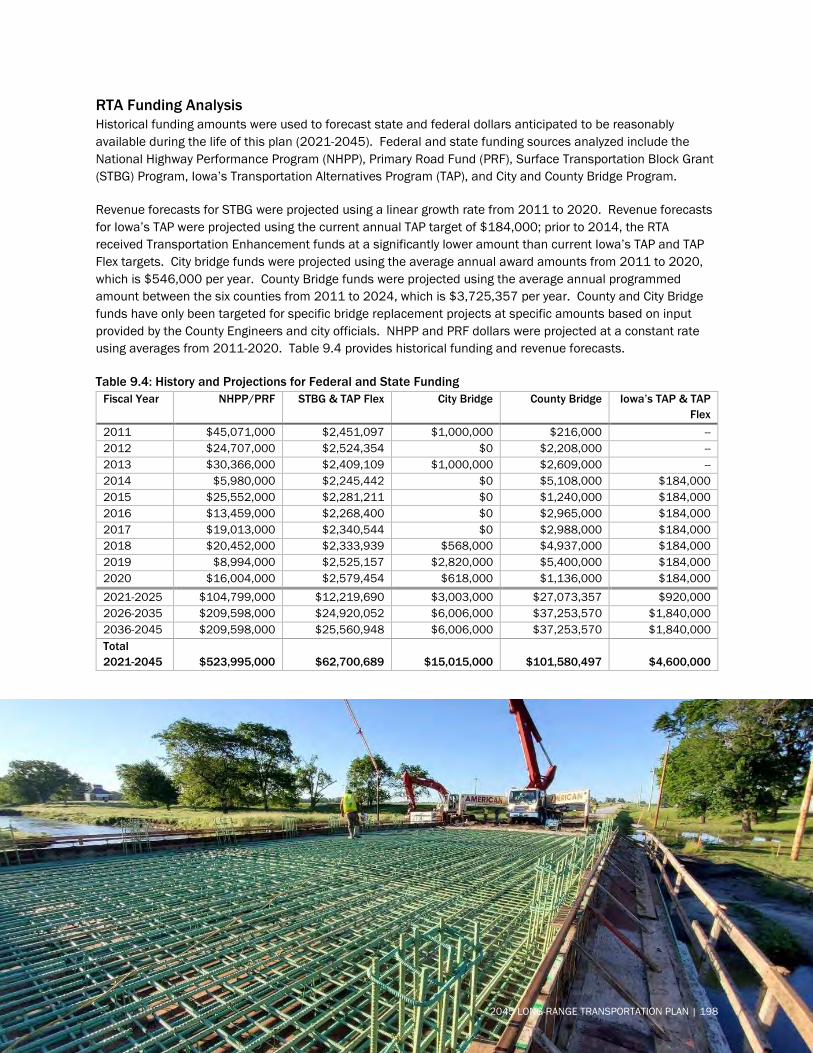
RTA Funding Analysis Historical funding amounts were used to forecast state and federal dollars anticipated to be reasonably available during the life of this plan (2021-2045). Federal and state funding sources analyzed include the National Highway Performance Program (NHPP), Primary Road Fund (PRF), Surface Transportation Block Grant (STBG) Program, Iowa’s Transportation Alternatives Program (TAP), and City and County Bridge Program.
Revenue forecasts for STBG were projected using a linear growth rate from 2011 to 2020. Revenue forecasts for Iowa’s TAP were projected using the current annual TAP target of $184,000; prior to 2014, the RTA received Transportation Enhancement funds at a significantly lower amount than current Iowa’s TAP and TAP Flex targets. City bridge funds were projected using the average annual award amounts from 2011 to 2020, which is $546,000 per year. County Bridge funds were projected using the average annual programmed amount between the six counties from 2011 to 2024, which is $3,725,357 per year. County and City Bridge funds have only been targeted for specific bridge replacement projects at specific amounts based on input provided by the County Engineers and city officials. NHPP and PRF dollars were projected at a constant rate using averages from 2011-2020. Table 9.4 provides historical funding and revenue forecasts.
Table 9.4: History and Projections for Federal and State Funding Fiscal Year NHPP/PRF STBG & TAP Flex City Bridge County Bridge Iowa’s TAP & TAP
Flex 2011 $45,071,000 $2,451,097 $1,000,000 $216,000 -- 2012 $24,707,000 $2,524,354 $0 $2,208,000 -- 2013 $30,366,000 $2,409,109 $1,000,000 $2,609,000 -- 2014 $5,980,000 $2,245,442 $0 $5,108,000 $184,000 2015 $25,552,000 $2,281,211 $0 $1,240,000 $184,000 2016 $13,459,000 $2,268,400 $0 $2,965,000 $184,000 2017 $19,013,000 $2,340,544 $0 $2,988,000 $184,000 2018 $20,452,000 $2,333,939 $568,000 $4,937,000 $184,000 2019 $8,994,000 $2,525,157 $2,820,000 $5,400,000 $184,000 2020 $16,004,000 $2,579,454 $618,000 $1,136,000 $184,000 2021-2025 $104,799,000 $12,219,690 $3,003,000 $27,073,357 $920,000 2026-2035 $209,598,000 $24,920,052 $6,006,000 $37,253,570 $1,840,000 2036-2045 $209,598,000 $25,560,948 $6,006,000 $37,253,570 $1,840,000 Total 2021-2045 $523,995,000 $62,700,689 $15,015,000 $101,580,497 $4,600,000
2045 LONG-RANGE TRANSPORTATION PLAN | 198
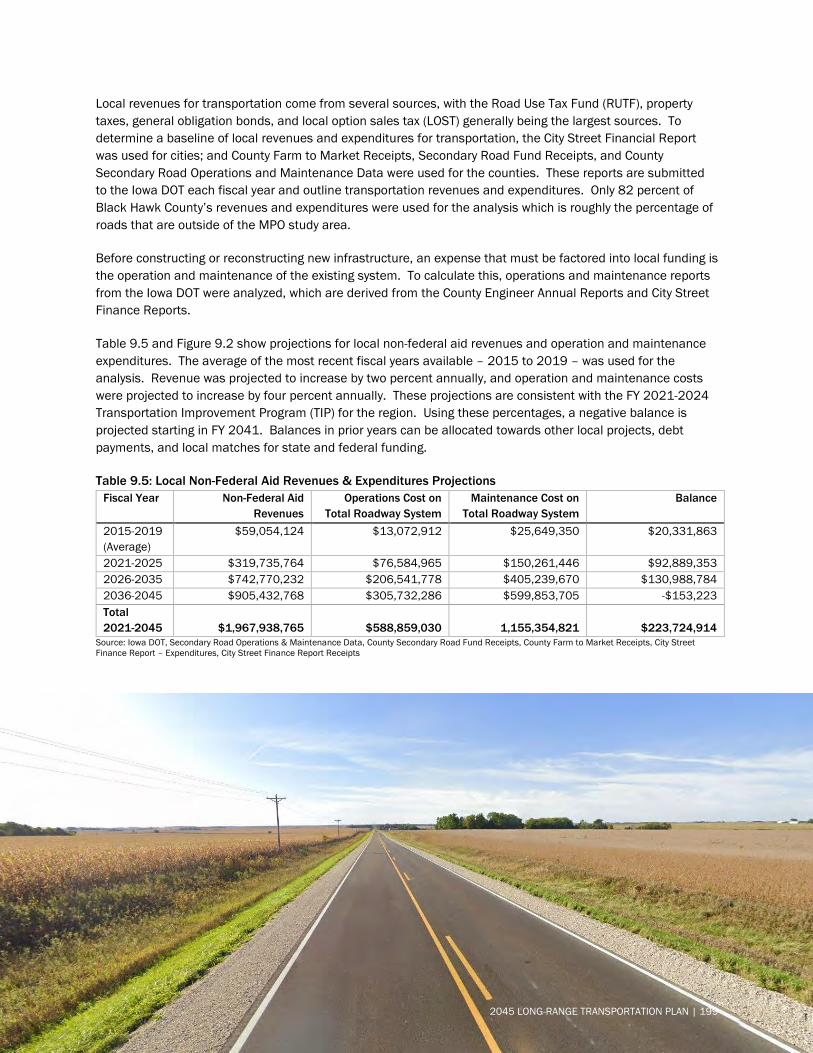
Local revenues for transportation come from several sources, with the Road Use Tax Fund (RUTF), property taxes, general obligation bonds, and local option sales tax (LOST) generally being the largest sources. To determine a baseline of local revenues and expenditures for transportation, the City Street Financial Report was used for cities; and County Farm to Market Receipts, Secondary Road Fund Receipts, and County Secondary Road Operations and Maintenance Data were used for the counties. These reports are submitted to the Iowa DOT each fiscal year and outline transportation revenues and expenditures. Only 82 percent of Black Hawk County’s revenues and expenditures were used for the analysis which is roughly the percentage of roads that are outside of the MPO study area.
Before constructing or reconstructing new infrastructure, an expense that must be factored into local funding is the operation and maintenance of the existing system. To calculate this, operations and maintenance reports from the Iowa DOT were analyzed, which are derived from the County Engineer Annual Reports and City Street Finance Reports.
Table 9.5 and Figure 9.2 show projections for local non-federal aid revenues and operation and maintenance expenditures. The average of the most recent fiscal years available – 2015 to 2019 – was used for the analysis. Revenue was projected to increase by two percent annually, and operation and maintenance costs were projected to increase by four percent annually. These projections are consistent with the FY 2021-2024 Transportation Improvement Program (TIP) for the region. Using these percentages, a negative balance is projected starting in FY 2041. Balances in prior years can be allocated towards other local projects, debt payments, and local matches for state and federal funding.
Table 9.5: Local Non-Federal Aid Revenues & Expenditures Projections Fiscal Year Non-Federal Aid
Revenues Operations Cost on
Total Roadway System Maintenance Cost on
Total Roadway System Balance
2015-2019 (Average)
$59,054,124 $13,072,912 $25,649,350 $20,331,863
2021-2025 $319,735,764 $76,584,965 $150,261,446 $92,889,353 2026-2035 $742,770,232 $206,541,778 $405,239,670 $130,988,784 2036-2045 $905,432,768 $305,732,286 $599,853,705 -$153,223 Total 2021-2045 $1,967,938,765 $588,859,030 1,155,354,821 $223,724,914
Source: Iowa DOT, Secondary Road Operations & Maintenance Data, County Secondary Road Fund Receipts, County Farm to Market Receipts, City Street Finance Report – Expenditures, City Street Finance Report Receipts
2045 LONG-RANGE TRANSPORTATION PLAN | 199
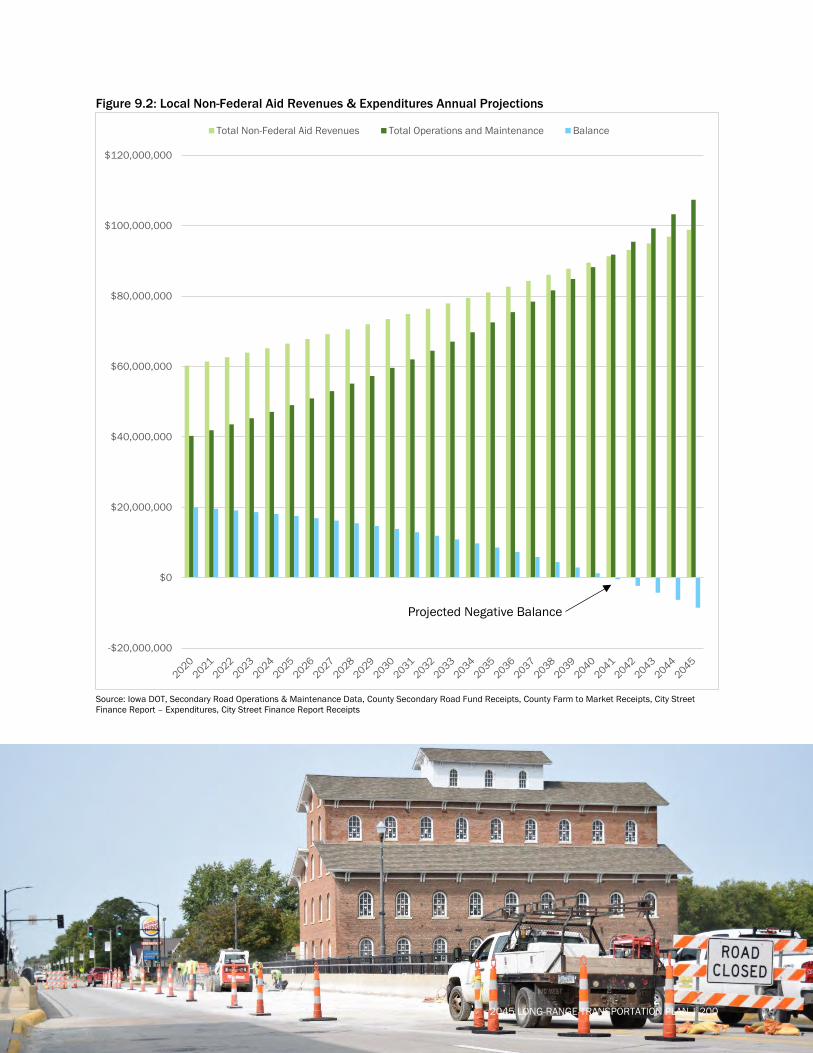
Figure 9.2: Local Non-Federal Aid Revenues & Expenditures Annual Projections
Source: Iowa DOT, Secondary Road Operations & Maintenance Data, County Secondary Road Fund Receipts, County Farm to Market Receipts, City Street Finance Report – Expenditures, City Street Finance Report Receipts
-$20,000,000
$0
$20,000,000
$40,000,000
$60,000,000
$80,000,000
$100,000,000
$120,000,000
Total Non-Federal Aid Revenues Total Operations and Maintenance Balance
Projected Negative Balance
2045 LONG-RANGE TRANSPORTATION PLAN | 200
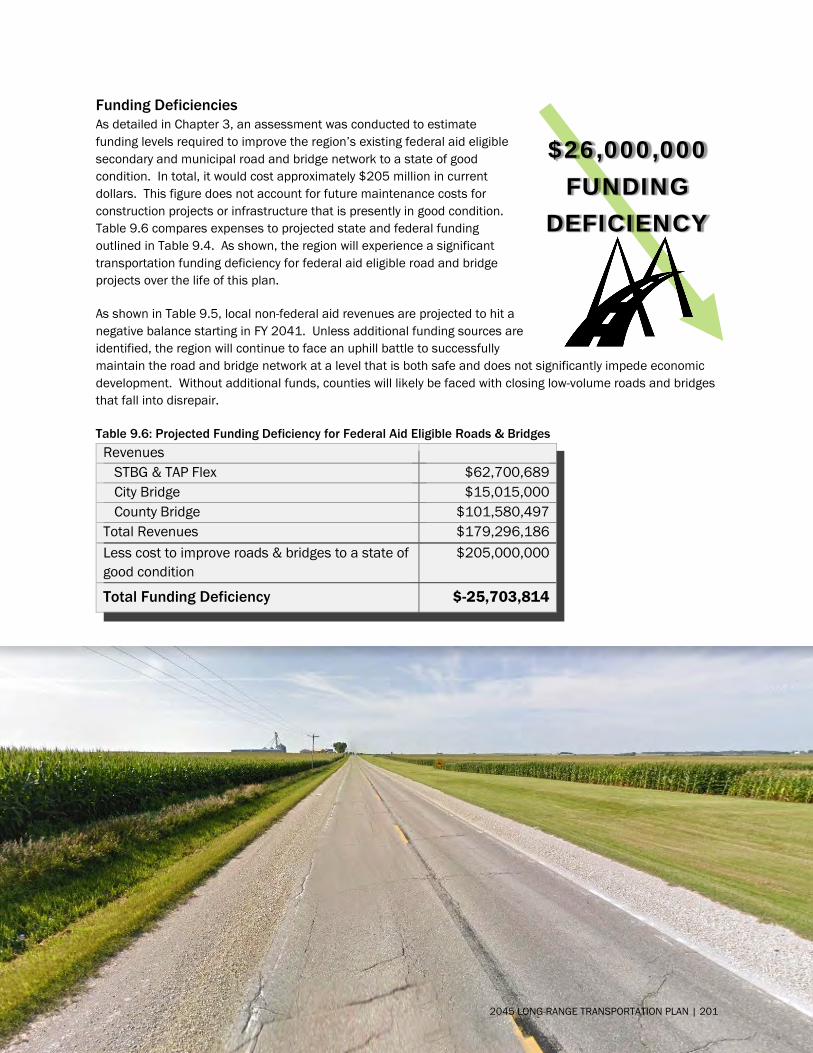
Funding Deficiencies As detailed in Chapter 3, an assessment was conducted to estimate funding levels required to improve the region’s existing federal aid eligible secondary and municipal road and bridge network to a state of good condition. In total, it would cost approximately $205 million in current dollars. This figure does not account for future maintenance costs for construction projects or infrastructure that is presently in good condition. Table 9.6 compares expenses to projected state and federal funding outlined in Table 9.4. As shown, the region will experience a significant transportation funding deficiency for federal aid eligible road and bridge projects over the life of this plan.
As shown in Table 9.5, local non-federal aid revenues are projected to hit a negative balance starting in FY 2041. Unless additional funding sources are identified, the region will continue to face an uphill battle to successfully maintain the road and bridge network at a level that is both safe and does not significantly impede economic development. Without additional funds, counties will likely be faced with closing low-volume roads and bridges that fall into disrepair.
Table 9.6: Projected Funding Deficiency for Federal Aid Eligible Roads & Bridges Revenues STBG & TAP Flex $62,700,689 City Bridge $15,015,000 County Bridge $101,580,497 Total Revenues $179,296,186 Less cost to improve roads & bridges to a state of good condition
$205,000,000
Total Funding Deficiency $-25,703,814
$26,000,000 FUNDING
DEFICIENCY
2045 LONG-RANGE TRANSPORTATION PLAN | 201
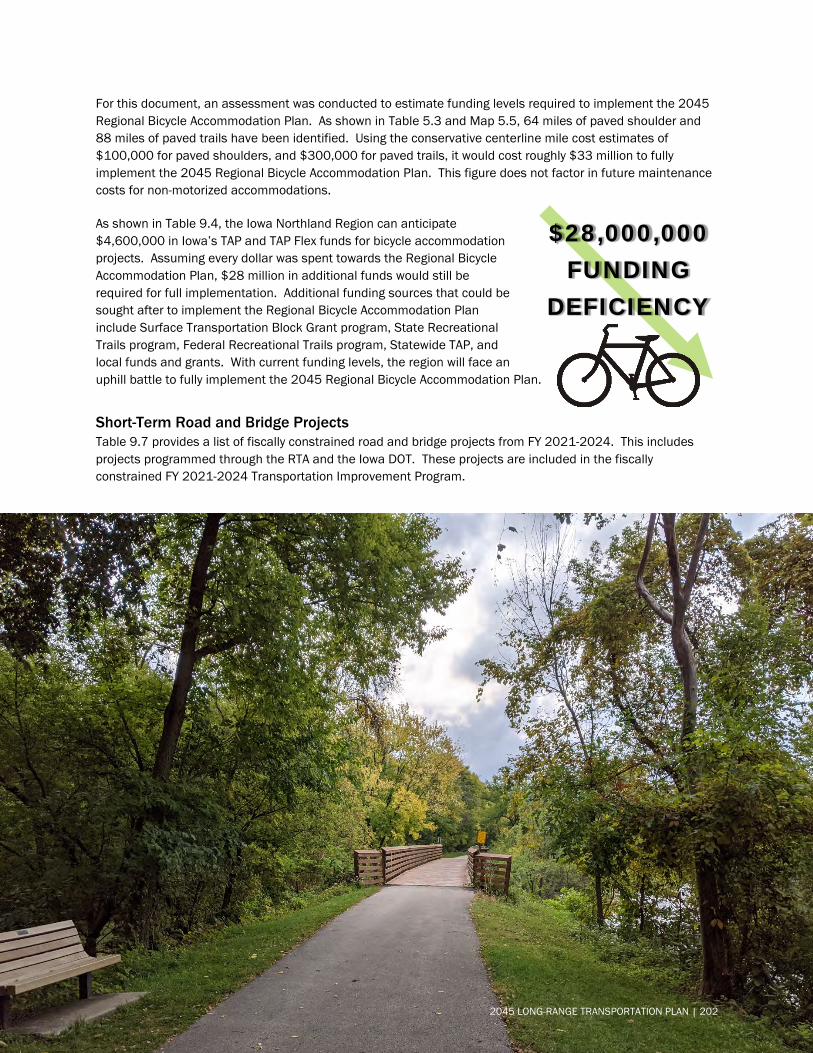
For this document, an assessment was conducted to estimate funding levels required to implement the 2045 Regional Bicycle Accommodation Plan. As shown in Table 5.3 and Map 5.5, 64 miles of paved shoulder and 88 miles of paved trails have been identified. Using the conservative centerline mile cost estimates of $100,000 for paved shoulders, and $300,000 for paved trails, it would cost roughly $33 million to fully implement the 2045 Regional Bicycle Accommodation Plan. This figure does not factor in future maintenance costs for non-motorized accommodations.
As shown in Table 9.4, the Iowa Northland Region can anticipate $4,600,000 in Iowa’s TAP and TAP Flex funds for bicycle accommodation projects. Assuming every dollar was spent towards the Regional Bicycle Accommodation Plan, $28 million in additional funds would still be required for full implementation. Additional funding sources that could be sought after to implement the Regional Bicycle Accommodation Plan include Surface Transportation Block Grant program, State Recreational Trails program, Federal Recreational Trails program, Statewide TAP, and local funds and grants. With current funding levels, the region will face an uphill battle to fully implement the 2045 Regional Bicycle Accommodation Plan.
Short-Term Road and Bridge Projects Table 9.7 provides a list of fiscally constrained road and bridge projects from FY 2021-2024. This includes projects programmed through the RTA and the Iowa DOT. These projects are included in the fiscally constrained FY 2021-2024 Transportation Improvement Program.
$28,000,000 FUNDING
DEFICIENCY
2045 LONG-RANGE TRANSPORTATION PLAN | 202
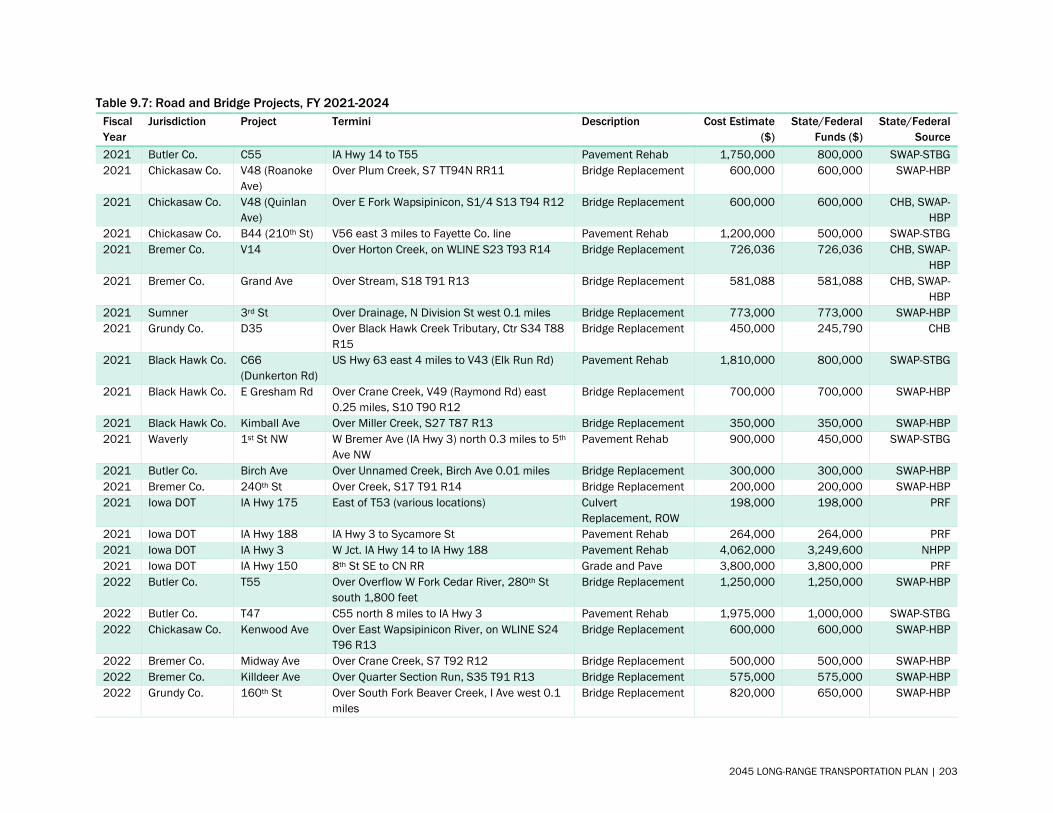
Table 9.7: Road and Bridge Projects, FY 2021-2024 Fiscal Year
Jurisdiction Project Termini Description Cost Estimate ($)
State/Federal Funds ($)
State/Federal Source
2021 Butler Co. C55 IA Hwy 14 to T55 Pavement Rehab 1,750,000 800,000 SWAP-STBG 2021 Chickasaw Co. V48 (Roanoke
Ave) Over Plum Creek, S7 TT94N RR11 Bridge Replacement 600,000 600,000 SWAP-HBP
2021 Chickasaw Co. V48 (Quinlan Ave)
Over E Fork Wapsipinicon, S1/4 S13 T94 R12 Bridge Replacement 600,000 600,000 CHB, SWAP-HBP
2021 Chickasaw Co. B44 (210th St) V56 east 3 miles to Fayette Co. line Pavement Rehab 1,200,000 500,000 SWAP-STBG 2021 Bremer Co. V14 Over Horton Creek, on WLINE S23 T93 R14 Bridge Replacement 726,036 726,036 CHB, SWAP-
HBP 2021 Bremer Co. Grand Ave Over Stream, S18 T91 R13 Bridge Replacement 581,088 581,088 CHB, SWAP-
HBP 2021 Sumner 3rd St Over Drainage, N Division St west 0.1 miles Bridge Replacement 773,000 773,000 SWAP-HBP 2021 Grundy Co. D35 Over Black Hawk Creek Tributary, Ctr S34 T88
R15 Bridge Replacement 450,000 245,790 CHB
2021 Black Hawk Co. C66 (Dunkerton Rd)
US Hwy 63 east 4 miles to V43 (Elk Run Rd) Pavement Rehab 1,810,000 800,000 SWAP-STBG
2021 Black Hawk Co. E Gresham Rd Over Crane Creek, V49 (Raymond Rd) east 0.25 miles, S10 T90 R12
Bridge Replacement 700,000 700,000 SWAP-HBP
2021 Black Hawk Co. Kimball Ave Over Miller Creek, S27 T87 R13 Bridge Replacement 350,000 350,000 SWAP-HBP 2021 Waverly 1st St NW W Bremer Ave (IA Hwy 3) north 0.3 miles to 5th
Ave NW Pavement Rehab 900,000 450,000 SWAP-STBG
2021 Butler Co. Birch Ave Over Unnamed Creek, Birch Ave 0.01 miles Bridge Replacement 300,000 300,000 SWAP-HBP 2021 Bremer Co. 240th St Over Creek, S17 T91 R14 Bridge Replacement 200,000 200,000 SWAP-HBP 2021 Iowa DOT IA Hwy 175 East of T53 (various locations) Culvert
Replacement, ROW 198,000 198,000 PRF
2021 Iowa DOT IA Hwy 188 IA Hwy 3 to Sycamore St Pavement Rehab 264,000 264,000 PRF 2021 Iowa DOT IA Hwy 3 W Jct. IA Hwy 14 to IA Hwy 188 Pavement Rehab 4,062,000 3,249,600 NHPP 2021 Iowa DOT IA Hwy 150 8th St SE to CN RR Grade and Pave 3,800,000 3,800,000 PRF 2022 Butler Co. T55 Over Overflow W Fork Cedar River, 280th St
south 1,800 feet Bridge Replacement 1,250,000 1,250,000 SWAP-HBP
2022 Butler Co. T47 C55 north 8 miles to IA Hwy 3 Pavement Rehab 1,975,000 1,000,000 SWAP-STBG 2022 Chickasaw Co. Kenwood Ave Over East Wapsipinicon River, on WLINE S24
T96 R13 Bridge Replacement 600,000 600,000 SWAP-HBP
2022 Bremer Co. Midway Ave Over Crane Creek, S7 T92 R12 Bridge Replacement 500,000 500,000 SWAP-HBP 2022 Bremer Co. Killdeer Ave Over Quarter Section Run, S35 T91 R13 Bridge Replacement 575,000 575,000 SWAP-HBP 2022 Grundy Co. 160th St Over South Fork Beaver Creek, I Ave west 0.1
miles Bridge Replacement 820,000 650,000 SWAP-HBP
2045 LONG-RANGE TRANSPORTATION PLAN | 203
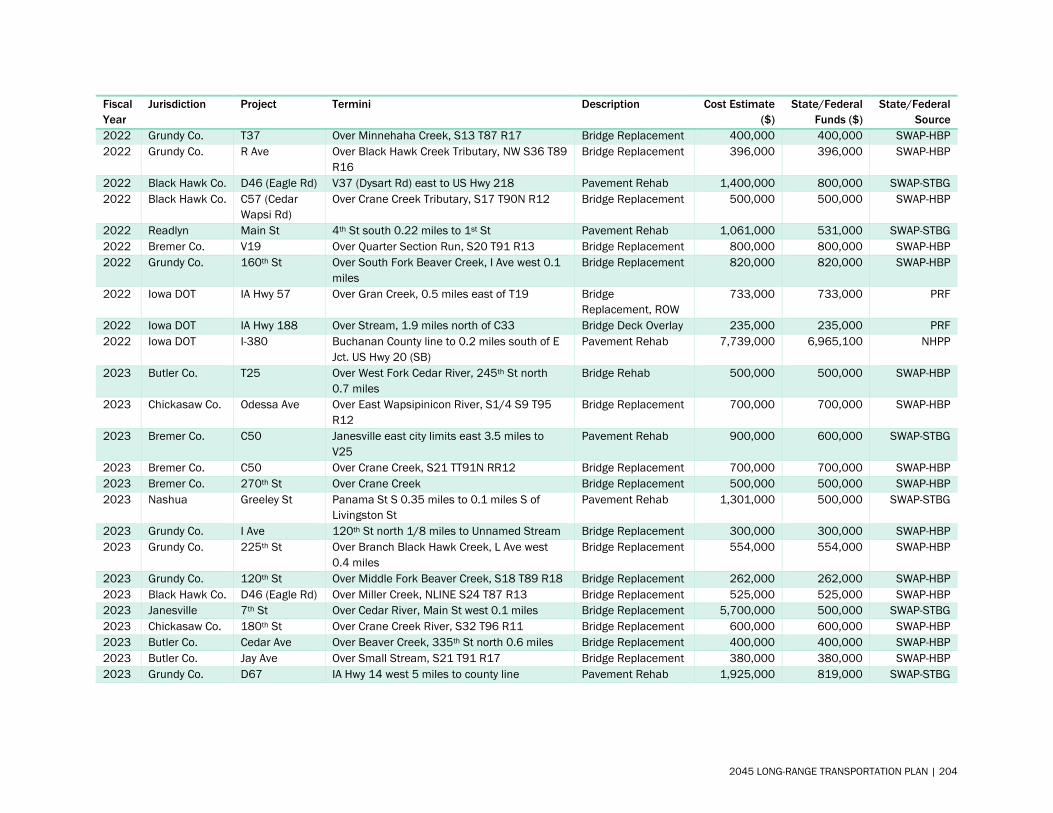
Fiscal Year
Jurisdiction Project Termini Description Cost Estimate ($)
State/Federal Funds ($)
State/Federal Source
2022 Grundy Co. T37 Over Minnehaha Creek, S13 T87 R17 Bridge Replacement 400,000 400,000 SWAP-HBP 2022 Grundy Co. R Ave Over Black Hawk Creek Tributary, NW S36 T89
R16 Bridge Replacement 396,000 396,000 SWAP-HBP
2022 Black Hawk Co. D46 (Eagle Rd) V37 (Dysart Rd) east to US Hwy 218 Pavement Rehab 1,400,000 800,000 SWAP-STBG 2022 Black Hawk Co. C57 (Cedar
Wapsi Rd) Over Crane Creek Tributary, S17 T90N R12 Bridge Replacement 500,000 500,000 SWAP-HBP
2022 Readlyn Main St 4th St south 0.22 miles to 1st St Pavement Rehab 1,061,000 531,000 SWAP-STBG 2022 Bremer Co. V19 Over Quarter Section Run, S20 T91 R13 Bridge Replacement 800,000 800,000 SWAP-HBP 2022 Grundy Co. 160th St Over South Fork Beaver Creek, I Ave west 0.1
miles Bridge Replacement 820,000 820,000 SWAP-HBP
2022 Iowa DOT IA Hwy 57 Over Gran Creek, 0.5 miles east of T19 Bridge Replacement, ROW
733,000 733,000 PRF
2022 Iowa DOT IA Hwy 188 Over Stream, 1.9 miles north of C33 Bridge Deck Overlay 235,000 235,000 PRF 2022 Iowa DOT I-380 Buchanan County line to 0.2 miles south of E
Jct. US Hwy 20 (SB) Pavement Rehab 7,739,000 6,965,100 NHPP
2023 Butler Co. T25 Over West Fork Cedar River, 245th St north 0.7 miles
Bridge Rehab 500,000 500,000 SWAP-HBP
2023 Chickasaw Co. Odessa Ave Over East Wapsipinicon River, S1/4 S9 T95 R12
Bridge Replacement 700,000 700,000 SWAP-HBP
2023 Bremer Co. C50 Janesville east city limits east 3.5 miles to V25
Pavement Rehab 900,000 600,000 SWAP-STBG
2023 Bremer Co. C50 Over Crane Creek, S21 TT91N RR12 Bridge Replacement 700,000 700,000 SWAP-HBP 2023 Bremer Co. 270th St Over Crane Creek Bridge Replacement 500,000 500,000 SWAP-HBP 2023 Nashua Greeley St Panama St S 0.35 miles to 0.1 miles S of
Livingston St Pavement Rehab 1,301,000 500,000 SWAP-STBG
2023 Grundy Co. I Ave 120th St north 1/8 miles to Unnamed Stream Bridge Replacement 300,000 300,000 SWAP-HBP 2023 Grundy Co. 225th St Over Branch Black Hawk Creek, L Ave west
0.4 miles Bridge Replacement 554,000 554,000 SWAP-HBP
2023 Grundy Co. 120th St Over Middle Fork Beaver Creek, S18 T89 R18 Bridge Replacement 262,000 262,000 SWAP-HBP 2023 Black Hawk Co. D46 (Eagle Rd) Over Miller Creek, NLINE S24 T87 R13 Bridge Replacement 525,000 525,000 SWAP-HBP 2023 Janesville 7th St Over Cedar River, Main St west 0.1 miles Bridge Replacement 5,700,000 500,000 SWAP-STBG 2023 Chickasaw Co. 180th St Over Crane Creek River, S32 T96 R11 Bridge Replacement 600,000 600,000 SWAP-HBP 2023 Butler Co. Cedar Ave Over Beaver Creek, 335th St north 0.6 miles Bridge Replacement 400,000 400,000 SWAP-HBP 2023 Butler Co. Jay Ave Over Small Stream, S21 T91 R17 Bridge Replacement 380,000 380,000 SWAP-HBP 2023 Grundy Co. D67 IA Hwy 14 west 5 miles to county line Pavement Rehab 1,925,000 819,000 SWAP-STBG
2045 LONG-RANGE TRANSPORTATION PLAN | 204
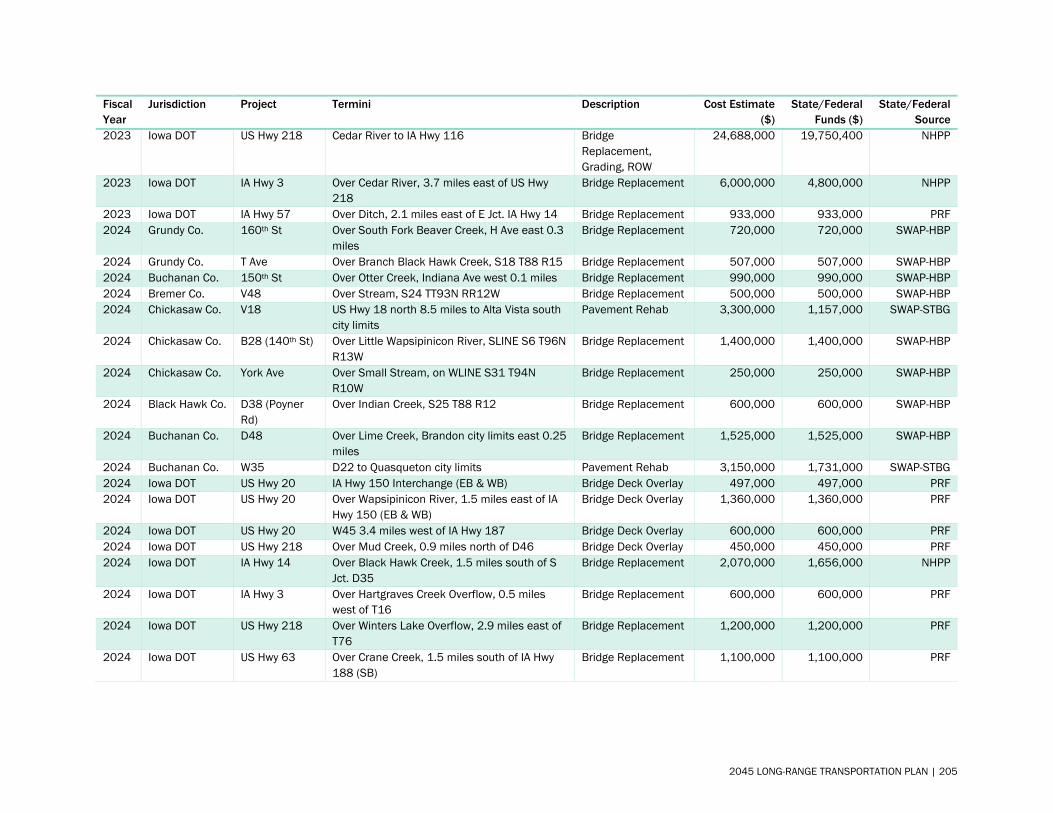
Fiscal Year
Jurisdiction Project Termini Description Cost Estimate ($)
State/Federal Funds ($)
State/Federal Source
2023 Iowa DOT US Hwy 218 Cedar River to IA Hwy 116 Bridge Replacement, Grading, ROW
24,688,000 19,750,400 NHPP
2023 Iowa DOT IA Hwy 3 Over Cedar River, 3.7 miles east of US Hwy 218
Bridge Replacement 6,000,000 4,800,000 NHPP
2023 Iowa DOT IA Hwy 57 Over Ditch, 2.1 miles east of E Jct. IA Hwy 14 Bridge Replacement 933,000 933,000 PRF 2024 Grundy Co. 160th St Over South Fork Beaver Creek, H Ave east 0.3
miles Bridge Replacement 720,000 720,000 SWAP-HBP
2024 Grundy Co. T Ave Over Branch Black Hawk Creek, S18 T88 R15 Bridge Replacement 507,000 507,000 SWAP-HBP 2024 Buchanan Co. 150th St Over Otter Creek, Indiana Ave west 0.1 miles Bridge Replacement 990,000 990,000 SWAP-HBP 2024 Bremer Co. V48 Over Stream, S24 TT93N RR12W Bridge Replacement 500,000 500,000 SWAP-HBP 2024 Chickasaw Co. V18 US Hwy 18 north 8.5 miles to Alta Vista south
city limits Pavement Rehab 3,300,000 1,157,000 SWAP-STBG
2024 Chickasaw Co. B28 (140th St) Over Little Wapsipinicon River, SLINE S6 T96N R13W
Bridge Replacement 1,400,000 1,400,000 SWAP-HBP
2024 Chickasaw Co. York Ave Over Small Stream, on WLINE S31 T94N R10W
Bridge Replacement 250,000 250,000 SWAP-HBP
2024 Black Hawk Co. D38 (Poyner Rd)
Over Indian Creek, S25 T88 R12 Bridge Replacement 600,000 600,000 SWAP-HBP
2024 Buchanan Co. D48 Over Lime Creek, Brandon city limits east 0.25 miles
Bridge Replacement 1,525,000 1,525,000 SWAP-HBP
2024 Buchanan Co. W35 D22 to Quasqueton city limits Pavement Rehab 3,150,000 1,731,000 SWAP-STBG 2024 Iowa DOT US Hwy 20 IA Hwy 150 Interchange (EB & WB) Bridge Deck Overlay 497,000 497,000 PRF 2024 Iowa DOT US Hwy 20 Over Wapsipinicon River, 1.5 miles east of IA
Hwy 150 (EB & WB) Bridge Deck Overlay 1,360,000 1,360,000 PRF
2024 Iowa DOT US Hwy 20 W45 3.4 miles west of IA Hwy 187 Bridge Deck Overlay 600,000 600,000 PRF 2024 Iowa DOT US Hwy 218 Over Mud Creek, 0.9 miles north of D46 Bridge Deck Overlay 450,000 450,000 PRF 2024 Iowa DOT IA Hwy 14 Over Black Hawk Creek, 1.5 miles south of S
Jct. D35 Bridge Replacement 2,070,000 1,656,000 NHPP
2024 Iowa DOT IA Hwy 3 Over Hartgraves Creek Overflow, 0.5 miles west of T16
Bridge Replacement 600,000 600,000 PRF
2024 Iowa DOT US Hwy 218 Over Winters Lake Overflow, 2.9 miles east of T76
Bridge Replacement 1,200,000 1,200,000 PRF
2024 Iowa DOT US Hwy 63 Over Crane Creek, 1.5 miles south of IA Hwy 188 (SB)
Bridge Replacement 1,100,000 1,100,000 PRF
2045 LONG-RANGE TRANSPORTATION PLAN | 205
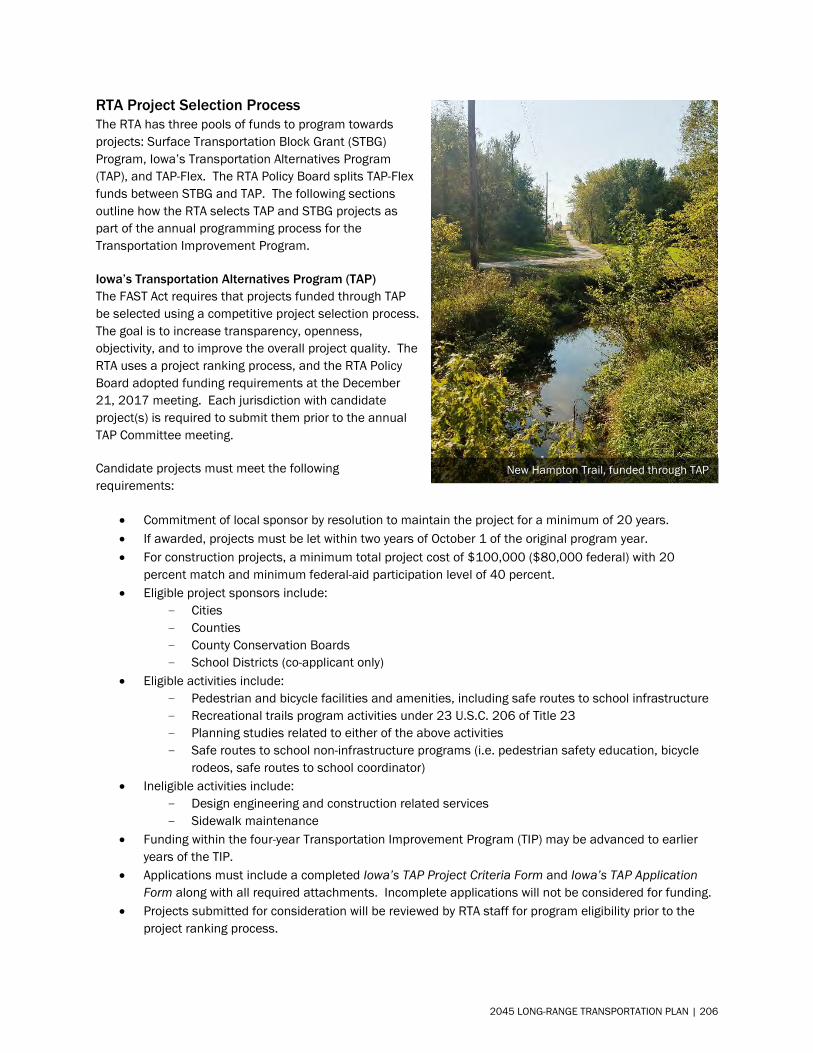
RTA Project Selection Process The RTA has three pools of funds to program towards projects: Surface Transportation Block Grant (STBG) Program, Iowa’s Transportation Alternatives Program (TAP), and TAP-Flex. The RTA Policy Board splits TAP-Flex funds between STBG and TAP. The following sections outline how the RTA selects TAP and STBG projects as part of the annual programming process for the Transportation Improvement Program.
Iowa’s Transportation Alternatives Program (TAP) The FAST Act requires that projects funded through TAP be selected using a competitive project selection process. The goal is to increase transparency, openness, objectivity, and to improve the overall project quality. The RTA uses a project ranking process, and the RTA Policy Board adopted funding requirements at the December 21, 2017 meeting. Each jurisdiction with candidate project(s) is required to submit them prior to the annual TAP Committee meeting.
Candidate projects must meet the following requirements:
• Commitment of local sponsor by resolution to maintain the project for a minimum of 20 years.• If awarded, projects must be let within two years of October 1 of the original program year.• For construction projects, a minimum total project cost of $100,000 ($80,000 federal) with 20
percent match and minimum federal-aid participation level of 40 percent.• Eligible project sponsors include:
- Cities- Counties- County Conservation Boards- School Districts (co-applicant only)
• Eligible activities include:- Pedestrian and bicycle facilities and amenities, including safe routes to school infrastructure- Recreational trails program activities under 23 U.S.C. 206 of Title 23- Planning studies related to either of the above activities- Safe routes to school non-infrastructure programs (i.e. pedestrian safety education, bicycle
rodeos, safe routes to school coordinator)• Ineligible activities include:
- Design engineering and construction related services- Sidewalk maintenance
• Funding within the four-year Transportation Improvement Program (TIP) may be advanced to earlieryears of the TIP.
• Applications must include a completed Iowa’s TAP Project Criteria Form and Iowa’s TAP ApplicationForm along with all required attachments. Incomplete applications will not be considered for funding.
• Projects submitted for consideration will be reviewed by RTA staff for program eligibility prior to theproject ranking process.
New Hampton Trail, funded through TAP
2045 LONG-RANGE TRANSPORTATION PLAN | 206
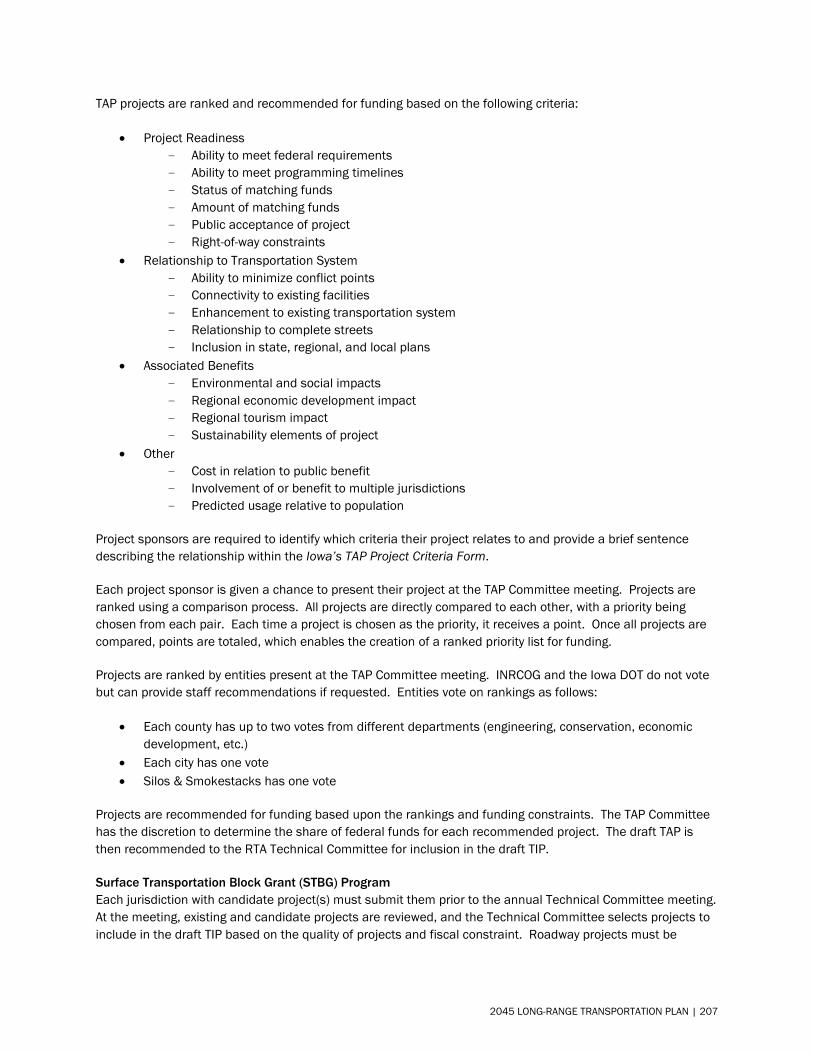
TAP projects are ranked and recommended for funding based on the following criteria:
• Project Readiness- Ability to meet federal requirements- Ability to meet programming timelines- Status of matching funds- Amount of matching funds- Public acceptance of project- Right-of-way constraints
• Relationship to Transportation System- Ability to minimize conflict points- Connectivity to existing facilities- Enhancement to existing transportation system- Relationship to complete streets- Inclusion in state, regional, and local plans
• Associated Benefits- Environmental and social impacts- Regional economic development impact- Regional tourism impact- Sustainability elements of project
• Other- Cost in relation to public benefit- Involvement of or benefit to multiple jurisdictions- Predicted usage relative to population
Project sponsors are required to identify which criteria their project relates to and provide a brief sentence describing the relationship within the Iowa’s TAP Project Criteria Form.
Each project sponsor is given a chance to present their project at the TAP Committee meeting. Projects are ranked using a comparison process. All projects are directly compared to each other, with a priority being chosen from each pair. Each time a project is chosen as the priority, it receives a point. Once all projects are compared, points are totaled, which enables the creation of a ranked priority list for funding.
Projects are ranked by entities present at the TAP Committee meeting. INRCOG and the Iowa DOT do not vote but can provide staff recommendations if requested. Entities vote on rankings as follows:
• Each county has up to two votes from different departments (engineering, conservation, economicdevelopment, etc.)
• Each city has one vote• Silos & Smokestacks has one vote
Projects are recommended for funding based upon the rankings and funding constraints. The TAP Committee has the discretion to determine the share of federal funds for each recommended project. The draft TAP is then recommended to the RTA Technical Committee for inclusion in the draft TIP.
Surface Transportation Block Grant (STBG) Program Each jurisdiction with candidate project(s) must submit them prior to the annual Technical Committee meeting. At the meeting, existing and candidate projects are reviewed, and the Technical Committee selects projects to include in the draft TIP based on the quality of projects and fiscal constraint. Roadway projects must be
2045 LONG-RANGE TRANSPORTATION PLAN | 207
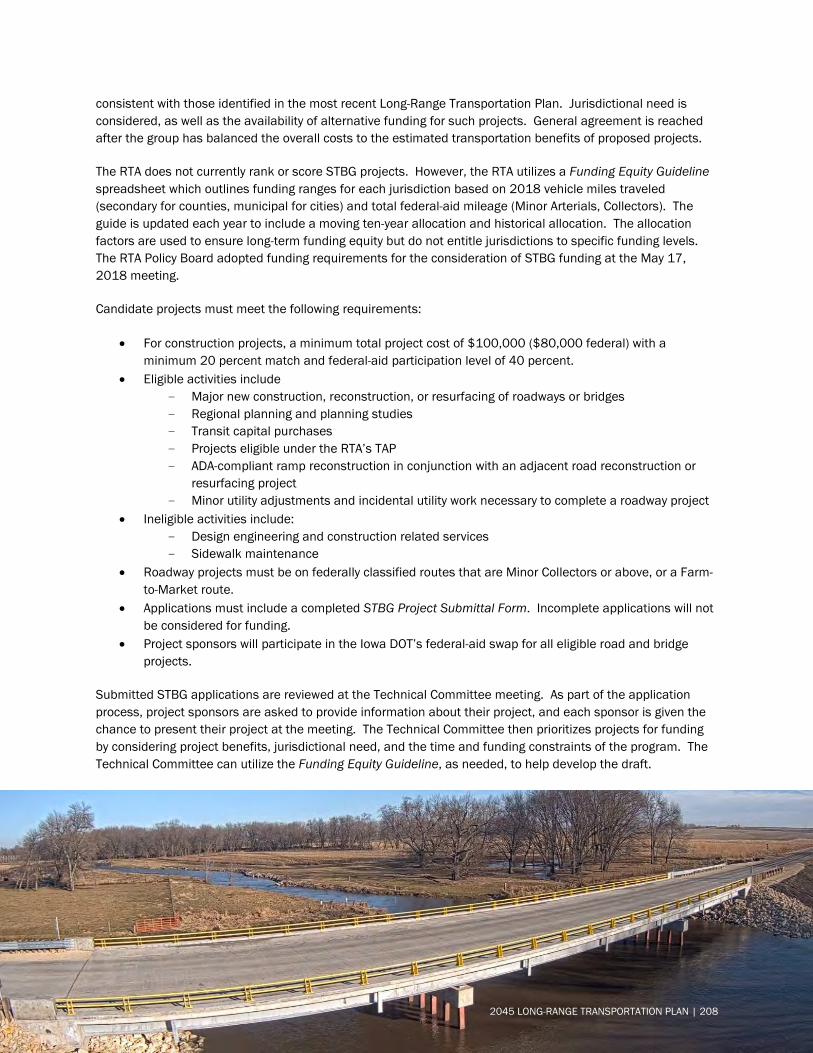
consistent with those identified in the most recent Long-Range Transportation Plan. Jurisdictional need is considered, as well as the availability of alternative funding for such projects. General agreement is reached after the group has balanced the overall costs to the estimated transportation benefits of proposed projects.
The RTA does not currently rank or score STBG projects. However, the RTA utilizes a Funding Equity Guideline spreadsheet which outlines funding ranges for each jurisdiction based on 2018 vehicle miles traveled (secondary for counties, municipal for cities) and total federal-aid mileage (Minor Arterials, Collectors). The guide is updated each year to include a moving ten-year allocation and historical allocation. The allocation factors are used to ensure long-term funding equity but do not entitle jurisdictions to specific funding levels. The RTA Policy Board adopted funding requirements for the consideration of STBG funding at the May 17, 2018 meeting.
Candidate projects must meet the following requirements:
• For construction projects, a minimum total project cost of $100,000 ($80,000 federal) with aminimum 20 percent match and federal-aid participation level of 40 percent.
• Eligible activities include- Major new construction, reconstruction, or resurfacing of roadways or bridges- Regional planning and planning studies- Transit capital purchases- Projects eligible under the RTA’s TAP- ADA-compliant ramp reconstruction in conjunction with an adjacent road reconstruction or
resurfacing project- Minor utility adjustments and incidental utility work necessary to complete a roadway project
• Ineligible activities include:- Design engineering and construction related services- Sidewalk maintenance
• Roadway projects must be on federally classified routes that are Minor Collectors or above, or a Farm-to-Market route.
• Applications must include a completed STBG Project Submittal Form. Incomplete applications will notbe considered for funding.
• Project sponsors will participate in the Iowa DOT’s federal-aid swap for all eligible road and bridgeprojects.
Submitted STBG applications are reviewed at the Technical Committee meeting. As part of the application process, project sponsors are asked to provide information about their project, and each sponsor is given the chance to present their project at the meeting. The Technical Committee then prioritizes projects for funding by considering project benefits, jurisdictional need, and the time and funding constraints of the program. The Technical Committee can utilize the Funding Equity Guideline, as needed, to help develop the draft.
2045 LONG-RANGE TRANSPORTATION PLAN | 208
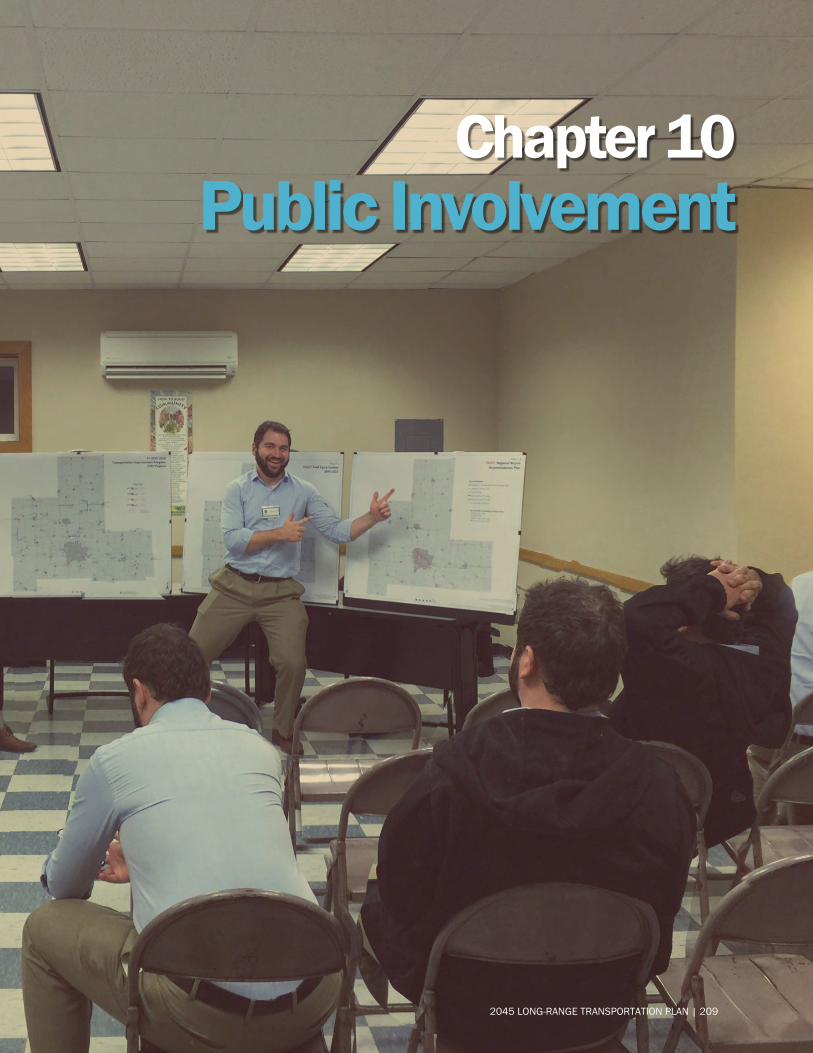
Chapter 10
Public Involvement
2045 LONG-RANGE TRANSPORTATION PLAN | 209
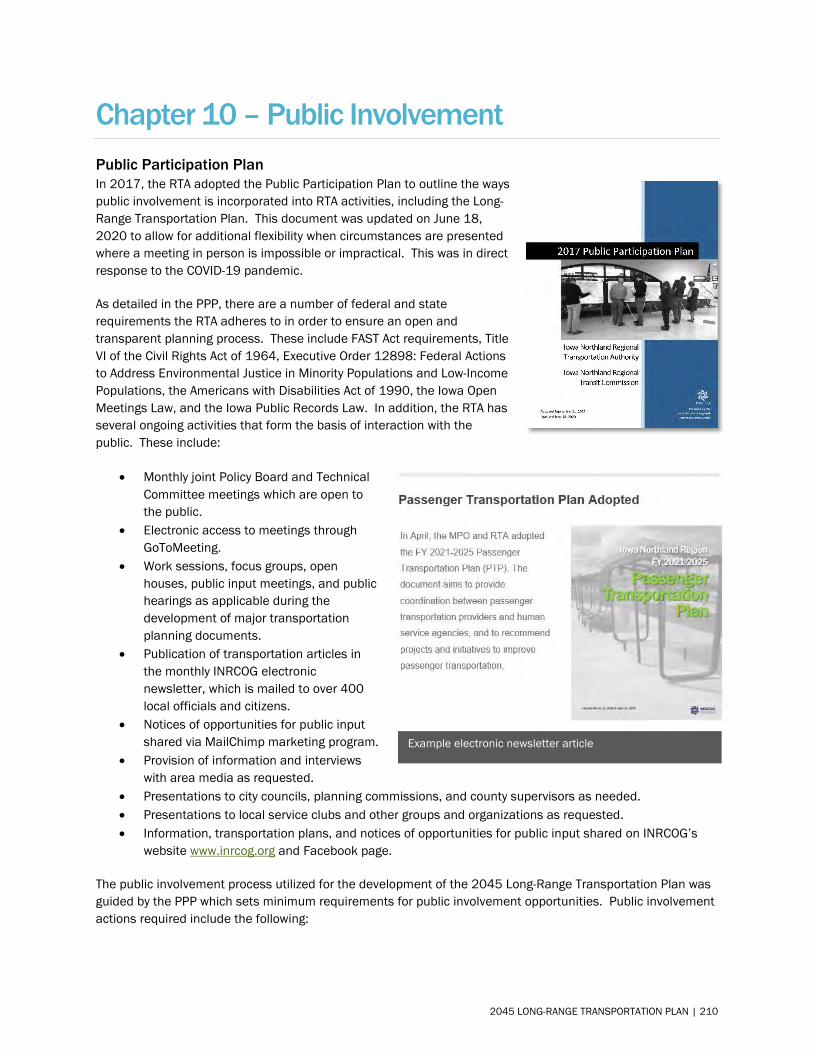
Chapter 10 – Public Involvement Public Participation Plan In 2017, the RTA adopted the Public Participation Plan to outline the ways public involvement is incorporated into RTA activities, including the Long-Range Transportation Plan. This document was updated on June 18, 2020 to allow for additional flexibility when circumstances are presented where a meeting in person is impossible or impractical. This was in direct response to the COVID-19 pandemic.
As detailed in the PPP, there are a number of federal and state requirements the RTA adheres to in order to ensure an open and transparent planning process. These include FAST Act requirements, Title VI of the Civil Rights Act of 1964, Executive Order 12898: Federal Actions to Address Environmental Justice in Minority Populations and Low-Income Populations, the Americans with Disabilities Act of 1990, the Iowa Open Meetings Law, and the Iowa Public Records Law. In addition, the RTA has several ongoing activities that form the basis of interaction with the public. These include:
• Monthly joint Policy Board and TechnicalCommittee meetings which are open tothe public.
• Electronic access to meetings throughGoToMeeting.
• Work sessions, focus groups, openhouses, public input meetings, and publichearings as applicable during thedevelopment of major transportationplanning documents.
• Publication of transportation articles inthe monthly INRCOG electronicnewsletter, which is mailed to over 400local officials and citizens.
• Notices of opportunities for public inputshared via MailChimp marketing program.
• Provision of information and interviewswith area media as requested.
• Presentations to city councils, planning commissions, and county supervisors as needed.• Presentations to local service clubs and other groups and organizations as requested.• Information, transportation plans, and notices of opportunities for public input shared on INRCOG’s
website www.inrcog.org and Facebook page.
The public involvement process utilized for the development of the 2045 Long-Range Transportation Plan was guided by the PPP which sets minimum requirements for public involvement opportunities. Public involvement actions required include the following:
Example electronic newsletter article
2045 LONG-RANGE TRANSPORTATION PLAN | 210
• Draft LRTP- The draft document will be developed by INRCOG staff with further input from jurisdiction
representatives & the Iowa DOT, & oversight by the Policy Board & Technical Committee.- Input will be sought from individuals, affected public agencies, representatives of public transportation
employees, freight shippers, private providers of transportation, representatives of users of publictransportation, representatives of users of pedestrian walkways & bicycle transportation facilities,representatives of the disabled, providers of freight transportation services, & other interested parties.
- Focus groups will be utilized to represent all pertinent modes of transportation & issues. Focus groupsmay include transit, highway & land use, bicycle & pedestrian, safety & security, & environmentalresources. Focus groups will be charged with identifying issues & potential solutions & reviewing draftchapters.
- The draft document will be made available at the INRCOG Center, on the INRCOG website, & uponrequest.
• Notices & Public Meetings- A minimum of three (3) public input sessions will be held regarding the draft LRTP.- When a circumstance presents itself where a meeting in person is impossible or impractical, the RTA
may conduct a public input meeting by electronic means. The RTA will provide public access to the discussion of the input meeting to the extent
reasonably possible. The public announcement of the meeting, at least one week before the public input meeting,
shall include the time, virtual/electronic place, subject matter of the meeting, & name & phonenumber of the person available to respond to request for information about the meeting.
The place of the input meeting is the place from which the communication originates or wherepublic access is provided to the discussion.
The RTA shall make promptly available to the public, in a place easily accessible to the public,the transcript, electronic recording, or minutes of the discussion & will include a statementexplaining why a public input meeting in person was impossible or impractical.
- Should in person meetings be held, at least one (1) public input session will be held in an area identifiedas being a low-income or minority neighborhood.
- All in person meetings will be held in accessible facilities.- Notices for public input sessions will be advertised through local media sources. Notices may be posted
at governmental offices, public libraries, post offices, on transit buses, at the INRCOG Center, & on theINRCOG website & Facebook page. Notices may also be sent to organizations serving traditionallyunderserved populations.
- Any person with sight, reading, or language barriers can contact the RTA (minimum 48 hours prior to asession) & arrangements will be made for accommodation.
• Public Comment Period- Written & oral comments will be solicited during the public input sessions. The public will also have at
least a 15-day comment period following the final public input session to submit comments via letter,email, phone, or in person.
- A public hearing will be held at a regularly scheduled RTA meeting following the public input sessions tosummarize public comments & responses. A notice of the public hearing will be published no more thantwenty (20) days & no less than four (4) days before the date of the hearing.
• Final LRTP- Following the public hearing, the RTA will adopt a final LRTP, including a summary of comments &
responses.- The final LRTP will be submitted to the Iowa DOT, FHWA, & FTA.- The final LRTP will be available on the INRCOG website, at the INRCOG Center, & upon request.- The public participation process associated with the LRTP will be evaluated & updated as needed.
• Revisions- The LRTP may be revised between full document updates to reflect current project information.- Other amendments to the LRTP will be made as needed.- Amendments will require a public hearing to be held at a regularly scheduled RTA meeting. A notice of
the public hearing will be published no more than twenty (20) days & no less than four (4) days beforethe date of the hearing.
2045 LONG-RANGE TRANSPORTATION PLAN | 211
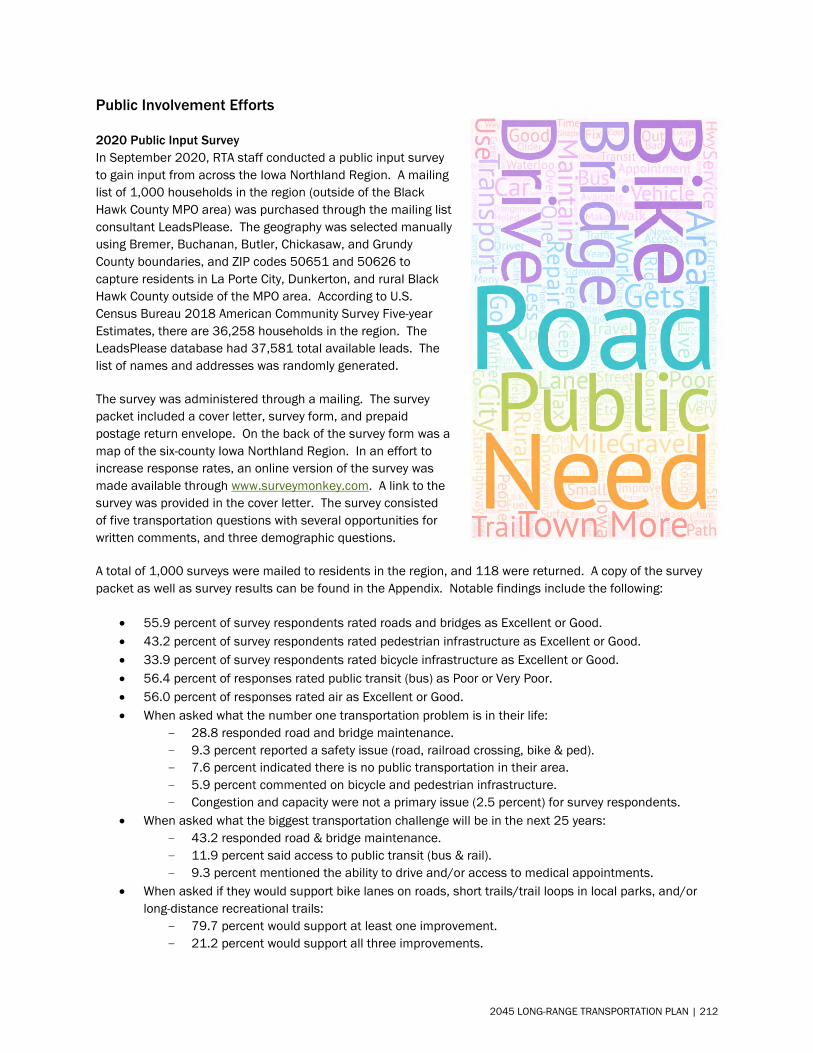
Public Involvement Efforts
2020 Public Input Survey In September 2020, RTA staff conducted a public input survey to gain input from across the Iowa Northland Region. A mailing list of 1,000 households in the region (outside of the Black Hawk County MPO area) was purchased through the mailing list consultant LeadsPlease. The geography was selected manually using Bremer, Buchanan, Butler, Chickasaw, and Grundy County boundaries, and ZIP codes 50651 and 50626 to capture residents in La Porte City, Dunkerton, and rural Black Hawk County outside of the MPO area. According to U.S. Census Bureau 2018 American Community Survey Five-year Estimates, there are 36,258 households in the region. The LeadsPlease database had 37,581 total available leads. The list of names and addresses was randomly generated.
The survey was administered through a mailing. The survey packet included a cover letter, survey form, and prepaid postage return envelope. On the back of the survey form was a map of the six-county Iowa Northland Region. In an effort to increase response rates, an online version of the survey was made available through www.surveymonkey.com. A link to the survey was provided in the cover letter. The survey consisted of five transportation questions with several opportunities for written comments, and three demographic questions.
A total of 1,000 surveys were mailed to residents in the region, and 118 were returned. A copy of the survey packet as well as survey results can be found in the Appendix. Notable findings include the following:
• 55.9 percent of survey respondents rated roads and bridges as Excellent or Good.• 43.2 percent of survey respondents rated pedestrian infrastructure as Excellent or Good.• 33.9 percent of survey respondents rated bicycle infrastructure as Excellent or Good.• 56.4 percent of responses rated public transit (bus) as Poor or Very Poor.• 56.0 percent of responses rated air as Excellent or Good.• When asked what the number one transportation problem is in their life:
- 28.8 responded road and bridge maintenance.- 9.3 percent reported a safety issue (road, railroad crossing, bike & ped).- 7.6 percent indicated there is no public transportation in their area.- 5.9 percent commented on bicycle and pedestrian infrastructure.- Congestion and capacity were not a primary issue (2.5 percent) for survey respondents.
• When asked what the biggest transportation challenge will be in the next 25 years:- 43.2 responded road & bridge maintenance.- 11.9 percent said access to public transit (bus & rail).- 9.3 percent mentioned the ability to drive and/or access to medical appointments.
• When asked if they would support bike lanes on roads, short trails/trail loops in local parks, and/orlong-distance recreational trails:
- 79.7 percent would support at least one improvement.- 21.2 percent would support all three improvements.
2045 LONG-RANGE TRANSPORTATION PLAN | 212
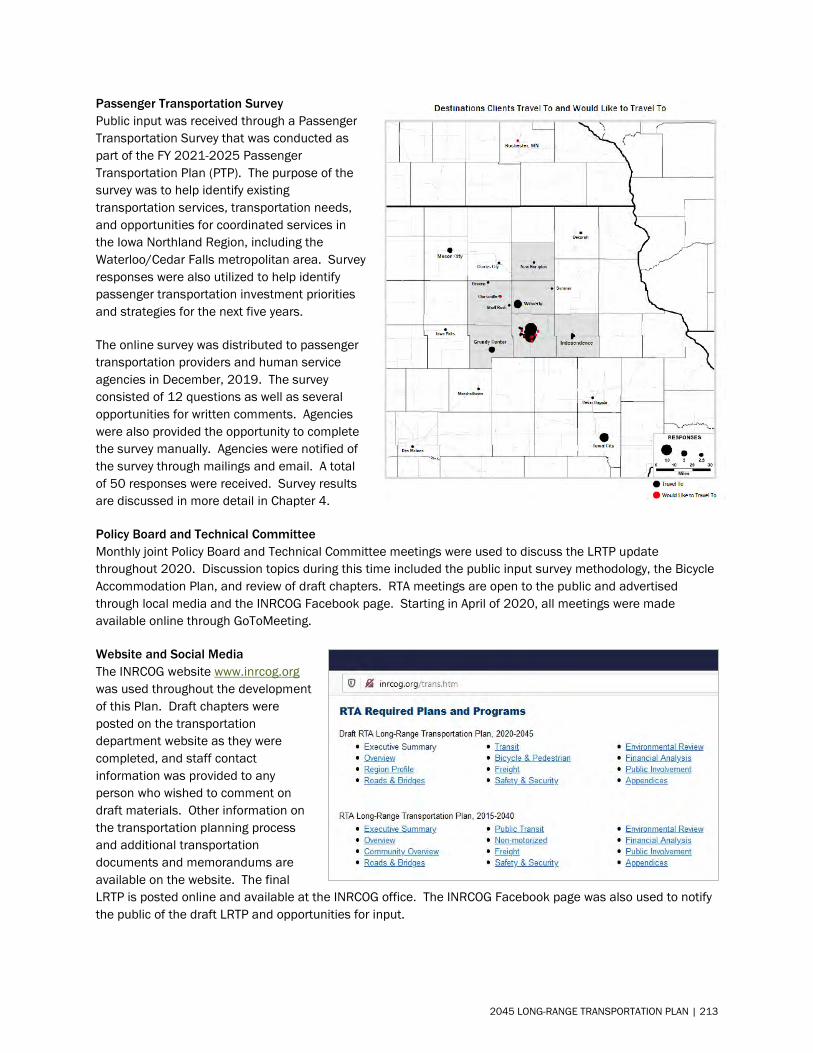
Passenger Transportation Survey Public input was received through a Passenger Transportation Survey that was conducted as part of the FY 2021-2025 Passenger Transportation Plan (PTP). The purpose of the survey was to help identify existing transportation services, transportation needs, and opportunities for coordinated services in the Iowa Northland Region, including the Waterloo/Cedar Falls metropolitan area. Survey responses were also utilized to help identify passenger transportation investment priorities and strategies for the next five years.
The online survey was distributed to passenger transportation providers and human service agencies in December, 2019. The survey consisted of 12 questions as well as several opportunities for written comments. Agencies were also provided the opportunity to complete the survey manually. Agencies were notified of the survey through mailings and email. A total of 50 responses were received. Survey results are discussed in more detail in Chapter 4.
Policy Board and Technical Committee Monthly joint Policy Board and Technical Committee meetings were used to discuss the LRTP update throughout 2020. Discussion topics during this time included the public input survey methodology, the Bicycle Accommodation Plan, and review of draft chapters. RTA meetings are open to the public and advertised through local media and the INRCOG Facebook page. Starting in April of 2020, all meetings were made available online through GoToMeeting.
Website and Social Media The INRCOG website www.inrcog.org was used throughout the development of this Plan. Draft chapters were posted on the transportation department website as they were completed, and staff contact information was provided to any person who wished to comment on draft materials. Other information on the transportation planning process and additional transportation documents and memorandums are available on the website. The final LRTP is posted online and available at the INRCOG office. The INRCOG Facebook page was also used to notify the public of the draft LRTP and opportunities for input.
2045 LONG-RANGE TRANSPORTATION PLAN | 213
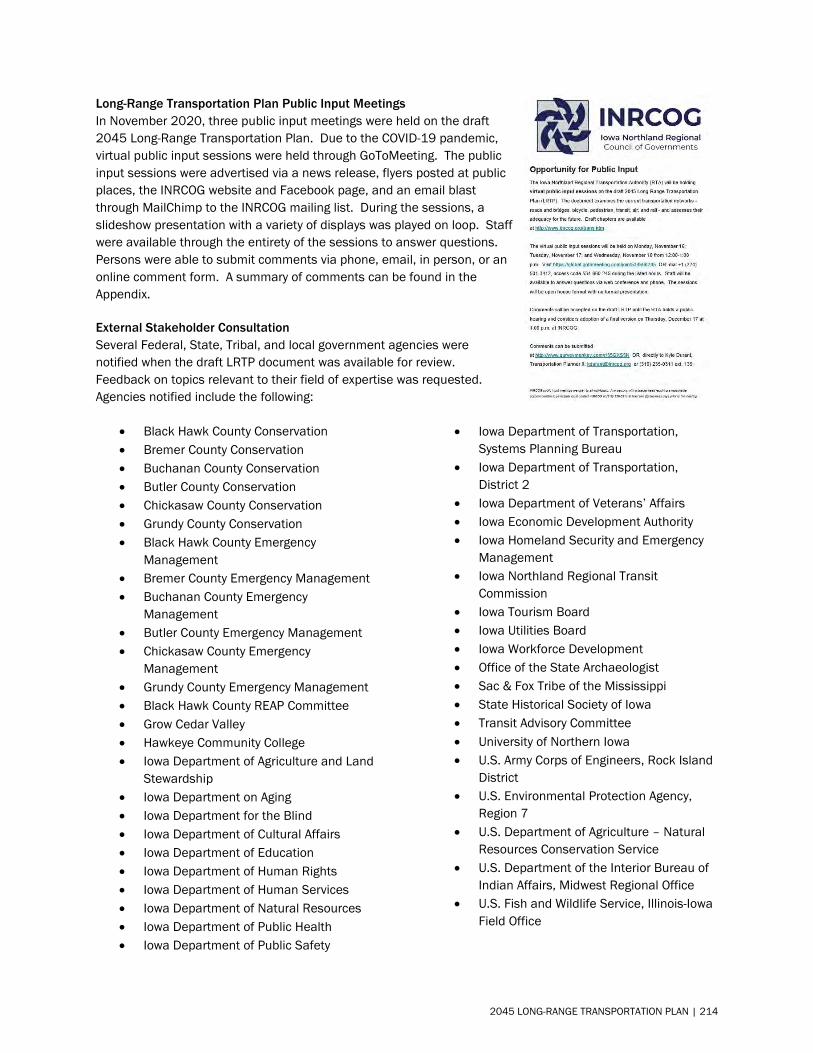
Long-Range Transportation Plan Public Input Meetings In November 2020, three public input meetings were held on the draft 2045 Long-Range Transportation Plan. Due to the COVID-19 pandemic, virtual public input sessions were held through GoToMeeting. The public input sessions were advertised via a news release, flyers posted at public places, the INRCOG website and Facebook page, and an email blast through MailChimp to the INRCOG mailing list. During the sessions, a slideshow presentation with a variety of displays was played on loop. Staff were available through the entirety of the sessions to answer questions. Persons were able to submit comments via phone, email, in person, or an online comment form. A summary of comments can be found in the Appendix.
External Stakeholder Consultation Several Federal, State, Tribal, and local government agencies were notified when the draft LRTP document was available for review. Feedback on topics relevant to their field of expertise was requested. Agencies notified include the following:
• Black Hawk County Conservation • Bremer County Conservation • Buchanan County Conservation • Butler County Conservation • Chickasaw County Conservation • Grundy County Conservation • Black Hawk County Emergency
Management • Bremer County Emergency Management • Buchanan County Emergency
Management • Butler County Emergency Management • Chickasaw County Emergency
Management • Grundy County Emergency Management • Black Hawk County REAP Committee • Grow Cedar Valley • Hawkeye Community College • Iowa Department of Agriculture and Land
Stewardship • Iowa Department on Aging • Iowa Department for the Blind • Iowa Department of Cultural Affairs • Iowa Department of Education • Iowa Department of Human Rights • Iowa Department of Human Services • Iowa Department of Natural Resources • Iowa Department of Public Health • Iowa Department of Public Safety
• Iowa Department of Transportation, Systems Planning Bureau
• Iowa Department of Transportation, District 2
• Iowa Department of Veterans’ Affairs • Iowa Economic Development Authority • Iowa Homeland Security and Emergency
Management • Iowa Northland Regional Transit
Commission • Iowa Tourism Board • Iowa Utilities Board • Iowa Workforce Development • Office of the State Archaeologist • Sac & Fox Tribe of the Mississippi • State Historical Society of Iowa • Transit Advisory Committee • University of Northern Iowa • U.S. Army Corps of Engineers, Rock Island
District • U.S. Environmental Protection Agency,
Region 7 • U.S. Department of Agriculture – Natural
Resources Conservation Service • U.S. Department of the Interior Bureau of
Indian Affairs, Midwest Regional Office • U.S. Fish and Wildlife Service, Illinois-Iowa
Field Office
2045 LONG-RANGE TRANSPORTATION PLAN | 214

Appendices
2045 LONG-RANGE TRANSPORTATION PLAN | 215
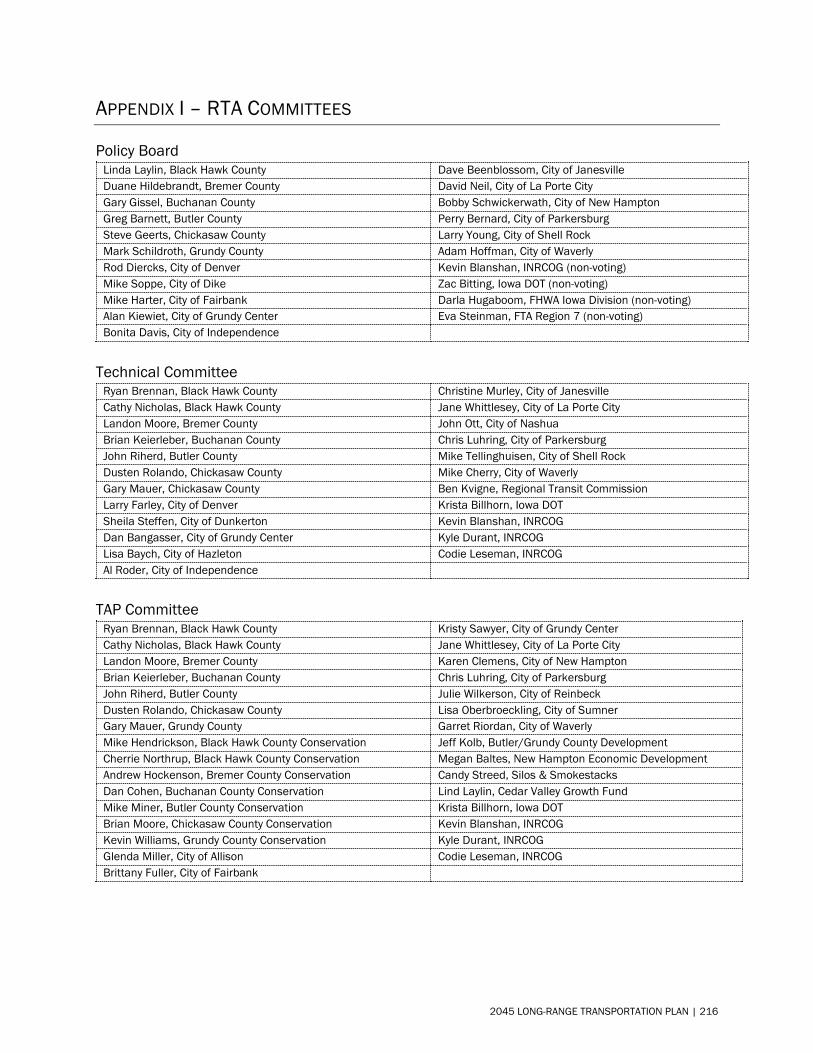
APPENDIX I – RTA COMMITTEES
Policy Board Linda Laylin, Black Hawk County Dave Beenblossom, City of Janesville Duane Hildebrandt, Bremer County David Neil, City of La Porte City Gary Gissel, Buchanan County Bobby Schwickerwath, City of New Hampton Greg Barnett, Butler County Perry Bernard, City of Parkersburg Steve Geerts, Chickasaw County Larry Young, City of Shell Rock Mark Schildroth, Grundy County Adam Hoffman, City of Waverly Rod Diercks, City of Denver Kevin Blanshan, INRCOG (non-voting) Mike Soppe, City of Dike Zac Bitting, Iowa DOT (non-voting) Mike Harter, City of Fairbank Darla Hugaboom, FHWA Iowa Division (non-voting) Alan Kiewiet, City of Grundy Center Eva Steinman, FTA Region 7 (non-voting) Bonita Davis, City of Independence
Technical Committee Ryan Brennan, Black Hawk County Christine Murley, City of Janesville Cathy Nicholas, Black Hawk County Jane Whittlesey, City of La Porte City Landon Moore, Bremer County John Ott, City of Nashua Brian Keierleber, Buchanan County Chris Luhring, City of Parkersburg John Riherd, Butler County Mike Tellinghuisen, City of Shell Rock Dusten Rolando, Chickasaw County Mike Cherry, City of Waverly Gary Mauer, Chickasaw County Ben Kvigne, Regional Transit Commission Larry Farley, City of Denver Krista Billhorn, Iowa DOT Sheila Steffen, City of Dunkerton Kevin Blanshan, INRCOG Dan Bangasser, City of Grundy Center Kyle Durant, INRCOG Lisa Baych, City of Hazleton Codie Leseman, INRCOG Al Roder, City of Independence
TAP Committee Ryan Brennan, Black Hawk County Kristy Sawyer, City of Grundy Center Cathy Nicholas, Black Hawk County Jane Whittlesey, City of La Porte City Landon Moore, Bremer County Karen Clemens, City of New Hampton Brian Keierleber, Buchanan County Chris Luhring, City of Parkersburg John Riherd, Butler County Julie Wilkerson, City of Reinbeck Dusten Rolando, Chickasaw County Lisa Oberbroeckling, City of Sumner Gary Mauer, Grundy County Garret Riordan, City of Waverly Mike Hendrickson, Black Hawk County Conservation Jeff Kolb, Butler/Grundy County Development Cherrie Northrup, Black Hawk County Conservation Megan Baltes, New Hampton Economic Development Andrew Hockenson, Bremer County Conservation Candy Streed, Silos & Smokestacks Dan Cohen, Buchanan County Conservation Lind Laylin, Cedar Valley Growth Fund Mike Miner, Butler County Conservation Krista Billhorn, Iowa DOT Brian Moore, Chickasaw County Conservation Kevin Blanshan, INRCOG Kevin Williams, Grundy County Conservation Kyle Durant, INRCOG Glenda Miller, City of Allison Codie Leseman, INRCOG Brittany Fuller, City of Fairbank
2045 LONG-RANGE TRANSPORTATION PLAN | 216
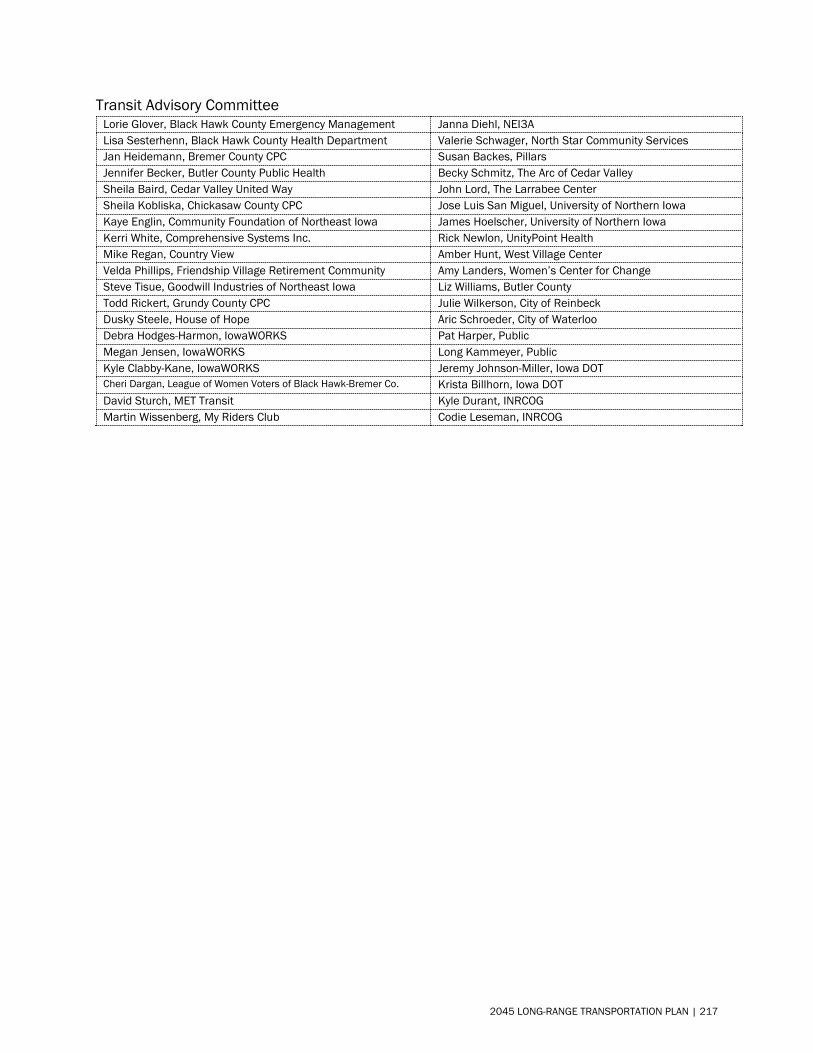
Transit Advisory Committee Lorie Glover, Black Hawk County Emergency Management Janna Diehl, NEI3A Lisa Sesterhenn, Black Hawk County Health Department Valerie Schwager, North Star Community Services Jan Heidemann, Bremer County CPC Susan Backes, Pillars Jennifer Becker, Butler County Public Health Becky Schmitz, The Arc of Cedar Valley Sheila Baird, Cedar Valley United Way John Lord, The Larrabee Center Sheila Kobliska, Chickasaw County CPC Jose Luis San Miguel, University of Northern Iowa Kaye Englin, Community Foundation of Northeast Iowa James Hoelscher, University of Northern Iowa Kerri White, Comprehensive Systems Inc. Rick Newlon, UnityPoint Health Mike Regan, Country View Amber Hunt, West Village Center Velda Phillips, Friendship Village Retirement Community Amy Landers, Women’s Center for Change Steve Tisue, Goodwill Industries of Northeast Iowa Liz Williams, Butler County Todd Rickert, Grundy County CPC Julie Wilkerson, City of Reinbeck Dusky Steele, House of Hope Aric Schroeder, City of Waterloo Debra Hodges-Harmon, IowaWORKS Pat Harper, Public Megan Jensen, IowaWORKS Long Kammeyer, Public Kyle Clabby-Kane, IowaWORKS Jeremy Johnson-Miller, Iowa DOT Cheri Dargan, League of Women Voters of Black Hawk-Bremer Co. Krista Billhorn, Iowa DOT David Sturch, MET Transit Kyle Durant, INRCOG Martin Wissenberg, My Riders Club Codie Leseman, INRCOG
2045 LONG-RANGE TRANSPORTATION PLAN | 217
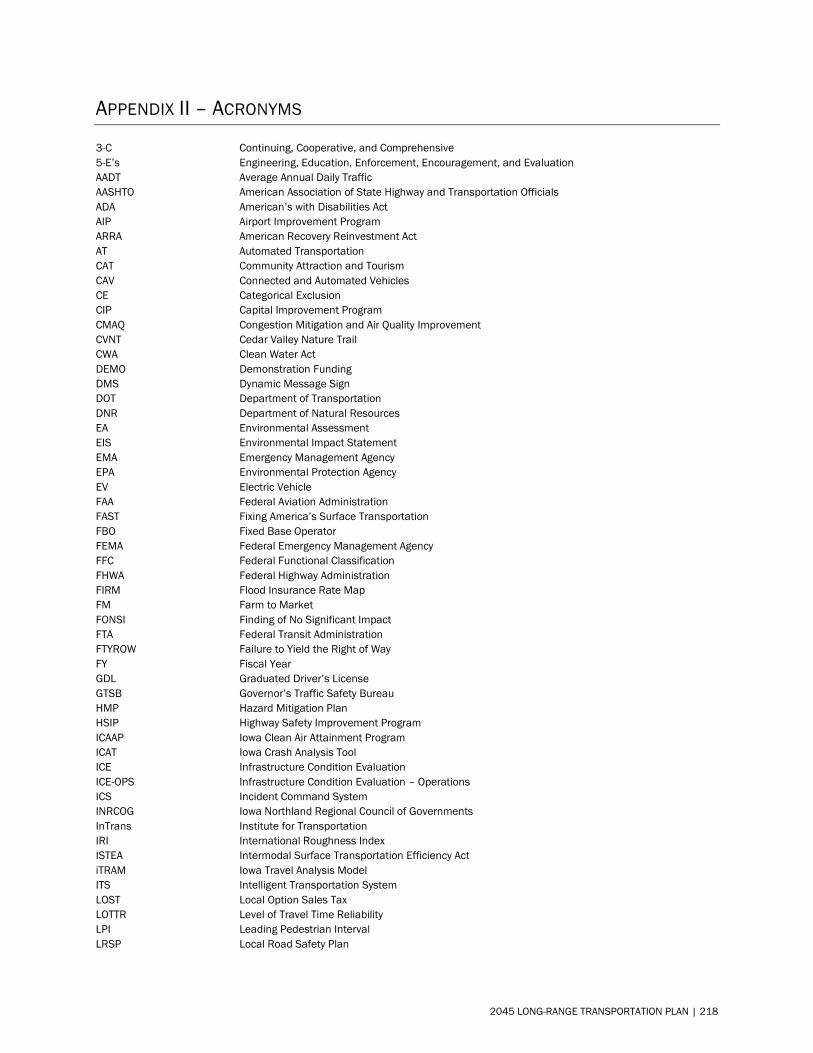
APPENDIX II – ACRONYMS
3-C Continuing, Cooperative, and Comprehensive 5-E’s Engineering, Education, Enforcement, Encouragement, and Evaluation AADT Average Annual Daily Traffic AASHTO American Association of State Highway and Transportation Officials ADA American’s with Disabilities Act AIP Airport Improvement Program ARRA American Recovery Reinvestment Act AT Automated Transportation CAT Community Attraction and Tourism CAV Connected and Automated Vehicles CE Categorical Exclusion CIP Capital Improvement Program CMAQ Congestion Mitigation and Air Quality Improvement CVNT Cedar Valley Nature Trail CWA Clean Water Act DEMO Demonstration Funding DMS Dynamic Message Sign DOT Department of Transportation DNR Department of Natural Resources EA Environmental Assessment EIS Environmental Impact Statement EMA Emergency Management Agency EPA Environmental Protection Agency EV Electric Vehicle FAA Federal Aviation Administration FAST Fixing America’s Surface Transportation FBO Fixed Base Operator FEMA Federal Emergency Management Agency FFC Federal Functional Classification FHWA Federal Highway Administration FIRM Flood Insurance Rate Map FM Farm to Market FONSI Finding of No Significant Impact FTA Federal Transit Administration FTYROW Failure to Yield the Right of Way FY Fiscal Year GDL Graduated Driver’s License GTSB Governor’s Traffic Safety Bureau HMP Hazard Mitigation Plan HSIP Highway Safety Improvement Program ICAAP Iowa Clean Air Attainment Program ICAT Iowa Crash Analysis Tool ICE Infrastructure Condition Evaluation ICE-OPS Infrastructure Condition Evaluation – Operations ICS Incident Command System INRCOG Iowa Northland Regional Council of Governments InTrans Institute for Transportation IRI International Roughness Index ISTEA Intermodal Surface Transportation Efficiency Act iTRAM Iowa Travel Analysis Model ITS Intelligent Transportation System LOST Local Option Sales Tax LOTTR Level of Travel Time Reliability LPI Leading Pedestrian Interval LRSP Local Road Safety Plan
2045 LONG-RANGE TRANSPORTATION PLAN | 218
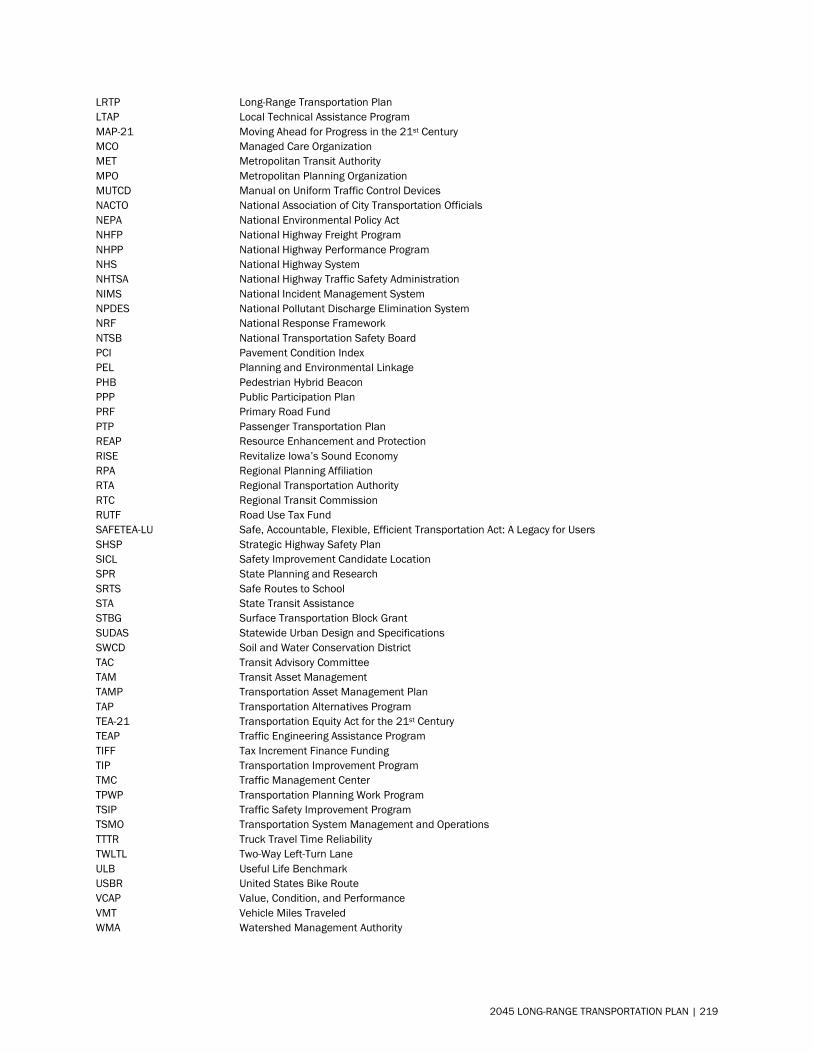
LRTP Long-Range Transportation Plan LTAP Local Technical Assistance Program MAP-21 Moving Ahead for Progress in the 21st Century MCO Managed Care Organization MET Metropolitan Transit Authority MPO Metropolitan Planning Organization MUTCD Manual on Uniform Traffic Control Devices NACTO National Association of City Transportation Officials NEPA National Environmental Policy Act NHFP National Highway Freight Program NHPP National Highway Performance Program NHS National Highway System NHTSA National Highway Traffic Safety Administration NIMS National Incident Management System NPDES National Pollutant Discharge Elimination System NRF National Response Framework NTSB National Transportation Safety Board PCI Pavement Condition Index PEL Planning and Environmental Linkage PHB Pedestrian Hybrid Beacon PPP Public Participation Plan PRF Primary Road Fund PTP Passenger Transportation Plan REAP Resource Enhancement and Protection RISE Revitalize Iowa’s Sound Economy RPA Regional Planning Affiliation RTA Regional Transportation Authority RTC Regional Transit Commission RUTF Road Use Tax Fund SAFETEA-LU Safe, Accountable, Flexible, Efficient Transportation Act: A Legacy for Users SHSP Strategic Highway Safety Plan SICL Safety Improvement Candidate Location SPR State Planning and Research SRTS Safe Routes to School STA State Transit Assistance STBG Surface Transportation Block Grant SUDAS Statewide Urban Design and Specifications SWCD Soil and Water Conservation District TAC Transit Advisory Committee TAM Transit Asset Management TAMP Transportation Asset Management Plan TAP Transportation Alternatives Program TEA-21 Transportation Equity Act for the 21st Century TEAP Traffic Engineering Assistance Program TIFF Tax Increment Finance Funding TIP Transportation Improvement Program TMC Traffic Management Center TPWP Transportation Planning Work Program TSIP Traffic Safety Improvement Program TSMO Transportation System Management and Operations TTTR Truck Travel Time Reliability TWLTL Two-Way Left-Turn Lane ULB Useful Life Benchmark USBR United States Bike Route VCAP Value, Condition, and Performance VMT Vehicle Miles Traveled WMA Watershed Management Authority
2045 LONG-RANGE TRANSPORTATION PLAN | 219
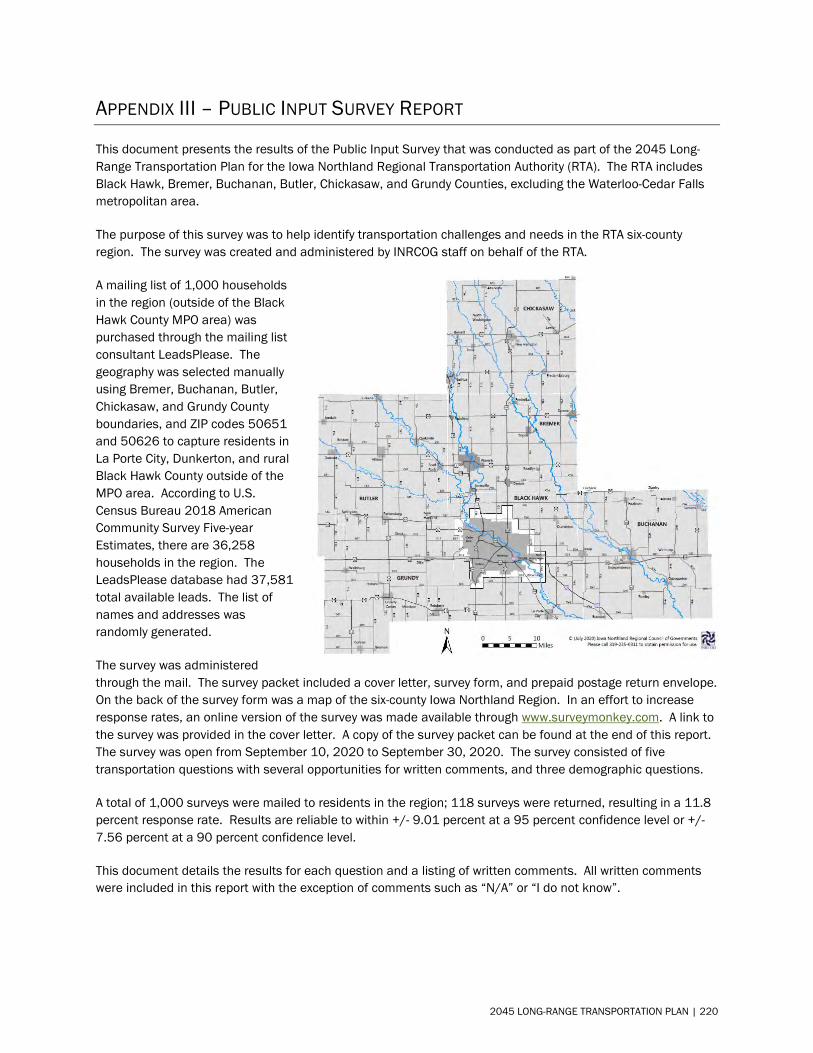
APPENDIX III – PUBLIC INPUT SURVEY REPORT
This document presents the results of the Public Input Survey that was conducted as part of the 2045 Long-Range Transportation Plan for the Iowa Northland Regional Transportation Authority (RTA). The RTA includes Black Hawk, Bremer, Buchanan, Butler, Chickasaw, and Grundy Counties, excluding the Waterloo-Cedar Falls metropolitan area.
The purpose of this survey was to help identify transportation challenges and needs in the RTA six-county region. The survey was created and administered by INRCOG staff on behalf of the RTA.
A mailing list of 1,000 households in the region (outside of the Black Hawk County MPO area) was purchased through the mailing list consultant LeadsPlease. The geography was selected manually using Bremer, Buchanan, Butler, Chickasaw, and Grundy County boundaries, and ZIP codes 50651 and 50626 to capture residents in La Porte City, Dunkerton, and rural Black Hawk County outside of the MPO area. According to U.S. Census Bureau 2018 American Community Survey Five-year Estimates, there are 36,258 households in the region. The LeadsPlease database had 37,581 total available leads. The list of names and addresses was randomly generated.
The survey was administered through the mail. The survey packet included a cover letter, survey form, and prepaid postage return envelope. On the back of the survey form was a map of the six-county Iowa Northland Region. In an effort to increase response rates, an online version of the survey was made available through www.surveymonkey.com. A link to the survey was provided in the cover letter. A copy of the survey packet can be found at the end of this report. The survey was open from September 10, 2020 to September 30, 2020. The survey consisted of five transportation questions with several opportunities for written comments, and three demographic questions.
A total of 1,000 surveys were mailed to residents in the region; 118 surveys were returned, resulting in a 11.8 percent response rate. Results are reliable to within +/- 9.01 percent at a 95 percent confidence level or +/- 7.56 percent at a 90 percent confidence level.
This document details the results for each question and a listing of written comments. All written comments were included in this report with the exception of comments such as “N/A” or “I do not know”.
2045 LONG-RANGE TRANSPORTATION PLAN | 220
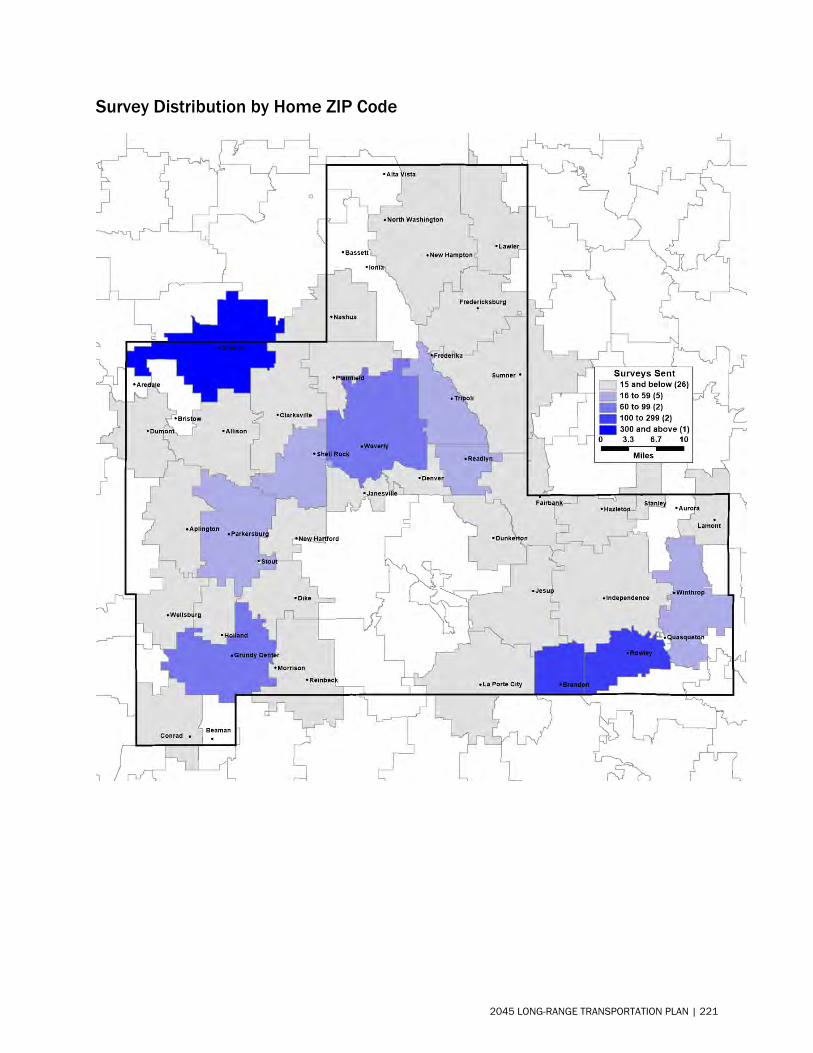
Survey Distribution by Home ZIP Code
2045 LONG-RANGE TRANSPORTATION PLAN | 221
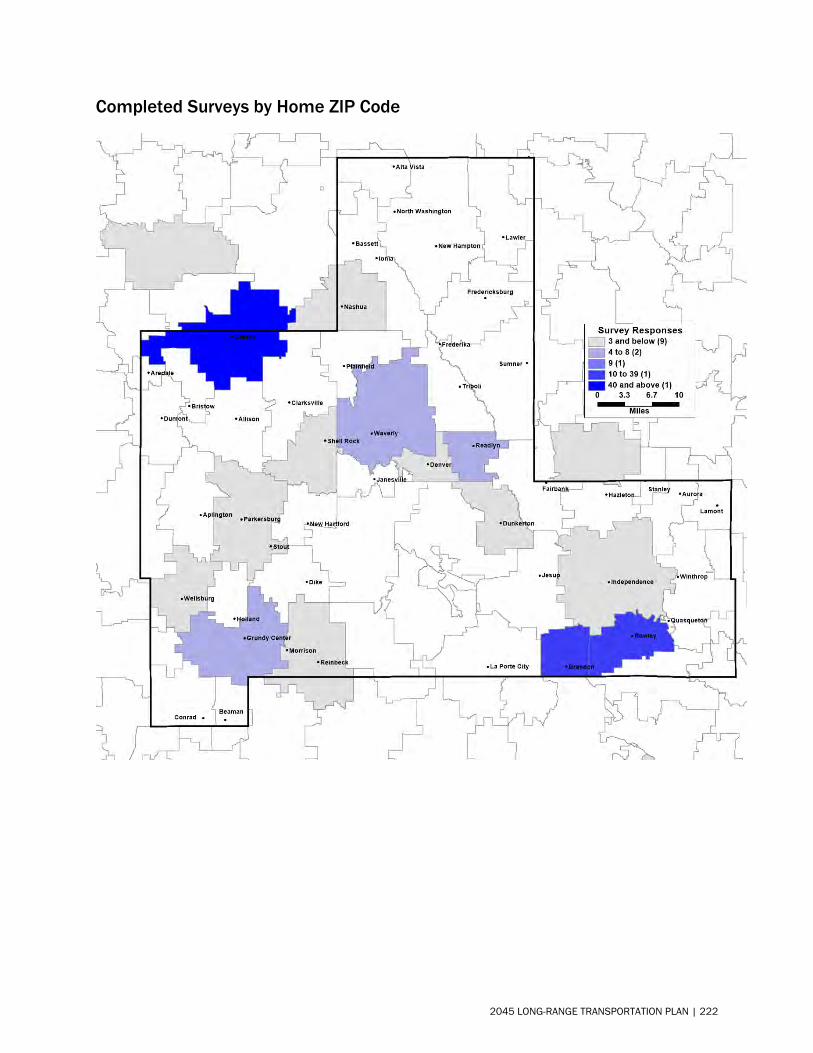
Completed Surveys by Home ZIP Code
2045 LONG-RANGE TRANSPORTATION PLAN | 222
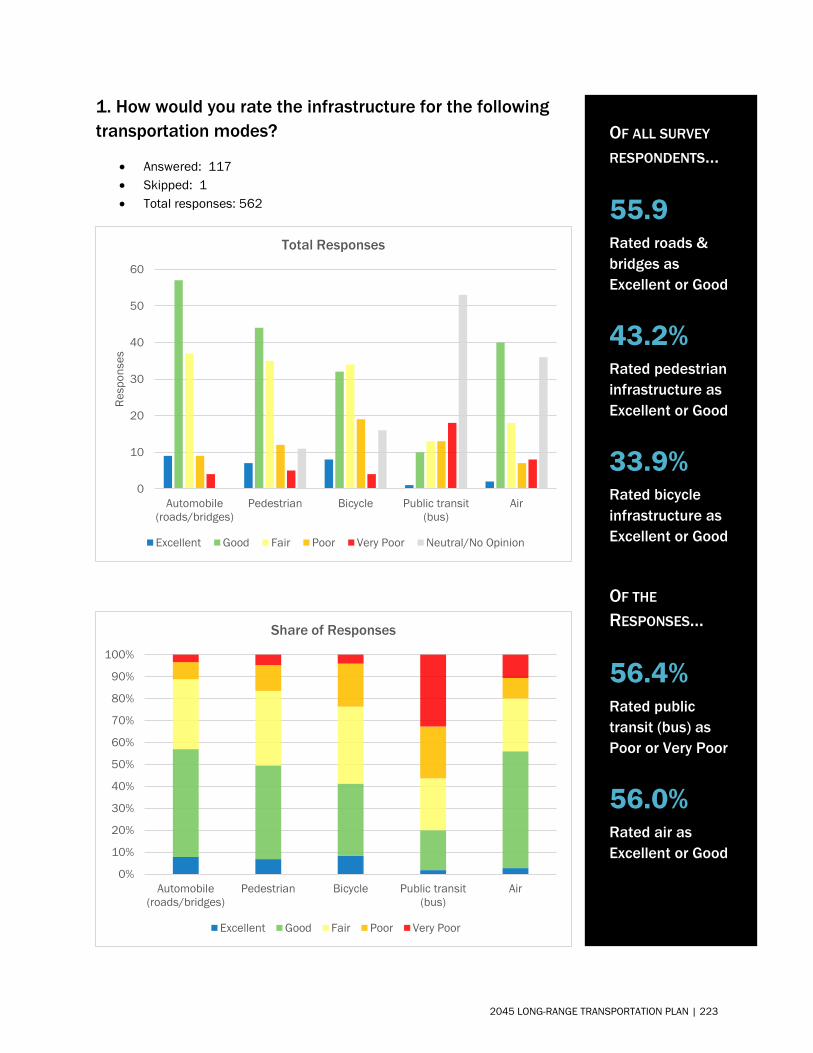
1. How would you rate the infrastructure for the followingtransportation modes?
• Answered: 117• Skipped: 1• Total responses: 562
0
10
20
30
40
50
60
Automobile(roads/bridges)
Pedestrian Bicycle Public transit(bus)
Air
Resp
onse
s
Total Responses
Excellent Good Fair Poor Very Poor Neutral/No Opinion
0%
10%
20%
30%
40%
50%
60%
70%
80%
90%
100%
Automobile(roads/bridges)
Pedestrian Bicycle Public transit(bus)
Air
Share of Responses
Excellent Good Fair Poor Very Poor
OF ALL SURVEY
RESPONDENTS…
55.9 Rated roads & bridges as Excellent or Good
43.2% Rated pedestrian infrastructure as Excellent or Good
33.9% Rated bicycle infrastructure as Excellent or Good
OF THE
RESPONSES…
56.4% Rated public transit (bus) as Poor or Very Poor
56.0% Rated air as Excellent or Good
2045 LONG-RANGE TRANSPORTATION PLAN | 223
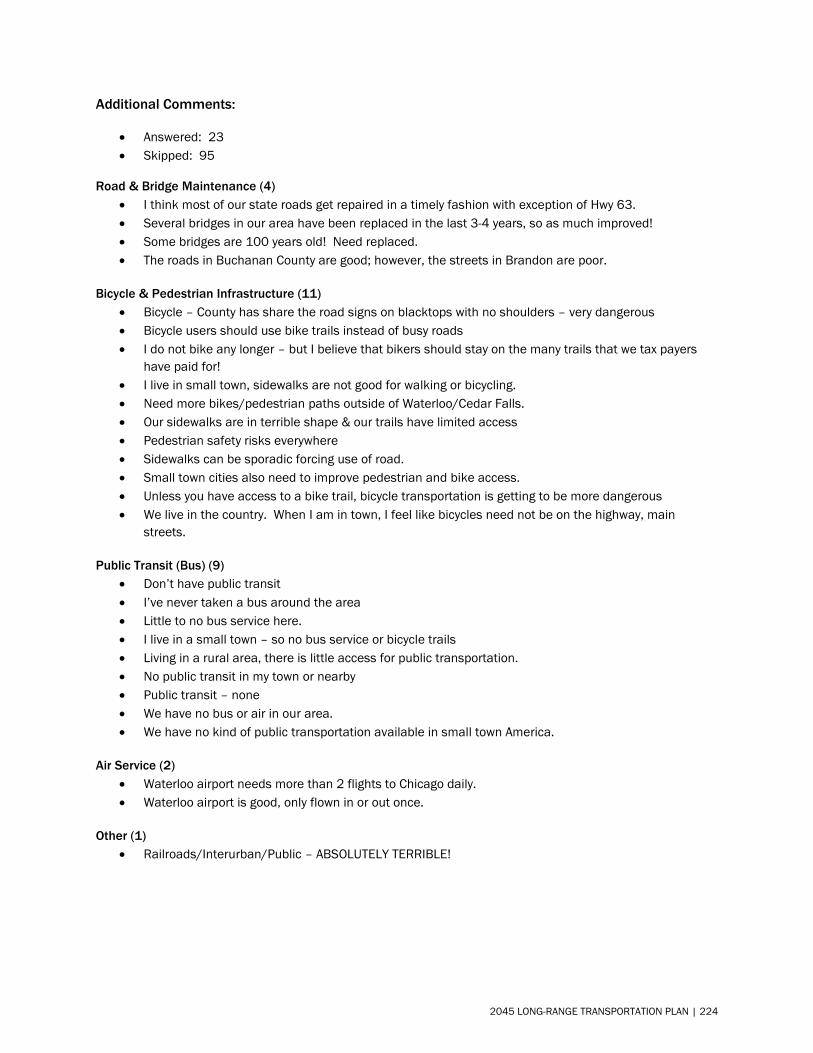
Additional Comments:
• Answered: 23• Skipped: 95
Road & Bridge Maintenance (4) • I think most of our state roads get repaired in a timely fashion with exception of Hwy 63.• Several bridges in our area have been replaced in the last 3-4 years, so as much improved!• Some bridges are 100 years old! Need replaced.• The roads in Buchanan County are good; however, the streets in Brandon are poor.
Bicycle & Pedestrian Infrastructure (11) • Bicycle – County has share the road signs on blacktops with no shoulders – very dangerous• Bicycle users should use bike trails instead of busy roads• I do not bike any longer – but I believe that bikers should stay on the many trails that we tax payers
have paid for!• I live in small town, sidewalks are not good for walking or bicycling.• Need more bikes/pedestrian paths outside of Waterloo/Cedar Falls.• Our sidewalks are in terrible shape & our trails have limited access• Pedestrian safety risks everywhere• Sidewalks can be sporadic forcing use of road.• Small town cities also need to improve pedestrian and bike access.• Unless you have access to a bike trail, bicycle transportation is getting to be more dangerous• We live in the country. When I am in town, I feel like bicycles need not be on the highway, main
streets.
Public Transit (Bus) (9) • Don’t have public transit• I’ve never taken a bus around the area• Little to no bus service here.• I live in a small town – so no bus service or bicycle trails• Living in a rural area, there is little access for public transportation.• No public transit in my town or nearby• Public transit – none• We have no bus or air in our area.• We have no kind of public transportation available in small town America.
Air Service (2) • Waterloo airport needs more than 2 flights to Chicago daily.• Waterloo airport is good, only flown in or out once.
Other (1) • Railroads/Interurban/Public – ABSOLUTELY TERRIBLE!
2045 LONG-RANGE TRANSPORTATION PLAN | 224

2. What is the number one transportation problem in yourlife?
• Answered: 89• Skipped: 29
Road & Bridge Maintenance (34) • Bridges• Bumpy roads• County gravel roads poorly maintained turn to mud after rain in winter
leave 4”-6” of snow on roads to turn to slush or ice• Crappy gravel roads why can’t we seal coat some of the more traveled
ones. Like Wisconsin does. Or at least better maintenance.• Embargo bridges.• Gravel road• Gravel roads. Generally well maintained by Buchanan Co. Road Dept –
but sometimes they are overwhelmed. • Hard surface gravel roads like MN.• HWY 3 should be resurfaced like was done on HWY 14. Some of 13 was
done, but it needs to be finished. The bridge on C13 in Greene over theDry Run needs to be fixed.
OF ALL SURVEY
RESPONDENTS…
28.8% Commented on road & bridge maintenance
9.3% Reported a safety issue (road, railroad crossing, bike & ped)
7.6% Indicated there is no public transportation in their area
5.9% Commented on bicycle & pedestrian infrastructure
4.2% Mentioned the ability to drive and/or access to medical appointments
2045 LONG-RANGE TRANSPORTATION PLAN | 225
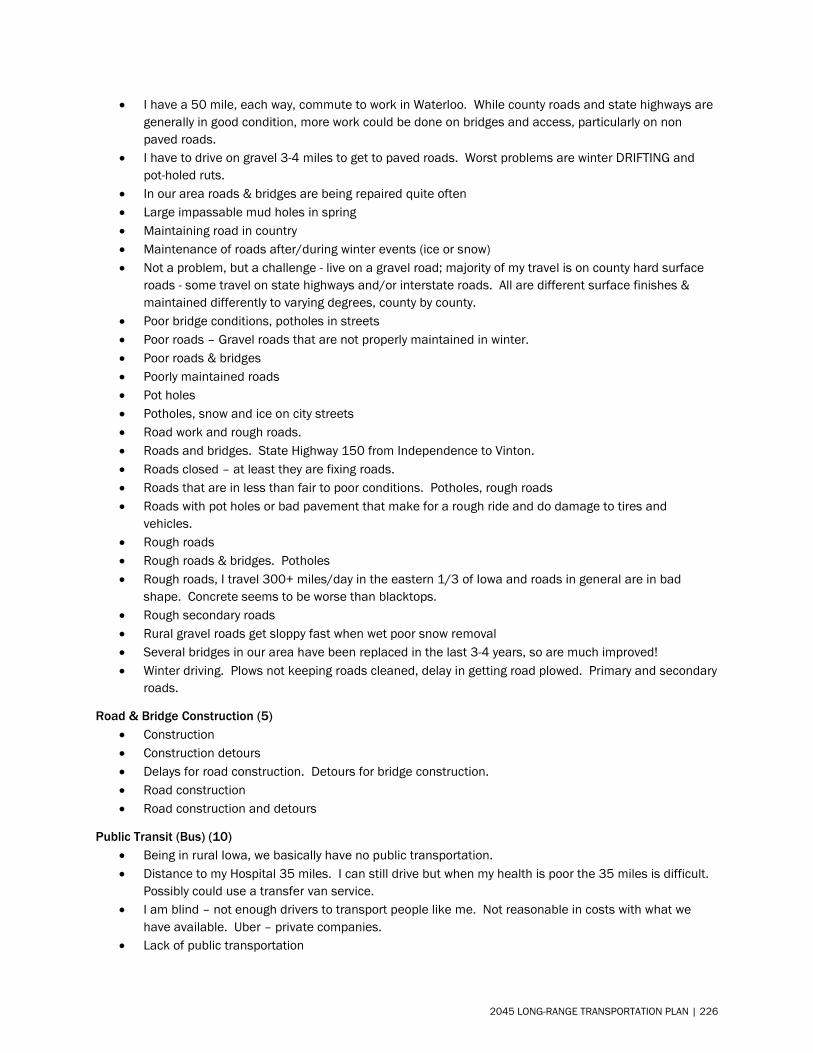
• I have a 50 mile, each way, commute to work in Waterloo. While county roads and state highways are generally in good condition, more work could be done on bridges and access, particularly on non paved roads.
• I have to drive on gravel 3-4 miles to get to paved roads. Worst problems are winter DRIFTING and pot-holed ruts.
• In our area roads & bridges are being repaired quite often • Large impassable mud holes in spring • Maintaining road in country • Maintenance of roads after/during winter events (ice or snow) • Not a problem, but a challenge - live on a gravel road; majority of my travel is on county hard surface
roads - some travel on state highways and/or interstate roads. All are different surface finishes & maintained differently to varying degrees, county by county.
• Poor bridge conditions, potholes in streets • Poor roads – Gravel roads that are not properly maintained in winter. • Poor roads & bridges • Poorly maintained roads • Pot holes • Potholes, snow and ice on city streets • Road work and rough roads. • Roads and bridges. State Highway 150 from Independence to Vinton. • Roads closed – at least they are fixing roads. • Roads that are in less than fair to poor conditions. Potholes, rough roads • Roads with pot holes or bad pavement that make for a rough ride and do damage to tires and
vehicles. • Rough roads • Rough roads & bridges. Potholes • Rough roads, I travel 300+ miles/day in the eastern 1/3 of Iowa and roads in general are in bad
shape. Concrete seems to be worse than blacktops. • Rough secondary roads • Rural gravel roads get sloppy fast when wet poor snow removal • Several bridges in our area have been replaced in the last 3-4 years, so are much improved! • Winter driving. Plows not keeping roads cleaned, delay in getting road plowed. Primary and secondary
roads.
Road & Bridge Construction (5) • Construction • Construction detours • Delays for road construction. Detours for bridge construction. • Road construction • Road construction and detours
Public Transit (Bus) (10) • Being in rural Iowa, we basically have no public transportation. • Distance to my Hospital 35 miles. I can still drive but when my health is poor the 35 miles is difficult.
Possibly could use a transfer van service. • I am blind – not enough drivers to transport people like me. Not reasonable in costs with what we
have available. Uber – private companies. • Lack of public transportation
2045 LONG-RANGE TRANSPORTATION PLAN | 226
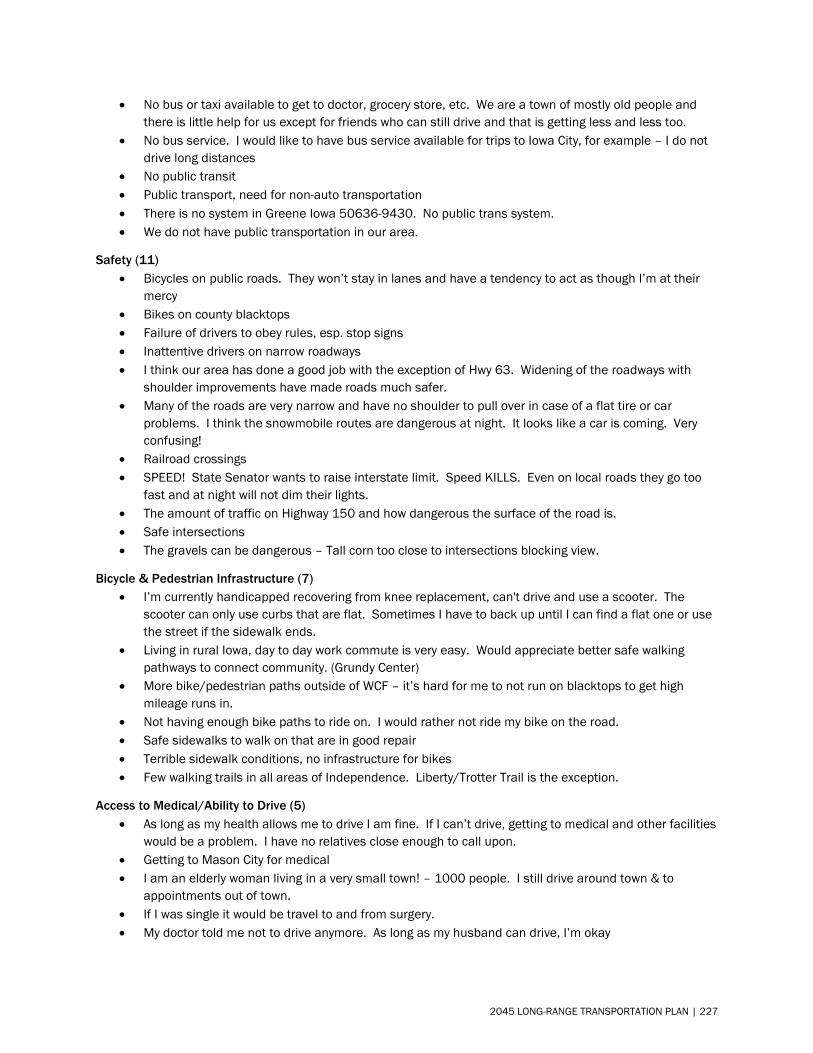
• No bus or taxi available to get to doctor, grocery store, etc. We are a town of mostly old people andthere is little help for us except for friends who can still drive and that is getting less and less too.
• No bus service. I would like to have bus service available for trips to Iowa City, for example – I do notdrive long distances
• No public transit• Public transport, need for non-auto transportation• There is no system in Greene Iowa 50636-9430. No public trans system.• We do not have public transportation in our area.
Safety (11) • Bicycles on public roads. They won’t stay in lanes and have a tendency to act as though I’m at their
mercy• Bikes on county blacktops• Failure of drivers to obey rules, esp. stop signs• Inattentive drivers on narrow roadways• I think our area has done a good job with the exception of Hwy 63. Widening of the roadways with
shoulder improvements have made roads much safer.• Many of the roads are very narrow and have no shoulder to pull over in case of a flat tire or car
problems. I think the snowmobile routes are dangerous at night. It looks like a car is coming. Veryconfusing!
• Railroad crossings• SPEED! State Senator wants to raise interstate limit. Speed KILLS. Even on local roads they go too
fast and at night will not dim their lights.• The amount of traffic on Highway 150 and how dangerous the surface of the road is.• Safe intersections• The gravels can be dangerous – Tall corn too close to intersections blocking view.
Bicycle & Pedestrian Infrastructure (7) • I’m currently handicapped recovering from knee replacement, can't drive and use a scooter. The
scooter can only use curbs that are flat. Sometimes I have to back up until I can find a flat one or usethe street if the sidewalk ends.
• Living in rural Iowa, day to day work commute is very easy. Would appreciate better safe walkingpathways to connect community. (Grundy Center)
• More bike/pedestrian paths outside of WCF – it’s hard for me to not run on blacktops to get highmileage runs in.
• Not having enough bike paths to ride on. I would rather not ride my bike on the road.• Safe sidewalks to walk on that are in good repair• Terrible sidewalk conditions, no infrastructure for bikes• Few walking trails in all areas of Independence. Liberty/Trotter Trail is the exception.
Access to Medical/Ability to Drive (5) • As long as my health allows me to drive I am fine. If I can’t drive, getting to medical and other facilities
would be a problem. I have no relatives close enough to call upon.• Getting to Mason City for medical• I am an elderly woman living in a very small town! – 1000 people. I still drive around town & to
appointments out of town.• If I was single it would be travel to and from surgery.• My doctor told me not to drive anymore. As long as my husband can drive, I’m okay
2045 LONG-RANGE TRANSPORTATION PLAN | 227
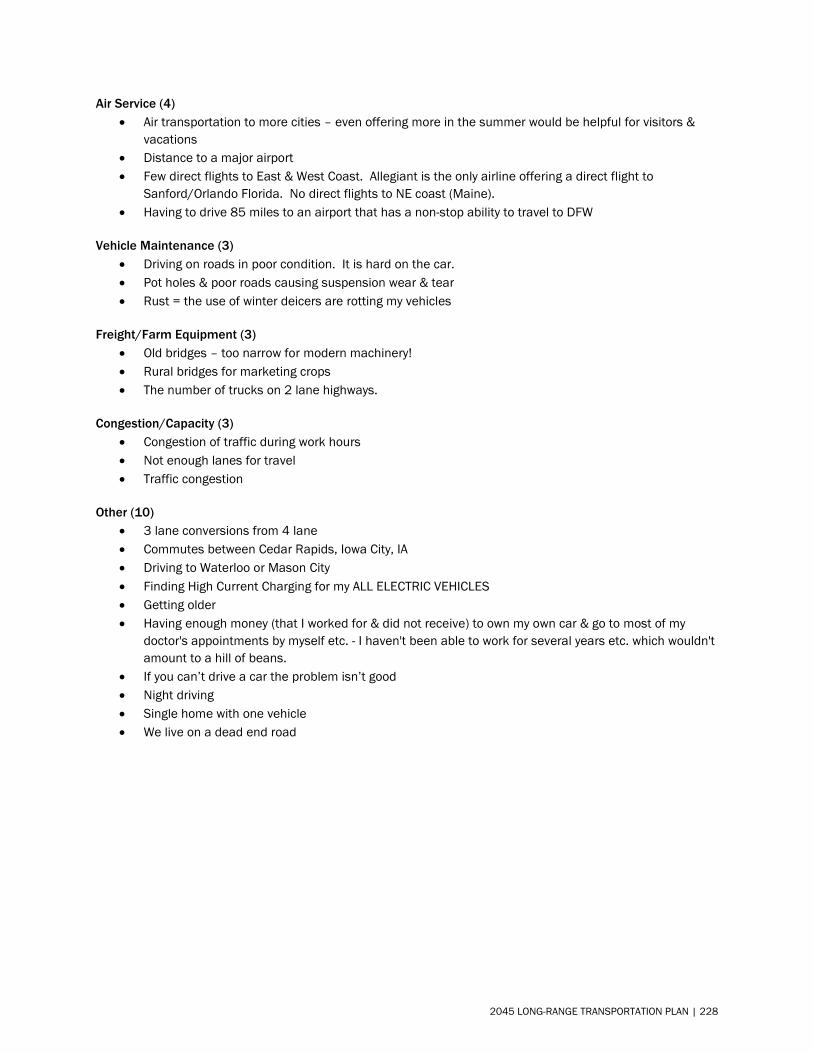
Air Service (4) • Air transportation to more cities – even offering more in the summer would be helpful for visitors &
vacations• Distance to a major airport• Few direct flights to East & West Coast. Allegiant is the only airline offering a direct flight to
Sanford/Orlando Florida. No direct flights to NE coast (Maine).• Having to drive 85 miles to an airport that has a non-stop ability to travel to DFW
Vehicle Maintenance (3) • Driving on roads in poor condition. It is hard on the car.• Pot holes & poor roads causing suspension wear & tear• Rust = the use of winter deicers are rotting my vehicles
Freight/Farm Equipment (3) • Old bridges – too narrow for modern machinery!• Rural bridges for marketing crops• The number of trucks on 2 lane highways.
Congestion/Capacity (3) • Congestion of traffic during work hours• Not enough lanes for travel• Traffic congestion
Other (10) • 3 lane conversions from 4 lane• Commutes between Cedar Rapids, Iowa City, IA• Driving to Waterloo or Mason City• Finding High Current Charging for my ALL ELECTRIC VEHICLES• Getting older• Having enough money (that I worked for & did not receive) to own my own car & go to most of my
doctor's appointments by myself etc. - I haven't been able to work for several years etc. which wouldn'tamount to a hill of beans.
• If you can’t drive a car the problem isn’t good• Night driving• Single home with one vehicle• We live on a dead end road
2045 LONG-RANGE TRANSPORTATION PLAN | 228
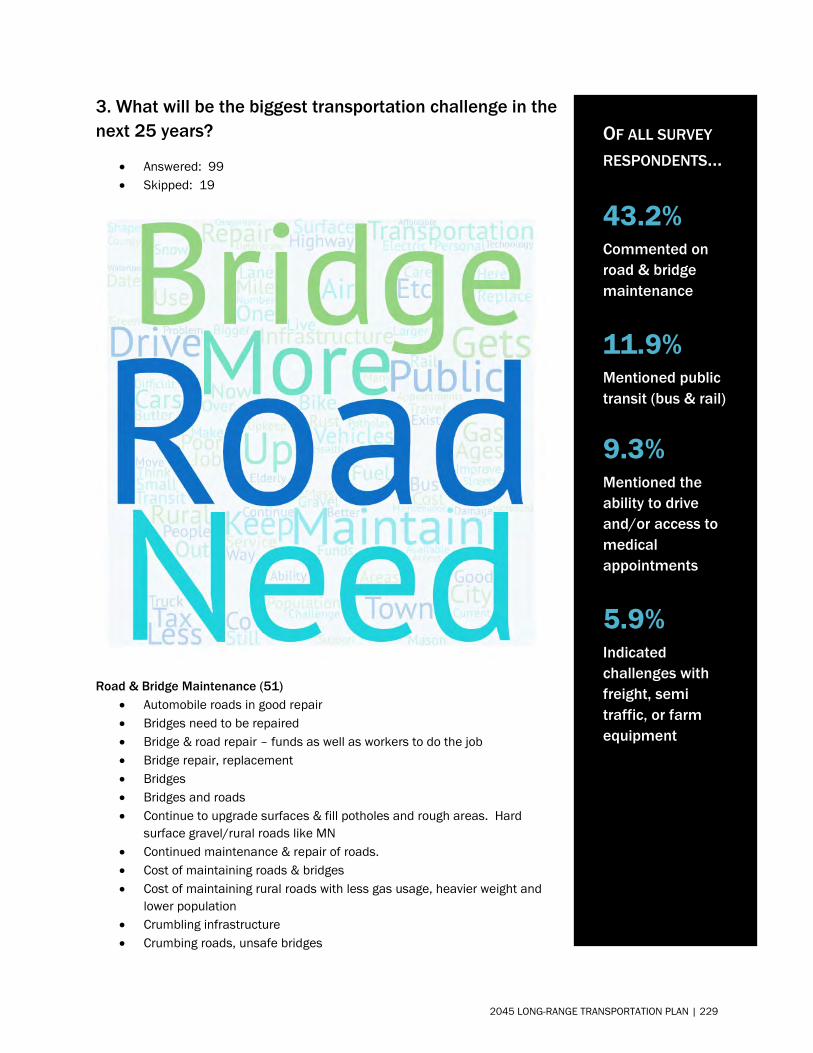
3. What will be the biggest transportation challenge in thenext 25 years?
• Answered: 99• Skipped: 19
Road & Bridge Maintenance (51) • Automobile roads in good repair• Bridges need to be repaired• Bridge & road repair – funds as well as workers to do the job• Bridge repair, replacement• Bridges• Bridges and roads• Continue to upgrade surfaces & fill potholes and rough areas. Hard
surface gravel/rural roads like MN• Continued maintenance & repair of roads.• Cost of maintaining roads & bridges• Cost of maintaining rural roads with less gas usage, heavier weight and
lower population• Crumbling infrastructure• Crumbing roads, unsafe bridges
OF ALL SURVEY
RESPONDENTS…
43.2% Commented on road & bridge maintenance
11.9% Mentioned public transit (bus & rail)
9.3% Mentioned the ability to drive and/or access to medical appointments
5.9% Indicated challenges with freight, semi traffic, or farm equipment
2045 LONG-RANGE TRANSPORTATION PLAN | 229
• Failing infrastructure and bridges and tax payer burden• Finding the funds to replace bridges and roads.• Gravel road• I think maintaining what we have will be our biggest challenge.• I think ice and snow is a constant problem that we will face. All areas should use new technologies in
managing them as they become available. If there were way to stop snow from blowing over roadways, we should do that. Would trees, bushes or long grass work?
• Improving infrastructure – ability to pay for it without raising taxes• Infrastructure• Infrastructure improvements• Just keeping the roads that we have now up to date. Not adding any more roads. Also the bridges
need up dating!!• Keeping our roads & bridges in good shape with an increased travel in the future• Keeping roads up.• Keeping the roads we have in good shape• Keeping up with replacing infrastructure – particularly aging bridges and road repair.• Keeping up with road deterioration & damage• Maintaining bridges & roads• Maintaining current roads• Maintaining decent roads• Maintaining gravel roads• Maintaining roads so they are not full of holes and bumps.• Maintaining rural roads• Maintaining rural roads & bridges• More vehicles out on the highways making roads that are heavily traveled deteriorate more quickly• Poor roads• Poor, town streets (small towns)• Repair on roadways, destroying highways• Replace & maintain roads & interstates.• Replace bridges and repairing roads for trucks.• Road maintenance as our population keeps growing & the number of cars on roads increases.• Road surfaces• Road surfaces – bridges better surfaced• Roads & bridges that need repair• Roads and bridges. State Highway 150 from Independence to Vinton.• Rust – bridges made of steel, rusting out• Keeping roads repaired• To improve and maintain these better (roads)• Upkeep of existing roads in Buchanan County.• Upkeep of highways, bridges, and urban streets.• Upkeep of secondary roads & bridges• Weather damage to roads & bridges – extremes of frost & heat will do damages.
2045 LONG-RANGE TRANSPORTATION PLAN | 230
Public Transit (Bus and Rail) (14) • Affordable para-transit • Get some public trans system (if need be) in Butler County (if there is any population left here!) in
Greene Iowa or Northern Butler Co. All of Butler Co. [if (its still here)] • Highspeed rail to bigger cities • Larger concern is for public transportation for the poor and elderly, access to essential services. As
more and more healthcare and support service move to regional centers in larger cities, its difficult for in need to travel – i.e. the closest social security offices to where I live are either in Mason City or Waterloo – a 40-50 mile drive. Many health care services are similar.
• Mass transit – we need cars etc. with less pollution & gets more miles/gallon. Get more people to use mass transportation.
• No bus or taxi available to get to doctor, grocery store, etc. We are a town of mostly old people and there is little help for us except for friends who can still drive and that is getting less and less too.
• NO public accessible transportation as the population ages! • Public transit • Public transit • Public transportation • Public transportation • Public transportation for elders • Small towns being connected to bigger towns for shopping, appts., etc. • Transportation for elderly and disabled as rural population ages and their needs are not available in
their small communities
Access to Medical/Ability to Drive (11) • As one ages, getting to appointments and stores for personal needs. • Distance to my hospital. I can still drive but when my health is poor the 35 miles is difficult. I would
be forced to move to a location closer to Primary Care as the challenge of driving will be more difficult. • Eye sight, other physical challenges • For small town elderly ones transportation challenge is getting to out-of-town appointments when you
should no longer drive. In our town there is a local woman who is willing to drive people to appointments after family members help.
• Getting to a bigger town for purchases, dr. appointments • Getting to doctor appointments • Getting to Dr. appointments • Getting to Mason City for medical • If I can’t drive anymore – getting transportation when living in the country • Not sure but could be ability to drive personal vehicles • Our aging population needing transportation to appointments
Freight/Semi Traffic/Farm Equipment (7) • Big truck traffic • Large & heavy loads • No R.R. • Oversized trucks • Road conditions to support all the semi-traffic • The number of trucks on 2 lane highways • There are more larger vehicles and many roads have potholes & no shoulders
2045 LONG-RANGE TRANSPORTATION PLAN | 231
Technology (6) • Accommodating less dependence on fossil fuels – infrastructure that supports electric or other alt
fuels in cars & public transportation• Banning Fossil Fueled VEHICLES from public roads. Electric Recharging Infrastructure. Planning for
PAVS (Personal Air Vehicles - People carrying QUADROTORS). In less than 70 years we will need sub-orbital and orbital launch facilities for PSCS (personal space craft!)
• Electric charging stations, self-driving cars• Needing electric charging stations. We need more green cars on the road to save the environment.• Replacing gas powered vehicles with electric cars.• Staying current with technology and auto driving
Bicycle & Pedestrian Infrastructure (5) • Bike trails are needed for the safety of our cyclists. We have to drive to the bike trails – should be
available in all towns.• Bike transportation• Providing additional bike routes in rural areas• Providing trails for walking & biking• Will need more bike paths/lanes
Congestion (5) • Adequate lanes on highways• Congestion• Continued congestion due to additional population• Highway congestion• Over crowded
Safety (2) • Make roads safe and comfortable for vehicles. We have spent enough money on recreational uses
and are forgetting the majority of the tax dollars come from vehicles and gas taxes.• Safe intersections
Air Service (2) • Airline fees• Hopefully we will keep our air service in Waterloo & Mason City – only 40 miles away
Other (10) • Affordability• For me (if things don't financially improve) and physical problems they will stay the same & get much
worse & they are bad now. I hardly have enough money to even exist as does several of us older ones -one in particular who has 3 x's my income & she doesn't know what she is going to do either. Lowincome housing just isn't workable for some of us for several reasons.
• Getting my license• People drive fast now and it will be worse, especially if you are older• Price of fuel & gas• Probably construction• Probably travel on 380 through Cedar Rapids• Probably trip to grave. I’m 88 years old now.• RAGBRAI and the month prior to it. As rash rides get more & more popular. Also you looking at 2045
when you’ll leave this job ASAP• Rude drivers, lots of drivers, poor drivers.
2045 LONG-RANGE TRANSPORTATION PLAN | 232
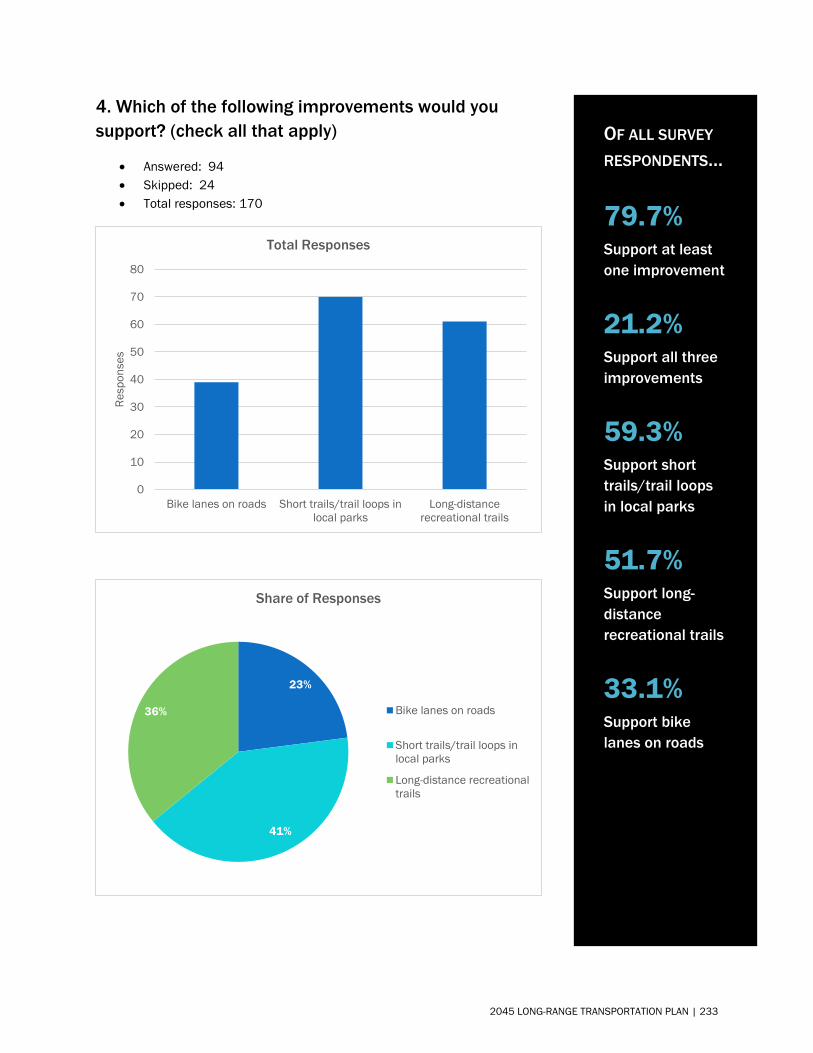
4. Which of the following improvements would yousupport? (check all that apply)
• Answered: 94• Skipped: 24• Total responses: 170
0
10
20
30
40
50
60
70
80
Bike lanes on roads Short trails/trail loops inlocal parks
Long-distancerecreational trails
Resp
onse
s
Total Responses
23%
41%
36%
Share of Responses
Bike lanes on roads
Short trails/trail loops inlocal parks
Long-distance recreationaltrails
OF ALL SURVEY
RESPONDENTS…
79.7% Support at least one improvement
21.2% Support all three improvements
59.3% Support short trails/trail loops in local parks
51.7% Support long-distance recreational trails
33.1% Support bike lanes on roads
2045 LONG-RANGE TRANSPORTATION PLAN | 233
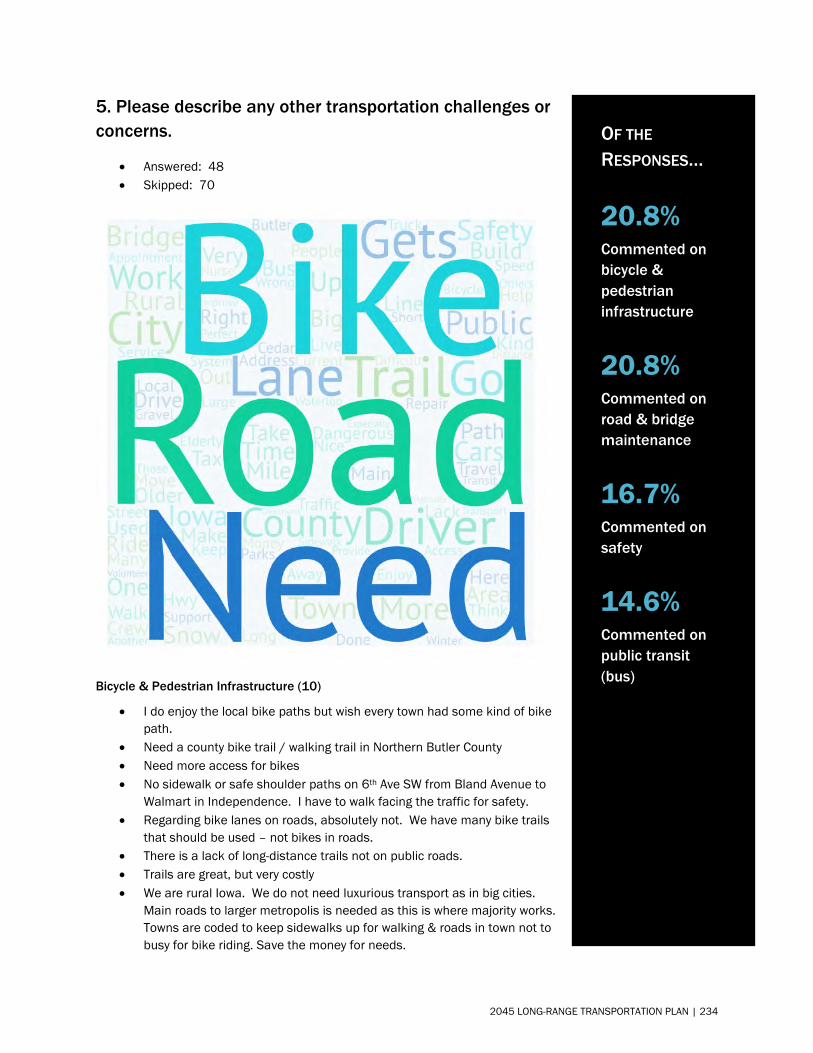
5. Please describe any other transportation challenges orconcerns.
• Answered: 48• Skipped: 70
Bicycle & Pedestrian Infrastructure (10)
• I do enjoy the local bike paths but wish every town had some kind of bikepath.
• Need a county bike trail / walking trail in Northern Butler County• Need more access for bikes• No sidewalk or safe shoulder paths on 6th Ave SW from Bland Avenue to
Walmart in Independence. I have to walk facing the traffic for safety.• Regarding bike lanes on roads, absolutely not. We have many bike trails
that should be used – not bikes in roads.• There is a lack of long-distance trails not on public roads.• Trails are great, but very costly• We are rural Iowa. We do not need luxurious transport as in big cities.
Main roads to larger metropolis is needed as this is where majority works.Towns are coded to keep sidewalks up for walking & roads in town not tobusy for bike riding. Save the money for needs.
OF THE
RESPONSES…
20.8% Commented on bicycle & pedestrian infrastructure
20.8% Commented on road & bridge maintenance
16.7% Commented on safety
14.6% Commented on public transit (bus)
2045 LONG-RANGE TRANSPORTATION PLAN | 234
• We enjoy Cedar Valley trails system • We have plenty of hiking & biking trails
Road & Bridge Maintenance (10) • Bridge repair for large farm machines • Did I say bridges? • Dusty gravel roads • Fix the roads – Too bad of shape • Getting snow removal done in the Winter, sometimes they don't get out after a snow and wait until
work starts at 7 am. By that time the snow is packed on the roads from cars and truck travel and they stay slippery for days. Then they sand and make a mess. If they would get out right away, problem solved.
• Improve rural gravel roads to hard surface • Provide enough tax money to help repair & resurface roads/streets in the cities and rural. • Substandard secondary roads and streets • Winter roads, build up of caked on snow & ice. • With Iowa’s climate roads & bridges are tough to keep perfect.
Public Transit (Bus) (7)
• For elderly person without family or others to take them to events or shopping, this would improve the quality of life immensely.
• Handicap people need help. Small town buses. • I only was scheduled for one ride to a doctor's appointment & the driver supposedly came 2 hours
early & arrived at the wrong address. I heard from a nurse that they had gotten the wrong address for others here at another location parked on opposite side of an apartment building & an older gentlemen in didn't get to his appointment on time because of it also & had to go through another colonoscopy prep. Here we have people who give rides now, but those who live here & volunteer to drive people to their appointments are getting older themselves & short on finances. Those other drivers don't know how to read & go to the right street with a similar address or follow the directions of their computer ap. My brother tried his for my place and it took way down to the end of my street for my address and it was wrong.
• No public transit system in Butler County (there maybe no need for it) • No public transportation in our area • Rural areas need access to transport for elderly. • Would be nice to have a bus to take older citizens to Waverly, Waterloo, or Mason City.
Access to Medical/Ability to Drive (3) • Getting to kidney dialysis, chemo, etc. • It’s difficult for elderly residents to get to appointments in Cedar Rapids and Waterloo. • Some older people who can’t drive will be forced to move into nursing homes to live
Safety (8) • Add continuous rumble strips between traffic going opposite directions. It's nice that there are strips @
outside (right) of lane but would be more meaningful to call attention when crossing center lines. • Bike lanes on main roads are very dangerous & makes travel by automobile even more difficult. • Bike safety on roads. I have a friend that last summer was biking on the road, far right and wearing a
bright safety vest and a truck did not move over & hit her with this mirror breaking several ribs. Cars do not move over.
2045 LONG-RANGE TRANSPORTATION PLAN | 235
• Bikes on the road• I think bike lanes on most roads – especially in Iowa would be dangerous for the bicyclist and a
motorist.• I think the current trend of bike trails is a dangerous choice for a very few that utilize them, and takes
away road funds that are needed for general road repairs that are in need currently.• Safety• TOO dangerous! Leave bikes off hwys
Road & Bridge Construction (2) • Blocking off excessive miles in work on highways - 380 gets 7 miles blocked off to 1 lane and work
gets done on less than 1 mile at a time• I would like to see the road built between Hwy 175 & 20 at the Black Hawk Grundy Co. line
Speed (2) • Speed. Why is everyone in a hurry to die.• The speed limit should be better enforced.
Technology (1) • Acute lack of recharging stations for all EVs cars, motorcycles, boats and aircraft especially at national,
state, county and city governmental office buildings. We need grass-roots support to perfect andimplement the wireless transmission of electricity of the kind developed and championed by NikolaTesla. We need to add a $1000 per fossil fueled vehicle with the money used to build a wirelesscharging system along the lines of Nikola Tesla's work. A separation of roadways with large overland(16 wheeled) vehicles not allowed on public roads but having their own roadways! In support of long-distance recreational trails, short trails/trail loops in local parks, and bike lanes on roads if theyincorporated recharging stations for electric bicycles, motorcycles and other non fossil fueled devices.
Other (7) • Air travel – getting to an airport that provides reasonable rates• Devaluation of my cars, due to ruse• Increase in rude, careless distracted or aggressive (road rage) drivers on our roads.• Make drivers ed more available. See too many drivers not using blinkers & driving poorly. I no longer
go into Waterloo unless needed due to idiot drivers.• Everywhere you want to go is in a big city, where traffic is terrible• There are no ambulance any closer than 9 miles. Also the current service only staffs one crew 24/7.
They should staff 2 full time 24 hr. crews. They should not need to rely on one crew & volunteerswhich are becoming scarce. This endangers the entire area. EMS Services should be mandatory in allcommunities in Buchanan County and all areas of Iowa. Tax dollars support Fire Dept.'s only. They aresupposed to support ambulance services but many don't. T ax dollars to fire should be mandated tosplit with EMS services.
• Want UTV trails
2045 LONG-RANGE TRANSPORTATION PLAN | 236
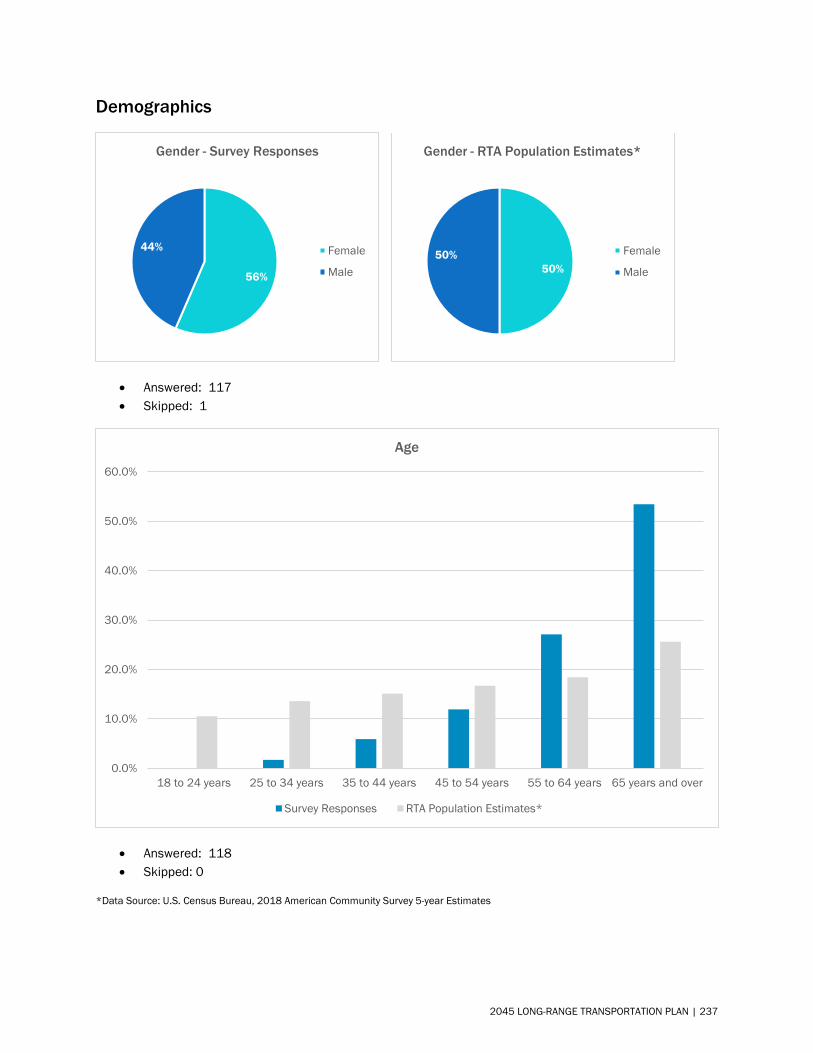
Demographics
• Answered: 117• Skipped: 1
• Answered: 118• Skipped: 0
*Data Source: U.S. Census Bureau, 2018 American Community Survey 5-year Estimates
50%50%
Gender - RTA Population Estimates*
Female
Male
0.0%
10.0%
20.0%
30.0%
40.0%
50.0%
60.0%
18 to 24 years 25 to 34 years 35 to 44 years 45 to 54 years 55 to 64 years 65 years and over
Age
Survey Responses RTA Population Estimates*
56%
44%
Gender - Survey Responses
Female
Male
2045 LONG-RANGE TRANSPORTATION PLAN | 237
September 25, 2020 Survey ID «Survey_Code»
«First» «Last» «Address1» «Address2» «City», «State» «ZIP»
Hello,
Your household has been selected at random to participate in a brief survey to help identify transportation challenges and needs in the Iowa Northland Regional Transportation Authority (RTA) six-county region. Your input will provide useful information for our 2045 Long-Range Transportation Plan.
The following survey will require approximately 10 minutes to complete. Your participation is voluntary, and answers will remain anonymous. If you choose to participate, please return the survey in the enclosed prepaid postage envelope. You may also complete the survey by visiting https://www.surveymonkey.com/r/N5QC25T.
If you have any questions regarding the survey or the 2045 Long-Range Transportation Plan, please feel free to contact me at [email protected] or (319) 235-0311.
Thank you for your time and input!
Sincerely,
Kyle Durant Transportation Planner II
2045 LONG-RANGE TRANSPORTATION PLAN | 238
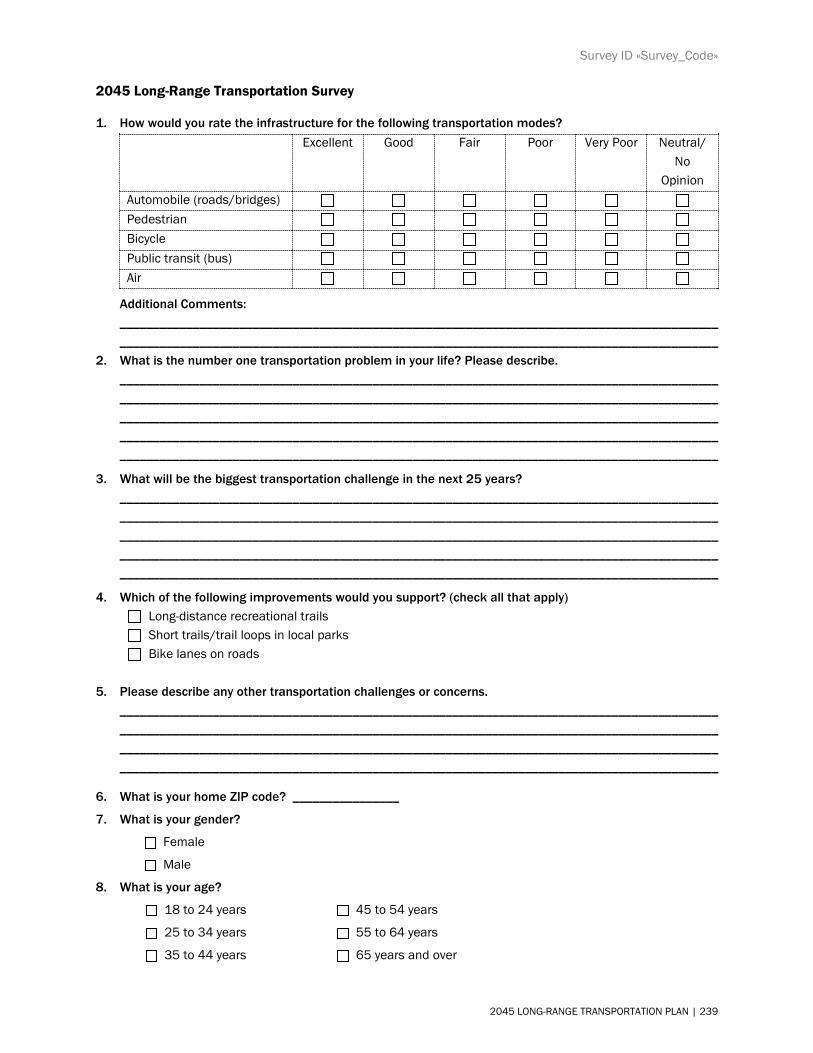
Survey ID «Survey_Code»
2045 Long-Range Transportation Survey
1. How would you rate the infrastructure for the following transportation modes?Excellent Good Fair Poor Very Poor Neutral/
No Opinion
Automobile (roads/bridges) Pedestrian Bicycle Public transit (bus) Air
Additional Comments: __________________________________________________________________________________________ __________________________________________________________________________________________
2. What is the number one transportation problem in your life? Please describe.__________________________________________________________________________________________________________________________________________________________________________________________________________________________________________________________________________________________________________________________________________________________________________________________________________________________________________________________________
3. What will be the biggest transportation challenge in the next 25 years?__________________________________________________________________________________________________________________________________________________________________________________________________________________________________________________________________________________________________________________________________________________________________________________________________________________________________________________________________
4. Which of the following improvements would you support? (check all that apply) Long-distance recreational trails
Short trails/trail loops in local parks Bike lanes on roads
5. Please describe any other transportation challenges or concerns.________________________________________________________________________________________________________________________________________________________________________________________________________________________________________________________________________________________________________________________________________________________________________
6. What is your home ZIP code? ________________
7. What is your gender?
Female
Male
8. What is your age?
18 to 24 years 45 to 54 years
25 to 34 years 55 to 64 years
35 to 44 years 65 years and over
2045 LONG-RANGE TRANSPORTATION PLAN | 239

Survey ID «Survey_Code»
RTA Six-County Region
2045 LONG-RANGE TRANSPORTATION PLAN | 240
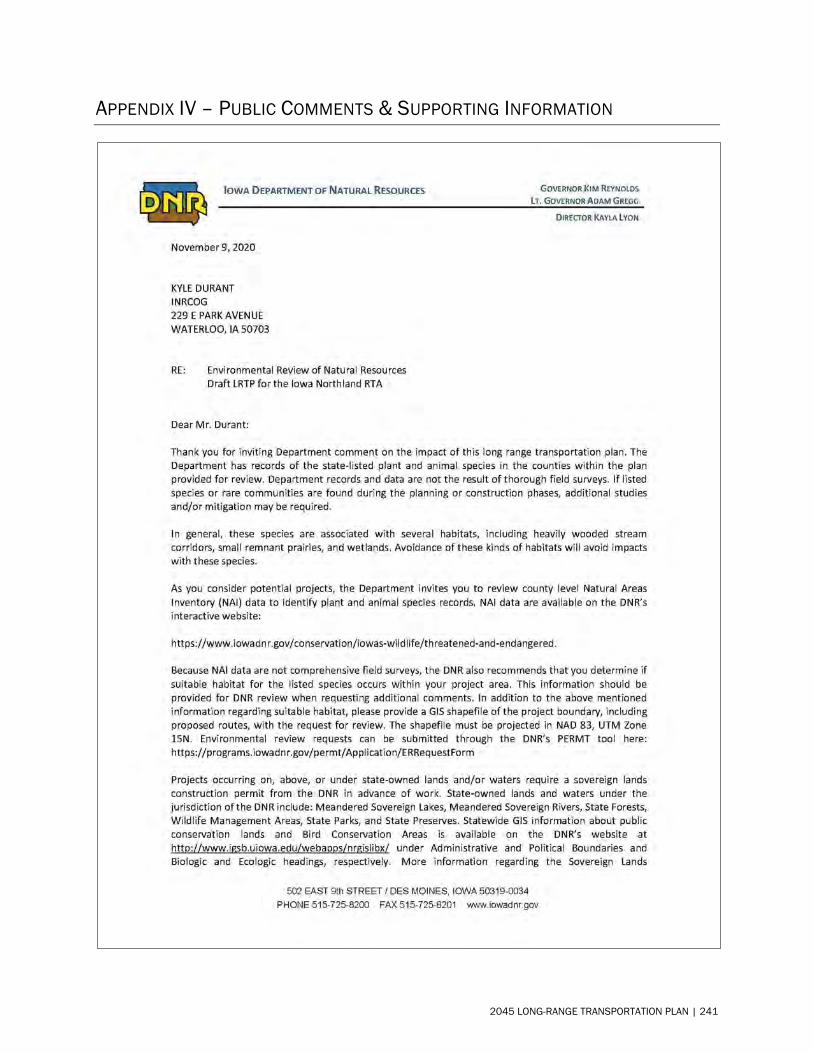
APPENDIX IV – PUBLIC COMMENTS & SUPPORTING INFORMATION
2045 LONG-RANGE TRANSPORTATION PLAN | 241
2045 LONG-RANGE TRANSPORTATION PLAN | 242
• I could not find mention of roadside vegetation in the Environmental Review section. Native roadsidevegetation provides many environmental benefits such as improved erosion control, habitat forpollinators and birds, and improved competition against invasive plant species. Many counties in Iowahave a county roadside vegetation program to manage secondary roads in an integrated manner thatincorporates native plants. See tallgrassprairiecenter.org/roadsides for more information.
• There are trail counters on the Cedar Valley Nature Trail that are owned by Black Hawk CountyConservation. They have been collecting data since 2018.
2045 LONG-RANGE TRANSPORTATION PLAN | 243
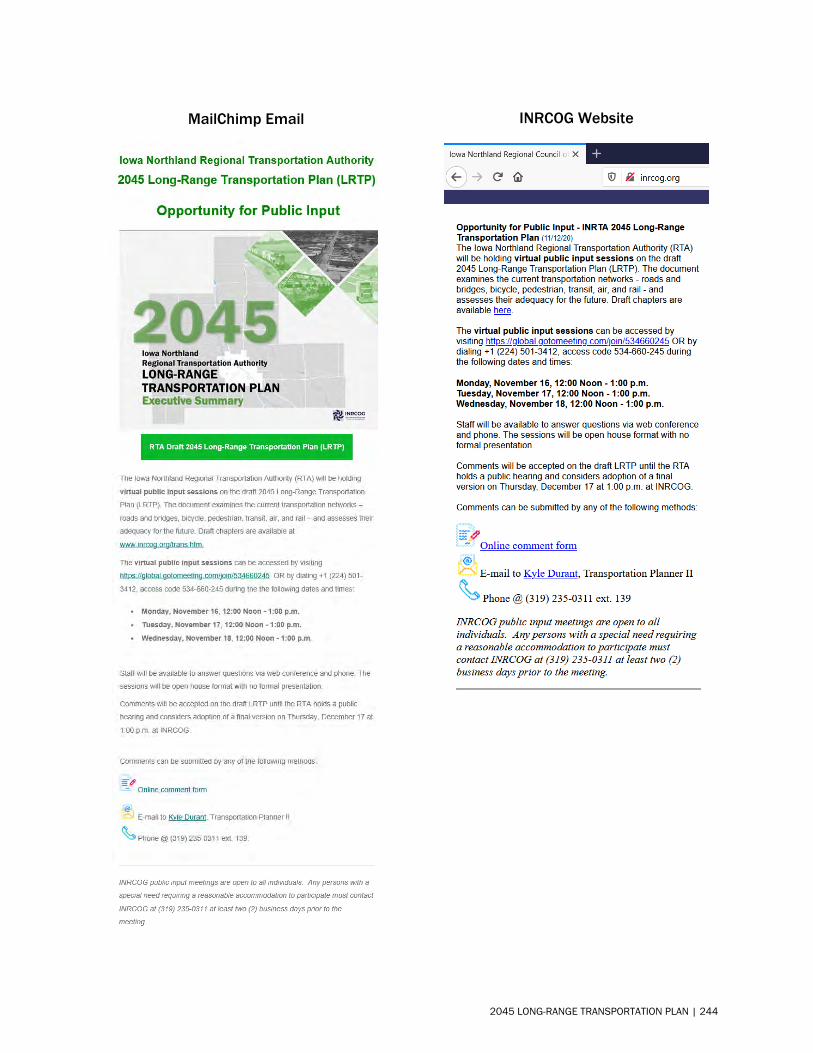
MailChimp Email INRCOG Website
2045 LONG-RANGE TRANSPORTATION PLAN | 244
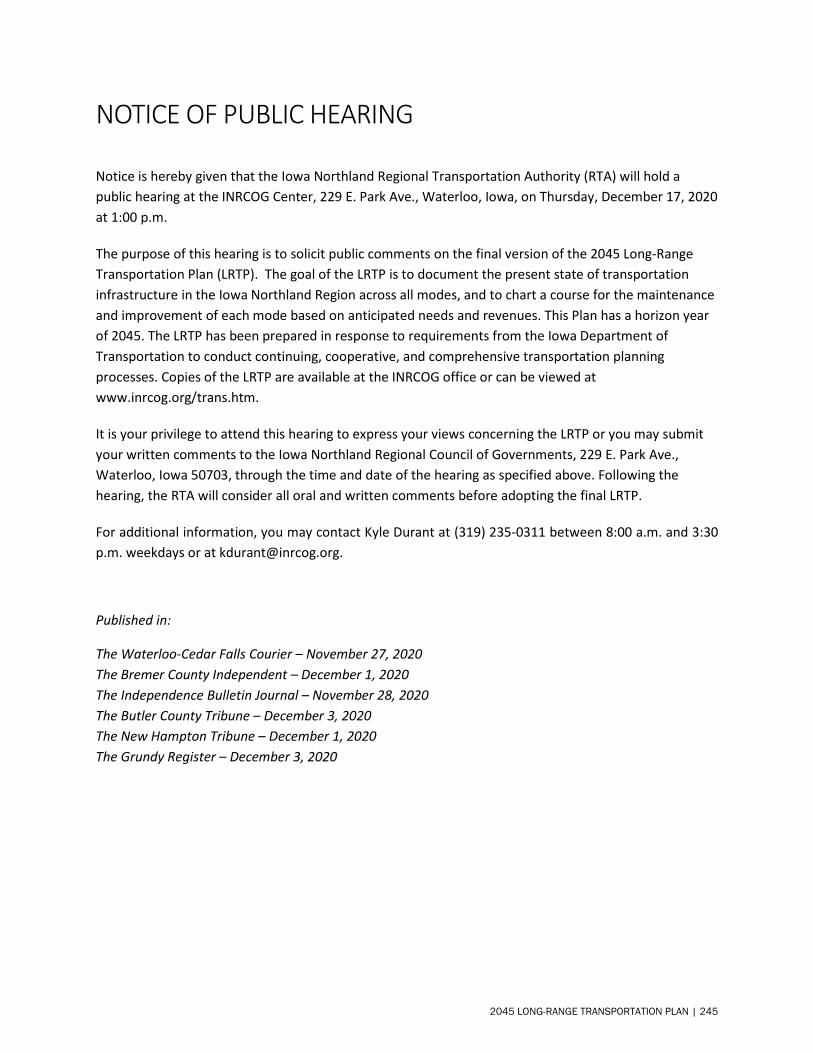
NOTICE OF PUBLIC HEARING
Notice is hereby given that the Iowa Northland Regional Transportation Authority (RTA) will hold a public hearing at the INRCOG Center, 229 E. Park Ave., Waterloo, Iowa, on Thursday, December 17, 2020 at 1:00 p.m.
The purpose of this hearing is to solicit public comments on the final version of the 2045 Long-Range Transportation Plan (LRTP). The goal of the LRTP is to document the present state of transportation infrastructure in the Iowa Northland Region across all modes, and to chart a course for the maintenance and improvement of each mode based on anticipated needs and revenues. This Plan has a horizon year of 2045. The LRTP has been prepared in response to requirements from the Iowa Department of Transportation to conduct continuing, cooperative, and comprehensive transportation planning processes. Copies of the LRTP are available at the INRCOG office or can be viewed at www.inrcog.org/trans.htm.
It is your privilege to attend this hearing to express your views concerning the LRTP or you may submit your written comments to the Iowa Northland Regional Council of Governments, 229 E. Park Ave., Waterloo, Iowa 50703, through the time and date of the hearing as specified above. Following the hearing, the RTA will consider all oral and written comments before adopting the final LRTP.
For additional information, you may contact Kyle Durant at (319) 235-0311 between 8:00 a.m. and 3:30 p.m. weekdays or at [email protected].
Published in:
The Waterloo-Cedar Falls Courier – November 27, 2020 The Bremer County Independent – December 1, 2020 The Independence Bulletin Journal – November 28, 2020 The Butler County Tribune – December 3, 2020 The New Hampton Tribune – December 1, 2020 The Grundy Register – December 3, 2020
2045 LONG-RANGE TRANSPORTATION PLAN | 245

Related Documents