IONIC CONDUCTIVITY OF OXALIC ACID CROSSLINKED CHITOSAN AND APPLICATION IN ELECTRICAL DOUBLE LAYER CAPACITOR (EDLC) IMAN BINTI ARIS FADZALLAH FACULTY OF SCIENCE UNIVERSITY OF MALAYA KUALA LUMPUR 2015 University of Malaya

Welcome message from author
This document is posted to help you gain knowledge. Please leave a comment to let me know what you think about it! Share it to your friends and learn new things together.
Transcript
IONIC CONDUCTIVITY OF OXALIC ACID CROSSLINKED CHITOSAN AND APPLICATION IN ELECTRICAL DOUBLE LAYER CAPACITOR
(EDLC)
IMAN BINTI ARIS FADZALLAH
FACULTY OF SCIENCE UNIVERSITY OF MALAYA
KUALA LUMPUR
2015
Univers
ity of
Mala
ya
IONIC CONDUCTIVITY OF OXALIC ACID CROSSLINKED
CHITOSAN AND APPLICATION IN ELECTRICAL DOUBLE
LAYER CAPACITOR (EDLC)
IMAN BINTI ARIS FADZALLAH
DISSERTATION SUBMITTED IN FULFILLMENT OF
THE REQUIREMENTS FOR THE DEGREE OF
MASTER OF SCIENCE
DEPARTMENT OF PHYSICS
FACULTY OF SCIENCE
UNIVERSITY OF MALAYA
KUALA LUMPUR
2015
Univers
ity of
Mala
ya
ii
UNIVERSITI MALAYA
ORIGINAL LITERARY WORK DECLARATION
Name of Candidate: IMAN BINTI ARIS FADZALLAH
I/C/Passport No:
Registration/Matric No.: SGR100110
Name of Degree: MASTER OF SCIENCE
Title of Project Paper/Research Report/Dissertation/Thesis (“this Work”):
“IONIC CONDUCTIVITY OF OXALIC ACID CROSSLINKED CHITOSAN AND APPLICATION IN ELECTRICAL DOUBLE LAYER CAPACITOR (EDLC)”
Field of Study: ADVANCED CHEMISTRY
I do solemnly and sincerely declare that:
(1) I am the sole author/writer of this Work, (2) This Work is original, (3) Any use of any work in which copyright exists was done by way of fair dealing and for
permitted purposes and any excerpt or extract from, or reference to or reproduction of any copyright work has been disclosed expressly and sufficiently and the title of the Work and its authorship have been acknowledged in this Work,
(4) I do not have any actual knowledge nor do I ought reasonably to know that the making of this work constitutes an infringement of any copyright work,
(5) I hereby assign all and every rights in the copyright to this Work to the University of Malaya (“UM”), who henceforth shall be owner of the copyright in this Work and that any reproduction or use in any form or by any means whatsoever is prohibited without the written consent of UM having been first had and obtained,
(6) I am fully aware that if in the course of making this Work I have infringed any copyright whether intentionally or otherwise, I may be subject to legal action or any other action as may be determined by UM.
(Candidate Signature) Date:
Subscribed and solemnly declared before,
Witness’s Signature Date:
Name
Designation
Univers
ity of
Mala
ya
iii
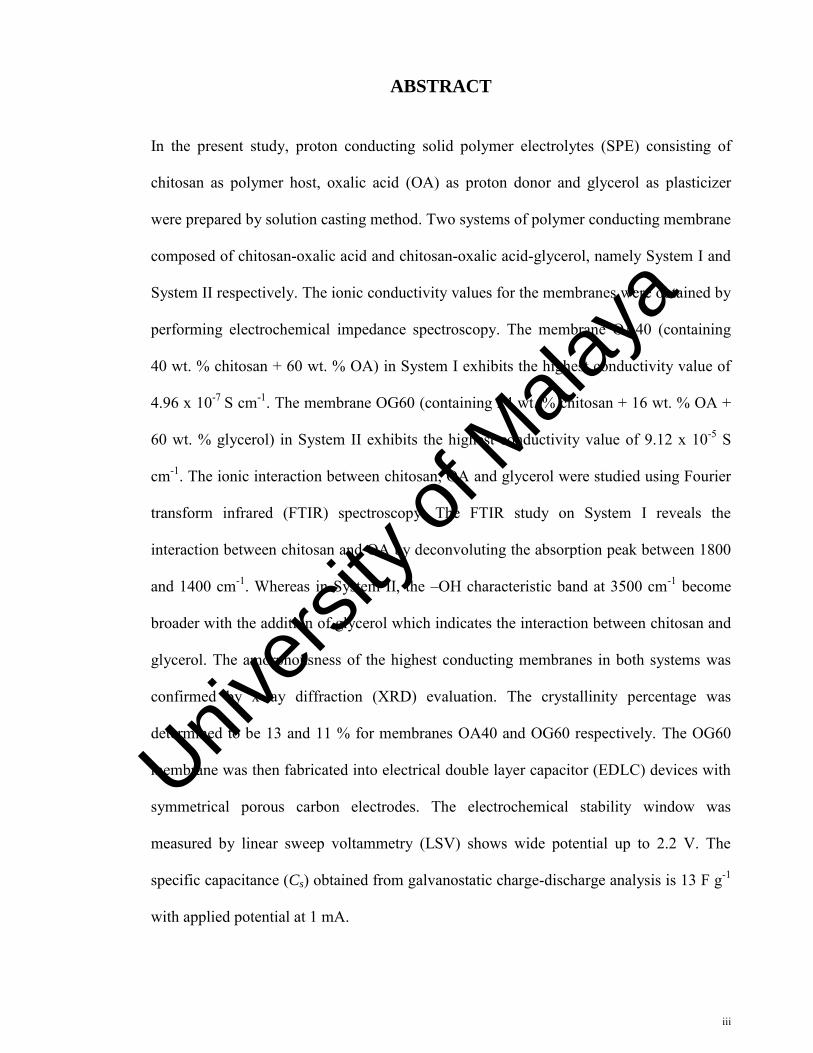
ABSTRACT
In the present study, proton conducting solid polymer electrolytes (SPE) consisting of
chitosan as polymer host, oxalic acid (OA) as proton donor and glycerol as plasticizer
were prepared by solution casting method. Two systems of polymer conducting membrane
composed of chitosan-oxalic acid and chitosan-oxalic acid-glycerol, namely System I and
System II respectively. The ionic conductivity values for the membranes were obtained by
performing electrochemical impedance spectroscopy. The membrane OA40 (containing
40 wt. % chitosan + 60 wt. % OA) in System I exhibits the highest conductivity value of
4.96 x 10⁻⁷ S cm-1. The membrane OG60 (containing 24 wt. % chitosan + 16 wt. % OA +
60 wt. % glycerol) in System II exhibits the highest conductivity value of 9.12 x 10⁻⁵ S
cm-1. The ionic interaction between chitosan, OA and glycerol were studied using Fourier
transform infrared (FTIR) spectroscopy. The FTIR study on System I reveals the
interaction between chitosan and OA by deconvoluting the absorption peak between 1800
and 1400 cm-1. Whereas in System II, the –OH characteristic band at 3500 cm-1 become
broader with the addition of glycerol which indicates the interaction between chitosan and
glycerol. The amorphousness of the highest conducting membranes in both systems was
confirmed by x-ray diffraction (XRD) evaluation. The crystallinity percentage was
determined to be 13 and 11 % for membranes OA40 and OG60 respectively. The OG60
membrane was then fabricated into electrical double layer capacitor (EDLC) devices with
symmetrical porous carbon electrodes. The electrochemical stability window was
measured by linear sweep voltammetry (LSV) shows wide potential up to 2.2 V. The
specific capacitance (Cs) obtained from galvanostatic charge-discharge analysis is 13 F g-1
with applied potential at 1 mA.
Univers
ity of
Mala
ya
iv
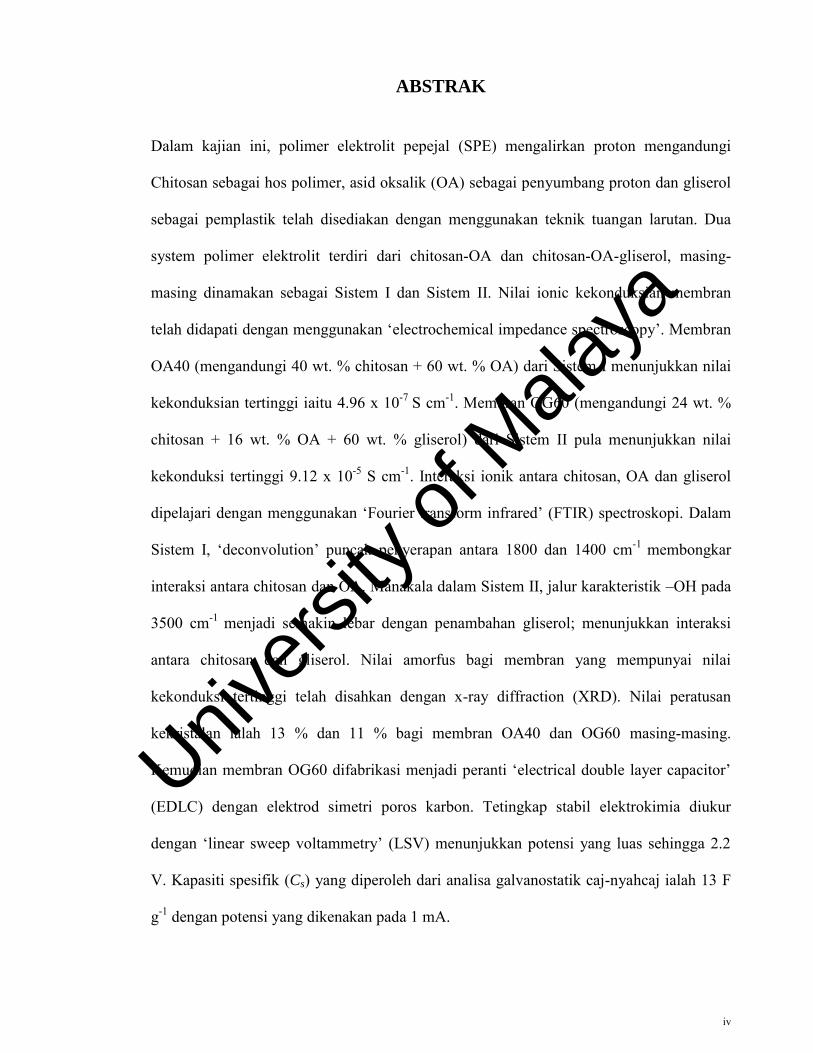
ABSTRAK
Dalam kajian ini, polimer elektrolit pepejal (SPE) mengalirkan proton mengandungi
Chitosan sebagai hos polimer, asid oksalik (OA) sebagai penyumbang proton dan gliserol
sebagai pemplastik telah disediakan dengan menggunakan teknik tuangan larutan. Dua
system polimer elektrolit terdiri dari chitosan-OA dan chitosan-OA-gliserol, masing-
masing dinamakan sebagai Sistem I dan Sistem II. Nilai ionic kekonduksian membran
telah didapati dengan menggunakan ‘electrochemical impedance spectroscopy’. Membran
OA40 (mengandungi 40 wt. % chitosan + 60 wt. % OA) dari Sistem I menunjukkan nilai
kekonduksian tertinggi iaitu 4.96 x 10⁻⁷ S cm-1. Membran OG60 (mengandungi 24 wt. %
chitosan + 16 wt. % OA + 60 wt. % gliserol) dari Sistem II pula menunjukkan nilai
kekonduksi tertinggi 9.12 x 10⁻⁵ S cm-1. Interaksi ionik antara chitosan, OA dan gliserol
dipelajari dengan menggunakan ‘Fourier transform infrared’ (FTIR) spectroskopi. Dalam
Sistem I, ‘deconvolution’ puncak penyerapan antara 1800 dan 1400 cm-1 membongkar
interaksi antara chitosan dan OA. Manakala dalam Sistem II, jalur karakteristik –OH pada
3500 cm-1 menjadi semakin lebar dengan penambahan gliserol; menunjukkan interaksi
antara chitosan dan gliserol. Nilai amorfus bagi membran yang mempunyai nilai
kekonduksi tertinggi telah disahkan dengan x-ray diffraction (XRD). Nilai peratusan
kekristalan ialah 13 % dan 11 % bagi membran OA40 dan OG60 masing-masing.
Kemudian membran OG60 difabrikasi menjadi peranti ‘electrical double layer capacitor’
(EDLC) dengan elektrod simetri poros karbon. Tetingkap stabil elektrokimia diukur
dengan ‘linear sweep voltammetry’ (LSV) menunjukkan potensi yang luas sehingga 2.2
V. Kapasiti spesifik (Cs) yang diperoleh dari analisa galvanostatik caj-nyahcaj ialah 13 F
g-1 dengan potensi yang dikenakan pada 1 mA.
Univers
ity of
Mala
ya
v
ACKNOWLEDGEMENT
All praises to Allah; the Exalted and the Almighty for giving me the blessing and
opportunity to pursue my education. I would like to express my gratitude to both my
supervisors; Prof. Dr. Abdul Kariem Arof and Associate Prof. Dr. Siti Rohana Majid for
guiding and educating me with patience and perseverance; also Prof Dr. M.A. Careem
with his generous assistance and ideas. Not forgetting, Prof. Dr. Rosiyah who
introduced me to the world of polymer with her vast experience and insight which
served as the foundation in my understanding. To quoted Dan Rather; the dream begins
with a teacher who believes in you, who tugs and pushes and leads you to the next
plateau, sometimes poking you with a sharp stick called 'truth'. I also would like to
thank University of Malaya for the PPP grant award for making this research possible.
My appreciation extends to the science officers from Department of Physics, University
of Malaya and COMBICAT for their cooperation. Thanks to the colleagues from Centre
for Ionics University of Malaya (C.I.U.M) with their assistance and boundless help; to
‘kakak-kakak’ seniors in Polymer Lab, Department of Chemistry, University of
Malaya- I am glad that we met. My heartfelt thanks to Syahidah, Ati and Term for being
there for me during my ups and downs; Hana-Deqna and Zila for guiding me during my
earlier days in C.I.U.M. My endless gratitude goes to my parents; Abi and Ummi in
supporting me for each step I took. Their infinite love cannot be replaced and I prayed
to Allah the Almighty shower mercy on them as they have nourished me with education
since i was small. I am also thankful to my siblings; Mujalong, Yamo, Mawan, Ijat and
Rayyan. The bickering, sulking and laughing are important ingredients that make us as
the Aris’ crews. My gratitude can be summarized in what Friedrich Nietzsche said ‘The
essence of all beautiful art, all great art, is gratitude’.
IMAN ARIS FADZALLAH
Univers
ity of
Mala
ya
vi
LIST OF CONTENTS
Content Page
Declaration ii
Abstract iii
Abstrak iv
Acknowledgement v
List of Contents vi
List of Figures x
List of Tables xvi
List of Journal & Seminar/ Conferences Presentation xviii
List of Abbreviations xix
CHAPTER 1: INTRODUCTION 1
1.1 Research background 1
1.2 Scope and objectives of the research 2
1.3 Thesis organization 3
CHAPTER 2: LITERATURE REVIEW 5
2.1 Introduction 5
2.2 Electrochemical capacitors (EC) 5
2.2.1 Electrical double layer capacitor (EDLC) 8
2.2.2 Redox based electrochemical capacitor 14
2.2.3 Hybrid electrochemical capacitors 18
2.3 Polymer electrolyte 19
2.3.1 Liquid electrolyte 20
2.3.2 Solid polymer electrolyte 22
2.3.2.1 Cellulose based electrolytes 23
Univers
ity of
Mala
ya
vii
2.3.2.2 Gelatin based electrolytes 24
2.3.2.3 Chitosan based electrolytes 25
2.4 Improvement of polymer electrolyte properties 30
2.5 Ionic conductivity characterization 32
2.5.1 Arrhenius model 33
2.5.2 Vogel–Tamman–Fulcher model 34
2.6 Electrical double layer capacitor characterization 37
2.7 Summary 40
CHAPTER 3: EXPERIMENTAL METHODS 41
3.1 Introduction 41
3.2 Materials 41
3.3 Sample preparation 42
3.3.1 Chitosan-Oxalic acid system (System I) 42
3.3.2 Flow chart of the experimental methods 43
3.3.3 Chitosan-Oxalic acid-Glycerol system (System II) 44
3.4 Electrical Impedance Spectroscopy (EIS) 45
3.5 Fourier transform infra-red (FTIR) spectroscopy 47
3.6 X-Ray Diffraction (XRD) 49
3.7 Electrochemical window stability study 50
3.8 Electrical double layer capacitor (EDLC) 52
3.8.1 Electrode preparation 52
3.8.2 Electrical double layer capacitor (EDLC) fabrication 52
3.8.3 Cyclic voltammetry (CV) 53
3.8.4 Charge-discharge studies of EDLC 54
3.9 Summary 55
Univers
ity of
Mala
ya
viii
CHAPTER 4: ELECTRICAL IMPEDANCE SPECTROSCOPY (EIS)
STUDIES 56
4.1 Introduction 56
4.2 Conductivity Studies on Chitosan–Oxalic acid system (System I) 56
4.2.1 Temperature dependence of conductivity 64
4.2.2 AC conductivity studies on System I 67
4.2.3 Electrical Analyses on System I 71
4.3 Conductivity Studies on Chitosan–Oxalic acid–Glycerol system (System II) 78
4.3.1 Temperature dependence of conductivity for System II 82
4.3.2 AC conductivity studies on System II 85
4.3.3 Electrical Analyses for System II 87
4.4 Summary 91
CHAPTER 5: FOURIER TRANSFORM INFRARED SPECTROSCOPY
ANALYSES
92
5.1 Introduction 92
5.2 FTIR Studies for Chitosan- Oxalic acid system (System I) 96
5.2.1 Deconvolution and band fitting of IR absorptions 98
5.3 FTIR Studies for Chitosan-Oxalic acid-Glycerol system (System II) 103
5.4 Summary 105
CHAPTER 6: X-RAY DIFFRACTION ANALYSES 107
6.1 Introduction 107
6.2 XRD study for Chitosan–Oxalic acid system (System I) 109
6.2.1 Deconvolution of XRD patterns for Chitosan–Oxalic acid system (System I)
111
6.3 XRD study for Chitosan–Oxalic acid–Glycerol system (System II) 114
6.3.1 Deconvolution of XRD patterns for Chitosan–Oxalic acid–Glycerol system (System II)
116
6.4 Summary 119
Univers
ity of
Mala
ya
ix
CHAPTER 7: APPLICATION OF PLASTICIZED POLYMER
ELECTROLYTE IN ELECTRICAL DOUBLE LAYER CAPACITOR
120
7.1 Introduction 120
7.2 Electrochemical stability of the plasticized electrolyte 122
7.3 Electrochemical study on of electrical double layer capacitor (EDLC) 123
7.3.1 Cyclic voltammetry study 123
7.3.2 Charge-discharge study 126
7.4 Summary 131
CHAPTER 8: DISCUSSION 132
CHAPTER 9: CONLUSION AND SUGGESTIONS FOR FURTHER WORK 142
REFERENCES 145
Univers
ity of
Mala
ya
x
LIST OF FIGURES
Figure Caption Page
Figure 2.1 : Sketch of Ragone plot for various energy and conversion devices. The indicated areas are rough lines (Kötz & Carlen, 2000)
5
Figure 2.2 : Schematics of an electrochemical double layer and its electrode/electrolyte interface model (Zhang et al., 2009)
8
Figure 2.3 : Illustration of an electrochemical double layer capacitor (EDLC) in its charge state (Pandolfo & Hollenkamp, 2006)
9
Figure 2.4 : Schematic diagram of the pore size network of an activated carbon grain (Simon & Burke, 2008)
12
Figure 2.5 : Cyclic voltammetrics of the fabricated carbon–carbon symmetric supercapacitor using LiClO4 doped CS/starch blend electrolyte at scan rates. (a) 50 mV s−1, (b) 25 mV s−1, (c) 20 mV s−1, (d) 15 mV s−1 (e) 10 mV s−1, and (f) 5 mV s−1 (Sudhakar and Selvakumar, 2012)
13
Figure 2.6 : Cyclic voltamograms of the cells at 10 mV s−1 (Ramasamy et al., 2014)
13
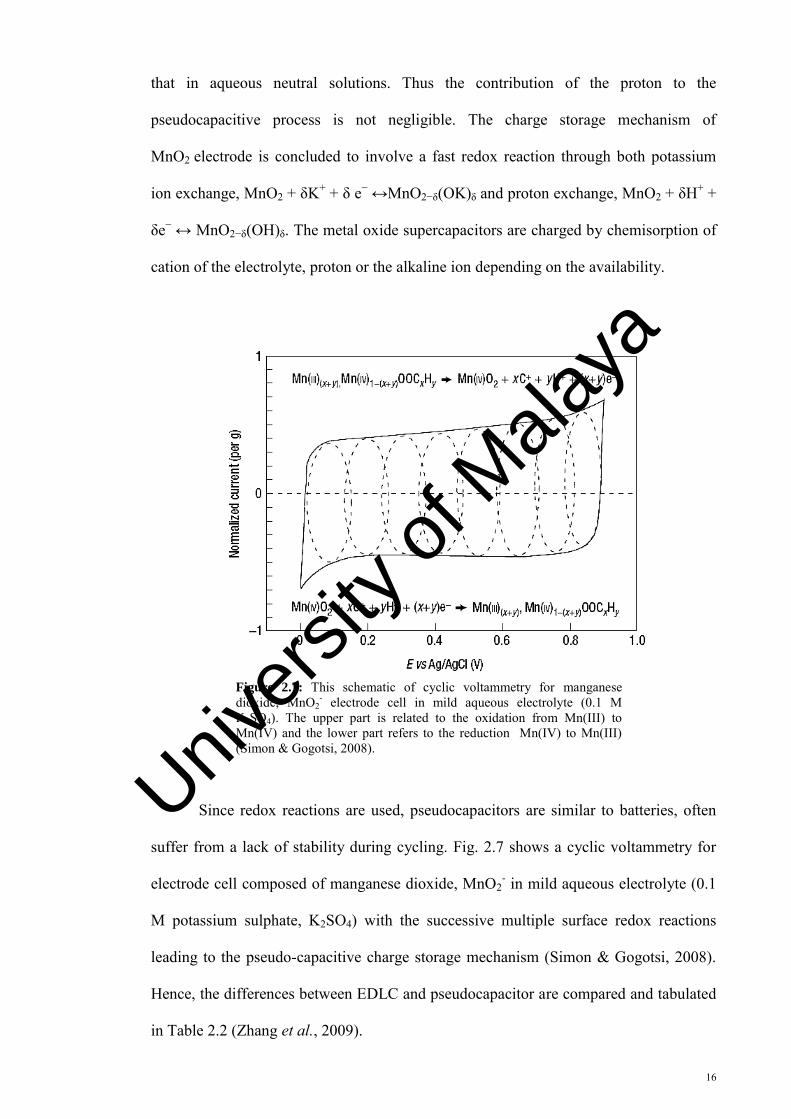
Figure 2.7 : This schematic of cyclic voltammetry for manganese dioxide, MnO2
- electrode cell in mild aqueous electrolyte (0.1 M K2SO4). The upper part is related to the oxidation from Mn(III) to Mn(IV) and the lower part refers to the reduction Mn(IV) to Mn(III) (Simon & Gogotsi, 2008)
15
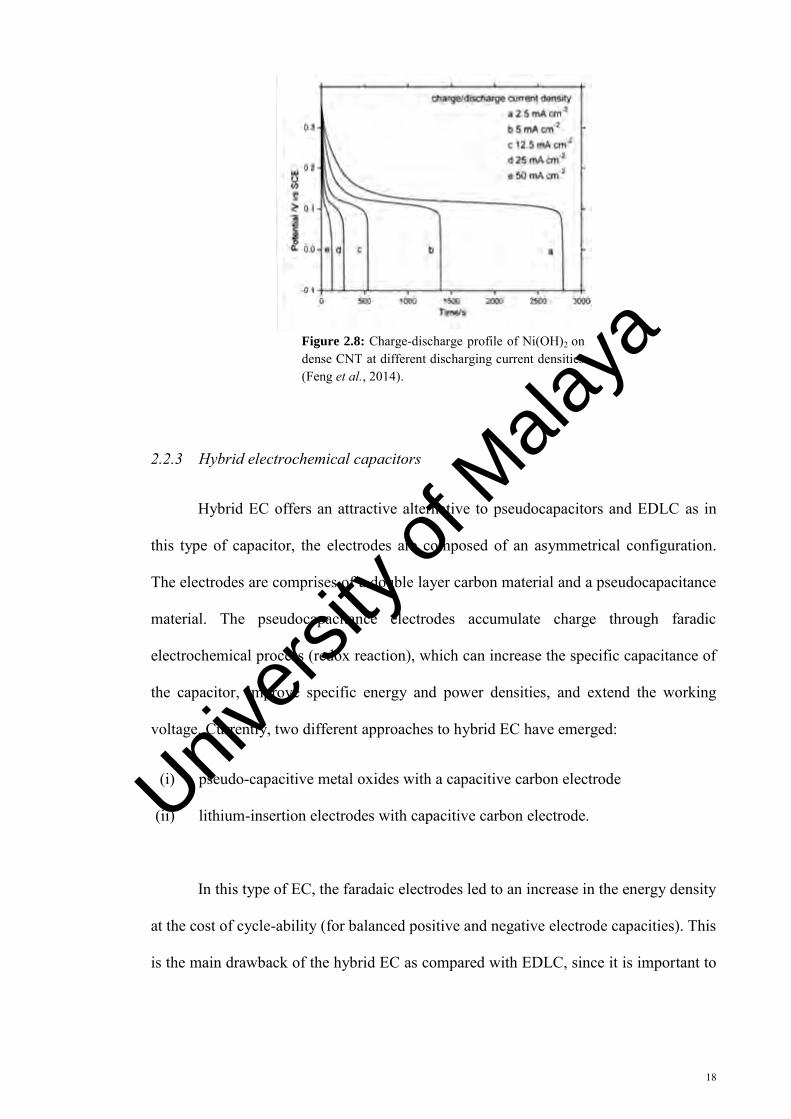
Figure 2.8 : Charge-discharge profile of Ni(OH)2 on dense CNT at different discharging current densities (Feng et al., 2014)
17
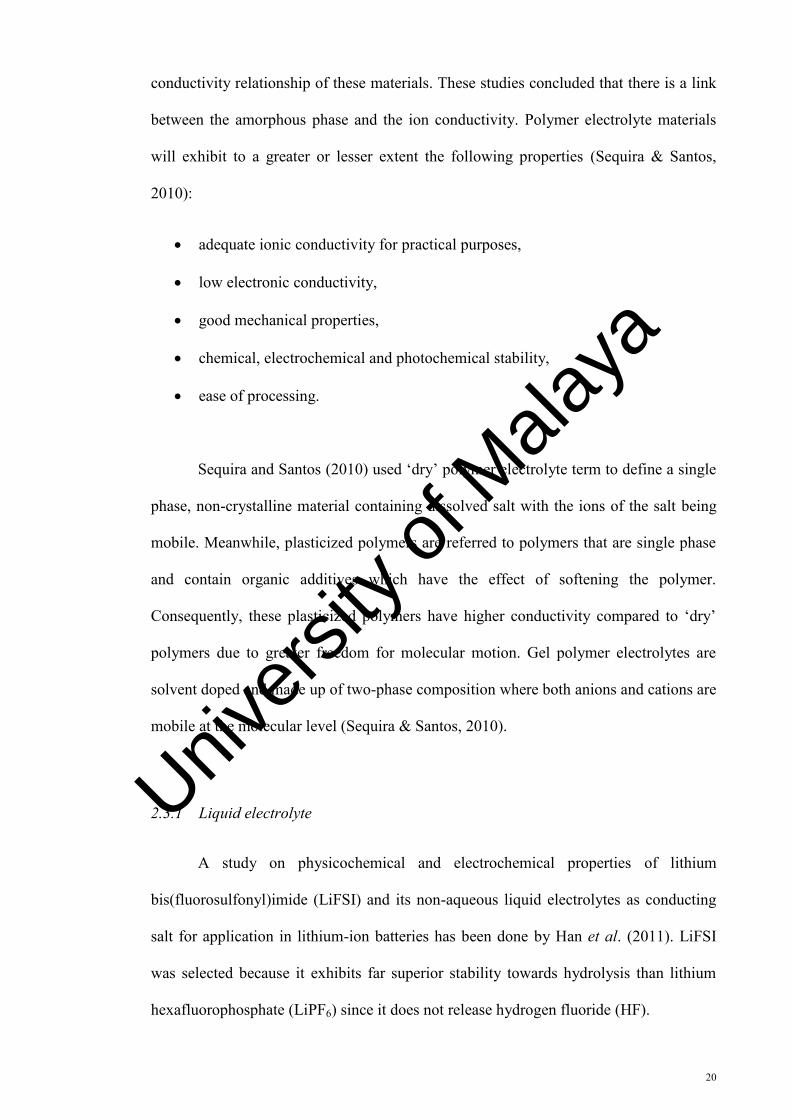
Figure 2.9 : Arrhenius plots of specific conductivity of 1.0 M lithium bis(fluorosulfonyl)imide (LiFSI), lithium hexafluorophosphate (LiPF6), lithium bis(trifluoromethane sulfonyl) imide (LiTFSI), lithium perchlorate (LiClO4), and lithium tetrafluoroborate (LiBF4) in a mixture of ethylene carbonate (EC)/ethyl methyl carbonate (EMC) with ratio of 3:7 (v/v) (Han et al., 2011)
20
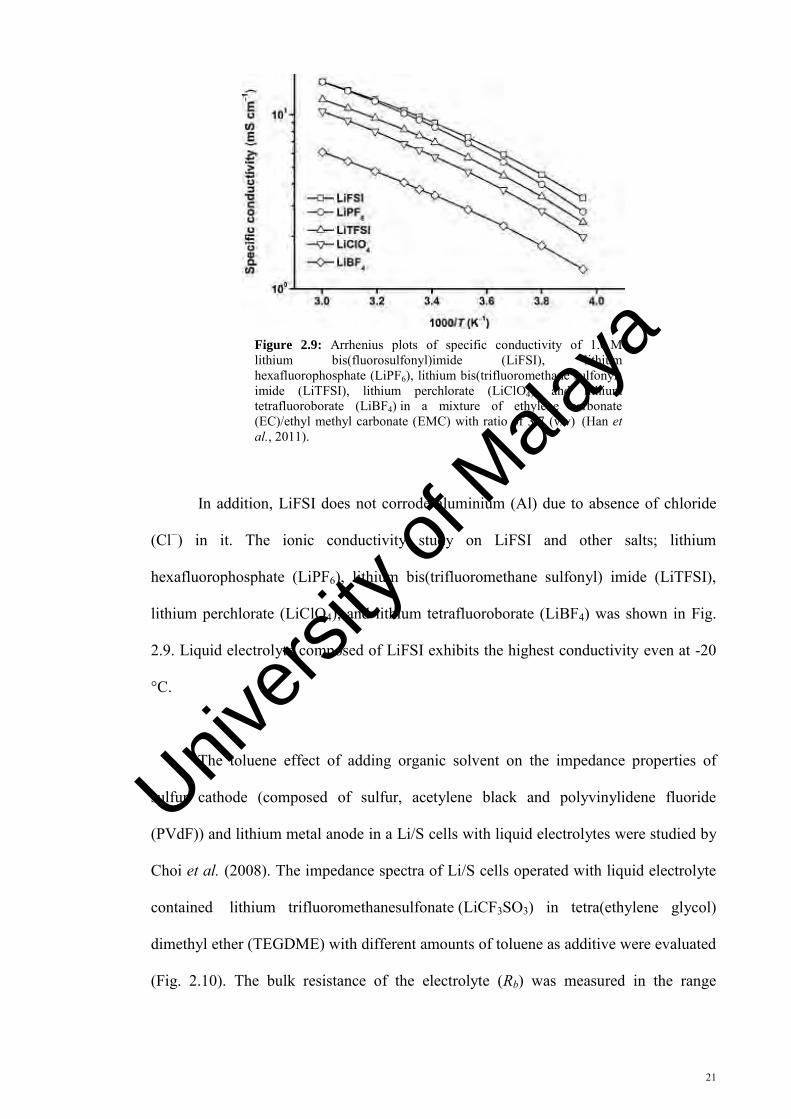
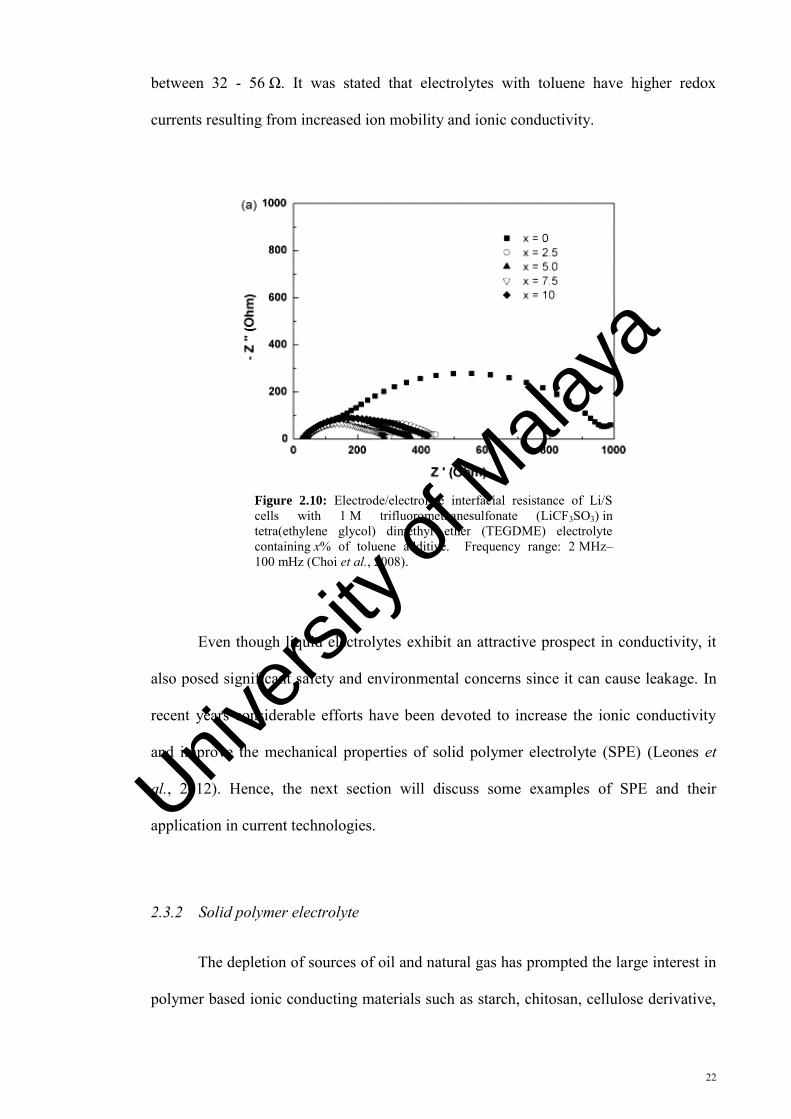
Figure 2.10 : Electrode/electrolyte interfacial resistance of Li/S cells with 1 M trifluoromethanesulfonate (LiCF3SO3) in tetra(ethylene glycol) dimethyl ether (TEGDME) electrolyte containing x% of toluene additive. Frequency range: 2 MHz–100 mHz (Choi et al., 2008)
21
Figure 2.11 : X-ray diffraction of (a) gelatin with ionic liquid 1-ethyl-3- 24
Univers
ity of
Mala
ya
xi
methylimidazolium acetate (C2mim)(OAc) and (b) gelatin with ionic liquid 1-ethyl-3-methylimidazolium acetate (C2mim)(OAc) and fixed amount of 0.1 g europium triflate (Eu(CF3SO3)3) (Leones et al., 2012)
Figure 2.12 : Structure of (a) cellulose, (b) chitin, and (c) chitosan (redraw from Shukla et al., 2013)
25
Figure 2.13 : Chemical structure of glycerol 30
Figure 2.14 : Nyquist plots for chitosan acetate-lithium triflate (LiCF3SO3) containing (a) 0.1 g EC (b) 0.3 g EC. Bulk resistance, Rb is taken at the intersection of the depressed semicircle and the tilted spike (Osman et al., 2001)
32
Figure 2.15 : Log (ζ) vs. 1000/T plot for the polymer electrolyte film (PVA+15 wt% LiClO4) + 15 wt. % 1-ethyl-3-methylimidazolium ethylsulfate (Saroj & Singh, 2012)
33
Figure 2.16 : Arrhenius plot for PVAc–DMF–LiClO4 of various compositions (Baskaran et al., 2004)
34
Figure 2.17 : VTF plots of ionic conductivity for PVAc–DMF–LiClO4 gel polymer electrolytes of various compositions (Baskaran et al., 2004)
35
Figure 2.18 : Cyclic voltammograms of carbon aerogel (CA), activated carbon aerogel (ACA), and commercial activated carbon (AC) electrodes at a scan rate of (a) 10 mV/s and (b) 100 mV/s (Kwon et al., 2014)
37
Figure 2.19 : Charge–discharge characteristics of two EDLC cells at different current densities of (a) 150, (b) 200, and (c) 300 μA cm−2 (Pandey et al., 2011)
38
Figure 3.1 : Flow chart of the experimental methods 42
Figure 3.2 : Typical Nyquist plot of a membrane (Niya & Hoorfar, 2013) 44
Figure 3.3 : The FTIR spectra for the prepared samples; plain starch, 1% pure chitosan film and pure glycerol (Liu et al., 2013)
46
Figure 3.4 : Deconvolution of SCN− band from 1990 cm− 1 to 2103 cm− 1 wavenumbers for sample with 40 wt. % NH4SCN (Aziz et al., 2012)
47
Figure 3.5 : X-ray patterns for plain starch, pure chitosan and starch-chitosan blend films with different glycerol concentration (Liu et al., 2013)
48
Figure 3.6 : XRD pattern of chitosan acetate with deconvoluted peaks (Hassan et al., 2013)
49
Figure 3.7 : Linear sweep voltammograms of the single-ion conductor polymer 51
Univers
ity of
Mala
ya
xii
samples at room temperature (Lian et al., 2014)
Figure 3.8 : The design of electrical double layer capacitor (EDLC) 52
Figure 3.9 : Cyclic voltammetry (CV) analysis in 1 M H2SO4 aqueous solution (Liu et al., 2006)
53
Figure 3.10 : Current 10 mA, current density 694 A kg−1 of activated carbon. Curves at cycle 915 and 916 (Lewandowski and Olejniczak, 2007)
54
Figure 4.1 : Chemical structure of oxalic acid.
56
Figure 4.2 : Resonance structures for oxalic acid ((a) and (c)) along with oxalate ion ((b) and (d)) for its first dissociation reaction (redraw from Solomon & Fryhle, 2004)
59
Figure 4.3 : Inductive effects in oxalic acid (redraw from Solomon & Fryhle, 2004)
59
Figure 4.4 : Nyquist plots of samples containing different wt. % of oxalic acid (a) 10 (OA10) (b) 20 (OA20) (c) 30 (OA30) (d) 40 (OA40) and (e) 50 (OA50)
60
Figure 4.5 : Graph of ionic conductivity of membranes for various OA contents at room temperature (300 K) with error bars
62
Figure 4.6 : Possible conduction mechanism in chitosan-oxalic acid system 63
Figure 4.7 : Nyquist plots for OA40 sample at elevated temperatures 65
Figure 4.8 : Plot of log ζdc vs. 103/T (K-1) for OA 40 membrane with error bars 65
Figure 4.9 : Fit to equation (4.10) of the real part of conductivity vs. frequency for (a) sample membranes with different oxalic acid contents at room temperature, 300 K, and (b) sample membrane OA40 at various temperatures (dotted line represent the extrapolation)
68
Figure 4.10 : Variation of exponent s versus temperature for OA40 70
Figure 4.11 : The dielectric constant, εr for samples with different amount of OA versus log f at room temperature, 300 K (the inset shows the enlarged plot at high frequencies)
71
Figure 4.12 : The dielectric constant, εr of 40 wt. % OA (OA40) sample versus log f at various temperatures (the inset shows the enlarged plot at high frequencies)
71
Figure 4.13 : Oxalic acid dependence of dielectric constant, εr and ionic conductivity at room temperature, 300 K
72
Univers
ity of
Mala
ya
xiii
Figure 4.14 : Temperature dependence of dielectric constant, εr for OA40 at selected frequencies
73
Figure 4.15 : Variation of tan δ with frequency for samples with different amount of OA at room temperature, 300 K
74
Figure 4.16 : Variation of tan δ with frequency for OA40 sample at elevated temperatures
75
Figure 4.17 : Log η versus weight percentage of oxalic acid 76
Figure 4.18: Variation of log η with temperature for the highest conducting sample OA40 (dotted line depicts that the points lie on a straight line hence obeying Arrhenius expression)
76
Figure 4.19 : Nyquist plots of samples containing different wt. % of glycerol (a) 10 (OG10), (b) 20 (OAG0), (c) 30 (OG30), (d) 40 (OG40), (e) 50 (OG50) and (f) 60 (OG60)
78
Figure 4.20 : Graph of ionic conductivity of membranes for various glycerol contents at room temperature (300 K) with error bars
79
Figure 4.21 : Possible conduction mechanism in chitosan-oxalic acid-glycerol system
81
Figure 4.22 : Nyquist plot for OG60 sample at various temperatures 82
Figure 4.23 : Plot of log ζdc vs. 103/T (K-1) for OG60 membrane with error bars 82
Figure 4.24 : Fit to Eq. (4.10) of the real part of conductivity against frequency for (a) sample membranes with different oxalic acid contents at room temperature, 300K, and (b) sample membrane OG60 at various temperatures (dotted line represent the extrapolation)
85
Figure 4.25 : The dielectric constant, εr for samples with different amount of glycerol versus log f at room temperature, 300 K (the inset shows the enlarged plot at high frequencies)
87
Figure 4.26 : Glycerol dependence of dielectric constant, εr and ionic conductivity at room temperature, 300 K
88
Figure 4.27 : Variation of tan δ with frequency for sample with different amount of plasticizer glycerol at room temperature, 300 K
89
Figure 4.28 : Log η versus amount of glycerol (wt. %) 89
Figure 5.1 : A schematic diagram of Fourier transform infrared (FTIR) 92
Figure 5.2 : FT-IR spectra of (a) pure chitosan, (b) OA10, (c) OA20, (d) OA30, (e) OA40, (f) OA50, and (g) pure OA
95
Univers
ity of
Mala
ya
xiv
Figure 5.3 : FTIR spectra in the range between 3700 and 3000 cm-1 for (a) pure chitosan, (b) OA10, (c) OA20, (d) OA30, (e) OA40 and (f) OA50.
97
Figure 5.4 : FTIR spectra in the range between 1800 and 1400 cm-1 for (a) pure chitosan, (b) OA10, (c) OA20, (d) OA30, (e) OA40 and (f) OA50
97
Figure 5.5 : The scheme of hydrogen bonding occurrence. The Z atom is the electronegative atom such as O, N, & F (Solomon & Fryhle, 2004)
98
Figure 5.6 : Deconvolution and band-fitting of IR spectra between 3700 and 3000 cm-1 for (a) chitosan, (b) OA10, (c) OA20, (d) OA30, (e) OA40, (f) OA50
99
Figure 5.7 : Deconvolution and band-fitting of IR spectra between 1800 and 1400 cm-1 for (a) chitosan, (b) OA10, (c) OA20, (d) OA30, (e) OA40, (f) OA50
101
Figure 5.8 : Variation of peak areas of NH3+ and NH2 as a function of
oxalic acid content 102
Figure 5.9 : FT-IR spectra of (a) OG10, (b) OG20, (c) OG30, (d) OG40, (e) OG50, (f) OG60
103
Figure 6.1 : A schematic diagram of an x-ray diffractometer 107
Figure 6.2 : XRD patterns of (a) chitosan (b) OA10 (c) OA20 (d) OA30 (e) OA40 (f) OA50 (g) pure OA (inset)
109
Figure 6.3 : The deconvolution of XRD patterns of (a) chitosan, (b) OA10, (c) OA20, (d) OA30, (e) OA40, (f) OA50
111
Figure 6.4 : Chemical structure of chitosan, showing position numbering. The two angles Ψ and Φ define the chain conformation, and the angle χ define the O-6 orientation (redraw from Muzzarelli et al., 2012)
112
Figure 6.5 : Hydrogen bonds interaction between glycerol and carboxamide group of chitosan (redraw from Domjan et al., 2009)
114
Figure 6.6 : X-ray diffractograms of the plasticized sample membranes (a) OG10 (b) OG20 (c) OG30 (d) OG40 (e) OG50 (f) OG60
115
Figure 6.7 : The deconvolution of XRD patterns of (a) OG10 (b) OG20 (c) OG30 (d) OG40 (e) OG50 (f) OG60
116
Figure 6.6 : The possible attraction between carboxylate ions and glycerol based on XRD results
117
Figure 7.1 : Linear sweep voltammetry (LSV) of the highest conducting 123
Univers
ity of
Mala
ya
xv
plasticized polymer electrolyte OG60
Figure 7.2 : Cyclic voltammograms for EDLC comprises OG60 as electrolyte 124
Figure 7.3 : Charge-discharge characteristic for EDLC at fixed current, 1 mA 126
Figure 7.4 : Charge-discharge profile at different applied current 129
Figure 7.5 : Charge-discharge profile at applied current (a) 0.1 mA and (b) at 1 mA. The continuous line (‒) depicts the GCD curve at 1st cycle meanwhile dotted line (--) depicts curve at 10th cycle
130
Univers
ity of
Mala
ya
xvi
LIST OF TABLES
Table Caption Page
Table 2.1 : Comparison of the properties of battery, electrostatic capacitor and EC (Zhang et al., 2009)
6
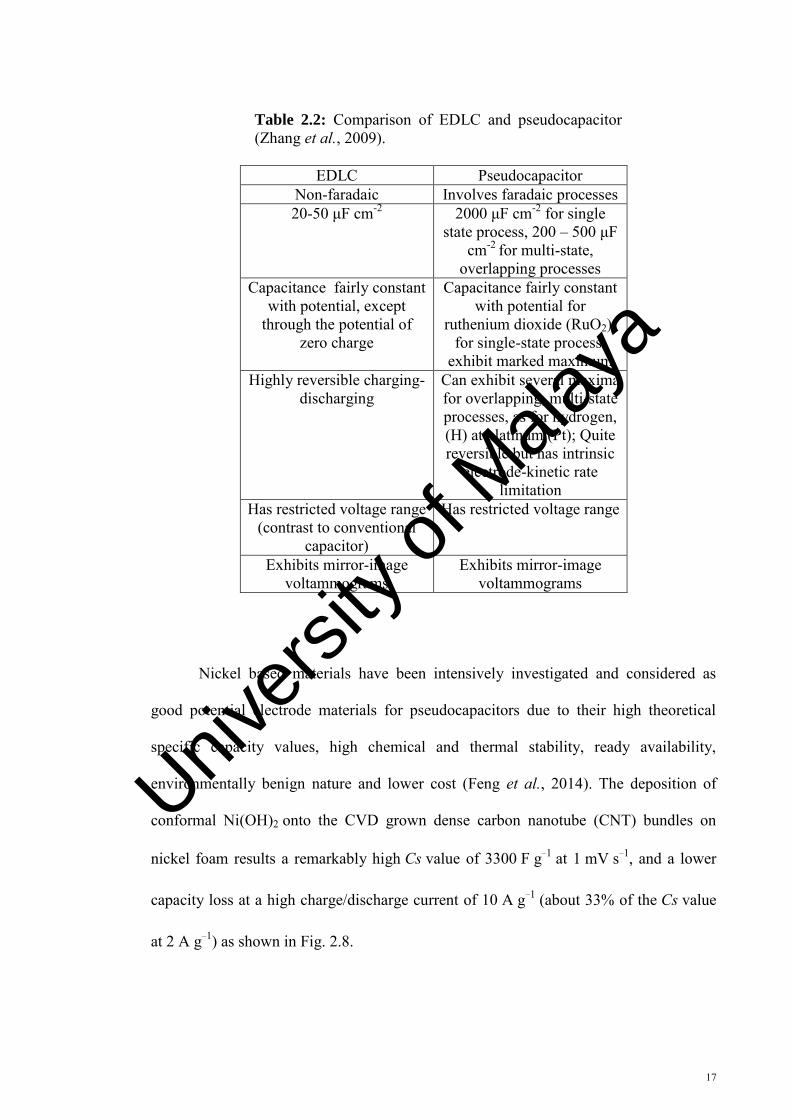
Table 2.2 : Comparison of EDLC and pseudocapacitor (Zhang et al., 2009) 16
Table 2.3 : Some works on chitosan base polymer electrolyte 28
Table 2.4 : VTF parameters and mechanical properties for poly(vinyl acetamide)-dimethyl formamide-lithium perchlorate (PVAc-DMF-LiClO4) electrolyte compositions (Baskaran et al., 2004)
36
Table 2.5 : Typical discharge capacitance of EDLC cells at a current density 200 μA cm−2 (taken from Pandey et al., 2011)
39
Table 3.1 : Various weight percentages of oxalic acid in chitosan membranes 41
Table 3.2 : The particular weight percent of glycerol in chitosan-oxalic acid membranes
43
Table 3.3 : Relationship between the four basic immittance function (MacDonald & Johnson, 2005)
44
Table 4.1 : Different weight percentage (wt. %) of oxalic acid used to prepare chitosan membranes and the thickness, bulk resistance and ionic conductivity values of all membranes at room temperature (300 K) with efficient area of 3.14 cm
62
Table 4.2 : Ionic conductivity values of OA40 at various temperatures with area and bulk resistance Rb
66
Table 4.3 : Comparison of parameters obtained from fit of the experimental data to Eq. 8 for (a) sample membranes with different oxalic acid content at room temperature, 300 K and (b) sample membrane OA40 at various temperatures
69
Table 4.4 : Different weight percentage (wt. %) of glycerol used to prepare chitosan membranes and the thickness, bulk resistance and ionic conductivity values of all membranes at room temperature (300 K) with efficient area of 3.14 cm
80
Table 4.5 : Ionic conductivity values of OG60 at various temperature with area and bulk resistance Rb
83
Table 4.6 : Comparison of parameters obtained from fit of the experimental 86
Univers
ity of
Mala
ya
xvii
data to Eq. 8 for (a) sample membranes with different glycerol content at room temperature, 300 K and (b) sample membrane OG60 at various temperatures
Table 5.1 : The vibrational modes and wavenumbers for chitosan, oxalic acid and glycerol
94
Table 5.2 : Deconvolution of IR spectra between 3700 and 3000 cm-1 100
Table 5.3 : Deconvolution of IR spectra between 1800 and 1400 cm-1 102
Table 6.1 : Room temperature conductivity value and degree of crystallinity of chitosan and the crosslinked membranes
113
Table 6.2 : Room temperature conductivity value and degree of crystallinity of chitosan and the crosslinked membranes
118
Table 7.1 : The specific capacitance, Cs value at respective scan rate 125
Table 7.2 : The calculated values of potential difference ∆V, specific capacitance Cs, energy density E, and power density P at different working potential
128
Table 7.3 : The calculated values of potential difference ∆V, specific capacitance Cs, energy density E, and power density P at different applied current
129
Table 7.4 : Parameters of GCD at different cyclic processes 131
Univers
ity of
Mala
ya
xviii
LIST OF JOURNAL & SEMINAR/ CONFERENCES
PRESENTATION
List of published Articles in Journal
1. Fadzallah, I. A., Majid, S. R., Careem, M. A. & Arof, A. K. (2014). Relaxation process in chitosan-oxalic acid solid polymer electrolytes. Ionics, 20, 969-975.
2. Fadzallah, I. A., Majid, S. R., Careem, M. A. & Arof, A. K. (2014). A study on ionic interactions in chitosan–oxalic acid polymer electrolyte membranes. Journal
of Membrane Science, 463, 65-72.
List of Presentation in Seminar and Conferences
1. Fadzallah, I. A., & Majid, S. R. ‘A study of chitosan crosslinked as membrane for direct methanol fuel cell,’ presented at Annual Physics Research Colloquium, 28-29 June 2012, University of Malaya, Kuala Lumpur, Malaysia.
2. Fadzallah, I. A., Majid, S. R., & Arof. A. K. ‘Ionic crosslinked chitosan membrane for fuel cell application: Ionic conductivity and electrical properties study. Presented at 8th Mathematical and Physical Sciences Graduate Congress
(MPSGC), 8-10 Disember 2012, University of Chulalongkorn, Bangkok, Thailand.
3. Fadzallah, I. A., Majid, S. R., & Arof. A. K. ‘Electrochemical studies on chitosan-based membrane,’ presented at 4th International Conference on Functional
Materials and Devices (ICFMD), 8-11 April 2013, Pulau Pinang, Malaysia.
4. Fadzallah, I. A., Majid, S. R., Careem, M. A., & Arof. A. K. ‘Electrochemical studies on chitosan-based membrane,’ presented at International Conference on
Science & Engineering of Materials International (ICSEM), 6-8 January 2014, Greater Noida, India.
5. Fadzallah, I. A., M. A. Careem & Arof, A.K. ‘Electrochemical studies on chitosan-based membrane,’ presented at International Conference on Materials
Science and Technology (ICMST), 13-17 October 2014, PUSPIPTEK, Serpong Tangerang, Indonesia.
Univers
ity of
Mala
ya
xix
LIST OF ABBREVIATIONS
(C2mim)(OAc) 1-ethyl-3-methylimidazolium acetate (C3mim)(C2SO4) 1-ethyl-3-methylimidazolium ethylsulfate (Ch)(OAc) Trimethyl-ethanolammonium (COOH)COO− Oxalate ion ACA Activated carbon aerogel CA Carbon aerogel Carot Carotene CNT Carbon nanotube Co3O4 Cobalt (II, III) oxide DMF Dimethylformamide EC Ethylene carbonate Eu(CF3SO3)3 Europium (III) trifluoromethanesulfonate Fe3O4 Iron (II, III) oxide Gel Gelatin H2SO4 Sulphuric acid H3BO3 Boric acid HEC Hydroxyethylcellulose HF Hydrogen fluoride IrO2 Iridium dioxide K2SO4 Potassium suphate Li2CO3 Lithium carbonate LiBF4 Lithium tetrafluoroborate LiCF3SO3 Lithium trifluoromethanesulfonate LiClO4 Lithium perchlorate LiFSi Lithium bis(fluorosulfonyl) imide LiPF6 Lithium hexafluorophosphate LiTFSI Lithium bis(trifluoromethane sulfonyl) imide MePrPipNTf2 N-Methyl-N-propylpiperidinium bis(trifluoromethanesulphonyl) MnO2 Manganese dioxide NC Networked cellulose NH4I Ammonium iodide NH4SCN Ammonium thiocyanate Ni(OH)2 Nickel (II) hydroxide NMP N-methyl-2-pyrrolidone PC Propylene carbonate PEG Poly(ethylene glycol) PEO Poly(ethylene oxide) PVA Poly(vinyl alcohol) PVAc Poly(vinyl acetate) PVFM Poly(vinyl formal) PVP Poly(vinyl pyrrolidone) RuO2 Ruthenium dioxide TEGDME Tetraethylene glycol dimethyl ether
Univers
ity of
Mala
ya
1
CHAPTER 1
INTRODUCTION
1.1 Research background
One of the greatest challenges in the 21st century is unquestionably energy
storage and conversion. As the concern over fossil fuel depletion and global warming
increases, the world needs to seek for renewable energy sources in order to sustain
energy requirement. Methods for storing electricity and retrieving when it is needed will
also have to be improved (Ma et al., 2014). The increased use of portable electronic
equipment such as mobile telephones and laptops and to encourage the use of electric
vehicles have generated the search for alternative and renewable energy sources such as
batteries, fuel cells and capacitors (Pernaut & Goulart, 1995; Hashmi & Upadhyaya,
2002; Emmenegger et al., 2003; Lavall et al., 2008).
Over the past few years, electrochemical capacitors that store energy in the
electric double layer at the electrode/electrolyte interface have ignited significant
worldwide research because of the large specific capacitance, rapid
charging/discharging rates, high power performance, long cycle life, and environment-
friendly features (Nohara et al., 2003; Yu et al., 2012; Ma et al., 2014). Most of the
reports on supercapacitors are based on liquid electrolytes (Ingram et al., 2004; Ma et
al., 2013). Although liquid electrolytes possess high ionic conductivity they are prone to
leakage, corrosion and explosions (Staiti et al., 2002; Lavall et al., 2008). Replacing
liquid electrolytes with solid electrolytes in supercapacitors has been explored by many
Univers
ity of
Mala
ya
2
researchers. Solid electrolytes have several advantages over liquids that include easy
handling without spillage of hazardous liquids and thus making it environmentally safe,
minimal internal corrosion, simple principle and mode of construction and flexibility in
packaging (Sivaraman et al., 2010; Yu et al., 2011).
Various ways have been employed in order to enhance the performance of solid
polymer electrolyte such as addition of plasticizers (Masuda et al., 2007; Lee et al.,
2010), ceramic fillers (Wen et al., 2003; Shin et al., 2005) and polymer blending
(Micheal & Prabaharan 2004; Venkatesan et al., 2014). The low room temperature ionic
conductivity of solid polymer-salt complexes is likely due to their high crystalline
fraction and is the main drawback for technological applications. Plasticization has
proved to be an effective way to enhance conductivity of solid polymer electrolytes
(Qian et al., 2002). Plasticization will make the polymer electrolyte more amorphous
and will assist in the dissociation of the salt thereby increasing the number of mobile
charge carriers (Pradhan et al., 2007; Pandey et al., 2013).
1.2 Scope and objectives of the research
In this work, chitosan based solid polymer electrolyte will be prepared with the
addition of oxalic acid as the proton source and glycerol as the plasticizer. The scope of
this research includes incorporating the polymer host (i.e. chitosan) with different
concentrations (wt. %) of oxalic acid. The ionic conductivity of the polymer electrolytes
is further enhanced by plasticizing the polymer-oxalic acid system with different
glycerol concentrations. The electrochemical property such as capacitive behaviour and
galvanostatic charge-discharge of the highest conducting plasticized polymer electrolyte
Univers
ity of
Mala
ya
3
will then be investigated before it is used as an electrolyte in electrical double layer
capacitors.
It is therefore obvious that the objectives of the present work are:
To develop a high conducting solid polymer electrolyte using chitosan as the
polymer host.
To enhance and optimize the ionic conductivity value of the chitosan based
polymer electrolyte by plasticization with glycerol.
To characterize the chitosan based polymer electrolytes using electrochemical
impedance spectroscopy (EIS), Fourier transform infrared spectroscopy (FTIR)
and x-ray diffraction (XRD).
To fabricate an electrical double layer capacitor (EDLC) device using the
optimized plasticized polymer electrolyte.
1.3 Thesis organization
This thesis is divided into nine chapters. Chapter 1 presents the motivation of the
present work and is a brief introduction of the activities of the present investigation. The
literature review in Chapter 2 though inexhaustive, provides an overview of different
types of electrochemical capacitors, polymer electrolytes, improvement of polymer
electrolytes, their properties and application. Chapter 3 describes the experimental
methods. Chapter 4 looks at the effect of oxalic acid and glycerol addition to the ionic
conductivity and electrical properties of chitosan and chitosan-oxalic acid systems.
Chapter 5 discusses further on the interactions between chitosan-oxalic acid and
chitosan-oxalic acid-glycerol systems Fourier Transform Infrared (FTIR). The degree of
crystallinity for polymer electrolytes is presented in Chapter 6. Chapter 7 reports on the
Univers
ity of
Mala
ya
4
electrochemical behaviour of the plasticized polymer electrolyte and its application in
an electrical double layer capacitor (EDLC). Discussion on the results obtained is
divulged in Chapter 8. Chapter 9 concludes the dissertation with some suggestions for
further studies.
Univers
ity of
Mala
ya
5
CHAPTER 2
LITERATURE REVIEW
2.1 Introduction
Energy is important for our daily activities since it is needed to power our
homes, drive our cars, and even to feed and clothe us. A wide range of technological
uses of energy have emerged and developed, so much so that energy availability of has
become a major issue in society. Wood and hydrocarbon natural fossil fuels, such as
coal and crude oil are the easiest way to acquire useful energy. However, climate
change and the decreasing availability of fossil fuels require society to move towards
sustainable and renewable resources. This has led to an increase in renewable energy
production from the sun and wind. Electric vehicles or hybrid electric vehicles with low
carbon dioxide emission that require batteries are being developed to help reduce
environmental issues. Energy storage systems such as batteries and electrochemical
capacitors have started to influence a larger part in our daily activities (Simon &
Gogotsi, 2008).
2.2 Electrochemical capacitors (EC)
Electrochemical capacitors (EC) have been known for many years and the world
witnessed the first patented EC work in 1957 by Becker who described a capacitor
based on high surface area carbon. EC has been considered for use in hybrid electric
vehicles in a development program initiated in 1989. EC was supposed to boost the
Univers
ity of
Mala
ya
6
battery or the fuel cell in hybrid electric vehicles by providing the necessary power for
acceleration and additionally allow for recuperation of braking energy (Kötz & Carlen,
2000; Burke, 2007). The EC applications are principally boost components supporting
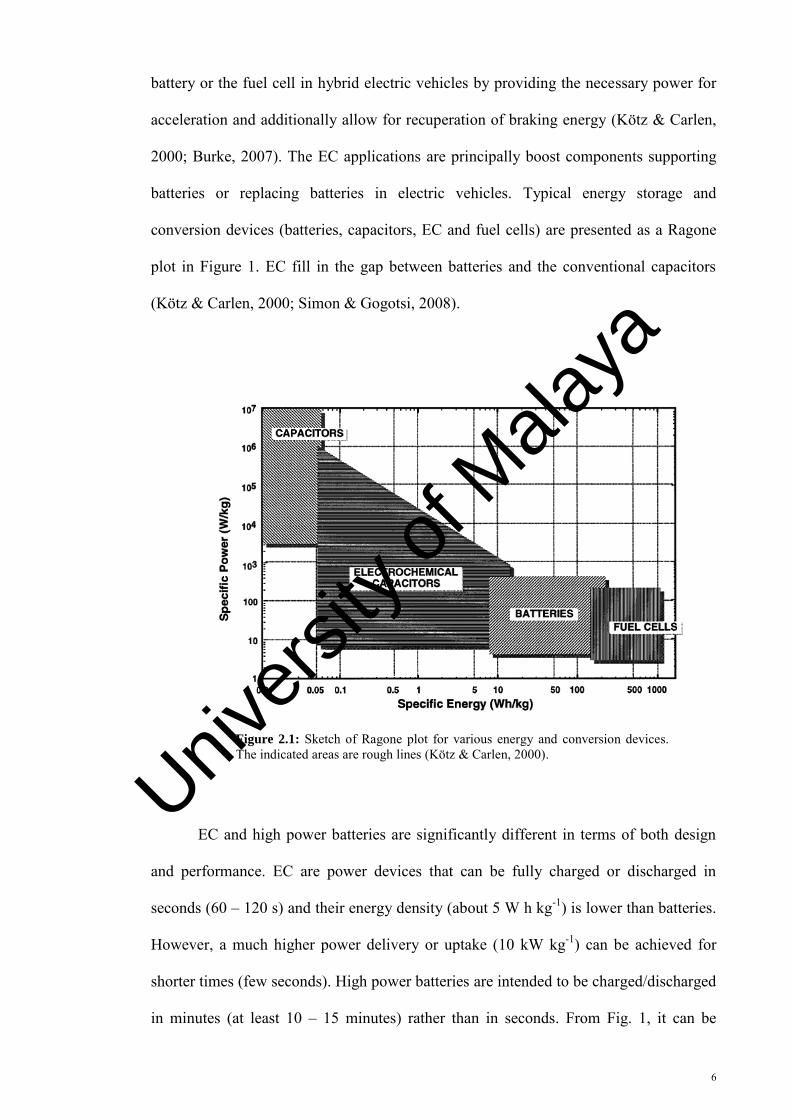
batteries or replacing batteries in electric vehicles. Typical energy storage and
conversion devices (batteries, capacitors, EC and fuel cells) are presented as a Ragone
plot in Figure 1. EC fill in the gap between batteries and the conventional capacitors
(Kötz & Carlen, 2000; Simon & Gogotsi, 2008).
Figure 2.1: Sketch of Ragone plot for various energy and conversion devices. The indicated areas are rough lines (Kötz & Carlen, 2000).
EC and high power batteries are significantly different in terms of both design
and performance. EC are power devices that can be fully charged or discharged in
seconds (60 – 120 s) and their energy density (about 5 W h kg-1) is lower than batteries.
However, a much higher power delivery or uptake (10 kW kg-1) can be achieved for
shorter times (few seconds). High power batteries are intended to be charged/discharged
in minutes (at least 10 – 15 minutes) rather than in seconds. From Fig. 1, it can be
Univers
ity of
Mala
ya
7
observed that batteries and low temperature fuel cells are typical low power devices
whereas conventional capacitors may have a power density of 106 watts per dm3 but
very low energy density. EC has been used to complement or replace batteries in the
energy storage field such as for uninterruptible power supplies (back-up supplies used
to protect against power disruption) and load levelling (Burke, 2007; Simon & Gogotsi,
2008).
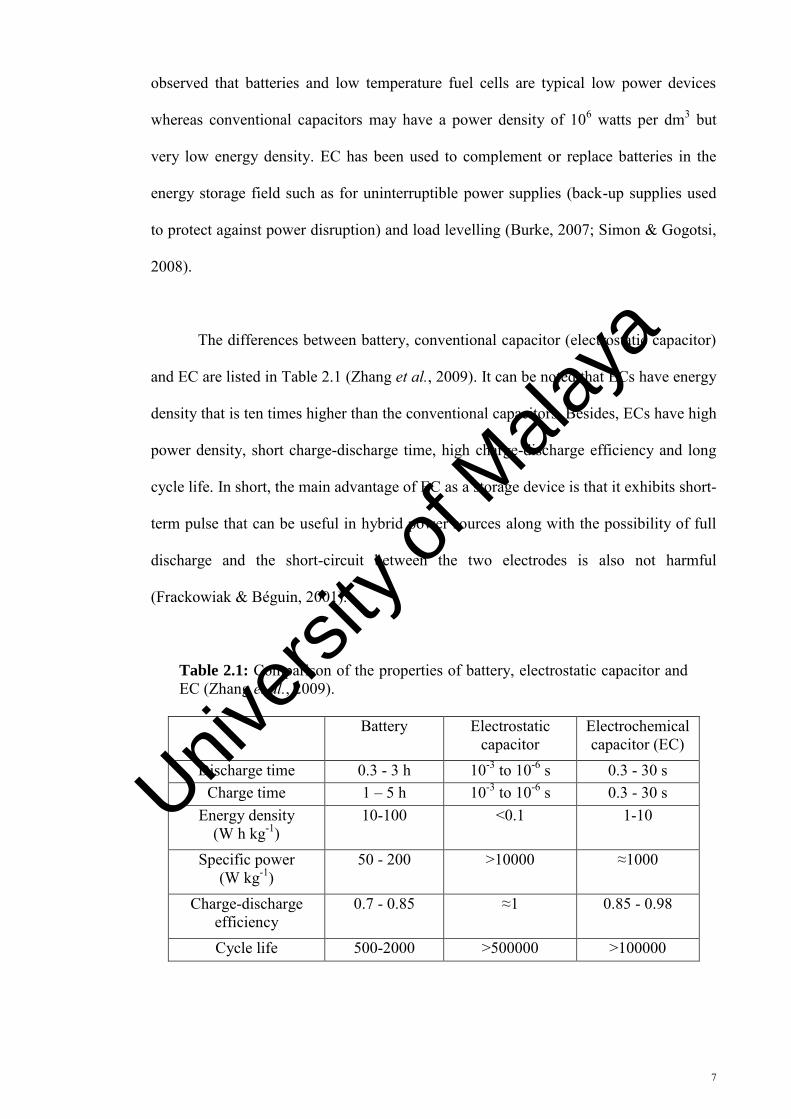
The differences between battery, conventional capacitor (electrostatic capacitor)
and EC are listed in Table 2.1 (Zhang et al., 2009). It can be noted that ECs have energy
density that is ten times higher than the conventional capacitors. Besides, ECs have high
power density, short charge-discharge time, high charge-discharge efficiency and long
cycle life. In short, the main advantage of EC as a storage device is that it exhibits short-
term pulse that can be useful in hybrid power sources along with the possibility of full
discharge and the short-circuit between the two electrodes is also not harmful
(Frackowiak & Béguin, 2001).
Table 2.1: Comparison of the properties of battery, electrostatic capacitor and EC (Zhang et al., 2009).
Battery Electrostatic
capacitor Electrochemical capacitor (EC)
Discharge time 0.3 - 3 h 10-3 to 10-6 s 0.3 - 30 s Charge time 1 – 5 h 10-3 to 10-6 s 0.3 - 30 s
Energy density (W h kg-1)
10-100 <0.1 1-10
Specific power (W kg-1)
50 - 200 >10000 ≈1000
Charge-discharge efficiency
0.7 - 0.85 ≈1 0.85 - 0.98
Cycle life 500-2000 >500000 >100000
Univers
ity of
Mala
ya
8
ECs can be classified according to the charge storage mechanism as well as the
active materials used. The first type is electrical double layer capacitor (EDLC) which
uses high surface area carbon electrodes and the charge storage mechanism arises from
the charge separation at the electrode/electrolyte interface (Zhang et al., 2009). Other
types of EC are redox based EC and hybrid EC (Yang et al., 2005, Simon & Gogotsi,
2008).
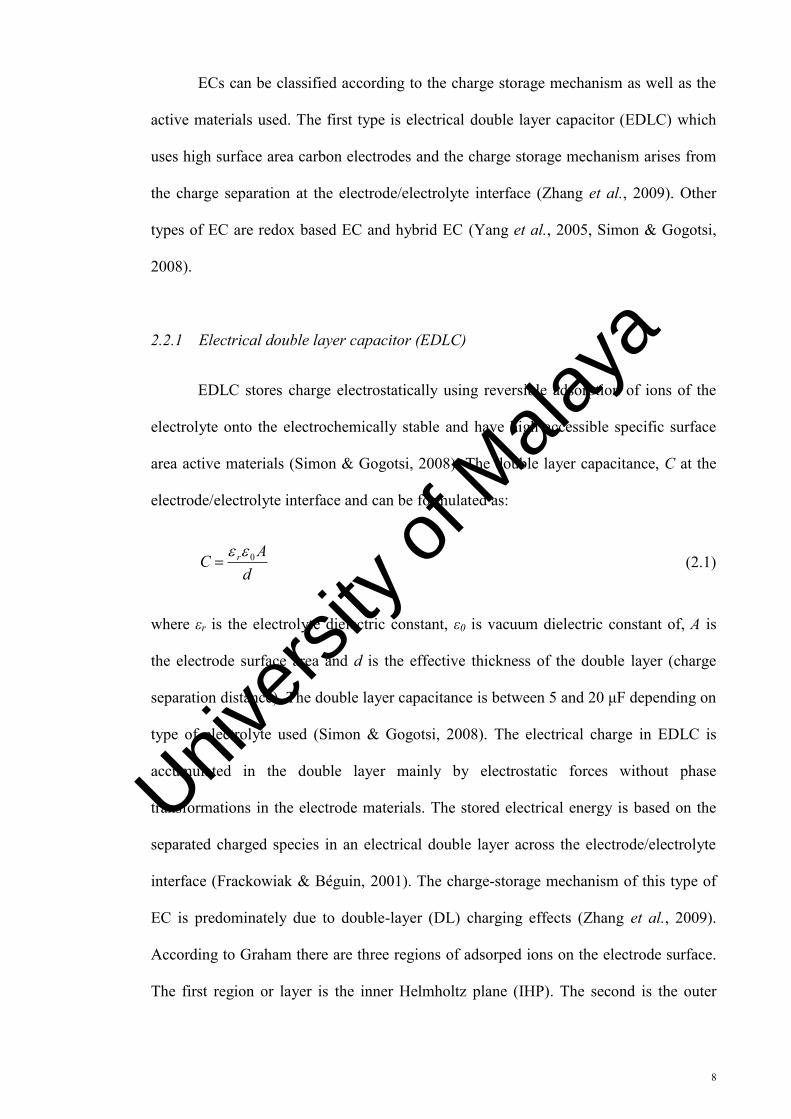
2.2.1 Electrical double layer capacitor (EDLC)
EDLC stores charge electrostatically using reversible adsorption of ions of the
electrolyte onto the electrochemically stable and have high accessible specific surface
area active materials (Simon & Gogotsi, 2008). The double layer capacitance, C at the
electrode/electrolyte interface and can be formulated as:
dAC r 0
(2.1)
where εr is the electrolyte dielectric constant, ε0 is vacuum dielectric constant of, A is
the electrode surface area and d is the effective thickness of the double layer (charge
separation distance). The double layer capacitance is between 5 and 20 μF depending on
type of electrolyte used (Simon & Gogotsi, 2008). The electrical charge in EDLC is
accumulated in the double layer mainly by electrostatic forces without phase
transformations in the electrode materials. The stored electrical energy is based on the
separated charged species in an electrical double layer across the electrode/electrolyte
interface (Frackowiak & Béguin, 2001). The charge-storage mechanism of this type of
EC is predominately due to double-layer (DL) charging effects (Zhang et al., 2009).
According to Graham there are three regions of adsorped ions on the electrode surface.
The first region or layer is the inner Helmholtz plane (IHP). The second is the outer
Univers
ity of
Mala
ya
9
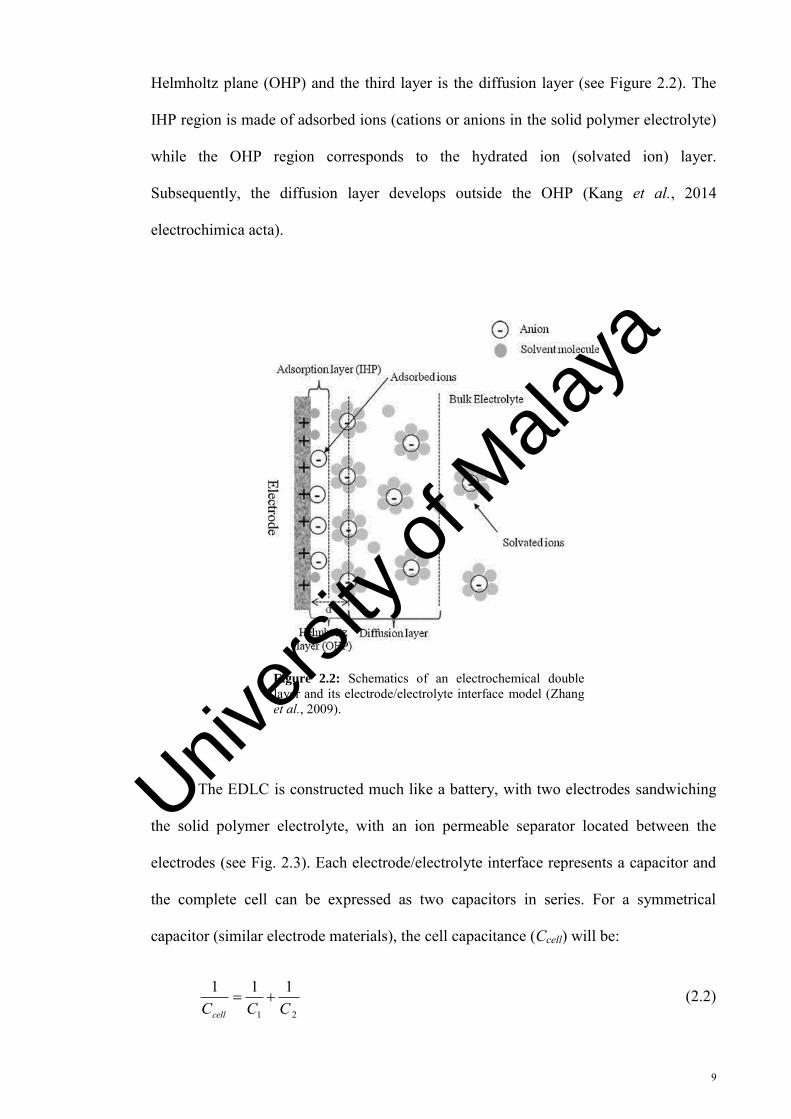
Helmholtz plane (OHP) and the third layer is the diffusion layer (see Figure 2.2). The
IHP region is made of adsorbed ions (cations or anions in the solid polymer electrolyte)
while the OHP region corresponds to the hydrated ion (solvated ion) layer.
Subsequently, the diffusion layer develops outside the OHP (Kang et al., 2014
electrochimica acta).
Figure 2.2: Schematics of an electrochemical double layer and its electrode/electrolyte interface model (Zhang et al., 2009).
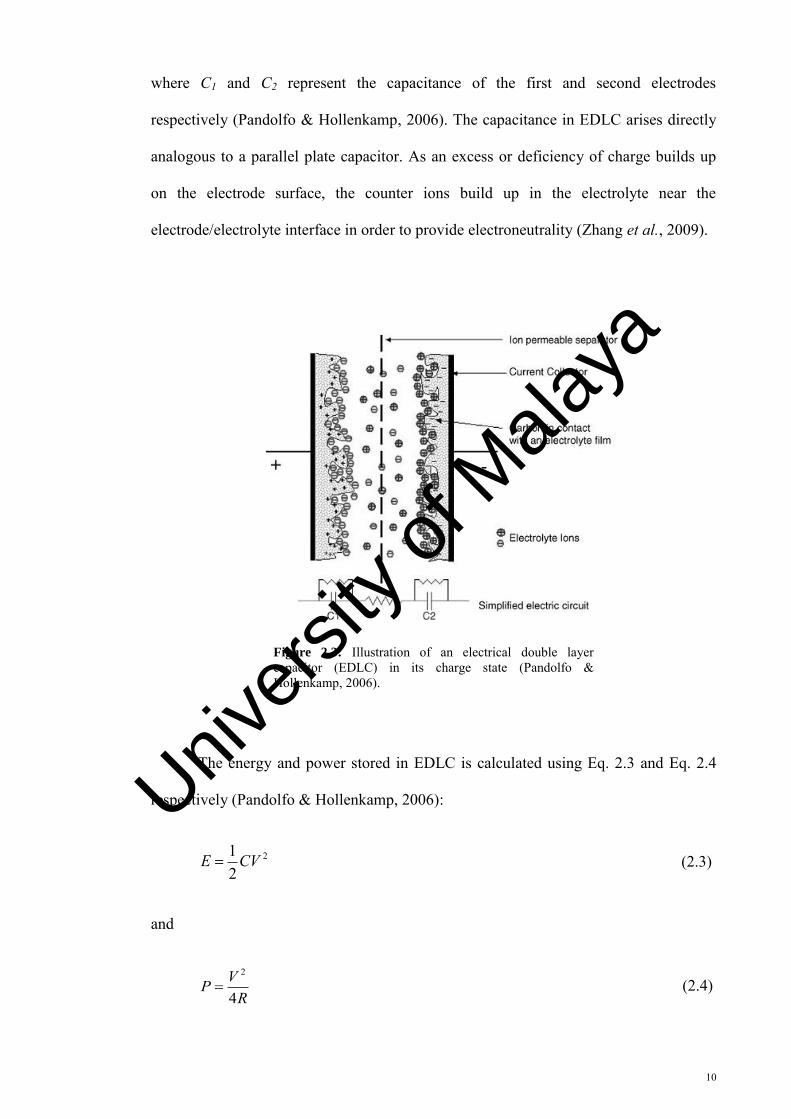
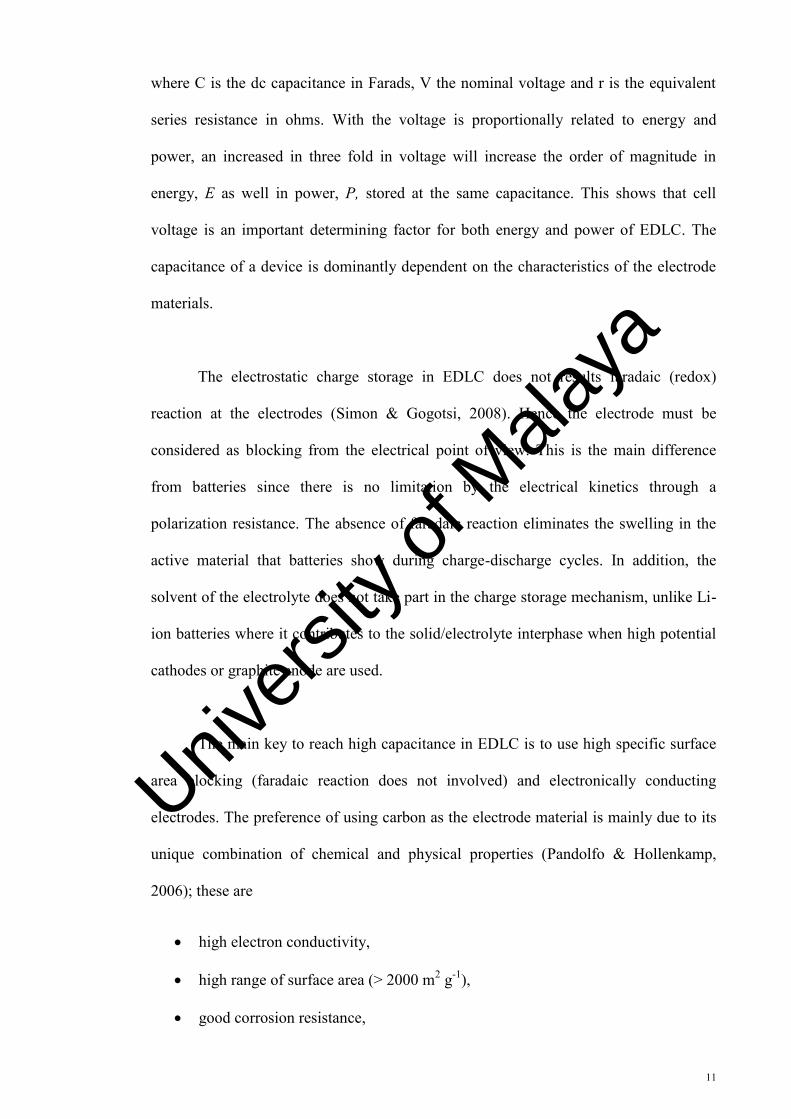
The EDLC is constructed much like a battery, with two electrodes sandwiching
the solid polymer electrolyte, with an ion permeable separator located between the
electrodes (see Fig. 2.3). Each electrode/electrolyte interface represents a capacitor and
the complete cell can be expressed as two capacitors in series. For a symmetrical
capacitor (similar electrode materials), the cell capacitance (Ccell) will be:
21
111CCCcell
(2.2)
Univers
ity of
Mala
ya
10
where C1 and C2 represent the capacitance of the first and second electrodes
respectively (Pandolfo & Hollenkamp, 2006). The capacitance in EDLC arises directly
analogous to a parallel plate capacitor. As an excess or deficiency of charge builds up
on the electrode surface, the counter ions build up in the electrolyte near the
electrode/electrolyte interface in order to provide electroneutrality (Zhang et al., 2009).
Figure 2.3: Illustration of an electrical double layer capacitor (EDLC) in its charge state (Pandolfo & Hollenkamp, 2006).
The energy and power stored in EDLC is calculated using Eq. 2.3 and Eq. 2.4
respectively (Pandolfo & Hollenkamp, 2006):
2
21 CVE (2.3)
and
RVP4
2
(2.4)
Univers
ity of
Mala
ya
11
where C is the dc capacitance in Farads, V the nominal voltage and r is the equivalent
series resistance in ohms. With the voltage is proportionally related to energy and
power, an increased in three fold in voltage will increase the order of magnitude in
energy, E as well in power, P, stored at the same capacitance. This shows that cell
voltage is an important determining factor for both energy and power of EDLC. The
capacitance of a device is dominantly dependent on the characteristics of the electrode
materials.
The electrostatic charge storage in EDLC does not results faradaic (redox)
reaction at the electrodes (Simon & Gogotsi, 2008). Hence the electrode must be
considered as blocking from the electrical point of view. This is the main difference
from batteries since there is no limitation by the electrical kinetics through a
polarization resistance. The absence of faradaic reaction eliminates the swelling in the
active material that batteries show during charge-discharge cycles. In addition, the
solvent of the electrolyte does not take part in the charge storage mechanism, unlike Li-
ion batteries where it contributes to the solid/electrolyte interphase when high potential
cathodes or graphite anode are used.
The main key to reach high capacitance in EDLC is to use high specific surface
area blocking (faradaic reaction does not involved) and electronically conducting
electrodes. The preference of using carbon as the electrode material is mainly due to its
unique combination of chemical and physical properties (Pandolfo & Hollenkamp,
2006); these are
high electron conductivity,
high range of surface area (> 2000 m2 g-1),
good corrosion resistance,
Univers
ity of
Mala
ya
12
high temperature stability,
controlled pore structure,
processability and compatibility in composite materials,
relatively low cost.
The first two of these properties are critical to the construction of EDLC
electrodes. The conductivity of carbon material is influenced by the increasing
proportion of conjugated carbon in the sp2 state during carbonization as electrons
associated with π-bonds are delocalized and become available as charge carriers. Hence
the electrical conductivity increases as separate conjugated systems also become
interconnected to form a conducting network. The conductivity of solid carbon started
to increase in the temperature range between 600 and 700 °C that corresponds to the
range which carbon loses its acidic functionalities (primarily by formation of H2O and
CO2). Furthermore, the heat treatment increases the conductivity of carbon by
alternating the degree of structural disorder, varying from nearly amorphous carbon to
the near perfect crystals of graphite which formed at temperatures higher than 2300 °C
(Pandolfo & Hollenkamp, 2006).
Activation process is needed in order to increase surface area and porosity from
a carbonized organic precursor (known as char) and results in broad group of materials
production which referred to as activated carbons (Pandolfo & Hollenkamp, 2006).
Chars generally have a relatively low porosity and their structure consists of crystallites
with a large number of interstices between them. The interstices tend to be occupied
with disorganized carbon residues that block the entrances to the pores. The activation
processes open these pores and form additional porosity that can be categorized as
thermal activation and chemical activation. The development of porous network in the
Univers
ity of
Mala
ya
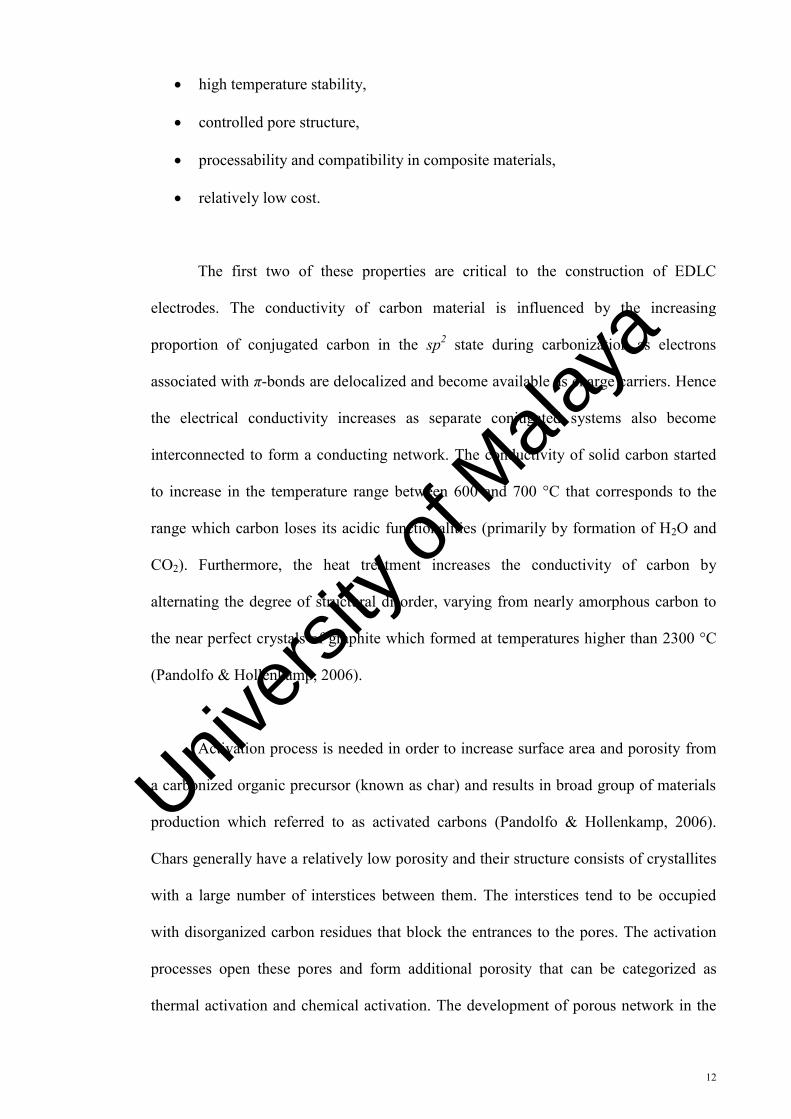
13
bulk of the carbon particles that results in the presence of micropores (smaller than 2
nm), mesopores (between 2 and 50 nm) and macropores (larger than 50 nm) can be seen
in Fig. 2.4 (Simon & Burke, 2008). The mobility of ions within the pores is different to
the mobility of ions in the bulk of the electrolytic solution, and thus it is greatly
influenced by the pore size of the electrode (Sharma & Bhatti, 2010). The pore size is
important for easy access of the electrolyte ions into the pores. Small pore size will
make the bigger sized ions difficult to pass through disabling the ions to contribute to
the double layer capacitance. Hence the pore size must be chosen to suit the electrolyte
and thereby ensure that the pore size distribution is optimal based on the size of the ions
(Frackowiak & Béguin, 2001; Sharma & Bhatti, 2010).
Figure 2.4: Schematic diagram of the pore size network of an activated carbon grain (Simon & Burke, 2008).
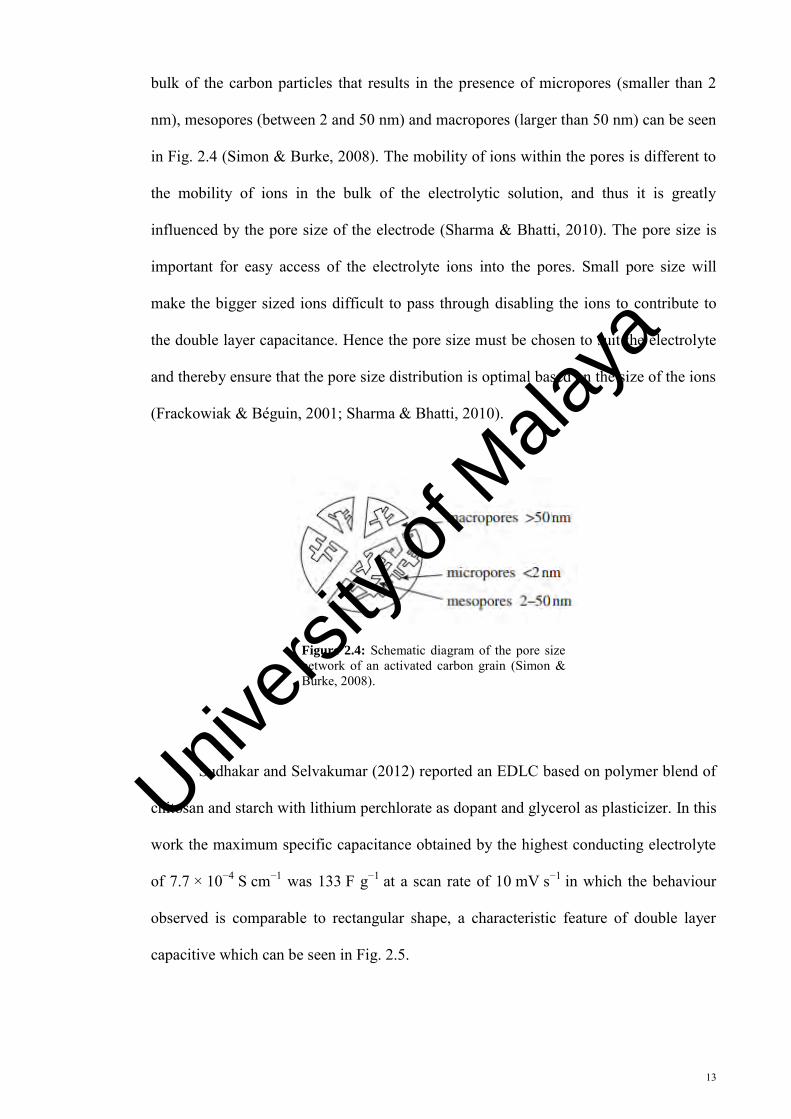
Sudhakar and Selvakumar (2012) reported an EDLC based on polymer blend of
chitosan and starch with lithium perchlorate as dopant and glycerol as plasticizer. In this
work the maximum specific capacitance obtained by the highest conducting electrolyte
of 7.7 × 10⁻⁴ S cm−1 was 133 F g−1 at a scan rate of 10 mV s−1 in which the behaviour
observed is comparable to rectangular shape, a characteristic feature of double layer
capacitive which can be seen in Fig. 2.5.
Univers
ity of
Mala
ya
14
Figure 2.5: Cyclic voltammetrics of the fabricated carbon–carbon symmetric supercapacitor using LiClO4 doped CS/starch blend electrolyte at scan rates. (a) 50 mV s−1, (b) 25 mV s−1, (c) 20 mV s−1, (d) 15 mV s−1 (e) 10 mV s−1, and (f) 5 mV s−1 (Sudhakar and Selvakumar, 2012).
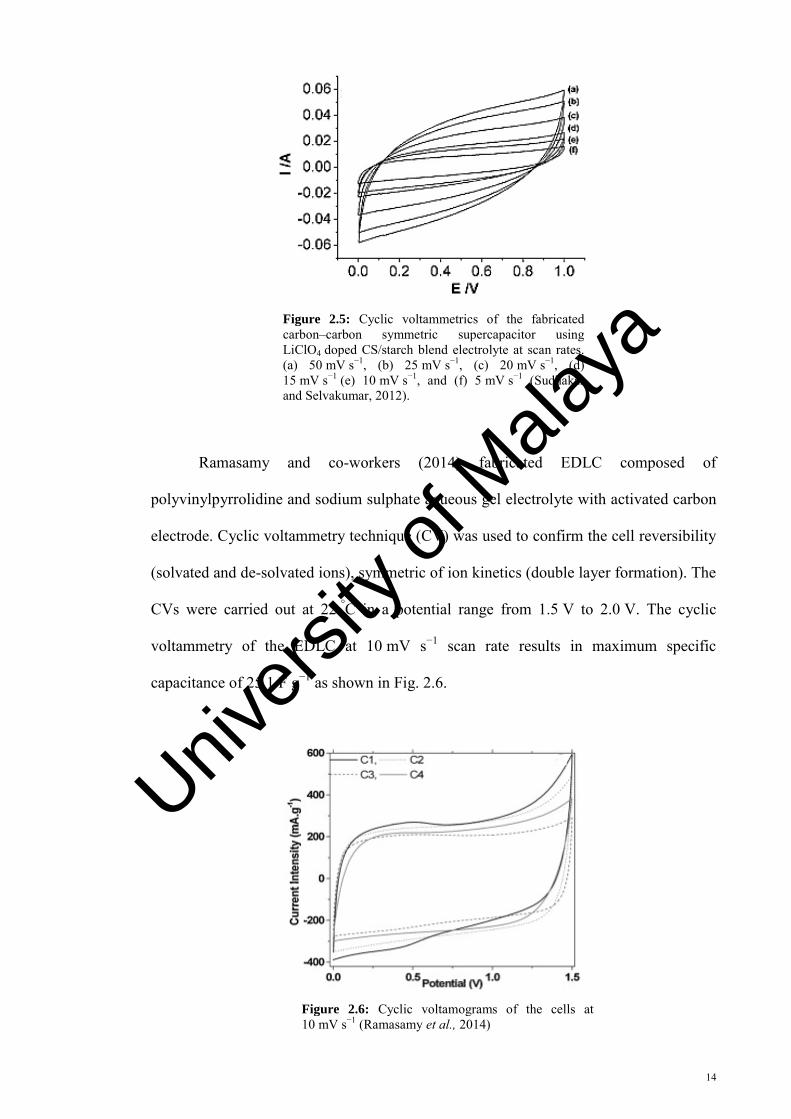
Ramasamy and co-workers (2014) fabricated EDLC composed of
polyvinylpyrrolidine and sodium sulphate aqueous gel electrolyte with activated carbon
electrode. Cyclic voltammetry technique (CV) was used to confirm the cell reversibility
(solvated and de-solvated ions), symmetric of ion kinetics (double layer formation). The
CVs were carried out at 22 °C in a potential range from 1.5 V to 2.0 V. The cyclic
voltammetry of the EDLC at 10 mV s−1 scan rate results in maximum specific
capacitance of 25.1 F g−1 as shown in Fig. 2.6.
Figure 2.6: Cyclic voltamograms of the cells at 10 mV s−1 (Ramasamy et al., 2014)
Univers
ity of
Mala
ya
15
2.2.2 Redox based electrochemical capacitor
The second type of EC is redox based EC which is also called as
pseudocapacitors which arises on electrodes when the application of a potential induces
faradaic current from reactions such as electrosorption or from the oxidation-reduction
(redox) of electroactive materials. Some examples of the electroactive materials are
ruthenium dioxide (RuO2), iridium dioxide (IrO2), iron(II,III) oxide (Fe3O4), manganese
dioxide (MnO2), cobalt (II,III) oxide (Co3O4), as well as electronically conducting
polymers have been extensively studied (Simon & Gogotsi, 2008; Zhang et al., 2009).
The electrosorption process occurs when chemisorption of electron donating anion (A-)
such as chloride (Cl-), bromide (B-), iodide (I-), or thiocyanate (CNS-) takes place in a
process such as:
M + A- MA(1-δ)- + δe- (2.5)
In Eq. 2.5, M is the metal ion and A is anion. Such an electrosorption reaction of
A- anions at the surface of an electrode, and the quantity δe- are related to the so called
electrosorption valence. Rather than a static separation of charge across a finite distance,
an exchange of charge across the double layer results in oxidation-reduction reactions:
Oxn + ne- Red (2.6)
where Oxn and Red refer to oxidation and reduction reaction, the charge ne- exchanged in
this reaction and the energy storage is indirect and analogous to that of a battery (Zhang
et al., 2009).
Wen et al. (2004) investigated the role of cations of the electrolyte for the
pseudocapacitive behavior of metal oxide electrodes MnO2. They reported that
capacitances in aprotic solvents were drastically decreased to the smaller values than
Univers
ity of
Mala
ya
16
that in aqueous neutral solutions. Thus the contribution of the proton to the
pseudocapacitive process is not negligible. The charge storage mechanism of
MnO2 electrode is concluded to involve a fast redox reaction through both potassium
ion exchange, MnO2 + δK+ + δ e− ↔MnO2−δ(OK)δ and proton exchange, MnO2 + δH+ +
δe− ↔ MnO2−δ(OH)δ. The metal oxide supercapacitors are charged by chemisorption of
cation of the electrolyte, proton or the alkaline ion depending on the availability.
Figure 2.7: This schematic of cyclic voltammetry for manganese dioxide, MnO2
- electrode cell in mild aqueous electrolyte (0.1 M K2SO4). The upper part is related to the oxidation from Mn(III) to Mn(IV) and the lower part refers to the reduction Mn(IV) to Mn(III) (Simon & Gogotsi, 2008).
Since redox reactions are used, pseudocapacitors are similar to batteries, often
suffer from a lack of stability during cycling. Fig. 2.7 shows a cyclic voltammetry for
electrode cell composed of manganese dioxide, MnO2- in mild aqueous electrolyte (0.1
M potassium sulphate, K2SO4) with the successive multiple surface redox reactions
leading to the pseudo-capacitive charge storage mechanism (Simon & Gogotsi, 2008).
Hence, the differences between EDLC and pseudocapacitor are compared and tabulated
in Table 2.2 (Zhang et al., 2009).
Univers
ity of
Mala
ya
17
Table 2.2: Comparison of EDLC and pseudocapacitor (Zhang et al., 2009).
EDLC Pseudocapacitor
Non-faradaic Involves faradaic processes 20-50 μF cm-2 2000 μF cm-2 for single
state process, 200 – 500 μF cm-2 for multi-state,
overlapping processes Capacitance fairly constant
with potential, except through the potential of
zero charge
Capacitance fairly constant with potential for
ruthenium dioxide (RuO2); for single-state process,
exhibit marked maximum Highly reversible charging-
discharging Can exhibit several maxima for overlapping, multi-state processes, as for hydrogen, (H) at platinum (Pt); Quite reversible but has intrinsic
electrode-kinetic rate limitation
Has restricted voltage range (contrast to conventional
capacitor)
Has restricted voltage range
Exhibits mirror-image voltammograms
Exhibits mirror-image voltammograms
Nickel based materials have been intensively investigated and considered as
good potential electrode materials for pseudocapacitors due to their high theoretical
specific capacity values, high chemical and thermal stability, ready availability,
environmentally benign nature and lower cost (Feng et al., 2014). The deposition of
conformal Ni(OH)2 onto the CVD grown dense carbon nanotube (CNT) bundles on
nickel foam results a remarkably high Cs value of 3300 F g−1 at 1 mV s−1, and a lower
capacity loss at a high charge/discharge current of 10 A g−1 (about 33% of the Cs value
at 2 A g−1) as shown in Fig. 2.8.
Univers
ity of
Mala
ya
18
Figure 2.8: Charge-discharge profile of Ni(OH)2 on dense CNT at different discharging current densities (Feng et al., 2014).
2.2.3 Hybrid electrochemical capacitors
Hybrid EC offers an attractive alternative to pseudocapacitors and EDLC as in
this type of capacitor, the electrodes are composed of an asymmetrical configuration.
The electrodes are comprises of a double layer carbon material and a pseudocapacitance
material. The pseudocapacitance electrodes accumulate charge through faradic
electrochemical process (redox reaction), which can increase the specific capacitance of
the capacitor, improve specific energy and power densities, and extend the working
voltage. Currently, two different approaches to hybrid EC have emerged:
(i) pseudo-capacitive metal oxides with a capacitive carbon electrode
(ii) lithium-insertion electrodes with capacitive carbon electrode.
In this type of EC, the faradaic electrodes led to an increase in the energy density
at the cost of cycle-ability (for balanced positive and negative electrode capacities). This
is the main drawback of the hybrid EC as compared with EDLC, since it is important to
Univers
ity of
Mala
ya
19
deflect transforming a good capacitor into a mainstream battery (Simon & Gogotsi,
2008; Zhang et al., 2009).
In this work, electrical double layer capacitor (EDLC) has been chosen as the
charge storage device utilizing solid polymer electrolyte which also acts as the
separator. Polymer electrolyte will be discussed in Section 2.3, and the ionic
conductivity improvement methods will be dealt with in Section 2.4. The
characterization of the selected polymer electrolyte will be reviewed in Section 2.5
whereas the characterization of the fabricated EDLC will be further elaborated in
Section 2.6.
2.3 Polymer electrolyte
Polymer electrolyte can be defined as any polymer-based structure with
significant ionic conductivity. The solid character of polymers is generally related to the
molecular weight of the polymer (Sequira & Santos, 2010). Subsequently the low
molecular weight polymers are often liquid which reflects that the polymer character
can be in the range from liquids to very hard and rigid materials. Di Noto and co-
workers (2011) illustrate polymer electrolytes as macromolecular systems capable of
dissolving suitable salts. The salts then will provide the ionic conductivity to the
material.
The first proposition was made by Armand in 1979. This proposition has
triggered an enormous amount of research worldwide (Sequira & Santos, 2010; Di
Notto et al., 2011). Independent studies have explored the structure – morphology –
Univers
ity of
Mala
ya
20
conductivity relationship of these materials. These studies concluded that there is a link
between the amorphous phase and the ion conductivity. Polymer electrolyte materials
will exhibit to a greater or lesser extent the following properties (Sequira & Santos,
2010):
adequate ionic conductivity for practical purposes,
low electronic conductivity,
good mechanical properties,
chemical, electrochemical and photochemical stability,
ease of processing.
Sequira and Santos (2010) used ‘dry’ polymer electrolyte term to define a single
phase, non-crystalline material containing dissolved salt with the ions of the salt being
mobile. Meanwhile, plasticized polymers are referred to polymers that are single phase
and contain organic additives which have the effect of softening the polymer.
Consequently, these plasticized polymers have higher conductivity compared to ‘dry’
polymers due to greater freedom for molecular motion. Gel polymer electrolytes are
solvent doped and made up of two-phase composition where both anions and cations are
mobile at the molecular level (Sequira & Santos, 2010).
2.3.1 Liquid electrolyte
A study on physicochemical and electrochemical properties of lithium
bis(fluorosulfonyl)imide (LiFSI) and its non-aqueous liquid electrolytes as conducting
salt for application in lithium-ion batteries has been done by Han et al. (2011). LiFSI
was selected because it exhibits far superior stability towards hydrolysis than lithium
hexafluorophosphate (LiPF6) since it does not release hydrogen fluoride (HF).
Univers
ity of
Mala
ya
21
Figure 2.9: Arrhenius plots of specific conductivity of 1.0 M lithium bis(fluorosulfonyl)imide (LiFSI), lithium hexafluorophosphate (LiPF6), lithium bis(trifluoromethane sulfonyl) imide (LiTFSI), lithium perchlorate (LiClO4), and lithium tetrafluoroborate (LiBF4) in a mixture of ethylene carbonate (EC)/ethyl methyl carbonate (EMC) with ratio of 3:7 (v/v) (Han et al., 2011).
In addition, LiFSI does not corrode aluminium (Al) due to absence of chloride
(Cl−) in it. The ionic conductivity study on LiFSI and other salts; lithium
hexafluorophosphate (LiPF6), lithium bis(trifluoromethane sulfonyl) imide (LiTFSI),
lithium perchlorate (LiClO4), and lithium tetrafluoroborate (LiBF4) was shown in Fig.
2.9. Liquid electrolyte composed of LiFSI exhibits the highest conductivity even at -20
°C.
The toluene effect of adding organic solvent on the impedance properties of
sulfur cathode (composed of sulfur, acetylene black and polyvinylidene fluoride
(PVdF)) and lithium metal anode in a Li/S cells with liquid electrolytes were studied by
Choi et al. (2008). The impedance spectra of Li/S cells operated with liquid electrolyte
contained lithium trifluoromethanesulfonate (LiCF3SO3) in tetra(ethylene glycol)
dimethyl ether (TEGDME) with different amounts of toluene as additive were evaluated
(Fig. 2.10). The bulk resistance of the electrolyte (Rb) was measured in the range
Univers
ity of
Mala
ya
22
between 32 - 56 Ω. It was stated that electrolytes with toluene have higher redox
currents resulting from increased ion mobility and ionic conductivity.
Figure 2.10: Electrode/electrolyte interfacial resistance of Li/S cells with 1 M trifluoromethanesulfonate (LiCF3SO3) in tetra(ethylene glycol) dimethyl ether (TEGDME) electrolyte containing x% of toluene additive. Frequency range: 2 MHz–100 mHz (Choi et al., 2008).
Even though liquid electrolytes exhibit an attractive prospect in conductivity, it
also posed significant safety and environmental concerns since it can cause leakage. In
recent years considerable efforts have been devoted to increase the ionic conductivity
and improve the mechanical properties of solid polymer electrolyte (SPE) (Leones et
al., 2012). Hence, the next section will discuss some examples of SPE and their
application in current technologies.
2.3.2 Solid polymer electrolyte
The depletion of sources of oil and natural gas has prompted the large interest in
polymer based ionic conducting materials such as starch, chitosan, cellulose derivative,
Univers
ity of
Mala
ya
23
gelatin and natural rubber. These naturally occurring polymers are called biopolymers
are able to contribute to the reduction in the emission of industrial gases and generation
of greenhouse gases. Besides the use of biopolymers reduces the environmental impact
due to the disposal and storage and long-term degradation of synthetic polymers.
Biopolymers also show good properties such as biodegradability, low production cost,
good physical and chemical properties and good performance as solid polymer
electrolyte (SPE). The studies on biopolymers take into consideration the low
production cost due to great variety and low prices of raw materials (Pawlicka &
Donoso, 2010).
2.3.2.1 Cellulose based electrolytes
Cellulose is the most abundant biopolymer which can be extracted
inexpensively from plants, some animals, fungi, algae and bacteria and it is known for
its broad modifying capacity and formation of versatile semicrystalline fiber
morphologies (Asghar et al., 2012). The structure, morphology and crystallinity of the
native cellulose can be modified to enhance its physical and chemical. Cellulose
nanocrystals, whiskers and microfibrils have been explored as reinforcements in SPEs
and have successfully produced electrolyte material with good mechanical
properties (Azizi Samir et al., 2005; Lindman et al., 2010).
Modified cellulose has been synthesized by Machado et al. (2005) by reacting
cellulose with ethylene oxide to produce hydroxyethylcellulose. The amorphousness of
hydroxyethylcellulose (HEC) electrolyte with [O]/[Li] of 6 and room temperature
conductivity of 1.07 x10⁻⁵ S cm-1 has been enhanced with glycerol.
Univers
ity of
Mala
ya
24
Another work on modified cellulose has been done by composing a quaternary
system of poly ethylene glycol (PEG) or tetraethylene glycol dimethyl ether
(TEGDME) with polyethylene oxide (PEO), networked cellulose (NC) and lithium
perchlorate (LiClO4) as the doping salt (Lalia et al., 2014). In this work, cellulose was
dissolved in sulphuric acid and regenerated in ethanol in order to produce a suspension
of network cellulose (NC). The highest conductivity of the system was of the order
10−4 S cm−1 at room temperature.
2.3.2.2 Gelatin based electrolytes
Gelatin consists of proteins (85–92%), mineral salts and water and originated
from pig skin, bovine hides, pig and cattle bones and fish (Gomez-Guillén et al., 2009).
Gelatin is produced by partial hydrolysis of collagen (Duconseille et al., 2014).
Collagen and gelatin do not have exactly the same structure, composition and
properties. During the gelatin-making process, proteins are extracted from skin and
bone by acid or alkaline baths and thermal pre-treatments. A thermal process is then
used to separate proteins from the rest of the raw material.
Leones et al. (2012) reported the characteristics of polymer electrolytes using
gelatin matrix doped with europium triflate (Eu(CF3SO3)3) and different ionic liquids;
1-ethyl-3-methylimidazolium ethylsulfate, (C2mim)(C2SO4), 1-ethyl-3-
methylimidazolium acetate, (C2mim)(OAc) and trimethyl-ethanolammonium acetate,
(Ch)(OAc). The maximum conductivity of 1.18 × 10⁻⁴ S cm−1 in this electrolyte system
is based on 1-ethyl-3-methylimidazolium acetate, (C2mim)(OAc) at 303 K. Fig. 2.11
shows the x-ray diffraction patterns obtained from the gelatin-based electrolytes at room
temperature. The electrolytes were amorphous.
Univers
ity of
Mala
ya

25
Figure 2.11: X-ray diffraction of (a) gelatin with ionic liquid 1-ethyl-3-methylimidazolium acetate (C2mim)(OAc) and (b) gelatin with ionic liquid 1-ethyl-3-methylimidazolium acetate (C2mim)(OAc) and fixed amount of 0.1 g europium triflate (Eu(CF3SO3)3) (Leones et al., 2012).
A series of gelatin/poly (vinyl) alcohol copolymer (Gel/PVA) with different
entrapped carotene (Carot) concentration into the films has been investigated. The films
were irradiated with gamma rays (γ-rays) at dose levels of 10, 50, 100, 150 and 250 kGy
(Lotfy & Fawzy, 2014). The highest conductivity value of 6.54 x10⁻⁸ S cm−1 was
achieved for the Gel/PVA copolymer added with 15 mg/ mL carotene but without
gamma radiation. The authors reported that the electrical conductivity of
PVA/Gel/Carot films was increased two to three orders of magnitude due to carotene
doping, and decreased one order of magnitude on gamma radiation since gamma
radiation led to more crosslinking than chain scission causing an increase in the thermal
stability of the films and a decrease in the conductivity of the copolymer films.
2.3.2.3 Chitosan based electrolytes
Chitosan is the deacetylated product of chitin hydrolysis treatment in alkaline
solution as described by Thor and Henderson in 1940 (Muzzarelli, 1978). The chemical
Univers
ity of
Mala
ya
26
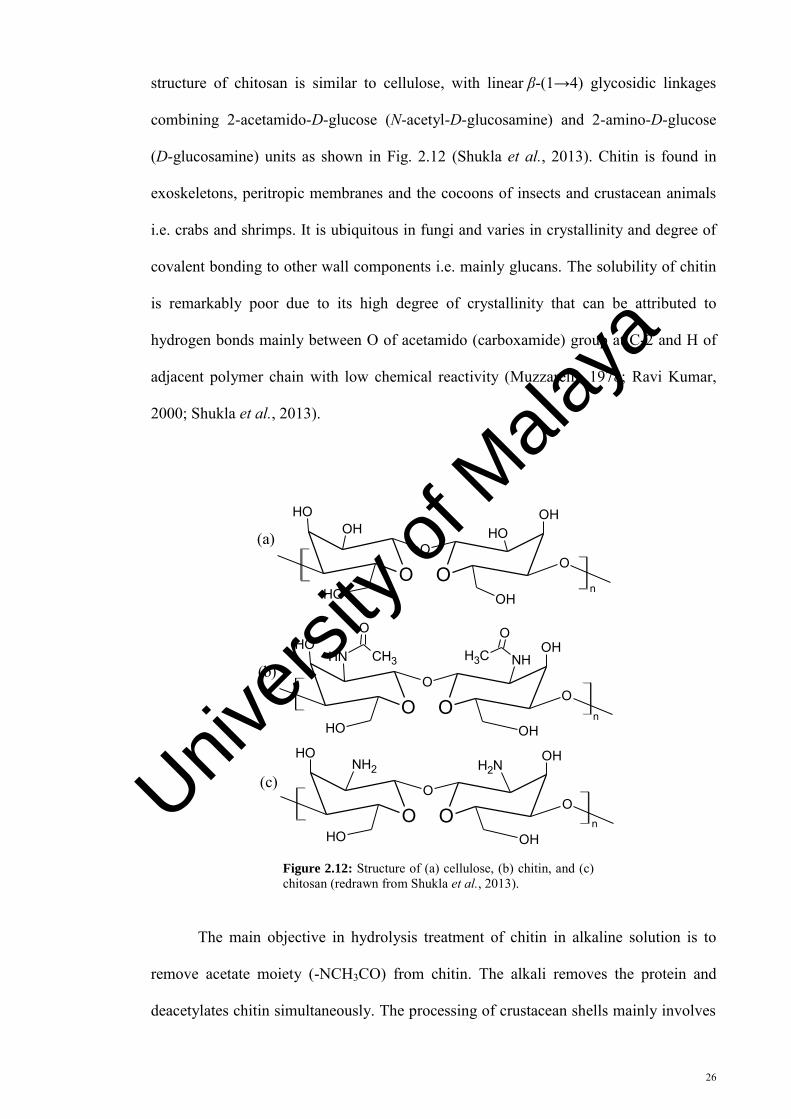
structure of chitosan is similar to cellulose, with linear β-(1→4) glycosidic linkages
combining 2-acetamido-D-glucose (N-acetyl-D-glucosamine) and 2-amino-D-glucose
(D-glucosamine) units as shown in Fig. 2.12 (Shukla et al., 2013). Chitin is found in
exoskeletons, peritropic membranes and the cocoons of insects and crustacean animals
i.e. crabs and shrimps. It is ubiquitous in fungi and varies in crystallinity and degree of
covalent bonding to other wall components i.e. mainly glucans. The solubility of chitin
is remarkably poor due to its high degree of crystallinity that can be attributed to
hydrogen bonds mainly between O of acetamido (carboxamide) group at C-2 and H of
adjacent polymer chain with low chemical reactivity (Muzzarelli, 1978; Ravi Kumar,
2000; Shukla et al., 2013).
OO
OO
OHOH OH
OH
OH OH
OO
OO
OHNH NH
OH
OH OH
CH3
O
CH3
O
OO
OO
OHNH2 NH2
OH
OH OH
(a)
(b)
(c)
n
n
n
Figure 2.12: Structure of (a) cellulose, (b) chitin, and (c) chitosan (redrawn from Shukla et al., 2013).
The main objective in hydrolysis treatment of chitin in alkaline solution is to
remove acetate moiety (-NCH3CO) from chitin. The alkali removes the protein and
deacetylates chitin simultaneously. The processing of crustacean shells mainly involves
Univers
ity of
Mala
ya
27
the removal of proteins and the dissolution of calcium carbonate which is present in
crab shells in high concentrations. In the case of chitosan, the extent of this
deacetylation reaction of chitin is determined by the property degree of deacetylation
(DD). Hence, the ability of chitosan to dissolve in dilute acids are attributed by DD. The
DD is the ratio (usually expressed in percent) of the amount (in moles) of D-
glucosamine units to the total D-glucosamine and N-acetyl-D-glucosamine units
(Dimzon, 2013). For example 70% deacetylated chitosan can be produced by
deacetylation process in 40% sodium hydroxide at 120°C for 1–3 hours. (Muzzarelli,
1978; Ravi Kumar, 2000; Shukla et al., 2013). Chitin and chitosan have gained
tremendous interest due to their properties as non-toxic, biocompatible and
biodegradable polymers.
It is known that chitosan does not have the same degree of hydrogen bonding in
as chitin, but chitosan remains insoluble in water and organic solvents due to the
abundance of hydroxyl group (Grant et al., 1989). However, the protonation of the
amine group in chitosan when treated with dilute organic acid (i.e. acetic, formic,
succinic, and lactic acids at pH below 6.5) results in chitosan solubilisation and it has
been established that the casting procedure and acid chosen as solvent can affect the
crystallinity. Therefore, the applications of chitin and chitosan are limited due to less
solubility in water and organic solvent (Mourya & Inamdar, 2008; Sajomsang, 2010).
In order to improve the solubility, physicochemical and biological properties,
several chemical modifications of chitosan have been reported. Some examples of
modification processes of chitosan are N-Acylchitosans, N-Carboxyalkyl/(aryl)
chitosans and thiolated chitosan (Mourya & Inamdar, 2008). Chitosan and its
derivatives have been receiving significant scientific interests have become one of the
Univers
ity of
Mala
ya
28
hottest topics in recent decades, especially for its food, medical and pharmaceutical
applications, including nutrient and drug delivery and tissue engineering (Luo & Wang,
2014).
Grant et al. (1989) discussed the importance of chitosan modification by
substitution with side chain that can result in structural orientation changes of the chains
and solubility of the polymers in water and organic solvents. Chitosan has also been
modified by phthaloylation reaction which enabling phthaloyl chitosan solubilization in
organic solvents, since the addition of bulky phthaloyl group eliminates hydrogen from
the amino group thus preventing hydrogen bonding (Kurita, 2001).
Chitosan is also unique characteristic since it is the only polysaccharide that
possesses a high density of positive charges, due to the protonation of amino groups on
its backbone when dissolved in acidic medium (Luo & Wang, 2014). The primary
amino group of chitosan is partially protonated in weakly acidic aqueous solution and at
pH 4.0; the protonation is complete (Il’ina & Varlamov, 2005):
NH2 + H+ NH3+ (2.7)
Thus, the molecules of chitosan are present as cationic polyelectrolyte in acidic
solution which enables the interactions with negatively charged molecules (anions and
polyanions). Polyelectrolyte is defined as a class of macromolecular compound
spontaneously acquiring a large number of elementary charges distributed along the
molecular chain when dissolved in a suitable polar solvent (Dakhara & Anajwala,
2010). In addition, the polyelectrolyte form of chitosan can interact with polyanions of
various nature to form polyelectrolyte complexes which involves electrostatic and
dipole-dipole interaction as well as hydrogen and hydrophobic bonds.
Univers
ity of
Mala
ya
29
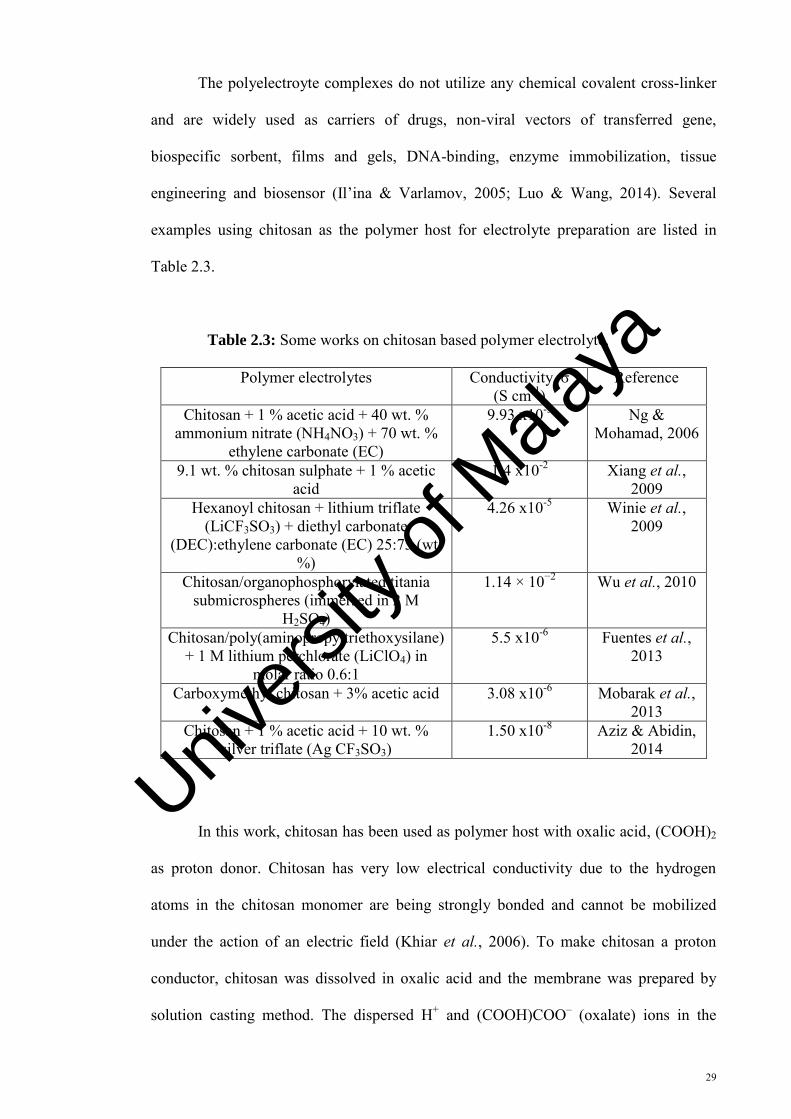
The polyelectroyte complexes do not utilize any chemical covalent cross-linker
and are widely used as carriers of drugs, non-viral vectors of transferred gene,
biospecific sorbent, films and gels, DNA-binding, enzyme immobilization, tissue
engineering and biosensor (Il’ina & Varlamov, 2005; Luo & Wang, 2014). Several
examples using chitosan as the polymer host for electrolyte preparation are listed in
Table 2.3.
Table 2.3: Some works on chitosan based polymer electrolyte.
Polymer electrolytes Conductivity, σ (S cm-1)
Reference
Chitosan + 1 % acetic acid + 40 wt. % ammonium nitrate (NH4NO3) + 70 wt. %
ethylene carbonate (EC)
9.93 x10⁻³ Ng & Mohamad, 2006
9.1 wt. % chitosan sulphate + 1 % acetic acid
1.4 x10⁻² Xiang et al., 2009
Hexanoyl chitosan + lithium triflate (LiCF3SO3) + diethyl carbonate
(DEC):ethylene carbonate (EC) 25:75 (wt. %)
4.26 x10⁻⁵ Winie et al., 2009
Chitosan/organophosphorylated titania submicrospheres (immersed in 2 M
H2SO4)
1.14 × 10⁻² Wu et al., 2010
Chitosan/poly(aminopropyltriethoxysilane) + 1 M lithium perchlorate (LiClO4) in
molar ratio 0.6:1
5.5 x10⁻⁶ Fuentes et al., 2013
Carboxymethyl chitosan + 3% acetic acid 3.08 x10⁻⁶ Mobarak et al., 2013
Chitosan + 1 % acetic acid + 10 wt. % silver triflate (Ag CF3SO3)
1.50 x10⁻⁸ Aziz & Abidin, 2014
In this work, chitosan has been used as polymer host with oxalic acid, (COOH)2
as proton donor. Chitosan has very low electrical conductivity due to the hydrogen
atoms in the chitosan monomer are being strongly bonded and cannot be mobilized
under the action of an electric field (Khiar et al., 2006). To make chitosan a proton
conductor, chitosan was dissolved in oxalic acid and the membrane was prepared by
solution casting method. The dispersed H+ and (COOH)COO‒ (oxalate) ions in the
Univers
ity of
Mala
ya
30
chitosan solvent can be mobilized on application of an electric field. Since the H+ ions
are more mobile than the oxalate ions the membrane becomes a proton conductor.
Hence, since the conductivity is increased upon the addition of a proton donor, it should
then be possible to produce a more ionically conducting film by increasing the hydrogen
donor concentration. Numerous works have been harnessed to produce chitosan based
polymer electrolytes as can be seen in Table 2.3.
2.4 Improvement of polymer electrolyte properties
To enhance the conductivity, several approaches were suggested in the literature,
including the use of blend polymers, the addition of a ceramic filler, plasticizer and even
radiation. Compared to other methods, plasticization is the simplest, lowest cost and
most effective way to improve the conductivity of a SPE. The plasticization of polymer
electrolyte has been proven to increase the conductivity values of the electrolyte as
reported by Osman et al. (2001). In their work, ethylene carbonate (EC) has been added
into a chitosan-lithium triflate (LiCF3SO3) system. They also studied the effect of
plasticizer addition on the dielectric constant (εr) and observed that upon the addition of
EC, the dielectric constant of the electrolyte was also increased. This indicates that the
plasticizer increased salt dissolution.
Ali et al. (2012) reported that propylene carbonate (PC) assisted salt dissociation
in chitosan acetate-ammonium iodide (NH4I) electrolyte. This results in increased
number of free mobile ions that led to the increase in conductivity. The plasticizer has
great influence on the physical and electrical properties of polymer electrolytes and the
plasticizer is also able to penetrate into the polymer chains and increase polymer chain
Univers
ity of
Mala
ya
31
flexibility that can result in improved ionic conductivity. The crystallinity of the
electrolyte was also further reduced with addition of the plasticizer.
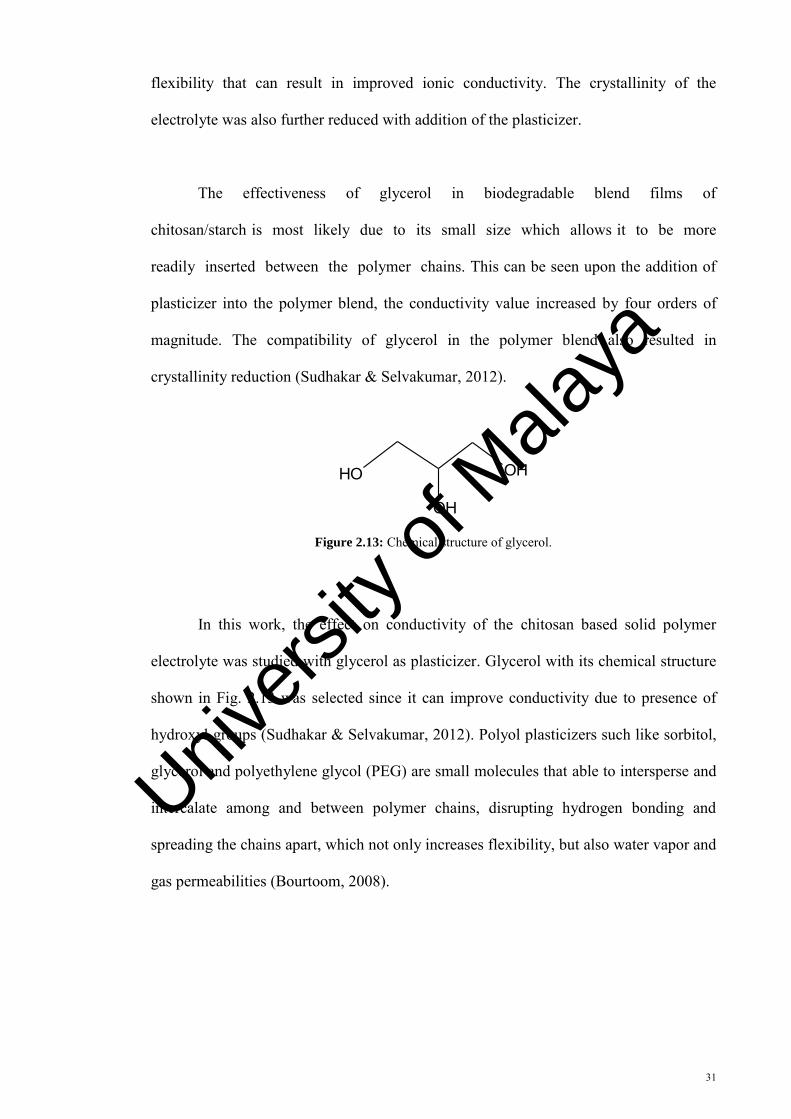
The effectiveness of glycerol in biodegradable blend films of
chitosan/starch is most likely due to its small size which allows it to be more
readily inserted between the polymer chains. This can be seen upon the addition of
plasticizer into the polymer blend, the conductivity value increased by four orders of
magnitude. The compatibility of glycerol in the polymer blend also resulted in
crystallinity reduction (Sudhakar & Selvakumar, 2012).
OHOH
OH
Figure 2.13: Chemical structure of glycerol.
In this work, the effect on conductivity of the chitosan based solid polymer
electrolyte was studied with glycerol as plasticizer. Glycerol with its chemical structure
shown in Fig. 2.13 was selected since it can improve conductivity due to presence of
hydroxyl groups (Sudhakar & Selvakumar, 2012). Polyol plasticizers such like sorbitol,
glycerol and polyethylene glycol (PEG) are small molecules that able to intersperse and
intercalate among and between polymer chains, disrupting hydrogen bonding and
spreading the chains apart, which not only increases flexibility, but also water vapor and
gas permeabilities (Bourtoom, 2008).
Univers
ity of
Mala
ya
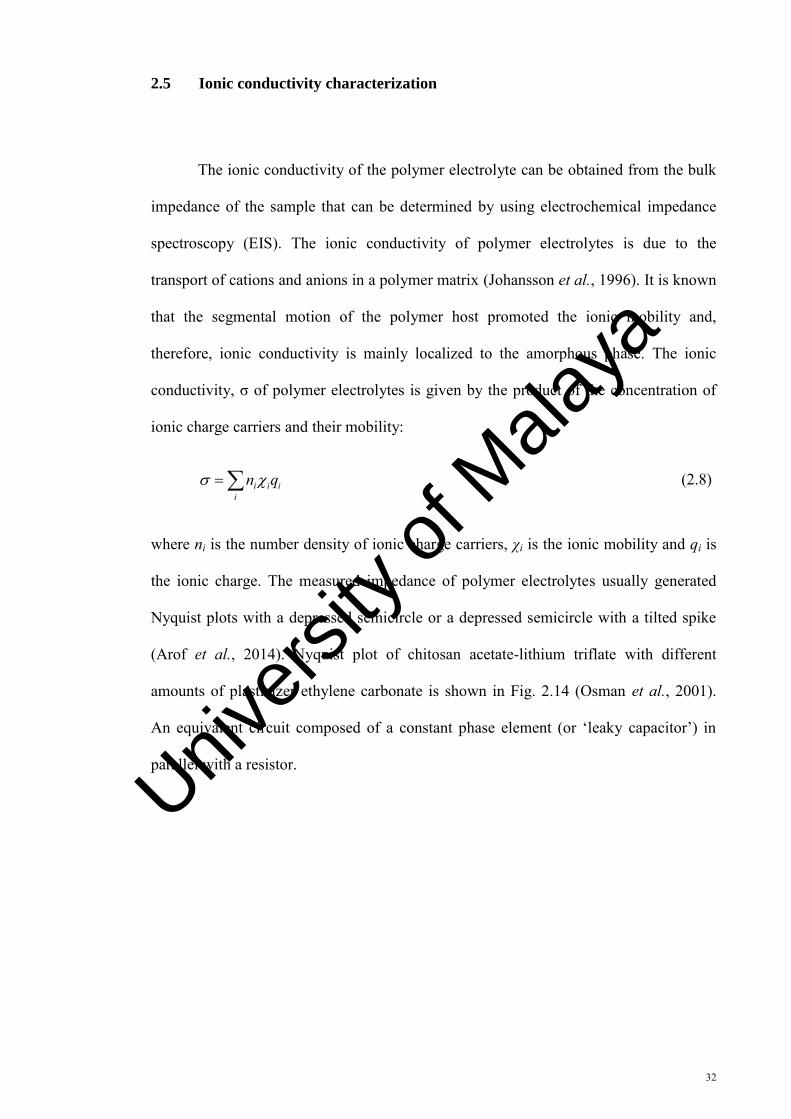
32
2.5 Ionic conductivity characterization
The ionic conductivity of the polymer electrolyte can be obtained from the bulk
impedance of the sample that can be determined by using electrochemical impedance
spectroscopy (EIS). The ionic conductivity of polymer electrolytes is due to the
transport of cations and anions in a polymer matrix (Johansson et al., 1996). It is known
that the segmental motion of the polymer host promoted the ionic mobility and,
therefore, ionic conductivity is mainly localized to the amorphous phase. The ionic
conductivity, σ of polymer electrolytes is given by the product of the concentration of
ionic charge carriers and their mobility:
i
iii qn (2.8)
where ni is the number density of ionic charge carriers, χi is the ionic mobility and qi is
the ionic charge. The measured impedance of polymer electrolytes usually generated
Nyquist plots with a depressed semicircle or a depressed semicircle with a tilted spike
(Arof et al., 2014). Nyquist plot of chitosan acetate-lithium triflate with different
amounts of plasticizer ethylene carbonate is shown in Fig. 2.14 (Osman et al., 2001).
An equivalent circuit composed of a constant phase element (or ‘leaky capacitor’) in
parallel with a resistor.
Univers
ity of
Mala
ya
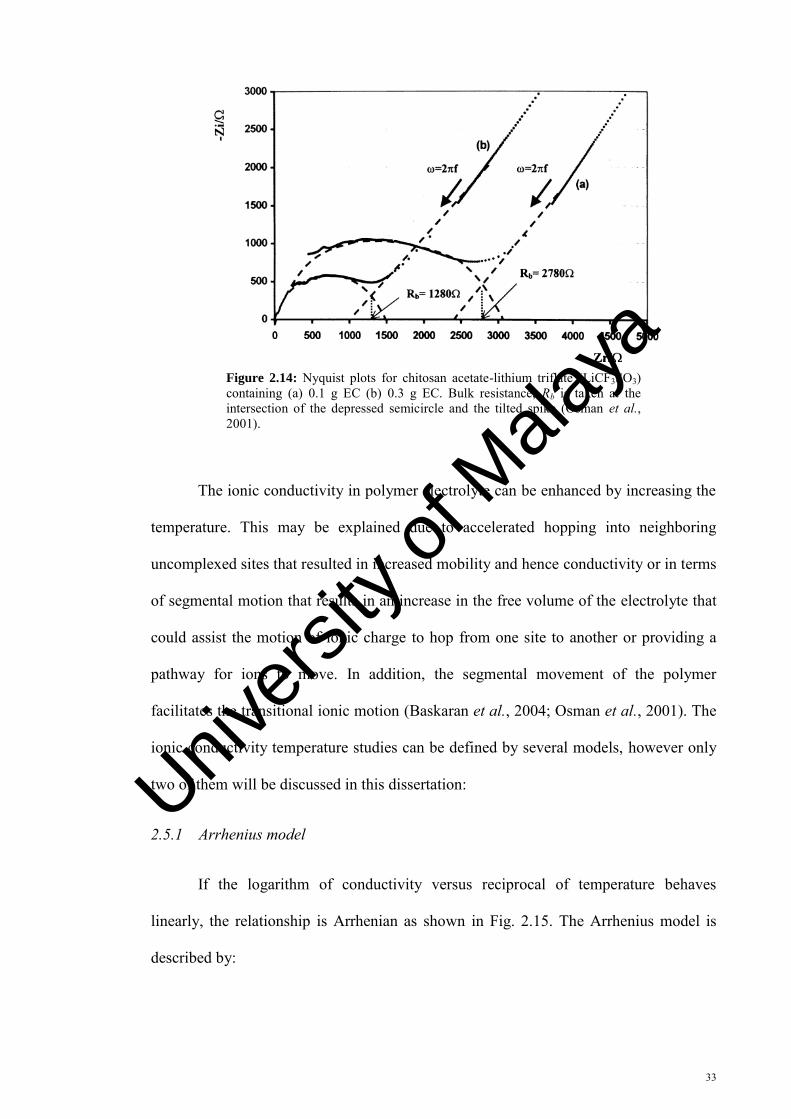
33
Figure 2.14: Nyquist plots for chitosan acetate-lithium triflate (LiCF3SO3) containing (a) 0.1 g EC (b) 0.3 g EC. Bulk resistance, Rb is taken at the intersection of the depressed semicircle and the tilted spike (Osman et al., 2001).
The ionic conductivity in polymer electrolyte can be enhanced by increasing the
temperature. This may be explained due to accelerated hopping into neighboring
uncomplexed sites that resulted in increased mobility and hence conductivity or in terms
of segmental motion that results in an increase in the free volume of the electrolyte that
could assist the motion of ionic charge to hop from one site to another or providing a
pathway for ions to move. In addition, the segmental movement of the polymer
facilitates the transitional ionic motion (Baskaran et al., 2004; Osman et al., 2001). The
ionic conductivity temperature studies can be defined by several models, however only
two of them will be discussed in this dissertation:
2.5.1 Arrhenius model
If the logarithm of conductivity versus reciprocal of temperature behaves
linearly, the relationship is Arrhenian as shown in Fig. 2.15. The Arrhenius model is
described by:
Univers
ity of
Mala
ya
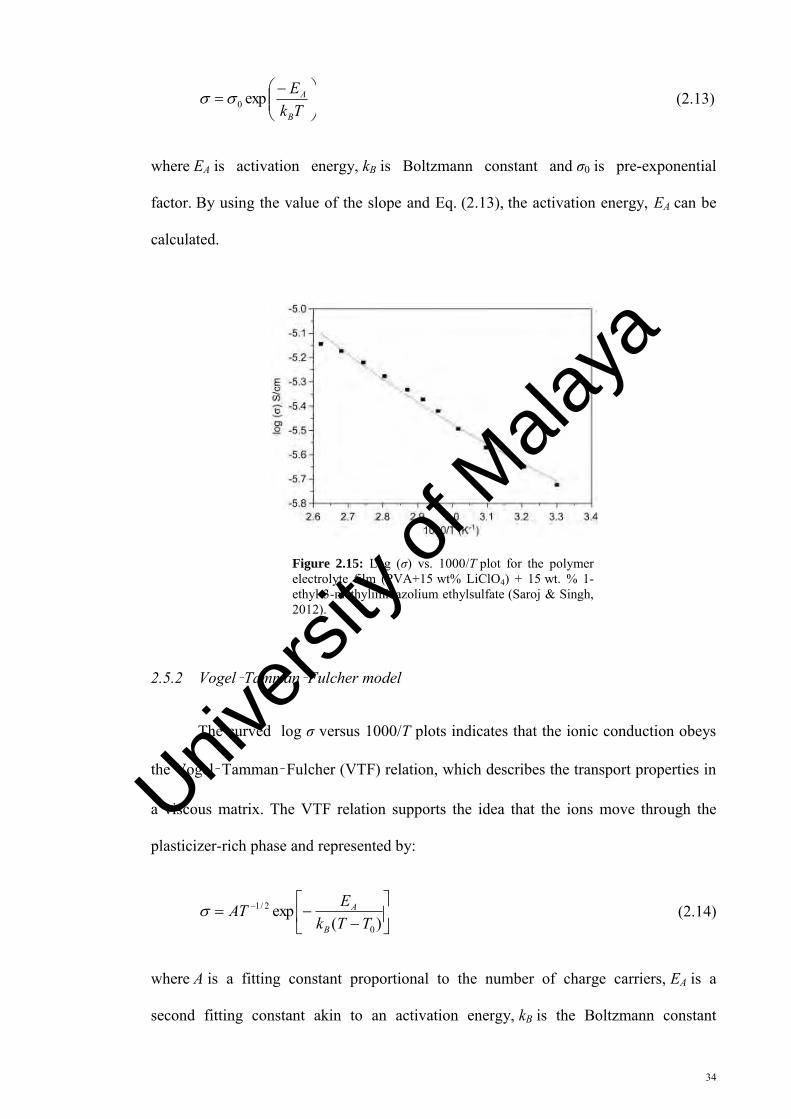
34
TkEB
Aexp0 (2.13)
where EA is activation energy, kB is Boltzmann constant and σ0 is pre-exponential
factor. By using the value of the slope and Eq. (2.13), the activation energy, EA can be
calculated.
Figure 2.15: Log (σ) vs. 1000/T plot for the polymer electrolyte film (PVA+15 wt% LiClO4) + 15 wt. % 1-ethyl-3-methylimidazolium ethylsulfate (Saroj & Singh, 2012).
2.5.2 Vogel–Tamman–Fulcher model
The curved log σ versus 1000/T plots indicates that the ionic conduction obeys
the Vogel–Tamman–Fulcher (VTF) relation, which describes the transport properties in
a viscous matrix. The VTF relation supports the idea that the ions move through the
plasticizer-rich phase and represented by:
)(exp
0
2/1
TTkEAT
B
A (2.14)
where A is a fitting constant proportional to the number of charge carriers, EA is a
second fitting constant akin to an activation energy, kB is the Boltzmann constant
Univers
ity of
Mala
ya
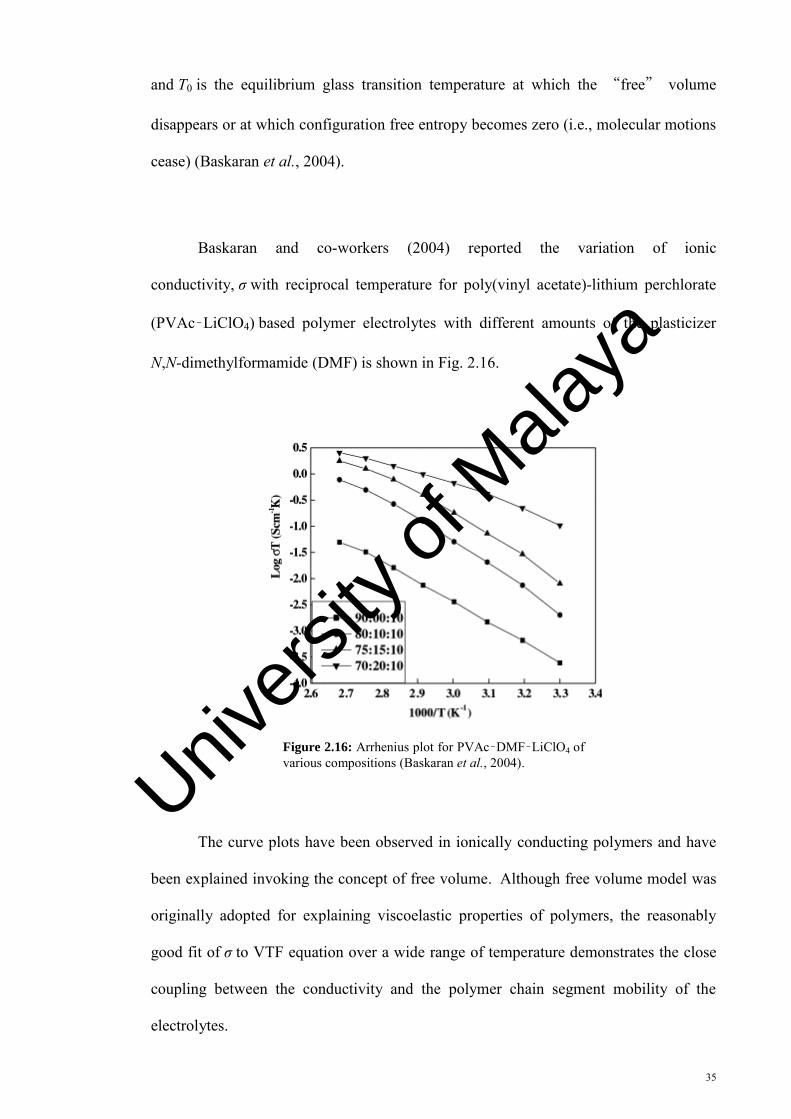
35
and T0 is the equilibrium glass transition temperature at which the “free” volume
disappears or at which configuration free entropy becomes zero (i.e., molecular motions
cease) (Baskaran et al., 2004).
Baskaran and co-workers (2004) reported the variation of ionic
conductivity, σ with reciprocal temperature for poly(vinyl acetate)-lithium perchlorate
(PVAc–LiClO4) based polymer electrolytes with different amounts of the plasticizer
N,N-dimethylformamide (DMF) is shown in Fig. 2.16.
Figure 2.16: Arrhenius plot for PVAc–DMF–LiClO4 of various compositions (Baskaran et al., 2004).
The curve plots have been observed in ionically conducting polymers and have
been explained invoking the concept of free volume. Although free volume model was
originally adopted for explaining viscoelastic properties of polymers, the reasonably
good fit of σ to VTF equation over a wide range of temperature demonstrates the close
coupling between the conductivity and the polymer chain segment mobility of the
electrolytes.
Univers
ity of
Mala
ya
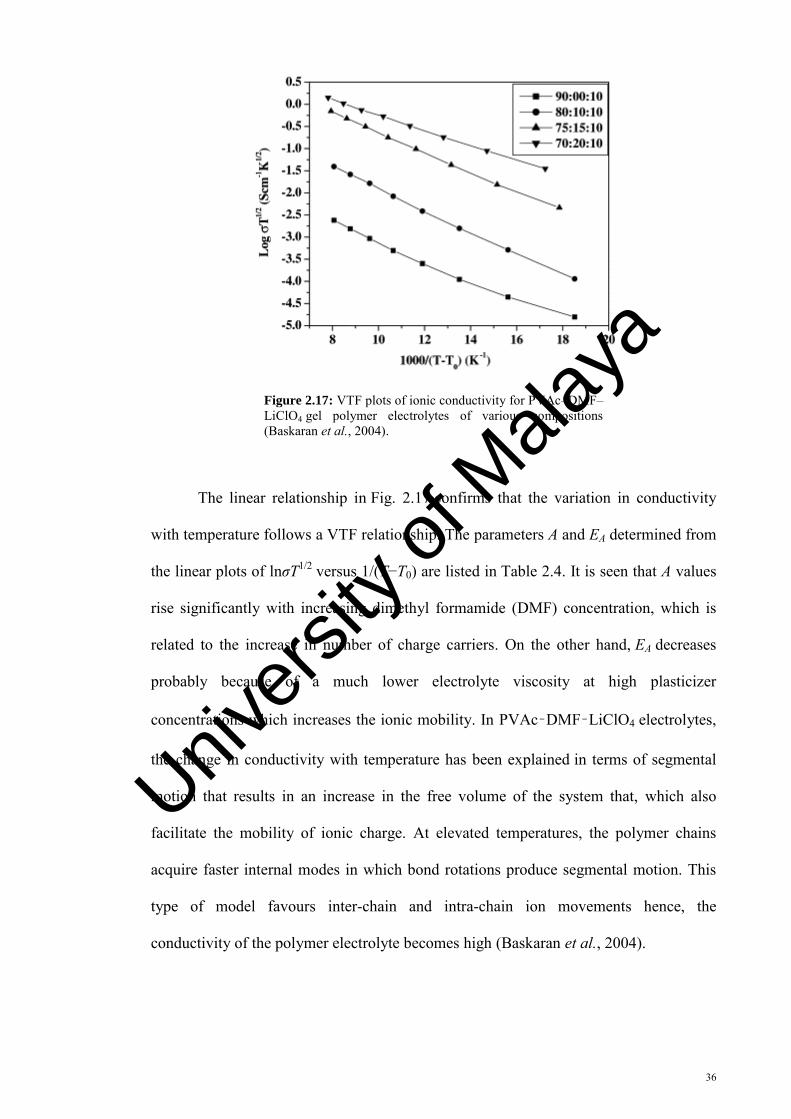
36
Figure 2.17: VTF plots of ionic conductivity for PVAc–DMF–LiClO4 gel polymer electrolytes of various compositions (Baskaran et al., 2004).
The linear relationship in Fig. 2.17 confirms that the variation in conductivity
with temperature follows a VTF relationship. The parameters A and EA determined from
the linear plots of lnσT1/2 versus 1/(T−T0) are listed in Table 2.4. It is seen that A values
rise significantly with increasing dimethyl formamide (DMF) concentration, which is
related to the increase in number of charge carriers. On the other hand, EA decreases
probably because of a much lower electrolyte viscosity at high plasticizer
concentrations which increases the ionic mobility. In PVAc–DMF–LiClO4 electrolytes,
the change in conductivity with temperature has been explained in terms of segmental
motion that results in an increase in the free volume of the system that, which also
facilitate the mobility of ionic charge. At elevated temperatures, the polymer chains
acquire faster internal modes in which bond rotations produce segmental motion. This
type of model favours inter-chain and intra-chain ion movements hence, the
conductivity of the polymer electrolyte becomes high (Baskaran et al., 2004).
Univers
ity of
Mala
ya
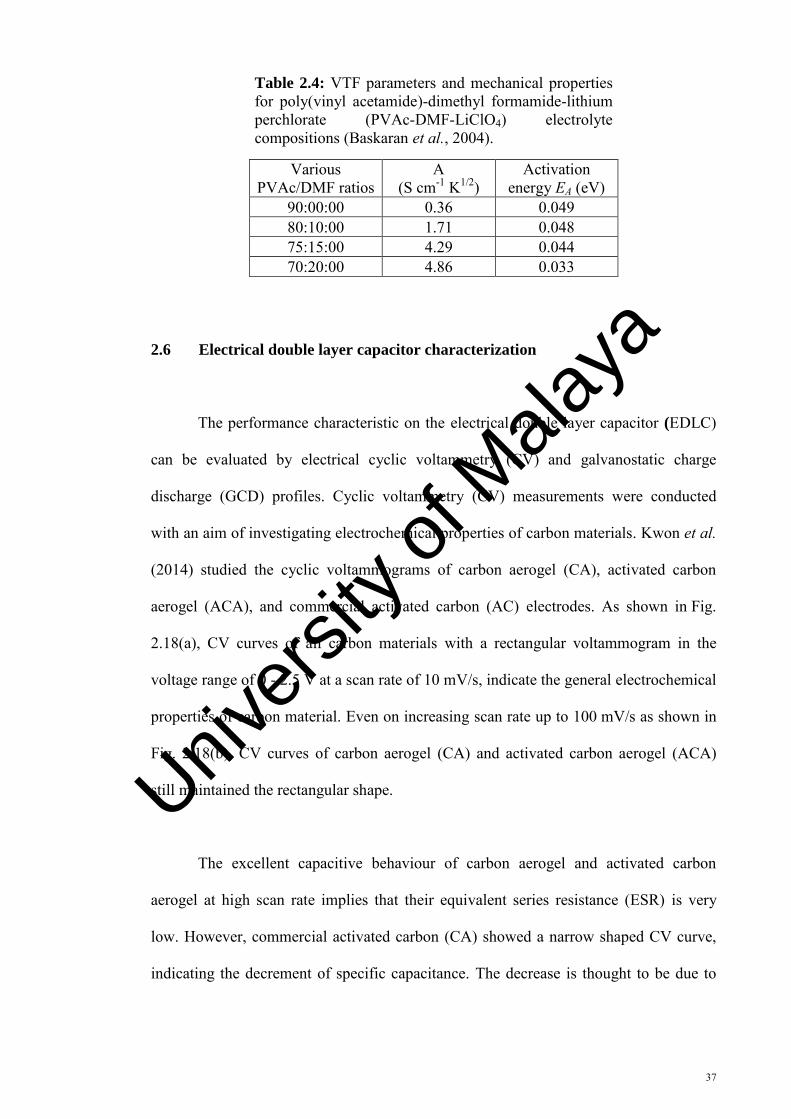
37
Table 2.4: VTF parameters and mechanical properties for poly(vinyl acetamide)-dimethyl formamide-lithium perchlorate (PVAc-DMF-LiClO4) electrolyte compositions (Baskaran et al., 2004).
Various PVAc/DMF ratios
A (S cm-1 K1/2)
Activation energy EA (eV)
90:00:00 0.36 0.049 80:10:00 1.71 0.048 75:15:00 4.29 0.044 70:20:00 4.86 0.033
2.6 Electrical double layer capacitor characterization
The performance characteristic on the electrical double layer capacitor (EDLC)
can be evaluated by electrical cyclic voltammetry (CV) and galvanostatic charge
discharge (GCD) profiles. Cyclic voltammetry (CV) measurements were conducted
with an aim of investigating electrochemical properties of carbon materials. Kwon et al.
(2014) studied the cyclic voltammograms of carbon aerogel (CA), activated carbon
aerogel (ACA), and commercial activated carbon (AC) electrodes. As shown in Fig.
2.18(a), CV curves of all carbon materials with a rectangular voltammogram in the
voltage range of 0 - 2.5 V at a scan rate of 10 mV/s, indicate the general electrochemical
properties of carbon material. Even on increasing scan rate up to 100 mV/s as shown in
Fig. 2.18(b), CV curves of carbon aerogel (CA) and activated carbon aerogel (ACA)
still maintained the rectangular shape.
The excellent capacitive behaviour of carbon aerogel and activated carbon
aerogel at high scan rate implies that their equivalent series resistance (ESR) is very
low. However, commercial activated carbon (CA) showed a narrow shaped CV curve,
indicating the decrement of specific capacitance. The decrease is thought to be due to
Univers
ity of
Mala
ya
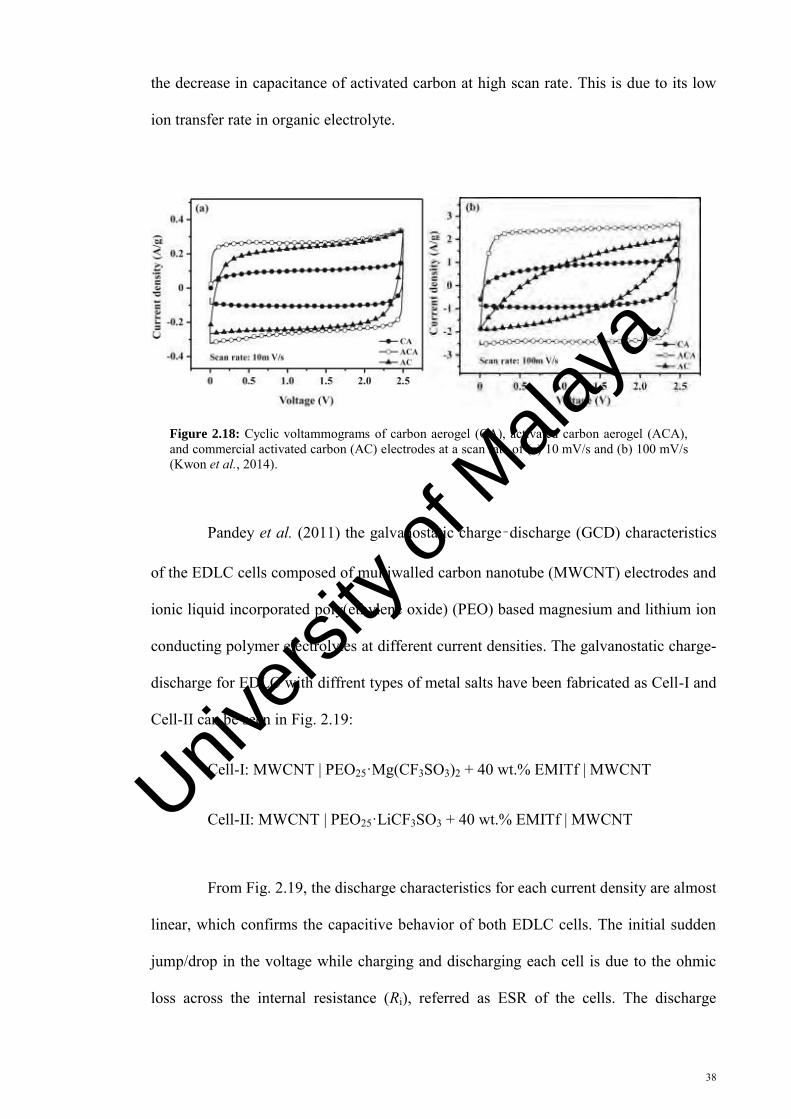
38
the decrease in capacitance of activated carbon at high scan rate. This is due to its low
ion transfer rate in organic electrolyte.
Figure 2.18: Cyclic voltammograms of carbon aerogel (CA), activated carbon aerogel (ACA), and commercial activated carbon (AC) electrodes at a scan rate of (a) 10 mV/s and (b) 100 mV/s (Kwon et al., 2014).
Pandey et al. (2011) the galvanostatic charge–discharge (GCD) characteristics
of the EDLC cells composed of multiwalled carbon nanotube (MWCNT) electrodes and
ionic liquid incorporated poly(ethylene oxide) (PEO) based magnesium and lithium ion
conducting polymer electrolytes at different current densities. The galvanostatic charge-
discharge for EDLC with diffrent types of metal salts have been fabricated as Cell-I and
Cell-II can be seen in Fig. 2.19:
Cell-I: MWCNT | PEO25·Mg(CF3SO3)2 + 40 wt.% EMITf | MWCNT
Cell-II: MWCNT | PEO25·LiCF3SO3 + 40 wt.% EMITf | MWCNT
From Fig. 2.19, the discharge characteristics for each current density are almost
linear, which confirms the capacitive behavior of both EDLC cells. The initial sudden
jump/drop in the voltage while charging and discharging each cell is due to the ohmic
loss across the internal resistance (Ri), referred as ESR of the cells. The discharge
Univers
ity of
Mala
ya
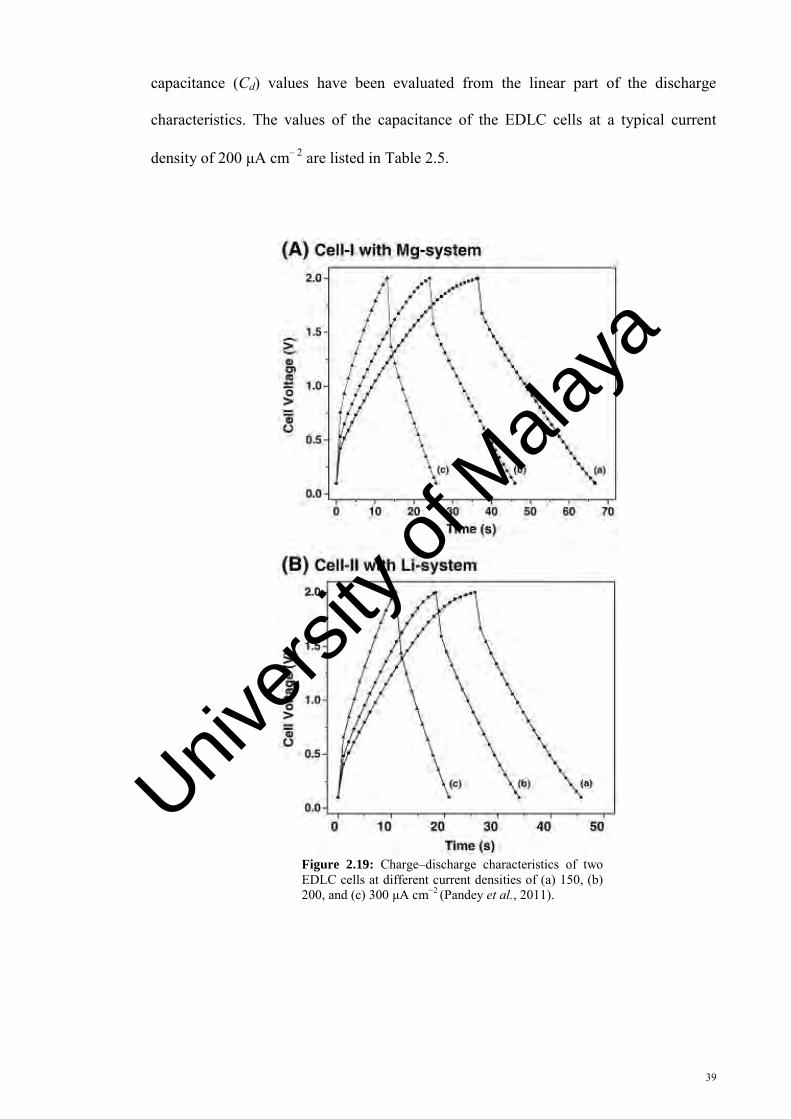
39
capacitance (Cd) values have been evaluated from the linear part of the discharge
characteristics. The values of the capacitance of the EDLC cells at a typical current
density of 200 μA cm− 2 are listed in Table 2.5.
Figure 2.19: Charge–discharge characteristics of two EDLC cells at different current densities of (a) 150, (b) 200, and (c) 300 μA cm−2 (Pandey et al., 2011).
Univers
ity of
Mala
ya
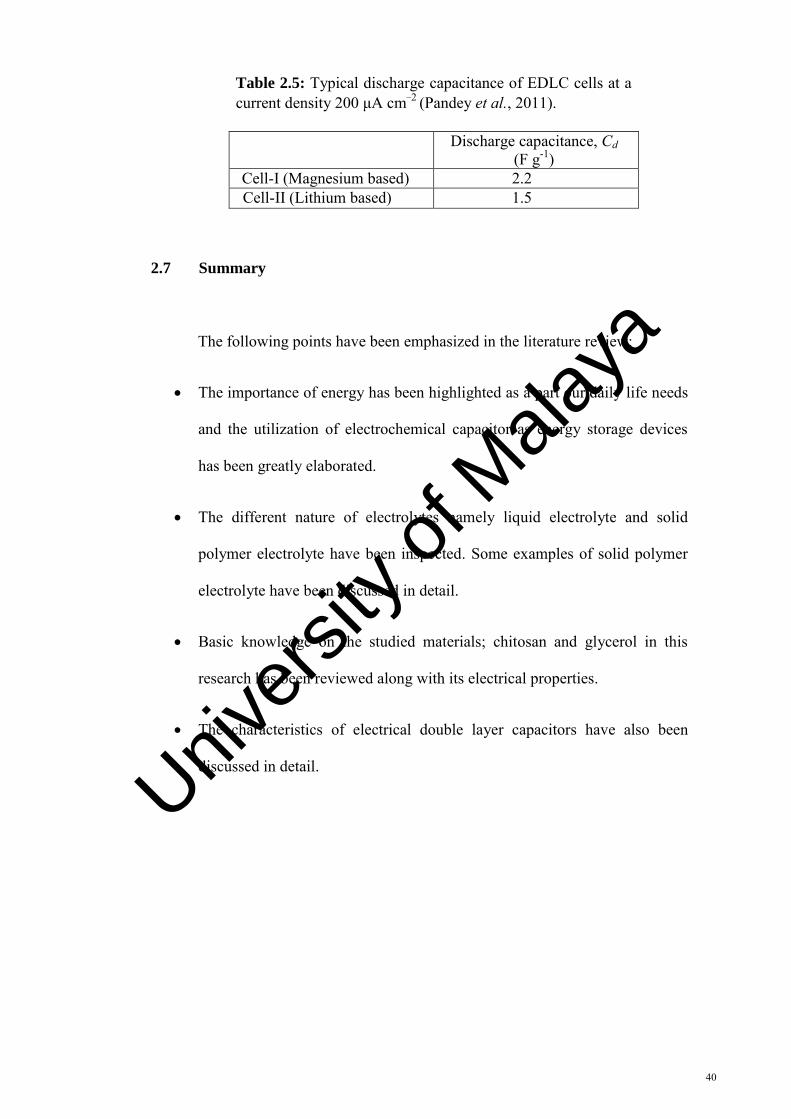
40
Table 2.5: Typical discharge capacitance of EDLC cells at a current density 200 μA cm−2 (Pandey et al., 2011).
Discharge capacitance, Cd (F g-1)
Cell-I (Magnesium based) 2.2 Cell-II (Lithium based) 1.5
2.7 Summary
The following points have been emphasized in the literature review:
The importance of energy has been highlighted as a part our daily life needs
and the utilization of electrochemical capacitor as energy storage devices
has been greatly elaborated.
The different nature of electrolytes namely liquid electrolyte and solid
polymer electrolyte have been inspected. Some examples of solid polymer
electrolyte have been discussed in detail.
Basic knowledge on the studied materials; chitosan and glycerol in this
research has been reviewed along with its electrical properties.
The characteristics of electrical double layer capacitors have also been
discussed in detail.
Univers
ity of
Mala
ya
41
CHAPTER 3
EXPERIMENTAL METHODS
3.1 Introduction
Pristine chitosan can dissolve effectively in dilute acidic solutions namely acetic
acid, adipic acid, boric acid and salicylic acid compared to chitin. This is due to less
hydrogen bonding occurrence between its intra- and inter-polymeric chains (Muzzarelli,
1977). The chitosan based solid polymer electrolytes will be characterized via
electrochemical impedance spectroscopy (EIS) to obtain the ionic conductivity and
impedance properties of the electrolytes (Huang et al., 2010) and Fourier transform infrared
(FTIR) spectroscopy to identify the nature of bonding and different functional groups
present in a sample by monitoring the vibrational energy levels of the molecules, which are
essentially the fingerprint of different molecules (Rajendran et al., 2007). The crystallinity
of the electrolytes will be evaluated using x-ray diffraction (XRD). The optimized
electrolyte will be used in the fabrication of electrochemical double layer capacitor (EDLC)
and the performance of EDLC will be evaluated.
3.2 Materials
Chitosan powder with more than 75 % degree of deacetylation (DD) (and molecular
weight, Mw between 310000 and 375000), oxalic acid and glycerol were purchased from
Univers
ity of
Mala
ya
42
Aldrich, R&M Chemicals, and Sigma respectively. Oxalic acid was recrystallized in order
to eliminate the impurities and kept in drying oven prior to use to minimize the moisture.
The commercial porous carbon (PC) (BET: 2000 m2/g) was purchased from
Advanced Chemical Supplier (ACS) company. N-methyl-2-pyrrolidone (NMP) and
poly(vinyl pyrrolidone) (PVP) (Mw = 40000) were obtained from Aldrich. All materials
were obtained commercially.
3.3 Sample preparation
The chitosan based samples in this work was prepared in two stages; namely
System I and System II, where chitosan in System I was doped with different percentages
of oxalic acid, and in System II, glycerol was added as a plasticizer in the optimized sample
in System I to enhance the conductivity of the optimized chitosan – oxalic acid membranes.
3.3.1 Chitosan-oxalic acid system (System I)
The flow chart of the experimental methods in this work was shown in Fig. 3.1. A
specific weight percent of oxalic acid was dissolved into 25 mL of distilled water in a
conical flask and the various weight percentages of oxalic acid is as listed in Table 3.1. A
fixed amount of chitosan, 0.5 g was then added and the mixtures were stirred overnight at
60 °C in order to ensure complete dissolution of the mixtures. The clear homogeneous
solutions were cast in a glass Petri dish and left overnight in a drying oven at 45 °C. The
dried membranes were kept in a desiccator for further characterizations.
Univers
ity of
Mala
ya
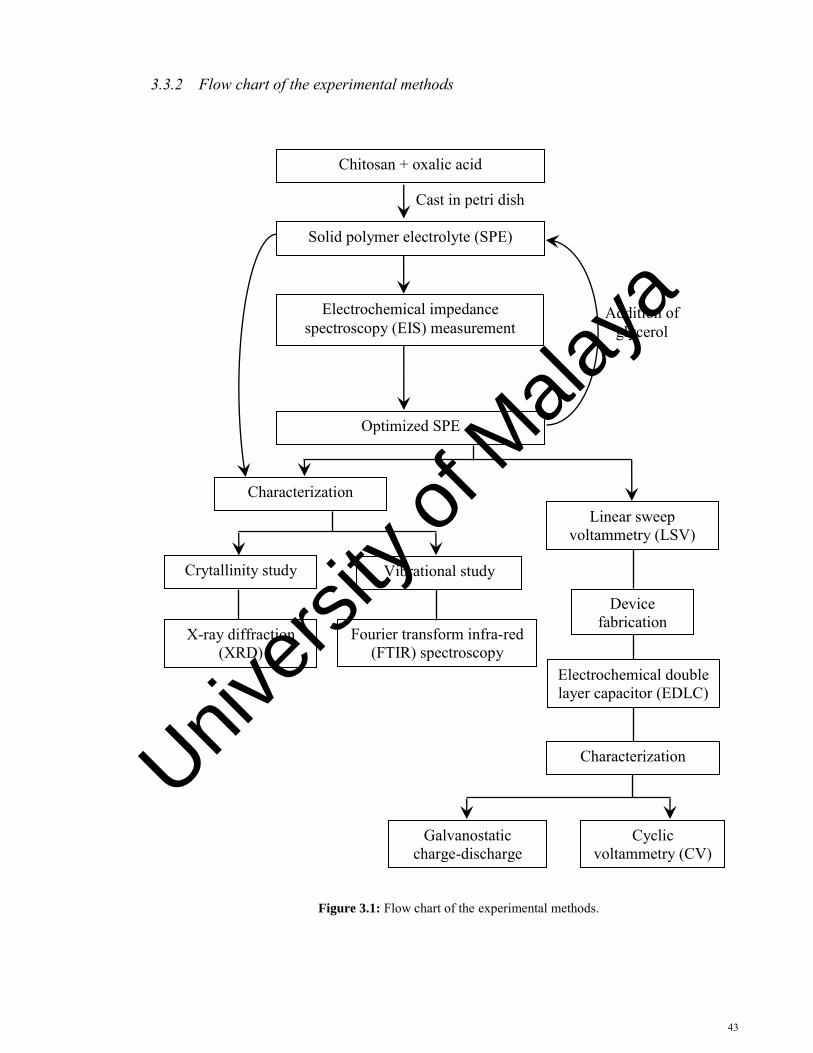
43
3.3.2 Flow chart of the experimental methods
Figure 3.1: Flow chart of the experimental methods.
Chitosan + oxalic acid
Solid polymer electrolyte (SPE)
Optimized SPE
Electrochemical impedance spectroscopy (EIS) measurement
Addition of glycerol
Crytallinity study
X-ray diffraction (XRD)
Vibrational study
Fourier transform infra-red (FTIR) spectroscopy
Characterization
Device fabrication
Electrochemical double layer capacitor (EDLC)
Characterization
Linear sweep voltammetry (LSV)
Galvanostatic charge-discharge
(GCD)
Cyclic voltammetry (CV)
Cast in petri dish
Univers
ity of
Mala
ya
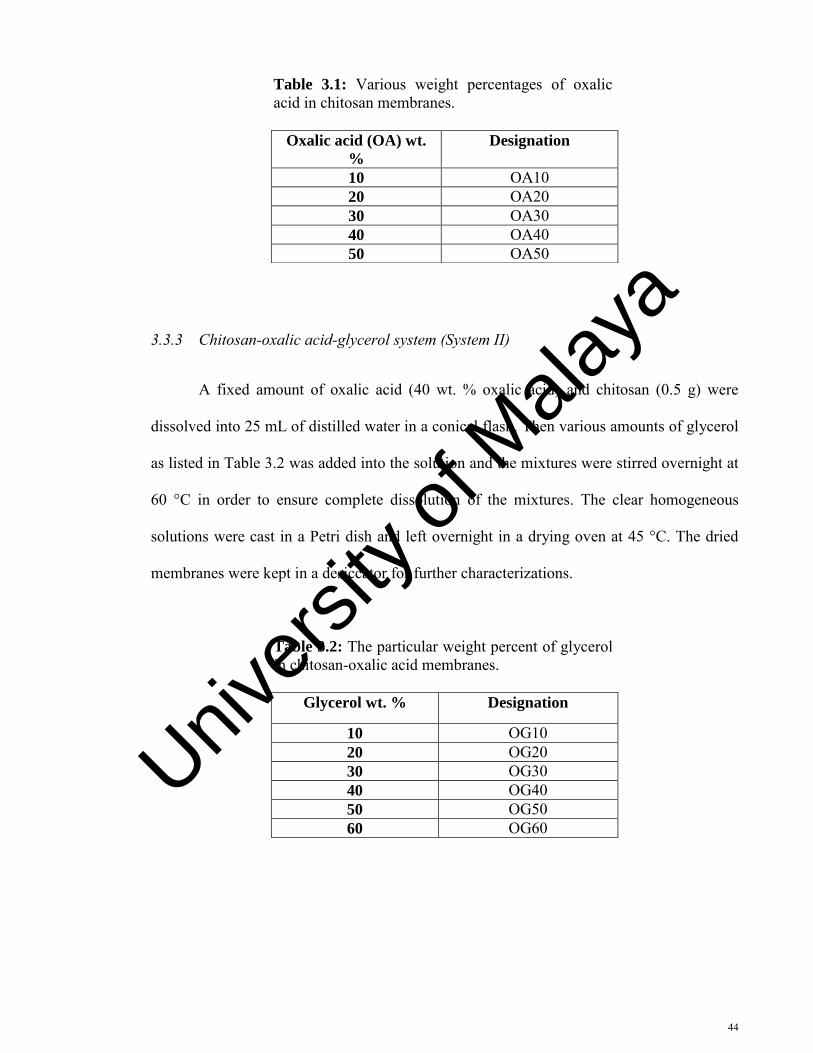
44
Table 3.1: Various weight percentages of oxalic acid in chitosan membranes.
3.3.3 Chitosan-oxalic acid-glycerol system (System II)
A fixed amount of oxalic acid (40 wt. % oxalic acid) and chitosan (0.5 g) were
dissolved into 25 mL of distilled water in a conical flask. Then various amounts of glycerol
as listed in Table 3.2 was added into the solution and the mixtures were stirred overnight at
60 °C in order to ensure complete dissolution of the mixtures. The clear homogeneous
solutions were cast in a Petri dish and left overnight in a drying oven at 45 °C. The dried
membranes were kept in a desiccator for further characterizations.
Table 3.2: The particular weight percent of glycerol in chitosan-oxalic acid membranes.
Glycerol wt. % Designation
10 OG10 20 OG20 30 OG30 40 OG40 50 OG50 60 OG60
Oxalic acid (OA) wt.
%
Designation
10 OA10 20 OA20 30 OA30 40 OA40 50 OA50
Univers
ity of
Mala
ya
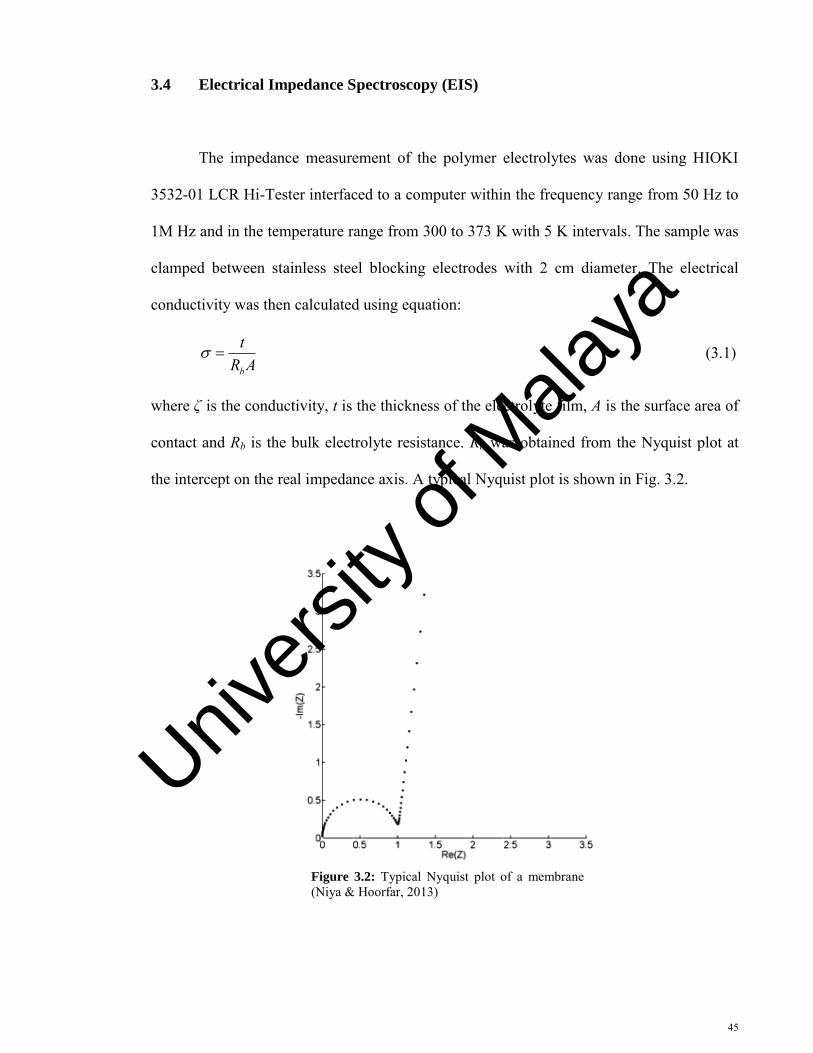
45
3.4 Electrical Impedance Spectroscopy (EIS)
The impedance measurement of the polymer electrolytes was done using HIOKI
3532-01 LCR Hi-Tester interfaced to a computer within the frequency range from 50 Hz to
1M Hz and in the temperature range from 300 to 373 K with 5 K intervals. The sample was
clamped between stainless steel blocking electrodes with 2 cm diameter. The electrical
conductivity was then calculated using equation:
ARtb
(3.1)
where ζ is the conductivity, t is the thickness of the electrolyte film, A is the surface area of
contact and Rb is the bulk electrolyte resistance. Rb was obtained from the Nyquist plot at
the intercept on the real impedance axis. A typical Nyquist plot is shown in Fig. 3.2.
Figure 3.2: Typical Nyquist plot of a membrane (Niya & Hoorfar, 2013)
Univers
ity of
Mala
ya
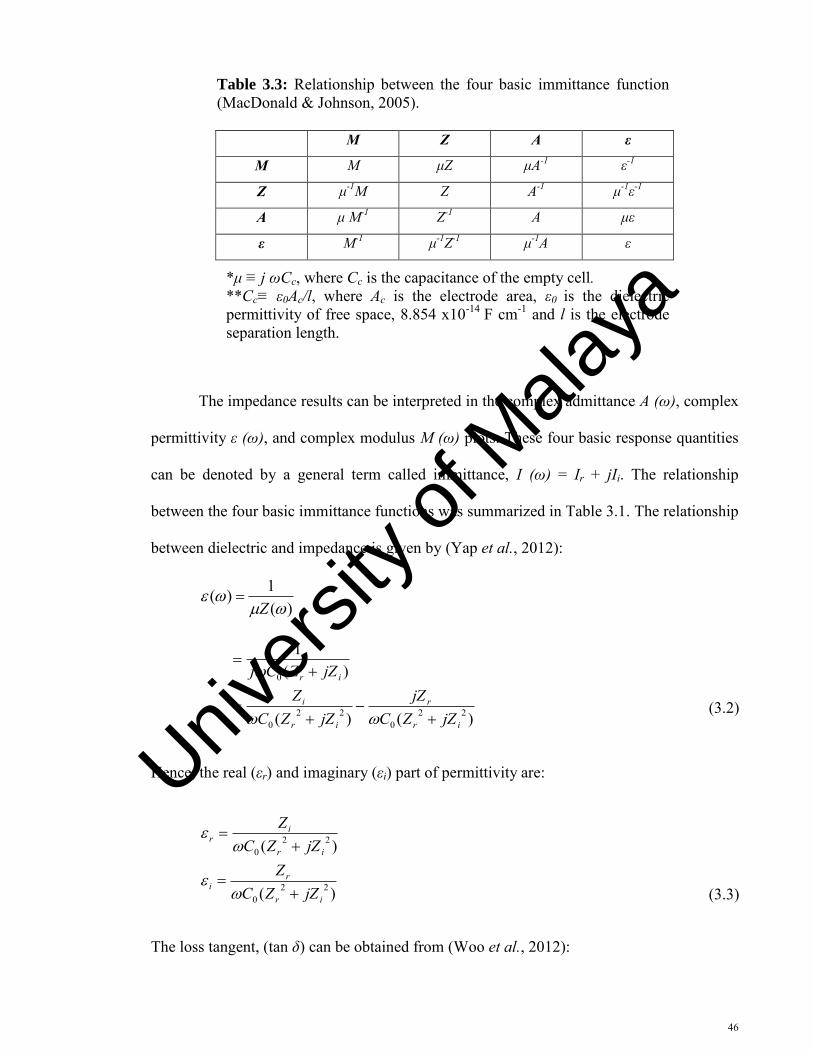
46
Table 3.3: Relationship between the four basic immittance function (MacDonald & Johnson, 2005).
M Z A ε
M M μZ μA-1 ε-1
Z μ-1M Z A-1 μ-1ε-1
A μ M-1 Z-1 A με
ε M-1 μ-1Z-1 μ-1A ε
*μ ≡ j ωCc, where Cc is the capacitance of the empty cell. **Cc≡ ε0Ac/l, where Ac is the electrode area, ε0 is the dielectric permittivity of free space, 8.854 x10⁻¹⁴ F cm-1 and l is the electrode separation length.
The impedance results can be interpreted in the complex admittance A (ω), complex
permittivity ε (ω), and complex modulus M (ω) plots. These four basic response quantities
can be denoted by a general term called immittance, I (ω) = Ir + jIi. The relationship
between the four basic immittance functions was summarized in Table 3.1. The relationship
between dielectric and impedance is given by (Yap et al., 2012):
)(1)(
Z
)()(
)(1
220
220
0
ir
r
ir
i
ir
jZZCjZ
jZZCZ
jZZCj
Hence, the real (εr) and imaginary (εi) part of permittivity are:
)(
)(
220
220
ir
ri
ir
ir
jZZCZ
jZZCZ
The loss tangent, (tan δ) can be obtained from (Woo et al., 2012):
(3.2)
(3.3)
Univers
ity of
Mala
ya
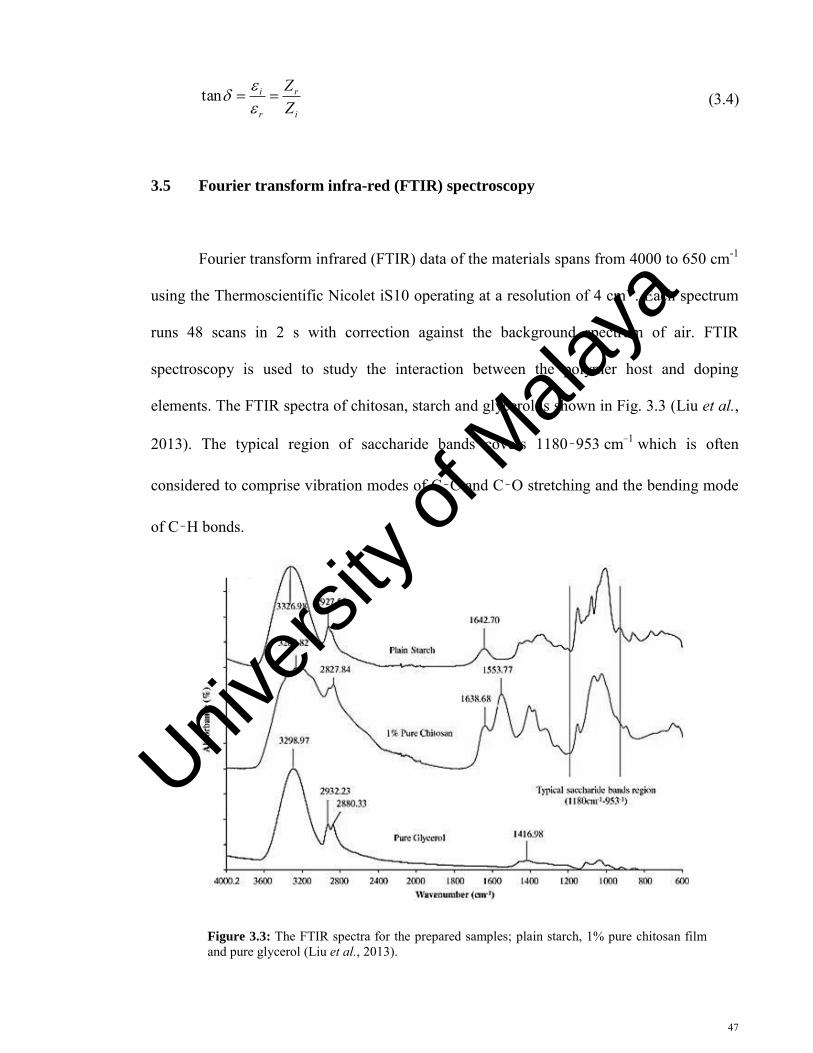
47
i
r
r
i
ZZ
tan
3.5 Fourier transform infra-red (FTIR) spectroscopy
Fourier transform infrared (FTIR) data of the materials spans from 4000 to 650 cm-1
using the Thermoscientific Nicolet iS10 operating at a resolution of 4 cm-1. Each spectrum
runs 48 scans in 2 s with correction against the background spectrum of air. FTIR
spectroscopy is used to study the interaction between the polymer host and doping
elements. The FTIR spectra of chitosan, starch and glycerol is shown in Fig. 3.3 (Liu et al.,
2013). The typical region of saccharide bands covers 1180–953 cm−1 which is often
considered to comprise vibration modes of C–C and C–O stretching and the bending mode
of C–H bonds.
Figure 3.3: The FTIR spectra for the prepared samples; plain starch, 1% pure chitosan film and pure glycerol (Liu et al., 2013).
(3.4)
Univers
ity of
Mala
ya
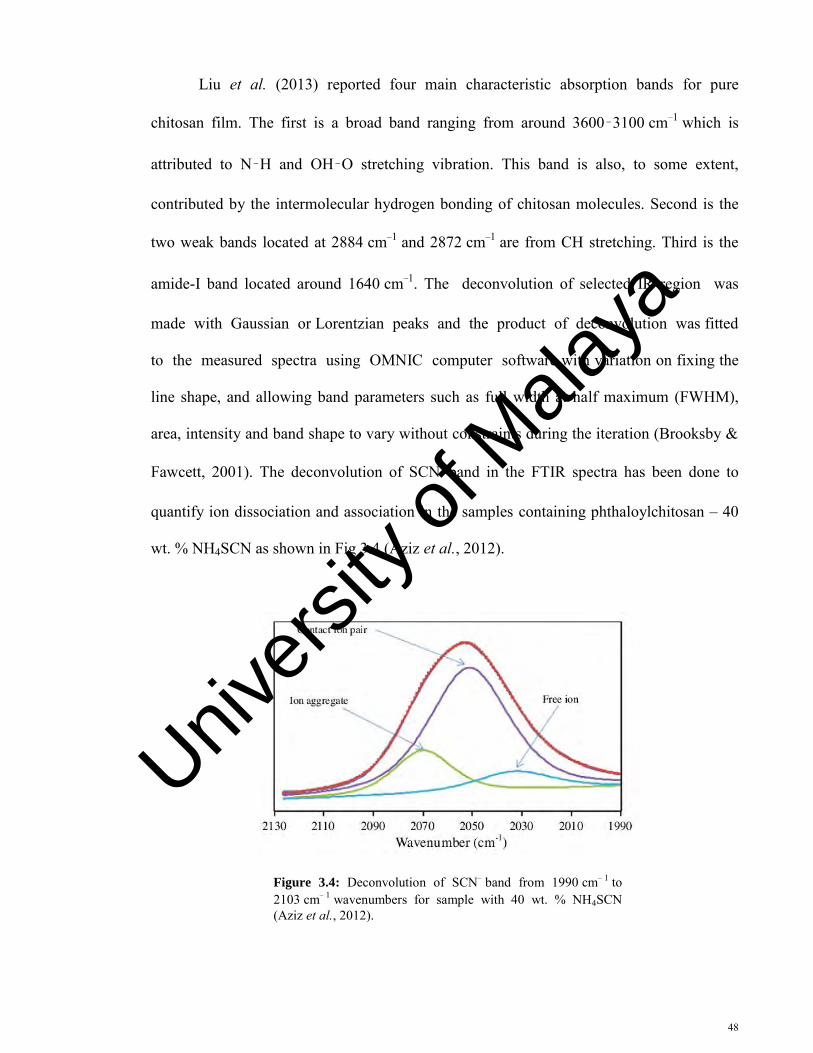
48
Liu et al. (2013) reported four main characteristic absorption bands for pure
chitosan film. The first is a broad band ranging from around 3600–3100 cm−1 which is
attributed to N–H and OH–O stretching vibration. This band is also, to some extent,
contributed by the intermolecular hydrogen bonding of chitosan molecules. Second is the
two weak bands located at 2884 cm−1 and 2872 cm−1 are from CH stretching. Third is the
amide-I band located around 1640 cm−1. The deconvolution of selected IR region was
made with Gaussian or Lorentzian peaks and the product of deconvolution was fitted
to the measured spectra using OMNIC computer software with variation on fixing the
line shape, and allowing band parameters such as full width at half maximum (FWHM),
area, intensity and band shape to vary without constraints during the iteration (Brooksby &
Fawcett, 2001). The deconvolution of SCN− band in the FTIR spectra has been done to
quantify ion dissociation and association in the samples containing phthaloylchitosan – 40
wt. % NH4SCN as shown in Fig 3.4 (Aziz et al., 2012).
Figure 3.4: Deconvolution of SCN− band from 1990 cm− 1 to 2103 cm− 1 wavenumbers for sample with 40 wt. % NH4SCN (Aziz et al., 2012).
Univers
ity of
Mala
ya
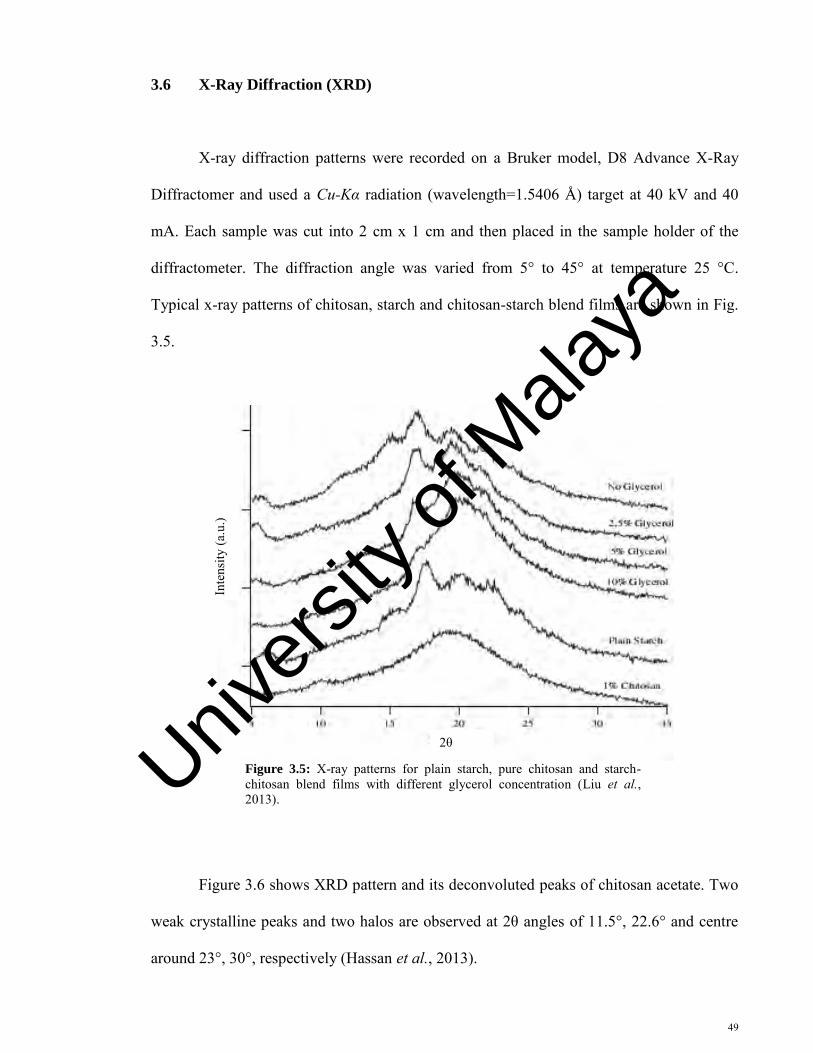
49
3.6 X-Ray Diffraction (XRD)
X-ray diffraction patterns were recorded on a Bruker model, D8 Advance X-Ray
Diffractomer and used a Cu-Kα radiation (wavelength=1.5406 Å) target at 40 kV and 40
mA. Each sample was cut into 2 cm x 1 cm and then placed in the sample holder of the
diffractometer. The diffraction angle was varied from 5° to 45° at temperature 25 °C.
Typical x-ray patterns of chitosan, starch and chitosan-starch blend films are shown in Fig.
3.5.
Figure 3.5: X-ray patterns for plain starch, pure chitosan and starch-chitosan blend films with different glycerol concentration (Liu et al., 2013).
Figure 3.6 shows XRD pattern and its deconvoluted peaks of chitosan acetate. Two
weak crystalline peaks and two halos are observed at 2θ angles of 11.5°, 22.6° and centre
around 23°, 30°, respectively (Hassan et al., 2013).
Inte
nsity
(a.u
.)
2θ Univers
ity of
Mala
ya
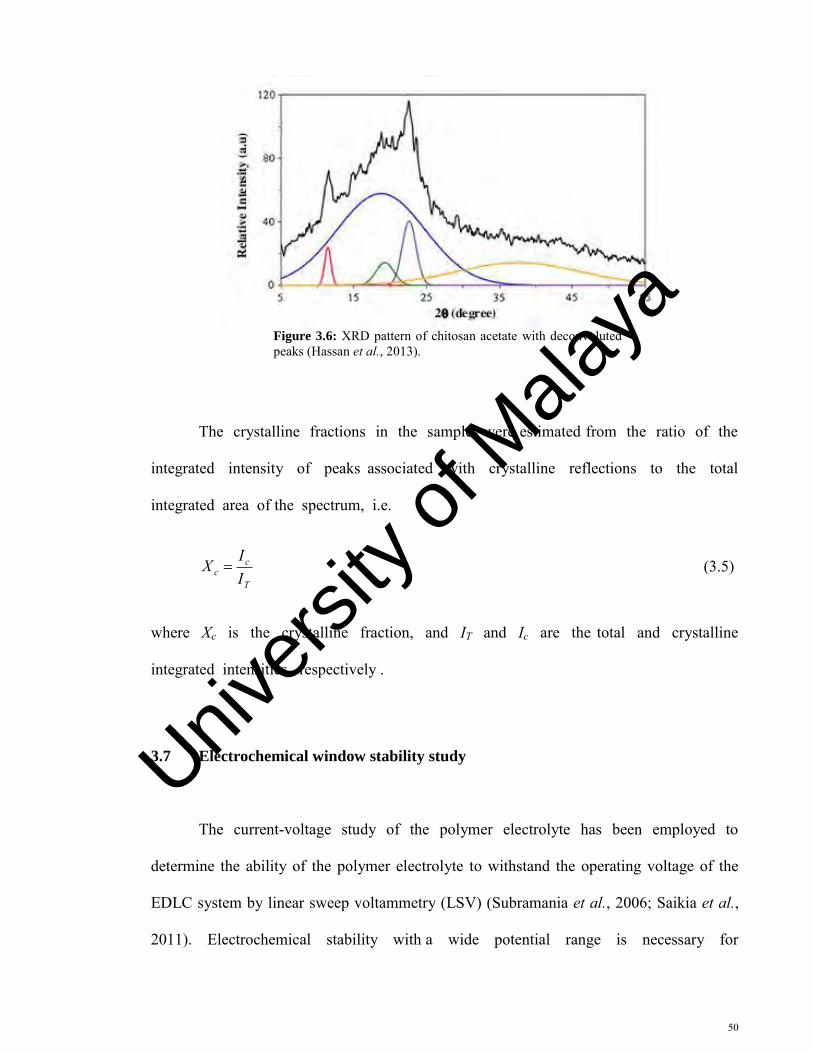
50
Figure 3.6: XRD pattern of chitosan acetate with deconvoluted peaks (Hassan et al., 2013).
The crystalline fractions in the samples were estimated from the ratio of the
integrated intensity of peaks associated with crystalline reflections to the total
integrated area of the spectrum, i.e.
T
cc I
IX (3.5)
where Xc is the crystalline fraction, and IT and Ic are the total and crystalline
integrated intensities, respectively .
3.7 Electrochemical window stability study
The current-voltage study of the polymer electrolyte has been employed to
determine the ability of the polymer electrolyte to withstand the operating voltage of the
EDLC system by linear sweep voltammetry (LSV) (Subramania et al., 2006; Saikia et al.,
2011). Electrochemical stability with a wide potential range is necessary for
Univers
ity of
Mala
ya
51
electrochemical devices. The anodic and cathodic voltage response was recorded with an
electrochemical working station potentiostat CHI600D. Hence, the LSV measurement was
carried out in order to study the decomposition voltage of the electrolyte.
Lian et al. (2014) reported the synthesis and unique electrochemical properties of
novel oxalate-chelated borate grafted polyvinyl formal based single-ion conductor polymer
(SCP) membranes. In their work, poly(vinyl formal) (PVFM) was doped with boric acid
(H3BO3), lithium carbonate (Li2CO3), oxalic acid (H2C2O4) in fixed ratio of 2.0:1.0:2.0. The
molar ratio of -OH in PVFM and B is fixed at 2:0.8, 2:0.9, 2:1.0, 2:1.1 and 2:1.2 to obtain
the corresponding single-ion conductor polymer (SCP) samples, which are marked as SCP-
0.8, SCP-0.9, SCP-1.0, SCP-1.1 and SCP-1.2, respectively.
Fig. 3.7 shows the voltammogram of samples SCP-0.8, SCP-0.9, SCP-1.0, SCP-1.1
and SCP-1.2. The linear sweep voltammograms (LSV) using Li/GPE/stainless steel cells at
room temperature between 2 V and 7 V versus Li/Li+ at a scanning rate of 5 mV s−1. No
obvious current peak is found through the working electrode from open circuit potential to
5 V all the samples. At applied voltage larger than 5 V, the samples will be oxidized slowly
due to the oxidation of plasticizer propelene carbonate (PC). The SCP samples show wide
electrochemical stability window, which is accessible to the application in lithium polymer
battery for high-voltage lithium ion batteries.
Univers
ity of
Mala
ya
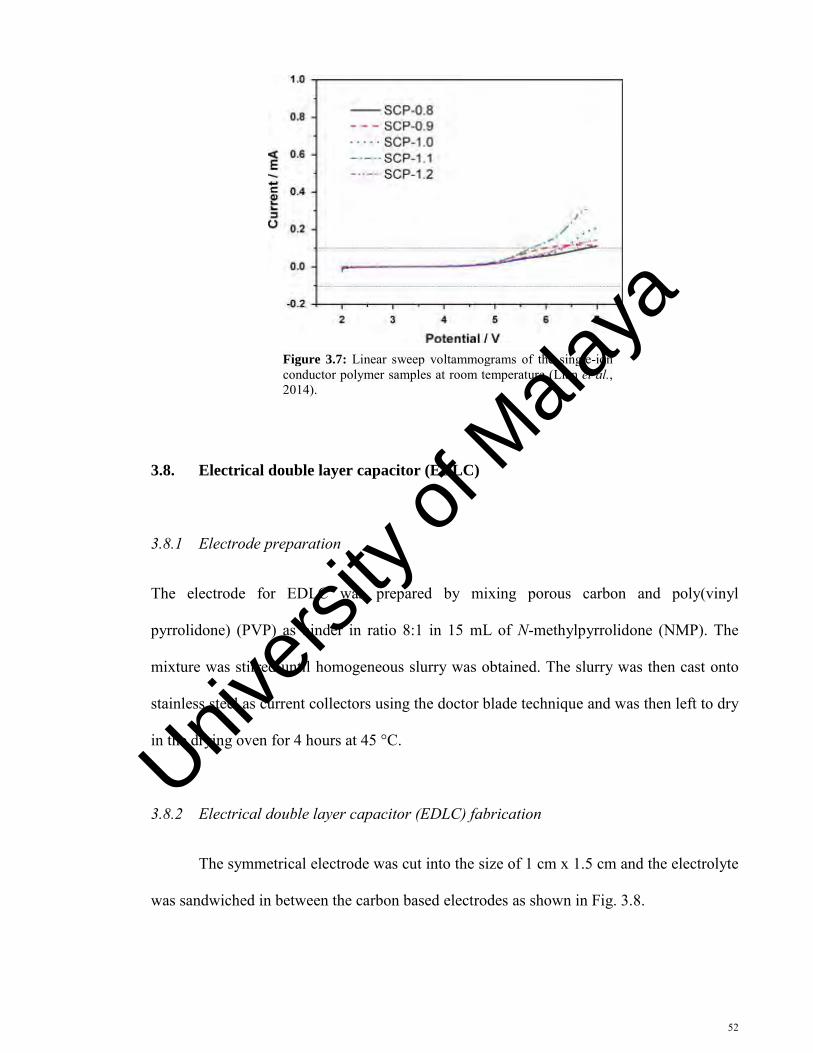
52
Figure 3.7: Linear sweep voltammograms of the single-ion conductor polymer samples at room temperature (Lian et al., 2014).
3.8. Electrical double layer capacitor (EDLC)
3.8.1 Electrode preparation
The electrode for EDLC was prepared by mixing porous carbon and poly(vinyl
pyrrolidone) (PVP) as binder in ratio 8:1 in 15 mL of N-methylpyrrolidone (NMP). The
mixture was stirred until homogeneous slurry was obtained. The slurry was then cast onto
stainless steel as current collectors using the doctor blade technique and was then left to dry
in the drying oven for 4 hours at 45 °C.
3.8.2 Electrical double layer capacitor (EDLC) fabrication
The symmetrical electrode was cut into the size of 1 cm x 1.5 cm and the electrolyte
was sandwiched in between the carbon based electrodes as shown in Fig. 3.8.
Univers
ity of
Mala
ya
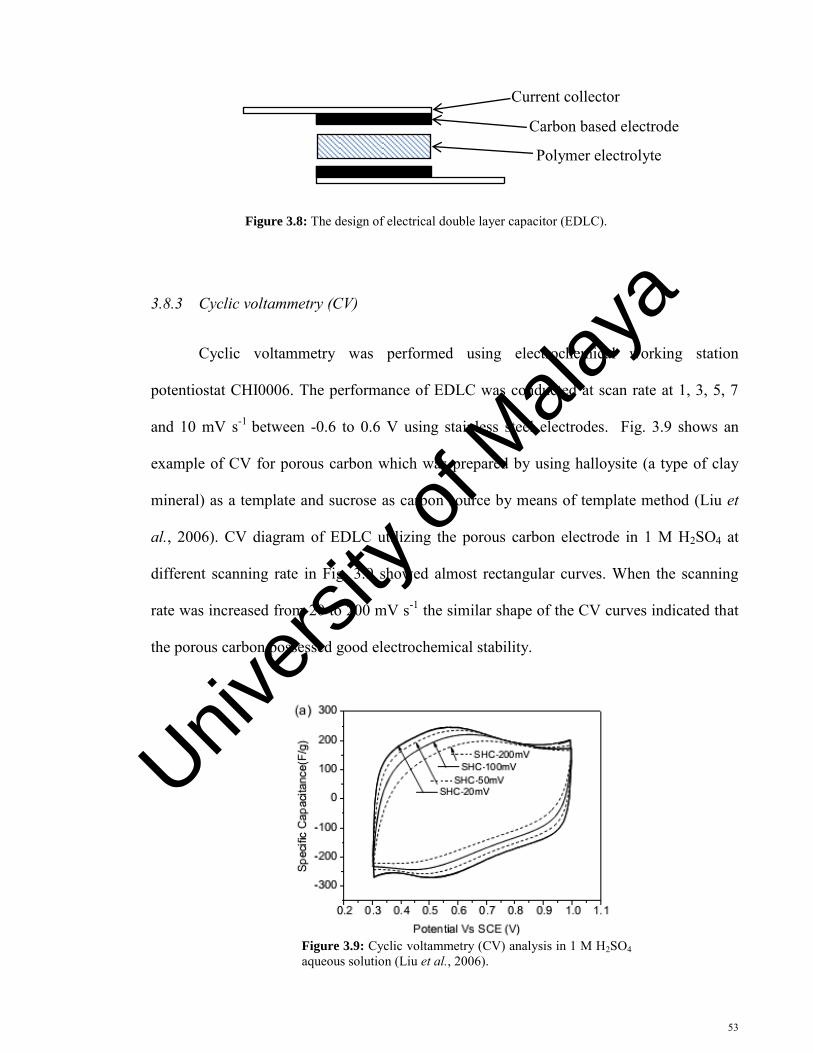
53
Figure 3.8: The design of electrical double layer capacitor (EDLC).
3.8.3 Cyclic voltammetry (CV)
Cyclic voltammetry was performed using electrochemical working station
potentiostat CHI0006. The performance of EDLC was conducted at scan rate at 1, 3, 5, 7
and 10 mV s-1 between -0.6 to 0.6 V using stainless steel electrodes. Fig. 3.9 shows an
example of CV for porous carbon which was prepared by using halloysite (a type of clay
mineral) as a template and sucrose as carbon source by means of template method (Liu et
al., 2006). CV diagram of EDLC utilizing the porous carbon electrode in 1 M H2SO4 at
different scanning rate in Fig. 3.9 showed almost rectangular curves. When the scanning
rate was increased from 20 to 200 mV s-1 the similar shape of the CV curves indicated that
the porous carbon possessed good electrochemical stability.
Figure 3.9: Cyclic voltammetry (CV) analysis in 1 M H2SO4 aqueous solution (Liu et al., 2006).
Current collector
Carbon based electrode
Polymer electrolyte
Univers
ity of
Mala
ya
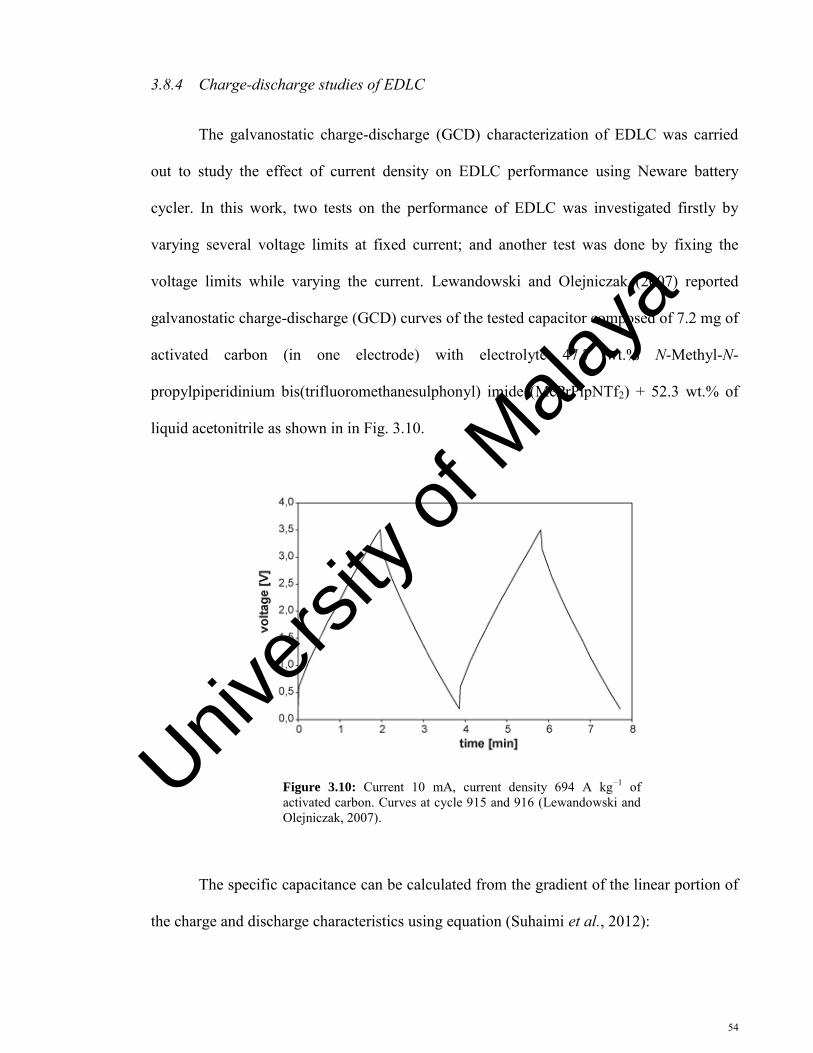
54
3.8.4 Charge-discharge studies of EDLC
The galvanostatic charge-discharge (GCD) characterization of EDLC was carried
out to study the effect of current density on EDLC performance using Neware battery
cycler. In this work, two tests on the performance of EDLC was investigated firstly by
varying several voltage limits at fixed current; and another test was done by fixing the
voltage limits while varying the current. Lewandowski and Olejniczak (2007) reported
galvanostatic charge-discharge (GCD) curves of the tested capacitor composed of 7.2 mg of
activated carbon (in one electrode) with electrolyte 47.7 wt.% N-Methyl-N-
propylpiperidinium bis(trifluoromethanesulphonyl) imide (MePrPipNTf2) + 52.3 wt.% of
liquid acetonitrile as shown in in Fig. 3.10.
Figure 3.10: Current 10 mA, current density 694 A kg−1 of activated carbon. Curves at cycle 915 and 916 (Lewandowski and Olejniczak, 2007).
The specific capacitance can be calculated from the gradient of the linear portion of
the charge and discharge characteristics using equation (Suhaimi et al., 2012):
Univers
ity of
Mala
ya
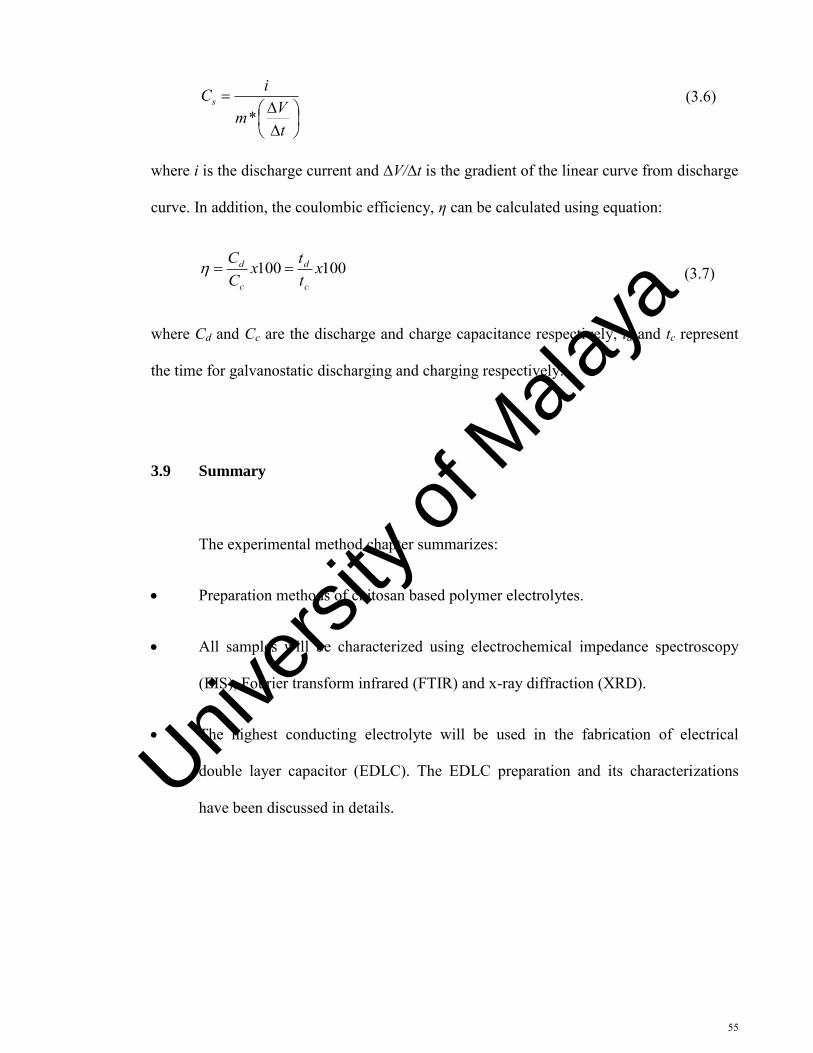
55
tVm
iCs
* (3.6)
where i is the discharge current and ∆V/∆t is the gradient of the linear curve from discharge
curve. In addition, the coulombic efficiency, η can be calculated using equation:
100100 xttx
CC
c
d
c
d
where Cd and Cc are the discharge and charge capacitance respectively, td and tc represent
the time for galvanostatic discharging and charging respectively.
3.9 Summary
The experimental method chapter summarizes:
Preparation methods of chitosan based polymer electrolytes.
All samples will be characterized using electrochemical impedance spectroscopy
(EIS), Fourier transform infrared (FTIR) and x-ray diffraction (XRD).
The highest conducting electrolyte will be used in the fabrication of electrical
double layer capacitor (EDLC). The EDLC preparation and its characterizations
have been discussed in details.
(3.7)
Univers
ity of
Mala
ya
56
CHAPTER 4
ELECTRICAL IMPEDANCE SPECTROSCOPY (EIS) STUDIES
4.1 Introduction
Impedance measurement has been used to study the electrochemical systems by
applying a small voltage perturbation across the sample (Brett et al., 1993). The small
applied voltage is to ensure that the current response is also sinusoidal with the same
frequency as the applied voltage but can differ in phase and amplitude from the applied
signa l. In this chapter, two systems of electrolytes will be prepared namely; System I
compose of chitosan−oxalic acid samples whereas System II comprises chitosan−oxalic
acid−glycerol samples. The ionic conductivity of the electrolytes will be investigated
using electrochemical impedance spectroscopy (EIS) at room and elevated
temperatures. The ac conduction mechanism of the electrolytes will be studied using
Jonscher’s universal power law (UPL). The conductivity relaxation time η of the
electrolytes can be determined by plotting the dielectric tangent loss (tan δ) graph.
4.2 Conductivity Studies on Chitosan–Oxalic acid system (System I)
The chemical structure of oxalic acid which has been used in this work is shown
in Fig. 4.1. Oxalic acid is a dicarboxylic acid (i.e. two carboxylic acid groups) and
named as alkanedioic acids in the International Union of Pure and Applied Chemistry
(IUPAC) system (Solomon & Fryhle, 2004). Oxalic acid is a polar substance and can
form strong hydrogen bonds with each other and with water which results in appreciable
Univers
ity of
Mala
ya
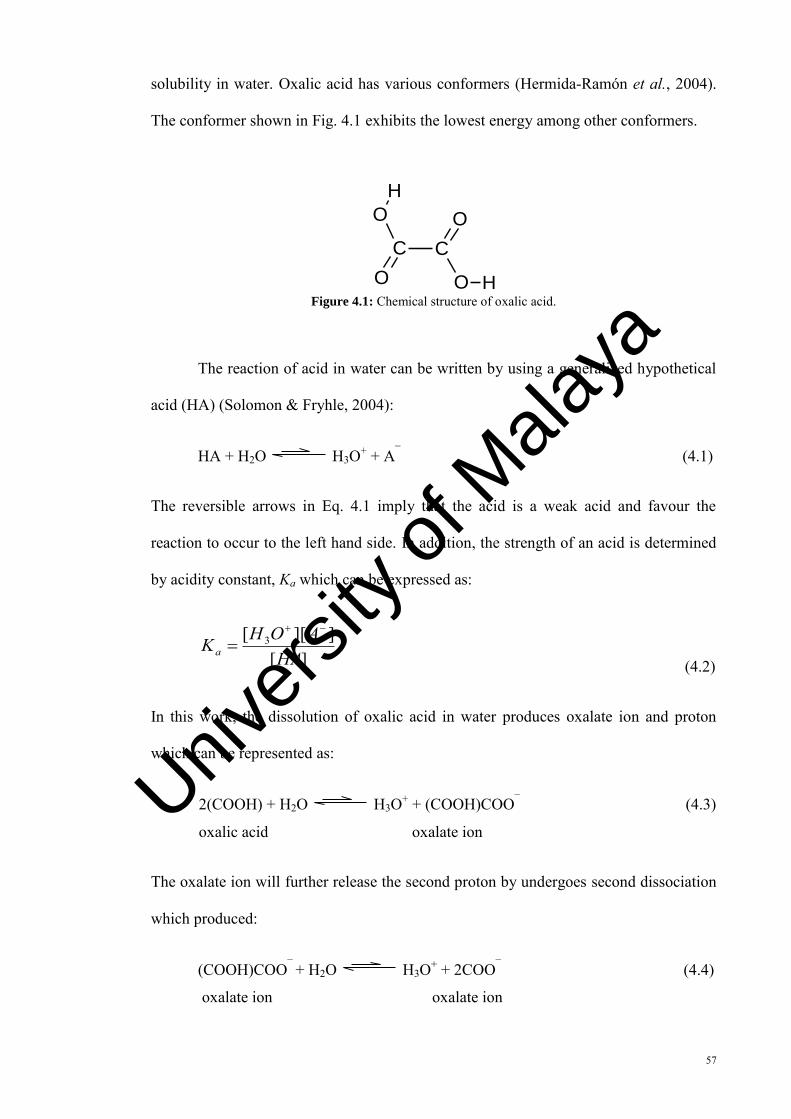
57
solubility in water. Oxalic acid has various conformers (Hermida-Ramón et al., 2004).
The conformer shown in Fig. 4.1 exhibits the lowest energy among other conformers.
C CO
O
O
O H
H
Figure 4.1: Chemical structure of oxalic acid.
The reaction of acid in water can be written by using a generalized hypothetical
acid (HA) (Solomon & Fryhle, 2004):
HA + H2O H3O+ + A¯ (4.1)
The reversible arrows in Eq. 4.1 imply that the acid is a weak acid and favour the
reaction to occur to the left hand side. In addition, the strength of an acid is determined
by acidity constant, Ka which can be expressed as:
][]][[ 3
HAAOHKa
(4.2)
In this work, the dissolution of oxalic acid in water produces oxalate ion and proton
which can be represented as:
2(COOH) + H2O H3O+ + (COOH)COO¯ (4.3)
oxalic acid oxalate ion
The oxalate ion will further release the second proton by undergoes second dissociation
which produced:
(COOH)COO¯ + H2O H3O+ + 2COO¯ (4.4)
oxalate ion oxalate ion
Univers
ity of
Mala
ya
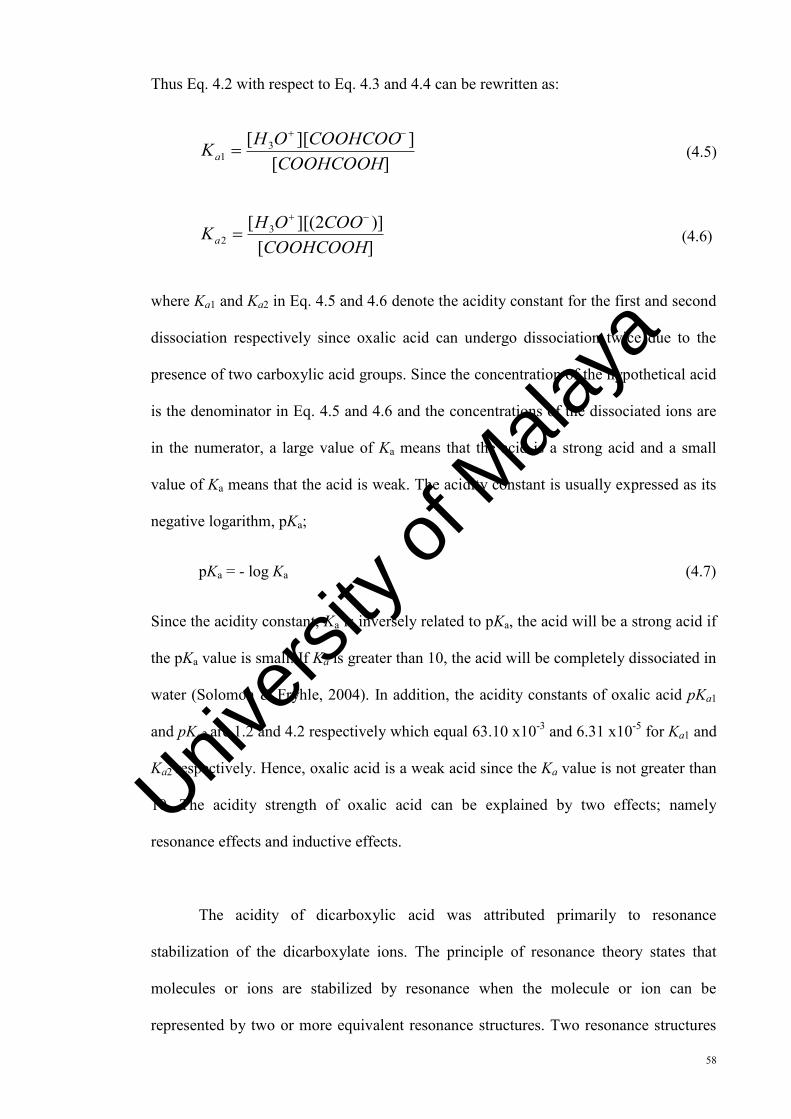
58
Thus Eq. 4.2 with respect to Eq. 4.3 and 4.4 can be rewritten as:
][]][[ 3
1 COOHCOOHCOOHCOOOHKa
][)]2][([ 3
2 COOHCOOHCOOOHKa
(4.6)
where Ka1 and Ka2 in Eq. 4.5 and 4.6 denote the acidity constant for the first and second
dissociation respectively since oxalic acid can undergo dissociation twice due to the
presence of two carboxylic acid groups. Since the concentration of the hypothetical acid
is the denominator in Eq. 4.5 and 4.6 and the concentrations of the dissociated ions are
in the numerator, a large value of Ka means that the acid is a strong acid and a small
value of Ka means that the acid is weak. The acidity constant is usually expressed as its
negative logarithm, pKa;
pKa = - log Ka (4.7)
Since the acidity constant, Ka is inversely related to pKa, the acid will be a strong acid if
the pKa value is small. If Ka is greater than 10, the acid will be completely dissociated in
water (Solomon & Fryhle, 2004). In addition, the acidity constants of oxalic acid pKa1
and pKa2 are 1.2 and 4.2 respectively which equal 63.10 x10⁻³ and 6.31 x10⁻⁵ for Ka1 and
Ka2 respectively. Hence, oxalic acid is a weak acid since the Ka value is not greater than
10. The acidity strength of oxalic acid can be explained by two effects; namely
resonance effects and inductive effects.
The acidity of dicarboxylic acid was attributed primarily to resonance
stabilization of the dicarboxylate ions. The principle of resonance theory states that
molecules or ions are stabilized by resonance when the molecule or ion can be
represented by two or more equivalent resonance structures. Two resonance structures
(4.5)
Univers
ity of
Mala
ya
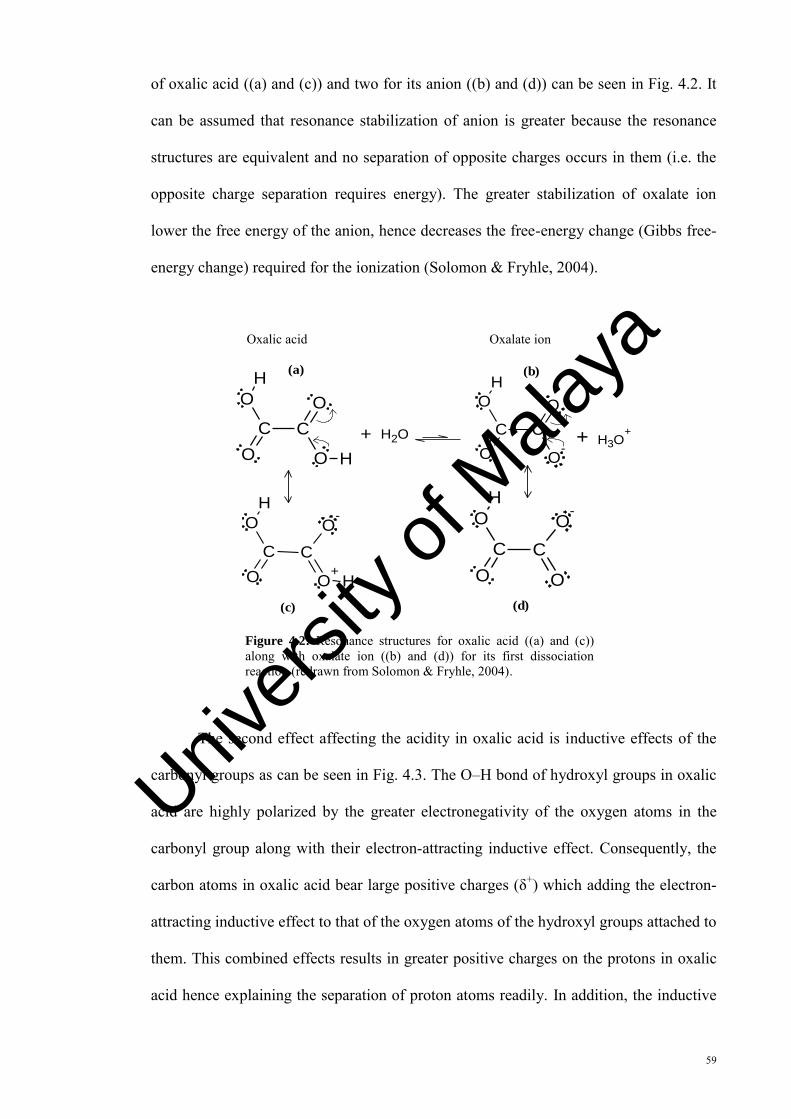
59
of oxalic acid ((a) and (c)) and two for its anion ((b) and (d)) can be seen in Fig. 4.2. It
can be assumed that resonance stabilization of anion is greater because the resonance
structures are equivalent and no separation of opposite charges occurs in them (i.e. the
opposite charge separation requires energy). The greater stabilization of oxalate ion
lower the free energy of the anion, hence decreases the free-energy change (Gibbs free-
energy change) required for the ionization (Solomon & Fryhle, 2004).
Oxalic acid Oxalate ion
C CO
O
O
O H
H
+ OH2 C C
O
O-
O
O
H
OH3++
C C
O+
O
O H
HO
-
C C
O
O
O
HO
-
(a) (b)
(d)(c)
Figure 4.2: Resonance structures for oxalic acid ((a) and (c)) along with oxalate ion ((b) and (d)) for its first dissociation reaction (redrawn from Solomon & Fryhle, 2004).
The second effect affecting the acidity in oxalic acid is inductive effects of the
carbonyl groups as can be seen in Fig. 4.3. The O‒H bond of hydroxyl groups in oxalic
acid are highly polarized by the greater electronegativity of the oxygen atoms in the
carbonyl group along with their electron-attracting inductive effect. Consequently, the
carbon atoms in oxalic acid bear large positive charges (δ+) which adding the electron-
attracting inductive effect to that of the oxygen atoms of the hydroxyl groups attached to
them. This combined effects results in greater positive charges on the protons in oxalic
acid hence explaining the separation of proton atoms readily. In addition, the inductive
Univers
ity of
Mala
ya
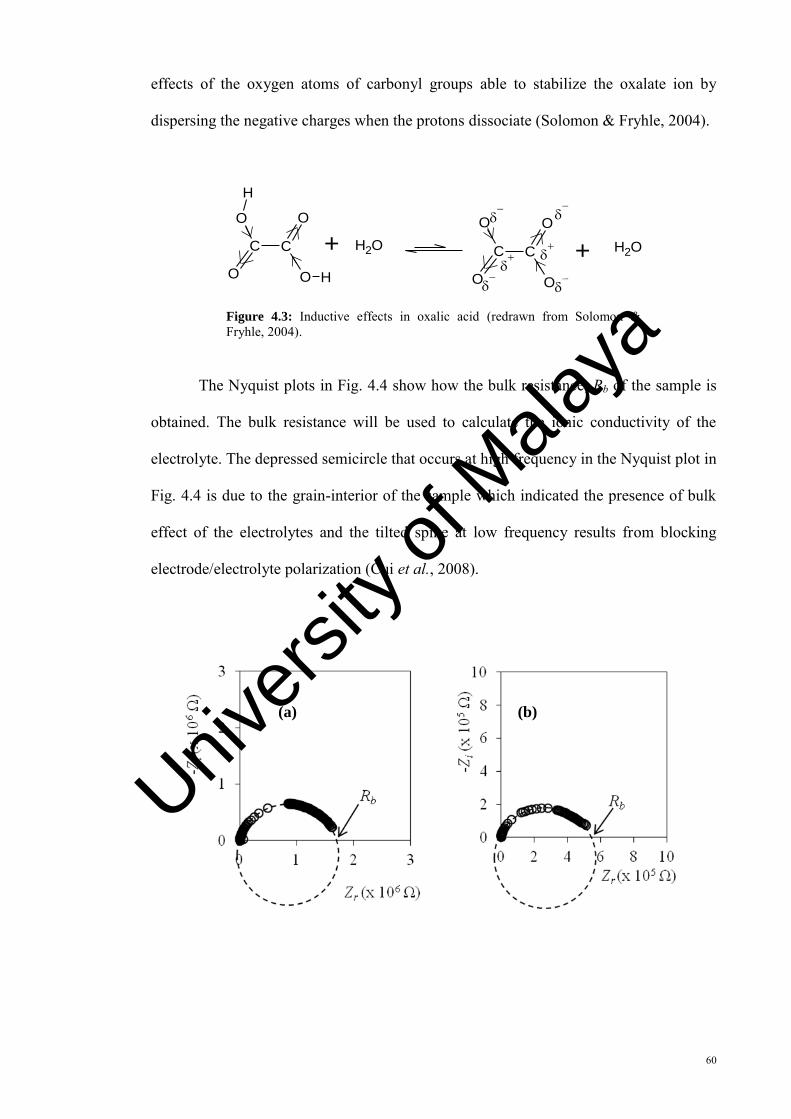
60
effects of the oxygen atoms of carbonyl groups able to stabilize the oxalate ion by
dispersing the negative charges when the protons dissociate (Solomon & Fryhle, 2004).
C C
O
O
O
O H
H
C C
O
O-
O-
O
+ OH2 + OH2
Figure 4.3: Inductive effects in oxalic acid (redrawn from Solomon & Fryhle, 2004).
The Nyquist plots in Fig. 4.4 show how the bulk resistance, Rb of the sample is
obtained. The bulk resistance will be used to calculate the ionic conductivity of the
electrolyte. The depressed semicircle that occurs at high frequency in the Nyquist plot in
Fig. 4.4 is due to the grain-interior of the sample which indicated the presence of bulk
effect of the electrolytes and the tilted spike at low frequency results from blocking
electrode/electrolyte polarization (Cui et al., 2008).
(a) (b)
Univers
ity of
Mala
ya
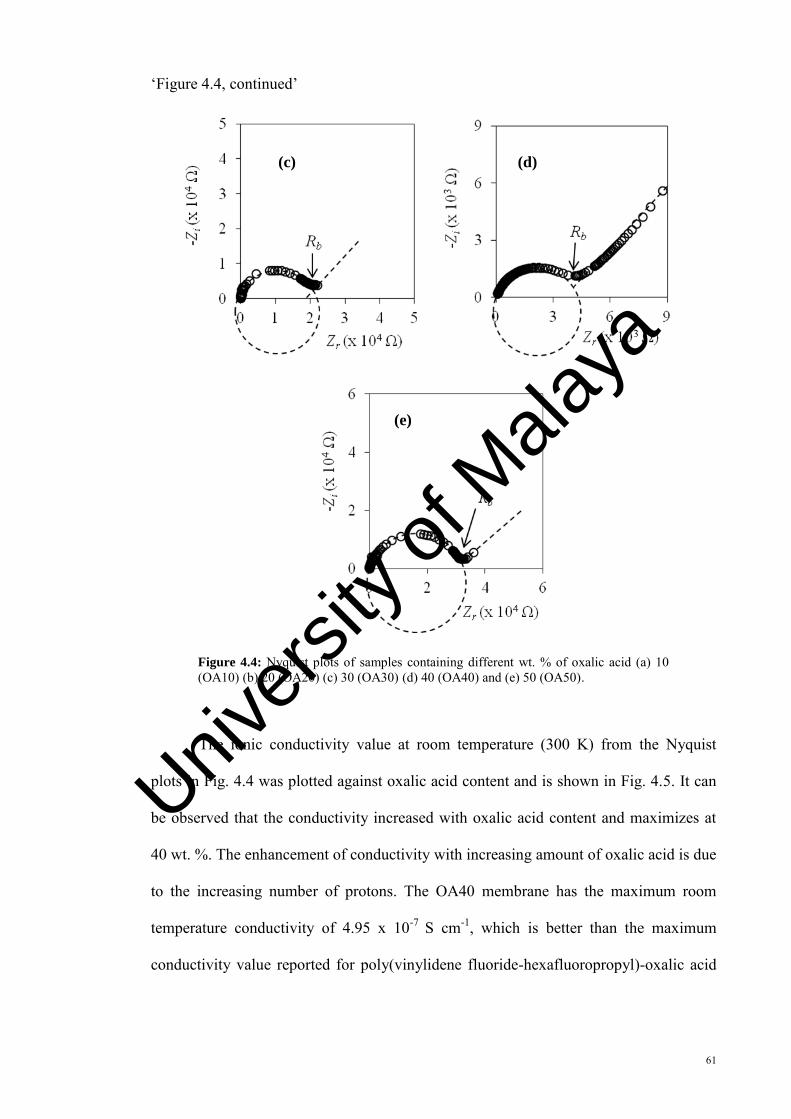
61
‘Figure 4.4, continued’
Figure 4.4: Nyquist plots of samples containing different wt. % of oxalic acid (a) 10 (OA10) (b) 20 (OA20) (c) 30 (OA30) (d) 40 (OA40) and (e) 50 (OA50).
The ionic conductivity value at room temperature (300 K) from the Nyquist
plots in Fig. 4.4 was plotted against oxalic acid content and is shown in Fig. 4.5. It can
be observed that the conductivity increased with oxalic acid content and maximizes at
40 wt. %. The enhancement of conductivity with increasing amount of oxalic acid is due
to the increasing number of protons. The OA40 membrane has the maximum room
temperature conductivity of 4.95 x 10⁻⁷ S cm-1, which is better than the maximum
conductivity value reported for poly(vinylidene fluoride-hexafluoropropyl)-oxalic acid
(e)
(c) (d)
Univers
ity of
Mala
ya
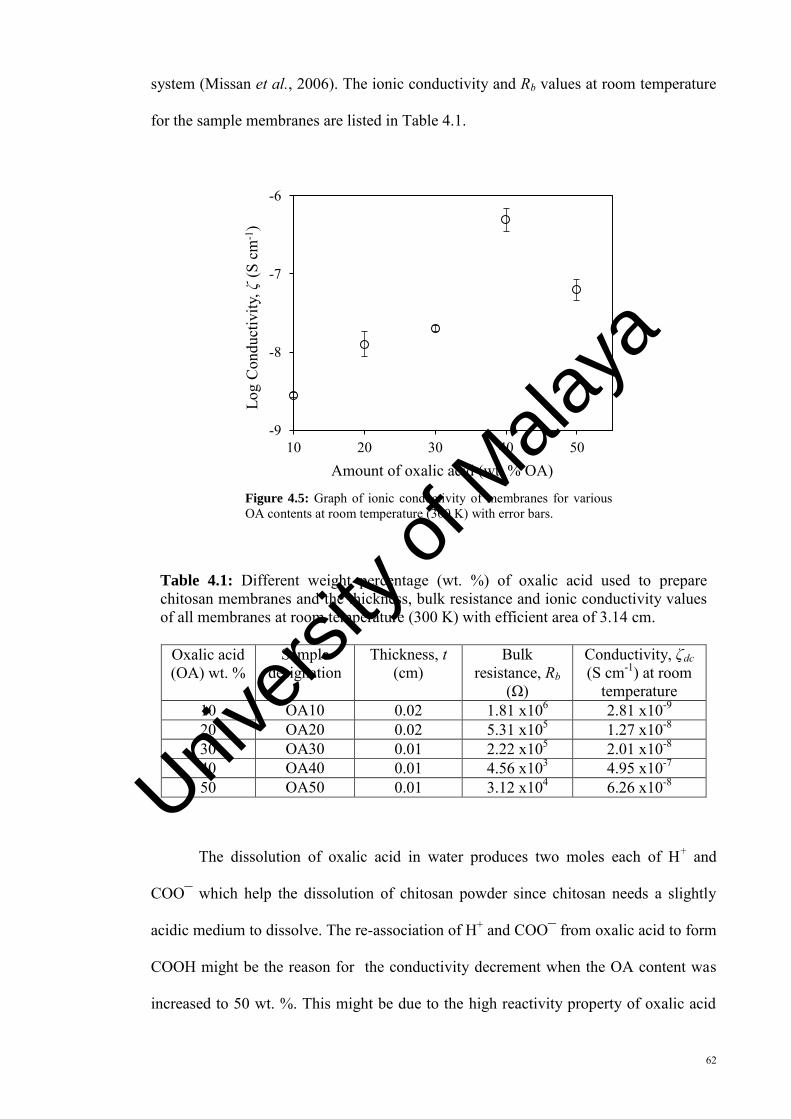
62
system (Missan et al., 2006). The ionic conductivity and Rb values at room temperature
for the sample membranes are listed in Table 4.1.
Figure 4.5: Graph of ionic conductivity of membranes for various OA contents at room temperature (300 K) with error bars.
Table 4.1: Different weight percentage (wt. %) of oxalic acid used to prepare chitosan membranes and the thickness, bulk resistance and ionic conductivity values of all membranes at room temperature (300 K) with efficient area of 3.14 cm.
Oxalic acid (OA) wt. %
Sample designation
Thickness, t (cm)
Bulk resistance, Rb
(Ω)
Conductivity, ζdc (S cm-1) at room
temperature
10 OA10 0.02 1.81 x10⁶ 2.81 x10⁻⁹ 20 OA20 0.02 5.31 x10⁵ 1.27 x10⁻⁸ 30 OA30 0.01 2.22 x10⁵ 2.01 x10⁻⁸ 40 OA40 0.01 4.56 x10³ 4.95 x10⁻⁷ 50 OA50 0.01 3.12 x10⁴ 6.26 x10⁻⁸
The dissolution of oxalic acid in water produces two moles each of H+ and
COO¯ which help the dissolution of chitosan powder since chitosan needs a slightly
acidic medium to dissolve. The re-association of H+ and COO¯ from oxalic acid to form
COOH might be the reason for the conductivity decrement when the OA content was
increased to 50 wt. %. This might be due to the high reactivity property of oxalic acid
-9
-8
-7
-6
10 20 30 40 50
Log
Con
duct
ivity
, ζ (S
cm
-1)
Amount of oxalic acid (wt. % OA)
Univers
ity of
Mala
ya
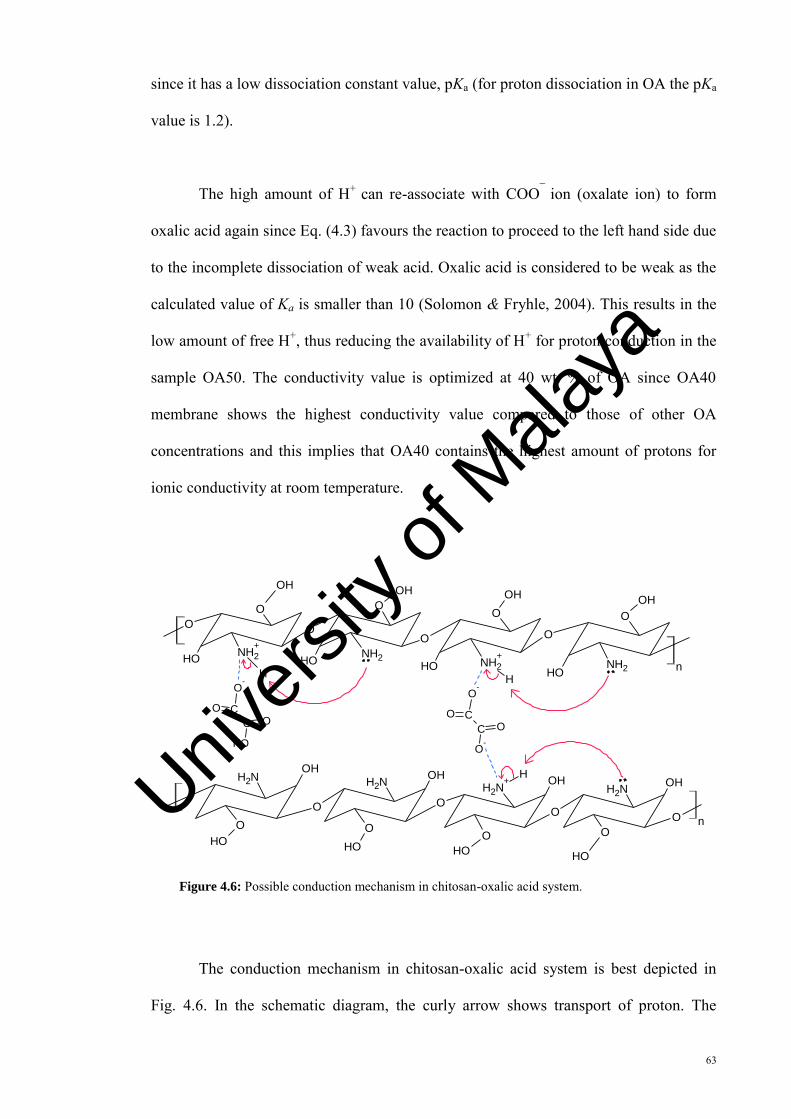
63
since it has a low dissociation constant value, pKa (for proton dissociation in OA the pKa
value is 1.2).
The high amount of H+ can re-associate with COO¯ ion (oxalate ion) to form
oxalic acid again since Eq. (4.3) favours the reaction to proceed to the left hand side due
to the incomplete dissociation of weak acid. Oxalic acid is considered to be weak as the
calculated value of Ka is smaller than 10 (Solomon & Fryhle, 2004). This results in the
low amount of free H+, thus reducing the availability of H+ for proton conduction in the
sample OA50. The conductivity value is optimized at 40 wt. % of OA since OA40
membrane shows the highest conductivity value compared to those of other OA
concentrations and this implies that OA40 contains the highest amount of protons for
ionic conductivity at room temperature.
OO O
O
OH
OOH
OOH
OOH
O
NH2+
NH2 NH2+
NH2OH OH OH OHH H
OOO
O
OH
OOH
OOH
OOH
O
NH2NH2+NH2
NH2 OHOHOHOH H
CC
OH
O
O-
O
n
n
CC
O-
O
O-
O
Figure 4.6: Possible conduction mechanism in chitosan-oxalic acid system.
The conduction mechanism in chitosan-oxalic acid system is best depicted in
Fig. 4.6. In the schematic diagram, the curly arrow shows transport of proton. The
Univers
ity of
Mala
ya
64
oxygen atom in the water molecule will form hydrogen bond with the hydrogen atom of
the hydroxyl group in oxalic acid. The inductive effect in oxalic acid releases two
protons (H+). These protons will attach to water molecule hence forming hydroxonium
ion (H3O+). Upon oxalic acid dissociation, oxalate ion and two hydroxonium ions will
be produced. The hydroxonium ion will then protonate the amine group in the chitosan.
The oxalate ion can crosslink two protonated amine groups (R-NH3+) from two different
chitosan chains due to coulombic electrostatic interaction (Selvasekarapandian et al.,
2006). By assuming the protonated amine R-NH3+ of chitosan has similar tetrahedral
structure as in ammonium ion NH4+, one of the hydrogen is weakly bonded to N
(Hashmi et al., 1990). The weakly bonded hydrogen will dissociate under the influence
of electrical field (Hashmi et al., 1990; Buraidah et al., 2009). This led to proton H+
transport in solid chitosan-oxalic acid electrolytes. The movement of proton is shown by
the curly arrow in Fig. 4.6.
4.2.1 Temperature dependence of conductivity
The corresponding Nyquist plots for the highest conducting sample, OA40 at
various temperatures are shown in Fig. 4.7. The bulk resistance, Rb value and the semi-
circle region were observed to be reduced as the temperature increased. Moreover, the
spikes become more significant with temperature increment. These indicate that the
sample membrane OA40 is thermally active with ion migration contributing to as
temperature increases (Krishnakumar & Shanmugam, 2012).
The temperature dependence of conductivity exhibited by the highest RT
conducting sample membrane, OA40, is shown in Fig. 4.8 in the form of log ζ versus
1000/T. The conductivity values at the measured temperatures are listed in Table 4.2. It
Univers
ity of
Mala
ya
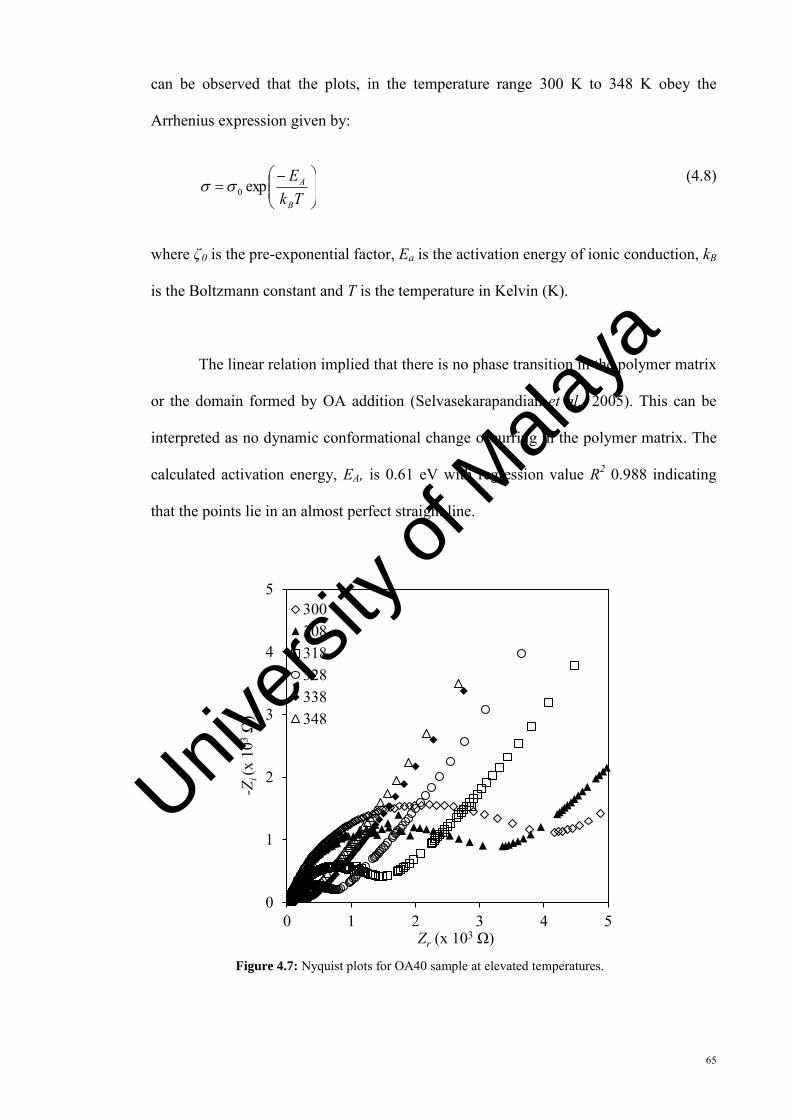
65
can be observed that the plots, in the temperature range 300 K to 348 K obey the
Arrhenius expression given by:
TkE
B
Aexp0
where ζ0 is the pre-exponential factor, Ea is the activation energy of ionic conduction, kB
is the Boltzmann constant and T is the temperature in Kelvin (K).
The linear relation implied that there is no phase transition in the polymer matrix
or the domain formed by OA addition (Selvasekarapandian et al., 2005). This can be
interpreted as no dynamic conformational change occurring in the polymer matrix. The
calculated activation energy, EA, is 0.61 eV with regression value R2 0.988 indicating
that the points lie in an almost perfect straight line.
Figure 4.7: Nyquist plots for OA40 sample at elevated temperatures.
0
1
2
3
4
5
0 1 2 3 4 5
-Zi (
x 10
3 Ω)
Zr (x 103 Ω)
300308318328338348
(4.8)
Univers
ity of
Mala
ya
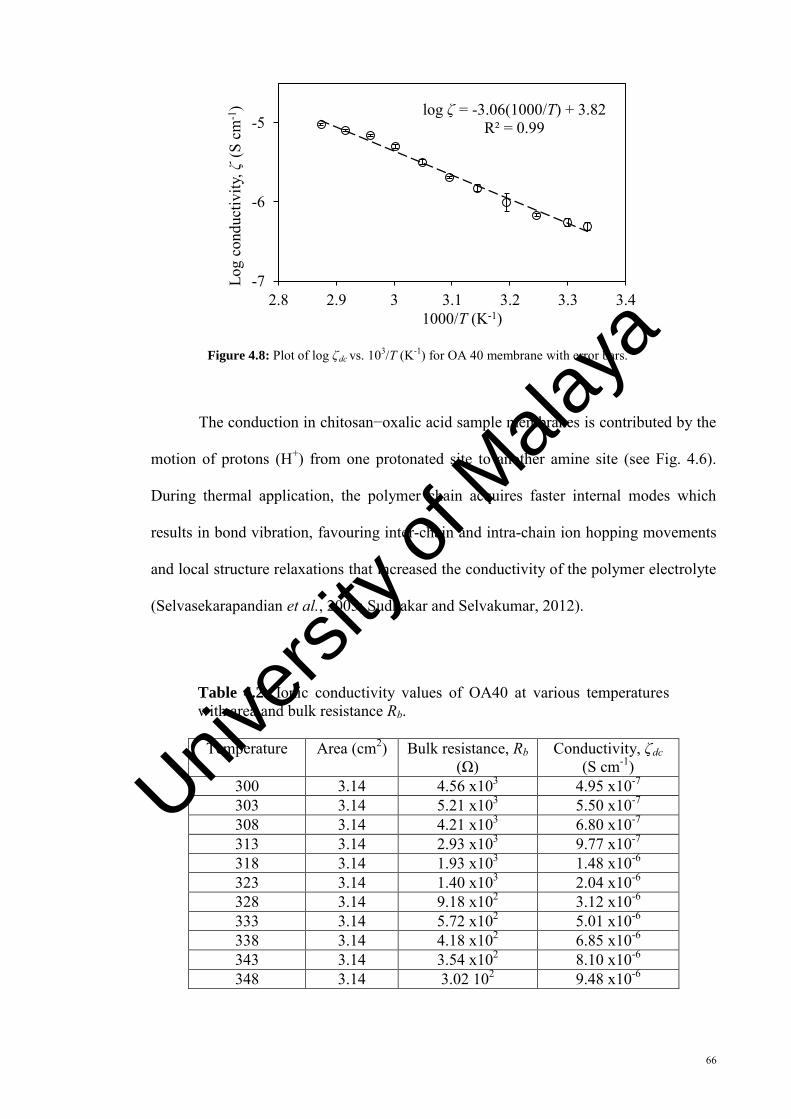
66
Figure 4.8: Plot of log ζdc vs. 103/T (K-1) for OA 40 membrane with error bars.
The conduction in chitosan−oxalic acid sample membranes is contributed by the
motion of protons (H+) from one protonated site to another amine site (see Fig. 4.6).
During thermal application, the polymer chain acquires faster internal modes which
results in bond vibration, favouring inter-chain and intra-chain ion hopping movements
and local structure relaxations that increased the conductivity of the polymer electrolyte
(Selvasekarapandian et al., 2005; Sudhakar and Selvakumar, 2012).
Table 4.2: Ionic conductivity values of OA40 at various temperatures with area and bulk resistance Rb.
Temperature Area (cm2) Bulk resistance, Rb (Ω)
Conductivity, ζdc (S cm-1)
300 3.14 4.56 x10³ 4.95 x10⁻⁷ 303 3.14 5.21 x10³ 5.50 x10⁻⁷ 308 3.14 4.21 x10³ 6.80 x10⁻⁷ 313 3.14 2.93 x10³ 9.77 x10⁻⁷ 318 3.14 1.93 x10³ 1.48 x10⁻⁶ 323 3.14 1.40 x10³ 2.04 x10⁻⁶ 328 3.14 9.18 x10² 3.12 x10⁻⁶ 333 3.14 5.72 x10² 5.01 x10⁻⁶ 338 3.14 4.18 x10² 6.85 x10⁻⁶ 343 3.14 3.54 x10² 8.10 x10⁻⁶ 348 3.14 3.02 102 9.48 x10⁻⁶
log ζ = -3.06(1000/T) + 3.82 R² = 0.99
-7
-6
-5
2.8 2.9 3 3.1 3.2 3.3 3.4
Log
cond
uctiv
ity, ζ
(S c
m-1
)
1000/T (K-1)
Univers
ity of
Mala
ya
67
In this chitosan−oxalic acid system, H+ can hop from one protonated site to
another amine group (NH2) since the polymer chains of chitosan in the electrolyte are
able to make the bond vibration (Ng and Mohamad, 2008; Krishnakumar and
Shanmugam, 2012). Increased in conductivity with temperature indicates the increase in
mobility of the protons. According to Krishnakumar and Shanmugam (2012) the proton
have gained kinetic energy and able to hop from a protonated amine site (NH3+) to an
unprotonated site (NH2).
4.2.2 AC conductivity studies on System I
The ac impedance technique can be used to obtain the specific dc conductivity
of the electrolytes. Figure 4.9(a) shows the variations of ac conductivity with frequency
for samples with different OA contents. Figure 4.9(b) shows the variations of ac
conductivity with frequency for the OA40 sample at different temperatures. The ac
conductivity at different frequencies was calculated using equation:
At
ZZZ
ir
rac )( 22
where Zr is the real part of the impedance, Zi is the imaginary part of the impedance, t is
the thickness of the sample (cm) and A is the cross-sectional area of the membranes
(cm2). In both figures, the graphs consist of frequency dependent regions and frequency
independent regions that are important characteristics for ion conducting membranes
(Cheruku et al., 2012).
It can be observed that the edge of the plateaus (the frequency independent
regions) in Fig. 4.9(a) is shifted to higher frequencies as oxalic acid content is increased.
The conductivity value obtained from extrapolating the plateau region is not much
(4.9)
Univers
ity of
Mala
ya
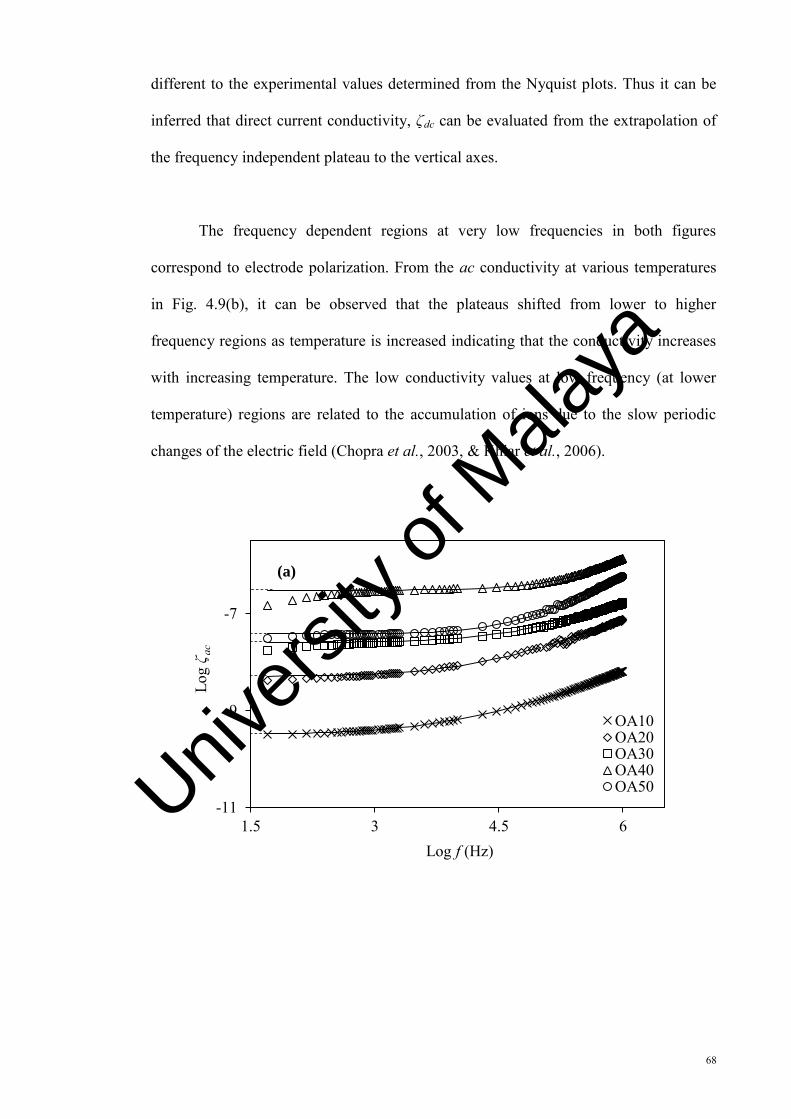
68
different to the experimental values determined from the Nyquist plots. Thus it can be
inferred that direct current conductivity, ζdc can be evaluated from the extrapolation of
the frequency independent plateau to the vertical axes.
The frequency dependent regions at very low frequencies in both figures
correspond to electrode polarization. From the ac conductivity at various temperatures
in Fig. 4.9(b), it can be observed that the plateaus shifted from lower to higher
frequency regions as temperature is increased indicating that the conductivity increases
with increasing temperature. The low conductivity values at low frequency (at lower
temperature) regions are related to the accumulation of ions due to the slow periodic
changes of the electric field (Chopra et al., 2003, & Khiar et al., 2006).
-11
-9
-7
1.5 3 4.5 6
Log
ζ ac
Log f (Hz)
OA10OA20OA30OA40OA50
(a)
Univers
ity of
Mala
ya
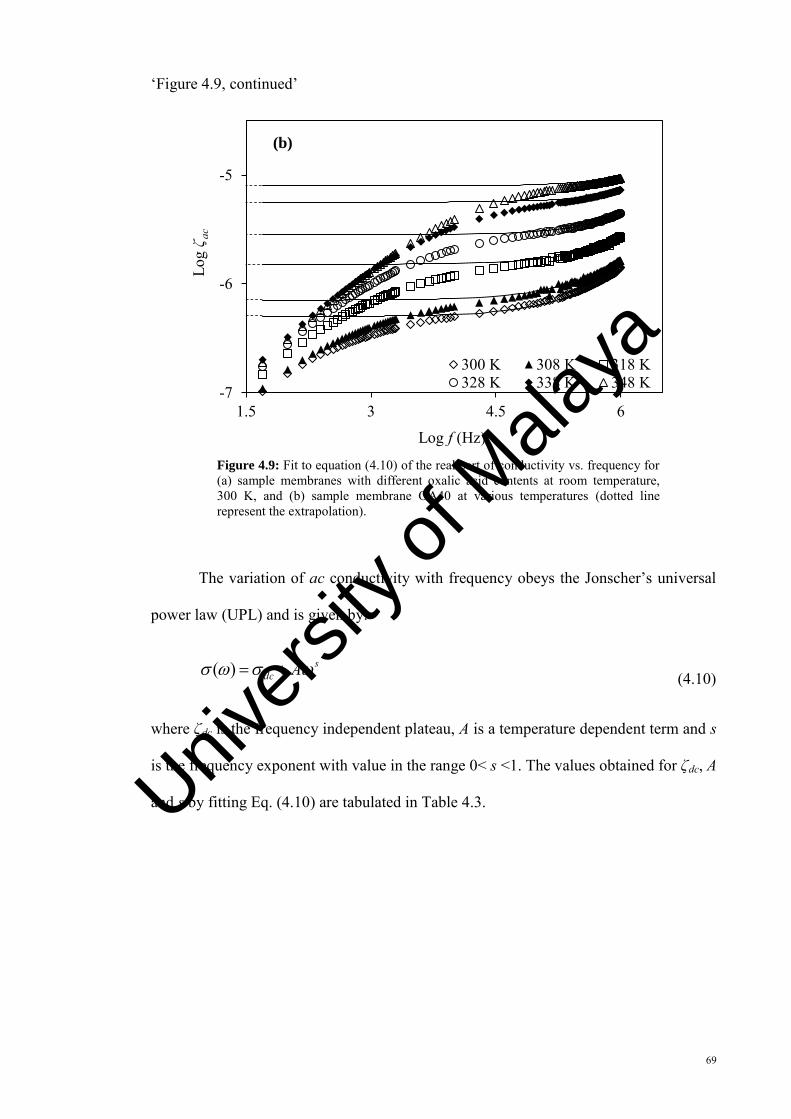
69
‘Figure 4.9, continued’
Figure 4.9: Fit to equation (4.10) of the real part of conductivity vs. frequency for (a) sample membranes with different oxalic acid contents at room temperature, 300 K, and (b) sample membrane OA40 at various temperatures (dotted line represent the extrapolation).
The variation of ac conductivity with frequency obeys the Jonscher’s universal
power law (UPL) and is given by:
sdc A )( (4.10)
where ζdc is the frequency independent plateau, A is a temperature dependent term and s
is the frequency exponent with value in the range 0< s <1. The values obtained for ζdc, A
and s by fitting Eq. (4.10) are tabulated in Table 4.3.
-7
-6
-5
1.5 3 4.5 6
Log
ζ ac
Log f (Hz)
300 K 308 K 318 K328 K 338 K 348 K
(b)
Univers
ity of
Mala
ya
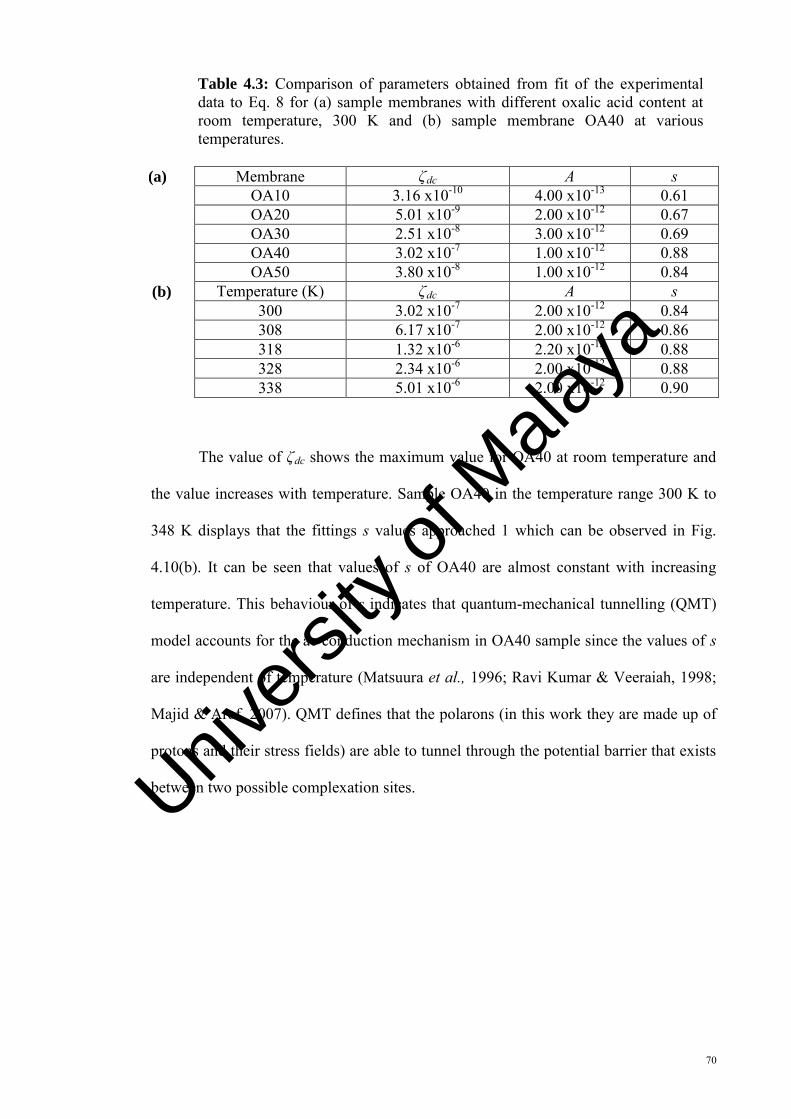
70
Table 4.3: Comparison of parameters obtained from fit of the experimental data to Eq. 8 for (a) sample membranes with different oxalic acid content at room temperature, 300 K and (b) sample membrane OA40 at various temperatures.
(a) Membrane ζdc A s OA10 3.16 x10⁻¹⁰ 4.00 x10⁻¹³ 0.61 OA20 5.01 x10⁻⁹ 2.00 x10⁻¹² 0.67 OA30 2.51 x10⁻⁸ 3.00 x10⁻¹² 0.69 OA40 3.02 x10⁻⁷ 1.00 x10⁻¹² 0.88 OA50 3.80 x10⁻⁸ 1.00 x10⁻¹² 0.84
(b) Temperature (K) ζdc A s 300 3.02 x10⁻⁷ 2.00 x10⁻¹² 0.84 308 6.17 x10⁻⁷ 2.00 x10⁻¹² 0.86 318 1.32 x10⁻⁶ 2.20 x10⁻¹² 0.88 328 2.34 x10⁻⁶ 2.00 x10⁻¹² 0.88 338 5.01 x10⁻⁶ 2.00 x10⁻¹² 0.90
The value of ζdc shows the maximum value for OA40 at room temperature and
the value increases with temperature. Sample OA40 in the temperature range 300 K to
348 K displays that the fittings s values approached 1 which can be observed in Fig.
4.10(b). It can be seen that values of s of OA40 are almost constant with increasing
temperature. This behaviour of s indicates that quantum-mechanical tunnelling (QMT)
model accounts for the ac conduction mechanism in OA40 sample since the values of s
are independent of temperature (Matsuura et al., 1996; Ravi Kumar & Veeraiah, 1998;
Majid & Arof, 2007). QMT defines that the polarons (in this work they are made up of
protons and their stress fields) are able to tunnel through the potential barrier that exists
between two possible complexation sites.
Univers
ity of
Mala
ya
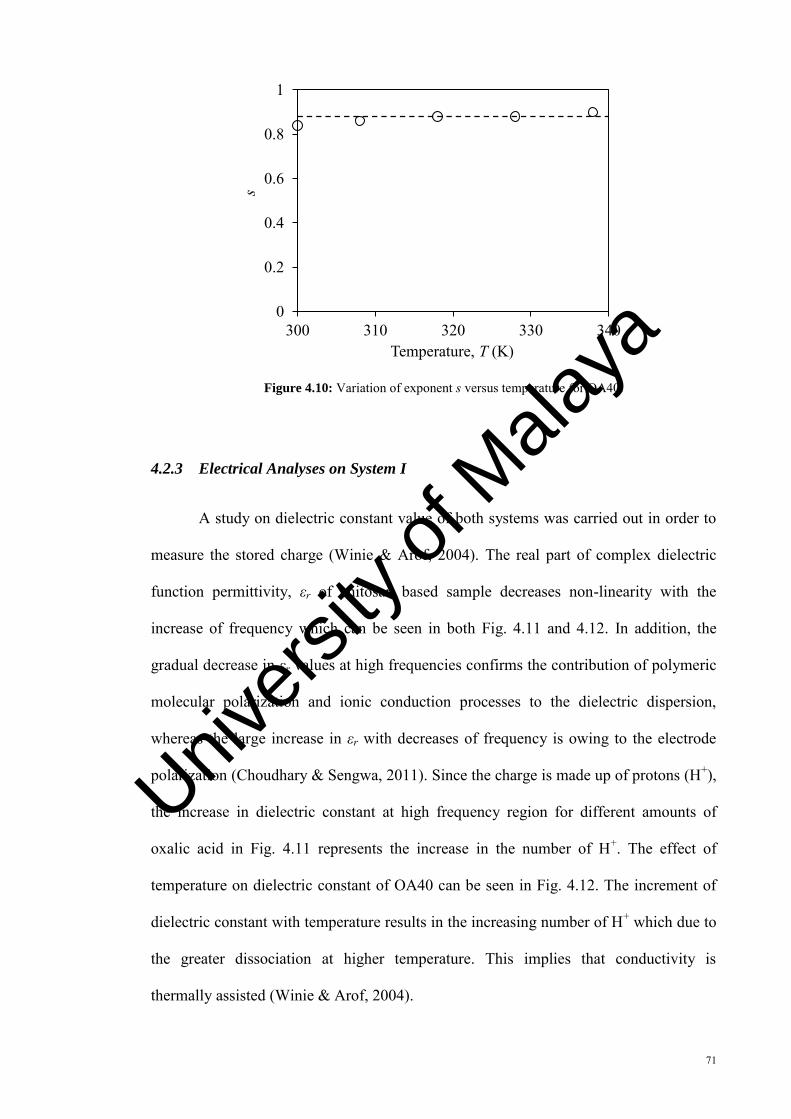
71
Figure 4.10: Variation of exponent s versus temperature for OA40.
4.2.3 Electrical Analyses on System I
A study on dielectric constant value of both systems was carried out in order to
measure the stored charge (Winie & Arof, 2004). The real part of complex dielectric
function permittivity, εr of chitosan based sample decreases non-linearity with the
increase of frequency which can be seen in both Fig. 4.11 and 4.12. In addition, the
gradual decrease in εr values at high frequencies confirms the contribution of polymeric
molecular polarization and ionic conduction processes to the dielectric dispersion,
whereas the large increase in εr with decreases of frequency is owing to the electrode
polarization (Choudhary & Sengwa, 2011). Since the charge is made up of protons (H+),
the increase in dielectric constant at high frequency region for different amounts of
oxalic acid in Fig. 4.11 represents the increase in the number of H+. The effect of
temperature on dielectric constant of OA40 can be seen in Fig. 4.12. The increment of
dielectric constant with temperature results in the increasing number of H+ which due to
the greater dissociation at higher temperature. This implies that conductivity is
thermally assisted (Winie & Arof, 2004).
0
0.2
0.4
0.6
0.8
1
300 310 320 330 340
s
Temperature, T (K)
Univers
ity of
Mala
ya
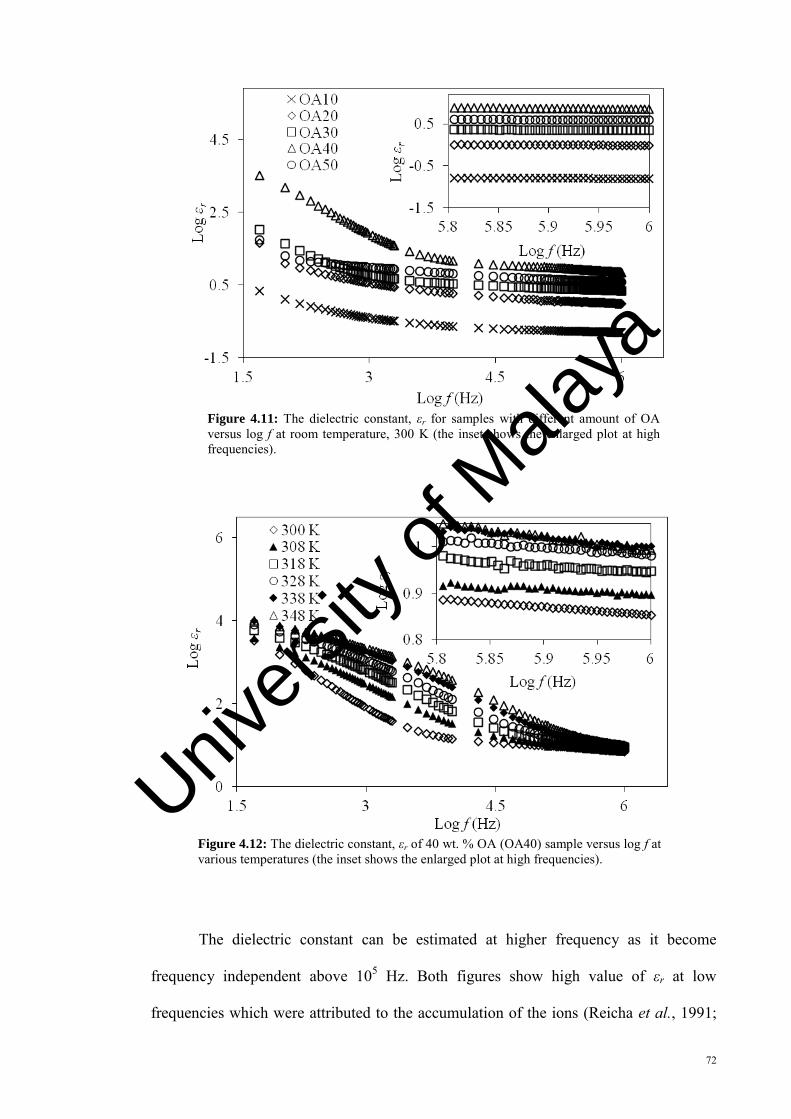
72
Figure 4.11: The dielectric constant, εr for samples with different amount of OA versus log f at room temperature, 300 K (the inset shows the enlarged plot at high frequencies).
Figure 4.12: The dielectric constant, εr of 40 wt. % OA (OA40) sample versus log f at various temperatures (the inset shows the enlarged plot at high frequencies).
The dielectric constant can be estimated at higher frequency as it become
frequency independent above 105 Hz. Both figures show high value of εr at low
frequencies which were attributed to the accumulation of the ions (Reicha et al., 1991;
Univers
ity of
Mala
ya
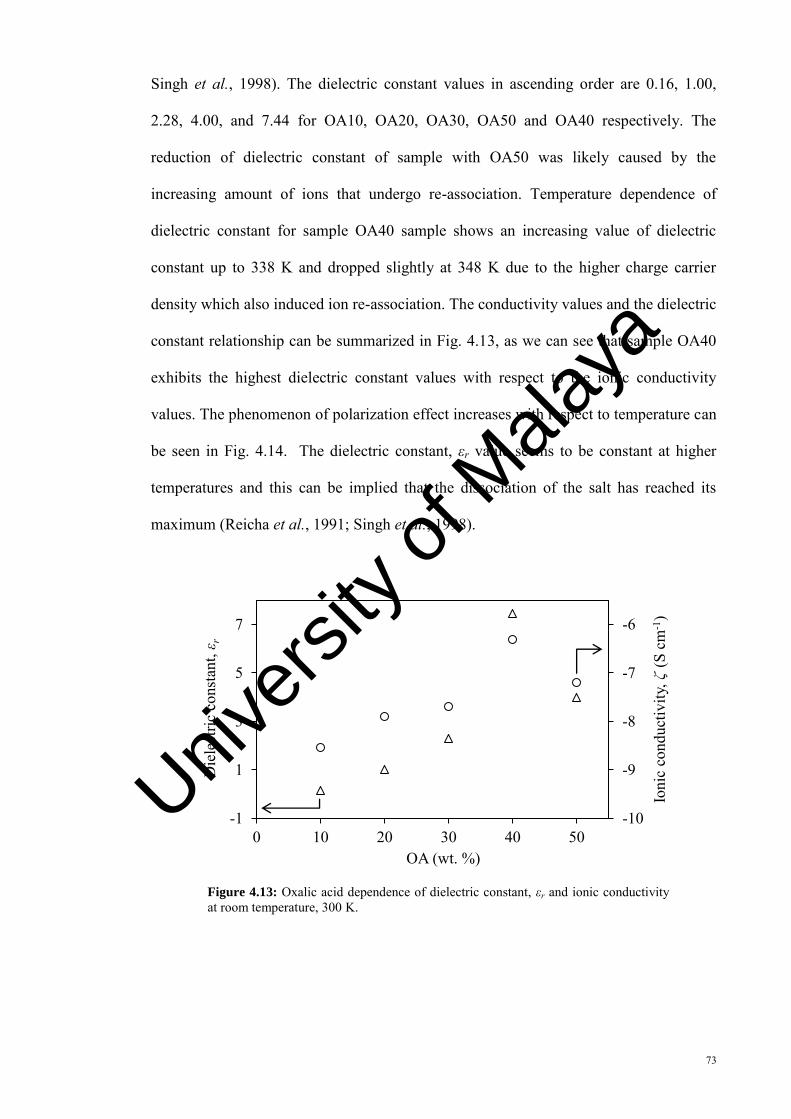
73
Singh et al., 1998). The dielectric constant values in ascending order are 0.16, 1.00,
2.28, 4.00, and 7.44 for OA10, OA20, OA30, OA50 and OA40 respectively. The
reduction of dielectric constant of sample with OA50 was likely caused by the
increasing amount of ions that undergo re-association. Temperature dependence of
dielectric constant for sample OA40 sample shows an increasing value of dielectric
constant up to 338 K and dropped slightly at 348 K due to the higher charge carrier
density which also induced ion re-association. The conductivity values and the dielectric
constant relationship can be summarized in Fig. 4.13, as we can see that sample OA40
exhibits the highest dielectric constant values with respect to the ionic conductivity
values. The phenomenon of polarization effect increases with respect to temperature can
be seen in Fig. 4.14. The dielectric constant, εr value seems to be constant at higher
temperatures and this can be implied that the dissociation of the salt has reached its
maximum (Reicha et al., 1991; Singh et al., 1998).
Figure 4.13: Oxalic acid dependence of dielectric constant, εr and ionic conductivity at room temperature, 300 K.
-10
-9
-8
-7
-6
-1
1
3
5
7
0 10 20 30 40 50
Ioni
c co
nduc
tivity
, ζ (S
cm
-1)
Die
lect
ric c
onst
ant,
ε r
OA (wt. %)
Univers
ity of
Mala
ya
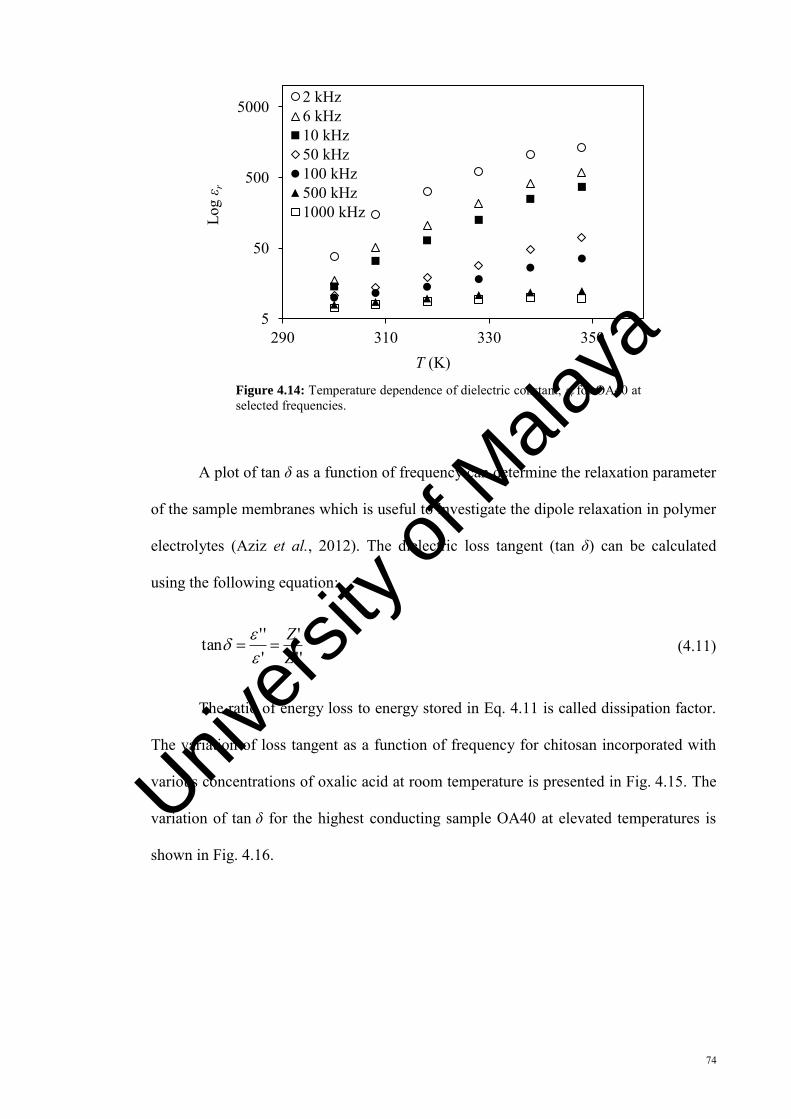
74
Figure 4.14: Temperature dependence of dielectric constant, εr for OA40 at selected frequencies.
A plot of tan δ as a function of frequency can determine the relaxation parameter
of the sample membranes which is useful to investigate the dipole relaxation in polymer
electrolytes (Aziz et al., 2012). The dielectric loss tangent (tan δ) can be calculated
using the following equation:
'''
'''tan
ZZ
(4.11)
The ratio of energy loss to energy stored in Eq. 4.11 is called dissipation factor.
The variation of loss tangent as a function of frequency for chitosan incorporated with
various concentrations of oxalic acid at room temperature is presented in Fig. 4.15. The
variation of tan δ for the highest conducting sample OA40 at elevated temperatures is
shown in Fig. 4.16.
5
50
500
5000
290 310 330 350
Log
ε r
T (K)
2 kHz6 kHz10 kHz50 kHz100 kHz500 kHz1000 kHz
Univers
ity of
Mala
ya
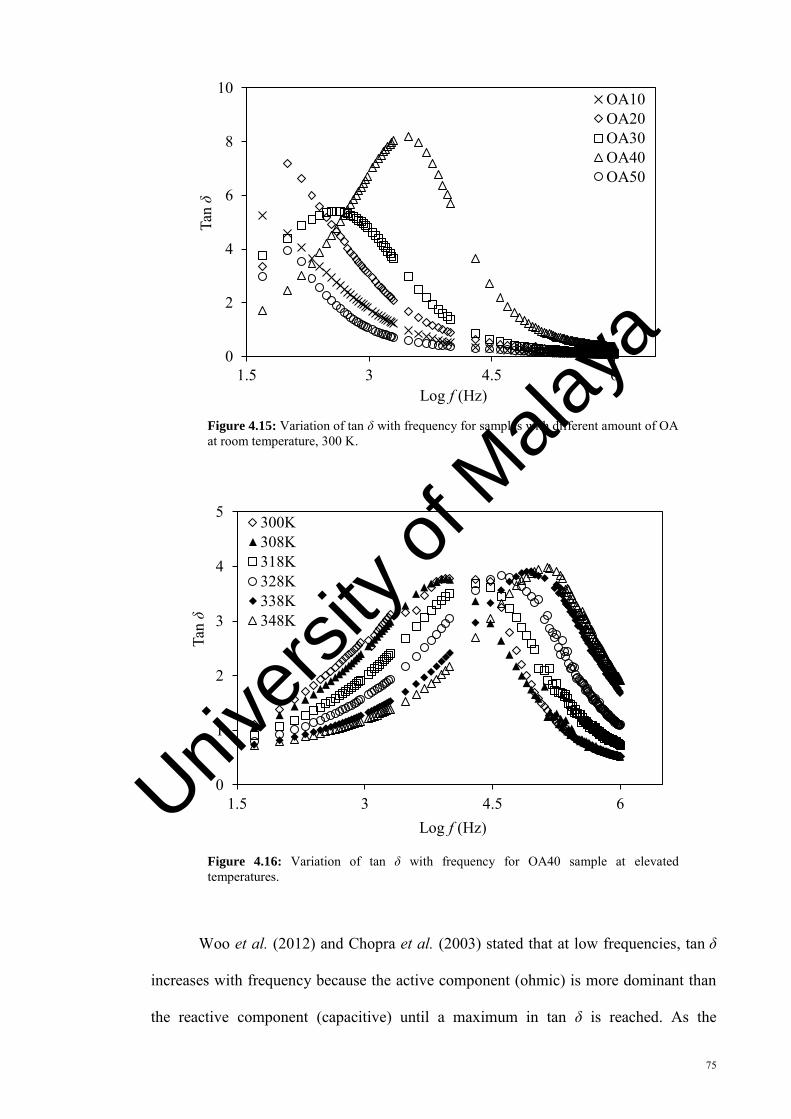
75
Figure 4.15: Variation of tan δ with frequency for samples with different amount of OA at room temperature, 300 K.
Figure 4.16: Variation of tan δ with frequency for OA40 sample at elevated temperatures.
Woo et al. (2012) and Chopra et al. (2003) stated that at low frequencies, tan δ
increases with frequency because the active component (ohmic) is more dominant than
the reactive component (capacitive) until a maximum in tan δ is reached. As the
0
2
4
6
8
10
1.5 3 4.5 6
Tan
δ
Log f (Hz)
OA10OA20OA30OA40OA50
0
1
2
3
4
5
1.5 3 4.5 6
Tan
δ
Log f (Hz)
300K308K318K328K338K348K
Univers
ity of
Mala
ya
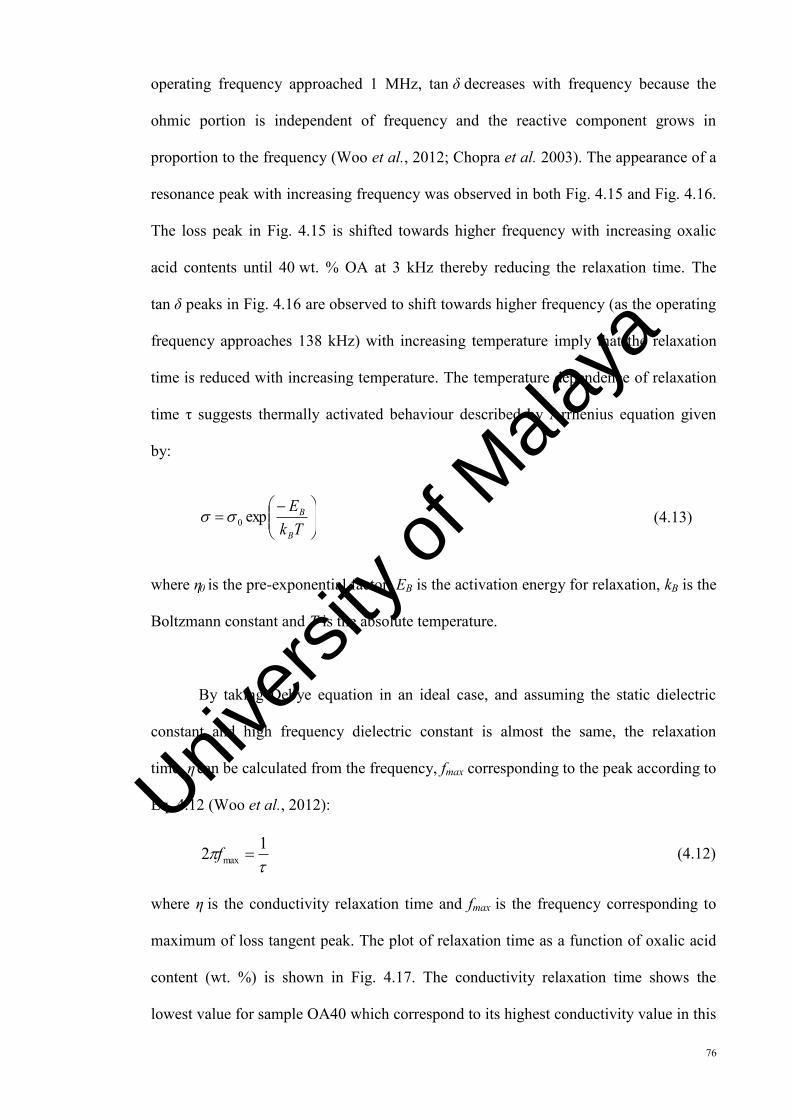
76
operating frequency approached 1 MHz, tan δ decreases with frequency because the
ohmic portion is independent of frequency and the reactive component grows in
proportion to the frequency (Woo et al., 2012; Chopra et al. 2003). The appearance of a
resonance peak with increasing frequency was observed in both Fig. 4.15 and Fig. 4.16.
The loss peak in Fig. 4.15 is shifted towards higher frequency with increasing oxalic
acid contents until 40 wt. % OA at 3 kHz thereby reducing the relaxation time. The
tan δ peaks in Fig. 4.16 are observed to shift towards higher frequency (as the operating
frequency approaches 138 kHz) with increasing temperature imply that the relaxation
time is reduced with increasing temperature. The temperature dependence of relaxation
time τ suggests thermally activated behaviour described by Arrhenius equation given
by:
TkE
B
Bexp0 (4.13)
where η0 is the pre-exponential factor, EB is the activation energy for relaxation, kB is the
Boltzmann constant and T is the absolute temperature.
By taking Debye equation in an ideal case, and assuming the static dielectric
constant and high frequency dielectric constant is almost the same, the relaxation
time, η can be calculated from the frequency, fmax corresponding to the peak according to
Eq. 4.12 (Woo et al., 2012):
12 max f
where η is the conductivity relaxation time and fmax is the frequency corresponding to
maximum of loss tangent peak. The plot of relaxation time as a function of oxalic acid
content (wt. %) is shown in Fig. 4.17. The conductivity relaxation time shows the
lowest value for sample OA40 which correspond to its highest conductivity value in this
(4.12)
Univers
ity of
Mala
ya
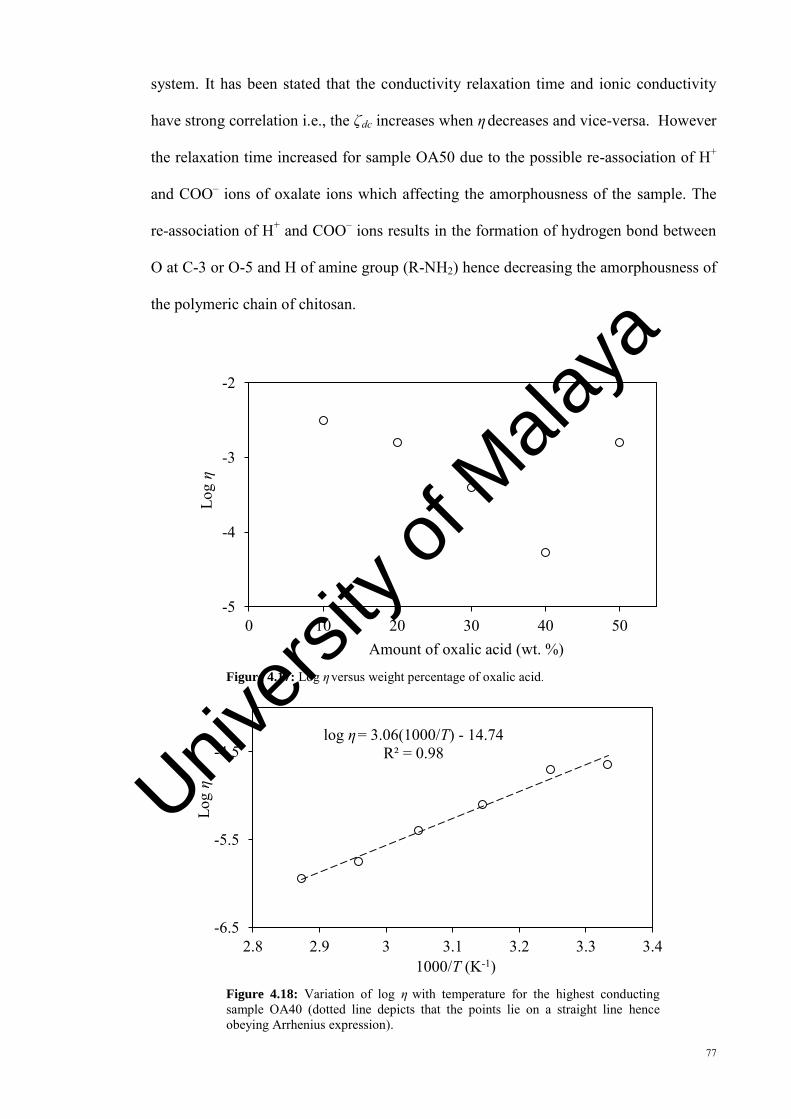
77
system. It has been stated that the conductivity relaxation time and ionic conductivity
have strong correlation i.e., the ζdc increases when η decreases and vice-versa. However
the relaxation time increased for sample OA50 due to the possible re-association of H+
and COO‒ ions of oxalate ions which affecting the amorphousness of the sample. The
re-association of H+ and COO‒ ions results in the formation of hydrogen bond between
O at C-3 or O-5 and H of amine group (R-NH2) hence decreasing the amorphousness of
the polymeric chain of chitosan.
Figure 4.17: Log η versus weight percentage of oxalic acid.
Figure 4.18: Variation of log η with temperature for the highest conducting sample OA40 (dotted line depicts that the points lie on a straight line hence obeying Arrhenius expression).
-5
-4
-3
-2
0 10 20 30 40 50
Log
η
Amount of oxalic acid (wt. %)
log η = 3.06(1000/T) - 14.74 R² = 0.98
-6.5
-5.5
-4.5
2.8 2.9 3 3.1 3.2 3.3 3.4
Log
η
1000/T (K-1)
Univers
ity of
Mala
ya
78
In order to determine the activation energy of OA40 sample, a plot of log η
versus 1000/T was plotted and displayed in Fig. 4.18. The linear relationship suggests
that the variation in conductivity with temperature obeys the Arrhenius equation. The
activation energy for relaxation EB calculated from the fitting of data points is 0.61 eV
for sample with 40 wt. % OA (OA40).
4.3 Conductivity Studies on Chitosan–Oxalic acid–Glycerol system (System II)
The room temperature ionic conductivity of the freshly prepared samples is
obtained by the same technique as mentioned in the Section 4.2 with stainless steel as
the blocking electrodes. Plasticization is an ionic conductivity enhancement alternative
route with the addition of a suitable chemical compound to the electrolyte.
Conductivity enhancement by 1 to 2 orders of magnitude has been investigated
by adding 50 wt. % propylene carbonate, 50 wt. % tetraglyme and 50 wt. % dimethyl
formamide into poly(ethylene oxide) samples (MacFarlane et al., 1995; Forsyth et al.,
1995). Missan and co-workers (2006) reported the addition of dimethylacetamide as
plasticizer to the poly(vinylidene fluoride-co-hexafluoro propylene) based electrolyte
has given rise to three orders of magnitude in conductivity. Pawlicka and co-workers
reported the conductivity increments by four orders of magnitude in samples of chitosan
doped with hydrochloric acid which were plasticized with ethylene glycol and glycerol
(Pawlicka et al., 2008). The conductivity of both samples increased from 9.2 x10⁻⁸ S
cm-1 to 9.5 x10⁻⁴ S cm-1 and 2.4 x10⁻⁴ S cm-1 with the addition of 59 wt. % glycerol and
68 wt. % ethylene glycol respectively.
Univers
ity of
Mala
ya
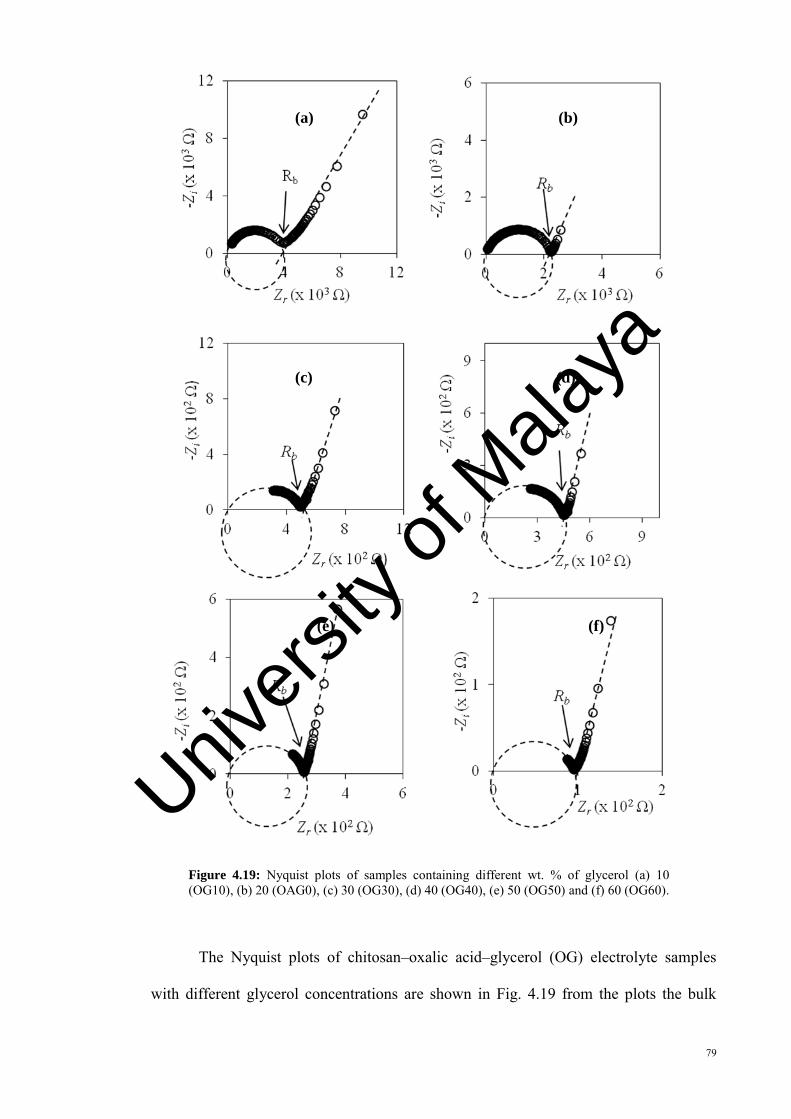
79
Figure 4.19: Nyquist plots of samples containing different wt. % of glycerol (a) 10 (OG10), (b) 20 (OAG0), (c) 30 (OG30), (d) 40 (OG40), (e) 50 (OG50) and (f) 60 (OG60).
The Nyquist plots of chitosan–oxalic acid–glycerol (OG) electrolyte samples
with different glycerol concentrations are shown in Fig. 4.19 from the plots the bulk
(e) (f)
(a) (b)
(c) (d)
Univers
ity of
Mala
ya
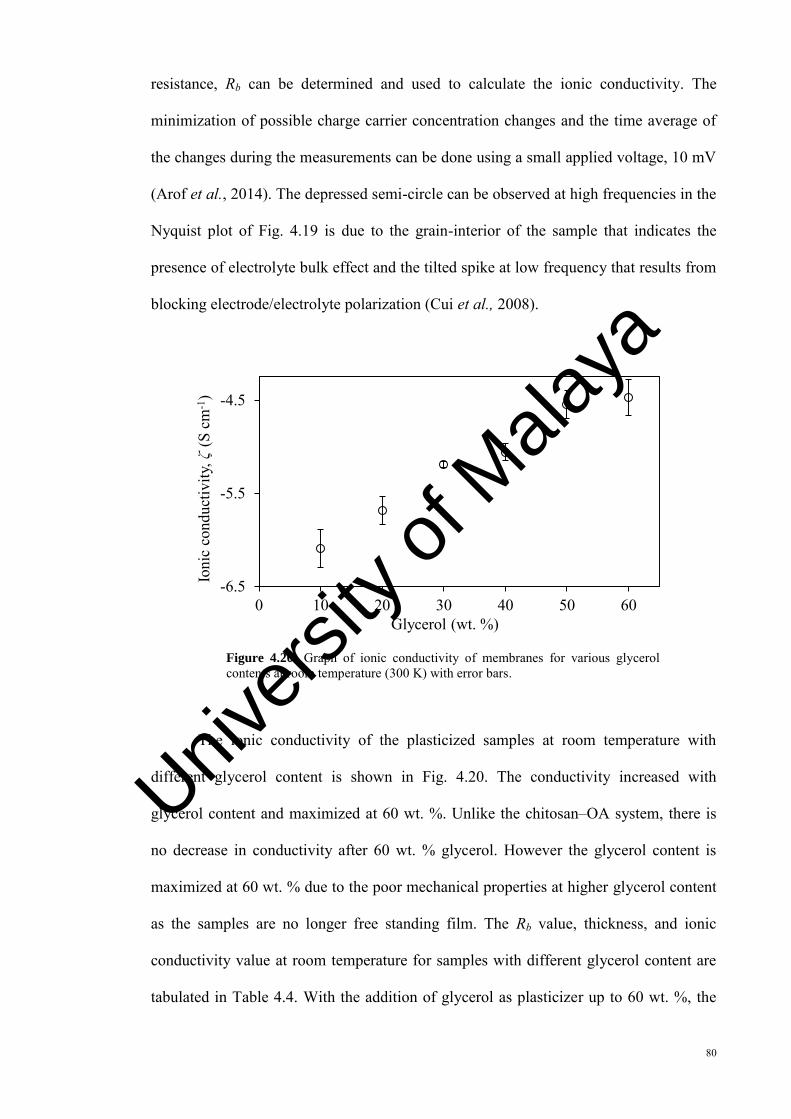
80
resistance, Rb can be determined and used to calculate the ionic conductivity. The
minimization of possible charge carrier concentration changes and the time average of
the changes during the measurements can be done using a small applied voltage, 10 mV
(Arof et al., 2014). The depressed semi-circle can be observed at high frequencies in the
Nyquist plot of Fig. 4.19 is due to the grain-interior of the sample that indicates the
presence of electrolyte bulk effect and the tilted spike at low frequency that results from
blocking electrode/electrolyte polarization (Cui et al., 2008).
Figure 4.20: Graph of ionic conductivity of membranes for various glycerol contents at room temperature (300 K) with error bars.
The ionic conductivity of the plasticized samples at room temperature with
different glycerol content is shown in Fig. 4.20. The conductivity increased with
glycerol content and maximized at 60 wt. %. Unlike the chitosan‒OA system, there is
no decrease in conductivity after 60 wt. % glycerol. However the glycerol content is
maximized at 60 wt. % due to the poor mechanical properties at higher glycerol content
as the samples are no longer free standing film. The Rb value, thickness, and ionic
conductivity value at room temperature for samples with different glycerol content are
tabulated in Table 4.4. With the addition of glycerol as plasticizer up to 60 wt. %, the
-6.5
-5.5
-4.5
0 10 20 30 40 50 60
Ioni
c co
nduc
tivity
, ζ (S
cm
-1)
Glycerol (wt. %)
Univers
ity of
Mala
ya
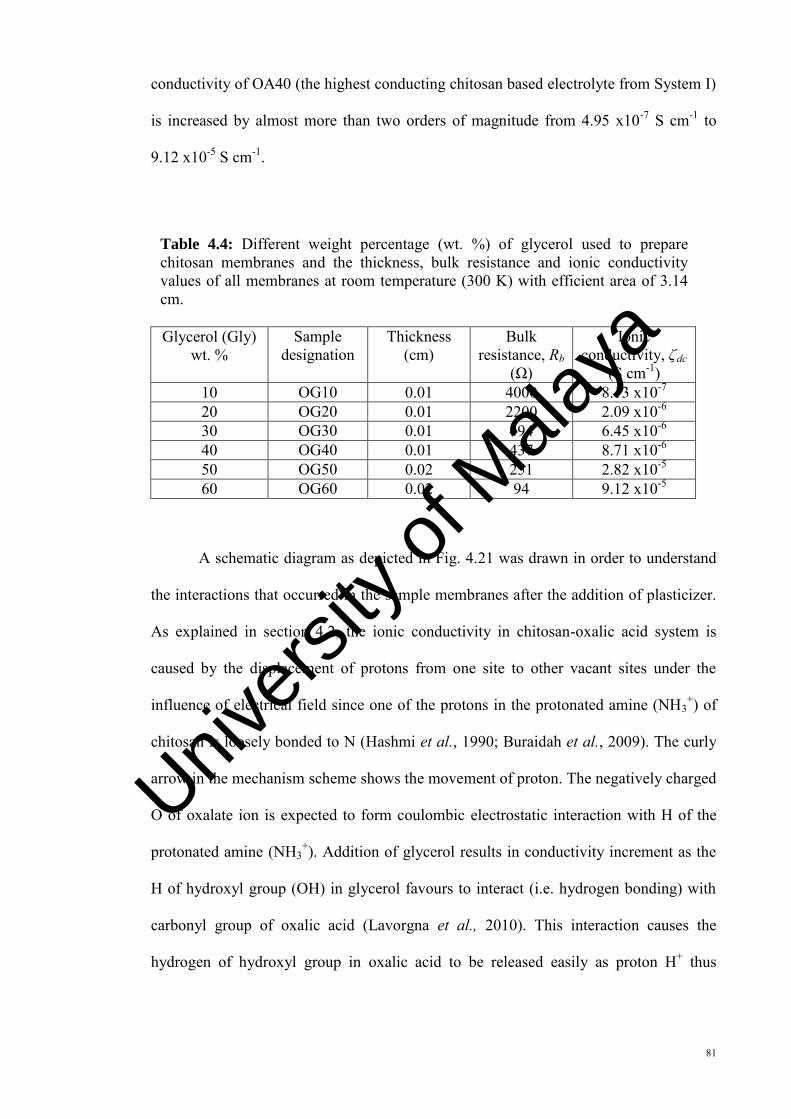
81
conductivity of OA40 (the highest conducting chitosan based electrolyte from System I)
is increased by almost more than two orders of magnitude from 4.95 x10⁻⁷ S cm-1 to
9.12 x10⁻⁵ S cm-1.
Table 4.4: Different weight percentage (wt. %) of glycerol used to prepare chitosan membranes and the thickness, bulk resistance and ionic conductivity values of all membranes at room temperature (300 K) with efficient area of 3.14 cm.
Glycerol (Gly)
wt. % Sample
designation Thickness
(cm) Bulk
resistance, Rb (Ω)
Ionic conductivity, ζdc
(S cm-1) 10 OG10 0.01 4000 8.13 x10⁻⁷ 20 OG20 0.01 2200 2.09 x10⁻⁶ 30 OG30 0.01 494 6.45 x10⁻⁶ 40 OG40 0.01 437 8.71 x10⁻⁶ 50 OG50 0.02 251 2.82 x10⁻⁵ 60 OG60 0.02 94 9.12 x10⁻⁵
A schematic diagram as depicted in Fig. 4.21 was drawn in order to understand
the interactions that occurred in the sample membranes after the addition of plasticizer.
As explained in section 4.2, the ionic conductivity in chitosan-oxalic acid system is
caused by the displacement of protons from one site to other vacant sites under the
influence of electrical field since one of the protons in the protonated amine (NH3+) of
chitosan is loosely bonded to N (Hashmi et al., 1990; Buraidah et al., 2009). The curly
arrow in the mechanism scheme shows the movement of proton. The negatively charged
O of oxalate ion is expected to form coulombic electrostatic interaction with H of the
protonated amine (NH3+). Addition of glycerol results in conductivity increment as the
H of hydroxyl group (OH) in glycerol favours to interact (i.e. hydrogen bonding) with
carbonyl group of oxalic acid (Lavorgna et al., 2010). This interaction causes the
hydrogen of hydroxyl group in oxalic acid to be released easily as proton H+ thus
Univers
ity of
Mala
ya
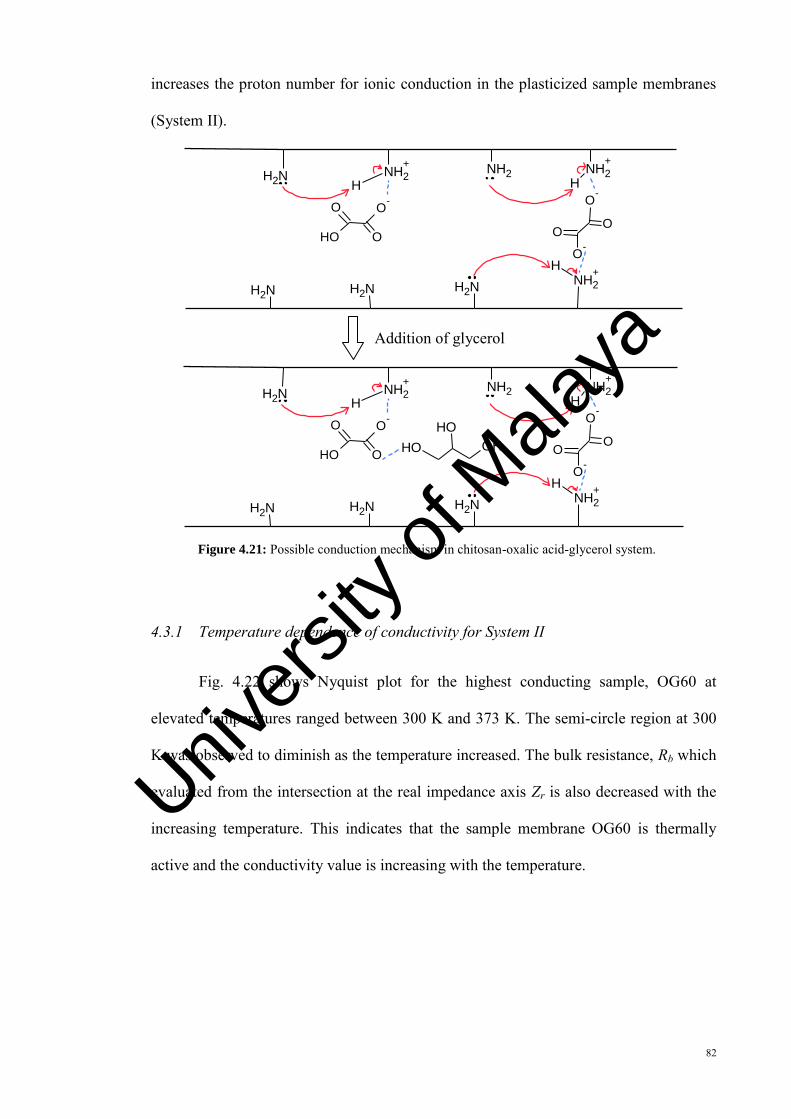
82
increases the proton number for ionic conduction in the plasticized sample membranes
(System II).
NH2NH2
+ NH2 NH2+
HH
NH2+
NH2NH2NH2
H
O-
O
O
OH
O-
OO
O-
Addition of glycerol
NH2NH2
+ NH2 NH2+
HH
NH2+
NH2NH2NH2
H
O-
O
O
OH
O-
OO
O-OH OH
OH
Figure 4.21: Possible conduction mechanism in chitosan-oxalic acid-glycerol system.
4.3.1 Temperature dependence of conductivity for System II
Fig. 4.22 shows Nyquist plot for the highest conducting sample, OG60 at
elevated temperatures ranged between 300 K and 373 K. The semi-circle region at 300
K was observed to diminish as the temperature increased. The bulk resistance, Rb which
evaluated from the intersection at the real impedance axis Zr is also decreased with the
increasing temperature. This indicates that the sample membrane OG60 is thermally
active and the conductivity value is increasing with the temperature.
Univers
ity of
Mala
ya
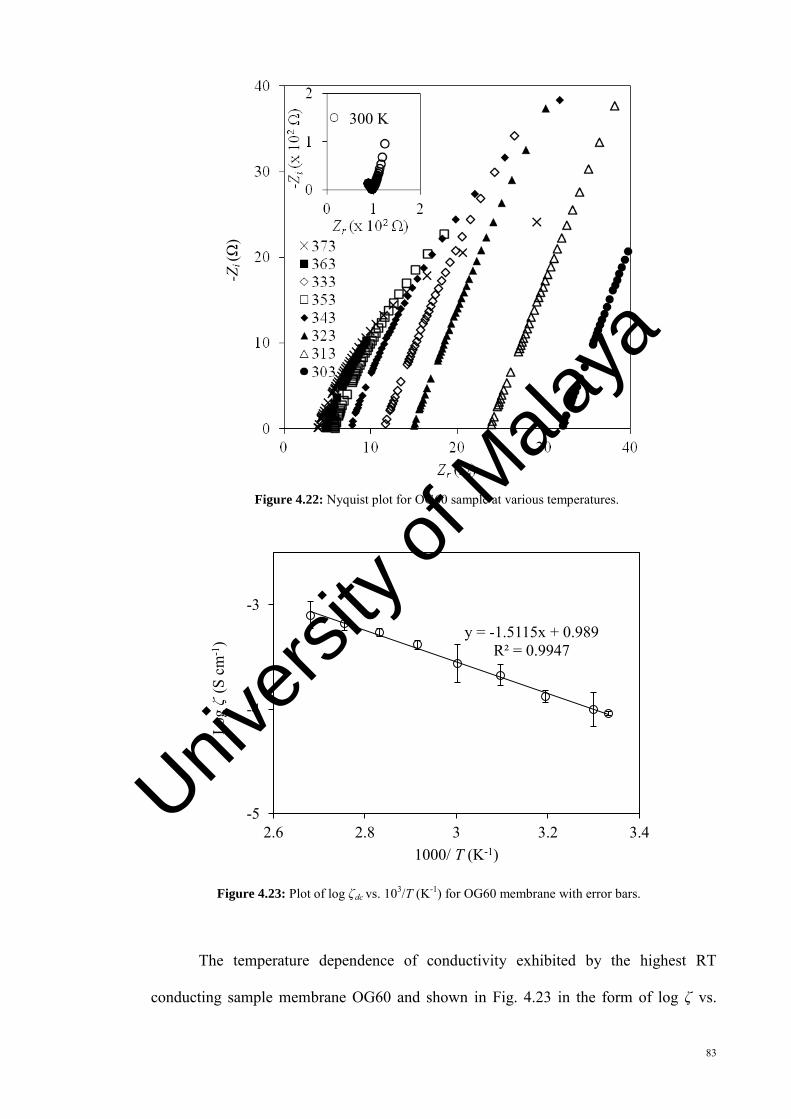
83
Figure 4.22: Nyquist plot for OG60 sample at various temperatures.
Figure 4.23: Plot of log ζdc vs. 103/T (K-1) for OG60 membrane with error bars.
The temperature dependence of conductivity exhibited by the highest RT
conducting sample membrane OG60 and shown in Fig. 4.23 in the form of log ζ vs.
y = -1.5115x + 0.989 R² = 0.9947
-5
-4
-3
2.6 2.8 3 3.2 3.4
Log
ζ (S
cm
-1)
1000/ T (K-1)
300 K
-Zi (
Ω)
Univers
ity of
Mala
ya
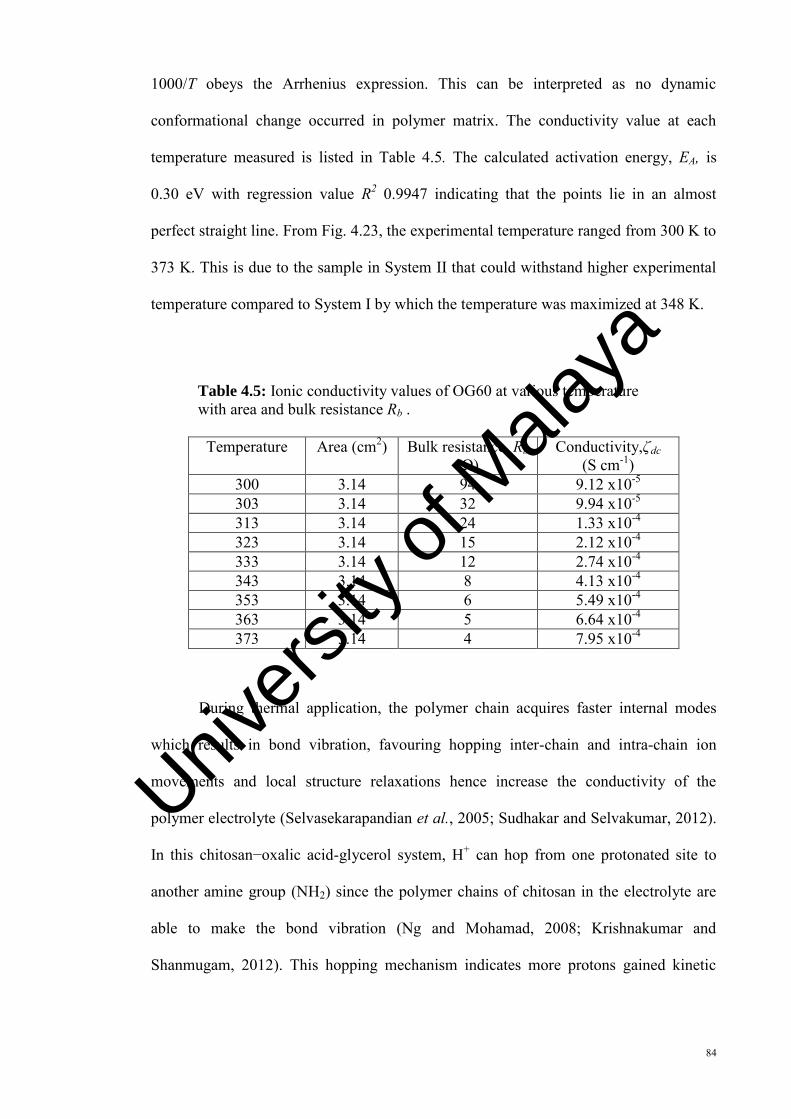
84
1000/T obeys the Arrhenius expression. This can be interpreted as no dynamic
conformational change occurred in polymer matrix. The conductivity value at each
temperature measured is listed in Table 4.5. The calculated activation energy, EA, is
0.30 eV with regression value R2 0.9947 indicating that the points lie in an almost
perfect straight line. From Fig. 4.23, the experimental temperature ranged from 300 K to
373 K. This is due to the sample in System II that could withstand higher experimental
temperature compared to System I by which the temperature was maximized at 348 K.
Table 4.5: Ionic conductivity values of OG60 at various temperature with area and bulk resistance Rb .
Temperature Area (cm2) Bulk resistance, Rb
(Ω) Conductivity,ζdc
(S cm-1) 300 3.14 94 9.12 x10⁻⁵ 303 3.14 32 9.94 x10⁻⁵ 313 3.14 24 1.33 x10⁻⁴ 323 3.14 15 2.12 x10⁻⁴ 333 3.14 12 2.74 x10⁻⁴ 343 3.14 8 4.13 x10⁻⁴ 353 3.14 6 5.49 x10⁻⁴ 363 3.14 5 6.64 x10⁻⁴ 373 3.14 4 7.95 x10⁻⁴
During thermal application, the polymer chain acquires faster internal modes
which results in bond vibration, favouring hopping inter-chain and intra-chain ion
movements and local structure relaxations hence increase the conductivity of the
polymer electrolyte (Selvasekarapandian et al., 2005; Sudhakar and Selvakumar, 2012).
In this chitosan−oxalic acid-glycerol system, H+ can hop from one protonated site to
another amine group (NH2) since the polymer chains of chitosan in the electrolyte are
able to make the bond vibration (Ng and Mohamad, 2008; Krishnakumar and
Shanmugam, 2012). This hopping mechanism indicates more protons gained kinetic
Univers
ity of
Mala
ya
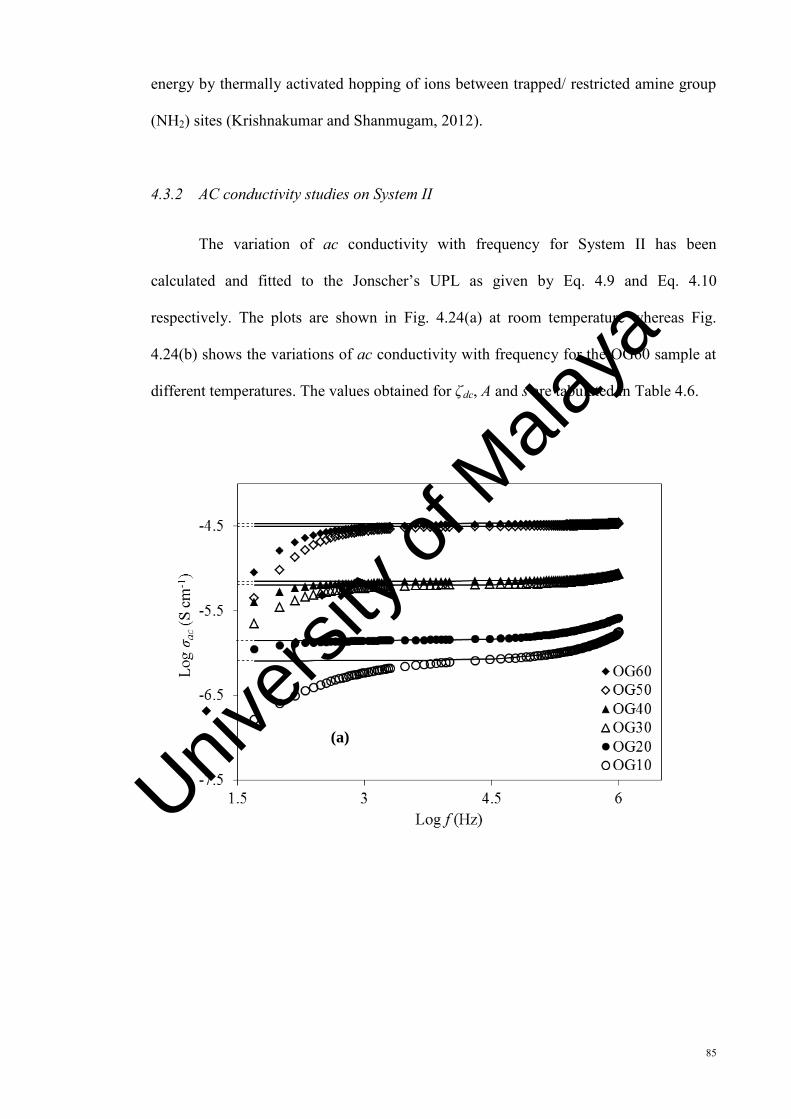
85
energy by thermally activated hopping of ions between trapped/ restricted amine group
(NH2) sites (Krishnakumar and Shanmugam, 2012).
4.3.2 AC conductivity studies on System II
The variation of ac conductivity with frequency for System II has been
calculated and fitted to the Jonscher’s UPL as given by Eq. 4.9 and Eq. 4.10
respectively. The plots are shown in Fig. 4.24(a) at room temperature whereas Fig.
4.24(b) shows the variations of ac conductivity with frequency for the OG60 sample at
different temperatures. The values obtained for ζdc, A and s are tabulated in Table 4.6.
(a)
Univers
ity of
Mala
ya
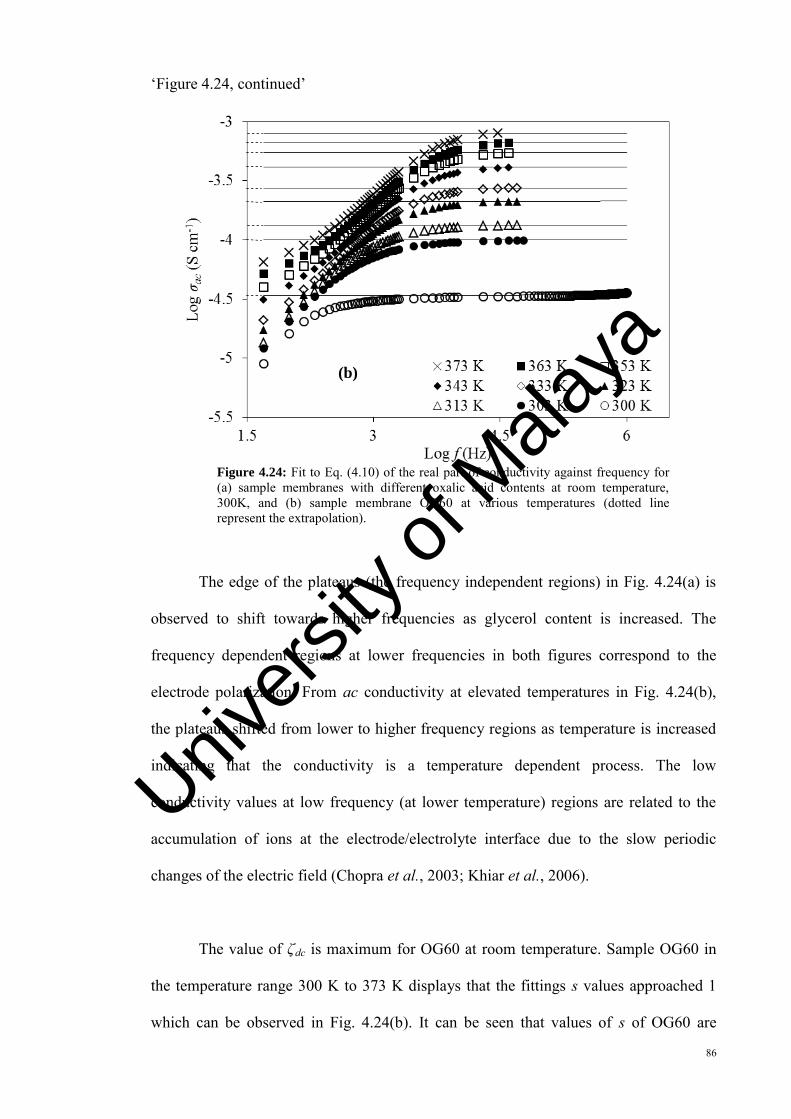
86
‘Figure 4.24, continued’
Figure 4.24: Fit to Eq. (4.10) of the real part of conductivity against frequency for (a) sample membranes with different oxalic acid contents at room temperature, 300K, and (b) sample membrane OG60 at various temperatures (dotted line represent the extrapolation).
The edge of the plateaus (the frequency independent regions) in Fig. 4.24(a) is
observed to shift towards higher frequencies as glycerol content is increased. The
frequency dependent regions at lower frequencies in both figures correspond to the
electrode polarization. From ac conductivity at elevated temperatures in Fig. 4.24(b),
the plateaus shifted from lower to higher frequency regions as temperature is increased
indicating that the conductivity is a temperature dependent process. The low
conductivity values at low frequency (at lower temperature) regions are related to the
accumulation of ions at the electrode/electrolyte interface due to the slow periodic
changes of the electric field (Chopra et al., 2003; Khiar et al., 2006).
The value of ζdc is maximum for OG60 at room temperature. Sample OG60 in
the temperature range 300 K to 373 K displays that the fittings s values approached 1
which can be observed in Fig. 4.24(b). It can be seen that values of s of OG60 are
(b)
Univers
ity of
Mala
ya
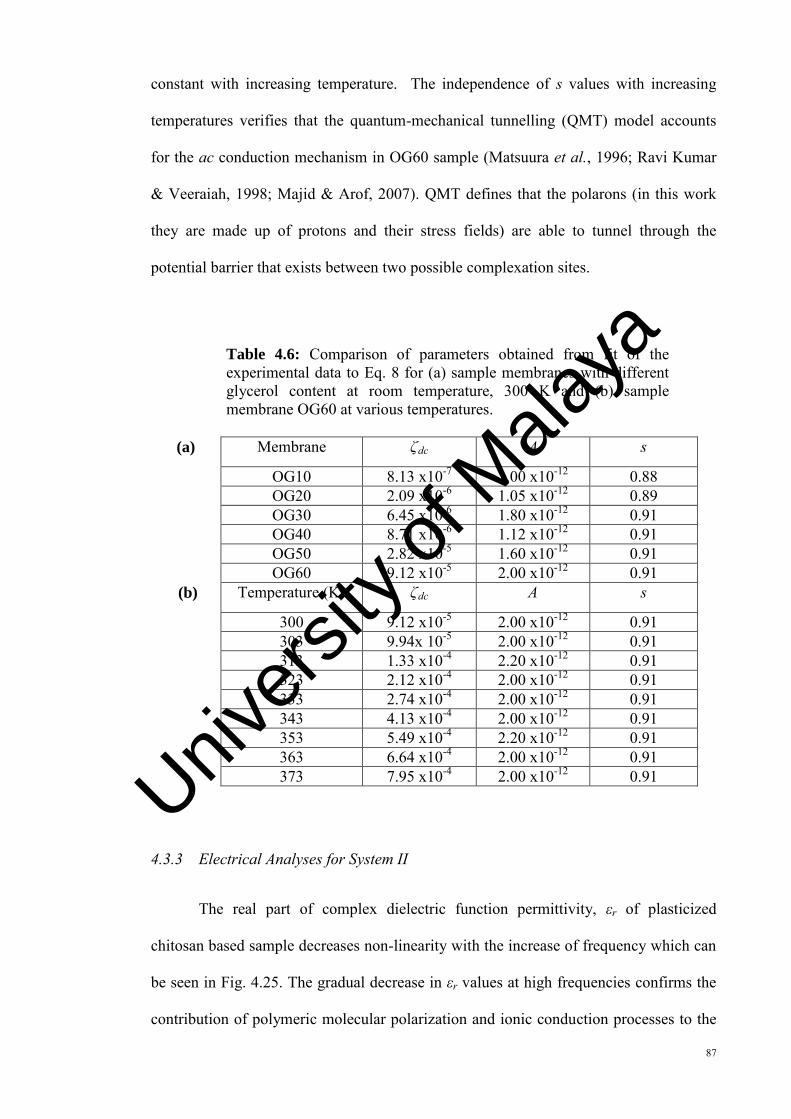
87
constant with increasing temperature. The independence of s values with increasing
temperatures verifies that the quantum-mechanical tunnelling (QMT) model accounts
for the ac conduction mechanism in OG60 sample (Matsuura et al., 1996; Ravi Kumar
& Veeraiah, 1998; Majid & Arof, 2007). QMT defines that the polarons (in this work
they are made up of protons and their stress fields) are able to tunnel through the
potential barrier that exists between two possible complexation sites.
Table 4.6: Comparison of parameters obtained from fit of the experimental data to Eq. 8 for (a) sample membranes with different glycerol content at room temperature, 300 K and (b) sample membrane OG60 at various temperatures.
(a) Membrane ζdc A s
OG10 8.13 x10⁻⁷ 1.00 x10⁻¹² 0.88 OG20 2.09 x10⁻⁶ 1.05 x10⁻¹² 0.89 OG30 6.45 x10⁻⁶ 1.80 x10⁻¹² 0.91 OG40 8.71 x10⁻⁶ 1.12 x10⁻¹² 0.91 OG50 2.82 x10⁻⁵ 1.60 x10⁻¹² 0.91 OG60 9.12 x10⁻⁵ 2.00 x10⁻¹² 0.91
(b) Temperature (K) ζdc A s
300 9.12 x10⁻⁵ 2.00 x10⁻¹² 0.91 303 9.94x 10⁻⁵ 2.00 x10⁻¹² 0.91 313 1.33 x10⁻⁴ 2.20 x10⁻¹² 0.91 323 2.12 x10⁻⁴ 2.00 x10⁻¹² 0.91 333 2.74 x10⁻⁴ 2.00 x10⁻¹² 0.91 343 4.13 x10⁻⁴ 2.00 x10⁻¹² 0.91 353 5.49 x10⁻⁴ 2.20 x10⁻¹² 0.91 363 6.64 x10⁻⁴ 2.00 x10⁻¹² 0.91 373 7.95 x10⁻⁴ 2.00 x10⁻¹² 0.91
4.3.3 Electrical Analyses for System II
The real part of complex dielectric function permittivity, εr of plasticized
chitosan based sample decreases non-linearity with the increase of frequency which can
be seen in Fig. 4.25. The gradual decrease in εr values at high frequencies confirms the
contribution of polymeric molecular polarization and ionic conduction processes to the
Univers
ity of
Mala
ya
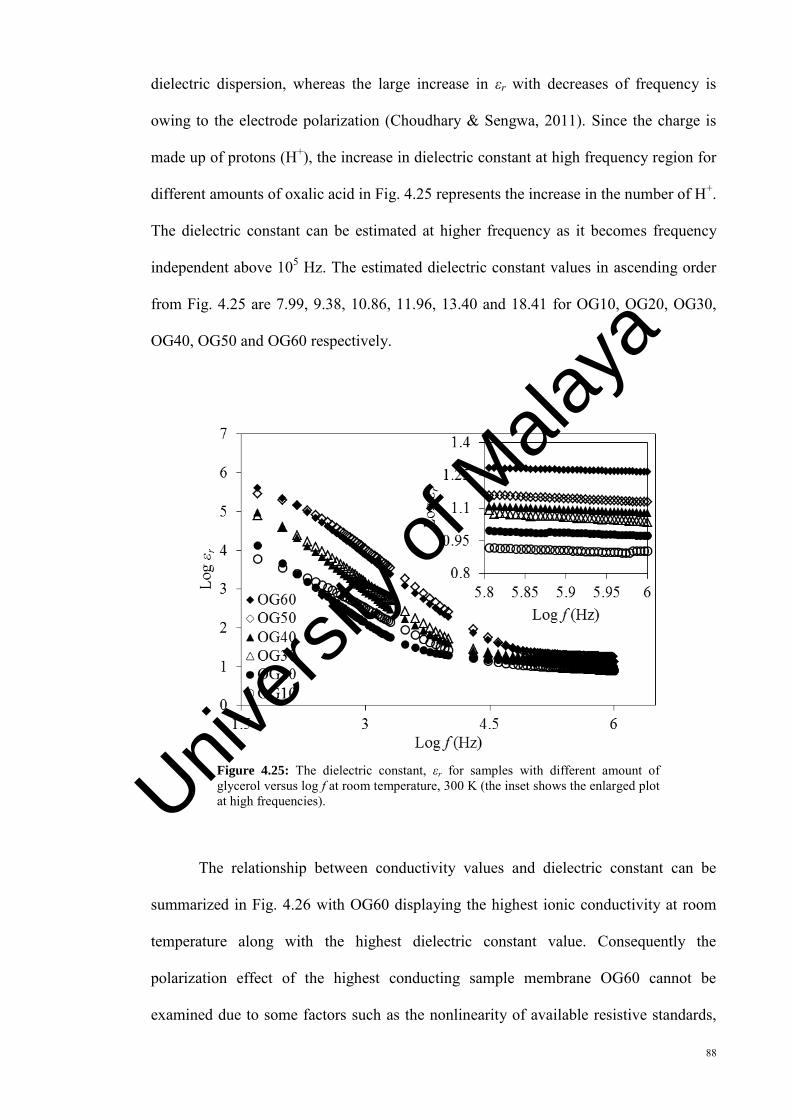
88
dielectric dispersion, whereas the large increase in εr with decreases of frequency is
owing to the electrode polarization (Choudhary & Sengwa, 2011). Since the charge is
made up of protons (H+), the increase in dielectric constant at high frequency region for
different amounts of oxalic acid in Fig. 4.25 represents the increase in the number of H+.
The dielectric constant can be estimated at higher frequency as it becomes frequency
independent above 105 Hz. The estimated dielectric constant values in ascending order
from Fig. 4.25 are 7.99, 9.38, 10.86, 11.96, 13.40 and 18.41 for OG10, OG20, OG30,
OG40, OG50 and OG60 respectively.
Figure 4.25: The dielectric constant, εr for samples with different amount of glycerol versus log f at room temperature, 300 K (the inset shows the enlarged plot at high frequencies).
The relationship between conductivity values and dielectric constant can be
summarized in Fig. 4.26 with OG60 displaying the highest ionic conductivity at room
temperature along with the highest dielectric constant value. Consequently the
polarization effect of the highest conducting sample membrane OG60 cannot be
examined due to some factors such as the nonlinearity of available resistive standards,
Univers
ity of
Mala
ya
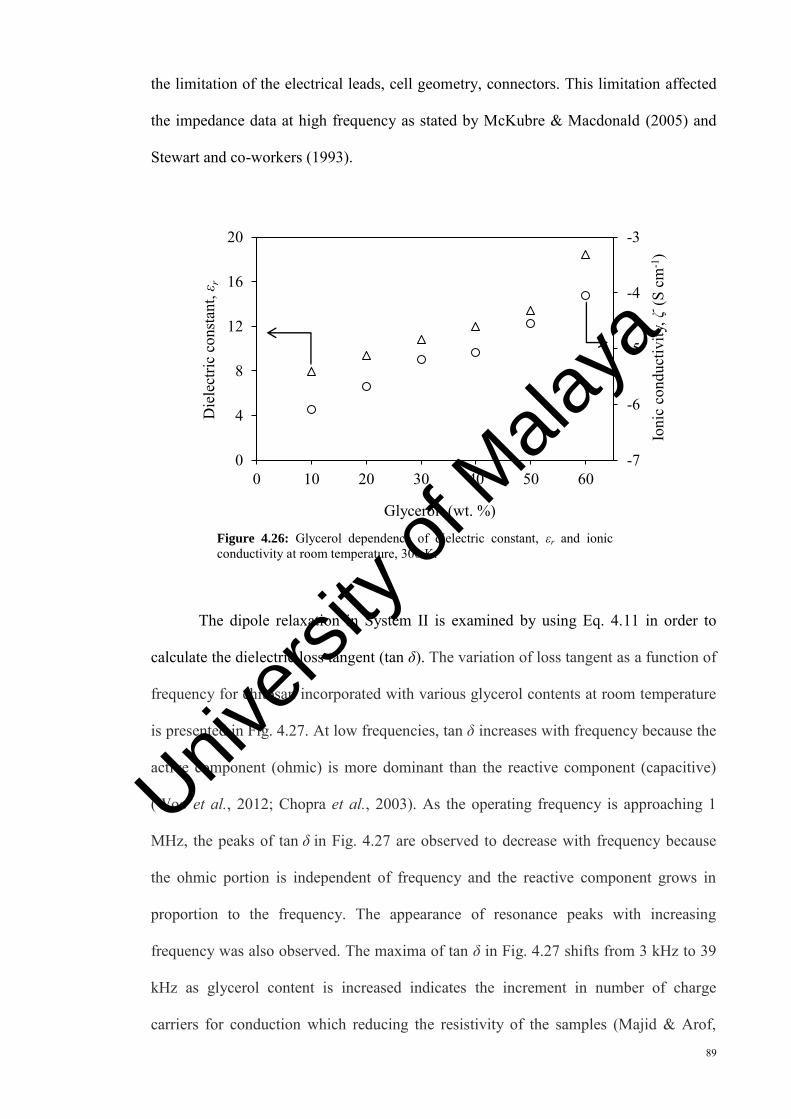
89
the limitation of the electrical leads, cell geometry, connectors. This limitation affected
the impedance data at high frequency as stated by McKubre & Macdonald (2005) and
Stewart and co-workers (1993).
Figure 4.26: Glycerol dependence of dielectric constant, εr and ionic conductivity at room temperature, 300 K.
The dipole relaxation in System II is examined by using Eq. 4.11 in order to
calculate the dielectric loss tangent (tan δ). The variation of loss tangent as a function of
frequency for chitosan incorporated with various glycerol contents at room temperature
is presented in Fig. 4.27. At low frequencies, tan δ increases with frequency because the
active component (ohmic) is more dominant than the reactive component (capacitive)
(Woo et al., 2012; Chopra et al., 2003). As the operating frequency is approaching 1
MHz, the peaks of tan δ in Fig. 4.27 are observed to decrease with frequency because
the ohmic portion is independent of frequency and the reactive component grows in
proportion to the frequency. The appearance of resonance peaks with increasing
frequency was also observed. The maxima of tan δ in Fig. 4.27 shifts from 3 kHz to 39
kHz as glycerol content is increased indicates the increment in number of charge
carriers for conduction which reducing the resistivity of the samples (Majid & Arof,
-7
-6
-5
-4
-3
0
4
8
12
16
20
0 10 20 30 40 50 60
Ioni
c co
nduc
tivity
, ζ (S
cm
-1)
Die
lect
ric c
onst
ant,
ε r
Glycerol (wt. %)
Univers
ity of
Mala
ya
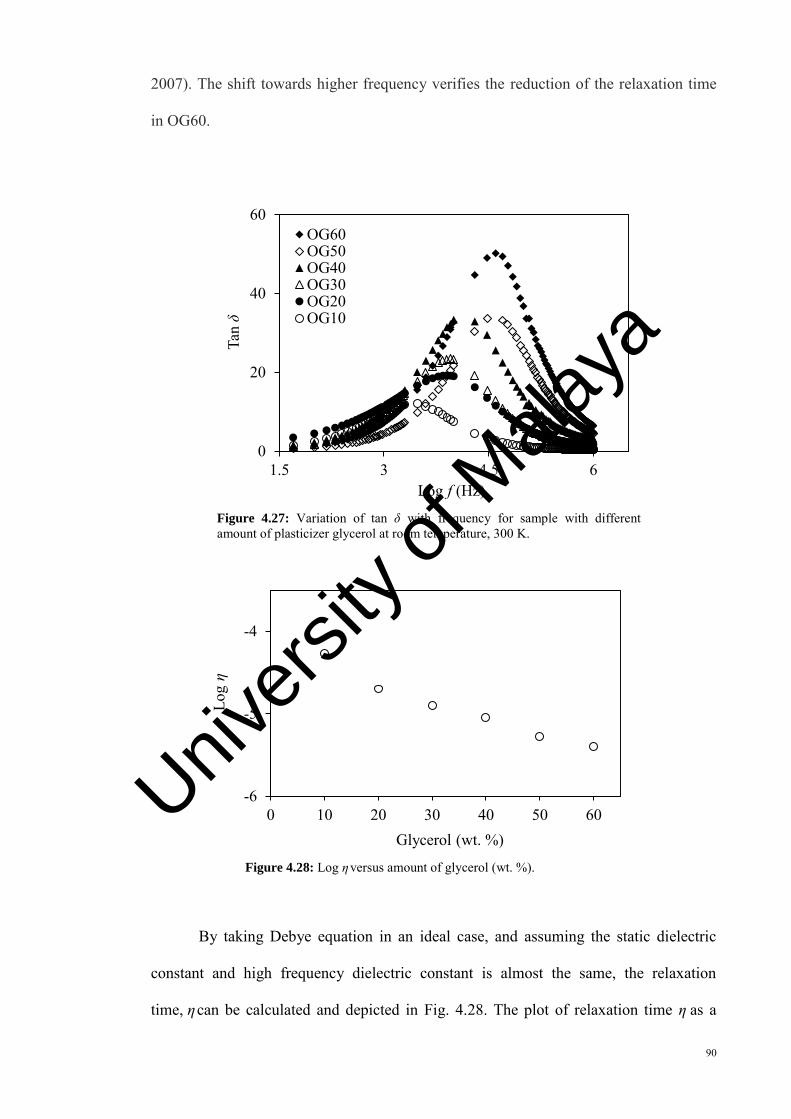
90
2007). The shift towards higher frequency verifies the reduction of the relaxation time
in OG60.
Figure 4.27: Variation of tan δ with frequency for sample with different amount of plasticizer glycerol at room temperature, 300 K.
Figure 4.28: Log η versus amount of glycerol (wt. %).
By taking Debye equation in an ideal case, and assuming the static dielectric
constant and high frequency dielectric constant is almost the same, the relaxation
time, η can be calculated and depicted in Fig. 4.28. The plot of relaxation time η as a
0
20
40
60
1.5 3 4.5 6
Tan
δ
Log f (Hz)
OG60OG50OG40OG30OG20OG10
-6
-5
-4
0 10 20 30 40 50 60
Log
η
Glycerol (wt. %) Univ
ersity
of M
alaya
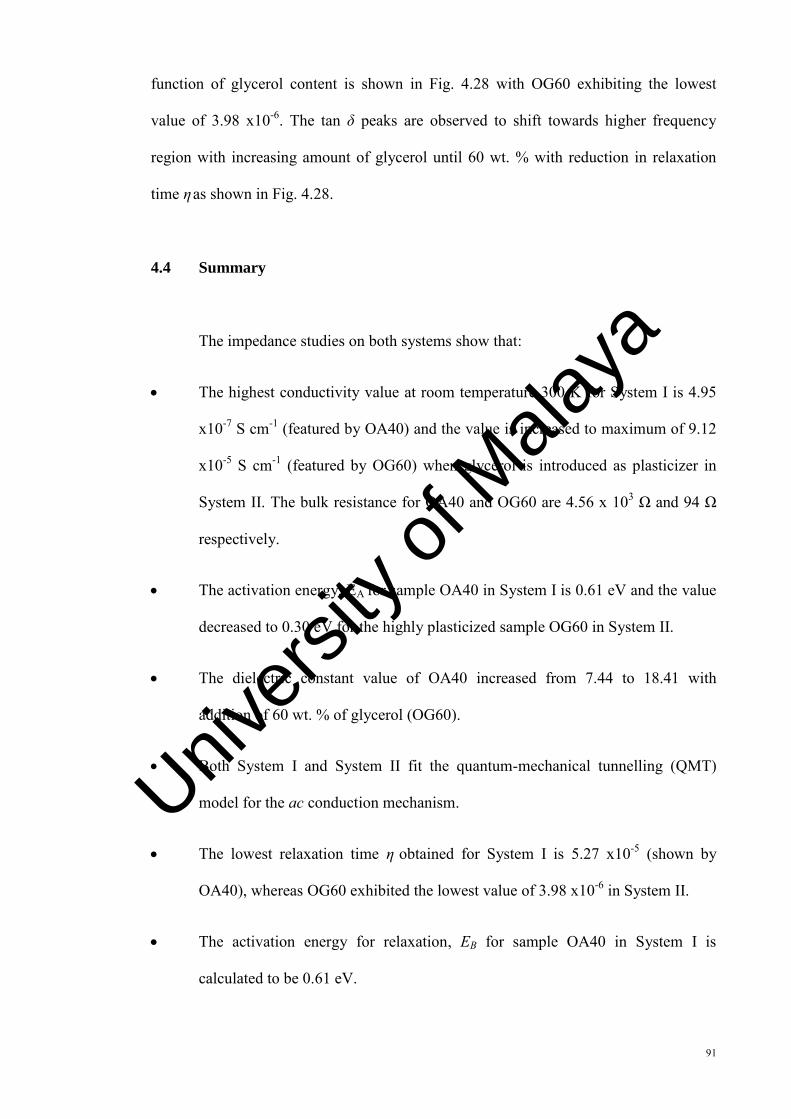
91
function of glycerol content is shown in Fig. 4.28 with OG60 exhibiting the lowest
value of 3.98 x10⁻⁶. The tan δ peaks are observed to shift towards higher frequency
region with increasing amount of glycerol until 60 wt. % with reduction in relaxation
time η as shown in Fig. 4.28.
4.4 Summary
The impedance studies on both systems show that:
The highest conductivity value at room temperature 300 K for System I is 4.95
x10-7 S cm-1 (featured by OA40) and the value is increased to maximum of 9.12
x10-5 S cm-1 (featured by OG60) when glycerol is introduced as plasticizer in
System II. The bulk resistance for OA40 and OG60 are 4.56 x 10³ Ω and 94 Ω
respectively.
The activation energy, EA for sample OA40 in System I is 0.61 eV and the value
decreased to 0.30 eV for the highly plasticized sample OG60 in System II.
The dielectric constant value of OA40 increased from 7.44 to 18.41 with
addition of 60 wt. % of glycerol (OG60).
Both System I and System II fit the quantum-mechanical tunnelling (QMT)
model for the ac conduction mechanism.
The lowest relaxation time η obtained for System I is 5.27 x10⁻⁵ (shown by
OA40), whereas OG60 exhibited the lowest value of 3.98 x10⁻⁶ in System II.
The activation energy for relaxation, EB for sample OA40 in System I is
calculated to be 0.61 eV.
Univers
ity of
Mala
ya
92
CHAPTER 5
FOURIER TRANSFORM INFRARED SPECTROSCOPY ANALYSES
5.1 Introduction
Infrared (IR) spectroscopy provides a simple and fast technique that can give
evidence for the presence of various functional groups. IR spectroscopy depends on the
interaction of molecules or atoms with electromagnetic radiation. IR radiation causes
atoms and groups of atoms of organic compounds to vibrate with increased amplitude
about the covalent bonds that connect them. However IR radiation does not have
sufficient energy to excite electrons, as in the case when molecules interact with visible,
ultraviolet, or higher energy forms of light (Solomon et al., 2004, Banwell & McCash,
1994).
IR radiation region is in between 3 x10¹² and 3 x10¹⁴ Hz and can be specified in
frequency related units by wavenumber ( v ) measured in reciprocal centimeters (cm-1).
The wavenumber is the number of cycle of the waves in each centimeter along direction
of the light. The FTIR spectrometer utilizes Michelson interferometer which can split
the radiation beam from IR source. The combined beams from a mobile mirror and a
fixed mirror pass through the sample to the detector and are recorded as a plot of time
versus signal intensity, called interferogram. The overlapping wavelengths and the
intensities of their respective absorptions are then converted to a spectrum by applying a
mathematical operation called Fourier transform.
Univers
ity of
Mala
ya
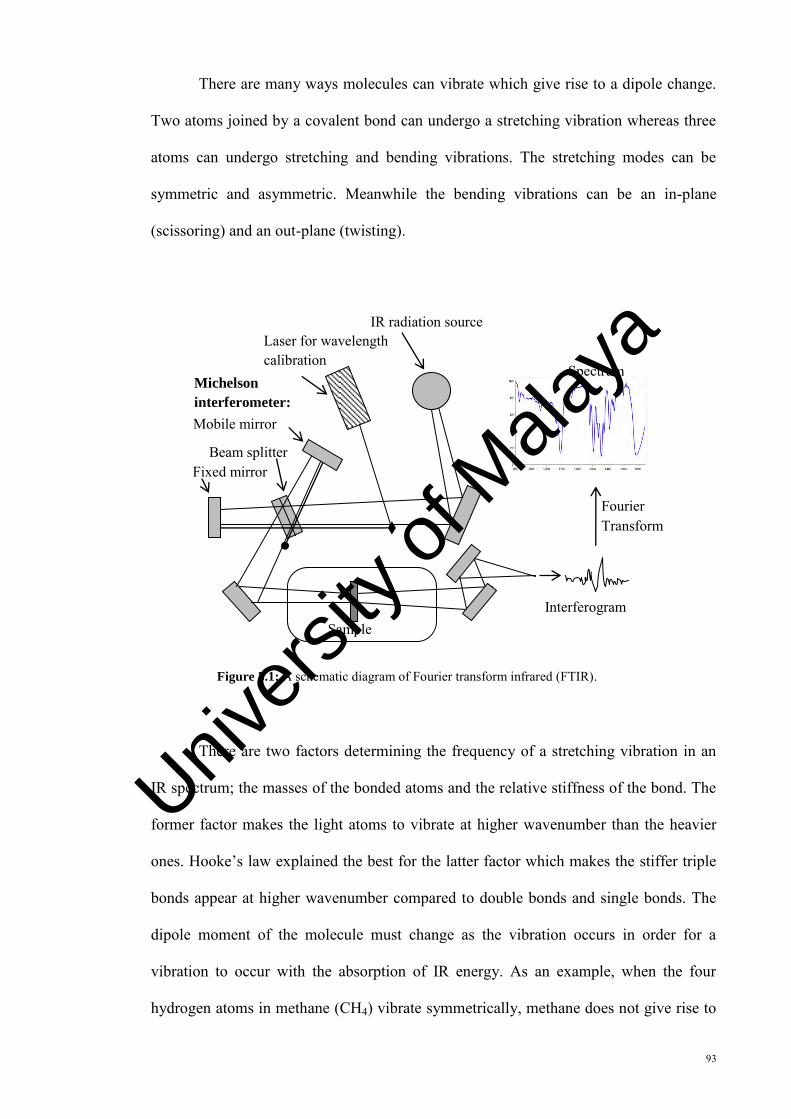
93
There are many ways molecules can vibrate which give rise to a dipole change.
Two atoms joined by a covalent bond can undergo a stretching vibration whereas three
atoms can undergo stretching and bending vibrations. The stretching modes can be
symmetric and asymmetric. Meanwhile the bending vibrations can be an in-plane
(scissoring) and an out-plane (twisting).
Figure 5.1: A schematic diagram of Fourier transform infrared (FTIR).
There are two factors determining the frequency of a stretching vibration in an
IR spectrum; the masses of the bonded atoms and the relative stiffness of the bond. The
former factor makes the light atoms to vibrate at higher wavenumber than the heavier
ones. Hooke’s law explained the best for the latter factor which makes the stiffer triple
bonds appear at higher wavenumber compared to double bonds and single bonds. The
dipole moment of the molecule must change as the vibration occurs in order for a
vibration to occur with the absorption of IR energy. As an example, when the four
hydrogen atoms in methane (CH4) vibrate symmetrically, methane does not give rise to
IR radiation source
Sample
Beam splitter Fixed mirror
Mobile mirror
Laser for wavelength calibration
Interferogram
Fourier Transform
Spectrum Michelson
interferometer:
Univers
ity of
Mala
ya
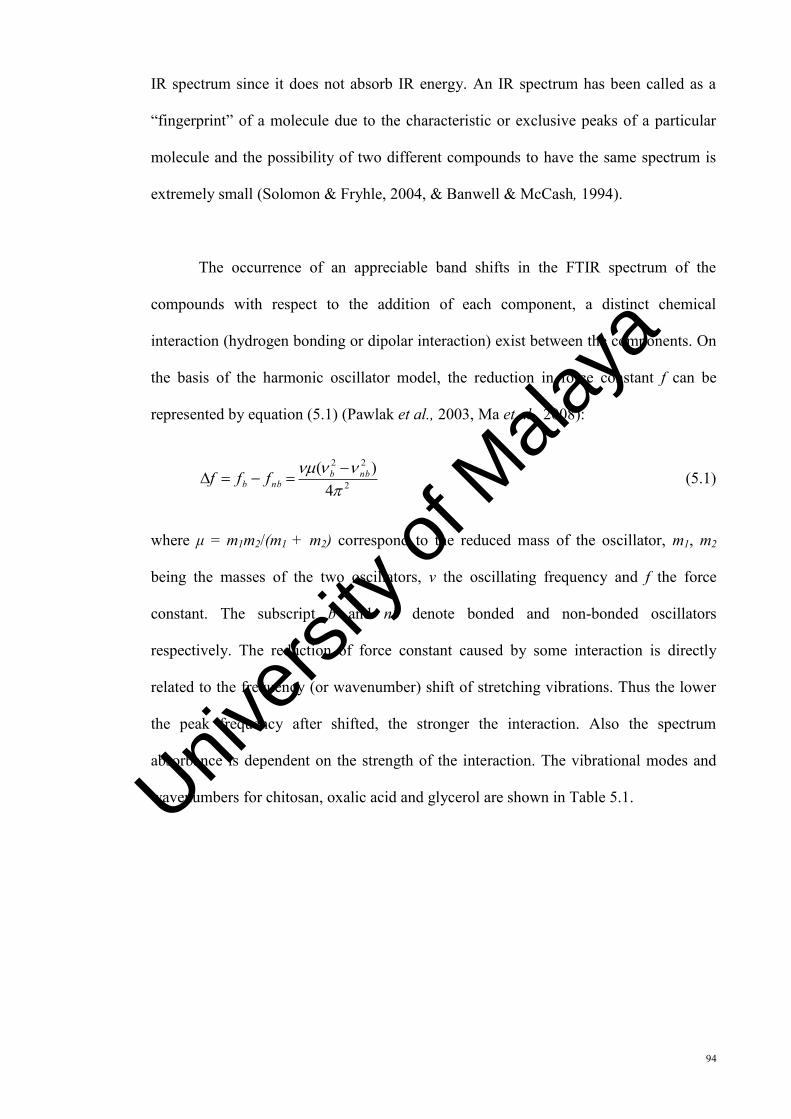
94
IR spectrum since it does not absorb IR energy. An IR spectrum has been called as a
“fingerprint” of a molecule due to the characteristic or exclusive peaks of a particular
molecule and the possibility of two different compounds to have the same spectrum is
extremely small (Solomon & Fryhle, 2004, & Banwell & McCash, 1994).
The occurrence of an appreciable band shifts in the FTIR spectrum of the
compounds with respect to the addition of each component, a distinct chemical
interaction (hydrogen bonding or dipolar interaction) exist between the components. On
the basis of the harmonic oscillator model, the reduction in force constant f can be
represented by equation (5.1) (Pawlak et al., 2003, Ma et al., 2008):
2
22
4)(
nbbnbb fff (5.1)
where μ = m1m2/(m1 + m2) correspond to the reduced mass of the oscillator, m1, m2
being the masses of the two oscillators, ν the oscillating frequency and f the force
constant. The subscript b and nb denote bonded and non-bonded oscillators
respectively. The reduction of force constant caused by some interaction is directly
related to the frequency (or wavenumber) shift of stretching vibrations. Thus the lower
the peak frequency after shifted, the stronger the interaction. Also the spectrum
absorbance is dependent on the strength of the interaction. The vibrational modes and
wavenumbers for chitosan, oxalic acid and glycerol are shown in Table 5.1.
Univers
ity of
Mala
ya
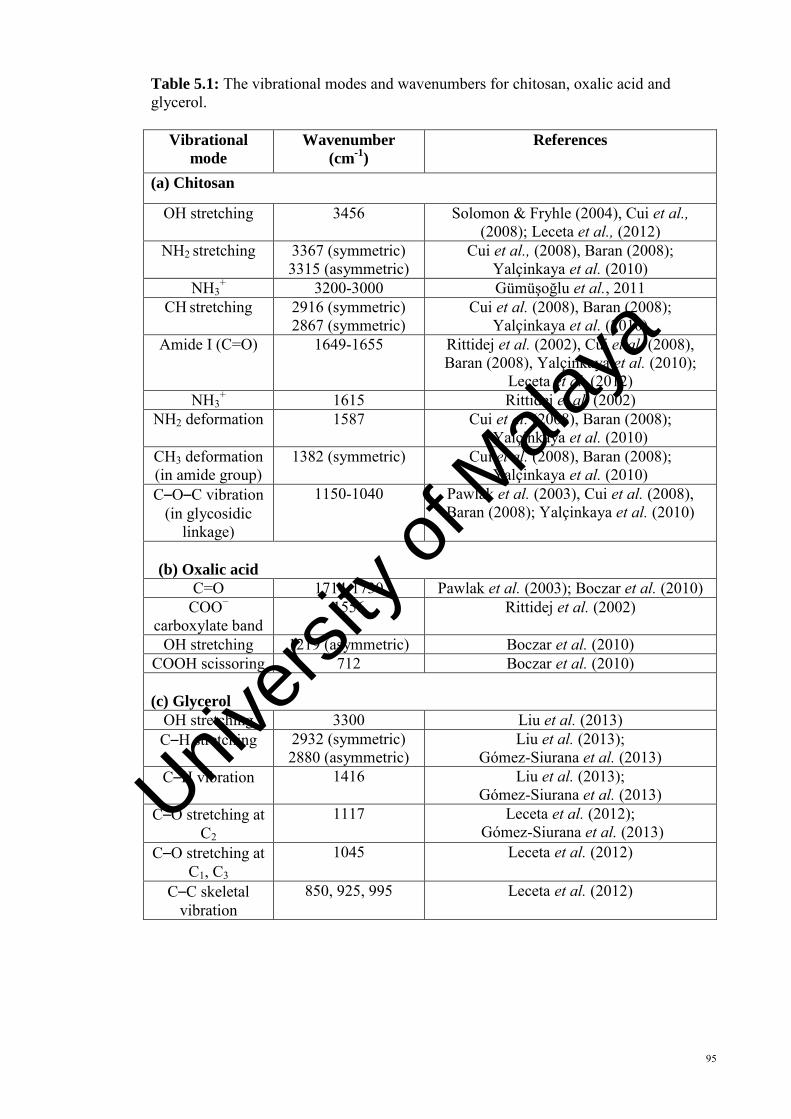
95
Table 5.1: The vibrational modes and wavenumbers for chitosan, oxalic acid and glycerol.
Vibrational
mode
Wavenumber
(cm-1
)
References
(a) Chitosan
OH stretching 3456 Solomon & Fryhle (2004), Cui et al., (2008); Leceta et al., (2012)
NH2 stretching 3367 (symmetric) 3315 (asymmetric)
Cui et al., (2008), Baran (2008); Yalçinkaya et al. (2010)
NH3+ 3200-3000 Gümüşoğlu et al., 2011
CH stretching 2916 (symmetric) 2867 (symmetric)
Cui et al. (2008), Baran (2008); Yalçinkaya et al. (2010)
Amide I (C=O) 1649-1655 Rittidej et al. (2002), Cui et al. (2008), Baran (2008), Yalçinkaya et al. (2010);
Leceta et al. (2012) NH3
+ 1615 Rittidej et al. (2002) NH2 deformation 1587 Cui et al. (2008), Baran (2008);
Yalçinkaya et al. (2010) CH3 deformation (in amide group)
1382 (symmetric) Cui et al. (2008), Baran (2008); Yalçinkaya et al. (2010)
C–O–C vibration (in glycosidic
linkage)
1150-1040 Pawlak et al. (2003), Cui et al. (2008), Baran (2008); Yalçinkaya et al. (2010)
(b) Oxalic acid
C=O 1714-1730 Pawlak et al. (2003); Boczar et al. (2010) COO−
carboxylate band 1556 Rittidej et al. (2002)
OH stretching 1219 (asymmetric) Boczar et al. (2010) COOH scissoring 712 Boczar et al. (2010)
(c) Glycerol OH stretching 3300 Liu et al. (2013) C–H stretching 2932 (symmetric)
2880 (asymmetric) Liu et al. (2013);
Gómez-Siurana et al. (2013) C–H vibration 1416 Liu et al. (2013);
Gómez-Siurana et al. (2013) C–O stretching at
C2 1117 Leceta et al. (2012);
Gómez-Siurana et al. (2013) C–O stretching at
C1, C3 1045 Leceta et al. (2012)
C–C skeletal
vibration 850, 925, 995 Leceta et al. (2012)
Univers
ity of
Mala
ya
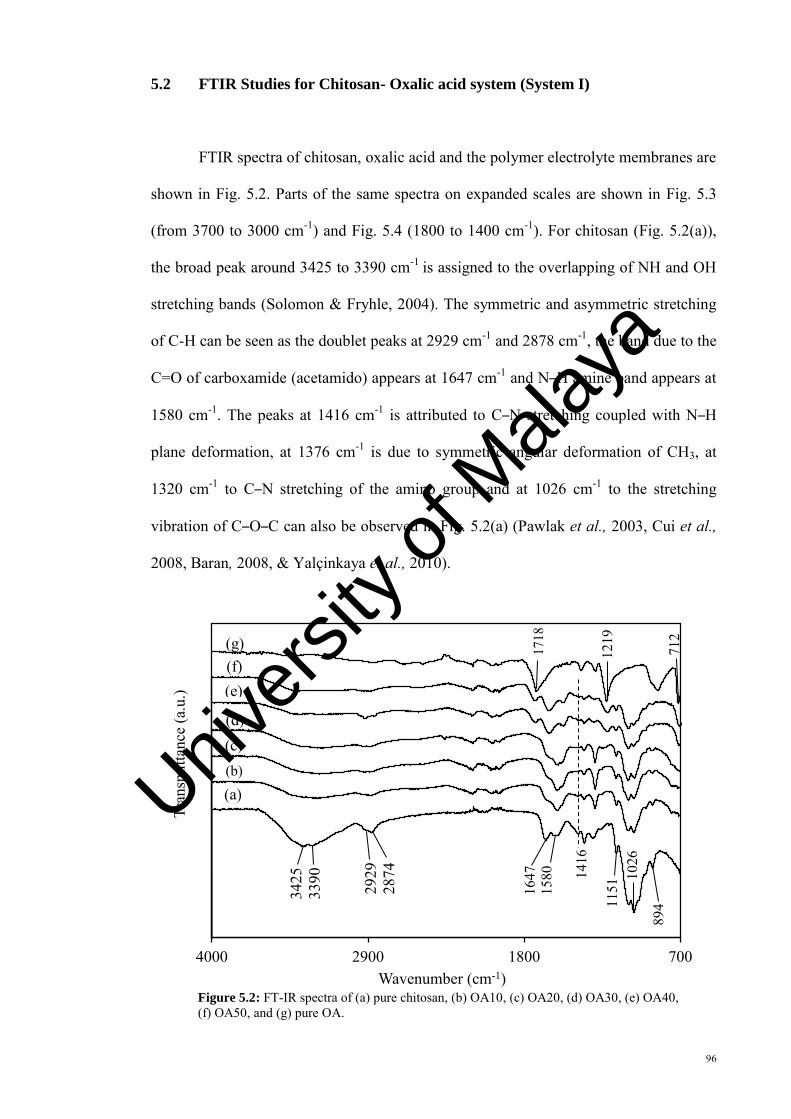
96
5.2 FTIR Studies for Chitosan- Oxalic acid system (System I)
FTIR spectra of chitosan, oxalic acid and the polymer electrolyte membranes are
shown in Fig. 5.2. Parts of the same spectra on expanded scales are shown in Fig. 5.3
(from 3700 to 3000 cm-1) and Fig. 5.4 (1800 to 1400 cm-1). For chitosan (Fig. 5.2(a)),
the broad peak around 3425 to 3390 cm-1 is assigned to the overlapping of NH and OH
stretching bands (Solomon & Fryhle, 2004). The symmetric and asymmetric stretching
of C-H can be seen as the doublet peaks at 2929 cm-1 and 2878 cm-1, the band due to the
C=O of carboxamide (acetamido) appears at 1647 cm-1 and N–H amine band appears at
1580 cm-1. The peaks at 1416 cm-1 is attributed to C–N stretching coupled with N–H
plane deformation, at 1376 cm-1 is due to symmetric angular deformation of CH3, at
1320 cm-1 to C–N stretching of the amino group and at 1026 cm-1 to the stretching
vibration of C–O–C can also be observed in Fig. 5.2(a) (Pawlak et al., 2003, Cui et al.,
2008, Baran, 2008, & Yalçinkaya et al., 2010).
Figure 5.2: FT-IR spectra of (a) pure chitosan, (b) OA10, (c) OA20, (d) OA30, (e) OA40, (f) OA50, and (g) pure OA.
700180029004000
Tran
smitt
ance
(a.u
.)
Wavenumber (cm-1)
(b)
2929
28
74
1647
15
80
1416
1151
1026
894
1718
1219
712
3425
33
90
(g) (f) (e)
(d) (c)
(a) Univers
ity of
Mala
ya
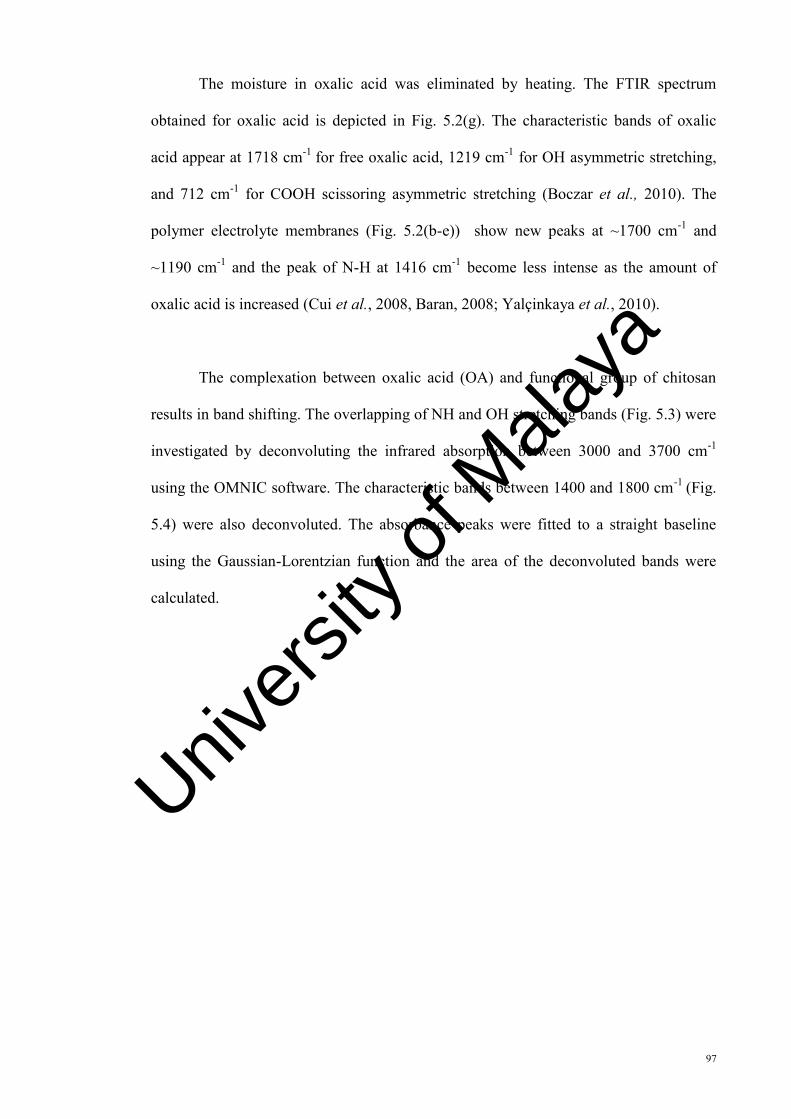
97
The moisture in oxalic acid was eliminated by heating. The FTIR spectrum
obtained for oxalic acid is depicted in Fig. 5.2(g). The characteristic bands of oxalic
acid appear at 1718 cm-1 for free oxalic acid, 1219 cm-1 for OH asymmetric stretching,
and 712 cm-1 for COOH scissoring asymmetric stretching (Boczar et al., 2010). The
polymer electrolyte membranes (Fig. 5.2(b-e)) show new peaks at ~1700 cm-1 and
~1190 cm-1 and the peak of N-H at 1416 cm-1 become less intense as the amount of
oxalic acid is increased (Cui et al., 2008, Baran, 2008; Yalçinkaya et al., 2010).
The complexation between oxalic acid (OA) and functional group of chitosan
results in band shifting. The overlapping of NH and OH stretching bands (Fig. 5.3) were
investigated by deconvoluting the infrared absorption between 3000 and 3700 cm-1
using the OMNIC software. The characteristic bands between 1400 and 1800 cm-1 (Fig.
5.4) were also deconvoluted. The absorbance peaks were fitted to a straight baseline
using the Gaussian-Lorentzian function and the area of the deconvoluted bands were
calculated.
Univers
ity of
Mala
ya
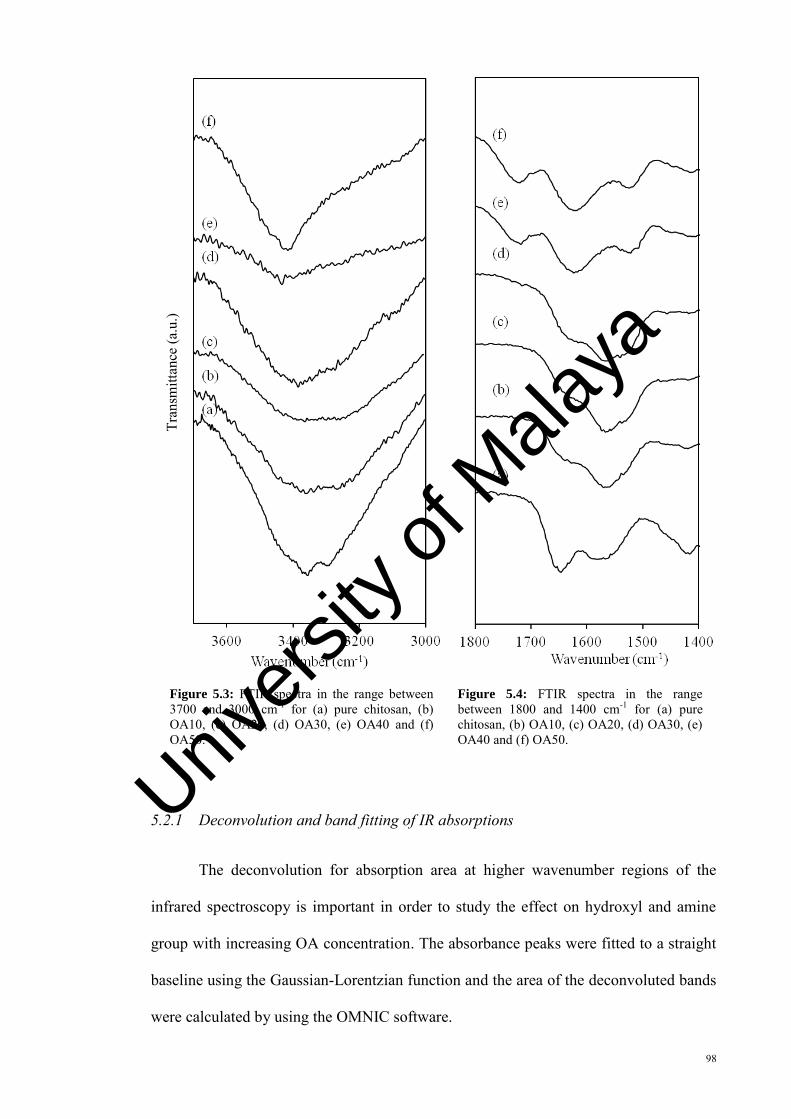
98
Figure 5.3: FTIR spectra in the range between 3700 and 3000 cm-1 for (a) pure chitosan, (b) OA10, (c) OA20, (d) OA30, (e) OA40 and (f) OA50.
Figure 5.4: FTIR spectra in the range between 1800 and 1400 cm-1 for (a) pure chitosan, (b) OA10, (c) OA20, (d) OA30, (e) OA40 and (f) OA50.
5.2.1 Deconvolution and band fitting of IR absorptions
The deconvolution for absorption area at higher wavenumber regions of the
infrared spectroscopy is important in order to study the effect on hydroxyl and amine
group with increasing OA concentration. The absorbance peaks were fitted to a straight
baseline using the Gaussian-Lorentzian function and the area of the deconvoluted bands
were calculated by using the OMNIC software.
Tran
smitt
ance
(a.u
.)
Univers
ity of
Mala
ya

99
The deconvolution of the characteristic bands between 3700 and 3000 cm-1 are
displayed in Fig. 5.6. As one can see in Fig. 5.6(a) the absorption band of free OH for
chitosan at 3456 cm-1 is shift upward to ~3500 cm-1 as OA concentration is increased.
The symmetric and asymmetric stretching bands for NH2 of chitosan shift to higher
region from 3366 and 3250 cm-1 to ~3414 and ~3332 cm-1 respectively. The shift from
lower to higher wavenumber indicates that the hydrogen bonding involving N of amine
(NH2) in chitosan becomes less. This is due to the protonation of amine to NH3+ by
oxalic acid hence reducing the electronegativity of the lone pair of N of amine (NH2).
This result in diminishing of hydrogen bonding formation hence shifts the wavenumber
to higher region.
Figure 5.5: The scheme of hydrogen bonding occurrence. The Z atom is the electronegative atom such as O, N, & F (Solomon & Fryhle, 2004).
The hydrogen bonding is a strong dipole-dipole attraction that occurs between
hydrogen to a strongly electronegative atom (oxygen, nitrogen, fluorine) and non-
bonding electron pairs (lone pairs) on other electronegative atoms (Solomon & Fryhle,
2004). The hydrogen bonding interaction is illustrated in Fig. 5.5 and in this work, O
and N atoms are represented as Z. The existence of a new peak at ~3203-3242 cm-1 in
Fig. 5.6(b-f) implies that the protonation of free amine NH2 of chitosan to NH3+
(Gümüşoğlu et al., 2011). The absorption band for hydrogen bonded hydroxyl (OH)
group of chitosan at ~3100 cm-1 shifted upward to 3138 cm-1 and almost diminished
implying that the hydrogen bonded OH (of inter and/intramolecular chitosan polymer
chain) become less with the increasing amount of oxalic acid (Solomon & Fryhle, 2004;
Cui et al., 2008).
Z H R
• •
Z H R
• •
Univers
ity of
Mala
ya
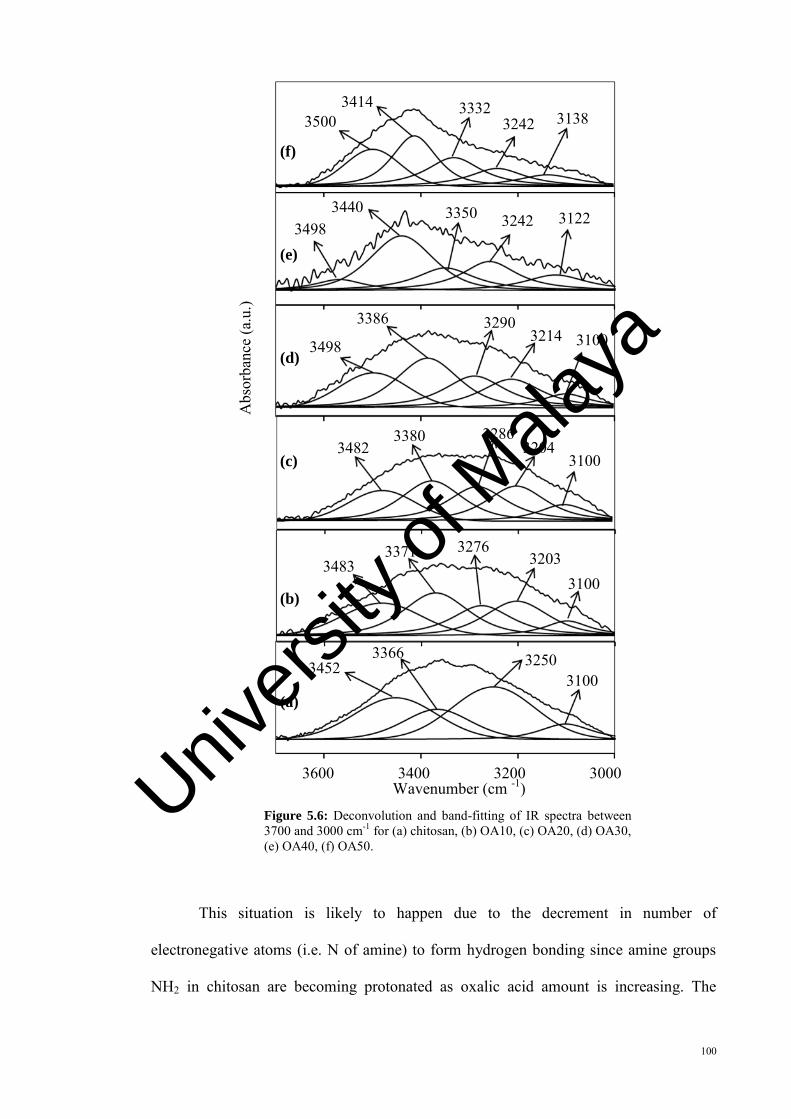
100
Figure 5.6: Deconvolution and band-fitting of IR spectra between 3700 and 3000 cm-1 for (a) chitosan, (b) OA10, (c) OA20, (d) OA30, (e) OA40, (f) OA50.
This situation is likely to happen due to the decrement in number of
electronegative atoms (i.e. N of amine) to form hydrogen bonding since amine groups
NH2 in chitosan are becoming protonated as oxalic acid amount is increasing. The
Abs
orba
nce
(a.u
.)
3600 3400 3200 3000
3100 3250 3366
3452
3483 3371 3276
3203 3100
3100 3204
3286 3380 3482
3100 3214 3290 3386
3498
3122 3242 3350 3440 3498
3500 3414 3332
3242 3138
(f)
(e)
(d)
(c)
(b)
(a)
Wavenumber (cm -1) Univers
ity of
Mala
ya
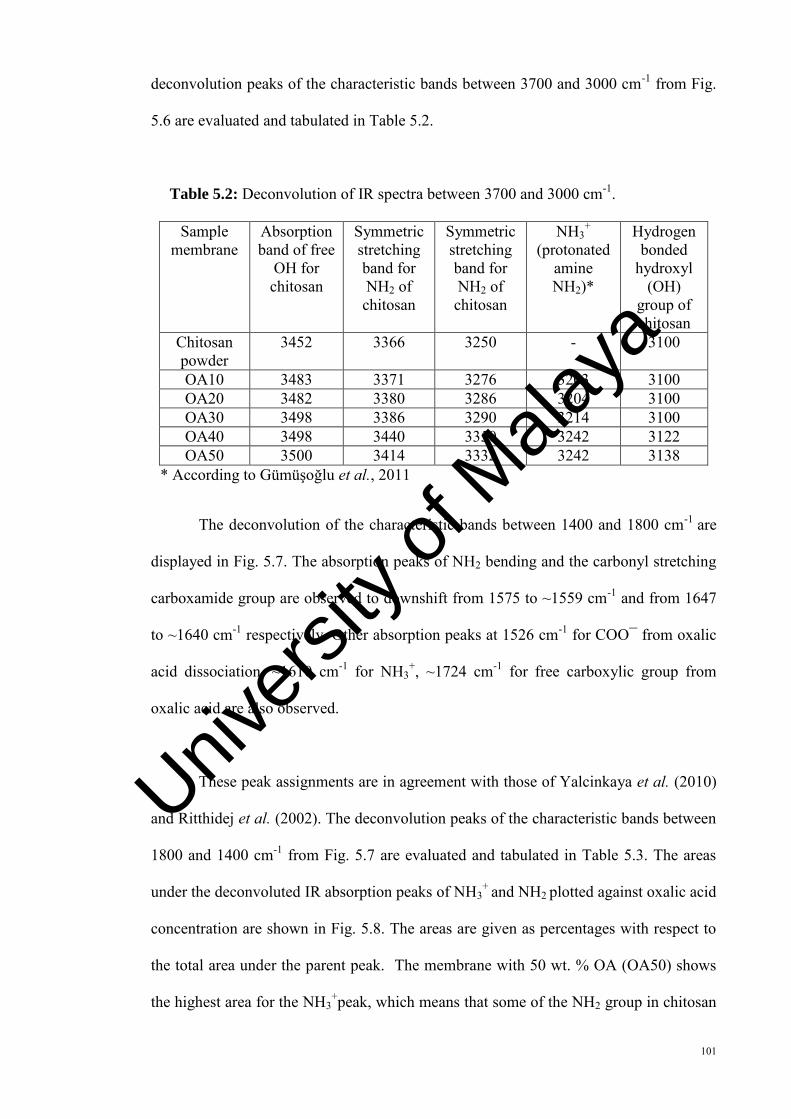
101
deconvolution peaks of the characteristic bands between 3700 and 3000 cm-1 from Fig.
5.6 are evaluated and tabulated in Table 5.2.
Table 5.2: Deconvolution of IR spectra between 3700 and 3000 cm-1.
Sample membrane
Absorption band of free
OH for chitosan
Symmetric stretching band for NH2 of chitosan
Symmetric stretching band for NH2 of chitosan
NH3+
(protonated amine NH2)*
Hydrogen bonded
hydroxyl (OH)
group of chitosan
Chitosan powder
3452 3366 3250 - 3100
OA10 3483 3371 3276 3203 3100 OA20 3482 3380 3286 3204 3100 OA30 3498 3386 3290 3214 3100 OA40 3498 3440 3350 3242 3122 OA50 3500 3414 3332 3242 3138
* According to Gümüşoğlu et al., 2011
The deconvolution of the characteristic bands between 1400 and 1800 cm-1 are
displayed in Fig. 5.7. The absorption peaks of NH2 bending and the carbonyl stretching
carboxamide group are observed to downshift from 1575 to ~1559 cm-1 and from 1647
to ~1640 cm-1 respectively. Other absorption peaks at 1526 cm-1 for COO¯ from oxalic
acid dissociation, ~1610 cm-1 for NH3+, ~1724 cm-1 for free carboxylic group from
oxalic acid are also observed.
These peak assignments are in agreement with those of Yalcinkaya et al. (2010)
and Ritthidej et al. (2002). The deconvolution peaks of the characteristic bands between
1800 and 1400 cm-1 from Fig. 5.7 are evaluated and tabulated in Table 5.3. The areas
under the deconvoluted IR absorption peaks of NH3+ and NH2 plotted against oxalic acid
concentration are shown in Fig. 5.8. The areas are given as percentages with respect to
the total area under the parent peak. The membrane with 50 wt. % OA (OA50) shows
the highest area for the NH3+peak, which means that some of the NH2 group in chitosan
Univers
ity of
Mala
ya
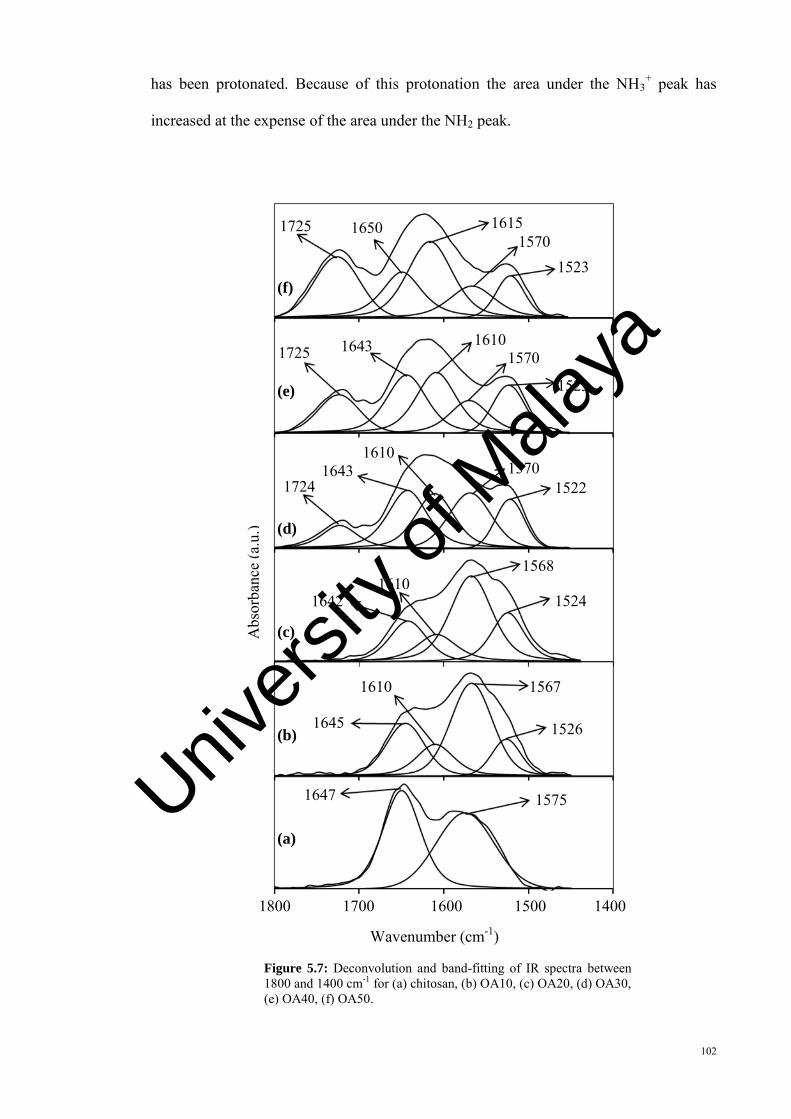
102
has been protonated. Because of this protonation the area under the NH3+ peak has
increased at the expense of the area under the NH2 peak.
Figure 5.7: Deconvolution and band-fitting of IR spectra between 1800 and 1400 cm-1 for (a) chitosan, (b) OA10, (c) OA20, (d) OA30, (e) OA40, (f) OA50.
1800 1700 1600 1500 1400
Wavenumber (cm-1)
Abs
orba
nce
(a.u
.)
1647 1575
1526
1567 1610
1645
1524
1568 1610
1642
1522 1570
1610 1643
1724
1523
1570 1610 1643 1725
1523 1570
1615 1650 1725
(f)
(e)
(d)
(c)
(b)
(a)
Univers
ity of
Mala
ya
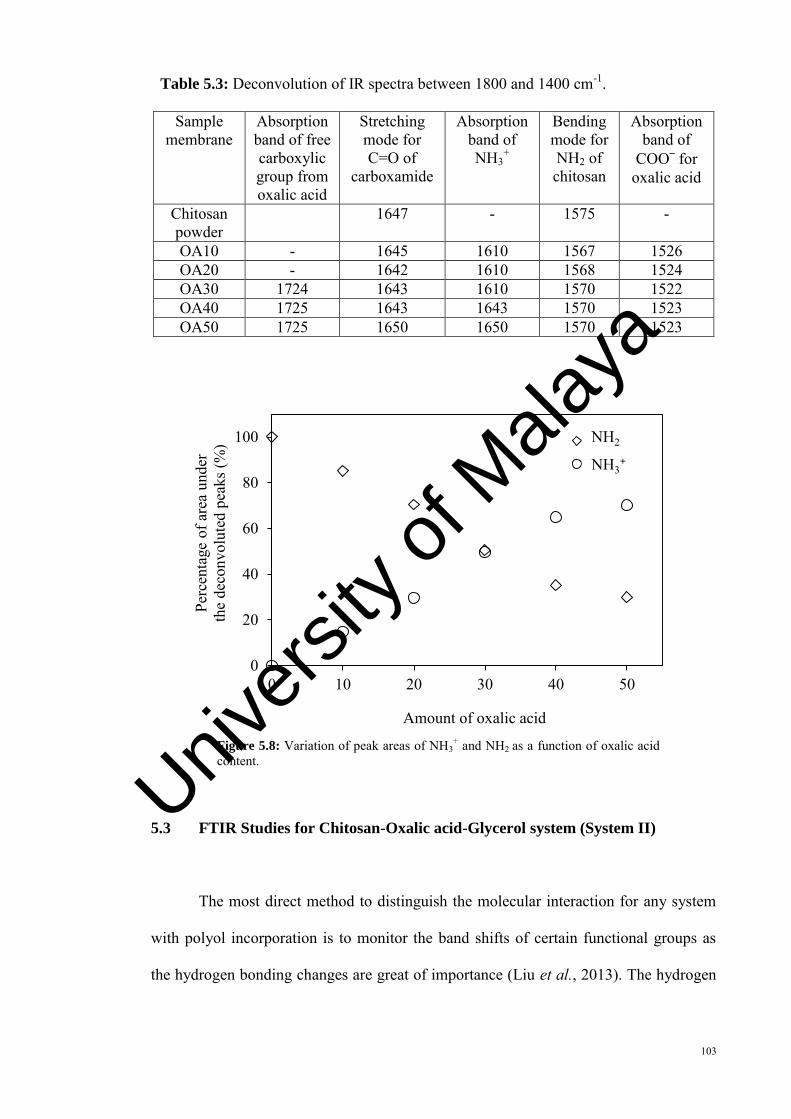
103
Table 5.3: Deconvolution of IR spectra between 1800 and 1400 cm-1.
Sample membrane
Absorption band of free carboxylic group from oxalic acid
Stretching mode for C=O of
carboxamide
Absorption band of NH3
+
Bending mode for NH2 of chitosan
Absorption band of
COO– for oxalic acid
Chitosan powder
1647 - 1575 -
OA10 - 1645 1610 1567 1526 OA20 - 1642 1610 1568 1524 OA30 1724 1643 1610 1570 1522 OA40 1725 1643 1643 1570 1523 OA50 1725 1650 1650 1570 1523
Figure 5.8: Variation of peak areas of NH3+ and NH2 as a function of oxalic acid
content.
5.3 FTIR Studies for Chitosan-Oxalic acid-Glycerol system (System II)
The most direct method to distinguish the molecular interaction for any system
with polyol incorporation is to monitor the band shifts of certain functional groups as
the hydrogen bonding changes are great of importance (Liu et al., 2013). The hydrogen
0
20
40
60
80
100
0 10 20 30 40 50
Perc
enta
ge o
f are
a un
der
the
deco
nvol
uted
pea
ks (%
)
Amount of oxalic acid
NH2NH3+
NH2
NH3+
Univers
ity of
Mala
ya
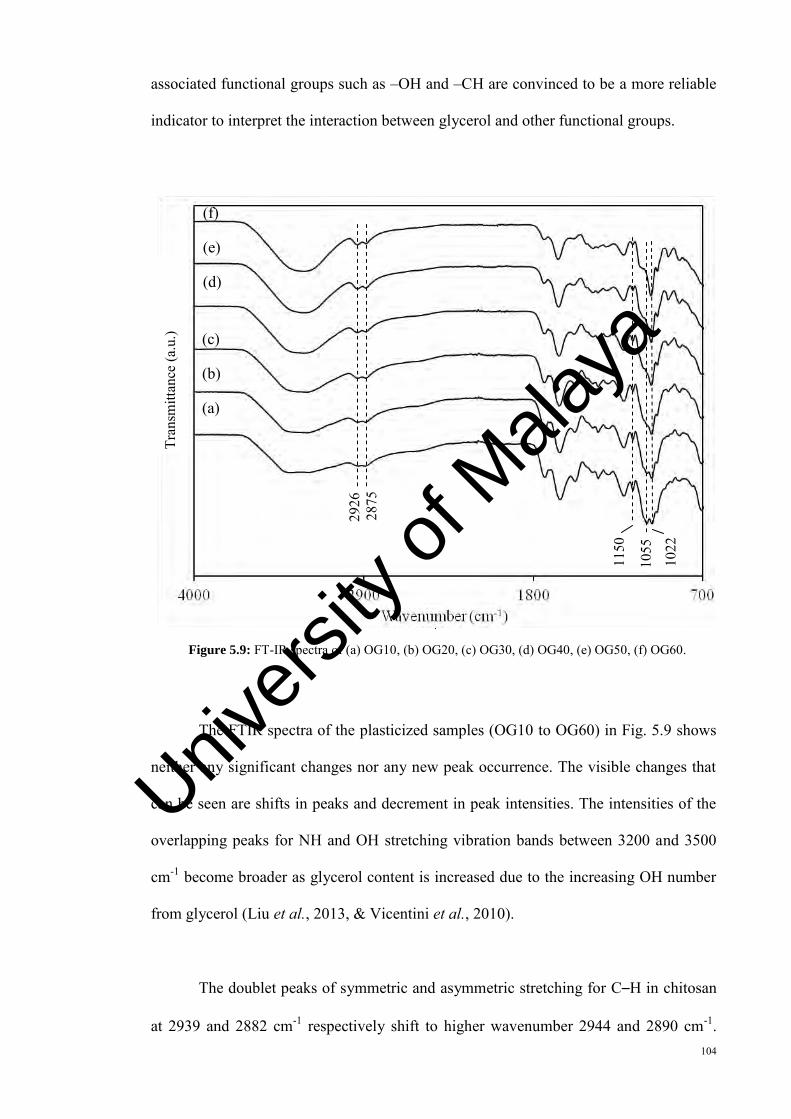
104
associated functional groups such as –OH and –CH are convinced to be a more reliable
indicator to interpret the interaction between glycerol and other functional groups.
Figure 5.9: FT-IR spectra of (a) OG10, (b) OG20, (c) OG30, (d) OG40, (e) OG50, (f) OG60.
The FTIR spectra of the plasticized samples (OG10 to OG60) in Fig. 5.9 shows
neither any significant changes nor any new peak occurrence. The visible changes that
can be seen are shifts in peaks and decrement in peak intensities. The intensities of the
overlapping peaks for NH and OH stretching vibration bands between 3200 and 3500
cm-1 become broader as glycerol content is increased due to the increasing OH number
from glycerol (Liu et al., 2013, & Vicentini et al., 2010).
The doublet peaks of symmetric and asymmetric stretching for C–H in chitosan
at 2939 and 2882 cm-1 respectively shift to higher wavenumber 2944 and 2890 cm-1.
1022
1150
2875
29
26
(c)
(b)
(a)
(f)
(e)
(d)
1055
Tran
smitt
ance
(a.u
.)
Univers
ity of
Mala
ya
105
The interaction between the plasticizer (glycerol) and C-H group become lesser as
glycerol content is increased hence causing the peaks to appear at higher wavelength
and become prominent as the force constant increased. This explanation is in agreement
with Ma et al. (2008) and Pawlak et al. (2003).
The characteristic bands between 1800 and 1450 cm-1 are observed to be weak
or less intense. The addition of glycerol results in increasing of hydrogen bonding
occurrence between OH (of glycerol) and NH2, NH3+, C=O of carboxamide group and
free oxalic acid (refer to section 5.2).
The hydrogen bonding effect with increasing content of glycerol can also be
seen for COC glycosidic linkage band in the range from 1150 to 1040 cm-1. The
absorption peak at 1150 cm-1 becomes less pronounced and the disappearance of peak at
1055 cm-1 suggests interactions between glycosidic linkage and glycerol (Leceta et al.,
2012, Pawlak et al., 2003). The absorption peak at 1022 cm-1 becomes more noticeable
and shifts to a higher wavenumber 1030 cm-1 as glycerol content is increased.
5.4 Summary
The Fourier transform infrared spectroscopy studies on both systems show that:
From the deconvolution study on System I, the intensity of NH3+ peak at 1610-
1615 cm-1 and COO‒ peak at1724 cm-1 increased with amount of oxalic acid.
The area under the NH3+ peak has increased with the content of oxalic acid
whereas the area under the NH2 peak is decreasing indicating that the amine
group of chitosan is being protonated.
Univers
ity of
Mala
ya
106
The interaction between the plasticizer (glycerol) and C–H group results in the
shift of the doublet peaks of symmetric and asymmetric stretching for alkyl
group in chitosan (C–H) at 2939 and 2882 cm-1 upward to 2944 and 2890 cm-1.
In this work, FTIR is an important tool in detecting the functional groups and
determining the interactions in electrolyte membranes consisting of chitosan,
oxalic acid and plasticizer glycerol. These interactions can be seen from the
band shifts as concentration of oxalic acid increased for bending mode for NH2
of chitosan from 1575 to 1575 cm-1, the presence of a new peak for protonated
amine NH3+ at ~1610. The prominent changes in the peak intensities of FTIR
spectra can be seen for NH and OH stretching vibration between 3200 and 3500
cm-1 as concentration of glycerol increased.
Univers
ity of
Mala
ya
107
CHAPTER 6
X-RAY DIFFRACTION ANALYSES
6.1 Introduction
X-ray diffraction (XRD) is the most widely used and least ambiguous method
for the precise determination of the positions of atoms in molecules and solids (Shriver
et al., 1994). It is also widely used as a means of characterizing materials of all forms
(Kumirska et al., 2010). A typical x-ray diffractomer consists of an x-ray source with a
fixed wavelength, a goniometer for mounting the sample and an x-ray detector as shown
in Fig. 6.1. A crystal is mounted on the goniometer and gradually rotated while being
bombarded with x-rays, producing a diffraction pattern of regularly spaced spots known
as reflections. The two-dimensional images taken at different rotations are converted
into a three dimensional model of the density of electrons within using the mathematical
method of Fourier transforms, combined with the chemical data obtained for the sample.
The pioneer crystal studies on chitin and chitosan were reported in 1937 using
XRD (Kumirska et al., 2010). The x-ray patterns were obtained by passing the x-ray
beam perpendicular and parallel to surface of the chitin sheet. They also examined the
diffractograms of chitin fibres, ground chitin, the precipitation from the reaction
between chitin and some chemicals; hydrochloric acid, lithium thiocyanate, nitric acid
and sodium hydroxide.
Univers
ity of
Mala
ya
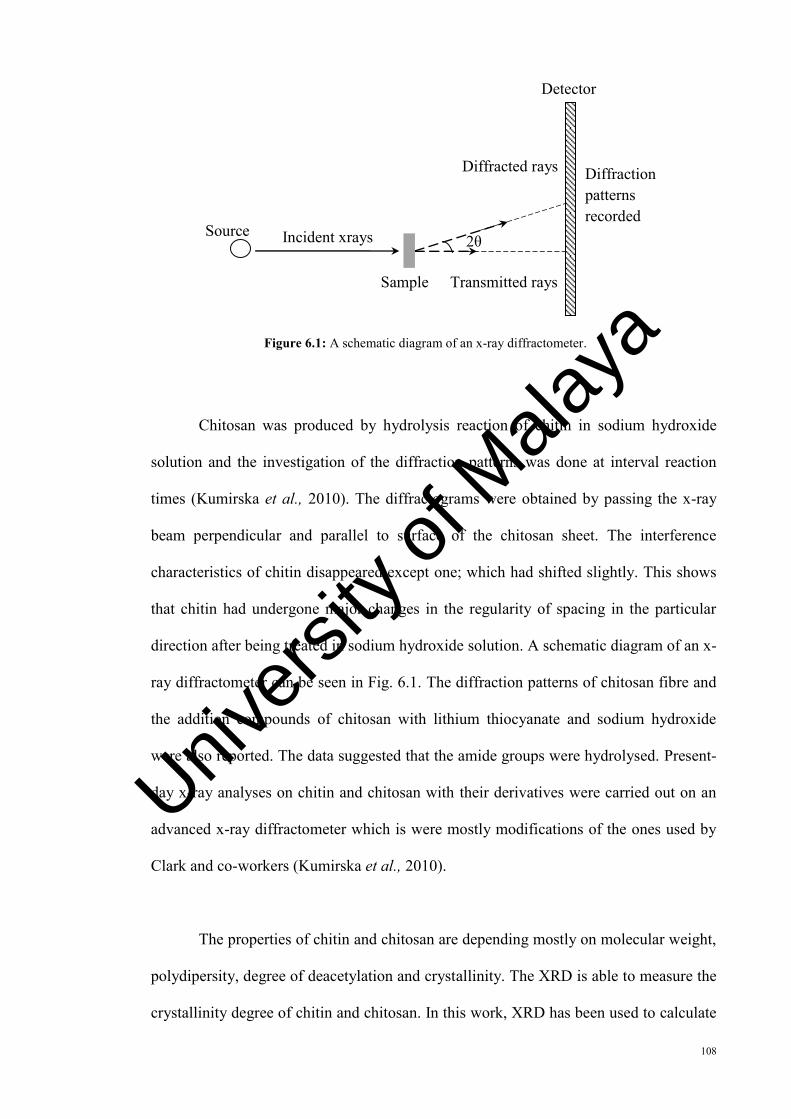
108
Figure 6.1: A schematic diagram of an x-ray diffractometer.
Chitosan was produced by hydrolysis reaction of chitin in sodium hydroxide
solution and the investigation of the diffraction patterns was done at interval reaction
times (Kumirska et al., 2010). The diffractograms were obtained by passing the x-ray
beam perpendicular and parallel to surface of the chitosan sheet. The interference
characteristics of chitin disappeared except one; which had shifted slightly. This shows
that chitin had undergone major changes in the regularity of spacing in the particular
direction after being treated in sodium hydroxide solution. A schematic diagram of an x-
ray diffractometer can be seen in Fig. 6.1. The diffraction patterns of chitosan fibre and
the addition compounds of chitosan with lithium thiocyanate and sodium hydroxide
were also reported. The data suggested that the amide groups were hydrolysed. Present-
day x-ray analyses on chitin and chitosan with their derivatives were carried out on an
advanced x-ray diffractometer which is were mostly modifications of the ones used by
Clark and co-workers (Kumirska et al., 2010).
The properties of chitin and chitosan are depending mostly on molecular weight,
polydipersity, degree of deacetylation and crystallinity. The XRD is able to measure the
crystallinity degree of chitin and chitosan. In this work, XRD has been used to calculate
Incident xrays Source
Sample
Diffracted rays
Detector
Diffraction patterns recorded
2θ
Transmitted rays
Univers
ity of
Mala
ya
109
the crystallinity degree of chitosan with DD higher than 75 %. The parameters of chitin
hydrolysis process in sodium hydroxide solution will determine the deacetylation degree
(DD) of chitosan. The longer reaction time will produce chitosan with higher DD value.
This chemical modification results in N-deacetylation of amide (–NC=O) to amine
(NH2). Zhang et al. (2005) reported the XRD patterns for chitosan with various DD
values as high as 93 %. It is noted that the crystallinity value is decreasing as the DD
value increased. The d-spacing changes in chitin can be seen for chitosan with higher
DD values (50–93 %) which indicate the occurrence of expansions of the crystal lattices
(compared to those of lower ones) and thus moved to wider diffraction angles. This is
due to the less intermolecular bonding in chitosan with higher DD values (Zhang et al.,
2005).
In the present work chitosan (polymer host) was incorporated with various
amounts of oxalic acid and glycerol (as plasticizer). The relative degree of crystallinity,
χc of each sample membrane can be calculated using the simplicity approach of the two-
phase model from XRD pattern using the following equation (Hassan et al., 2013 &
Lewandowska et al., 2011):
AC
CC II
I
(6.1)
where IC is the crystalline integrated intensity (area under the curve) of the peaks and IA
is amorphous integrated intensity of the halo.
6.2 XRD study for Chitosan–Oxalic acid system (System I)
The XRD patterns of crosslinked chitosan film with different amounts of oxalic
acid are shown in Fig. 6.2. Chitosan–oxalic acid salt or chitosan–oxalate can be formed
Univers
ity of
Mala
ya
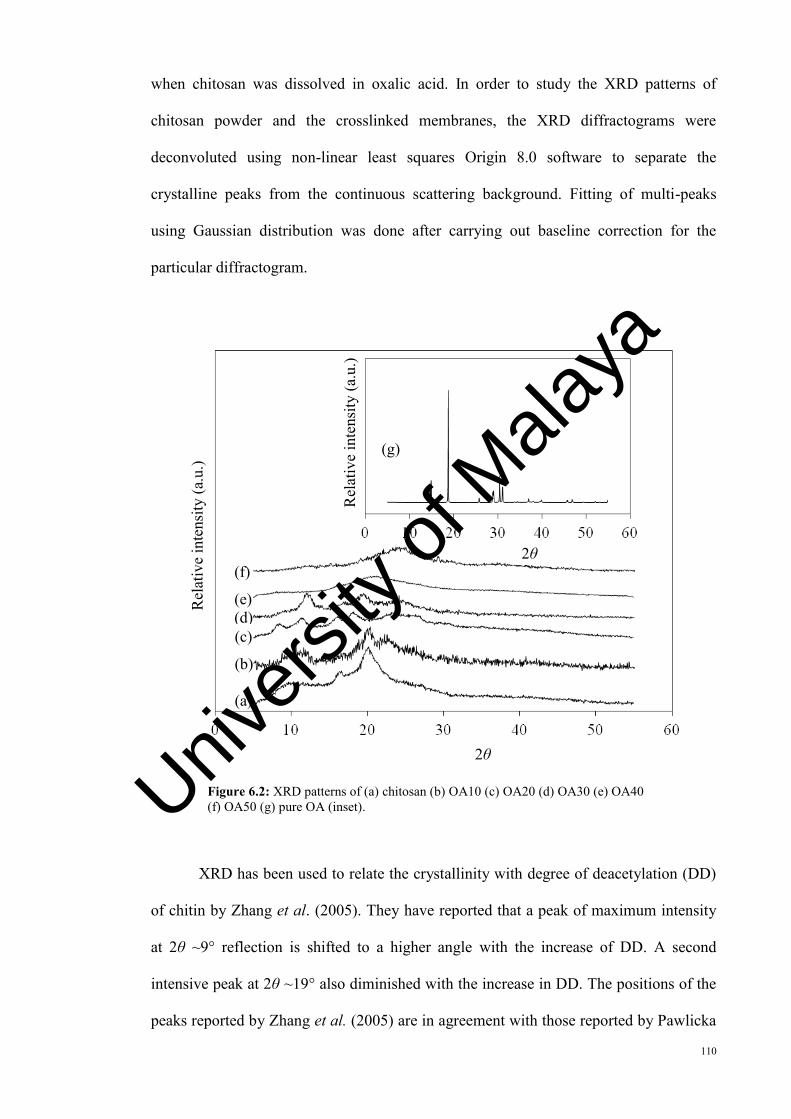
110
when chitosan was dissolved in oxalic acid. In order to study the XRD patterns of
chitosan powder and the crosslinked membranes, the XRD diffractograms were
deconvoluted using non-linear least squares Origin 8.0 software to separate the
crystalline peaks from the continuous scattering background. Fitting of multi-peaks
using Gaussian distribution was done after carrying out baseline correction for the
particular diffractogram.
Figure 6.2: XRD patterns of (a) chitosan (b) OA10 (c) OA20 (d) OA30 (e) OA40 (f) OA50 (g) pure OA (inset).
XRD has been used to relate the crystallinity with degree of deacetylation (DD)
of chitin by Zhang et al. (2005). They have reported that a peak of maximum intensity
at 2θ ~9° reflection is shifted to a higher angle with the increase of DD. A second
intensive peak at 2θ ~19° also diminished with the increase in DD. The positions of the
peaks reported by Zhang et al. (2005) are in agreement with those reported by Pawlicka
Rel
ativ
e in
tens
ity (a
.u.)
Rel
ativ
e in
tens
ity (a
.u.)
(f)
(e) (d) (c)
(b)
(a)
(g)
2θ
2θ
Univers
ity of
Mala
ya
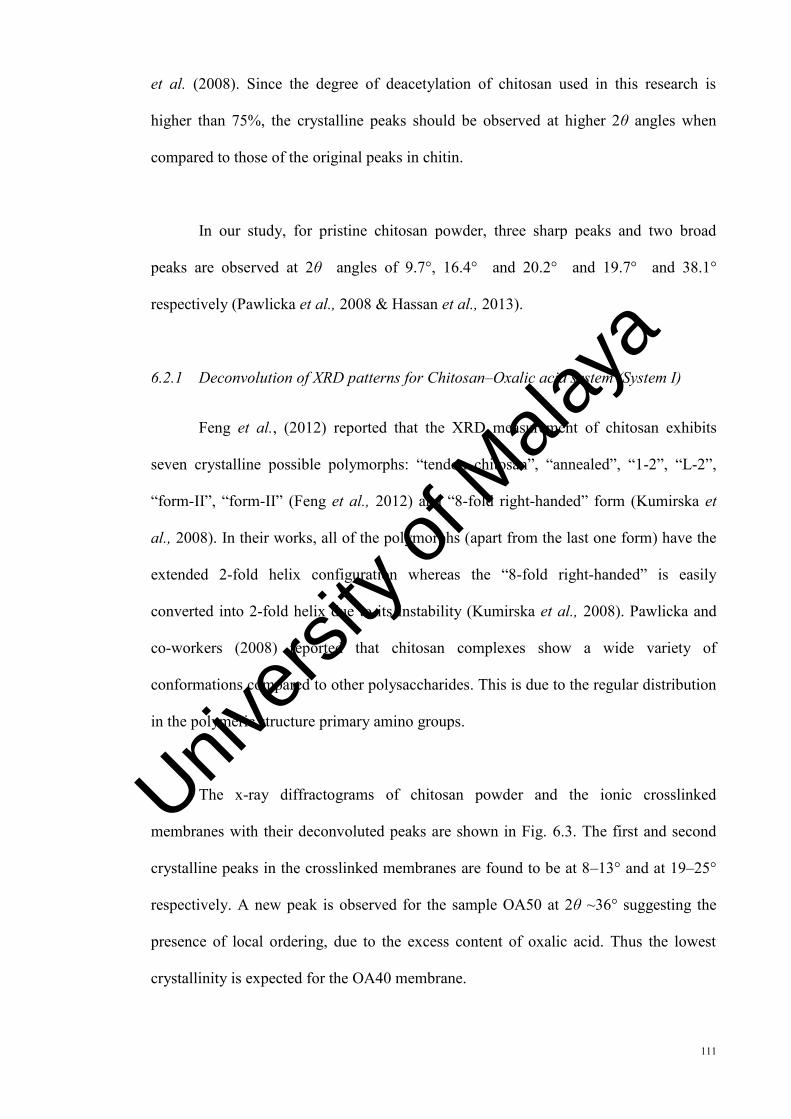
111
et al. (2008). Since the degree of deacetylation of chitosan used in this research is
higher than 75%, the crystalline peaks should be observed at higher 2θ angles when
compared to those of the original peaks in chitin.
In our study, for pristine chitosan powder, three sharp peaks and two broad
peaks are observed at 2θ angles of 9.7°, 16.4° and 20.2° and 19.7° and 38.1°
respectively (Pawlicka et al., 2008 & Hassan et al., 2013).
6.2.1 Deconvolution of XRD patterns for Chitosan–Oxalic acid system (System I)
Feng et al., (2012) reported that the XRD measurement of chitosan exhibits
seven crystalline possible polymorphs: “tendon chitosan”, “annealed”, “1-2”, “L-2”,
“form-II”, “form-II” (Feng et al., 2012) and “8-fold right-handed” form (Kumirska et
al., 2008). In their works, all of the polymorphs (apart from the last one form) have the
extended 2-fold helix configuration whereas the “8-fold right-handed” is easily
converted into 2-fold helix due to its instability (Kumirska et al., 2008). Pawlicka and
co-workers (2008) reported that chitosan complexes show a wide variety of
conformations compared to other polysaccharides. This is due to the regular distribution
in the polymeric structure primary amino groups.
The x-ray diffractograms of chitosan powder and the ionic crosslinked
membranes with their deconvoluted peaks are shown in Fig. 6.3. The first and second
crystalline peaks in the crosslinked membranes are found to be at 8–13° and at 19–25°
respectively. A new peak is observed for the sample OA50 at 2θ ~36° suggesting the
presence of local ordering, due to the excess content of oxalic acid. Thus the lowest
crystallinity is expected for the OA40 membrane.
Univers
ity of
Mala
ya
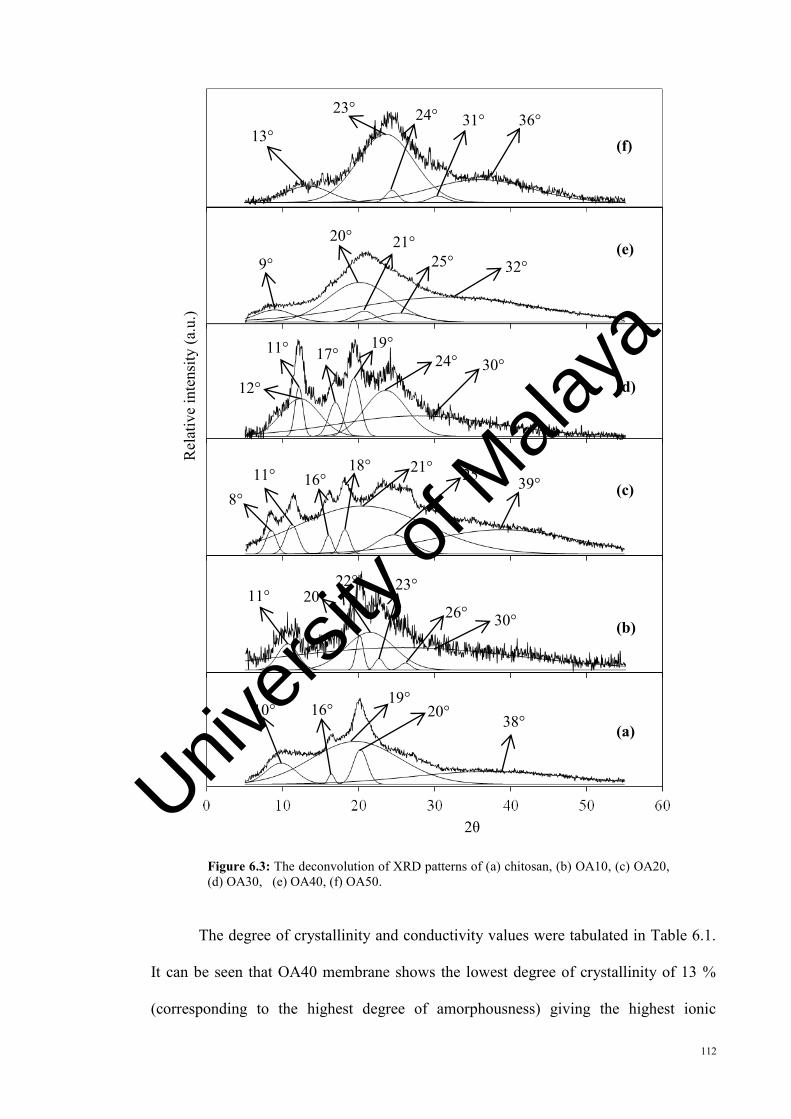
112
Figure 6.3: The deconvolution of XRD patterns of (a) chitosan, (b) OA10, (c) OA20, (d) OA30, (e) OA40, (f) OA50.
The degree of crystallinity and conductivity values were tabulated in Table 6.1.
It can be seen that OA40 membrane shows the lowest degree of crystallinity of 13 %
(corresponding to the highest degree of amorphousness) giving the highest ionic
Rel
ativ
e in
tens
ity (a
.u.)
38° 20° 19°
16° 10°
30° 26°
23° 22° 20° 11°
18° 11° 8°
21° 16° 39° 25°
30° 24° 19°
17° 11°
12°
32° 25° 21° 20°
9°
36° 31° 24° 23°
13°
2θ
(f)
(e)
(d)
(c)
(b)
(a)
Univers
ity of
Mala
ya
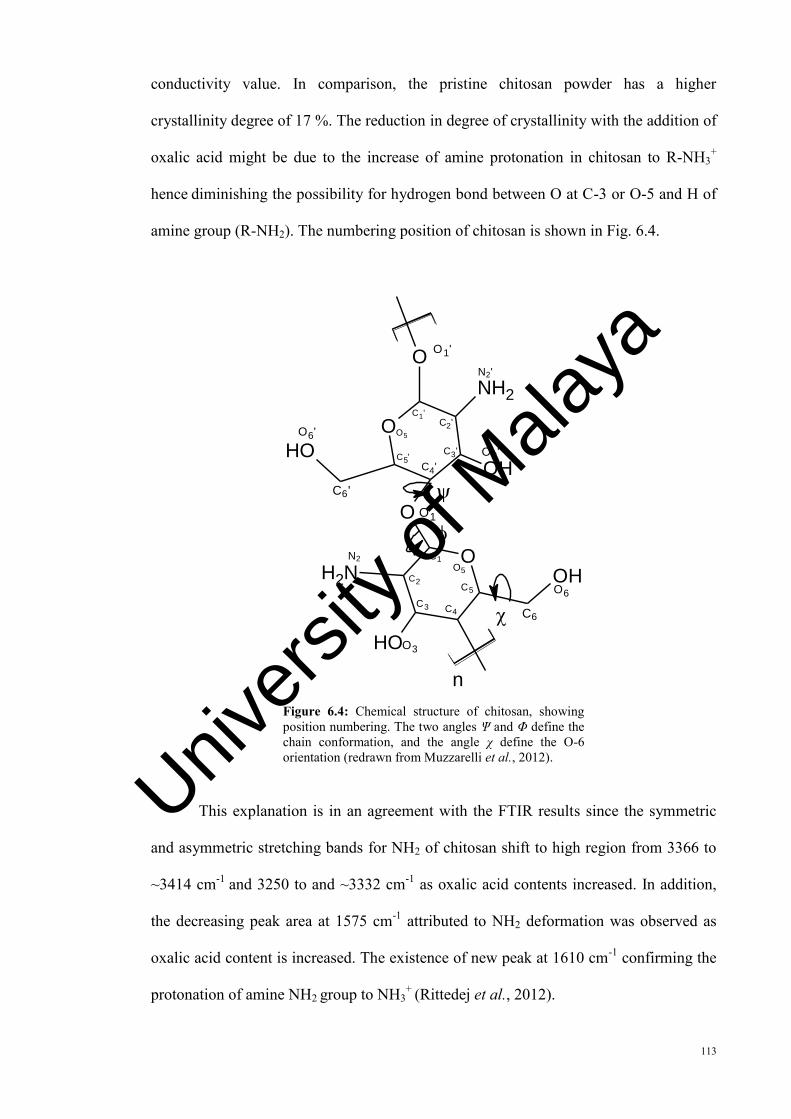
113
conductivity value. In comparison, the pristine chitosan powder has a higher
crystallinity degree of 17 %. The reduction in degree of crystallinity with the addition of
oxalic acid might be due to the increase of amine protonation in chitosan to R-NH3+
hence diminishing the possibility for hydrogen bond between O at C-3 or O-5 and H of
amine group (R-NH2). The numbering position of chitosan is shown in Fig. 6.4.
O
O
O
OH
OH
OH
OH
NH2
O
NH2
C6'
C5'
O5O6'
C1'
O1'
N2'
C3' O3'
O1
C4'
C2'
O5
C5
C4C3
C2
C1
C6
O6
O3
N2
n Figure 6.4: Chemical structure of chitosan, showing position numbering. The two angles Ψ and Φ define the chain conformation, and the angle χ define the O-6 orientation (redrawn from Muzzarelli et al., 2012).
This explanation is in an agreement with the FTIR results since the symmetric
and asymmetric stretching bands for NH2 of chitosan shift to high region from 3366 to
~3414 cm-1 and 3250 to and ~3332 cm-1 as oxalic acid contents increased. In addition,
the decreasing peak area at 1575 cm-1 attributed to NH2 deformation was observed as
oxalic acid content is increased. The existence of new peak at 1610 cm-1 confirming the
protonation of amine NH2 group to NH3+ (Rittedej et al., 2012).
Univers
ity of
Mala
ya
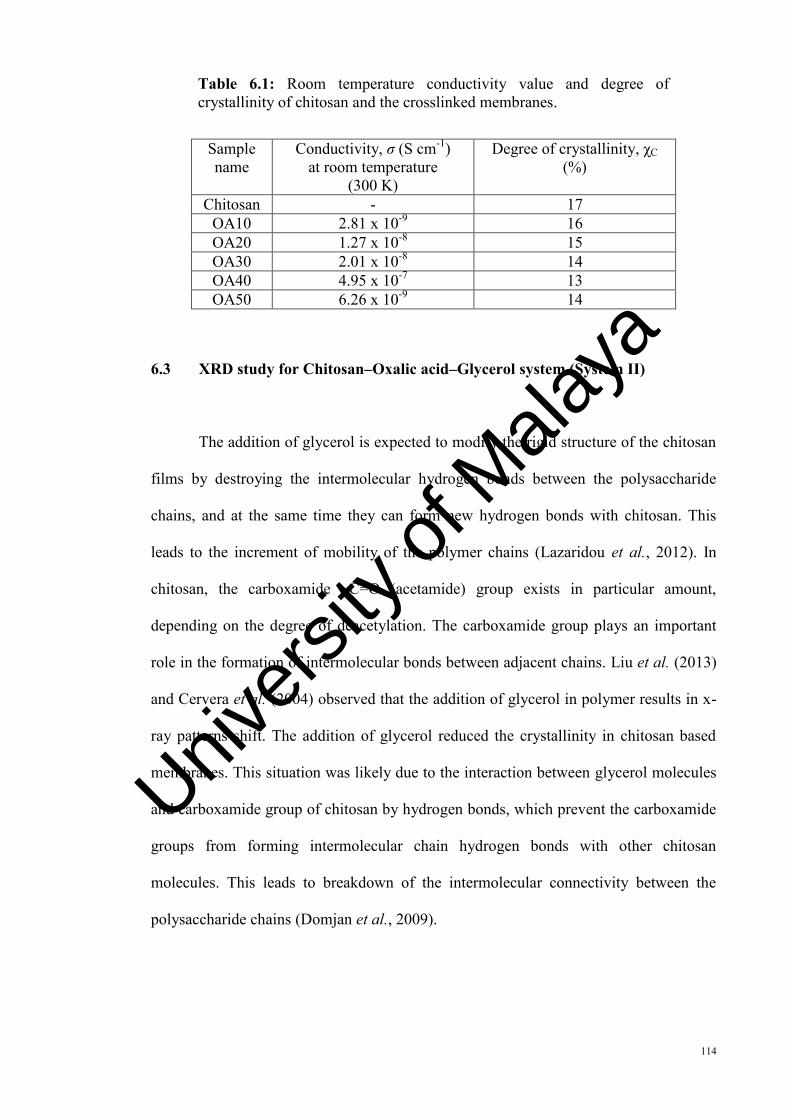
114
Table 6.1: Room temperature conductivity value and degree of crystallinity of chitosan and the crosslinked membranes.
Sample name
Conductivity, σ (S cm-1) at room temperature
(300 K)
Degree of crystallinity, χC (%)
Chitosan - 17 OA10 2.81 x 10⁻⁹ 16 OA20 1.27 x 10⁻⁸ 15 OA30 2.01 x 10⁻⁸ 14 OA40 4.95 x 10⁻⁷ 13 OA50 6.26 x 10⁻⁹ 14
6.3 XRD study for Chitosan–Oxalic acid–Glycerol system (System II)
The addition of glycerol is expected to modify the rigid structure of the chitosan
films by destroying the intermolecular hydrogen bonds between the polysaccharide
chains, and at the same time they can form new hydrogen bonds with chitosan. This
leads to the increment of mobility of the polymer chains (Lazaridou et al., 2012). In
chitosan, the carboxamide –C=O (acetamide) group exists in particular amount,
depending on the degree of deacetylation. The carboxamide group plays an important
role in the formation of intermolecular bonds between adjacent chains. Liu et al. (2013)
and Cervera et al. (2004) observed that the addition of glycerol in polymer results in x-
ray patterns shift. The addition of glycerol reduced the crystallinity in chitosan based
membranes. This situation was likely due to the interaction between glycerol molecules
and carboxamide group of chitosan by hydrogen bonds, which prevent the carboxamide
groups from forming intermolecular chain hydrogen bonds with other chitosan
molecules. This leads to breakdown of the intermolecular connectivity between the
polysaccharide chains (Domjan et al., 2009).
Univers
ity of
Mala
ya
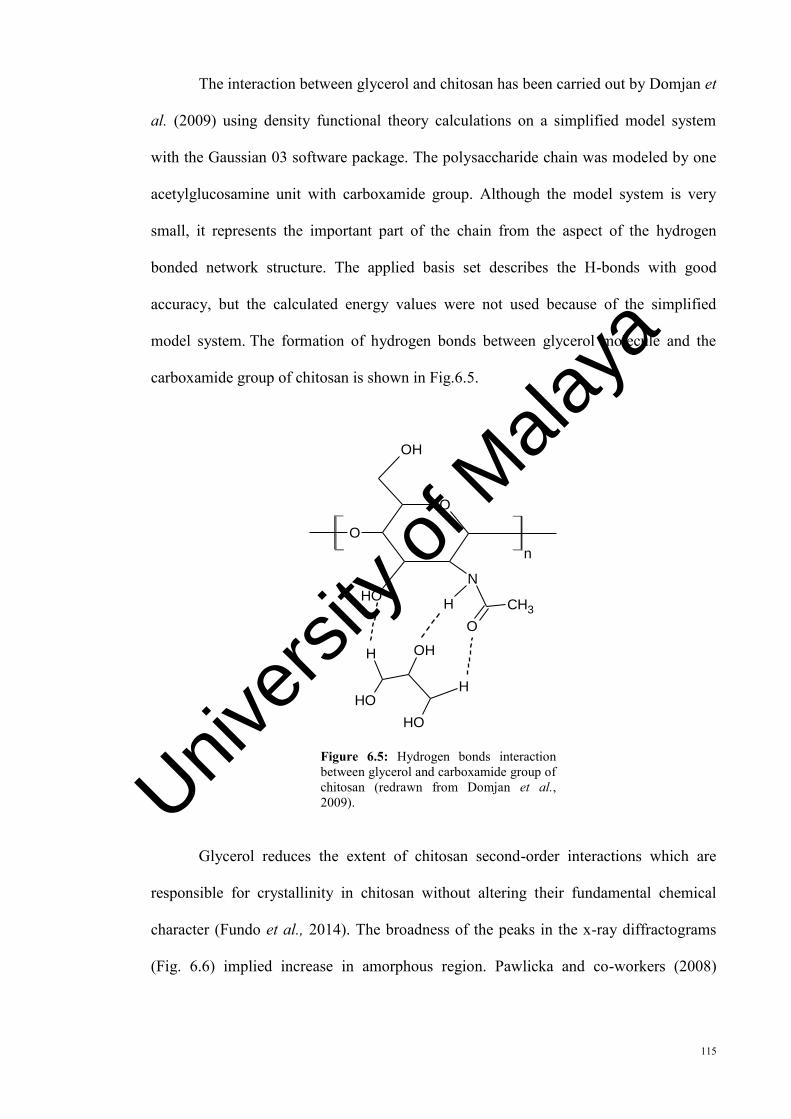
115
The interaction between glycerol and chitosan has been carried out by Domjan et
al. (2009) using density functional theory calculations on a simplified model system
with the Gaussian 03 software package. The polysaccharide chain was modeled by one
acetylglucosamine unit with carboxamide group. Although the model system is very
small, it represents the important part of the chain from the aspect of the hydrogen
bonded network structure. The applied basis set describes the H-bonds with good
accuracy, but the calculated energy values were not used because of the simplified
model system. The formation of hydrogen bonds between glycerol molecule and the
carboxamide group of chitosan is shown in Fig.6.5.
O
OH
OHN
CH3O
O
H
n
H
HOH
OH
OH
Figure 6.5: Hydrogen bonds interaction between glycerol and carboxamide group of chitosan (redrawn from Domjan et al., 2009).
Glycerol reduces the extent of chitosan second-order interactions which are
responsible for crystallinity in chitosan without altering their fundamental chemical
character (Fundo et al., 2014). The broadness of the peaks in the x-ray diffractograms
(Fig. 6.6) implied increase in amorphous region. Pawlicka and co-workers (2008)
Univers
ity of
Mala
ya
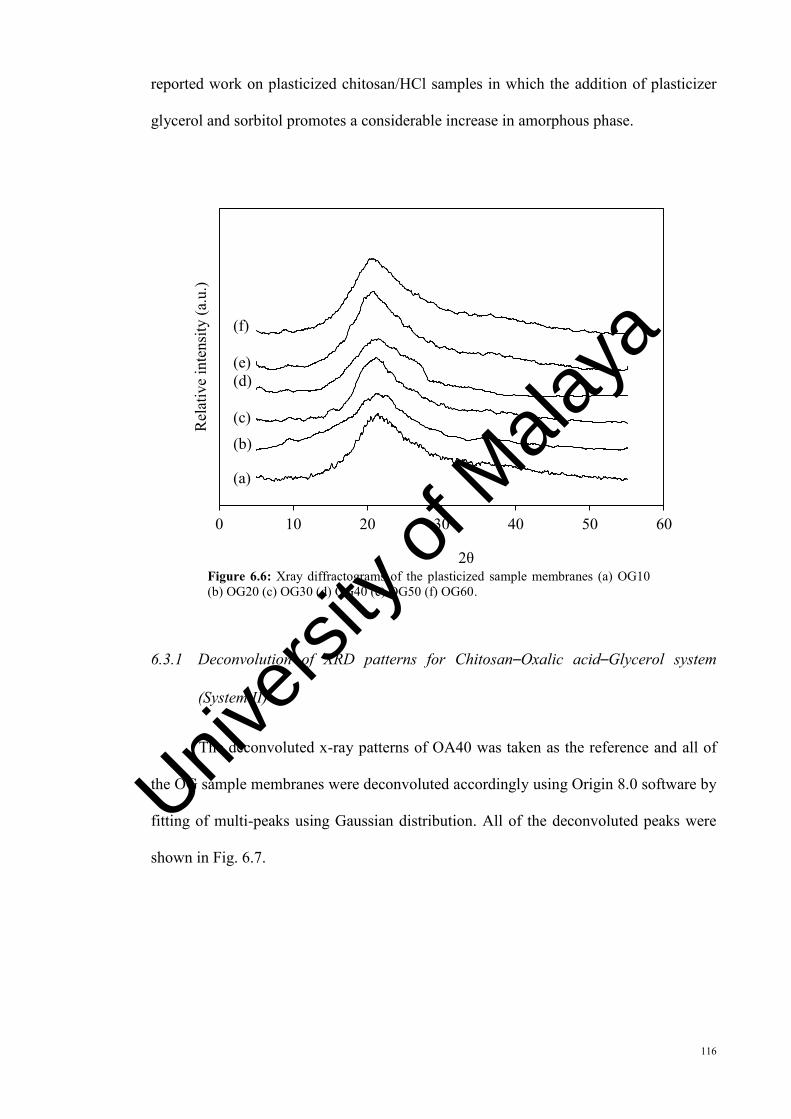
116
reported work on plasticized chitosan/HCl samples in which the addition of plasticizer
glycerol and sorbitol promotes a considerable increase in amorphous phase.
Figure 6.6: Xray diffractograms of the plasticized sample membranes (a) OG10 (b) OG20 (c) OG30 (d) OG40 (e) OG50 (f) OG60.
6.3.1 Deconvolution of XRD patterns for Chitosan–Oxalic acid–Glycerol system
(System II)
The deconvoluted x-ray patterns of OA40 was taken as the reference and all of
the OG sample membranes were deconvoluted accordingly using Origin 8.0 software by
fitting of multi-peaks using Gaussian distribution. All of the deconvoluted peaks were
shown in Fig. 6.7.
0 10 20 30 40 50 60
Rel
ativ
e in
tens
ity (a
.u.)
2θ
(f) (e) (d) (c)
(b)
(a)
Univers
ity of
Mala
ya
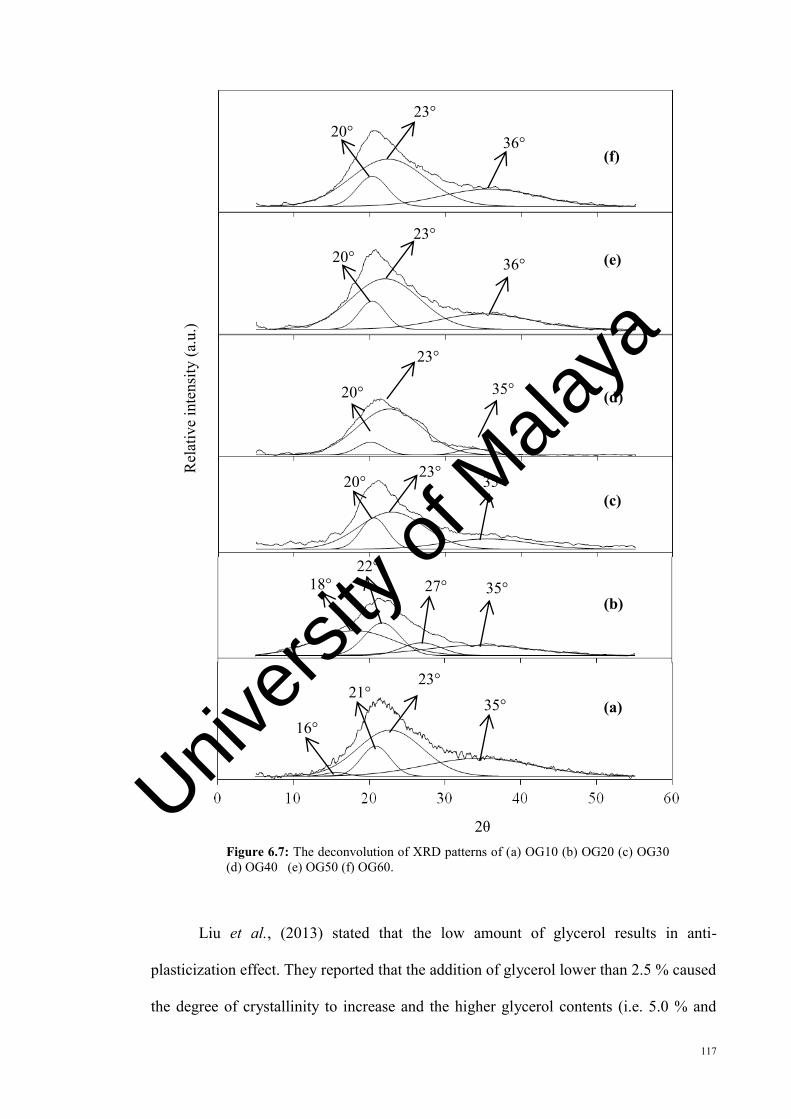
117
Figure 6.7: The deconvolution of XRD patterns of (a) OG10 (b) OG20 (c) OG30 (d) OG40 (e) OG50 (f) OG60.
Liu et al., (2013) stated that the low amount of glycerol results in anti-
plasticization effect. They reported that the addition of glycerol lower than 2.5 % caused
the degree of crystallinity to increase and the higher glycerol contents (i.e. 5.0 % and
Rel
ativ
e in
tens
ity (a
.u.)
(a.u
.)
(f)
(e)
(d)
(c)
(b)
(a)
22° 35° 27° 18°
20° 23° 35°
36°
23° 20°
23° 20°
36°
35°
23°
20°
35° 23°
21°
16°
2θ Univers
ity of
Mala
ya
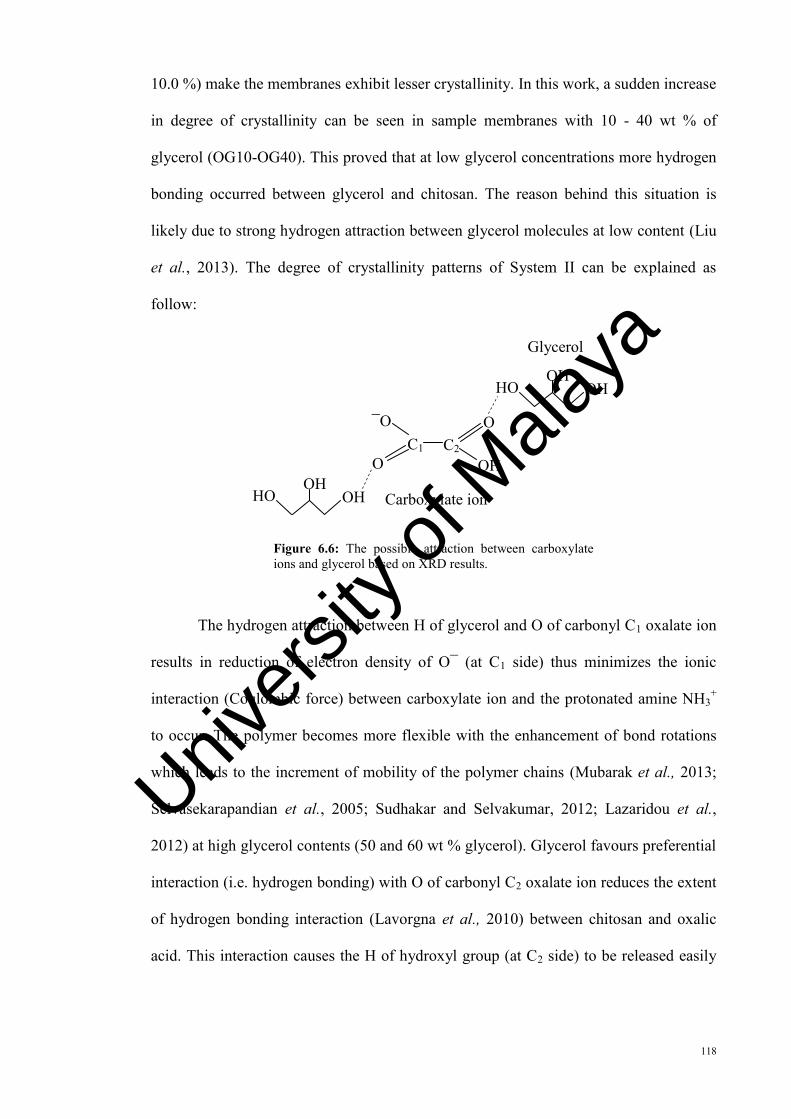
118
10.0 %) make the membranes exhibit lesser crystallinity. In this work, a sudden increase
in degree of crystallinity can be seen in sample membranes with 10 - 40 wt % of
glycerol (OG10-OG40). This proved that at low glycerol concentrations more hydrogen
bonding occurred between glycerol and chitosan. The reason behind this situation is
likely due to strong hydrogen attraction between glycerol molecules at low content (Liu
et al., 2013). The degree of crystallinity patterns of System II can be explained as
follow:
Figure 6.6: The possible attraction between carboxylate ions and glycerol based on XRD results.
The hydrogen attraction between H of glycerol and O of carbonyl C1 oxalate ion
results in reduction of electron density of O¯ (at C1 side) thus minimizes the ionic
interaction (Coulombic force) between carboxylate ion and the protonated amine NH3+
to occur. The polymer becomes more flexible with the enhancement of bond rotations
which leads to the increment of mobility of the polymer chains (Mubarak et al., 2013;
Selvasekarapandian et al., 2005; Sudhakar and Selvakumar, 2012; Lazaridou et al.,
2012) at high glycerol contents (50 and 60 wt % glycerol). Glycerol favours preferential
interaction (i.e. hydrogen bonding) with O of carbonyl C2 oxalate ion reduces the extent
of hydrogen bonding interaction (Lavorgna et al., 2010) between chitosan and oxalic
acid. This interaction causes the H of hydroxyl group (at C2 side) to be released easily
OH OH
HO
C1 C2 O
O OH
¯O
Carboxylate ion OH OH
HO
Glycerol
Univers
ity of
Mala
ya
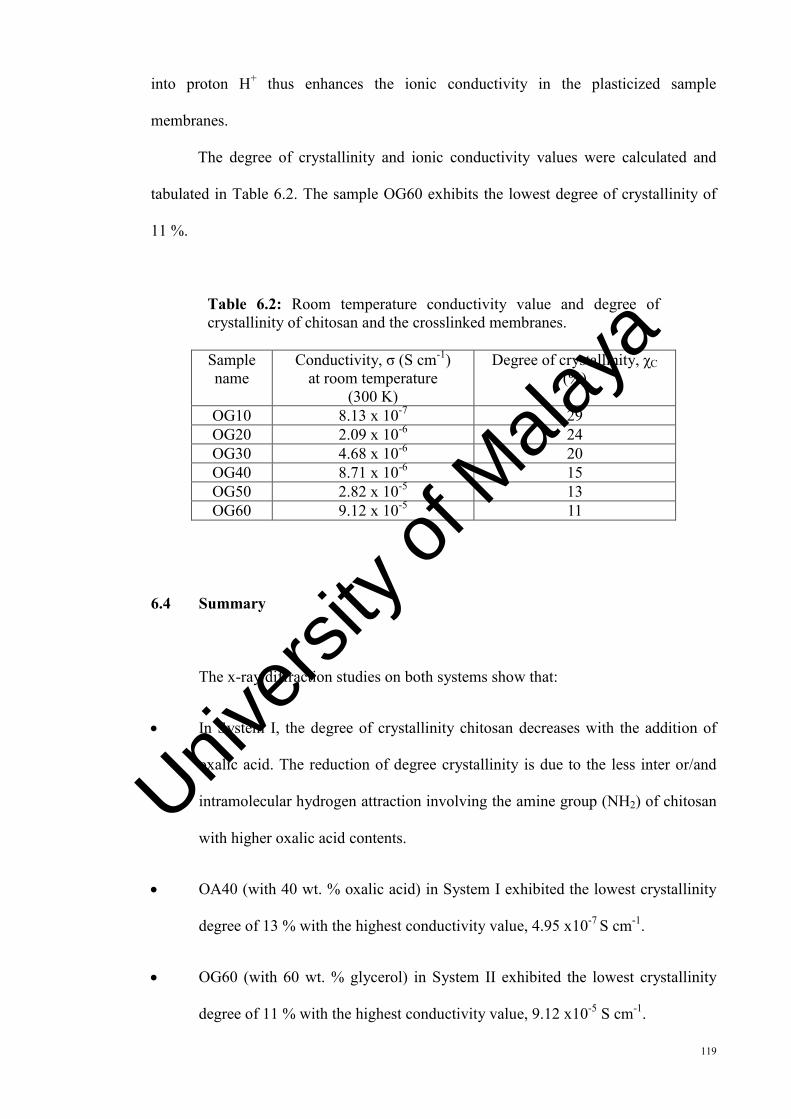
119
into proton H+ thus enhances the ionic conductivity in the plasticized sample
membranes.
The degree of crystallinity and ionic conductivity values were calculated and
tabulated in Table 6.2. The sample OG60 exhibits the lowest degree of crystallinity of
11 %.
Table 6.2: Room temperature conductivity value and degree of crystallinity of chitosan and the crosslinked membranes. Sample name
Conductivity, σ (S cm-1) at room temperature
(300 K)
Degree of crystallinity, χC (%)
OG10 8.13 x 10⁻⁷ 29 OG20 2.09 x 10⁻⁶ 24 OG30 4.68 x 10⁻⁶ 20 OG40 8.71 x 10⁻⁶ 15 OG50 2.82 x 10⁻⁵ 13 OG60 9.12 x 10⁻⁵ 11
6.4 Summary
The x-ray diffraction studies on both systems show that:
In System I, the degree of crystallinity chitosan decreases with the addition of
oxalic acid. The reduction of degree crystallinity is due to the less inter or/and
intramolecular hydrogen attraction involving the amine group (NH2) of chitosan
with higher oxalic acid contents.
OA40 (with 40 wt. % oxalic acid) in System I exhibited the lowest crystallinity
degree of 13 % with the highest conductivity value, 4.95 x10⁻⁷ S cm-1.
OG60 (with 60 wt. % glycerol) in System II exhibited the lowest crystallinity
degree of 11 % with the highest conductivity value, 9.12 x10⁻⁵ S cm-1.
Univers
ity of
Mala
ya
120
CHAPTER 7
APPLICATION OF PLASTICIZED POLYMER ELECTROLYTE IN
ELECTRICAL DOUBLE LAYER CAPACITOR
7.1 Introduction
A battery differs from a capacitor in terms of electrical energy storage; an
indirect storage in batteries happens as potentially available chemical energy requiring
faradaic oxidation and reduction of an electroactive reagent to release charges that can
perform electrical work when they flow between two electrodes having different
electrode potentials. Direct energy storage is defined as an electrostatic way with
negative and positive charges on the plates of a capacitor by a process termed as non-
faradaic electrical energy storage (Sukhla et al., 2000). Supercapacitors or
electrochemical capacitors are electrochemical energy storage devices suited ideally to
rapid storage and release of energy can be classified as redox supercapacitor and
electrical double layer capacitor (EDLC) based on their modes of energy storage (Ji et
al., 2010).
The redox supercapacitor sustains a Faradaic reaction between the electrode and
the electrolyte in a suitable potential window. The electrode material in this type of
device consists of either transition metal oxides or mixture of carbon and metal
oxides/polymers. An EDLC stores electric charge in the electric double layer which is
formed at the interface between carbon electrodes and the electrolyte when a dc voltage
is applied. The major constituent used in the electrodes of EDLC is carbonaceous
Univers
ity of
Mala
ya
121
material (Jayalakshmi and Balasubramaniam et al., 2008; Chanderasekaran et al.,
2010). A pair of polarizable electrodes with collector, a separator, and an electrolyte are
the main features in EDLC. The electrical energy stored in the EDLC is discharged at
loads (Nomoto et al., 2001). EDLC fills the gap between batteries and conventional
capacitors since EDLC can store more energy than the conventional capacitors and
offers higher power density than the batteries (Jayalakshmi and Balasubramaniam,
2008). EDLC is used in various power and energy applications such as load-levelling,
back-up power sources for electronic devices, engine start or acceleration for hybrid
vehicles and electricity storage generated from solar or wind energy (Nomoto et al.,
2001; Sharma & Bhatti, 2010). Although the energy density of EDLC is much lower
than the rechargeable batteries, EDLCs have stable charge-discharge performance in a
wide temperature range, higher power density and able to deliver much higher power
during 1 to 10 s provided the equivalent series resistance, Rs is small enough (Lassègues
et al., 1995; Nomoto et al., 2001).
In this chapter, the highest conducting plasticized electrolyte has been used as an
electrolyte in the fabrication of an EDLC using porous carbon electrodes. The linear
sweep voltammetry (LSV) of the electrolyte membrane is a crucial step for determining
the stable potential range for further EDLC characterization. The fabricated EDLC was
characterized using cyclic voltammetry (CV) and galvanostatic charge-discharge
cycling in order to determine the specific capacitance (Cs), cyclic durability, maximum
energy and power.
Univers
ity of
Mala
ya
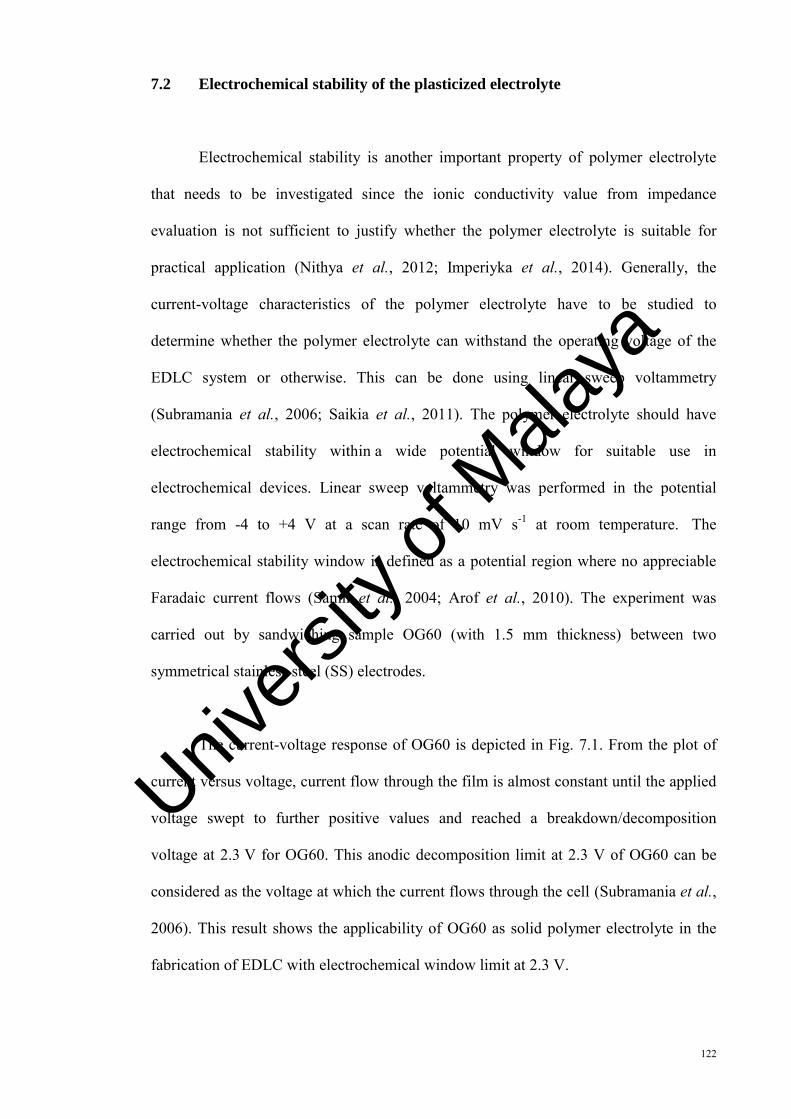
122
7.2 Electrochemical stability of the plasticized electrolyte
Electrochemical stability is another important property of polymer electrolyte
that needs to be investigated since the ionic conductivity value from impedance
evaluation is not sufficient to justify whether the polymer electrolyte is suitable for
practical application (Nithya et al., 2012; Imperiyka et al., 2014). Generally, the
current-voltage characteristics of the polymer electrolyte have to be studied to
determine whether the polymer electrolyte can withstand the operating voltage of the
EDLC system or otherwise. This can be done using linear sweep voltammetry
(Subramania et al., 2006; Saikia et al., 2011). The polymer electrolyte should have
electrochemical stability within a wide potential window for suitable use in
electrochemical devices. Linear sweep voltammetry was performed in the potential
range from -4 to +4 V at a scan rate of 10 mV s-1 at room temperature. The
electrochemical stability window is defined as a potential region where no appreciable
Faradaic current flows (Samir et al., 2004; Arof et al., 2010). The experiment was
carried out by sandwiching sample OG60 (with 1.5 mm thickness) between two
symmetrical stainless steel (SS) electrodes.
The current-voltage response of OG60 is depicted in Fig. 7.1. From the plot of
current versus voltage, current flow through the film is almost constant until the applied
voltage swept to further positive values and reached a breakdown/decomposition
voltage at 2.3 V for OG60. This anodic decomposition limit at 2.3 V of OG60 can be
considered as the voltage at which the current flows through the cell (Subramania et al.,
2006). This result shows the applicability of OG60 as solid polymer electrolyte in the
fabrication of EDLC with electrochemical window limit at 2.3 V.
Univers
ity of
Mala
ya
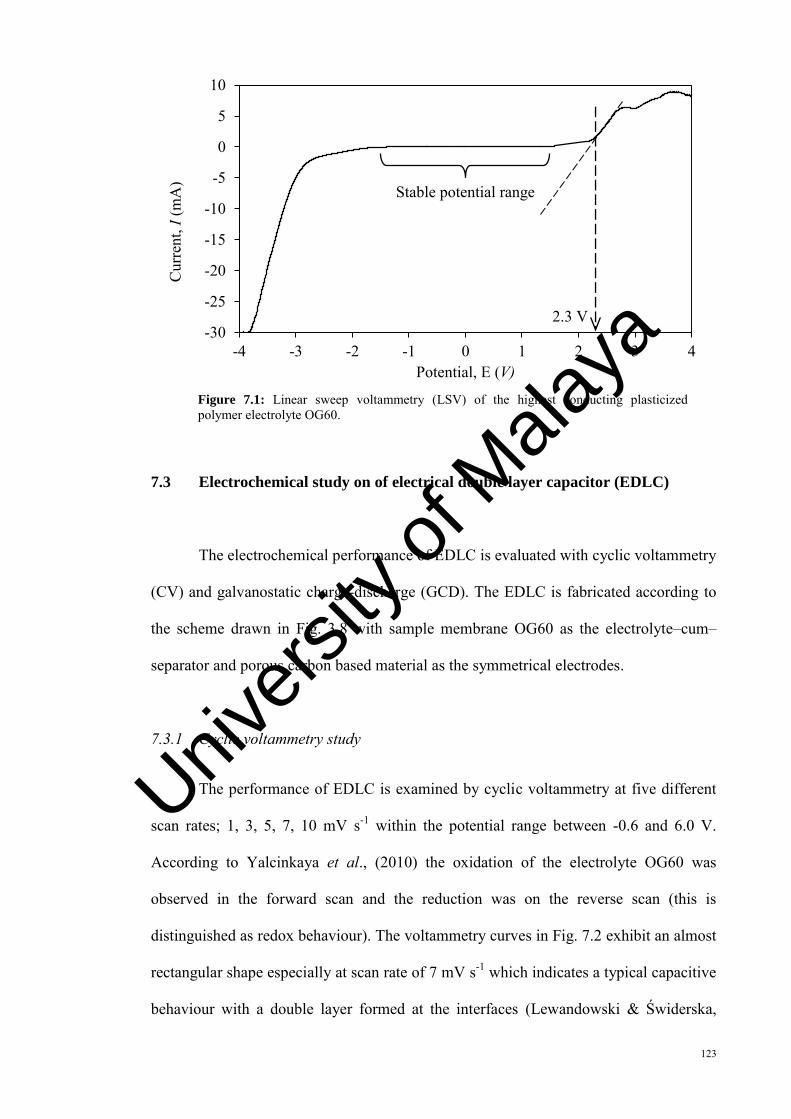
123
Figure 7.1: Linear sweep voltammetry (LSV) of the highest conducting plasticized polymer electrolyte OG60.
7.3 Electrochemical study on of electrical double layer capacitor (EDLC)
The electrochemical performance of EDLC is evaluated with cyclic voltammetry
(CV) and galvanostatic charge-discharge (GCD). The EDLC is fabricated according to
the scheme drawn in Fig. 3.8 with sample membrane OG60 as the electrolyte–cum–
separator and porous carbon based material as the symmetrical electrodes.
7.3.1 Cyclic voltammetry study
The performance of EDLC is examined by cyclic voltammetry at five different
scan rates; 1, 3, 5, 7, 10 mV s-1 within the potential range between -0.6 and 6.0 V.
According to Yalcinkaya et al., (2010) the oxidation of the electrolyte OG60 was
observed in the forward scan and the reduction was on the reverse scan (this is
distinguished as redox behaviour). The voltammetry curves in Fig. 7.2 exhibit an almost
rectangular shape especially at scan rate of 7 mV s-1 which indicates a typical capacitive
behaviour with a double layer formed at the interfaces (Lewandowski & Świderska,
-30
-25
-20
-15
-10
-5
0
5
10
-4 -3 -2 -1 0 1 2 3 4
Cur
rent
, I (m
A)
Potential, E (V)
Stable potential range
2.3 V
Univers
ity of
Mala
ya
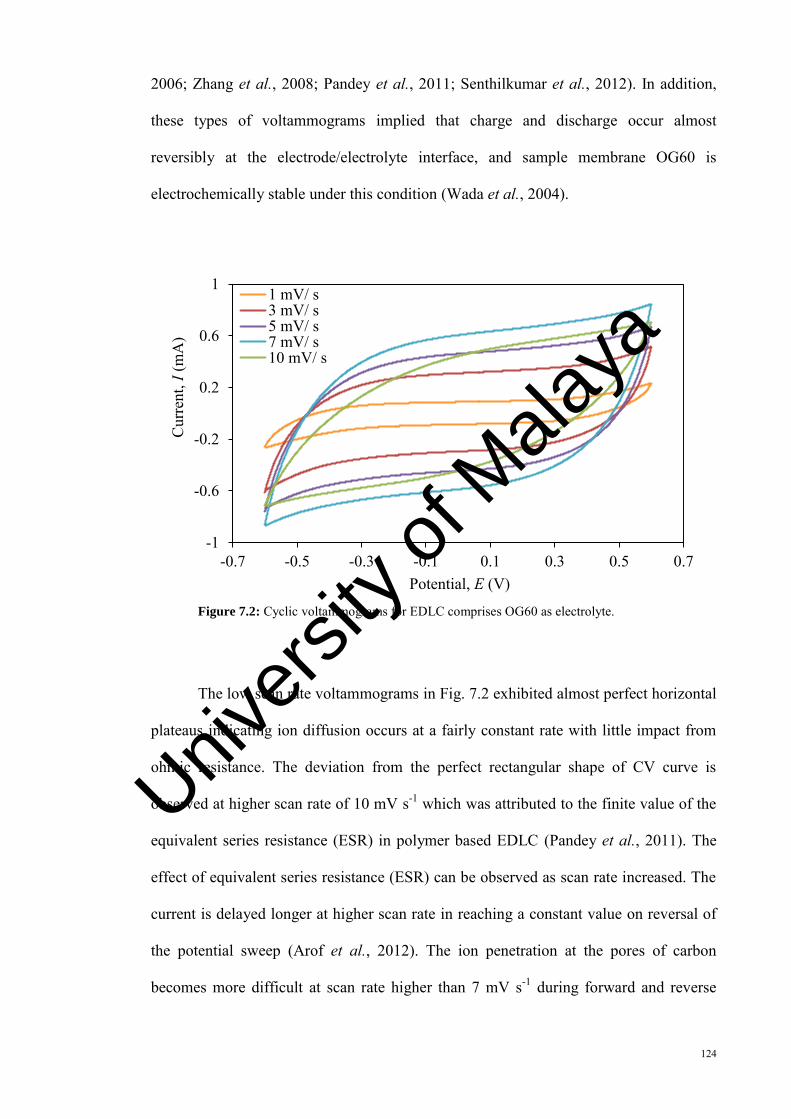
124
2006; Zhang et al., 2008; Pandey et al., 2011; Senthilkumar et al., 2012). In addition,
these types of voltammograms implied that charge and discharge occur almost
reversibly at the electrode/electrolyte interface, and sample membrane OG60 is
electrochemically stable under this condition (Wada et al., 2004).
Figure 7.2: Cyclic voltammograms for EDLC comprises OG60 as electrolyte.
The low scan rate voltammograms in Fig. 7.2 exhibited almost perfect horizontal
plateaus indicating ion diffusion occurs at a fairly constant rate with little impact from
ohmic resistance. The deviation from the perfect rectangular shape of CV curve is
observed at higher scan rate of 10 mV s-1 which was attributed to the finite value of the
equivalent series resistance (ESR) in polymer based EDLC (Pandey et al., 2011). The
effect of equivalent series resistance (ESR) can be observed as scan rate increased. The
current is delayed longer at higher scan rate in reaching a constant value on reversal of
the potential sweep (Arof et al., 2012). The ion penetration at the pores of carbon
becomes more difficult at scan rate higher than 7 mV s-1 during forward and reverse
-1
-0.6
-0.2
0.2
0.6
1
-0.7 -0.5 -0.3 -0.1 0.1 0.3 0.5 0.7
Cur
rent
, I (m
A)
Potential, E (V)
1 mV/ s3 mV/ s5 mV/ s7 mV/ s10 mV/ s
Univers
ity of
Mala
ya
125
scans due to diffusion limitation in the pores may also result in the anomaly of CV
curve from the perfect rectangular shape (Chanderasekaran et al., 2010).
The specific capacitance (Cs) value of the EDLC can be evaluated from the
respective cyclic voltammograms using the equation (Fang et al., 2012; Liew et al.,
2014):
mVICs *2
(7.1)
where Cs is the specific capacitance (F g-1), ∆I is the average current (mA) , ∆V is the
voltage scan rate (mV s-1), m is the mass per electrode.
Table 7.1: The specific capacitance, Cs value at respective scan rate.
Scan rate, mV s-1 Specific capacitance, Cs 1 6 3 5 5 4 7 3 10 2
The calculated specific capacitance, Cs shows that the lowest scan rate exhibited
the highest value as depicted in Table 7.1. The phenomenon behind the decrement of Cs
value as the scan rate is increased can be interpreted as the decrease in the capacitive
value delivered by the porous carbon electrodes (Zheng et al., 2010). It is also due to the
diffusion limitation in pores of carbon during reversal of the potential since the ion
penetration is hard to occur at higher scan rate (Chanderasekaran et al., 2010). Thus the
EDLC is dependent on scan rate, which is characteristic of capacitor cells.
Univers
ity of
Mala
ya
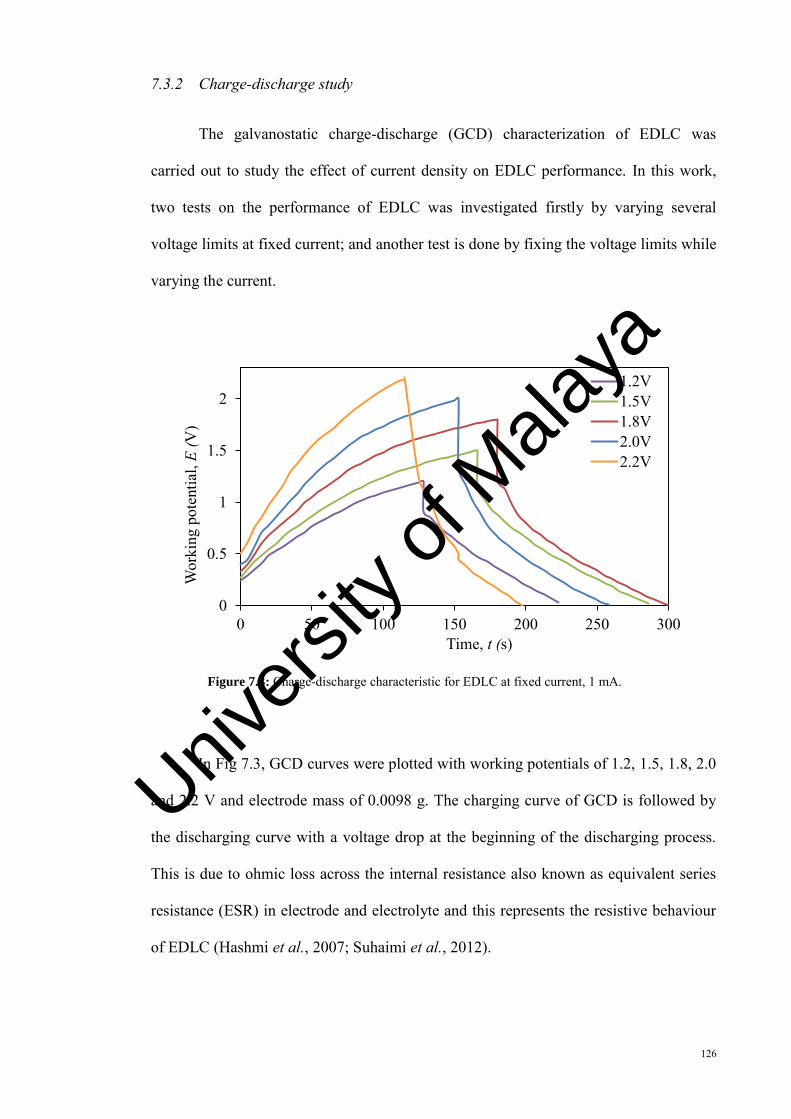
126
7.3.2 Charge-discharge study
The galvanostatic charge-discharge (GCD) characterization of EDLC was
carried out to study the effect of current density on EDLC performance. In this work,
two tests on the performance of EDLC was investigated firstly by varying several
voltage limits at fixed current; and another test is done by fixing the voltage limits while
varying the current.
Figure 7.3: Charge-discharge characteristic for EDLC at fixed current, 1 mA.
In Fig 7.3, GCD curves were plotted with working potentials of 1.2, 1.5, 1.8, 2.0
and 2.2 V and electrode mass of 0.0098 g. The charging curve of GCD is followed by
the discharging curve with a voltage drop at the beginning of the discharging process.
This is due to ohmic loss across the internal resistance also known as equivalent series
resistance (ESR) in electrode and electrolyte and this represents the resistive behaviour
of EDLC (Hashmi et al., 2007; Suhaimi et al., 2012).
0
0.5
1
1.5
2
0 50 100 150 200 250 300
Wor
king
pot
entia
l, E
(V)
Time, t (s)
1.2V1.5V1.8V2.0V2.2V
Univers
ity of
Mala
ya
127
The specific capacitance Cs (F g-1) can be calculated from the gradient of the
linear portion of the charge and discharge characteristics using equation (Suhaimi et al.,
2012):
tVm
iCs
* (7.2)
where i is the discharge current and ∆V/∆t is the gradient of the linear portion from the
discharge curve. Energy density, E (W h kg-1) delivered during the discharge was
calculated in using equation:
36001000)*(
21 2VCE s (7.3)
here Cs is the specific capacitance and ∆V is the is the potential difference. Power
density, P (W kg-1) of EDLC can be determined using equation:
1000*2
*
mViP (7.4)
where i is the discharge current, ∆V is the potential difference and m is the mass of
electrode. The calculated values of potential difference, specific capacitance Cs, energy
density E, and power density P obtained from the EDLC comprised of OG60 as the
electrolyte are listed in Table 7.2.
From Table 7.2, one can observe that the charge-discharge profile of EDLC
exhibits the highest specific capacitance Cs of 13 F g-1 at fixed current 1 mA with 1.2 V
as the working potential. However, the highest value of energy density E is 0.90 W h
kg-1 and power density P is 49 W kg-1 are shown by EDLC operated at the working
potential of 2.2 V. This shows that although EDLC deliver lower capacitance at
Univers
ity of
Mala
ya
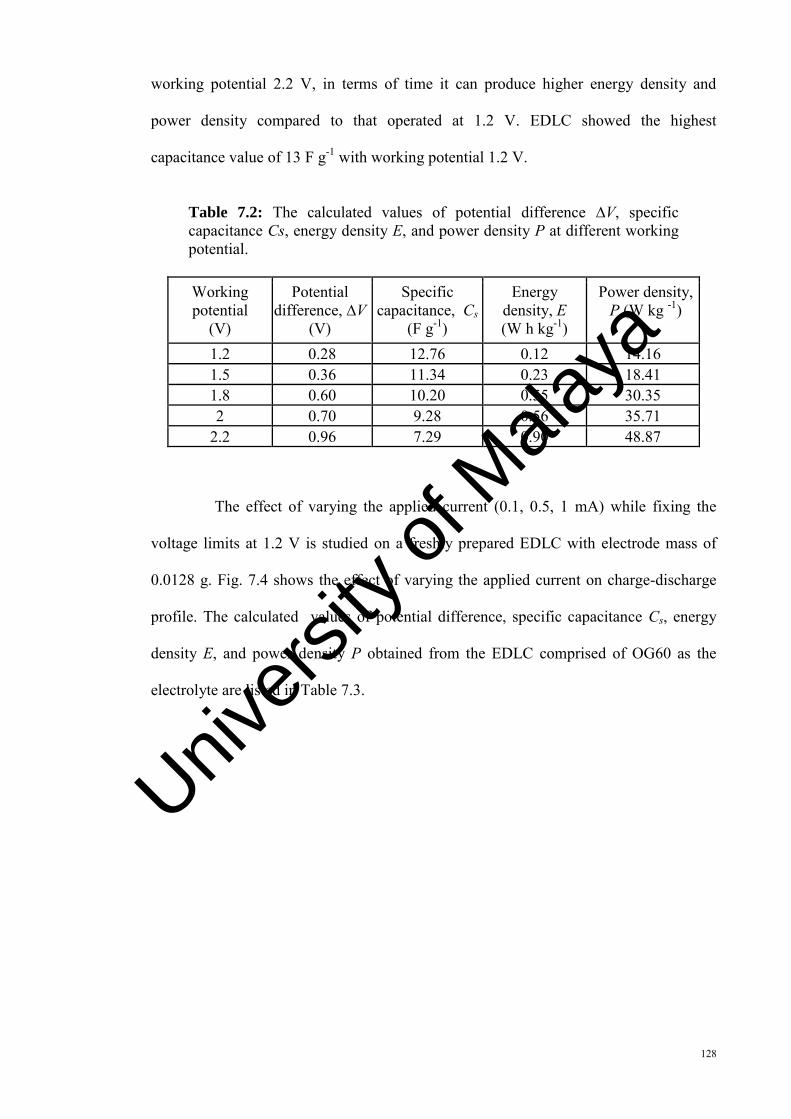
128
working potential 2.2 V, in terms of time it can produce higher energy density and
power density compared to that operated at 1.2 V. EDLC showed the highest
capacitance value of 13 F g-1 with working potential 1.2 V.
Table 7.2: The calculated values of potential difference ∆V, specific capacitance Cs, energy density E, and power density P at different working potential.
Working potential
(V)
Potential difference, ∆V
(V)
Specific capacitance, Cs
(F g-1)
Energy density, E (W h kg-1)
Power density, P (W kg -1)
1.2 0.28 12.76 0.12 14.16 1.5 0.36 11.34 0.23 18.41 1.8 0.60 10.20 0.55 30.35 2 0.70 9.28 0.56 35.71
2.2 0.96 7.29 0.90 48.87
The effect of varying the applied current (0.1, 0.5, 1 mA) while fixing the
voltage limits at 1.2 V is studied on a freshly prepared EDLC with electrode mass of
0.0128 g. Fig. 7.4 shows the effect of varying the applied current on charge-discharge
profile. The calculated values of potential difference, specific capacitance Cs, energy
density E, and power density P obtained from the EDLC comprised of OG60 as the
electrolyte are listed in Table 7.3.
Univers
ity of
Mala
ya
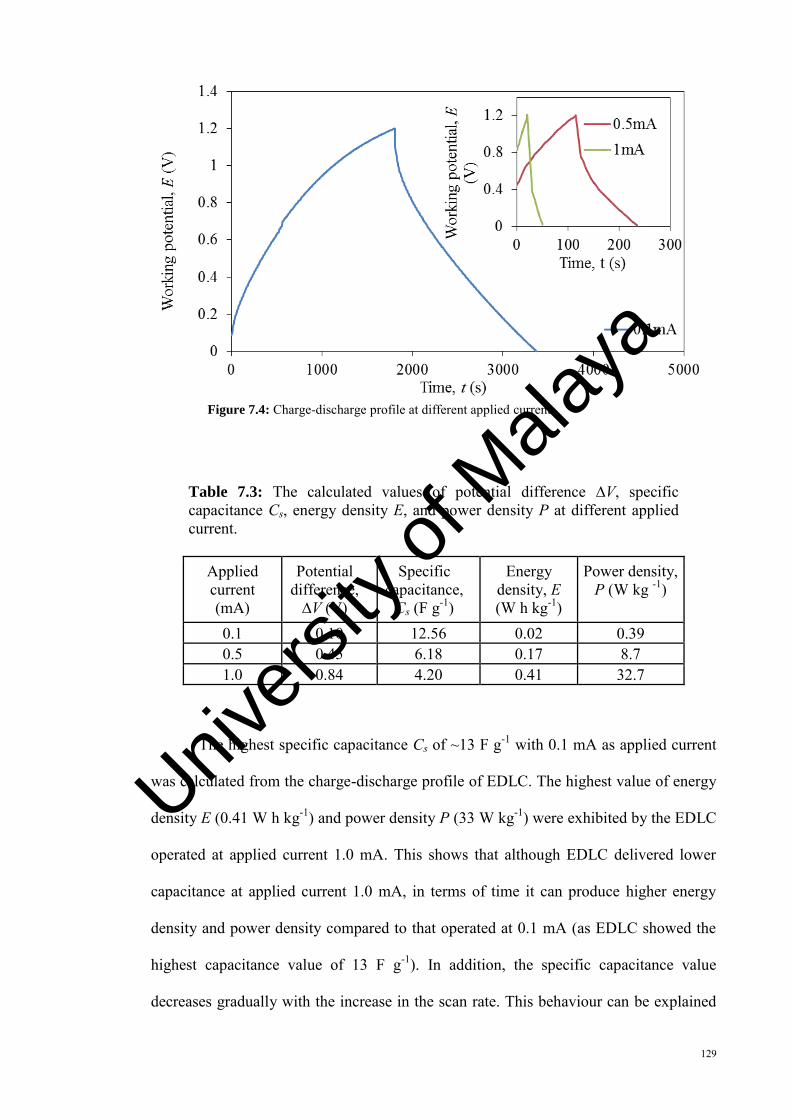
129
Figure 7.4: Charge-discharge profile at different applied current.
Table 7.3: The calculated values of potential difference ∆V, specific capacitance Cs, energy density E, and power density P at different applied current.
Applied current (mA)
Potential difference,
∆V (V)
Specific capacitance,
Cs (F g-1)
Energy density, E (W h kg-1)
Power density, P (W kg -1)
0.1 0.10 12.56 0.02 0.39 0.5 0.45 6.18 0.17 8.7 1.0 0.84 4.20 0.41 32.7
The highest specific capacitance Cs of ~13 F g-1 with 0.1 mA as applied current
was calculated from the charge-discharge profile of EDLC. The highest value of energy
density E (0.41 W h kg-1) and power density P (33 W kg-1) were exhibited by the EDLC
operated at applied current 1.0 mA. This shows that although EDLC delivered lower
capacitance at applied current 1.0 mA, in terms of time it can produce higher energy
density and power density compared to that operated at 0.1 mA (as EDLC showed the
highest capacitance value of 13 F g-1). In addition, the specific capacitance value
decreases gradually with the increase in the scan rate. This behaviour can be explained
Univers
ity of
Mala
ya
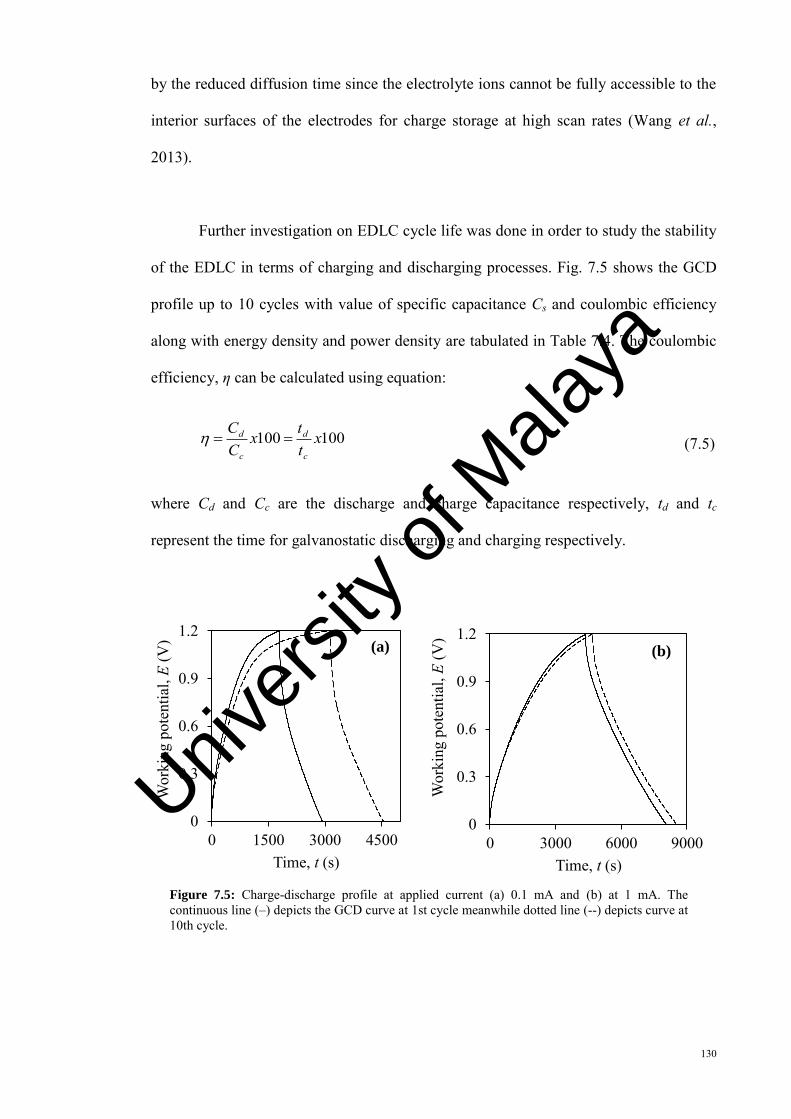
130
by the reduced diffusion time since the electrolyte ions cannot be fully accessible to the
interior surfaces of the electrodes for charge storage at high scan rates (Wang et al.,
2013).
Further investigation on EDLC cycle life was done in order to study the stability
of the EDLC in terms of charging and discharging processes. Fig. 7.5 shows the GCD
profile up to 10 cycles with value of specific capacitance Cs and coulombic efficiency
along with energy density and power density are tabulated in Table 7.4. The coulombic
efficiency, η can be calculated using equation:
100100 xttx
CC
c
d
c
d
where Cd and Cc are the discharge and charge capacitance respectively, td and tc
represent the time for galvanostatic discharging and charging respectively.
Figure 7.5: Charge-discharge profile at applied current (a) 0.1 mA and (b) at 1 mA. The continuous line (‒) depicts the GCD curve at 1st cycle meanwhile dotted line (--) depicts curve at 10th cycle.
0
0.3
0.6
0.9
1.2
0 1500 3000 4500
Wor
king
pot
entia
l, E
(V)
Time, t (s)
(a)
0
0.3
0.6
0.9
1.2
0 3000 6000 9000
Wor
king
pot
entia
l, E
(V)
Time, t (s)
(b)
(7.5)
Univers
ity of
Mala
ya
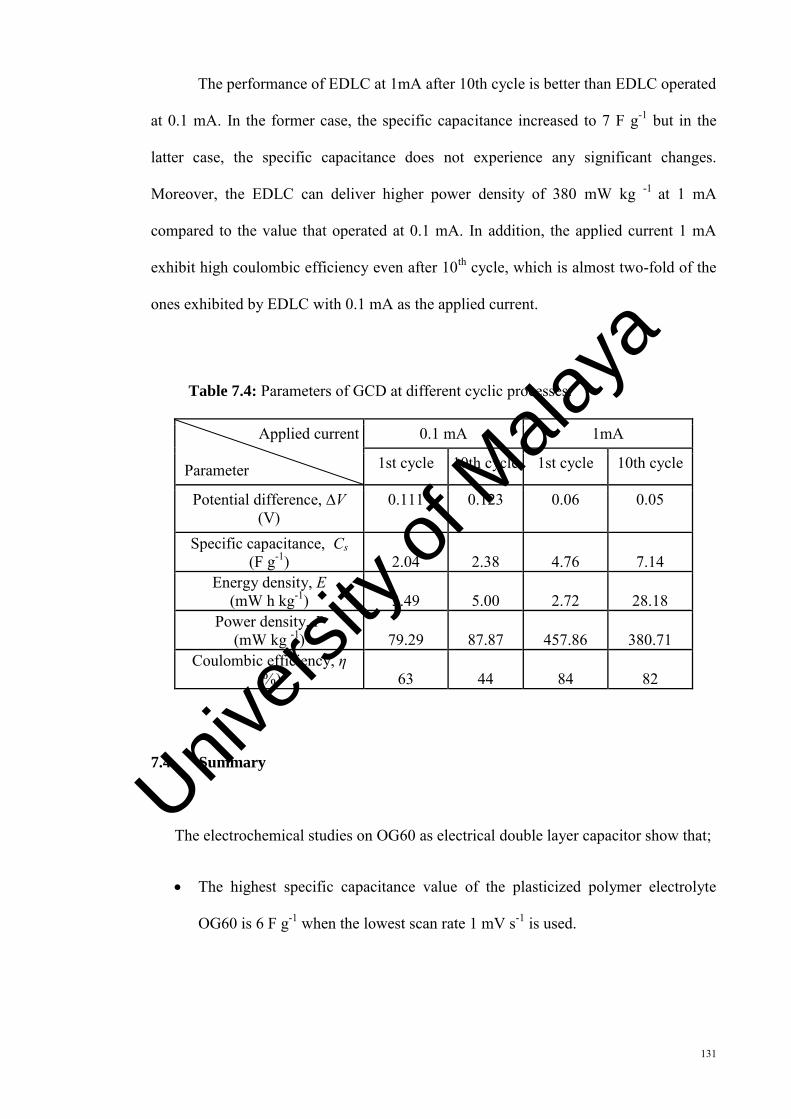
131
The performance of EDLC at 1mA after 10th cycle is better than EDLC operated
at 0.1 mA. In the former case, the specific capacitance increased to 7 F g-1 but in the
latter case, the specific capacitance does not experience any significant changes.
Moreover, the EDLC can deliver higher power density of 380 mW kg -1 at 1 mA
compared to the value that operated at 0.1 mA. In addition, the applied current 1 mA
exhibit high coulombic efficiency even after 10th cycle, which is almost two-fold of the
ones exhibited by EDLC with 0.1 mA as the applied current.
Table 7.4: Parameters of GCD at different cyclic processes.
Applied current
Parameter
0.1 mA 1mA
1st cycle 10th cycle 1st cycle 10th cycle
Potential difference, ∆V (V)
0.111 0.123 0.06 0.05
Specific capacitance, Cs (F g-1)
2.04 2.38 4.76 7.14
Energy density, E (mW h kg-1)
3.49 5.00 2.72 28.18
Power density, P (mW kg -1)
79.29 87.87 457.86 380.71
Coulombic efficiency, η (%)
63 44 84 82
7.4 Summary
The electrochemical studies on OG60 as electrical double layer capacitor show that;
The highest specific capacitance value of the plasticized polymer electrolyte
OG60 is 6 F g-1 when the lowest scan rate 1 mV s-1 is used.
Univers
ity of
Mala
ya
132
EDLC exhibits specific capacitance value of 13 F g-1 when working potential 1.2
V is used resulting 0.12 W h kg-1 and 14 W kg-1 as energy density and power
density delivered respectively at fixed current 1 mA.
When the working potential 1.2 V was fixed, the applied current 0.1 mA
produced specific capacitance of 13 F g-1 with 0.02 W h kg-1 and 0.4 W kg-1 as
energy density and power. However, the applied current 1 mA produced much
higher energy density (11 W h kg-1) and power density (33 W h kg-1).
Cyclic durability test was carried out by scanning up to 10th cycle with different
applied current and at fixed potential 1.2 V. The EDLC with applied current 1
mA exhibited a better performance after the 10th cycle as there is no significant
change in specific capacitance and coulombic efficiency.
Univers
ity of
Mala
ya
132
CHAPTER 8
DISCUSSION
Energy storage systems such as batteries and electrochemical capacitors have
started to influence a larger part in our daily activities (Simon & Gogotsi, 2008). This
has led to the increment in renewable energy production from the sun and wind, as well
as the development of electric vehicles or hybrid electric vehicles with low carbon
dioxide emission. Electrical double layer capacitors (EDLC) are one of the emerging
energy storage devices. It stores energy in the double-layer at the electrode/electrolyte
interface in a suitable potential window (Yang et al., 2005). Various types of carbon
materials with high surface area have been used for EDLCs. The porosity of carbon is
important since it influences the accessibility of electrolytes in the charge/discharge
processes as the surface of the pores is utilized for charge storage at high loading
current density. Thus, the presence of porous carbon in the electrodes efficiently
increased the transportation of ions into the active sites due to its large surface area (Li
et al., 2007).
The main drawback in the utilization of liquid electrolyte in commercial
electrochemical devices is its high flammability. To prevent possible electrolyte
leakage, metal casing is required. A separator must be placed between cathode and
anode to avoid short circuit in the cell. The weight of the container and volume
occupied by the separator decrease the specific energy of the device. The use of the
liquid electrolyte leads to problems such as production of gases upon overcharge and
thermal runway reaction when it is heated to high temperatures. Besides, large volume
of toxic and hazardous materials of the device components is also released to
Univers
ity of
Mala
ya
133
environment (Arcana et al., 2013). Replacing liquid electrolytes by solid polymer
electrolytes is useful due to easy handling (Lewandowski et al., 2001). The potential
application of solid polymer electrolytes (SPEs) in electrochemical devices is an
interesting issue due to advantages including the ease of fabrication and free of leakage
problems (Xu et al., 1998). Polymer electrolyte can be defined as any polymer-based
structure with significant ionic conductivity. The solid character of polymers is
generally related to the molecular weight of the polymer (Sequira & Santos, 2010).
In the present work, a study was made on natural chitosan polymer to
investigate its ability to host proton conduction provided by oxalic acid. The
conductivity of the chitosan-oxalic acid system was also investigated after addition
with glycerol. Chitosan is an amino polysaccharide which is chemically derived from
chitin that made the exoskeleton of crustaceans (i.e. shrimp, crab) by a chemical
process called N-deacetylation in sodium hydroxide (NaOH) solution (Muzzarelli,
1978; Lavorgna et al., 2010). This process converts the acetyl group at N of chitin into
amine group and the functional conversion results in chitosan production with
treatment time as the conversion parameter. The degree of conversion is called as
degree of deacetylation (DD) which is depends on the chemical treatment time. In
addition, the higher degree of conversion means that the acetyl group in chitin is highly
converted into amine group and DD is evaluated as a percentage (i.e. DD = 80 %).
The polyelectrolyte nature of chitosan makes it a suitable candidate as polymer
host for ionic conduction application. However, chitosan cannot dissolve in organic
solvents due to the small amount of hydrogen bonding (depending on DD) still present
in the polymer backbone even after the N-deacetylation process. The presence of two
functional groups in chitosan; hydroxyl (OH) and amine (NH2) make it susceptible to
Univers
ity of
Mala
ya
134
modifications either by chemical or physical means. Chemical modification will result
in structure changes and/or molecule conformation whereas physical modification will
change or enhance the physical properties of chitosan. In this work, since chitosan can
dissolve in dilute acids, ionic crosslinking has been made by dissolving chitosan in an
acidic medium. This is due to the proton (H+) from the dilute acid that interacted with
the amine group of chitosan and resulted in protonated amine (NH3+). This reduced the
hydrogen bonding in chitosan hence enabling it to dissolve in the acidic medium.
The classification of sample membranes in this work is divided into two
systems, namely System I (OA system) and System II (OG system). The first system is
comprised of chitosan‒oxalic acid, whereas the second one is consisted of
chitosan‒oxalic acid‒glycerol. Oxalic acid is the simplest dicarboxylic acid with high
reactivity and low dissociation constant value, pKa has been chosen as the dissolution
medium. The solid polymer electrolytes were prepared by dissolving in different
amounts (as in weight percentages) of oxalic acid. The sample membranes were kept in
a desiccator prior to use in order to minimize the moisture content. The oxalic acid was
recrystallized to minimize or eliminate the impurities and was always kept in a drying
oven.
The dissolution of oxalic acid in water produces protons that will protonate the
amine group (NH2) of chitosan into NH3+. Oxalic acid becomes a negatively charge
oxalate ion due to its proton loss. The ability of oxalic acid to undergo twice
dissociation results in the formation of negatively charged O at its both ends. The
positively charged protonated amine at two different chitosan chains will form ionic
interaction with the negatively charged oxalate ion hence forming ionic crosslinking.
The ionic crosslinking scheme was based on Gümüşoğlu et al. (2011) as shown in Fig.
Univers
ity of
Mala
ya

135
4.6. In their work, they used sulphuric acid to ionic crosslink the chitosan polymer
chains in order to lower methanol permittivity and obtain better mechanical integrity.
Impedance studies based on oxalic acid crosslinked chitosan has not been reported
elsewhere by other researchers. However other work based on ionic crosslinked
polyelectrolyte complex membrane based on chitosan and poly(acrylic acid) showed a
conductivity of ~2 x10⁻⁴ S cm-1 in its hydrated condition at 25 °C (Gümüşoğlu et al.
2011). Another work on hydrated chitosan in water with conductivity value of x10-4 S
cm-1 was reported by Wan et al. (2003). In their work, chitosan was dissolved in 1 %
acetic acid and was immersed in deionized water at room temperature for the required
time. Unfortunately, the conductivity value of the membranes in dry form exhibit ionic
conductivities between 10−10 and 10−9 S cm−1. The conductivity values reported by
Gümüşoğlu et al. (2011) and Wan et al. (2003) differ from the one studied in this work
with value of 4.95 x10⁻⁷ S cm-1. This due to the dry state of membranes in the chitosan-
oxalic acid system. The incorporation oxalic acid in chitosan is insufficient to make the
chitosan-based electrolytes useful for application in electrochemical devices. Thus it is
necessary for additives to be added in the electrolyte membranes to enhance the ionic
conductivity.
The addition of glycerol is able to interpenetrate and swell the polymer network
thus increasing the volume for proton conduction in the present work (Lewandowski et
al., 2001). The small size of glycerol enables the molecules to intersperse and
intercalate among and between polymer chains, disrupting hydrogen bonding and
spreading the chains apart, hence increases flexibility (Bourtoom, 2008). In this work,
the conductivity of chitosan-oxalic acid membrane increased with glycerol addition.
The highest conductivity value of 9.12 x10⁻⁵ S cm-1 is featured by the sample
containing 60 wt. % glycerol (OG60). Besides the conductivity value increased by two
Univers
ity of
Mala
ya
136
orders of magnitude at room temperature, the prominent change that can be seen is the
bulk resistance Rb value decreased drastically to 94 from 4560 Ω for sample OG60. The
effect of plasticizer addition in polymer electrolytes can be seen in various works. Ng
and Mohamad (2006) reported a work on ethylene carbonate plasticization in
ammonium nitrate (NH4NO3) doped chitosan. The conductivity of the chitosan-40 wt.
% NH4NO3 film at room temperature was increased by two orders of magnitude with
the addition of ethylene carbonate from ~10−4 to ~10−2 S cm−1. A polymer blend
consists of chitosan and starch as polymer host and lithium perchlorate as a dopant was
plasticized with glycerol (Sudhakar & Selvakumar, 2012). The maximum conductivity
is found to be 3.7 x10⁻⁴ S cm−1 at room temperature for 60:40 (CS/starch) with 25 wt.
% glycerol. This conductivity value is much higher compared to the sample without
glycerol plasticization which only can achieve ~10-7 S cm−1. It is therefore, the
conductivity value for the chitosan-oxalic acid-glycerol samples in this work is
comparable with the previous researches. The increase in conductivity of chitosan
based electrolyte with increasing concentration of oxalic acid and glycerol can be seen
as depicted in Fig. 4.5 and Fig. 4.20.
The impedance and dielectric properties of chitosan‒oxalic acid and
chitosan‒oxalic acid‒glycerol system were studied using electrochemical impedance
spectroscopy (EIS). Nyquist plot consists of a depressed semicircle or a depressed
semicircle with a tilted spike for chitosan‒oxalic acid system or a tilted spike for
chitosan‒oxalic acid‒ glycerol system as shown in Fig. 4.4 and Fig. 4.19. The
occurrence of the low frequency tilted spike is due to the blocking effects at the
electrode/electrolyte interface (Cui et al., 2008). The intersection of the low frequency
straight line with real impedance axis Zr for both systems with stainless steel as the
blocking electrode is found to be less than 90°. According to Karthikeyan et al. (2000),
Univers
ity of
Mala
ya
137
this behaviour could be due to the irregularities in the electrode/electrolyte interface
geometry. This condition is in contrast to the ideal capacitance which exhibits a 90°
low frequency vertical spike in impedance plot. In this work, it was observed that the
bulk resistance Rb is decreasing with the increasing amount of oxalic acid which led to
the increase in conductivity. Same trend was also observed with the addition of
glycerol in the chitosan‒oxalic acid electrolytes.
The rise in operating temperature results in decrement of Rb for chitosan-oxalic
acid membranes and chitosan-oxalic acid-glycerol membranes as seen in Fig. 4.7 and
Fig. 4.22 respectively. The behaviour implies that the conductivity of the electrolyte is
improved as the temperature is raised. This shows that the ionic mobility is a thermally
activated process (Sekhar et al., 2013). The activation energy EA for the highest
conducting membranes of each System I and II were obtained from the gradient of the
plot of log σ versus 1000/T as shown in Fig. 4.8 and Fig. 4.23. The highest room
temperature conducting samples OA40 and OG60 exhibit a linear line obeying
Arrhenius expression with regression value, R2 were approaching to 1. The linear
relation implied that there is no phase transition in the polymer matrix or the domain
formed with the addition of oxalic acid and glycerol. The calculated activation energy
EA for sample OA40 and OG60 are 0.61 and 0.30 eV respectively. During thermal
application, the polymer chain acquires faster internal modes which results in bond
vibration, favouring inter-chain and intra-chain ion hopping movements and local
structure relaxations that increased the conductivity of the polymer electrolyte
(Selvasekarapandian et al., 2005; Sudhakar & Selvakumar, 2012). The low activation
energy values of these electrolytes suggest that there is relatively fast hopping
mechanism for the ions, which is because of the thermally activated mobile protons
(Sengwa et al., 2014).
Univers
ity of
Mala
ya
138
A study on dielectric constant value for both systems was carried out in order to
measure the stored charge (Winie & Arof, 2004). An increased value in dielectric at
high frequency region implied that the number of free ions is greater along with the
reduction of coulombic interaction between ions. The dielectric constant value of OA40
increased from 7.44 to 18.41 with addition of 60 wt. % glycerol (OG60) which
indicates that the ion dissociation was assisted by the plasticizer addition. In addition,
this dielectric constant values was in an agreement with the values of ionic
conductivity. A further investigation of dipole relaxation in the polymer electrolytes
was also carried out by calculating the relaxation parameter (Aziz et al., 2012). The
best relaxation time τ obtained for System I is 5.27 x 10⁻⁵ s was shown by OA40,
whereas OG60 exhibits a shorter relaxation time of 3.98 x 10⁻⁶ s in System II. The
values of relaxation time were observed to decrease further with the addition of
glycerol in the chitosan‒oxalic acid system hence, resulting in the increment of ionic
conductivity. In addition, the activation energy for relaxation EB for sample OA40 in
System I is calculated to be 0.61 eV which is similar to the Arrhenius activation energy
EA. From the similarities of these values, a conclusion can be made that the ion
transportation occurs through hopping mechanism while relaxing as well as while
conducting in the chitosan‒oxalic acid system (Sengwa et al., 2014).
The interaction between chitosan, oxalic acid and glycerol were investigated by
evaluating the transmission of Fourier Transform Infrared (FTIR) spectra. The changes
in the spectra such as peak shifting and intensity along with presence of a new peak can
determine the types of interaction that occurred in the polymer electrolytes. The
protonation of amine group (NH2) to NH3+ in chitosan occurred as the oxalic acid
content is increased hence resulted in the presence of new peaks NH3+ at 1610-1615
Univers
ity of
Mala
ya
139
cm-1 and COO- at1724 cm-1. The specific region of FTIR spectra was further
investigated in order to study the effect on hydroxyl and amine group of chitosan with
increasing of oxalic acid content by deconvolution method utilizing the Gaussian-
Lorentzian function and the area of the deconvoluted bands were calculated using the
OMNIC software. The area under the deconvoluted peaks for protonated amine, NH3+
was observed to increase proportionally with oxalic acid content. On the contrary, the
area under the deconvoluted NH2 peak decreased with increasing oxalic acid content.
Upon the addition of glycerol as plasticizer, the interaction between glycerol and
chitosan results in the shift of the doublet peaks of symmetric and asymmetric
stretching for alkyl group in chitosan (C–H) at 2939 and 2882 cm-1 upward to 2944 and
2890 cm-1. In this work, it has been proven that FTIR is an undeniable important tool in
detecting the functional groups and determining the interactions in polymer electrolytes
consisting chitosan, oxalic acid and plasticizer glycerol.
Polymer electrolytes need to exhibit low degree of crystallinity in order to
exhibit high conductivity values. The x-ray diffractions (XRD) were done on the
polymer electrolytes by passing the x-ray beam perpendicular and parallel to its
surface. In this work, x-ray diffractions has been used to calculate the degree of
crystallinity for chitosan based membranes with degree of deacetylation higher than 75
%. The relative degree of crystallinity, χc of each sample membrane can be calculated
using the simplicity approach of the two-phase model from XRD pattern using the
equation by Hassan et al. (2013) and Lewandowska et al. (2011). In System I, the
crystallinity degree of chitosan decreases with the addition of oxalic acid. The
reduction of crystallinity degree is due to the lesser inter or/ and intramolecular
hydrogen attraction involving amine NH2 of chitosan with higher oxalic acid contents.
The highest conducting membrane in System I OA40 exhibited the lowest degree of
Univers
ity of
Mala
ya
140
crystallinity of 13 %. Whereas in System II, the degree of crystallinity for the sample
membranes increases abruptly as high as 29 % with the addition of glycerol as low as
10 wt. % which is due to the anti-plasticization effect at low glycerol content (Liu et
al., 2013). They reported that the addition of glycerol lower than 2.5 % caused the
degree of crystallinity to increase and at higher glycerol contents such as 5.0 % and
10.0 % will reduce the crystallinity of the membranes. In this work, the reduction in
degree of crystallinity with the increasing of glycerol contents is due to preferential
interaction between glycerol and oxalate ions. This caused the polymer becomes more
flexible with the enhancement of bond rotations which leads to the increment of
mobility of the polymer chains (Mubarak et al., 2013; Selvasekarapandian et al., 2005;
Sudhakar & Selvakumar, 2012; Lazaridou et al., 2012). Sample membrane OG60 in
System II exhibited the lowest crystallinity degree of 11 %.
The highest conducting plasticized polymer electrolyte OG60 was fabricated
into electrical double layer capacitor (EDLC) with symmetrical porous carbon as
electrodes. Linear sweep voltammetry experiment was performed on OG60 in the
potential range of -4 to 4 V with scan rate of 10 mV/ s at room temperature with
stainless steel as the electrodes in order to determine the electrochemical stability of
polymer electrolytes (Subramania et al., 2006; Saikia et al., 2011). It was observed
from the plot of current versus voltage, current flow in the film is almost constant until
the applied voltage swept to further positive value and reached a voltage breakdown/
decomposition voltage of 2.3 V. The performance of EDLC is examined by cyclic
voltammetry at five different scan rates; 1, 3, 5, 7, 10 mV/ s with the potential range
between -0.6 and 6.0 V and the highest specific capacitance value of the plasticized
polymer electrolyte OG60 is 6 F g-1 when the lowest scan rate 1 mV s-1 is used.
Univers
ity of
Mala
ya
141
The galvanostatic charge-discharge (GCD) characterization of EDLC was
carried out to study the effect of current density on EDLC performance. In this work,
two tests on the performance of EDLC was investigated firstly by varying several
voltage limits at fixed current; and another test is done by fixing the voltage limits
while varying the current. The EDLC exhibits a specific capacitance value of 13 F g-1
when working potential 1.2 V is used resulting 0.12 W h kg-1 and 14 W kg-1 as energy
density and power density delivered respectively at fixed current 1 mA. The presence
of a voltage drop at the beginning of the discharging process can be seen in Fig. 7.4.
This is due to ohmic loss across the internal resistance also known as equivalent series
resistance (ESR) in electrode and electrolyte and this represents the resistive behaviour
of EDLC (Hashmi et al., 2007; Suhaimi et al., 2012). When the working potential 1.2
V is fixed, the applied current 0.1 mA produced specific capacitance of 13 F g-1 with
0.5 W h kg-1 and 0.4 W kg-1 as energy density and power. However, the applied current
1 mA produced much higher energy density (0.41 W h kg-1) and power density (33 W h
kg-1). A cyclic durability test was carried out by scanning the EDLC up to 10th cycle
with different applied current and at fixed potential 1.2 V. The EDLC with 1 mA as
applied current exhibited a better performance after the 10th cycle as no significant
change in specific capacitance and coulombic efficiency were observed.
Univers
ity of
Mala
ya
142
CHAPTER 9
CONCLUSION AND SUGGESTIONS FOR FURTHER WORK
This work discussed the preparation of chitosan based solid polymer electrolyte
incorporating oxalic acid as proton donor. Chitosan is a biopolymer and the molecules
of chitosan exist as cationic polyelectrolyte in acidic solution. Being a polyelectrolyte,
chitosan spontaneously acquiring a large number of elementary charges distributed
along the molecular chain when dissolved in oxalic acid. The main objectives of this
work are to develop and optimize the high conducting plasticized chitosan based solid
polymer electrolytes. The highest ionic conductivity at room temperature was found to
be 4.95 x10⁻⁷
S cm-1
for sample OA40 with 40 wt. % oxalic acid. The conductivity of
OA40 was increased with the addition of plasticizer glycerol. Glycerol is a small
molecule polyol type plasticizer that able to intersperse and intercalate among and
between chitosan polymer chains, disrupting hydrogen bonding and spreading the
chains apart. Furthermore, it can assist the proton dissociation by forming hydrogen
bonds between its hydroxyl group and carbonyl group of oxalic acid. This interaction
withdrew the electron density of the oxygen of hydroxyl group in oxalic acid thereby
the proton was released easily. Sample with 60 wt. % glycerol (OG60) exhibited the
highest room temperature conductivity value of 9.12 x10⁻⁵
S cm-1
. The conductivity
studies on this plasticized chitosan based electrolyte proved that the objectives of this
have been achieved. The dielectric constant value of OA40 was found to be increased
from 7.44 to 18.41 with addition of 60 wt. % glycerol (OG60) which indicates that the
ion dissociation was assisted by the plasticizer addition. This dielectric constant values
was in an agreement with the values of ionic conductivity.
Univers
ity of
Mala
ya
143
A further investigation of dipole relaxation in the polymer electrolytes was also
carried out by calculating the relaxation parameter (Aziz et al., 2012). The lowest
relaxation time τ obtained for System I is 5.27 x 10⁻⁵
s was exhibited by OA40, whereas
OG60 exhibits the lowest value of 3.98 x 10⁻⁶
s in System II. From these relaxation
time values, a conclusion can be made that the ionic conductivity is inversely related to
the relaxation time. The conductivity values for both OA40 and OG60 from System I
and System II respectively showed the maximum while the relaxation time values were
the minimum.
The conduction behaviour is directly correlated with the crystallinity of the
polymer electrolyte. X-ray diffraction has been used to calculate the crystallinity degree
of chitosan based membranes. In System I, the crystallinity degree of chitosan
decreases with the addition of oxalic acid. The highest conducting membrane OA40 in
System I exhibited the lowest crystallinity degree of 13 %. Whereas in System II, the
crystallinity degree of the sample membranes increases abruptly as high as 29 % with
the addition of glycerol as low as 10 wt. % which is due to the anti-plasticization effect
at low glycerol content. The reduction of crystallinity degree with the increasing of
glycerol contents is due to preferential interaction between glycerol and oxalate ions.
Sample membrane OG60 in System II exhibited the lowest crystallinity degree of 11
%.
Another objective in this work is to fabricate an electrochemical double layer
capacitor (EDLC) device using OG60 as the electrolyte. The symmetrical electrodes for
EDLC containing porous carbon and poly(vinyl pyrrolidone) (PVP) in ratio 8:1 were
prepared by doctor blade technique. The linear sweep voltammetry of sample OG60
reached a breakdown/decomposition voltage at 2.3 V. The cyclic voltammetry curves
Univers
ity of
Mala
ya
144
of OG60 exhibit an almost rectangular shape especially at scan rate of 7 mV s-1
. The
EDLC exhibits specific capacitance value of 13 F g-1
when working potential 1.2 V is
used producing 4 W h kg-1
and 14 W kg-1
as energy density (E) and power density (P)
delivered respectively at fixed current 1 mA. The cyclic durability test was carried out
on the EDLC by scanning up to 10th cycle with different applied current and at fixed
potential 1.2 V. The EDLC with applied current 1 mA exhibited a better performance
after the 10th
cycle compared to that of applied current 0.1 mA as there is no significant
change in specific capacitance and coulombic efficiency. The electrochemical results
obtained show that the objective of fabricating EDLC with the optimized plasticized
polymer electrolyte OG60 has been achieved.
Further work studies should be extended to improve the ionic conductivity for
chitosan based solid polymer electrolyte. Accordingly, different types of ionic liquids
such as sulfonium-, thiophenium- and thioxonium-cation based can be doped in order
to increase the ionic conductivity and operating voltage of EDLC. This ionic liquid can
widen the electrochemical stability window and enhance the specific capacitance.
Univers
ity of
Mala
ya
145
Ali, R. M., Harun, N. I., Ali, A. M. M., & Yahya, M. Z. A. (2012). Effect of ZnS dispersoid in structural and electrical properties of plasticized CA-NH4I. Physics Procedia, 25, 293-298.
Arcana, I. M., Bundjali, B., Achmad Rochliadi, A., & Hariyawati, N. K. (2013, Nov.). Preparation of Polymers Electrolyte Membranes from Styrofoam Waste for Lithium Battery. Paper presented at Joint International Conference on Rural Information & Communication Technology and Electric-Vehicle Technology (rICT & ICeV-T), Bandung-Bali, Indonesia.
Arof, A. K., Kufian, M. Z., Shukur, M. F., Aziz, M. F., Abdelrahman, A. E., & Majid S. R. (2012). Electrical double layer capacitor using poly(methyl methacrylate)–C4BO8Li gel polymer electrolyte and carbonaceous material from shells of mata kucing (Dimocarpus longan) fruit. Electrochimica Acta, 74, 39–45.
Arof, A. K., Amiruddin, S., Yusof, S. Z., & Noor, I. M. (2014). A method based on impedance spectroscopy to determine transport properties of polymer electrolytes. Physical Chemistry Chemical Physics, 16, 1856-1867.
Arof, A. K., Shuhaimi, N. E. A., Alias, N. A., Kufian, M. Z., & Majid, S. R. (2010). Application of chitosan/iota-carrageenan polymer electrolytes in electrical double layer capacitor (EDLC). Journal Solid State Electrochemistry, 14, 2145–2152.
Asghar, A., Samad, Y. A., Lalia, B. S., & Hashaikeh, R. (2012). PEG based quasi-solid polymer electrolyte: Mechanically supported by networked cellulose. Journal of Membrane Science, 421-422, 85-90.
Aziz, N. A., Majid, S. R., & Arof, A. K. (2012). Synthesis and characterizations of phthaloyl chitosan-based polymer electrolytes. Journal of Non-Crystalline Solids, 358, 1581-1590.
Aziz, S. B., & Abidin, Z. H. Z. (2014). Electrical and morphological analysis of chitosan:AgTf solid electrolyte. Materials Chemistry and Physics, 144, 280-286.
Azizi Samir, M. A. S., Chazeau, L., Alloin, F., Cavaillé, J. -Y., Dufresne, A., & Sanchez, J. -Y. (2005). POE-based nanocomposite polymer electrolytes reinforced with cellulose whiskers. Electrochimica Acta, 50, 3897–3903.
Banwell, C. N., & McCash, E. M. (2006). Fundamentals of Molecular Spectroscopy (4th ed.). New Delhi, India: Tata McGraw-Hill.
Baran, E. J. (2008). Spectroscopic investigation of the VO2+/chitosan interaction. Carbohydrate Polymer, 74, 704-706.
Baskaran, R., Selvasekarapandian, S., Hirankumar, G, & Bhuvaneswari, M. S. (2004). Vibrational, ac impedance and dielectric spectroscopic studies of poly(vinylacetate)–N,N–dimethylformamide–LiClO4 polymer gel electrolytes. Journal of Power Sources, 134, 235-240.
Boczar, M., Kurczab, R., Wojcik, M.J. (2010). Theoretical and spectroscopic studies of vibrational spectra of hydrogen bonds in molecular crystal of β-oxalic acid. Vibrational Spectroscopy, 52, 39-47.
Univers
ity of
Mala
ya
146
Bourtoom, T. (2008). Plasticizer effect on the properties of biodegradable blend film from rice starch-chitosan. Songklanakarin Journal of Science and Technology, 30, 149-165.
Brett, C. M. A., & Brett, A. M. O. (1993). Electrochemistry principles, methods and applications. New York, NY: Oxford University Press Inc.
Buraidah, M. H., Teo, L. P., Majid, S. R., & Arof, A. K. (2009). Ionic conductivity by correlated barrier hopping in NH4I doped chitosan solid electrolyte. Physica B: Condensed Matter, 404, 1373-1379
Burke, A. (2007). R & D considerations for the performance and application of electrochemical capacitors. Electrochimica Acta, 53, 1083-1091.
Cervera, M. F., Karjalainen, M., Airaksinen, S., Rantanen, J., Krogars, K., Heinamaki, J., Colarte A. I., & Yliruusi, J. (2004). Physical stability and moisture sorption of aqueous chitosan-amylose starch films plasticized with polyols. European Journal of Pharmaceutics and Biopharmaceutics, 58, 69-76.
Chanderasekaran, R., Koh, M., Yamauchi, A., & Ishikawa, M. (2010). Electrochemical cell studies based on non-aqueous magnesium electrolyte for electric double layer capacitor application. Journal of Power Sources, 195, 662-666.
Cheruku, R., & Govindaraj, L. G. (2012). Electrical relaxation studies of solution combustion synthesized nanocrystalline Li2NiZrO4 material. Material Science Engineering B, 177, 771-779.
Choi, J. W., Cheruvally, G., Kim, D. S., Ahn, J. H., Kim, K. W., Ahn, H. J. (2008). Rechargeable lithium/sulfur battery with liquid electrolytes containing toluene as additive. Journal of Power Sources, 183, 441-445.
Chopra, S., Sharma, S., Goel, T. C., Mendiratta, R.G. (2003). Structural, dielectric and pyroelectric studies of Pb1-XCaXTiO3 thin films. Solid State Communication, 127, 299-304.
Choudhary, S., & Sengwa, R. J. (2011). Dielectric properties and structural conformation of melt compounded PEO-LiCF3SO3-MMT nanocomposite electrolytes. Indian Journal of Pure & Applied Physics, 49, 600-605.
Cui, Z., Xiang, Y., Si, J., Yang, M., Zhang, Q., & Zhang, T. (2008). Ionic interactions between sulfuric acid and chitosan membranes. Carbohydrate Polymer, 73, 111-116.
Dakhara, S. L., & Anajwala, C. C. (2010). Polyelectrolyte complex: A pharmaceutical review. Systematic Review in Pharmacy, 1, 121-127.
Di Noto, V., Lavina, S., Giffin, G. A., Negro, E., & Scrosati, B. (2011). Polymer electrolytes: Present, past and future. Electrochimica Acta, 57, 4-13.
Dimzon, I. K. D., Ebert, J., & Knepper, T. P. (2013). The interaction of chitosan and olive oil: Effects of degree of deacetylation and degree of polymerization. Carbohydrate Polymers, 92, 564-570.
Domján, A., Bajdik, J. & Pintye-Hódi, K. (2009). Understanding of the Plasticizing Effects of Glycerol and PEG 400 on Chitosan Films Using Solid-State NMR Spectroscopy. Macromolecules, 42, 4667-4673.
Univers
ity of
Mala
ya
147
Duconseille, A., Astruc, T., Quintana, N., Filip Meersman, F., & Sante-Lhoutellier, V. (2014). Gelatin structure and composition linked to hard capsule dissolution: A review. Food Hydrocolloids. doi: 10.1016/j.foodhyd.2014.06.006
Emmenegger, Ch., Mauron, Ph., Sudan, P., Wenger, P., Hermann, V., Gallay, R., & Züttel, A. (2003). Investigation of electrochemical double-layer (ECDL) capacitors electrodes based on carbon nanotubes and activated carbon materials. Journal of Power Sources, 124, 321-329.
Fang, Y., Jiang, F., Liu, H., Wu, X., & Lu, Y. (2012). Free-standing Ni-microfiber-supported carbon nanotube aerogel hybrid electrodes in 3D for high-performance supercapacitor. Royal Society of Chemistry Advances, 2, 6562-6569.
Feng, F., Liu, Y., Zhao, B., Hu, K. (2012). Characterization of half-acetylated chitosan powders and films. Procedia Engineering: Proceedings of Chinese Material Conference 2011, 27, 718-732. New York, NY: Curran Associates, Inc.
Feng, L., Zhu, Y., Ding, H., & Ni, C. (2014). Recent progress in nickel based materials for high performance pseudocapacitor electrodes. Journal of Power Sources, 267, 430-444.
Forsyth, M., Meakin, P. M. & MacFarane, D. R. (1995). A 13C NMR study of the role of plasticizers in the conduction mechanism of solid polymer electrolytes. Electrochimica Acta, 40, 2339-2342.
Frackowiak, E. & Beguin, F. (2001). Carbon materials for the electrochemical storage of energy in capacitors. Carbon, 39, 937-950.
Fuentes, S., Retuert P. J., & González, G. (2003). Transparent conducting polymer electrolyte by addition of lithium to the molecular complex chitosane–poly(aminopropyl siloxane). Electrochimica Acta, 48, 2015–2019.
Fundo, J. F., Fernandes, R., Almeida, P. M., Carvalho, A., Feio, G, Silva C. L. M., & Quintas, M. A. C. (2014). Molecular mobility, composition and structure analysis in glycerol plasticised chitosan films. Food chemistry, 144, 2-8.
Gómez-Guillén, M.C., Pérez-Mateos, M., Gómez-Estaca, J., López-Caballero, E., Giménez B., & Montero, P. (2009). Fish gelatin: a renewable material for developing active biodegradable films. Trends in Food Science & Technology, 20, 3-16.
Gómez-Siurana, A., Marcilla, A., Beltrán, M., Berenguer, D., Martínez-Castellanos, I., & Menargues, S. (2013). TGA/FTIR study of tobacco and glycerol-tobacco mixtures. Thermochimica Acta, 573, 146-157.
Grant, S., Blair, H. S. & McKay, G. (1989). Structural studies on chitosan and other chitin derivatives. Die Makromolekulare Chemie, 190, 2279-2286.
Gümüşoğlu, T, Arı, G. A., & Deligöz, H. (2011). Investigation of salt addition and acid treatment effects on the transport properties of ionically cross-linked polyelectrolyte complex membranes based on chitosan and polyacrylic acid. Journal of Membrane Science, 376, 25-34.
Han, H. B., Zhou, S. S., Zhang, D. J., Feng, S. W., Li, L. F., Liu, K., … Zhou, Z. B. (2011). Lithium bis(fluorosulfonyl)imide (LiFSI) as conducting salt for nonaqueous
Univers
ity of
Mala
ya
148
liquid electrolytes for lithium-ion batteries: Physicochemical and electrochemical properties. Journal of Power Sources, 196, 3623-3632.
Hashmi S. A., Kumar, A., & Tripathi, S. K. (2007). Experimental studies on poly methyl methacrylate based gel polymer electrolytes for application in electrical double layaeer capacitors. Journal Physical D Applied Physics, 40, 6527-6534.
Hashmi, S. A., & Upadhyaya, H. M. (2002). Polypyrrole and poly(3-methyl thiophene)-based solid state redox supercapacitors using ion conducting polymer electrolyte. Solid State Ionics, 152–153, 883–889.
Hashmi, S.A., Kumar, A., Maurya, K.K., Chandra, S. (1990). Proton-conducting polymer electrolyte I. The polyethylene oxide NH4CIO4 system. Journal of Physics D: Applied Physics, 23, 1307-1314.
Hassan, F., Woo, H. J., Aziz, N. A., Kufian, M. Z., & Majid, S. R. (2013). Synthesis of Al2TiO5 and its effect on the properties of chitosan–NH4SCN polymer electrolytes. Ionics, 19, 483–489.
H rm - m n J M nr qu M C l ro -L o M o rı u -Otero, J. (2004). Computational study of the dissociation of oxalic acid in water clusters. Chemical Physics, 302, 53-60.
Huang, J., Xu, Z., Zhao, S., Li, S., Feng, X., Wang, P., & Zhang, Z. (2010). Study on carrier mobility measurement using electroluminescence in frequency domain and electrochemical impedance spectroscopy. Measurement, 43, 295-298.
Il’ n A V V rl mov V P (2005) Ch tos n -based polyelectrolyte complexes: A review. Applied Biochemistry and Microbiology, 41, 5-11.
Imperiyka, M., Ahmad, A., Hanifah, S. A., Mohamed, N. S., & Rahman M. Y. A. (2014). Investigation of plasticized UV-curable glycidyl methacrylate based solid polymer electrolyte for photoelectrochemical cell (PEC) application. International Journal of Hydrogen Energy, 39, 3018–3024.
Ingram, M. D., Staesche, H., & Ryder, K. S. (2004). ‘L r- op ’ polypyrrol : possible electrode material for inclusion in electrochemical supercapacitors?. Journal of Power Sources, 129, 107–112.
Jayalakshmi, M., & Balasubramaniam, K. (2008). Simple Capacitors to Supercapacitors- An Overview. International Journal of Electrochemical Science, 3, 1196-1217.
Ji, Q. Q., Guo, P. Z., & Zhao, X. S. (2010). Preparation of Chitosan-Based Porous Carbons and Their Application as Electrode Materials for Supercapacitors. Acta Physico-Chimica Sinica, 26, 1254-1258.
Kang, J., Wen, J., Jayaram, S. H., Yu, A., Wang, X. (2014). Development of an equivalent circuit model for electrochemical double layer capacitors (EDLCs) with distinct electrolytes. Electrochimica Acta, 115, 587-598.
Karthikeyan, A., Vinatier, P. & Levasseur, A. (2000). Study of lithium glassy solid electrolyte/electrode interface by impedance analysis. Bulletin of Material Science, 23, 179-183.
Univers
ity of
Mala
ya
149
Khiar, A. S. A., Puteh, R., & Arof, A. K. (2006). Conductivity studies of a chitosan-based polymer electrolyte Physica B, 373, 23–27.
Kötz, R. & Carlen, M. (2000). Principles and applications of electrochemical capacitors. Electrochimica Acta, 45, 2483-2498.
Krishnakumar, V., & Shanmugam, G. (2012). Electrical and optical properties of pure and Pb2+ on op PVA−P G polym r compos t l c trolyt f lms Ionics, 18, 403-4011.
Kumirska, J., Czerw ck M K c yńsk Z Bychowsk A Br o owsk K Thöming, J., & Stepnowski, P. (2010). Application of Spectroscopic Methods for Structural Analysis of Chitin and Chitosan. Marine Drugs, 8, 1567-1636.
Kurita, K. (2001). Controlled functionalized of the polysaccharide chitin. Progress in Polymer Science, 26, 1921-1971.
Kwon, S. H., Lee, E., Kim, B. S., Kim, S. G., Lee, B. J., Kim, M. S., & Jung, J. C. (2014). Activated carbon aerogel as electrode material for coin-type EDLC cell in organic electrolyte. Current Applied Physics, 14, 603-607.
Lalia, B. S., Samad, Y.A., & Hashaikeh, R. (2014). Ternary polymer electrolyte with enhanced ionic conductivity and thermo-mechanical properties for lithium-ion batteries. International Journal of Hydrogen Energy, 39, 2964-2970.
Lassègues, J. C., Grondin, J., Servant, L., & Hernandez, M. (1995). Supercapacitor using a proton conducting polymer electrolyte. Solid State Ionics, 77, 311-317.
Lavall, R. L., Borges, R. S., Calado, H. D. R., Welter, C., Trigueiro, J. P. C., Rieumont, J., Neves, B. R. A., & Silva, G. G. (2008). Solid state double layer capacitor based on a polyether polymer electrolyte blend and nanostructured carbon black electrode composites. Journal of Power Sources, 177, 652–659.
Lavorgna, M., Piscitelli, F., Mangiacapra, P., & Buonocore, G. (2010). Study of the combined effect of both clay and glycerol plasticizer on the properties of chitosan films. Carbohydrate Polymers, 82, 291-298.
Lazaridou, A., & Biliaderis, C. G. (2002). Thermophysical properties of chitosan, chitosan–starch and chitosan–pullulan films near the glass transition. Carbohydrate Polymers, 48, 179-190.
Leceta, I., Guerrero, P., de la Caba, K. (2013). Functional properties of chitosan-based films. Carbohydrate Polmers, 93, 339-346.
Lee, J. I., Kim, D. W., Lee, C., & Kang, Y. (2010). Enhanced ionic conductivity of intrinsic solid polymer electrolytes using multi-armed oligo(ethylene oxide) plasticizers. Journal of Power Sources, 195, 6138-6142.
Leones, R., Sentanin, F., Rodrigues, L. C., Ferreira, R. A. S., Marrucho, I. M., Esperança, J. M. S. S., ... Silva, M. M. (2012). Novel polymer electrolytes based on gelatin and ionic liquids. Optical Materials Volume, 35, 187-195.
Lewandowska, K. (2011). Miscibility and interaction in chitosan acetate/ poly(N-vinylpyrrolidone) blends. Thermochimica Acta, 517, 90-97.
Univers
ity of
Mala
ya
150
L w n owsk A Św rsk A (2006) Solv nt -free double-layer capacitors with polymer electrolytes based on 1-ethyl-3-methyl-imidazolium triflate ionic liquid. Applied Physics A, 82, 579-584.
Lewandowski, A. & Olejniczak, A. (2007). N-Methyl-N-propylpiperidinium bis(trifluoromethanesulphonyl)imide as an electrolyte for carbon-based double-layer capacitors. Journal of Power Sources, 172, 487–492.
Lewandowski, A., Zajder, M., Frąckow k & Béguin, F. (2001). Supercapacitor based on activated carbon and polyethylene oxide–KOH–H2O polymer electrolyte. Electrochimica Acta, 46, 2777–2780.
Li, W., Chen, D., Li, Z., Shi, Y., Wan, Y., Wang, G., Jiang, Z., Zhao, D. (2007). Nitrogen-containing carbon spheres with very large uniform mesopores: The superior electrode materials for EDLC in organic electrolyte. Carbon, 45, 1757-1763.
Lian, F., Guan, H. Y., Wen, Y., & Pan, X. R. (2014). Polyvinyl formal based single-ion conductor membranes as polymer electrolytes for lithium ion batteries. Journal of Membrane Science, 469, 1 November 2014, 67–72.
Liew, C. W., Ramesh, S., & Arof, A. K. (2014). Good prospect of ionic liquid based-poly(vinyl alcohol) polymer electrolytes for supercapacitors with excellent electrical, electrochemical and thermal properties. International Journal of Hydrogen Energy, 39, 2953-2963.
Lindman, B. B., Karlström, G., & Stigsson, L. L. (2010). On the mechanism of dissolution of cellulose. Journal of Molecular Liquids, 156, 76-81.
Liu, G., Kang F., Li, B., Huang, Z., & Chuan, X. (2006). Characterization of the porous carbon prepared by using halloysite as template and its application to EDLC. Journal of Physics and Chemistry of Solids, 67, 1186–1189.
Liu, H., Adhikari, R., Guo, Q., & Adhikari, B. (2013). Preparation and characterization of glycerol plasticized (high-amylose) starch-chitosan films. Journal of Food Engineering, 116, 588-597.
Luo, Y., & Wang, Q. (2014). Recent development of chitosan-based polyelectrolyte complexes with natural polysaccharides for drug delivery. International Journal of Biological Macromolecules, 64, March 2014, 353-367.
Ma, G., Peng, H., Mu, J., Huang, H., Zhou, X., & Lei Z. (2013). In situ intercalative polymerization of pyrrole in graphene analogue of MoS2 as advanced electrode material in supercapacitor. Journal of Power Sources, 229, 72–78.
Ma, G., Li, J., Sun, K., Peng, H., Mu, J., & Lei, Z. (2014). High performance solid-state supercapacitor with PVA–KOH–K3[Fe(CN)6] gel polymer as electrolyte and separator. Journal of Power Sources, 256, 281–287.
Ma, X., Chang, P. R., Yu, J., Lu, P. (2008). Characterizations of glycerol plasticized-starch (GPS)/carbon black (CB) membranes prepared by melt extrusion and microwave radiation. Carbohydrate Polymers, 74, 895-900.
Macdonald J. R., & Johnson, W. B. (2005). Fundamentals of Impedance Spectroscopy. In Barsoukov, E., & Macdonald, J. R. (Eds.), Impedance
Univers
ity of
Mala
ya
151
Spectroscopy Theory, Experiment, and Applications (2nd ed., pp.1-20). New Jersey, USA: John Wiley & Sons, Inc.
MacFarlane, D. R., Sun, J., Meakin, P., Fasoulopoulos, P., Hey, J., & Forsyth, M. (1995). Structure-property relationships in plasticized solid polymer electrolytes. Electrochimica Acta, 40, 2131-2136.
Machado, G. O., Ferreira, H. C. A., & Pawlicka, A. (2005). Influence of plasticizer contents on the properties of HEC-based solid polymeric electrolytes. Electrochimica Acta, 50, 3827-3831.
Majid, S. R., & Arof, A. K. (2007). Electrical behavior of proton-conducting chitosan-phosphoric acid-based electrolytes. Physica B, 390, 209-215.
Masuda, Y., Nakayama, M., & Wakihara, M. (2007). Fabrication of all solid-state lithium polymer secondary batteries using PEG-borate/aluminate ester as plasticizer for polymer electrolyte. Solid State Ionics, 178, 981-986.
Matsuura, Y., Oshima, Y., Tanaka, K., & Yamabe, T. (1996). AC conductivity of C60-doped poly (o-ethylaniline). Synthetic Metals, 79, 7-10.
McKubre, M. C. H., & Macdonald, D. D. (2005). Measuring Techniques and Data Analysis (2nd ed.). In E. Barsoukov & J. R. Macdonald, (Eds.), Impedance Spectroscopy Theory, Experiment, and Applications (pp. 129-204). New Jersey, NJ: John Wiley and Sons Inc.
Michael, M. S., & Prabaharan S. R. S. (2004). Rechargeable lithium battery employing a new ambient temperature hybrid polymer electrolyte based on PVK+PVdF–HFP (copolymer). Journal of Power Sources, 136, 408-415.
Missan, H. P. S., Chu, P. P., & Shekon, S. S. (2006). Ion conduction mechanism in non-aqueous polymer electrolytes based on oxalic acid: Effect of plasticizer and polymer. Journal of Power Sources, 158, 1472-1479.
Mobarak N. N., Ahmad, A., Abdullah, M. P., Ramli, N., & Rahman M. Y. A. (2013). Conductivity enhancement via chemical modification of chitosanbased green polymer electrolyte. Electrochimica Acta, 92, 161-167.
Mourya, V. K., & Inamdar, N. N. (2008). Chitosan-modifications and applications: Opportunities galore. Reactive and Functional Polymers, 68, 1013-1051.
Muzzarelli, R. A. A. (1978). Chitin. Great Britain: Pergamon Press Ltd.
Muzzarelli, R. A. A., Boudrant, J., Meyer, D., Manno, N., DeMarchis, M. & Paoletti, M. G. (2012). Current views on fungal chitin/chitosan, human chitinases, food preservation, glucans, pectins and inulin: A tribute to Henri Braconnot, precursor of the carbohydrate polymers science, on the chitin bicentennial. Carbohydrate Polymers, 87, 995-1012.
Ng, L. S., & Mohamad, A. A. (2008). Effect of temperature on the performance of proton batteries based on chitosan-NH4NO3-EC membrane. Journal of Membrane Science, 325, 653-657.
Ng, L. S., & Mohamad, A. A. (2006). Protonic battery based on a plasticized chitosan-NH4NO3 solid polymer electrolyte. Journal of Power Sources, 163, 382-385.
Univers
ity of
Mala
ya
152
Nithya, H., Selvasekarapandian, S., Selvin, P. C., Kumar, D. A., & Kawamura, J. (2012). Effect of propylene carbonate and dimethylformamide on ionic conductivity of P(ECH-EO) based polymer electrolyte. Electrochimica Acta, 66, 110–120.
Niya, S. M. R., & Hoorfar, M. (2013). Study of proton exchange membrane fuel cells using electrochemical impedance spectroscopy technique. Journal of Power Sources, 240, 281-293.
Nohara, S., Wada, H., Furukawa, N., Inoue, H., Morita, M., & Iwakura, C. (2003). Electrochemical characterization of new electric double layer capacitor with polymer hydrogel electrolyte. Electrochimica Acta, 48, 749–753.
Nomoto, S., Nakata, H., Yoshioka, K., Yoshida, A., & Yoneda, H. (2001). Advanced capacitors and their application. Journal of Power Sources, 97-98, 807-811.
Osman, Z., Ibrahim, Z. A., & Arof, A. K. (2001). Conductivity enhancement due to ion dissociation in plasticized chitosan based polymer electrolytes. Carbohydrate Polymers, 44, 167-173.
Pandey, G. P., Kumar, S, & Hashmi, S. A. (2011). Ionic liquid incorporated PEO s po’lym r l c trolyt for l ctr c l ou l l y r c p c tors: A comp r t v study with lithium and magnesium system. Solid State Ionics, 190, 93-98.
Pandey, K., Asthana, N., Dwivedi, M. M. & Chaturvedi, S. K. (2013). Effect of Plasticizers on Structural and Dielectric Behaviour of [PEO + (NH4)2C4H8(COO)2]. Polymer Electrolyte Journal of Polymers, 2013, 1-12.
Pandolfo, A. G. & Hollenkamp, A. F. (2006). Carbon properties and their role in supercapacitors. Journal of Power Sources, 157, 11-27.
Patrice Simon, P. & Gogotsi, Y. (2008). Materials for electrochemical capacitors. Nature Materials, 7, 845-854.
Pawlak, A., Mucha, M. (2003). Thermogravimetric and FTIR studies of chitosan blends. Thermochimica Acta, 396, 153-166.
Pawlicka, A., & Donoso, J. P. (2010). Polymer electrolyte based on natural polymers. In Sequira, C. & Santos, D. Polymer electrolytes: Fundamentals and applications. (pp. 95-124). Cambridge, UK: Woodhead Publishing Limited.
Pawlicka, A., Danczuk, M., Wieczorek, W., & Zy ło -Monikowska E. (2008). Influence of plasticizer type on the properties of polymer electrolytes based on chitosan. Journal of Physical Chemistry A, 112, 8888-8895.
Pernaut, J. M., & Goulart, G. (1995). Electrochemical capacitor using polymer/carbon composites. Journal of Power Sources, 55, 93–96.
Pradhan, D. K., Choudhary, R. N. P., Samantaray, B. K., Karan, N. K. & Katiyar, R. S. (2007). Effect of plasticizer on Structural and Electrical Properties of Polymer Nanocomposite Electrolytes. International Journal of Electrochemical Science, 2, 861-871.
Qian, X., Gu, N., Cheng, Z., Yang, X., Wang, E., & Dong, S. (2002). Plasticizer effect on the ionic conductivity of PEO-based polymer electrolyte. Materials Chemistry and Physics, 74, 98–103.
Univers
ity of
Mala
ya
153
Rajendran, S., Babu, R. S., & Sivakumar, P. (2007). Effect of salt concentration on poly (vinyl chloride)/poly (acrylonitrile) based hybrid polymer electrolytes. Journal of Power Sources, 170, 460–464
Ramasamy, C., Palma del Val, J., Anderson, M. (2014). An electrochemical cell study on polyvinylpyrrolidine aqueous gel with glycol addition for capacitor applications. Electrochimica Acta, 135, 181-186.
Ravi Kumar, M. N. V. (2000). A review of chitin and chitosan applications. Reactive and Functional Polymers, 46, 1-27.
Ravi Kumar, V., & Veeraiah, N. (1998). Dielectric properties of ZnF2-PbO-TeO2 glasses. Journal Physics and Chemistry of Solids, 59, 91-97.
Reicha, F. M., El-Heiti, M., El-Sonabati, A. Z., Diab, & M. A., (1991). Conducting polymers. V. Electrical conductivity of polymer complexes of bis-2,6-diaminopyridinesulphoxide-copper halides. Journal of Physics D: Applied Physics, 24, 369-374.
Ritthidej, G. C., Phaechamud, T., Koizumi, T. (2002). Moist heat treatment on physicochemical change of chitosan salt films. International Journal of Pharmceutics, 232, 11-22.
Saikia, D., Wu, H. Y., Pan, Y. C., Lin, C. P., Huang, K. P., Chen, K. N., Fey, G. T. K., & Kao, H. M. (2011). Highly conductive and electrochemically stable plasticized blend polymer electrolytes based on PVdF-HFP and triblock copolymer PPG-PEG-PPG diamine for Li-ion batteries. Journal of Power Sources, 196, 2826–2834.
Sajomsang, W. (2010). Synthetic methods and applications of chitosan containing pyridylmethyl moiety and its quaternized derivatives: A review. Carbohydrate Polymers, 80, 631-647.
Samir, A., Alloin, F., Gorecki, W., Sanchez, J., & Dufresne, A. (2004). Nanocomposites polymer electrolytes based on poly(oxyethylene) and cellulose nanocrystal. Journal of Physical Chemistry B, 108, 10845–10852.
Saroj, A. L. & Singh R. K. (2012). Thermal, dielectric and conductivity studies on PVA/Ionic liquid [EMIM][EtSO4] based polymer electrolytes, Journal of Physics and Chemistry of Solids, 73, 162–168.
Sekhar. P. K., Sarraf, H., Mekonen, H., Mukundan, R., Brosha, E. L., & Garzon, F. H. (2013). Impedance spectroscopy based characterization of an electrochemical propylene sensor. Sensors and Actuators B, 177, 111-115.
Selvasekarapandian, S., Baskaran, R., Kamishima, O., Kawamura, J., Hattori, T. (2006). Laser Raman and FTIR studies on Li+ interaction in PVAc–LiClO4 polymer electrolytes. Spectrochimica Acta Part A: Molecular and Biomolecular Spectroscopy, 65, 1234–1240.
Selvasekarapandian, S., Baskaran, R., & Hema, M. (2005). Complex AC impedance, transference number and vibrational spectroscopy studies of proton conducting PVAc-NH4SCN polymer electrolytes. Physica B, 357, 412-419.
Sengwa, R. J., Dhatarwal P., & Choudhary, S. (2014). Role of preparation methods on the structural and dielectric properties of plasticized polymer blend electrolytes:
Univers
ity of
Mala
ya
154
Correlation between ionic conductivity and dielectric parameters. Electrochimica Acta, 142, 359–370.
Senthilkumar, S. T., Kalai Selvan, R., Ponpandian, N., & Melo, J. S. (2012). Redox additive aqueous polymer gel electrolyte for an electric double layer capacitor. Royal Chemistry Society Advances, 2, 8937-8940.
Sequira, C. A. C., & Santos, D. M. F. (2010). Introduction to polymer electrolyte materials. In Sequira, C. & Santos, D. Polymer electrolytes: Fundamentals and applications. (pp. 1-52). Cambridge, UK: Woodhead Publishing Limited.
Sharma, P., & Bhatti, T. S. (2010). A review on electrochemical double layer. Energy Conversion and Management, 51, 2901-2912.
Shin, J. H., Jeong, S. S., Kim, K. W., & Passerini, S. (2005). FT-Raman spectroscopy study on the effect of ceramic fillers in P(EO)20LiBETI. Solid State Ionics, 176, 571-577.
Shriver, D. F., Atkins P. W., & Langford, C. H. (1994). Inorganic Chemistry (2nd ed.). Oxford, Great Britain: Oxford University Press.
Shukla, S. K., Ajay K. Mishra, A. K., Arotiba, O. A., & Mamba, B. B. (2013). Chitosan-based nanomaterials: A state-of-the-art review. International Journal of Biological Macromolecules, 59, 46-58.
Simon, P., & Burke, A. (2008). Nanostructured carbons: Double layer capacitance and more. The Electrochemical Society, 17, 38-43.
Singh, K. P., & Gupta, P. N. (1998). Study of dielectric relaxation in polymer electrolytes. European Polymer Journal, 34, 1023-1029.
Sivaraman, P., Kushwaha, R. K., Shashidhara, K., Hande, V. R., Thakur, A. P., Samui, A. B., & Khandpekar, M. M. (2010). All solid supercapacitor based on polyaniline and crosslinked sulfonated poly[ether ether ketone]. Electrochimica Acta, 55, 2451–2456.
Solomon, T. W. G., & Fryle. C. (2004). Organic Chemistry (8th ed.) U. P. Noida, India: Wiley International Edition.
Staiti, P., Minutoli, M., & Lufrano, F. (2002). All solid electric double layer capacitors based on Nafion ionomer. Electrochimica Acta, 47, 2795–2800.
Stewart, K. C., Kolman, D. G., & Taylor, S. R. (1993). The effect of parasitic conduction pathways on EIS measurements in low conductivity media. In J. R. Scully, D. C. Silverman, M. W. Kendig, (Eds.), Electrochemical Impedance: Analysis and Interpretation, ASTM STP 1188, (pp. 73-93). Philadelphia: American Society for Testing and Materials.
Subramania, A., Sundaram N. T. K., & Kumar, G.V. (2006). Structural and electrochemical properties of micro-porous polymer blend electrolytes based on PVdF-co-HFP-PAN for Li-ion battery applications. Journal of Power Sources, 153, 23 January, 177-182.
Sudhakar, Y. N., & Selvakumar, M. (2012). Lithium perchlorate doped plasticized chitosan and starch blend as biodegradable polymer electrolyte for supercapacitors. Electrochimica Acta, 78, 398-405.
Univers
ity of
Mala
ya
155
Suhaimi, N. E. A., Teo, L. P., Woo, H. J., Majid, S. R., & Arof, A. K. (2012). Electrical double-layer capacitors with plasticized polymer electrolyte based on methyl cellulose. Polymer Bulletin, 69, 807-826.
Sukhla, A. K., Sampath, S., & Vijayamohanan, K. (2000). Electrochemical supercapacitors: energy storage beyond batteries. Current Science, 79, 1656-1661.
Venkatesan, S., Obadja, N., Chang, T. W., Chen, L. T., & Lee, Y. L. (2014). Performance improvement of gel- and solid-state dye-sensitized solar cells by utilization the blending effect of poly (vinylidene fluoride-co-hexafluropropylene) and poly (acrylonitrile-co-vinyl acetate) co-polymers. Journal of Power Sources, 268, 77-81.
Vicentini, D. S., Smania Jr., A., Laranjeira, M. C. M. (2010) Chitosan/poly (vinyl alcohol) films containing ZnO nanoparticles and plasticizers. Material Science and Engineering: C, 30, 503-508.
Wada, H., Nohara, S., Furukawa, N., Inoue, H., Sugoh, N., Iwasaki, H., Morita, M., & Chiaki Iwakura, C. (2004). Electrochemical characteristics of electric double layer capacitor using sulfonated polypropylene separator impregnated with polymer hydrogel electrolyte. Electrochimica Acta, 49, 4871–4875.
Wan, Y., Creber, K. A. M., Peppley, B., & Bui, V. T. (2003). Ionic conductivity of chitosan membranes. Polymer, 44, 1057–1065.
Wang, J. G., Yang, Y., Huang, Z. H., & Kang, F. (2013). A high-performance asymmetric superfcapacitorbased on carbon and carbon-MnO2 nanofiber electrodes. Carbon, 61, 190-199.
Wen, S., Lee, J. W., Yeo, I. H., Park, J., Mho, S. I. (2004). The role of cations of the electrolyte for the pseudocapacitive behavior of metal oxide electrodes, MnO2 and RuO2. Electrochimica Acta, 50, 849-855.
Wen, Z., Itoh, T., Uno, T., Kubo, M., & Yamamoto, O. (2003). Thermal, electrical, and mechanical properties of composite polymer electrolytes based on cross-linked poly(ethylene oxide-co-propylene oxide) and ceramic filler. Solid State Ionics, 160,141-148.
Winie, T., & Arof, A. K. (2004). Dielectric Behaviour and AC conductivity of LiCF3SO3 doped H-Chitosan polymer films. Ionics, 10, 193-199.
Winie, T., Ramesh, S., & Arof, A. K. (2009). Studies on the structure and transport properties of hexanoyl chitosan-based polymer electrolytes. Physica B: Condensed Matter, 404, 4308-4311.
Woo, H. J., Majid, S. R. & Arof, A. K. (2012). Dielectric properties and morpholo y of polym r l c trolyt s on poly(ε-caprolactone) and ammonium thiocyanate. Materials Chemistry and Physics, 134, 755-761.
Wu, H., Hou, W., Wang, J., Xiao, L., & Jiang, Z. (2010). Preparation and properties of hybrid direct methanol fuel cell membranes by embedding organophosphorylated titania submicrospheres into a chitosan polymer matrix. Journal of Power Sources, 195, 4104-4113.
Univers
ity of
Mala
ya
156
Xiang, Y., Yang, M., Guo, Z., & Cui, Z. (2009). Alternatively chitosan sulfate blending membrane as methanol-blocking polymer electrolyte membrane for direct methanol fuel cell. Journal of Membrane Science, 337, 318-323.
Xu, W., Deng, Z. H., Zhang X. Z., & Wan, G. X. (1998). The influence of the compatibility of plasticizers with polymer ionic conductors on ionic conduction. Journal of Solid State Electrochemistry, 2, 257-261.
Yalcinkaya, S., Demetgul, C., Timur, M., & Colak, N. (2010). Electrochemical synthesis and characterization of polypyrrole/chitosan composite on platinum electrode: Its electrochemical and thermal behavior. Carbohydrate Polymers, 79, 908-913.
Yang, C. C., Hsu, S. T., & Chien, W. C. (2005). All solid-state electric double-layer capacitors based on alkaline polyvinyl alcohol polymer electrolytes. Journal of Power Sources, 152, 303-310.
Yap, K. S., Teo, L. P., Sim, L. N., Majid, S. R., & Arof, A. K. (2012). Investigation on dielectric relaxation of PMMA-grafted natural rubber incorporated with LiCF3SO3. Physica B: Condensed Matter, 407, 2421–2428.
Yu, H., Wu, J., Fan, L., Lin, Y., Xu, K., Tang, Z., Cheng, C., Tang, S., Lin, J., Huang M., & Lan, Z. (2012). A novel redox-mediated gel polymer electrolyte for high-performance supercapacitor. Journal of Power Sources, 198, 402–407.
Yu, H., Wu, J., Fan, L., Xu, K., Zhong, X., Lin, Y., & Lin, J. (2011). Improvement of the performance for quasi-solid-state supercapacitor by using PVA–KOH–KI polymer gel electrolyte. Electrochimica Acta, 56, 6881–6886.
Zhang, H., Zhang, W., Cheng, J., Cao, G., & Yang Y. (2008). Acetylene black agglomeration in activated carbon based electrochemical double layer capacitor electrodes. Solid State Ionics, 179, 1946-1950.
Zhang, Y., Feng, H., Wu, X., Wang, L., Zhang, A., Xia, T., Dong, H., Li, X., & Zhang, L. (2009). Progress of electrochemical capacitor electrode materials: A review. International Journal of Hydrogen Energy, 34, 4889-4899.
Zhang, Y., Xue, C., Xue, Y., Gao R., & Zhang, X. (2005). Determination of the degree of deacetylation of chitin and chitosan by X-ray powder diffraction. Carbohydrate Research, 340, 1914-1917.
Zheng, C., Qi, L., Yoshio, M., & Wang, H. (2010). Cooperation of micro- and meso-porous carbon electrode mayerials in electric double-layer capacitors. Journal of Power Sources, 195, 4406-4409. Univ
ersity
of M
alaya
Related Documents

![Crosslinked chitosan-dextran sulfate nanoparticle for ... · drug delivery system that can provide sustained release and increased residence time on the ocular surface [ 3]. The latter](https://static.cupdf.com/doc/110x72/5f0b5ca17e708231d4302427/crosslinked-chitosan-dextran-sulfate-nanoparticle-for-drug-delivery-system-that.jpg)