To study Ratio Analysis of Indian Oil Corporation Ltd. Chapter 1 INTRODUCTION A tool used by individuals to conduct a quantitative analysis of information in a company's financial statements. Ratios are calculated from current year numbers and are then compared to previous years, other companies, the industry, or even the economy to judge the performance of the company. Ratio analysis is predominately used by proponents of fundamental analysis Ratio analysis is a method of analyzing data to determine the overall financial strength of a business. Financial analysts take the information off the balance sheets and income statements of a business and calculate ratios that can then be used to make assessments of the operating ability and future prospects of that business. These ratios are useful only when compared to other ratios, such as the comparable ratios of similar businesses or the historical trend of a single business over several business cycles. There are various ratios that measure a company's efficiency, short-term strength, and solvency. The type of ratio analysis that is most effective depends upon who needs the information. Credit analysts are concerned with risk evaluation, and they therefore will concentrate of ratios that measure whether a company RIMS Chandrapur 1

Welcome message from author
This document is posted to help you gain knowledge. Please leave a comment to let me know what you think about it! Share it to your friends and learn new things together.
Transcript
To study Ratio Analysis of Indian Oil Corporation Ltd.
Chapter 1
INTRODUCTION
A tool used by individuals to conduct a quantitative analysis of
information in a company's financial statements. Ratios are calculated from
current year numbers and are then compared to previous years, other
companies, the industry, or even the economy to judge the performance of
the company. Ratio analysis is predominately used by proponents of
fundamental analysis Ratio analysis is a method of analyzing data to
determine the overall financial strength of a business. Financial analysts take
the information off the balance sheets and income statements of a business
and calculate ratios that can then be used to make assessments of the
operating ability and future prospects of that business. These ratios are useful
only when compared to other ratios, such as the comparable ratios of similar
businesses or the historical trend of a single business over several business
cycles. There are various ratios that measure a company's efficiency, short-
term strength, and solvency.
The type of ratio analysis that is most effective depends upon who
needs the information. Credit analysts are concerned with risk evaluation, and
they therefore will concentrate of ratios that measure whether a company can
pay its financial obligations and how much debt is involved in capital structure.
On the opposite end of the spectrum, analysts looking at a business in terms
of an investment opportunity will employ ratios that determine if a company is
efficient and how great is its potential profitability.
For example, knowing that a company has a particular as determined
by a corresponding ratio is meaningless by itself. Financial analysts know it's
more important to determine how that ratio looks in terms of other similar
companies, or even how that ratio looks compared to prior profitability levels
of that same company. In addition, these ratios must be studied over a proper
RIMS Chandrapur 1
To study Ratio Analysis of Indian Oil Corporation Ltd.
time period, allowing for major changes within the company to be taken into
consideration.
Ratio analysis is useful in determining the solvency of a business and
the amount of reliance it has on its creditors. Specific ratios included in this
group are current ratio, which measures financial strength by dividing a
company's assets by its and, which takes the essence of the current ratio but
excludes. By focusing on of a business, a quick ratio can measure its strength
even in a worst-case scenario whereby all of its funding was suddenly
removed.
In contrast, income statement analysis is more concerned with the
profitability of a business. Among this type of ratio analysis, ratio measures
the profit from sales available to pay while margin ratio is an indicator on the
company's financial return on sales. Ratios known as management ratios can
also be calculated from balance sheet information. These ratios measure
efficiency in terms of collecting accounts receivable and managing inventory,
the ability to turn assets into profit, and how much of a return the owners of
the business are getting on their investment.
RATIO ANALYSIS
Ratio Analysis compares significant numbers from your financial
statements. Rather than focusing on specific volumes, ratios are indicators of
the broad state of your business.
What they indicate is dependent upon the nature of your company,
comparisons to your company’s historical ratio values, and Comparisons to
competitive companies in the same industry.
Financial ratios are useful to you and potential investors because they
allow comparisons to be made between your business and others of the same
type.
RIMS Chandrapur 2
To study Ratio Analysis of Indian Oil Corporation Ltd.
Standard ratios for many industries are available from on-line database
services and are also published in various reference books available at most
libraries.
As part of an agreement for financing, your lender or investor may
require that you maintain certain ratios. Any ratio that must be maintained at a
specific value as part of a financing agreement should be calculated and
monitored on a timely basis. If you neglect to do this, you risk being out of
complain with your lender or investor, which could result in the debt being
called for immediate repayment.
ADJUSTED EPS
Net income-dividend on preferred stock
Average outstanding share
The portion of a company's profit allocated to each outstanding share
of common stock. Earnings per share serves as an indicator of a company's
profitability.
Earnings per share are generally considered to be the single
most important variable in determining a share's price. It is also a major
component used to calculate the price-to-earnings valuation ratio.
DIVIDEND PER SHARE
Dps = d- sd
S
D - Sum of dividends over a period (usually 1 year)-
SD - Special, one time dividends
S - Shares outstanding for the period
The the sum of declared dividends for every ordinary share issued.
Dividend per share (DPS) is the total dividends paid out over an entire year
RIMS Chandrapur 3
To study Ratio Analysis of Indian Oil Corporation Ltd.
(including interim dividends but not including special dividends) divided by the
number of outstanding ordinary shares issued.
Dividends per share are usually easily found on quote pages as the
dividend paid in the most recent quarter which is then used to calculate the
dividend yield. Dividends over the entire year (not including any special
dividends) must be added together for a proper calculation of DPS, including
interim dividends. Special dividends are dividends which are only expected to
be issued once so are not included. The total number of ordinary shares
outstanding is sometimes calculated using the weighted average over the
reporting period.
PROFITABILITY RATIOS
A class of financial metrics that are used to assess a business's ability
to generate earnings as compared to its expenses and other relevant costs
incurred during a specific period of time. For most of these ratios, having a
higher value relative to a competitor's ratio or the same ratio from a previous
period is indicative that the company is doing well.
One of the primary reasons for operating most businesses is to
generate profits. If you have outside investors, the return on their investment
often comes from the net income the business generates (rather than from the
sale of the business or some other form of pay back). There are many ways to
measure
Return on Investment (ROI). Return on Equity and Return on Assets,
as shown below, are two easily calculated methods.
RIMS Chandrapur 4
To study Ratio Analysis of Indian Oil Corporation Ltd.
OPERATING PROFIT MARGIN (RETURN ON SALES - ROS)=
Operating profit margin = Operating income
Total revenue
A ratio used to measure a company's pricing strategy and operating
efficiency.This value measures the percent of revenue remaining after paying
all operating expenses (Operating Income). The operating profit margin is
your operating income (gross profit minus all operating expenses) divided by
your gross sales expressed as a percentage.
Operating margin gives analysts an idea of how much a company
makes (before interest and taxes) on each dollar of sales. When looking at
operating margin to determine the quality of a company, it is best to look at
the change in operating margin over time and to compare the company's
yearly or quarterly figures to those of its competitors. If a company's margin is
increasing, it is earning more per dollar of sales. The higher the margin, the
better.
GROSS PROFIT MARGIN
Gross Profit
Gros Profit Margin =
Total Revenue
This value measures the percent of money your company generated
over the cost of producing your goods or services. In other words, gross profit
margin (or percent) is the ratio of your net sales (gross sales minus your cost
of goods sold) divided by your gross sales, expressed as a percentage. You
can do very well here when you really understand the value your product or
service bring to your customers – your prices need not be built upon your
costs. Better to determine the real value to your customers and sell them on
that. This way you will enjoy higher gross margins
RIMS Chandrapur 5
To study Ratio Analysis of Indian Oil Corporation Ltd.
NET PROFIT MARGIN
Option 1: Net Income after Taxes
Revenue
Option 2: (Net Income + Minority Interest + Tax-Adjusted Interest)
Revenue
This is the profit you made on this business. The net income divided by
your gross sales, expressed as a percentage. Your company’s after-tax profit
margin tells you (and investors) the percentage of money your company
actually earns per dollar of sales. Interpretation is similar to your profit margin,
the after tax profit margin is more stringent as it takes into account taxes.
Looking at the earnings of a company often doesn't tell the entire story…
Profit can increase, but it does not mean that its profit margin is improving.
For example, if your company increases sales, and if costs also rise, you’ll
have a lower profit margin then had been seen with a lower profit. This
indicates that costs need to be better controlled.
All three of these above percentages should usually be included on
your income statements. To analyze your profitability, compare these
percentages to your industry’s averages or those of your immediate
competitors (if you can obtain this information). Of course, you’ll always want
to compare your current year’s profitability percentages to the percentages
from your company’s previous years in order to determine how well you are
progressing.
RIMS Chandrapur 6

To study Ratio Analysis of Indian Oil Corporation Ltd.
REPORTED RETURN ON NET WORTH (%)
Net income
Reported Return on NET Worth = x 100
Shareholders equity
The amount of net income returned as a percentage of shareholders
equity. Return on equity measures a corporation's profitability by revealing
how much profit a company generates with the money shareholders have
invested.
The ROE is useful for comparing the profitability of a company to that
of other firms in the same industry. There are several variations on the
formula that investors may use:
1. Investors wishing to see the return on common equity may modify
the formula above by subtracting preferred dividends from net income and
subtracting preferred equity from shareholders' equity, giving the following:
return on common equity (ROCE) = net income - preferred dividends /
common equity.
2. Return on equity may also be calculated by dividing net income
by average shareholders' equity. Average shareholders' equity is calculated
by adding the shareholders' equity at the beginning of a period to the
shareholders' equity at period's end and dividing the result by two.
3. Investors may also calculate the change in ROE for a period by
first using the shareholders' equity figure from the beginning of a period as a
denominator to determine the beginning ROE. Then, the end-of-period
shareholders' equity can be used as the denominator to determine the ending
ROE. Calculating both beginning and ending ROEs allows an investor to
determine the change in profitability over the period
RIMS Chandrapur 7

To study Ratio Analysis of Indian Oil Corporation Ltd.
LEVERAGE RATIOS
Long term debt / Equity
The long term debt to equity ratio is simply similar to gearing, except
that short term debt is excluded from the calculation. This is most simply
interpreted as a measure of capital structure, but is also used as a measure of
financial strength.
One shortcoming of the use of long term debt/equity with regard to
capital structure is that borrowing that appears to be short term on the face of
the balance sheet may in fact be rolled over or be provided from a continuing
facility such as an overdraft (which may be provided for many years, even
though re-payable on demand) — so its economic effect is that of long term
debt.
TOTAL DEBT TO OWNERS’ EQUITY
Total liabilityTotal Debt to Owners Equity =
Shareholders equity
A measure of a company's financial leverage calculated by dividing its
total liabilities by stockholders' equity. It indicates what proportion of equity
and debt the company is using to finance its assets.
The debt to equity ratio is a common benchmark used to measure the
leverage within a business. To relate Return on Equity to the Debt-to-Worth
ratio, you need to remember that given a fixed total asset figure,
the greater the debt, the lower the net worth. Therefore, given two companies
of identical asset size and profitability, the company with the higher debt to
worth ratio will also have a higher return on equity ratio. When potential
lenders and investors consider the risks of investing in your business, they will
look at your return on equity ratio. If the ratio is the same as lower risk
investments such as certificates of deposit or US Treasury bills, it does not
make sense for them to invest in your company.
RIMS Chandrapur 8

To study Ratio Analysis of Indian Oil Corporation Ltd.
A high debt/equity ratio generally means that a company has been aggressive
in financing its growth with debt. This can result in volatile earnings as a result
of the additional interest expense.
If a lot of debt is used to finance increased operations (high debt to
equity), the company could potentially generate more earnings than it would
have without this outside financing. If this were to increase earnings by a
greater amount than the debt cost (interest), then the shareholders benefit
as more earnings are being spread among the same amount of shareholders.
However, the cost of this debt financing may outweigh the return that the
company generates on the debt through investment and business activities
and become too much for the company to handle. This can lead to
bankruptcy, which would leave shareholders with nothing. The debt/equity
ratio also depends on the industry in which the company operates. For
example, capital-intensive industries such as auto manufacturing tend to have
a debt/equity ratio above 2, while personal computer companies have a
debt/equity of under 0.5.
FIXED ASSETS TURNOVER RATIO
Net salesFix asset turnover =
Net property, plan and equipment
A financial ratio of net sales to fixed assets. The fixed-asset turnover
ratio measures a company's ability to generate net sales from fixed-asset
investments - specifically property, plant and equipment (PP&E) - net of
depreciation. A higher fixed-asset turnover ratio shows that the company has
been more effective in using the investment in fixed assets to generate
revenues.
This ratio is often used as a measure in manufacturing industries,
where major purchases are made for PP&E to help increase output. When
RIMS Chandrapur 9
To study Ratio Analysis of Indian Oil Corporation Ltd.
companies make these large purchases, prudent investors watch this ratio in
following years to see how effective the investment in the fixed assets was.
LIQUIDITY RATIOS
Current assetCurrent ratio =
Current liabilityA liquidity ratio that measures a company's ability to pay short-term
obligations. Also known as "liquidity ratio", "cash asset ratio" and "cash ratio"
The ratio is mainly used to give an idea of the company's ability to pay
back its short-term liabilities (debt and payables) with its short-term assets
(cash, inventory, receivables). The higher the current ratio, the more capable
the company is of paying its obligations. A ratio under 1 suggests that the
company would be unable to pay off its obligations if they came due at that
point. While this shows the company is not in good financial health, it does not
necessarily mean that it will go bankrupt - as there are many ways to access
financing - but it is definitely not a good sign.
The current ratio can give a sense of the efficiency of a company's
operating cycle or its ability to turn its product into cash. Companies that have
trouble getting paid on their receivables or have long inventory turnover can
run into liquidity problems because they are unable to alleviate their
obligations. Because business operations differ in each industry, it is always
more useful to compare companies within the same industry. This ratio is
similar to the acid-test ratio except that the acid-test ratio does not include
inventory and prepaids as assets that can be liquidated. The components of
current ratio (current assets and current liabilities) can be used to derive
working capital (difference between current assets and current liabilities).
Working capital is frequently used to derive the working capital ratio, which is
working capital as a ratio of sales.
RIMS Chandrapur 10
To study Ratio Analysis of Indian Oil Corporation Ltd.
LIQUID OR LIQUIDITY OR ACID TEST OR QUICK RATIO:
Total Current Assets
Total Current Liabilities
A class of financial metrics that is used to determine a company's
ability to pay off its short-terms debts obligations. Generally, the higher the
value of the ratio, the larger the margin of safety that the company possesses
to cover short-term debts. These values come from your balance sheet and
are a measure of your liquidity. Your current ratio indicates your ability to pay
your current debt out of your current assets. The higher the ratio, the greater
your “cushion.” Although a satisfactory value for a current ratio varies from
industry to industry, a general rule of thumb is that a current ratio of 2 to 1 or
greater is fairly healthy. Thinking in terms of dollars, a 2 to 1 ratio means that
you have 94rupees of current assets from which to pay every 47rupees of
current bills.
A smaller current ratio may mean that you have successfully
negotiated to pay your suppliers later than the usual 30 days, which
essentially gives your company an interest-free source of cash. Let’s say your
current assets are 7, 05,000 rupees and current liabilities are 4, 70,000rupees
this gives you a current ratio of 1.5 to 1. In this scenario, you could improve
your current ratio to 2 to 1 by paying 2,35,000 RS of your current liabilities
with your current assets, reducing both by If your suppliers were willing to
wait for payment without charging you interest, this would probably be a bad
idea (unless your 2,35,000 RS financing agreement requires you to maintain a
current ratio of 2 to 1).
Common liquidity ratios include the current ratio, the quick ratio and the
operating cash flow ratio. Different analysts consider different assets to be
relevant in calculating liquidity. Some analysts will calculate only the sum of
cash and equivalents divided by current liabilities because they feel that they
are the most liquid assets, and would be the most likely to be used to cover
RIMS Chandrapur 11
To study Ratio Analysis of Indian Oil Corporation Ltd.
short-term debts in an emergency. A company's ability to turn short-term
assets into cash to cover debts is of the utmost importance when creditors are
seeking payment. Bankruptcy analysts and mortgage originators frequently
use the liquidity ratios to determine whether a company will be able to
continue as a going concern
INVENTORY TURNOVER RATIO
COGSInventory Turnover Ratio =
Inventory
A ratio showing how many times a company's inventory is sold and
replaced over a period.
The days in the period can then be divided by the inventory turnover
formula to calculate the days it takes to sell the inventory on hand or
"inventory turnover days". Although the first calculation is more frequently
used, COGS (cost of goods sold) may be substituted because sales are
recorded at market value, while inventories are usually recorded at cost. Also,
average inventory may be used instead of the ending inventory level to
minimize seasonal factors.
This ratio should be compared against industry averages. A low
turnover implies poor sales and, therefore, excess inventory. A high ratio
implies either strong sales or ineffective buying. High inventory levels are
unhealthy because they represent an investment with a rate of return of zero.
It also opens the company up to trouble should prices begin to fall.
Number of times inventory turns in period. High turn can indicate better
liquidity or good merchandising or shortage of needed inventory for sales.
Low turn can mean overstocking, obsolescence, builds to inaccurate sales
forecast – can also a planned inventory build-up in anticipation of possible
material shortages.
RIMS Chandrapur 12
To study Ratio Analysis of Indian Oil Corporation Ltd.
PAYOUT RATIOS
Dividend payout ratio (net profit)
Dividend Payment per Share Dividend Payout Ratio = ------------------------------------ Earnings per Share
The percentage of earnings paid to shareholders in dividends.
The payout ratio provides an idea of how well earnings support the dividend
payments. More mature companies tend to have a higher payout ratio.
In the U.K. there is a similar ratio, which is known as dividend cover. It
is calculated as earnings per share divided by dividends per share.
Earning retention ratio
Net income-dividendsEarning retention ratio = ---------------------------
Net income
The percent of earnings credited to retained earnings. In other words,
the proportion of net income that is not paid out as dividends. The retention
ratio is the opposite of the dividend payout ratio. In fact, it can also be
calculated as one minus the dividend payout ratio.
COMPONENT RATIOS
Working Capital Cycle
Net SalesReceivables Turnover = --------------------------------
Trade Account Receivable
An accounting measure used to quantify a firm's effectiveness in
extending credit as well as collecting debts. The receivables turnover ratio is
an activity ratio, measuring how efficiently a firm uses its assets.
(Sales/Receivables Ratio) Measures number of times AR turns over
during the period. Higher the turn, shorter the time between sale and
RIMS Chandrapur 13

To study Ratio Analysis of Indian Oil Corporation Ltd.
collection of the cash. Does not take into consideration seasonal fluctuations
or a large proportion of cash sales compared to total sales.
By maintaining accounts receivable, firms are indirectly extending
interest-free loans to their clients. A high ratio implies either that a company
operates on a cash basis or that its extension of credit and collection of
accounts receivable is efficient.
A low ratio implies the company should re-assess its credit policies in
order to ensure the timely collection of imparted credit that is not earning
interest for the firm.
Sales / Working Capital turnover
SalesSales / Working Capital turnover = ----------------------
Working capital
A measurement comparing the depletion of working capital to the
generation of sales over a given period. This provides some useful
information as to how effectively a company is using its working capital to
generate sales.
Net Working Capital equals current assets minus current liabilities.
Working Capital measures the margin of protection for current creditors and
reflects your ability to finance current operations. Comparing sales
to working capital this way measures how efficiently your working capital is
employed. Low ratio may mean ineffective use of WC. High ratio may mean
“overtrading”— a vulnerable position for creditors.
A company uses working capital (current assets - current liabilities) to
fund operations and purchase inventory. These operations and inventory are
then converted into sales revenue for the company. The working capital
turnover ratio is used to analyze the relationship between the money used to
fund operations and the sales generated from these operations. In a general
sense, the higher the working capital turnover, the better because it means
RIMS Chandrapur 14
To study Ratio Analysis of Indian Oil Corporation Ltd.
that the company is generating a lot of sales compared to the money it uses
to fund the sales.
OPERATING RATIOS
Operating ratios help measure the effectiveness of management
performance.
Gross Profit x 100Gross profit ratio = ----------------------- Net Sales
Gross profit ratio may be indicated to what extent the selling prices of
goods per unit may be reduced without incurring losses on operations. It
reflects efficiency with which a firm produces its products. As the gross profit
is found by deducting cost of goods sold from net sales, higher the gross profit
better it is. There is no standard GP ratio for evaluation. It may vary from
business to business. However, the gross profit earned should be sufficient to
recover all operating expenses and to build up reserves after paying all fixed
interest charges and dividends.
Operating Ratio
Operating ExpenseOperating Ratio = ------------------------
Net Sales
This ratio shows management efficiency by comparing your operating
expenses to your net sales. The Smaller the ratio, the greater your company’s
ability to generate a profit if revenue decreases this ratio
However, does not take into account any debt repayment or debt increase.
The smaller the ratio, the greater the organization's ability to generate profit if
revenues decrease. When using this ratio, however, investors should be
aware that it doesn't take debt repayment or expansion into account.
RIMS Chandrapur 15

To study Ratio Analysis of Indian Oil Corporation Ltd.
Chapter 2
INTRODUCTION TO ORGANISATION
Indian Oil owns and operates 6 of the refineries with a combined
refining capacity of over 25 million tones per annum (5,00,000bpd). Another 6
million tones per annum (1,20,000bpd) refinery will be ready during fiscal
1997. Constant technology up gradation enables achievement of over 100%
capacity utilization.
Indian Oil has the largest network of over 5,300 km onshore crude oil
and petroleum product pipelines in the country which operate at over 100%
capacity and are equipped with latest technology.
Indian Oil sold 41.97 million tones of petroleum products during the
year 1996-97. It markets 55% of the petroleum products consumption of India.
In aviation fuels, its market participation is 69%. Its nationwide retail network
of nearly 18,000 sales points (6,731 petrol stations, 3,413 kerosene dealers,
2,834 LPG distributors and 4,820 bulk consumer outlets) is backed for
supplies by 178 bulk storage terminals and depots having a tank age of five
million kilolitres. There are 92 aviation fuel stations besides 39 LPG bottling
plants with a capacity of 1.5 million tones to cater to nearly 15 million
customers in over 1,300 towns all over the country.
Indian Oil is India’s flagship national oil company, with Business
interests straddling the entire hydrocarbon Value chain and the highest
ranked Indian corporate in the prestigious Fortune ‘Global 500’ listing. With
over a 34,000- strong workforce, Indian Oil has been meeting India’s energy
demands for over five decades. The company’s operations are strategically
structured along business verticals - Refineries, Pipelines, Marketing, R&D
and Business Development.
To achieve the next level of growth, Indian Oil is currently forging
ahead on a well laid-out road map through vertical integration – upstream into
oil exploration & production (E&P) and downstream into petrochemicals – and
RIMS Chandrapur 16
To study Ratio Analysis of Indian Oil Corporation Ltd.
diversification into natural gas marketing and alternative energy, besides
globalization of its downstream operations. Having set up subsidiaries in Sri
Lanka, Mauritius and the United Arab
Emirates (UAE), Indian Oil is simultaneously scouting for new business
opportunities in the energy markets of Asia and Africa. Indian Oil and its
subsidiaries have a dominant share of the petroleum products market share,
national refining capacity and the downstream sector pipelines capacity in
India.
With a steady aim of maintaining its position as a market leader and
providing best quality products and services, Indian Oil is currently investing
Rs. 47,000 crore in a host of projects for augmentation of refining and
pipelines capacities, expansion of marketing infrastructure and product quality
up gradation.
The Indian Oil Group of companies owns and operates 10 of India’s 20
refineries and the largest network of crude oil and profile product pipelines in
the country.
Indian Oil has a keen customer focus and a formidable network of
customer touch-points dotting the landscape across urban and rural India,
backed for supplies by bulk storage terminals and depots, aviation fuel
stations and LPG gas bottling plants. Indian Oil’s ISO-9002 certified Aviation
Service commands a dominant market share in aviation fuel business,
successfully servicing the needs of domestic and international flag carriers,
private airlines and the Indian Defense Services.
RIMS Chandrapur 17

To study Ratio Analysis of Indian Oil Corporation Ltd.
ORGANIZATION CHART
RIMS Chandrapur 18
To study Ratio Analysis of Indian Oil Corporation Ltd.
Chapter 3REVIEW OF LITERATURE
1) Using Financial Statements & Ratio Analysis to manage your
business effectively; Kobus Barnard AGA (SA) – B.Compt. (Hons)
(2007)
This case study will help with a better understanding of business by
using simple but effective tools such as ratio analysis to identify areas of
concern, in order to take corrective action with the ultimate aim of converting
profits into cash. After completing this workshop you will be able to read and
use financial information to more effectively manage your profitability, asset
efficiency and cash flows and more confidently liaise with your accountant or
bank manager on the financial health of your business. The case study covers
Concepts and rules used in preparing financial statements, with a focus on
IFRS for SME’s. The Statement of Financial Position, Comprehensive Income
and Cash Flow statement are examined in detail, with a 5-point methodology
used in reading these statements. Introduction of ratio analysis to understand
the key relationships between the three financial statements. A Financial
Analysis workbook is introduced using a case study for practical application.
Focus is on what the three key users of the financials will be looking at:
SARS, Bankers and owners of the business
2) Ratio analysis featuring the dupont method: an overlooked
topic in the finance module of small business management and
entrepreneurship courses; Thomas J. Liesz (2006)
Many business students, along with a lot of small business
management instructors, tend to shy away from quantitative analysis.
The qualitative aspects of a business – such as generating novel
product ideas and creating marketing campaigns– are far more “fun” than
record keeping and financial analysis. However, there is much evidence that
a lack of financial control is often a quick path to business failure. According
RIMS Chandrapur 19

To study Ratio Analysis of Indian Oil Corporation Ltd.
to Dun & Bradstreet’s Business Failure Records (1994), “poor financial
practices” is second only to “economic conditions” as a cause of business
failures. Further, studies have been published as far back as 80 years ago
(see Meech (1925)), as well as more recently (such as those published by
Bruno, Leidecker, and Harder (1987); Gaskill, Van Auken, and Manning
(1993); Lauzen (1985); and Wood (1989) that specifically cite poor financial
control as a chief cause of unsuccessful businesses. Firer (1999), and more
recently Kelly (2005), stress the importance of monitoring the “financial
health” of a small business.
3) Financial Ratio Analysis; Chetan Bhargav (2004)
Ratio analysis is a process of determining and interpreting
relationships between the items of financial statements to provide a
meaningful understanding of the performance and financial position of an
enterprise. Ratio analysis is an accounting tool to present accounting
variables in a simple, concise, intelligible and understandable form. As per
Myers “Ratio analysis is a study of relationship among various financial
factors in a business” Objectives of Financial Ratio Analysis The objective of
ratio analysis is to judge the earning capacity, financial soundness and
operating efficiency of a business organization. The use of ratio in accounting
and financial management analysis helps the management to know the
profitability, financial position and operating efficiency of an enterprise.
4) How accouting ratios affecting an investor’s decision, some
cases of construction companies; by Nguyen Thi Kim Thoa (2008)
Accounting ratios are values of the relationships between 2 related
accounts that appear in the financial statements such as: income statement,
balance sheet, cash flows statement, and changes in equity. They present a
company condition in the previous time, and predict by how the company will
operate in the future. This research works to evaluate the values of
accounting ratios to make investment decisions. By conducting of standard
RIMS Chandrapur 20

To study Ratio Analysis of Indian Oil Corporation Ltd.
financial statements, calculating of accounting ratios and comparing these
ratios in variety of companies are a burning issue and crucial mission to
investors. As Vietnam is a developing and urbanizing country, it is a benefit
condition for construction industry to grow. This project aims to discover
definitions of accounting or financing ratios also the calculations of these
accounting, and then it shows how of accounting ratios affect on investor’s
decision making. The results of the study provide evidence to measure ratios
and lastly it show out some recommendations and suggestions in applying
accounting ratios in investment decisions to investors.
5) FINANCIAL RATIO ANALYSIS: PUTTING THE NUMBERS TO
WORK; By John Bajkowski (2010)
Financial statement analysis consists of applying analytical tools and
techniques to financial statements in an attempt to quantify the operating and
financial conditions of a firm. The emphasis of the analysis changes
depending upon one’s relationship with the company. A credit analyst
extending a shortterm, unsecured loan to a company will examine the firm’s
cash flow and the liquidity of the company’s assets. A stock investor, on the
other hand, is primarily looking for future growth in cash flow and earnings.
Investors typically examine variables that might significantly impact a firm’s
financial structure, sales, earnings production, and dividend policy. Having
examined the structure and basic interpretation of the balance sheet, income
statement, and statement of cash flows in the first three parts of this series on
financial statement analysis, we come to the central issue of how the data can
be used in investment analysis. [Note: All of the articles from this series can
be found on the AAII Web site in the section titled “Focus on Financial
Statements” in the stocks area of our Web site (www.aaii.com/stocks)]. This
article will consider financial ratio construction and interpretation with a focus
on ratios grouped into operating performance and liquidity and financial risk
RIMS Chandrapur 21
To study Ratio Analysis of Indian Oil Corporation Ltd.
categories. The financial data used to illustrate the ratios will be taken from
the balance sheet and income statements developed previously in this series
6) Ratio Analysis: Financial Benchmarks For The Club Industry
Raymond S. Schmidgall and Agnes L. DeFranco (2003)
General managers of clubs are often inundated with operations and
member- ship issues and may not be able to spend quality time engaging in
the analysis of the financial health of the club. With the aid of a handful of
ratios, general managers and club controllers can assess the business trends
and financial viability of their operations very easily. The top ratios used by
club managers are: payroll cost percentage, cost of food sold percentage,
cost of beverage sold percentage, current ratio, and debt-equity ratio. The
results of several ratios focusing primarily on clubs' balance sheets are
presented in this article. The purpose of this study is to provide the industry
with some new and meaningful measurements. As seen from the results,
certain ratios (such as profit margins and cost percentages) are more often
used than others in the club business. Others, such as current ratio or cash
flows to short- and long-term debt, are also important. Ratio analysis is a
powerful financial and diagnostic tool.
7) Analyzing Financial Information Using Ratios ; Kate Barr (2005)
Leaders of nonprofits who seek to understand the organization’s
financial situation usually start by reviewing the financial reports.
Understanding the financial information is the building block of any financial
discussion. Beyond understanding the reports, much can be learned from
analysis of the information and interpretation of what it is telling you. The
basic analysis includes comparing financial reports to a benchmark such as
the budget or the financial report from the previous year. One essential
question is: does this information match our expectations? For a more
technical financial analysis, ratios can be used to deepen the understanding
RIMS Chandrapur 22

To study Ratio Analysis of Indian Oil Corporation Ltd.
and interpretation. Financial ratios are an established tool for businesses and
nonprofits. While there are dozens of ratios that can be calculated, most
nonprofits can use a handful of them to learn more about their financial
condition. This tool provides the description and calculation of 14 ratios
including a mix of balance sheet and income statement ratios. Individual
nonprofits must decide for themselves which calculations are valuable.
8) Ratio Analysis for the Hospitality Industry: A cross Sector
Comparison of Financial Trends in the Lodging, Restaurant, Airline and
Amusement Sectors; Woo Gon Kim, Baker Ayoun (2002)
This study uses ratio analysis to examine salient financial trends within
four major sectors of the hospitality industry for the 1997-2001 period –
namely lodging, restaurants, airlines and the amusement sectors. Cross-
sectional analysis results indicate that at least for the test period, eight out of
thirteen financial ratios were statistically different across the four hospitality
segments. As such, financial trends and cross sectional anomalies within the
examined hospitality industry segments are better understood. This study has
compared key financial ratios of four segments of the hospitality industry.
These segments are hotels and motels, restaurant, amusement and
recreational services, and airline companies. Both types of ratio analysis were
performed. Trend analysis of the financial ratios indicated that the ratios
measuring profitability (namely, net profit margin, ROA, and ROE) are the
lowest for the amusement and recreational services segment compared with
the other three segments. However, companies in each of these segments
have varied levels in terms of these ratios. Except for the amusement and
recreational services segment, other hospitality industry segments achieved
steady levels of liquidity over the five-year period as measured by the current
and quick ratios.
RIMS Chandrapur 23

To study Ratio Analysis of Indian Oil Corporation Ltd.
9) Financial Indicators for Critical Access Hospitals; Chris Haris
(2009)
The purpose of this project was to develop and disseminate
comparative financial indicators specifically for Critical Access Hospitals
(CAHs) using Medicare Cost Report (Healthcare Report Information System)
data. A Technical Advisory Group of individuals with extensive experience in
rural hospital finance and operations provided advice to a research team from
the University of North Carolina at Chapel Hill. A literature review identified
114 financial ratios that have proven useful for assessing financial condition.
Twenty indicators deemed appropriate for assessment of CAH financial
condition were chosen. In September 2004, the CEOs of 853 CAHs were
mailed a CAH Financial Indicators Report© (the Report) that included values
specifically for their CAH and national median values. State-level reports
were sent to State Flex Coordinators.
10) The Impact of Financial Ratio Analysis on Financial Decisions;
Laura Lase (2003)
The objective clearly sets out the project aim for the current dissertation. The
study will cover the financial ratio analysis highlighting different ratios which
are commonly used by companies and shareholders to evaluate the financial
position of the company at any point in time. However, the availability of up to
date companies' information is somewhat limited for its external users. This
restricts the use of financial ratio analysis by shareholders. Management of a
company is considered as internal user and shareholders orinvestment
companies or research analysts are considered as external users. The study
will estimate the impact of financial ratios on financial decisions of both
internal users and external users of information. A case study of Muslim
Commercial Bank, a local bank incorporated in Pakistan would be
investigated and compared with its competitor bank – Habib Bank Limited that
is also based in Pakistan. Both primary and secondary sources will be
RIMS Chandrapur 24
To study Ratio Analysis of Indian Oil Corporation Ltd.
collected and subject to different analytical procedures. For primary results
Likert modeling will be used to determine the level of impact on financial
decisions. While on the other hand secondary sources will be used for
performing a financial ratio analysis of the banks under review. Overall
conclusions regarding the topic will be presented in the final chapter of the
current dissertation.
11) A Review of the Theoretical and Empirical Basis of Financial
Ratio Analysis; Timo Salmi, Teppo Martikainen (2011)
This paper provides a critical review of the theoretical and empirical
basis of four central areas of financial ratio analysis. The research areas
reviewed are the functional form of the financial ratios, distributional
characteristics of financial ratios, classification of financial ratios, and the
estimation of the internal rate of return from financial statements. It is
observed that it is typical of financial ratio analysis research that there are
several unexpectedly distinct lines with research traditions of their own. A
common feature of all the areas of financial ratio analysis research seems to
be that while significant regularities can be observed, they are not necessarily
stable across the different ratios, industries, and time periods. This leaves
much space for the development of a more robust theoretical basis and for
further empirical research.
12) Financial Management and Ratio Analysis for Cooperative
Enterprises; David S. Chesnick RBS Agricultural Economist (2003)
This study discusses differences in financial management and goals
between the investor-oriented firms and cooperatives. It briefly reviews what
bankers look for when appraising potential borrowers. A summary of standard
financial ratios used to analyze a variety of business structures is included,
along with other modified ratios to address deficiencies evident in standard
ratios. Financial reports contain a lot of information. The main objective of
RIMS Chandrapur 25
To study Ratio Analysis of Indian Oil Corporation Ltd.
financial analysis is to sort through that information to find useful and relevant
data in analyzing a business. Literature is rich with financial analysis tools that
examine the performance and strength of businesses. However, not all
businesses are alike. Differences between IOFs and cooperatives mean that
some standard financial analyses do not relate well with cooperatives. This is
especially relevant for profit-oriented ratios. This report provides a supplement
to standard analysis with an eye toward cooperatives. Some ratios help
analyze the cooperative’s financial performance and cash flow analysis.
Managers and creditors should find these findings helpful in appraising the
financial strength of the cooperative. While there is no set standard at this
time, using these analysis tools should help the cooperative develop its own
performance measurements.
13) Liquidity Analysis Using Cash Flow Ratios and Traditional
Ratios: The Telecommunications Sector in Australia ; Ross Kirkham
(2003)
The purpose of this study is to examine the value in analysis of the
liquidity of companies using the traditional ratios as compared to the more
recently devised cash flow ratios. The study revealed that differences existed
between the traditional liquidity ratios and the cash flow ratios. A conclusion
based solely on the traditional ratios could well have lead to an incorrect
decision regarding the liquidity of a number of companie. In ceratin instances
that may have been that a company was deemed to be liquid when it faced
cah flow problems or that a company was not liquid when in fact it had
sufficient cash flow resources. The results support the proposition that
analysis based on the traditional liquidity ratios is best compared against the
cash flow ratios before reaching any conclusions regarding the financial
liquidity position.
RIMS Chandrapur 26

To study Ratio Analysis of Indian Oil Corporation Ltd.
14) the effect of financial ratios, firm size and cash flows from
operating activities on earnings per share: (an applied study: on
jordanian industrial sector); khalaf Taani (2006)
The objective of this study is to examine the effect of accounting
information on earning per share (EPS) by using five categories of financial
ratios. A sample of 40 companies listed in the Amman Stock Market was
selected. To measure the impact of financial ratios on EPS multiple
regression method and stepwise regression models are used by taking
profitability, liquidity, debit to equity, market ratio, size which is derived from
firm’s total assets, and cash flow from operation activities as independent
variables ,and EPS (Earning Per Share) as dependent variable. The results
show that profitability ratio (ROE), Market ratio (PBV), cash flow from
operation/sales, and leverage ratio (DER) has significant impact on earning
per share.
15) Application of the Factor Analysis on the Financial Ratios and
Validation of the Results by the Cluster Analysis: An Empirical Study on
the Indian Cement Industry; Anupam De, Gautam Bandyopadhyay, B.N.
Chakraborty (2008)
The initial objective of the study was to identify the underlying ategories
present amongst the financial ratios so as to confirm or modify the
conventional categorization of financial ratios. Another objective of this study
was to reduce the number of financial ratios to a smaller number of financial
ratios which can capture almost the same amount of desired information as
the original larger set of ratios could do. We started the study with 44 financial
ratios of 130 India Iron and Steel companies for a period of 10 years grouped
in 7 conventional categories. However, with the help of a series of statistical
analysis, we could reach to a final conclusion which speaks about the
presence of 8 underlying categories. A comparison can be made between the
categories of financial ratios used in the study and categories appeared in the
final results.
RIMS Chandrapur 27
To study Ratio Analysis of Indian Oil Corporation Ltd.
16) Ratio analysis - case study - Stortford Yachts Limited; Bob
This case study is intended as a self-test exercise on all of ratio
analysis. The answers are given as popup boxes to each question. However,
do try to work through them all first before submitting to temptation. The more
you practise calculating ratios, the easier it gets - we promise! Paul Marriot is
the director of Stortford Yachts Ltd. The company has traded for 30 years and
has in the past achieved very good levels of growth and return on capital, but
this is now changing. In recent time it has failed to introduce new product
lines, relying on traditional products and little has been invested in Research
or Product Development. You are a business planning consultant for a firm of
Management Consultants. Stortford Yachts is one of your clients. In recent
times the business has experienced increased turnover but a downturn in
overall performance. Paul Marriot has had a meeting with your Director and
he has stated that he wants to introduce tighter management control within
the company by introducing a system of responsibility accounting.
17) Analysis And Interpretation Of Financial Statements: Case
Studies; Sudip Das (2008)
Financial statements are formal records of the financial activities of a
business, person, or other entity and provide an overview of a business or
person's financial condition in both short and long term. They give an
accurate picture of a company’s condition and operating results in a
condensed form. Financial statements are used as a management tool
primarily by company executives and investor’s in assessing the overall
position and operating results of the company. Analysis and interpretation of
financial statements help in determining the liquidity position, long term
solvency, financial viability and profitability of a firm. Ratio analysis shows
whether the ompany is improving or deteriorating in past years. Moreover,
Comparison of ifferent aspects of all the firms can be done effectively with
this. It helps the clients to decide in which firm the risk is less or in which one
RIMS Chandrapur 28
To study Ratio Analysis of Indian Oil Corporation Ltd.
they should invest so that maximum benefit can be earned. Mining industries
are capital intensive; hence a lot of money is invested in it. So before
investing in such companies one has to carefully study its financial condition
and worthiness. Unfortunately very limited work has been done on analysis
and interpretation of financial statements of Indian for mining companies. An
attempt has been carried out in this project to analyze and interpret the
financial statements of five coal and non- coal mining companies.
18) Decision making techniques A CIMA case study l; Jenipher
Pringley (2010)
Businesses generate a huge amount of data. Management accountants
can use a number of the company’s key accounting statements to extract
greater meaning from this information.
Prospect plc - Balance sheet/statement of financial position as at 31 March
2012
The income statement sets out the total sales revenue and subtracts
the costs of generating that revenue to give operating profit. This is the
surplus earned by the normal operations of the company and tells us most
about underlying business performance.
To continue to use the earlier illustrative example, Prospect plc is
expanding rapidly as it builds a commercial property portfolio consisting
mainly of shops and offices. The company receives rents and also benefits
from any profits when it sells property and sites.
The result is a danger signal! Management accountants investigate this
sort of data in order to alert managers to worrying trends, as well as to
possible opportunities.
RIMS Chandrapur 29
To study Ratio Analysis of Indian Oil Corporation Ltd.
19) An example of the use of financial ratio analysis: the case of
Motorola; H. W. Collier; T. Grai; S. Haslit; C. B. McGowan (2007)
In this paper, we demonstrate the use of actual financial data for
financial ratio analysis. We construct a financial and industry analysis for
Motorola Corporation. The objective is to show students exactly how to
compute ratios for an actual company. This paper demonstrates the
difficulties in applying the principles of financial ratio analysis when the data
are not homogeneous as is the case in textbook examples. We use Motorola
as an example because the firm has several segments, two of which account
for the ajority of sales and represent two industries (semi-conductor and
communications) that have different aracteristics. The case illustrates the
complexity of financial analysis.
20) The role of ratio analysis in business decisions a case study
of o. jaco bros. ent. (nig.) ltd., aba, abia state; ilorah fabian uzochukwu
(2010)
Accounting information provided by means of financial statements- The
income statement and the Balance Sheet are often in summarized form.
Viewed on the surface, the truths about the results and the financial position
of a business hidden in them remain veiled. To be of optimal benefit and as
well enable the users make well – informed decisions, financial statements
need to be analyzed by means of ratios. Therefore, in order to establish the
role of ratio analysis in business decisions, this research is carried out, using
O. Jaco Bros. Ent. (Nig.) LTD., Aba Abia State as the Case study. The
researcher made use of both primary and secondary sources of data
collection. However, for the former, questionnaires were administered,
whereas for the later, relevant were received. The data Collected via the
primary data sources were analyzed using simple averages and percentages.
After ratios analysis conducted on the chapter four, mode at 95 level of
RIMS Chandrapur 30

To study Ratio Analysis of Indian Oil Corporation Ltd.
confidence (5% level of significance). Finally, it was established that ratios
analysis evils business decision.
21) Ratio anaylsis (Profitability analysis) Operating profit; Mack
Roswell (2003)
Ratios are determined from a company's financial information and used
for comparison purposes, e.g. operating profit to sales. This can be set out in
the form: Operating Profit : Revenue. Alternatively, it can be set out as a
percentage. If you refer back to the Profit and Loss Account, you can see the
operating profit margin shown in the chart. This figure is crucial to Cadbury
Schweppes as it relates to the second performance goal.
Here is another ratio you will find in your current course. This ratio
shows whether the company owes more money to its suppliers and bankers
than the assets it holds in the form of stocks, debtors and cash. If this number
is less than 1, then the company's short-term or liquid assets are greater then
its short-term liabilities.
This ratio is used in different ways for small and large companies.
Businessmen and women considering whether to trade with a new small
company would prefer to see this figure at 1.5 or above - as an indication that
the company is solvent and will be able to pay its debts. For large established
companies with good credit ratings, a lower ratio indicates an efficient use of
capital.
22) Company ratio analysis- case study of Tesco.; Peter Samsburg
(2011)
In 2010, the turnover of Tesco was £56,910m, compared to 2011, it
was £60,931m. In the first year of Tescoâs financial period, the company
had a total of £41,57m expenses and a final profit of £2336.0m while in
2011 they had a total expense of £42,21m and a profit of £2671.0m. This
meaning that they made a profit, as the total profit the company made was
greater than their expenses, which also increased in the following year, 2011.
RIMS Chandrapur 31
To study Ratio Analysis of Indian Oil Corporation Ltd.
It was observed that the more money they spent in the running of the
company, the more profit they made at the end of the year.
It was found that from the estimated gross profit that, for every £1 of
turnover the company made a profit. This can be seen as the gross profit for
the year 2010, came to 8.10% while that of 2011 came up to 8.30%.
23) A financial Ratio Analysis of Commercial Bank Performance
in South Africa Mabwe Kumbirai and Robert Webb* (2001)
This paper investigates the performance of South Africa’s commercial
banking sector for the period 2005- 2009. Financial ratios are employed to
measure the profitability, liquidity and credit quality performance of five large
South African based commercial banks. The study found that overall bank
performance increased considerably in the first two years of the analysis. A
significant change in trend is noticed at the onset of the global financial crisis
in 2007, reaching its peak during 2008-2009. This resulted in falling
profitability, low liquidity and deteriorating credit quality in the South African
Banking sector.
24) Financial Ratio Analysis, Using Annual Statement STUDIES
General: Mhd. Tariq Husain (2006)
Accounting ratios are probably the most widely used indictors in
bankruptcy studies and therefore in supplier solvency risk assessments. In
identifying which contractors pose the greatest potential risk of non-
performance, published financial statements provide readily available
information. Ratio analysis of non-public companies may be suspect since it is
based on self-disclosure. The Securities and Exchange Commission (SEC)
has identified critical information that they believe a potential equity holder
should have of firms. Since there is a high likelihood that a potentially
insolvent firm can also become a non-performing supplier, we may use the
financial statements to gain crucial business information. A brief review of the
RIMS Chandrapur 32
To study Ratio Analysis of Indian Oil Corporation Ltd.
literature suggests that there may be over a hundred ratios that can be
calculated from accounting numbers included in financial statements. Many of
these, however, will reflect similar attributes. Some means is generally used
to reduce the number of ratios to manageable proportions and avoid
duplication.
25) Financial ratio analysis of dcc bank limited rajnandgaon a
case study Anil Kumar Soni & Harjinder Pal Singh Saluja (2010)
District Central Cooperative Bank plays a vital role in the agriculture
and rural development of the Rajnandgaon. The DCC Bank has more reached
to the rural area of Rajnandgaon, through their huge network. The DCC Bank
Rajnandgaon acts as intermediaries between State Cooperative Bank (Apex
Bank) and Primary Agriculture Cooperative Societies (PACSs). The success
of cooperative credit movement in a district is largely depends on their
financial strength. DCC Bank is a key financing institution at the district level
which shoulders responsibility of meeting credit needs of different types of
cooperatives in the district. At present, most of the district central ooperative
banks are facing the problems of overdue, recovery, nonperforming assets
and other problems. Therefore, it is necessary to study financial ratios of DCC
Bank Rajnandgaon. This paper attempts to analyze the financial ratios of
DCC Bank Rajnandgaon during the period 2008-2009 to 2010-2011. An
analytical research design (Financial Ratio Analysis) is followed in the present
study. The study is based on secondary data. Empirical results show positive
and ufficient growth of DCC Bank Rajnandgaon. The liquidity and solvency
position of the bank was found to be sound.
RIMS Chandrapur 33
To study Ratio Analysis of Indian Oil Corporation Ltd.
26) Fuzzy Expert System for Financial Ratio Analysis (Case Study:
Cement Industry) J. Nazemi*, M.R. Asgari & S. A. Banijamali (2007)
This paper presents a new mathematical programming model for an
integrated production and air transportation in supply chain management with
sequence-dependent setup times in order to design an applied procedure for
the production and distribution schedule. The aim of this model is to minimize
the total supply chain cost consisting of the costs of distribution, production
earliness and tardiness, and delivery. Because of the complexity and NP-
hardness of this problem, two meta-heuristics based on genetic algorithm
(GA) and variable neighborhood search (VNS) are proposed. The parameters
of these algorithms and their appropriate operators are set and determined by
the use of the Taguchi experimental design. Then, the quality of the results
obtained by these algorithms is compared. The computational results show
that the developed VNS outperforms the proposed GA.
27) Analysis ratios for detecting financial statement fraud By
Cynthia Harrington, Associate Member, CFA (2006)
Detection of financial statement fraud is on the front burner. With
billions of losses behind us from such companies as Enron, Tyco, and
WorldCom, the numbers of cases has slowed but not stopped. Catching the
deeds early is important because the average financial statement fraud costs
businesses an average of $1 million, according to the ACFE's 2004 Report to
the Nation. Analysis ratios tested by an Indiana University professor show
promise in identifying possible infractions and helping CFEs focus their efforts
once retained to look into suspicions. Although the study is now six years old,
it appears to be increasingly used to help detect signs of financial
manipulations.
RIMS Chandrapur 34

To study Ratio Analysis of Indian Oil Corporation Ltd.
28) Victoria's Milling Case; Essay by renesmee, College,
Undergraduate, January 2010
Point of View:Assumed in this case is the perspective of VICMICO’s
Finance OfficerProblem:What are the possible causes of VICMICO’s cash
flow problem and how can they be addressed?Case Context:This case
requires an analysis of Victoria Milling Co.’s financial statements in order to
present a comprehensible explanation regarding the company’s debt position.
This paper utilizes the concept of Ratio Analysis to solve the afore-mentioned
problem. The case also examines issues of cash flow problem for VICMICO in
light of a formation of a working committee consisting of VICMICO’s
stakeholders. A statement released by VICMICO’s Board Chairman reported
that 70- 80% of VICMICO’s problem was due to the crisis of the whole
industry. Massive importation and dwindling prices of sugar were observed.
29) Case study – Horizontal trend analysis; Business Accounting
and Finance 2nd Edition Catherine Gowthorpe 2005 Thomson Learning
Ben asks Barney for the company figures towards the end of 20X4, but
Barney is able to provide figures up to 31 March 20X3 only. Nine months or
so after the yearend of 31 March 20X4 it would be reasonable to expect 20X4
accounts to be available. If they are not yet available it may indicate some
serious administrative problems within the business. There would be good
grounds for serious doubts if the accounts had been prepared but Barney
was unwilling to provide them. The question could be easily resolved by
checking the latest filing at Companies House. Also, the information Barney
provides is limited to the basic profit and loss and balance sheet statements.
Although he assures Ben that the audit report is fine, he does not include it in
the information; nor are the notes to the accounts or the directors’ report
made available. This looks a little suspect.
RIMS Chandrapur 35

To study Ratio Analysis of Indian Oil Corporation Ltd.
30) Comparison between Financial Ratios Analysis and Balanced
Scorecard; Khalad M.S. Alrafadi and Mazila Md-Yusuf Graduate
Business School, Faculty of Business Management, (2005)
Financial ratios have long been used as a tool to evaluate the overall
financial performance of a company. However, in early 1990s, a new method
called Balanced Scorecard has been introduced by Robert Kaplan and David
Norton to evaluate the overall controlling of a company. This study is a
conceptual paper comparing between the financial ratios analysis and
balanced scorecard method. The objective of this paper is to compare
between the benefits and problems of using financial ratios analysis and
Balanced Scorecard method in evaluating the overall control of the company.
As a result, we found that the Balanced Scorecard is more efficient than
financial ratios analysis.
RIMS Chandrapur 36
To study Ratio Analysis of Indian Oil Corporation Ltd.
Chapter 4
RESEARCH METHODOLOGY
Definition:
Methodology refers to the body of method used in conducting a study.
Different type of method is used in social research. In selecting method a
researcher should take in to account not only the suitability of method but also
adequate knowledge of method.
PRIMARY DATA:
Primary data can be collected either through experiment or through
survey. It the researcher conducts an experiments, he observes some
cluantitive measurements, or the data with help of which he examine the truth
contained in the hypothesis. Primary data can be obtained by common or by
observation. Common involve questioning respondents either verbally or in
writing. It is the data collected for one’s own research purpose. In my project
the primary sources of data used are-
1. Desk Procedures:-
It used as the tool to understand the general procedures of Accounting
Department of the company.
2. Accounting Policies:-
The Accounting Policies help me lot in getting all the accounting concepts
clear. It was also useful in understanding the accounting procedures.
3. Formal Discussions:-
I got a lot of opportunities to get into formal discussion with the Project
guide and manager of company.
4. Observation:-
One of the methods that I used to collect the data was the observation, the
careful observation of company’s overall activities and functioning gave me
good insight into the topic under study.
RIMS Chandrapur 37

To study Ratio Analysis of Indian Oil Corporation Ltd.
Primary data collection methods can be classified as:-
1) Survey (Techniques) Method
2) Observational Method
SECONDARY DATA:
Secondary data is data, which has been collected by individual or
agencies for purpose other than those of our particular research study. In my
project the secondary data used is books, internet sites, company sites,
memorandum of settlement and company’s documents.
This method includes the collection of data by using various system,
such like Internet, News paper etc.
Some of various systems are:
1. Internet.
2. News paper.
3. Magazines etc.
STATISTICAL PROCESSING
1) Ratio Analysis
2) Tabulation of data
3) Line and pie graphs.
RIMS Chandrapur 38

To study Ratio Analysis of Indian Oil Corporation Ltd.
OBJECTIVES OF THE STUDY
1) To study and express the relationship between two values of the
comparative statement.
2) To study the various ratios to determine the relationship of different
factor which have impact on the financial position of the company
3) To study the operating efficiency of profitability of the company
4) To study the liquidity position
IMPORTANCE AND SCOPE OF THE STUDY
1) This study will help to know financial position of Indian Oil Corporation.
2) It also covers study of balance sheets of last five years.
3) It helps to know different financial aspects in Company.
4) It will also helpful in knowing financial management of company.
HYPOTHESIS
1) The study of ratio analysis play very important role to obtained financial
data easily.
2) There is considerable increase in net sales compared to previous years
sales.
3) Company has strict control over total expenditure when compared with
increase in production.
4) There is considerable increase in earning per share.
RIMS Chandrapur 39
To study Ratio Analysis of Indian Oil Corporation Ltd.
DATA ANALYSIS AND INTERPRETATION
Mar ' 13 Mar ' 12 Mar ' 11 Mar ' 10Income
Operating income 2,69,438.08
3,07,123.99 2,47,359.24
2,16,498.85
Expenses
Material consumed 2,35,668.52
2,75,383.54 2,21,256.55
1,93,471.53
Manufacturing expenses
1,755.28 1,500.51 1,558.14 1,112.87
Personnel expenses
5,723.96 5,686.96 2,894.86 2,586.80
Selling expenses 10,488.13 9,684.04 8,753.07 7,733.07
Administrative expenses
1,824.74 1,888.60 2,004.30 1,375.23
Expenses capitalised
-1,121.28 -544.01 -403.58 -542.83
Cost of sales 2,54,339.35
2,93,599.64 2,36,063.34
2,05,736.67
Operating profit 15,098.73 13,524.35 11,295.90 10,762.18
Other recurring income
3,320.35 2,709.59 2,422.73 1,836.69
Adjusted PBDIT 18,419.08 16,233.94 13,718.63 12,598.87
Financial expenses 1,572.35 4,020.98 1,589.73 1,496.25
Depreciation 3,227.14 2,881.71 2,709.70 2,590.31Other write offs 133.98 317.64 236.53 113.43
Adjusted PBT 13,485.61 9,013.61 9,182.67 8,398.88Tax charges 3,097.87 1,364.71 3,104.54 2,949.46Adjusted PAT 10,387.74 7,648.90 6,078.13 5,449.42Non recurring items -130.67 -5,615.51 705.81 1,973.32
Other non cash adjustments
-36.52 915.26 178.64 76.73
Reported net profit 10,220.55 2,948.65 6,962.58 7,499.47
Earnings before appropriation
15,525.63 8,254.63 6,962.58 7,499.47
Equity dividend 3,156.34 910.48 655.81 2,250.89
RIMS Chandrapur 40
Profit loss account in crore
To study Ratio Analysis of Indian Oil Corporation Ltd.
Preference dividend - - - -
Dividend tax 508.83 154.74 76.48 361.72Retained earnings 11,860.46 7,189.41 6,230.29 4,886.86
RIMS Chandrapur 41
To study Ratio Analysis of Indian Oil Corporation Ltd.
Balance sheet In crore
Mar ' 13 Mar ' 12 Mar ' 11 Mar ' 10Sources of fundsOwner's fundEquity share capital 2,427.95 1,192.37 1,192.37 1,168.01Share application money - 21.60 - 24.36Preference share capital - - - -Reserves & surplus 48,124.88 42,789.29 39,893.88 33,664.92Loan fundsSecured loans 18,292.45 17,565.13 6,415.78 5,671.42Unsecured loans 26,273.80 27,406.93 29,107.39 21,411.27Total 95,119.08 88,975.32 76,609.42 61,939.98Uses of fundsFixed assetsGross block 71,780.60 62,104.64 56,731.50 54,770.29Less : revaluation reserve - - - -Less : accumulated depreciation
30,199.53 27,326.19 23,959.68 21,400.07
Net block 41,581.07 34,778.45 32,771.82 33,370.22Capital work-in-progress 21,268.63 18,186.05 9,170.22 4,394.30
Investments 22,370.25 32,232.13 21,535.78 19,990.86Net current assetsCurrent assets, loans & advances
60,971.48 45,234.47 53,506.07 43,966.26
Less : current liabilities & provisions
51,090.52 41,493.74 40,499.06 39,938.93
Total net current assets 9,880.96 3,740.73 13,007.01 4,027.33Miscellaneous expenses not written
18.17 37.96 124.59 157.27
Total 95,119.08 88,975.32 76,609.42 61,939.98Book value of unquoted investments
22,370.25 29,527.27 18,682.05 17,137.21
Market value of quoted investments
23,844.00 15,318.66 21,437.75 17,958.41
Contingent liabilities 25,715.07 26,317.31 25,574.96 22,676.47Number of equity shares outstanding (Lacs)
24279.52 11923.74 11923.74 11680.12
RIMS Chandrapur 42

To study Ratio Analysis of Indian Oil Corporation Ltd.
RATIO ANALYSIS AND INTERPRETATION
1) Adjusted EPS (Rs)
Net income-dividend on preferred stock
Average outstanding share
Year 2013 Year 2012 Year 2011 Year 20100
10
20
30
40
50
60
70
42.78
64.15
50.9846.66
Interpretation:
In the year 2009 there was adjusted eps was 36.29, the average
annual growth is17.88% As we can see in graph the rise in the adjusted eps
from 2009 to 2012 but in the year 2013 there is fall in Adjusted EPS (Rs)
Thus the adjusted EPS of the company is reduced in year 2013 as
compared to that previous years.
RIMS Chandrapur 43
Year Mar
2013
Mar
2012
Mar
2011
Mar
2010
Adjusted EPS (Rs) 42.78 64.15 50.98 46.66
To study Ratio Analysis of Indian Oil Corporation Ltd.
2) Dividend per share
Dps = d- sd
S
Year 2013 Year 2012 Year 2011 Year 20100
2
4
6
8
10
12
14
16
18
20
13
7.5
5.5
19
Interpretation:
In year 2010 there is noted highest growth among the five year
because equity dividend was greater than 2009, 2011, 2012. In 2013 equity
dividend is maximum than 4 years but dividend per share could not rise
because share outstanding period was maximum.
Divident per share is decreased every year which is not good sign.
RIMS Chandrapur 44
Year Mar 2013 Mar 2012 Mar 2011 Mar 2010
Dividend per
share
13.00 7.50 5.50 19.00
To study Ratio Analysis of Indian Oil Corporation Ltd.
3) Profitability ratio:
a) Operating Profit Margin (Return On Sales - ROS)=
Operating profit margin = Operating income
Total revenue
Year 2013 Year 2012 Year 2011 Year 20100
1
2
3
4
5
6 5.6
4.4 4.564.97
Interpretation:
Higher the profit margin is better for Operating profit margin, the
highest profit margin is noted in year 2013 company’s pricing strategy and
operating efficiency is better in year 2013. That indicates increase in operating
income of the company.
RIMS Chandrapur 45
Years Mar
2013
Mar
2012
Mar
2011
Mar
2010
Operating margin (%) 5.60 4.40 4.56 4.97

To study Ratio Analysis of Indian Oil Corporation Ltd.
Gross profit margin (%)
Gross Profit
Total Revenue
Year 2013 Year 2012 Year 2011 Year 20100
0.5
1
1.5
2
2.5
3
3.5
4
4.5
54.4
3.46 3.473.77
Interpretation:
In the year 2009 it is noted that was lowest among the years. Year after
year the profit margin is increasing so that company profit margin is better
Gross profit margin of the company is highest in year 2013 as
compared to that of previous years which indicates good financial position of
the company.
RIMS Chandrapur 46
Years March
2013
March
2012
March
2011
March
2010
Gross profit margin (%) 4.40 3.46 3.47 3.77

To study Ratio Analysis of Indian Oil Corporation Ltd.
Net Profit Margin=
Option 1: Net Income after Taxes
Revenue
Year 2013 2012 2011 2010
Net profit margin (%) 3.74 0.95 2.78 3.43
Year 2013 Year 2012 Year 2011 Year 20100
0.5
1
1.5
2
2.5
3
3.5
4
3.74
0.950000000000001
2.78
3.43
Interpretation:
From the figure it is noted that net profit margin was decreased in 2012
because there was decrease in net income after tax, but it showing rise in
year 2013 because net income after tax was maximum in this year compare
to other year. Increase in Net profit margin indicates good financial condition
of the company.
RIMS Chandrapur 47

To study Ratio Analysis of Indian Oil Corporation Ltd.
REPORTED RETURN ON NET WORTH (%)
Reported return on net worth (%)
Net income x 100
Shareholders equity
Year 2013 Year 2012 Year 2011 Year 20100
5
10
15
20
25
20.22
6.71
16.99
21.62
Interpretation:
The average rise in reported return on net worth is 20.35 from 2009 to
2013 so that we can say that the company profit is better from shareholder
fund.
RIMS Chandrapur 48
Years March
2013
March
2012
March
2011
March
2010
Reported return on
net worth (%)
20.22 6.71 16.99 21.62
To study Ratio Analysis of Indian Oil Corporation Ltd.
LEVERAGE RATIOS:
a) Long term debt / Equity:
Year 2013 Year 2012 Year 2011 Year 20100
0.05
0.1
0.15
0.2
0.25
0.3
0.35
0.4
0.45
0.5
0.40.43
0.34
0.38
Interpretation:
Long term debt/equity ratio is 0.40 in 2013, and 0.43 in year 2011, 0.34
in year 2011 and 0.38 in year 2010. There is increase long term debt/equity in
last four years.
There is showing average financial growth that is recorded16.66%
RIMS Chandrapur 49
Years 2013 2012 201
1
2010
Long term debt / Equity 0.40 0.43 0.34 0.38
To study Ratio Analysis of Indian Oil Corporation Ltd.
b) Total debt to equity
Year 2013 Year 2012 Year 2011 Year 20100
0.2
0.4
0.6
0.8
1
1.2
0.88
1.020.860000000000
001 0.770000000000001
Interpretation:
The total debt/equity is highest in year 2012 and decreased in year
2013. Which shows that the company uses the financial budgets are in
average level.
RIMS Chandrapur 50
years 2013 2012 201
1
2010
Total debt/equity 0.88 1.02 0.86 0.77

To study Ratio Analysis of Indian Oil Corporation Ltd.
Fixed assets turnover ratio
net sales
Net property, plan and equipment
Year 2013 Year 2012 Year 2011 Year 20100
1
2
3
4
5
6
3.78
4.98
4.383.97
Interpretation:
Fixed asset turnover ratio is decreased in year 2013 as compared to
that of in previous three years.
In the year 2012 it was noted that the company is used the net
property, plan effectively so that graph is in gone high than other years
RIMS Chandrapur 51
year 2013 201
2
2011 2010
Fixed assets turnover ratio 3.78 4.98 4.38 3.97
To study Ratio Analysis of Indian Oil Corporation Ltd.
5) LIQUIDITY RATIOS:
a) Current ratio: Current asset
Current liability
2013 2012 2011 2010
Current Assets
60971.48 45,234.47 53,506.07 43,966.26
Current Liabilities
51090.52 41,493.74 40,499.06 39,938.93
Current Ratio
1.193401 1.0901517 1.3211682 1.1008372
Year 2013 Year 2012 Year 2011 Year 20100
0.2
0.4
0.6
0.8
1
1.2
1.4
1.191.09
1.32
1.1
Interpretation:
The entire ratio shows more than 1 so that it directs us that company is
having good financial condition
RIMS Chandrapur 52
years 2013 2012 2011 2010
Current ratio 1.19 1.09 1.32 1.10

To study Ratio Analysis of Indian Oil Corporation Ltd.
Acid test ratio or liquid test ratio or quick ratio:
Liquid asset
Liquid liability
Year 2013
Year 2012
Year 2011
Year 2010
0 0.1 0.2 0.3 0.4 0.5 0.6
0.44
0.46
0.54
0.47
Interpretation:
Larger the acid test ratio shows higher the margin of safety, in he year
20118 it was noted greater than of other 4 year because total current asset
was noted maximum in year 2013 it fall down because liquid liability was
maximum and liquid asset was also greater
RIMS Chandrapur 53
Year
2013 201
2
2011 2010
Quick ratio 0.44 0.46 0.54 0.47
To study Ratio Analysis of Indian Oil Corporation Ltd.
Inventory Turnover ratio
COGS
Inventory
Year 2013 Year 2012 Year 2011 Year 20100
2
4
6
8
10
12
14
8.37
13.98
9.0910.1
Interpretation:
High inventory levels are unhealthy because they represent an
investment with a rate of return of zero. It also opens the company up to
trouble should prices begin to fall. That is showing in year 2012. But this ratio
is decreased in year 2013.
RIMS Chandrapur 54
Years 2013 2012 2011 2010
Inventory turnover ratio 8.37 13.98 9.09 10.10
To study Ratio Analysis of Indian Oil Corporation Ltd.
6) PAYOUT RATIOS:
A) Dividend Payout Ratio =
Dividend Payment per Share
Earnings per Share
Year 2013 Year 2012 Year 2011 Year 20100
5
10
15
20
25
30
35
4035.86 36.11
10.51
34.83
Interpretation:
The payout ratio provides an idea of how well earnings support the
dividend payments. In year 2011 it was noted the fall in dividend payout ratio
because the dividend per share was low If there is dividend profit ratio is
maximum, than it shows better performance of company
RIMS Chandrapur 55
Years 2013 2012 2011 2010
Dividend payout ratio (net
profit)
35.86 36.11 10.51 34.83

To study Ratio Analysis of Indian Oil Corporation Ltd.
b) Earning retention ratio
Net income-dividends
Net income
Year 2013 Year 2012 Year 2011 Year 20100
10
20
30
40
50
60
70
80
90
64.72
86.08 87.96
52.06
Interpretation:
Tracking year-on-year earnings retention ratios is important
to fundamental analysis to investigate whether a company is increasing or
decreasing its rate of re-investment
It is noted the fluctuation in Earning retention ratio showing average
0.06%growth only
RIMS Chandrapur 56
year 2013 2012 2011 2010
Earning retention ratio 64.72 86.08 87.96 52.06

To study Ratio Analysis of Indian Oil Corporation Ltd.
c) Cash earnings retention ratio
Year 2013 Year 2012 Year 2011 Year 20100
10
20
30
40
50
60
70
80
90
100
73.35
90.19 91.89
67.96
Interpretation:
Tracking year-on-year earnings retention ratios is important
to fundamental analysis to investigate whether a company is increasing or
decreasing its rate of re-investment Showing the average growth 0.01 during
four years
RIMS Chandrapur 57
year 2013 2012 2011 2010
Cash earnings retention ratio 73.35 90.19 91.89 67.96

To study Ratio Analysis of Indian Oil Corporation Ltd.
7) Coverage ratios
a)Financial charges coverage ratio(pre tax)
Year 2013 Year 2012 Year 2011 Year 20100
2
4
6
8
10
1211.71
4.04
8.63 8.42
Interpretation:
Financial charges coverage ratio is 11.71 in year 2013 which is highest
as compared to previous years.
The figure showing the average profit is of Financial charges coverage
ratio (pre tax) is 0.26 so that financial charges coverage ratio very low
RIMS Chandrapur 58
Years 2013 2012 2011 2010
Financial charges coverage
ratio(pre tax)
11.71 4.04 8.63 8.42

To study Ratio Analysis of Indian Oil Corporation Ltd.
Sales / Working Capital turnover
Sales
Working capital
YEAR 2013 2012 2011 2010
W.C 11.65 16.144 25.74 46.82
Year 2013 Year 2012 Year 2011 Year 20100
5
10
15
20
25
30
35
40
45
50
11.65
16.144
25.74
46.82
Interpretation:
The figure showing that in year 2010 the company shows that company
is not using sales and working capital properly. It arised in year 2012 but fall
from 2011 to 2013
RIMS Chandrapur 59

To study Ratio Analysis of Indian Oil Corporation Ltd.
Financial ratios of the company
RIMS Chandrapur 60
2013 2012 2011 2010Adjusted EPS (Rs) 42.78 64.15 50.98 46.66Dividend per share 13.00 7.50 5.50 19.00Profitability ratios
Operating margin (%) 5.60 4.40 4.56 4.97Gross profit margin (%) 4.40 3.46 3.47 3.77Net profit margin (%) 3.74 0.95 2.78 3.43Reported return on net worth (%)
20.22 6.71 16.99 21.62
Return on long term funds (%) 21.20 20.72 19.54 20.59Leverage ratios
Long term debt / Equity 0.40 0.43 0.34 0.38Total debt/equity 0.88 1.02 0.86 0.77Owners fund as % of total source
53.14 49.44 53.63 56.25
Fixed assets turnover ratio 3.78 4.98 4.38 3.97Liquidity ratios
Current ratio 1.19 1.09 1.32 1.10Current ratio (inc. st loans) 0.76 0.60 0.83 0.79Quick ratio 0.44 0.46 0.54 0.47Inventory turnover ratio 8.37 13.98 9.09 10.10Payout ratios
Dividend payout ratio (net profit)
35.86 36.11 10.51 34.83
Earning retention ratio 64.72 86.08 87.96 52.06Cash earnings retention ratio 73.35 90.19 91.89 67.96Coverage ratiosFinancial charges coverage ratio(pre tax)
11.71 4.04 8.63 8.42

To study Ratio Analysis of Indian Oil Corporation Ltd.
Chapter 5
FINDINGS AND CONCLUSION
The rise in the adjusted eps from 2009 to 2012 but in the year 2013
there is fall in Adjusted EPS (Rs)
In year 2010 there is noted highest growth among the five year
because equity dividend was greater than 2009, 2011, 2012. In 2013 equity
dividend is maximum than 4 years but dividend per share could not rise
because share outstanding period was maximum
Operating profit margin, the highest profit margin is noted in year 2013
company’s pricing strategy and operating efficiency is better in year 2013
In the year 2009 it is noted that was lowest among the years. Year after
year the profit margin is increasing so that company profit margin is better
Net profit margin was decreased in 2012 because there was decrease
in net income after tax, but it showing rise in year 2013 because net income
after tax was maximum in this year compare to other year.
The average rise in reported return on net worth is 20.35 from 2009 to
2013 so that we can say that the company profit is better from shareholder
fund. In the year 2012 it was noted that the company is used the net property,
plan effectively The Current ratio shows more than 1 so that it directs us that
company is having good financial condition . Larger the acid test ratio shows
higher the margin of safety, in he year 20118 it was noted greater than of
other 4 year because total current asset was noted maximum in year 2013 it
fall down because liquid liability was maximum and liquid asset was also
greater High inventory levels are unhealthy because they represent an
investment with a rate of return of zero. It also opens the company up to
trouble should prices begin to fall. That is showing in year 2012. In year 2009
the company shows that company is not using sales and working capital
properly. It arised in year 2010 but fall from 2011 to 2013
RIMS Chandrapur 61

To study Ratio Analysis of Indian Oil Corporation Ltd.
REFERENCES
1) Kobus Barnard AGA (SA) – B.Compt. (Hons); Using Financial Statements
& Ratio Analysis to manage your business effectively; (2007)
2) Thomas J. Liesz; Ratio analysis featuring the dupont method: an
overlooked topic in the finance module of small business management
and entrepreneurship courses; (2006)
3) Chetan Bhargav; Financial Ratio Analysis; (2004)
4) Nguyen Thi Kim Thoa; How accouting ratios affecting an investor’s
decision, some cases of construction companies; (2008)
5) John Bajkowski; Financial Ratio Analysis: Putting The Numbers To Work;
(2010)
6) S. Schmidgall and Agnes L. DeFranco; Ratio Analysis: Financial
Benchmarks For The Club Industry Raymond (2003)
7) Kate Barr; Analyzing Financial Information Using Ratios ; (2005)
8) Woo Gon Kim, Baker Ayoun; Ratio Analysis for the Hospitality Industry: A
cross Sector Comparison of Financial Trends in the Lodging, Restaurant,
Airline and Amusement Sectors; (2002)
9) Financial Indicators for Critical Access Hospitals; Chris Haris (2009)
10)Laura Lase; The Impact of Financial Ratio Analysis on Financial
Decisions; (2003)
11)Timo Salmi, Teppo Martikainen; A Review of the Theoretical and Empirical
Basis of Financial Ratio Analysis; (2011)
12)David S. Chesnick; Financial Management and Ratio Analysis for
Cooperative Enterprises; RBS Agricultural Economist (2003)
13)Liquidity Analysis Using Cash Flow Ratios and Traditional Ratios: The
Telecommunications Sector in Australia ; Ross Kirkham (2003
RIMS Chandrapur 62

To study Ratio Analysis of Indian Oil Corporation Ltd.
14) Khalaf Taani; The effect of financial ratios, firm size and cash flows from
operating activities on earnings per share: (an applied study: on
jordanian industrial sector); (2006)
15)Anupam De, Gautam Bandyopadhyay, B.N. Chakraborty; Application of
the Factor Analysis on the Financial Ratios and Validation of the Results
by the Cluster Analysis: An Empirical Study on the Indian Cement
Industry; (2008)
16)Bob Kepler; Ratio analysis - case study - Stortford Yachts Limited; (2008)
17)Sudip Das; Analysis And Interpretation Of Financial Statements: Case
Studies; (2008)
18)Jenipher Pringley; Decision making techniques A CIMA case study l;
(2010)
19); H. W. Collier; T. Grai; S. Haslit; C. B. McGowan; An example of the use
of financial ratio analysis: the case of Motorola (2007)
20)Ilorah Fabian Uzochukwu; The role of ratio analysis in business decisions
a case study of o. jaco bros. ent. (nig.) ltd., aba, abia state; (2010)
21)Mack Roswell; Ratio anaylsis (Profitability analysis) Operating profit;
(2003)
22)Peter Samsburg; Company ratio analysis- case study of Tesco.; (2011)
23)Mabwe Kumbirai and Robert Webb; A financial Ratio Analysis of
Commercial Bank Performance in South Africa * (2001)
24)Financial Ratio Analysis, Using Annual Statement STUDIES General:
Mhd. Tariq Husain (2006)
25)Anil Kumar Soni & Harjinder Pal Singh Saluja; Financial ratio analysis of
dcc bank limited rajnandgaon a case study (2010)
26)J. Nazemi*, M.R. Asgari & S. A. Banijamali; Fuzzy Expert System for
Financial Ratio Analysis (Case Study: Cement Industry) (2007)
27)Analysis ratios for detecting financial statement fraud By Cynthia
Harrington, Associate Member, CFA (2006)
RIMS Chandrapur 63
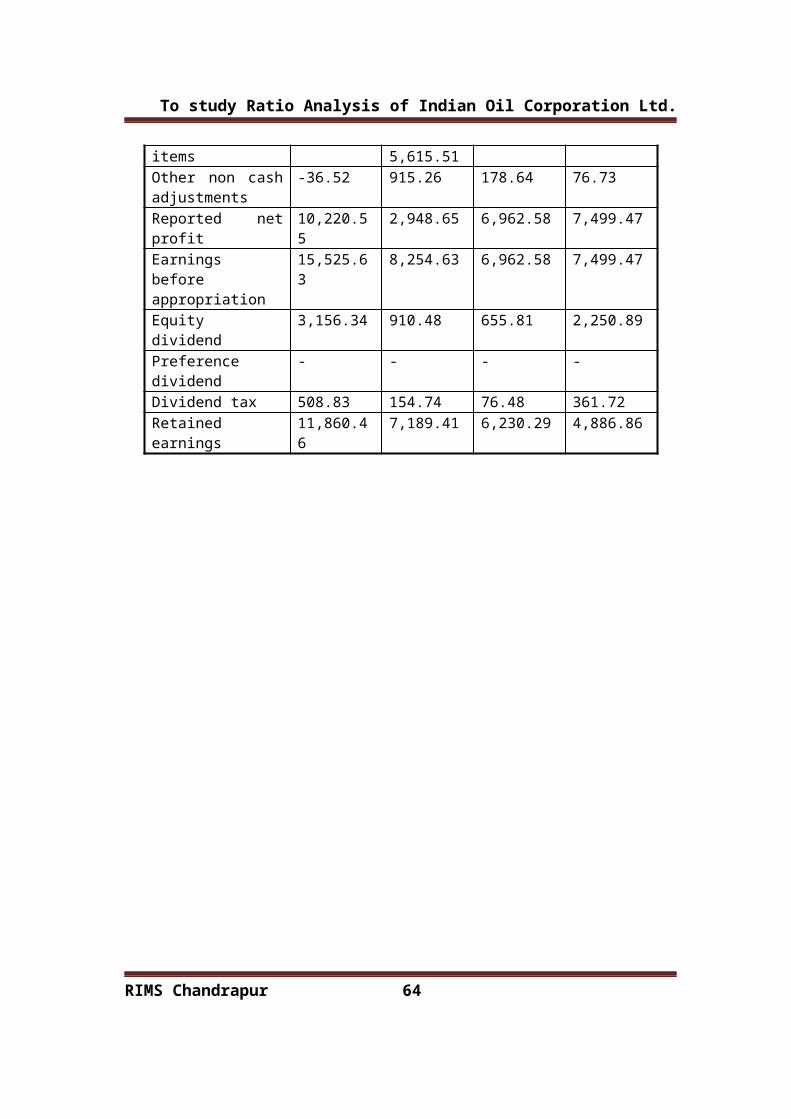
To study Ratio Analysis of Indian Oil Corporation Ltd.
28)Victoria's Milling Case; Essay by renesmee, College,
Undergraduate, January 2010
29)Case study – Horizontal trend analysis; Business Accounting and Finance
2nd Edition Catherine Gowthorpe 2005 Thomson Learning
30)Khalad M.S. Alrafadi and Mazila Md-Yusuf Graduate Business School,
Faculty of Business Management; Comparison between Financial Ratios
Analysis and Balanced Scorecard; (2005)
RIMS Chandrapur 64
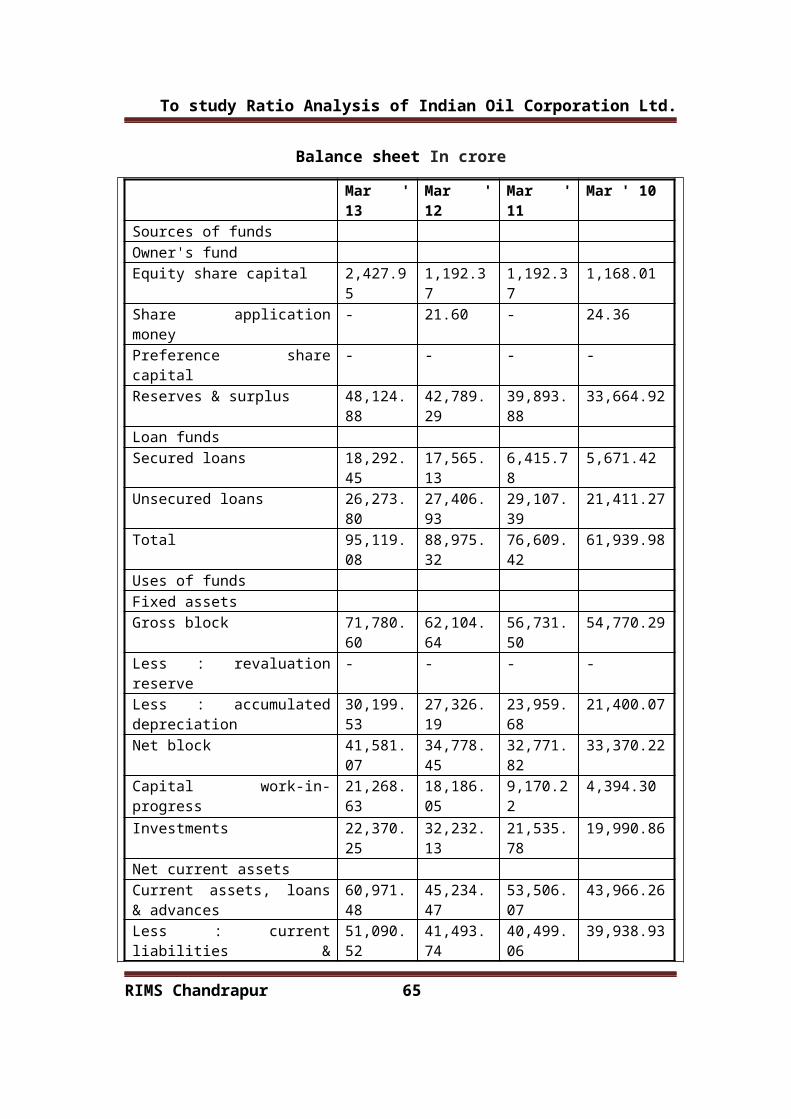
To study Ratio Analysis of Indian Oil Corporation Ltd.
BIBLIOGRAPHY
1) Financial Management,- Sushil Gupta ,6th edition, Kalyani Publishers
2) “Financial Management theory and practice”; Prasnna Chandra 7th
edition , Tata McGraw hills publishing house
3) New age international publisher research methodology methods and
techniques”; C.R Kothari second rived edition
WEBSITES:
1) www.wikipedia.com
2) www.investopedia.com
3) www.moneycontrol.com
4) www.iocl.com
RIMS Chandrapur 65
Related Documents