© UCO BANK 1 Investor Presentation FINANCIAL RESULTS FOR THE QUARTER ENDING JUNE’2013

Welcome message from author
This document is posted to help you gain knowledge. Please leave a comment to let me know what you think about it! Share it to your friends and learn new things together.
Transcript

© UCO BANK 1
Investor Presentation
FINANCIAL RESULTS FOR THE QUARTER ENDING
JUNE’2013

© UCO BANK
UCO BANK 3
UCO BANK 4
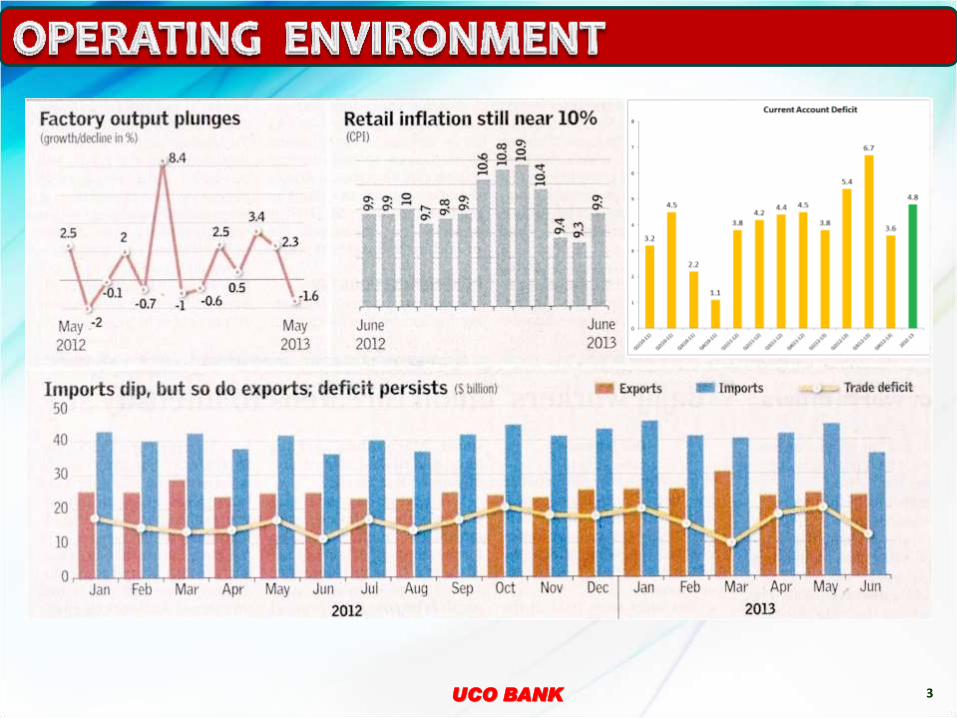
7.5 6.5
6.0 5.1 5.4 5.2
4.7 4.8 5.0
0
1
2
3
4
5
6
7
8
GDP at factor cost

UCO BANK 5
Earlier bank hard 4-tier structure that was changed to 3-tier.
Having regard to huge business potential, and spread of the branch network, a 4-tier organizational structure was reintroduced to strengthen span of control & business development.
Bank now comprise Head Office, 10 Circle Offices, 44 Zonal Offices & around 2650 branches.
During last three years Bank opened more branches (about 450) than in the entire last decade.
By Mar’14 Bank aim to have 3000 domestic branches and may open more ZOs & Circles.
The domestic branches have been categorized functionally into “general” branches and “specialized” branches.
The former has been made free from all mundane work that have been transferred to back offices to enable the branch personnel to devote quality time for customer acquisition and marketing of bank’s own and third party products.
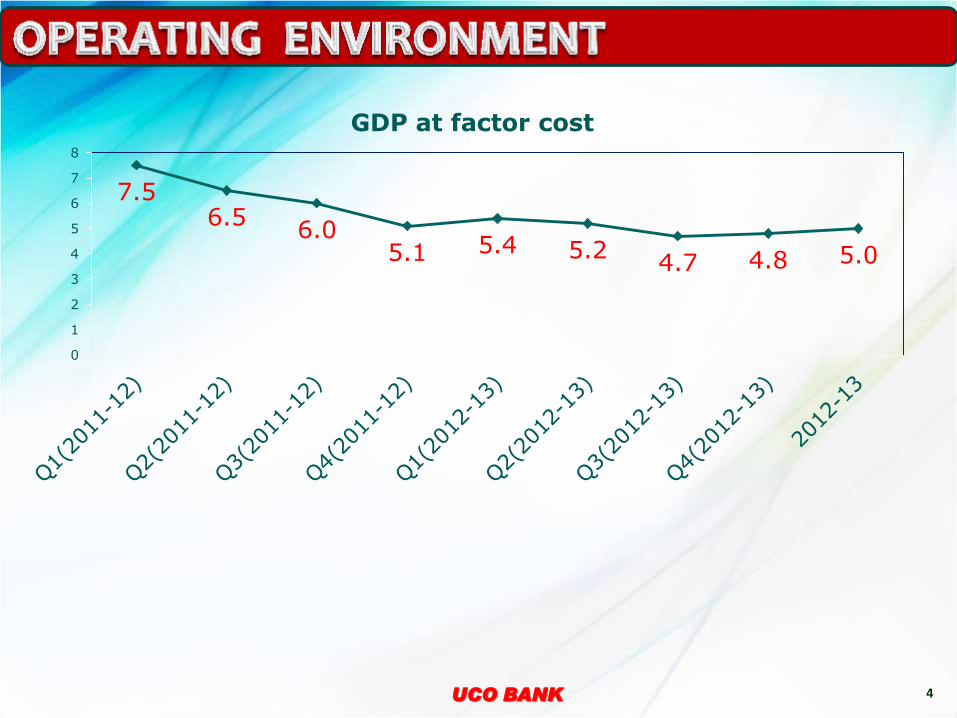
Bank’s CASA has jumped from 25.60% as on Jun’12 to 35.41% as on Jun’13.
The specialized branches (32 RLHs and 12 SME Hubs) were created to dispose loan proposals quickly by credit-groomed officers.

© UCO BANK

UCO BANK 7
[ Figs. in Rs.Crore excepting Ratios ]
Parameters As on / during the qtr ending Variation
Jun’13/Jun’12 (Y-o-Y)
Variation Jun’13/Mar’13
(Q-o-Q)
Jun’12 Mar'13 Jun’13 Amt % Amt %
Total Business 274173 305000 305719 31546 11.51 719 0.24
Total Deposit 155010 173431 177050 22040 14.22 3619 2.09
Total Advances 119163 131569 128669 9506 7.98 -2900 -2.20
Gross Investment 47432 52515 53293 5861 12.36 778 1.48
Operating Profit 780 1032 1264 484 62.05 232 22.48
Net Profit 362 50 511 149 41.16 461 922.00
CD Ratio (%) 76.87% 75.86% 72.67%

UCO BANK 8
[ Figs. in Rs.Crore excepting Ratios ]
Parameters Jun’12 Mar'13 Jun’13
Variation Jun’13/Jun’12
(Y-o-Y)
Variation Jun’13/Mar’13
(Q-o-Q)
Amt % Amt %
A)Deposit (Domestic) 141220 158386 160307 19087 13.52 1921 1.21
Current 9290 25694 26705 17415 187.46 1011 3.93
Savings 26861 29680 30053 3192 11.88 373 1.26
CASA 36151 55374 56758 20607 57.00 1384 2.50
Share of CASA (%) 25.60 34.96 35.41
Normal Term Deposit 42515 57686 64189 21674 50.98 6503 11.27
Core Deposit 78731 113040 121020 42289 53.71 7980 7.06
B)Deposit (Overseas) 13790 15045 16743 2953 21.41 1698 11.29
C)Total Deposit (Global) 155010 173431 177050 22040 14.22 3619 2.09
UCO BANK 9
FY’13 FY’14
Q1 Q2 Q3 Q4 Q1
CASA Rs. Crore 36151 38539 47691 55374 56758
% of Dom.Dep. 25.60 25.93 30.67 34.96 35.41
CA Rs. Crore 9290 10517 19341 25694 26705
% of Dom.Dep. 6.58 7.08 12.43 16.22 16.66
SA Rs. Crore 26861 28022 28350 29680 30053
% of Dom.Dep. 19.02 18.85 18.23 18.74 18.75

© UCO BANK

UCO BANK 11
[ Figs. in Rs.Crore excepting Ratios ]
POSITIONS AS AT YoY % change
QoQ % Change Q1FY 14 Q4FY13 Q1FY13
a)Interest Income 4206.93 4210.09 4174.57 0.78 -0.08%
Interest on Advances 3152.18 3127.13 3303.15 #-4.57 0.80%
Income on Investments 968.39 973.09 841.38 15.10 -0.48%
Other Interest Income 86.36 109.87 30.04 187.48 -21.40%
b)Other Income **461.89 316.97 232.82 98.39 45.72%
I)Total Income (a+b) : 4668.82 4527.06 4407.39 5.93 3.13%
II)Total Expenses 3404.38 3494.73 3626.97 -6.14 -2.59%
Interest Paid 2842.88 2862.41 3131.25 -9.21 -0.68%
Operating Expenses 561.50 632.32 495.72 13.27 -11.20%
III)Operating Profit (I-II): 1264.44 1032.33 780.42 62.02 22.48%
IV)Provisions 753.32 982.77 417.96 80.24 -23.35%
V)Net Profit (III-IV) : 511.12 49.56 362.46 41.01 931.32%
Net Interest Income 1364.05 1348.00 1043.32 30.74 1.19%
# Due to reduction in Base Rate ** Due to Treasury Trade Profit

UCO BANK 12
[ Figs. in Rs.Crore excepting Ratios ]
Q1 Y-o-Y change(%)
Q4 Q-o-Q change(%)
FY 14 FY13 2013
A)Capital & Liabilities 200373.38 179540.29 11.60 198651.40 0.87
Capital 2575.63 2487.71 3.53 2575.63 0.00
Reserves & Surplus 7718.98 6573.59 17.42 7106.79 8.61
Deposits 177050.3 155009.66 14.22 173431.04 2.09
Borrowings 6462.1 9764.27 -33.82 9492.43 -31.92
Other Liabilities & Provisions 6566.33 5705.06 15.10 6045.51 8.61
B)Assets 200373.38 179540.29 11.60 198651.40 0.87
Cash & Balances with RBI 7599.99 6798.82 11.78 5705.36 33.21
Balances with Banks 8218.01 2176.06 277.66 6638.76 23.79
Investments 52999.41 47130.18 12.45 52244.90 1.44
Advances 125141 116973.87 6.98 128282.86 -2.45
Fixed Assets 925.65 820.74 12.78 889.59 4.05
Other Assets 5489.32 5640.62 -2.68 4889.93 12.26
UCO BANK 13
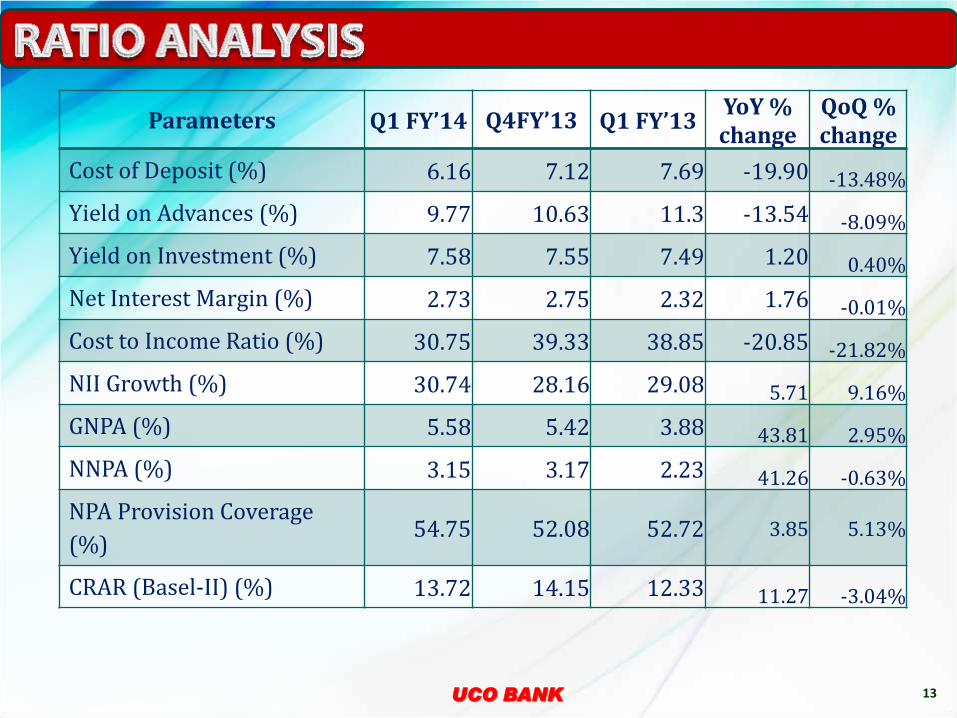
Parameters Q1 FY’14 Q4FY’13 Q1 FY’13 YoY % change
QoQ % change
Cost of Deposit (%) 6.16 7.12 7.69 -19.90 -13.48%
Yield on Advances (%) 9.77 10.63 11.3 -13.54 -8.09%
Yield on Investment (%) 7.58 7.55 7.49 1.20 0.40%
Net Interest Margin (%) 2.73 2.75 2.32 1.76 -0.01%
Cost to Income Ratio (%) 30.75 39.33 38.85 -20.85 -21.82%
NII Growth (%) 30.74 28.16 29.08 5.71 9.16%
GNPA (%) 5.58 5.42 3.88 43.81 2.95%
NNPA (%) 3.15 3.17 2.23 41.26 -0.63%
NPA Provision Coverage
(%) 54.75 52.08 52.72 3.85 5.13%
CRAR (Basel-II) (%) 13.72 14.15 12.33 11.27 -3.04%
UCO BANK 14
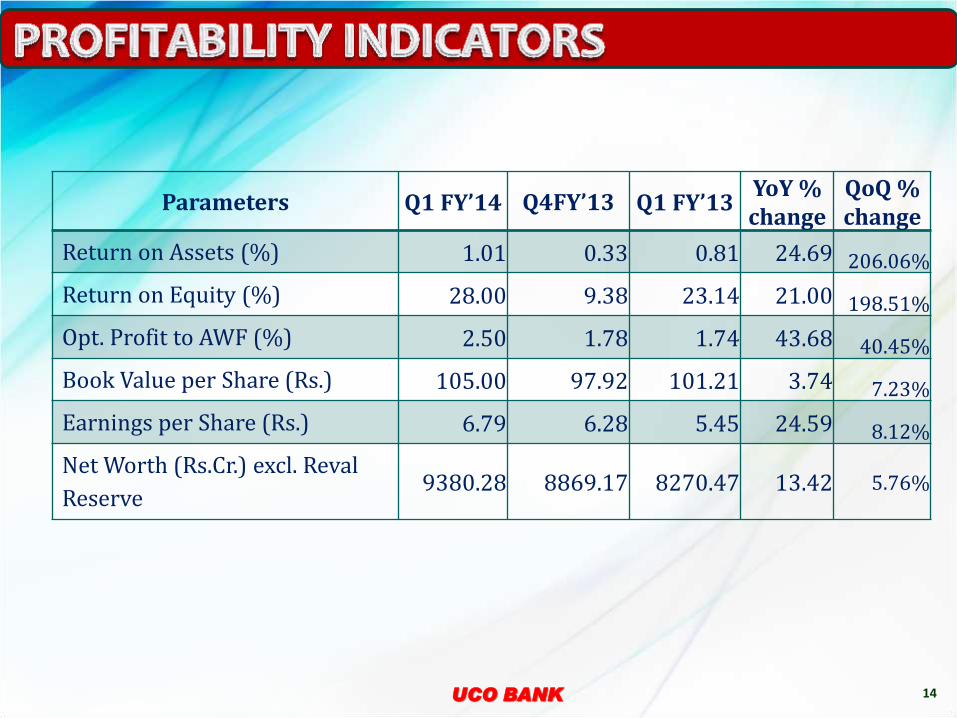
Parameters Q1 FY’14 Q4FY’13 Q1 FY’13 YoY % change
QoQ % change
Return on Assets (%) 1.01 0.33 0.81 24.69 206.06%
Return on Equity (%) 28.00 9.38 23.14 21.00 198.51%
Opt. Profit to AWF (%) 2.50 1.78 1.74 43.68 40.45%
Book Value per Share (Rs.) 105.00 97.92 101.21 3.74 7.23%
Earnings per Share (Rs.) 6.79 6.28 5.45 24.59 8.12%
Net Worth (Rs.Cr.) excl. Reval
Reserve 9380.28 8869.17 8270.47 13.42 5.76%
UCO BANK 15
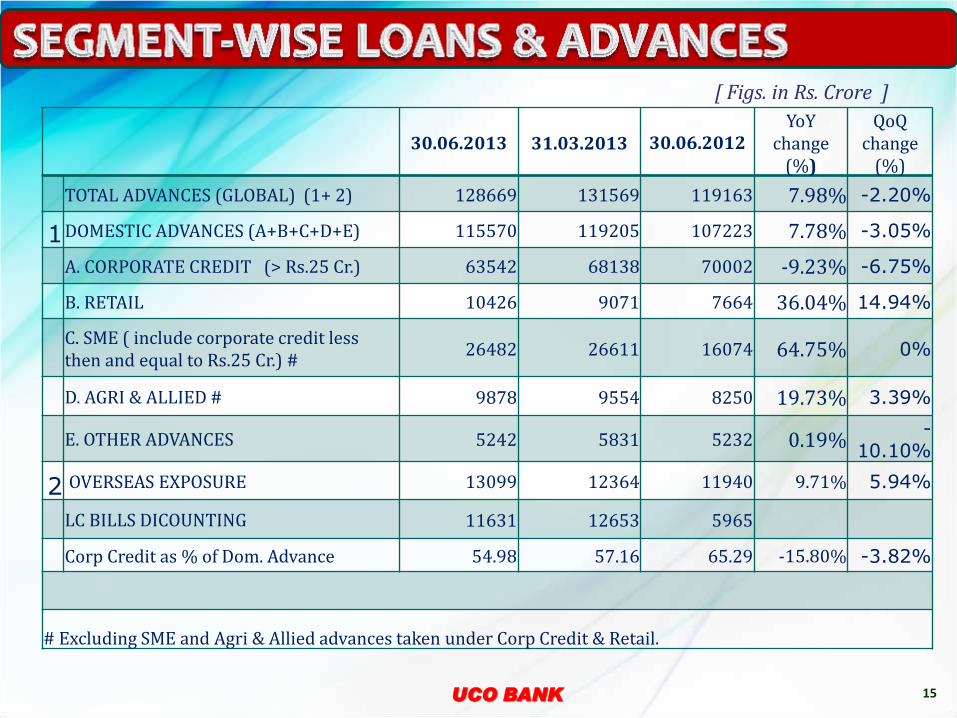
[ Figs. in Rs. Crore ]
30.06.2013 31.03.2013 30.06.2012 YoY
change (%)
QoQ change
(%)
TOTAL ADVANCES (GLOBAL) (1+ 2) 128669 131569 119163 7.98% -2.20%
1 DOMESTIC ADVANCES (A+B+C+D+E) 115570 119205 107223 7.78% -3.05%
A. CORPORATE CREDIT (> Rs.25 Cr.) 63542 68138 70002 -9.23% -6.75%
B. RETAIL 10426 9071 7664 36.04% 14.94%
C. SME ( include corporate credit less then and equal to Rs.25 Cr.) #
26482 26611 16074 64.75% 0%
D. AGRI & ALLIED # 9878 9554 8250 19.73% 3.39%
E. OTHER ADVANCES 5242 5831 5232 0.19% -
10.10%
2 OVERSEAS EXPOSURE 13099 12364 11940 9.71% 5.94%
LC BILLS DICOUNTING 11631 12653 5965
Corp Credit as % of Dom. Advance 54.98 57.16 65.29 -15.80% -3.82%
# Excluding SME and Agri & Allied advances taken under Corp Credit & Retail.
UCO BANK 16
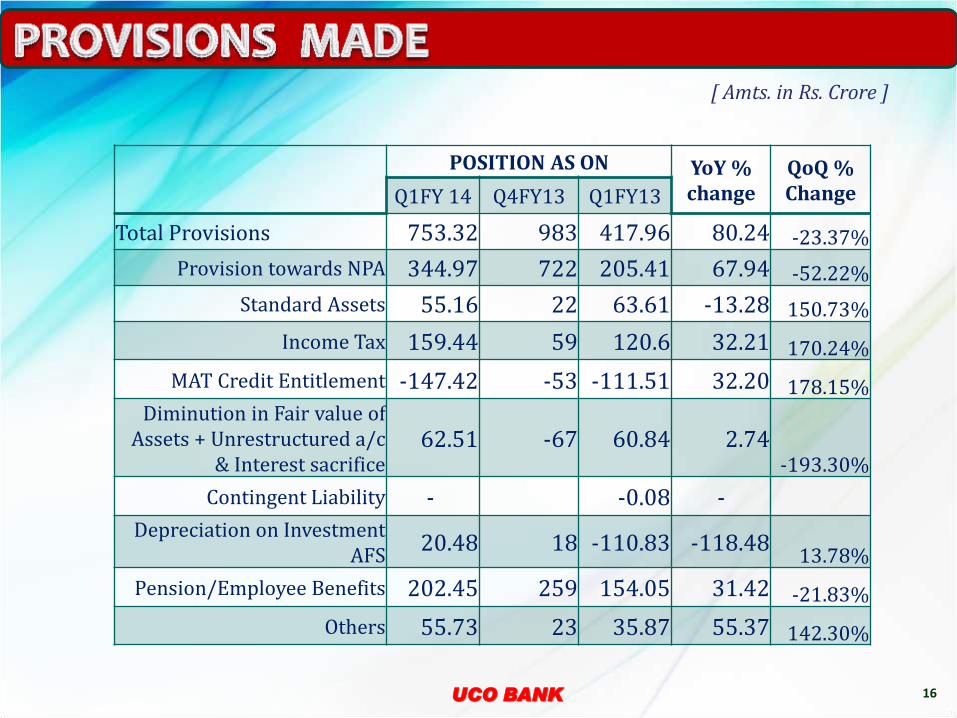
[ Amts. in Rs. Crore ]
POSITION AS ON YoY % change
QoQ % Change Q1FY 14 Q4FY13 Q1FY13
Total Provisions 753.32 983 417.96 80.24 -23.37%
Provision towards NPA 344.97 722 205.41 67.94 -52.22%
Standard Assets 55.16 22 63.61 -13.28 150.73%
Income Tax 159.44 59 120.6 32.21 170.24%
MAT Credit Entitlement -147.42 -53 -111.51 32.20 178.15% Diminution in Fair value of
Assets + Unrestructured a/c & Interest sacrifice
62.51 -67 60.84 2.74 -193.30%
Contingent Liability - -0.08 -
Depreciation on Investment AFS
20.48 18 -110.83 -118.48 13.78%
Pension/Employee Benefits 202.45 259 154.05 31.42 -21.83%
Others 55.73 23 35.87 55.37 142.30%

UCO BANK 17
[ Figs. in Rs.Crore excepting Ratios ]
Parameters Q1
FY’14 Q4
FY’13 Q1
FY’13
Total Risk Weighted Assets 101893.52 101044.90 96808.90
Credit Risk 87812.28 87416.69 84863.24
Market Risk 5700.99 6494.13 4811.58
Operational Risk 8380.25 7134.08 7134.08
Total Capital Fund 13979.67 14298.07 11935.70
Tier I Capital Fund 8969.77 9157.13 7890.76
Tier II Capital Fund 5009.90 5140.94 4044.94
Under BASEL II
Capital Adequacy Ratio (%) 13.72 14.15 12.33
Tier I (%) 8.80 9.06 8.15
Tier II (%) 4.92 5.09 4.18
Under BASEL III
Capital Adequacy Ratio (%) 13.44 -
-
Tier I (%) 8.74 - - Tier II (%) 4.70 - -
UCO BANK 18
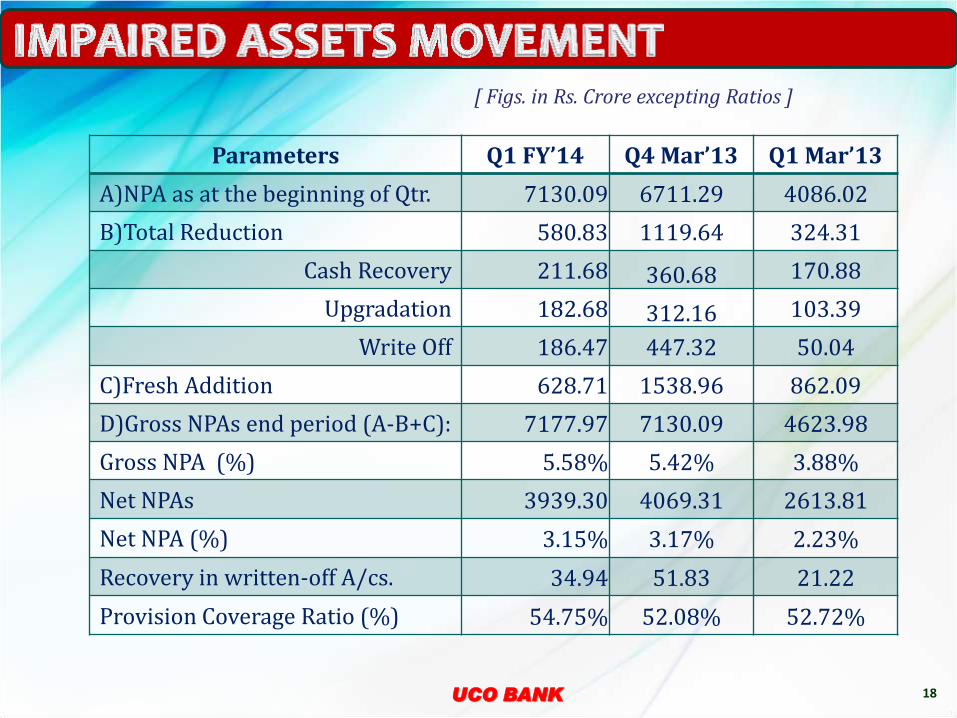
[ Figs. in Rs. Crore excepting Ratios ]
Parameters Q1 FY’14 Q4 Mar’13 Q1 Mar’13
A)NPA as at the beginning of Qtr. 7130.09 6711.29 4086.02
B)Total Reduction 580.83 1119.64 324.31
Cash Recovery 211.68 360.68 170.88
Upgradation 182.68 312.16 103.39
Write Off 186.47 447.32 50.04
C)Fresh Addition 628.71 1538.96 862.09
D)Gross NPAs end period (A-B+C): 7177.97 7130.09 4623.98
Gross NPA (%) 5.58% 5.42% 3.88%
Net NPAs 3939.30 4069.31 2613.81
Net NPA (%) 3.15% 3.17% 2.23%
Recovery in written-off A/cs. 34.94 51.83 21.22
Provision Coverage Ratio (%) 54.75% 52.08% 52.72%
UCO BANK 19
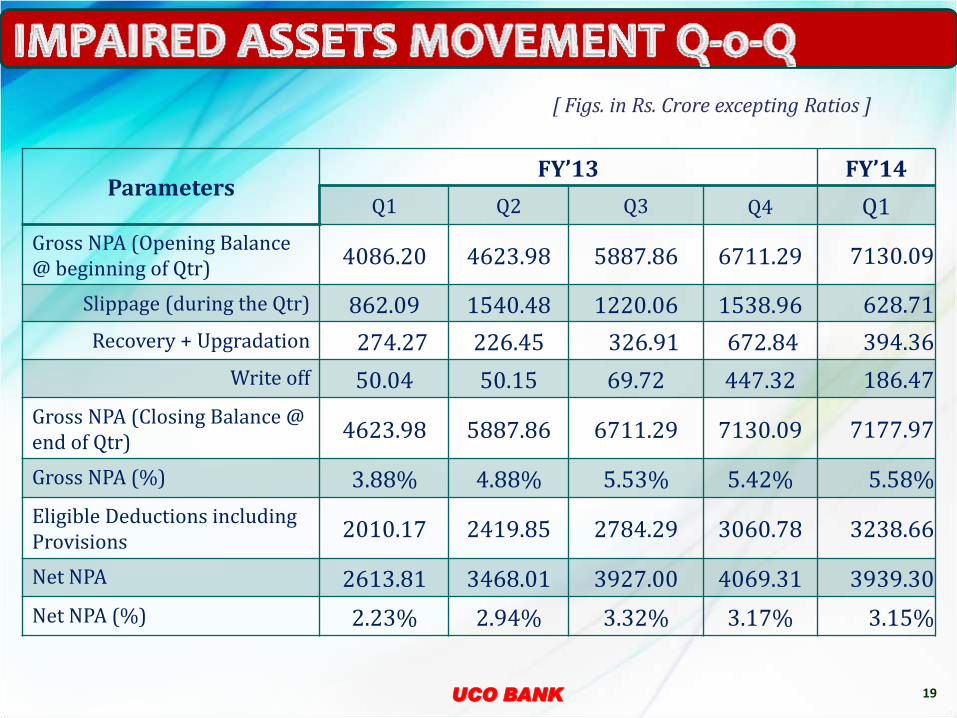
[ Figs. in Rs. Crore excepting Ratios ]
Parameters FY’13 FY’14
Q1 Q2 Q3 Q4 Q1
Gross NPA (Opening Balance @ beginning of Qtr)
4086.20 4623.98 5887.86 6711.29 7130.09
Slippage (during the Qtr) 862.09 1540.48 1220.06 1538.96 628.71
Recovery + Upgradation 274.27 226.45 326.91 672.84 394.36
Write off 50.04 50.15 69.72 447.32 186.47
Gross NPA (Closing Balance @ end of Qtr)
4623.98 5887.86 6711.29 7130.09 7177.97
Gross NPA (%) 3.88% 4.88% 5.53% 5.42% 5.58%
Eligible Deductions including Provisions
2010.17 2419.85 2784.29 3060.78 3238.66
Net NPA 2613.81 3468.01 3927.00 4069.31 3939.30
Net NPA (%) 2.23% 2.94% 3.32% 3.17% 3.15%
UCO BANK 20
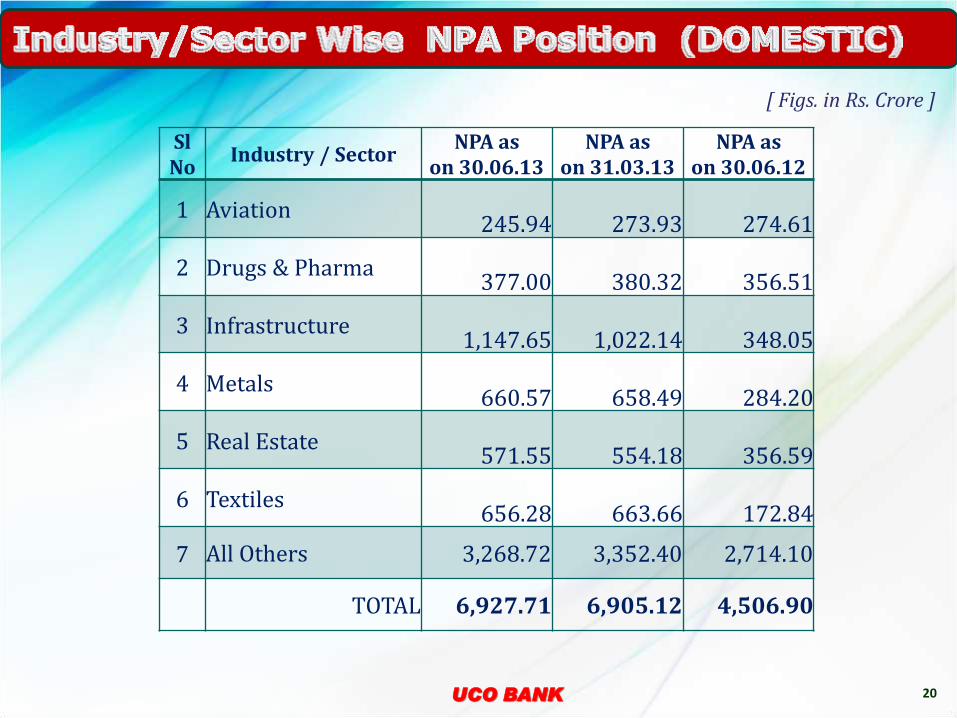
Sl No
Industry / Sector NPA as
on 30.06.13 NPA as
on 31.03.13 NPA as
on 30.06.12
1 Aviation
245.94
273.93
274.61
2 Drugs & Pharma
377.00
380.32
356.51
3 Infrastructure
1,147.65
1,022.14
348.05
4 Metals
660.57
658.49
284.20
5 Real Estate
571.55
554.18
356.59
6 Textiles
656.28
663.66
172.84
7 All Others 3,268.72 3,352.40 2,714.10
TOTAL 6,927.71 6,905.12 4,506.90
[ Figs. in Rs. Crore ]

UCO BANK 21
Details Amt.(Cr.)
Total Restructured Assets as on 01.04.2013 8743
Add: Standard Accounts restructured during Q1FY’14 2136
Less: Total Standard Restructured accounts closed 1162
Total Standard Restructured as on 30.06.2013 9717
% of Restructured Advances/Portfolio to Total Loans and Advances for the Quarter ending June , 2013 [Global Advances being Rs. 128,669 crores]
7.55% *
Industry March 13
Rs. in Crore June 13
Rs. in Crore
Power and Distribution 5092 5893 Infrastructure 1344 1205 Iron and Steel 996 710 Aviation 758 758 Information technology 120 124 Others 434 1027
Total 8743 9717
UCO BANK 22
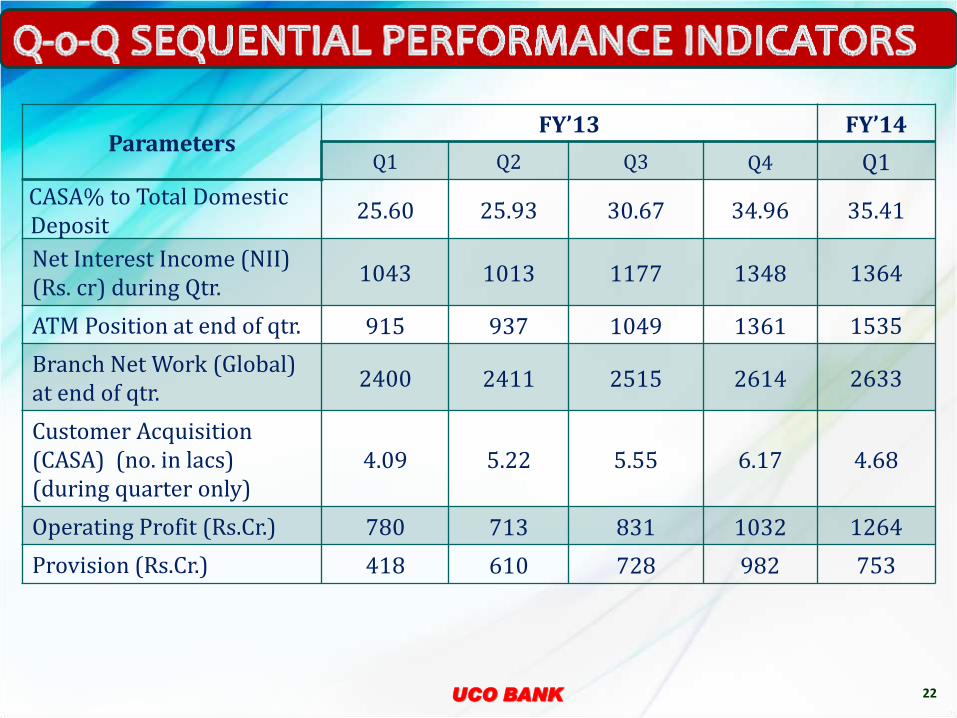
Parameters FY’13 FY’14
Q1 Q2 Q3 Q4 Q1
CASA% to Total Domestic Deposit
25.60 25.93 30.67 34.96 35.41
Net Interest Income (NII) (Rs. cr) during Qtr.
1043 1013 1177 1348 1364
ATM Position at end of qtr. 915 937 1049 1361 1535
Branch Net Work (Global) at end of qtr.
2400 2411 2515 2614 2633
Customer Acquisition (CASA) (no. in lacs) (during quarter only)
4.09 5.22 5.55 6.17 4.68
Operating Profit (Rs.Cr.) 780 713 831 1032 1264
Provision (Rs.Cr.) 418 610 728 982 753

UCO BANK 23
FY 2008-09 FY 2009-10 FY 2010-11 FY 2011-12 FY 2012-13
Officers Staff Officers Staff Officers Staff Officers Staff Officers Staff
Opening Position 8489 15339 8870 14737 8798 14446 8274 14752 9059 14088 Reduction during FY (Retirement & Promotion to Officer cadre etc.) 455 1657 515 678 577 695 470 1531 719 1392 Addition in FY (Recruitment & Promotion) 836 1055 443 387 53 1001 1255 867 2481 592
Closing Balance 8870 14737 8798 14446 8274 14752 9059 14088 10821 13288 Total Employee 23607 23244 23026 23147 24109
31-Mar-09 31-Mar-10 31-Mar-11 31-Mar-12 31-Mar-13
Officers Staff Officers Staff Officers Staff Officers Staff Officers Staff
<= 30 year 415 600 675 635 602 618 1011 1222 2532 1323 >30 years to 45 years 798 2374 780 2179 909 2169 1038 1897 1485 2258 > 45 years to 55 years 5708 9387 5379 8731 3954 7069 3703 6107 3216 5761 >55 years 1949 2376 1964 2901 2809 4896 3307 4862 3588 3946
8870 14737 8798 14446 8274 14752 9059 14088 10821 13288

© UCO BANK
UCO BANK 25
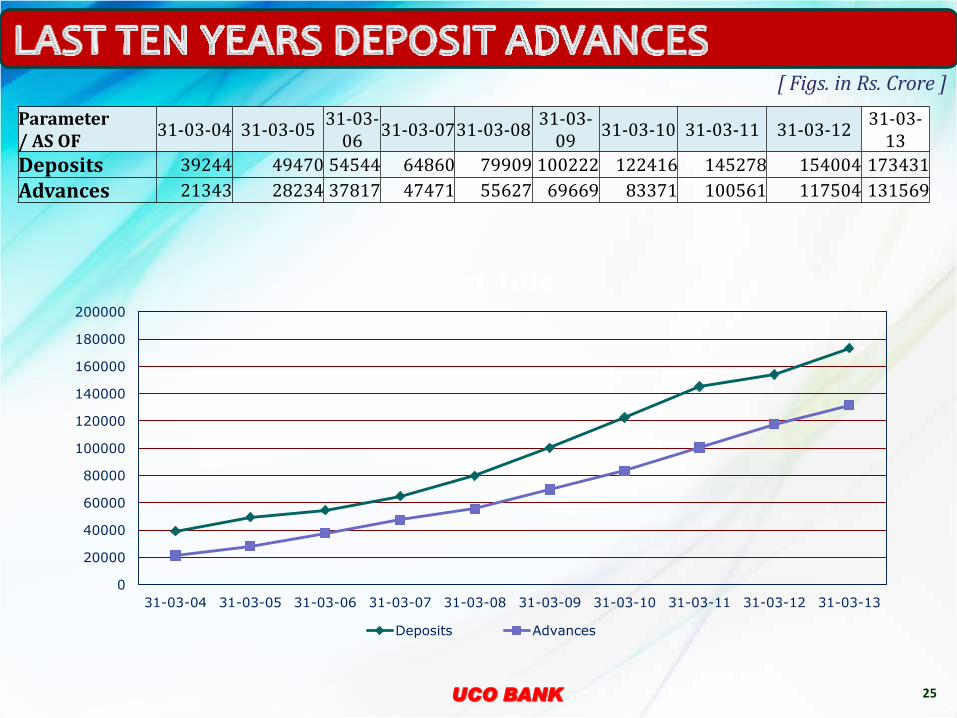
Parameter / AS OF
31-03-04 31-03-05 31-03-
06 31-03-07 31-03-08
31-03-09
31-03-10 31-03-11 31-03-12 31-03-
13
Deposits 39244 49470 54544 64860 79909 100222 122416 145278 154004 173431
Advances 21343 28234 37817 47471 55627 69669 83371 100561 117504 131569
0
20000
40000
60000
80000
100000
120000
140000
160000
180000
200000
31-03-04 31-03-05 31-03-06 31-03-07 31-03-08 31-03-09 31-03-10 31-03-11 31-03-12 31-03-13
Chart Title
Deposits Advances
[ Figs. in Rs. Crore ]
UCO BANK 26
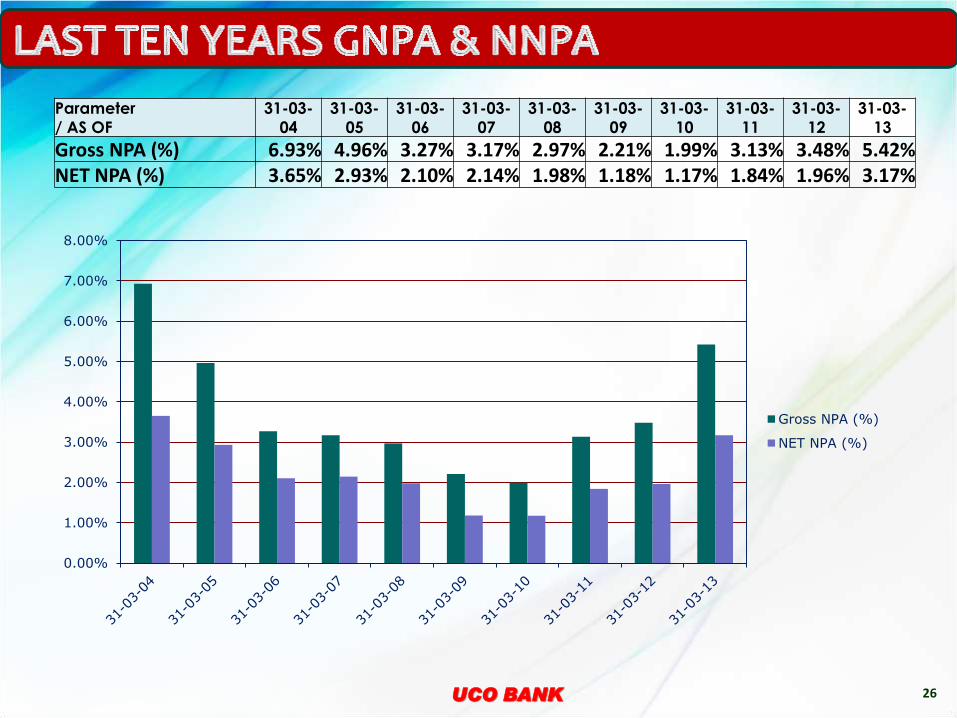
Parameter
/ AS OF
31-03-
04
31-03-
05
31-03-
06
31-03-
07
31-03-
08
31-03-
09
31-03-
10
31-03-
11
31-03-
12
31-03-
13
Gross NPA (%) 6.93% 4.96% 3.27% 3.17% 2.97% 2.21% 1.99% 3.13% 3.48% 5.42% NET NPA (%) 3.65% 2.93% 2.10% 2.14% 1.98% 1.18% 1.17% 1.84% 1.96% 3.17%
0.00%
1.00%
2.00%
3.00%
4.00%
5.00%
6.00%
7.00%
8.00%
Gross NPA (%)
NET NPA (%)

UCO BANK 27
PARTICULARS 2006-07 2007-08 2008-09 2009-10 2010-11 2011-12 2012-13
Gross NPA at the beginning
of the year 1234 1506 1652 1539 1666 3150 4086
Additions during the Year
(Fresh NPA) 1004 1035 666 1109 2730 2401 5162
Sub-Total (A) 2238 2541 2318 2648 4396 5551 9248
Less:
Cash Recovery 317 422 423 399 434 658 828
Upgradation 162 161 253 212 226 417 673
Write-off 253 306 103 371 586 391 617
Sub-Total (B) 732 889 779 982 1246 1465 2118 Gross NPA at the end of
year ( A - B ) 1506 1652 1539 1666 3150 4086 7130
%Gross NPA 3.17 2.97 2.21 1.99 3.13 3.48 5.42
%Net NPA 2.14 1.98 1.18 1.17 1.84 1.96 3.17
Total Advances (Global) 46971 55627 69669 83371 100561 117504 131569
Provision Coverage Ratio 33.20 33.88 47.21 50.00 51.60 54.39 52.08
[ Figs. in Rs. Crore excepting Ratios ]

UCO BANK 28
Particulars 2008-09 2009-10 2010-11 2011-12 2012-13
BRANCHES
(GLOBAL) 2068 2152 2206 2394 2614
CUSTOMER
BASE (Lacs) 156.37 175.27 184.20 196.08 223.00
EMPLOYEE
STRENGTH 23607 23244 23026 23147 24109

© UCO BANK

© UCO BANK
Operating Profit zooms 62% YoY & increases 23% QoQ
Net Profit grows sharply 41% YoY & registers more than 10 times jump over previous qtr.
Profit from sale of investments grows more than 18 times in Q1FY14 over Q1FY13
Cost to Income ratio registers sharp drop to 30.75% from 38.85% a year ago.
Related Documents