INVESTOR PRESENTATION MAY 2018

Welcome message from author
This document is posted to help you gain knowledge. Please leave a comment to let me know what you think about it! Share it to your friends and learn new things together.
Transcript

INVESTOR
PRESENTATIONMAY 2018

FORWARD LOOKING STATEMENTS
This document may contain forward-looking statements and/or assumptions that involve known and/or unknown risks. Such statements and
assumptions may include: the size and/or economics of the market, plans and intentions to increase market share, expand geographically,
and/or further develop product capabilities; the results of strategic initiatives; and the impact of competition. These forward-looking
statements and assumptions are based on the expectations of Solium and involve known and unknown risks, uncertainties and other
factors that may cause or influence the actual results, market performance, or achievements to differ from any future expected results,
performance or achievements expressed or implied by such forward-looking statements. Solium is not making any representation,
expressed or implied, as to the accuracy or completeness of the statements or assumption of future performance and operational results
made in this document. Important factors that could cause or influence such differences include, but are not limited to: inaccurate
assumptions on the size and/or economic parameters of the market; changes in economic or business conditions in general; changes in the
competition; changes in services provided by Solium’s suppliers, alliance partners, and channel partners; changes in customer needs and
expectations; and any governmental or regulatory actions. In making an investment decision, prospective investors must make their own
determinations as to the reliability of these projections, assumptions and forward-looking statements. Solium undertakes no obligation to
update any forward-looking statement, assumptions, or the other information herein in order to reflect events or circumstances that may
arise after the date of this document. The information in this document is not to be copied, printed or distributed without the prior written
approval of Solium.
2

A 500-EMPLOYEE
COMPANY CAN GENERATE
12,500 SHARE-BASED
TRANSACTIONS EACH YEAR
3

4
LAYER ON MULTIPLE
JURISDICTIONS,
REPORTING CURRENCIES
AND TAX REGIMES
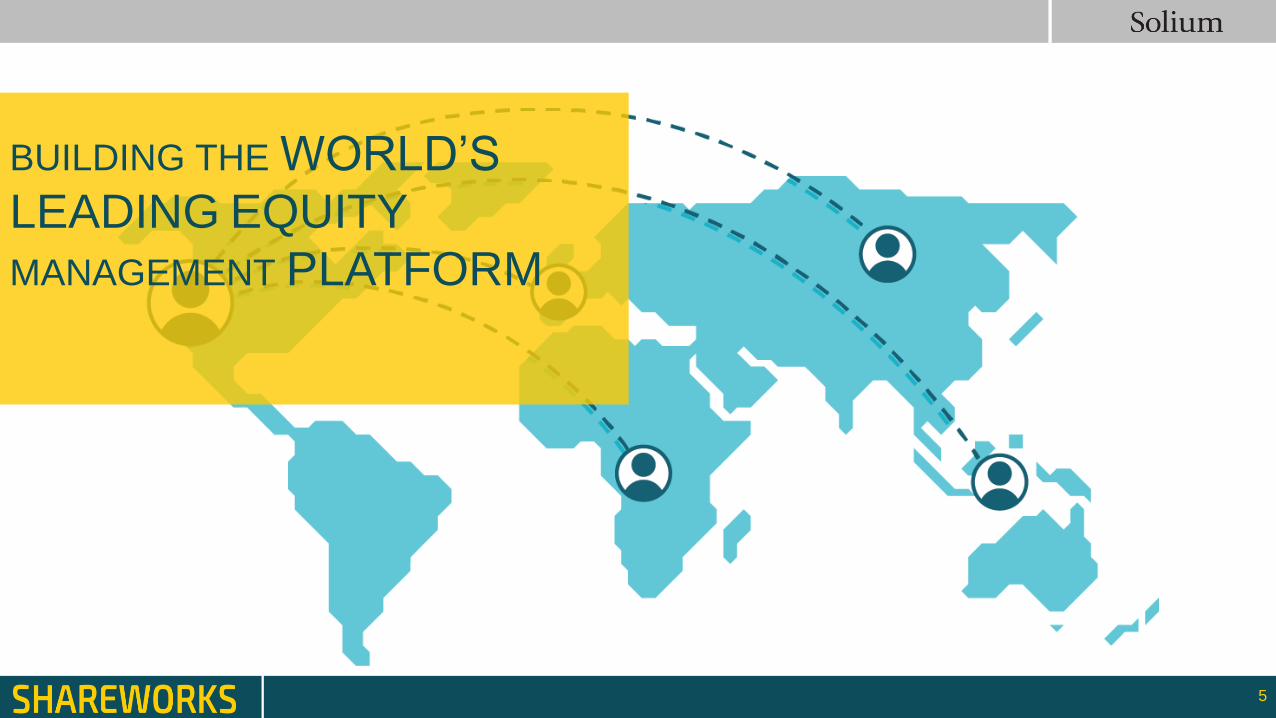
BUILDING THE WORLD’S
LEADING EQUITY
MANAGEMENT PLATFORM
5
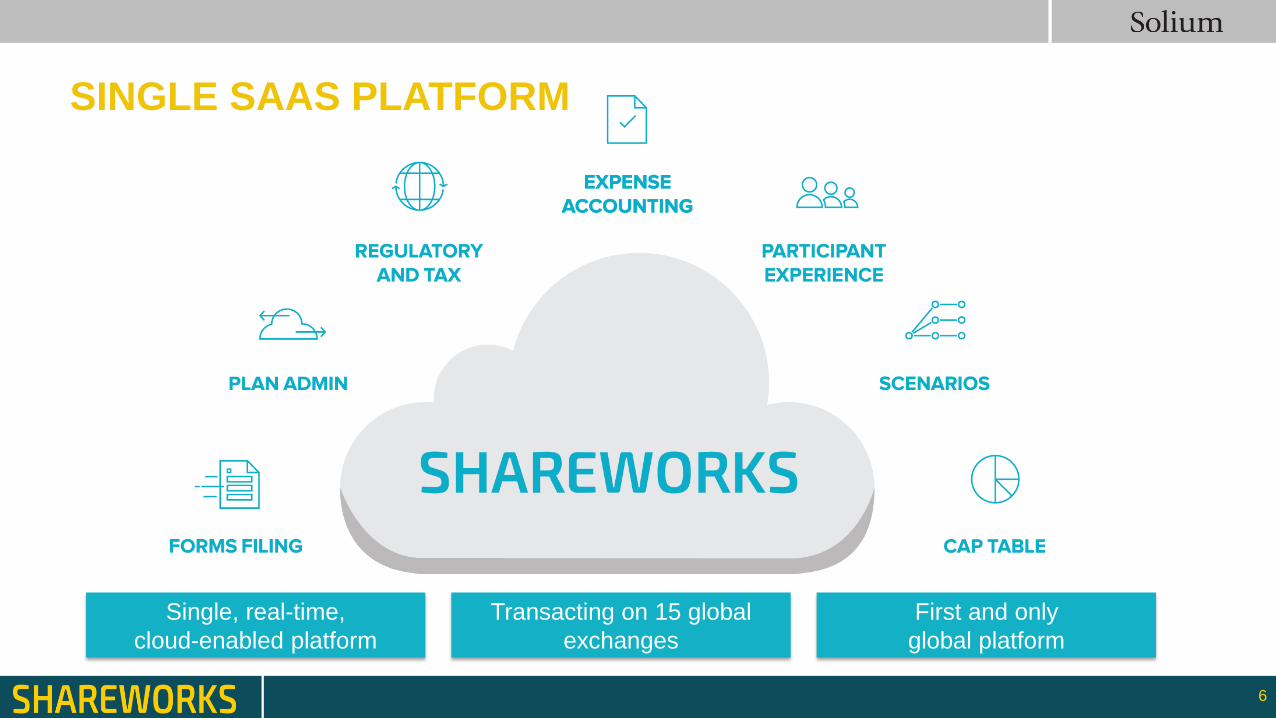
SINGLE SAAS PLATFORM
Transacting on 13 global
exchanges
6
Single, real-time,
cloud-enabled platform
Transacting on 15 global
exchanges
First and only
global platform
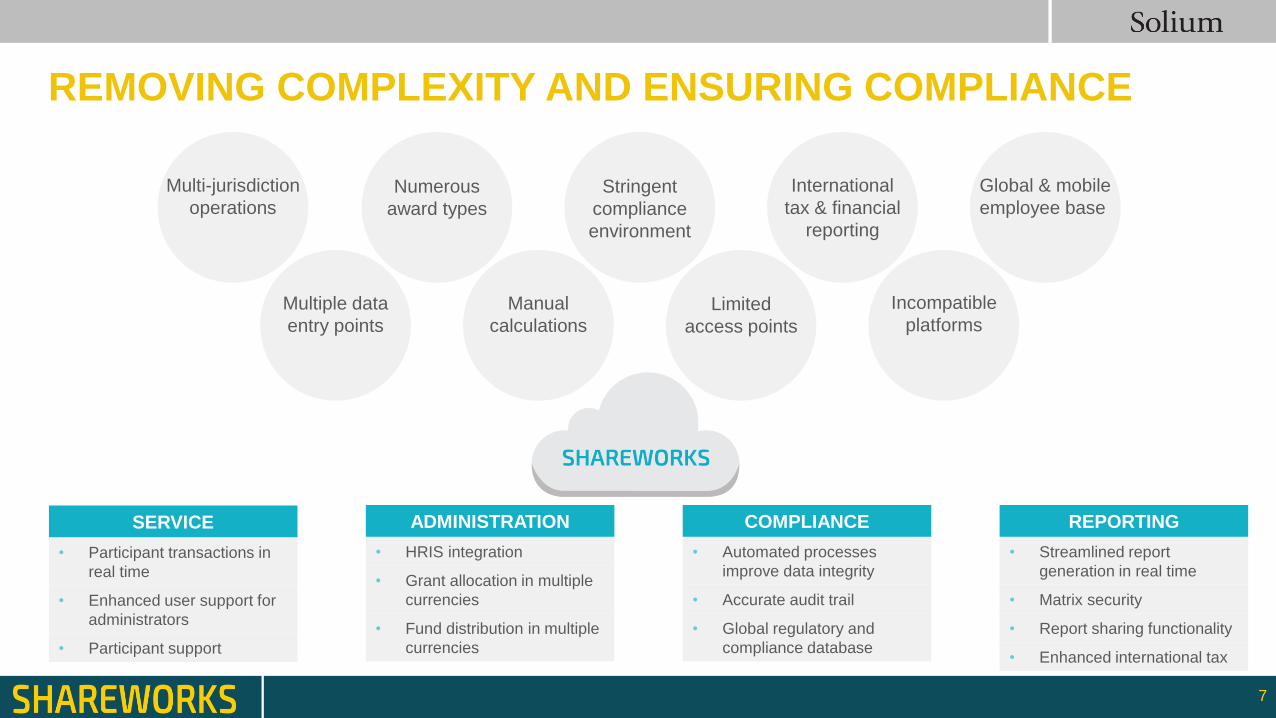
REMOVING COMPLEXITY AND ENSURING COMPLIANCE
REPORTING
• Streamlined report
generation in real time
• Matrix security
• Report sharing functionality
• Enhanced international tax
COMPLIANCE
• Automated processes
improve data integrity
• Accurate audit trail
• Global regulatory and
compliance database
ADMINISTRATION
• HRIS integration
• Grant allocation in multiple
currencies
• Fund distribution in multiple
currencies
SERVICE
• Participant transactions in
real time
• Enhanced user support for
administrators
• Participant support
7
Multi-jurisdiction
operationsNumerous
award types
Stringent
compliance
environment
International
tax & financial
reporting
Global & mobile
employee base
Multiple data
entry points
Manual
calculationsLimited
access points
Incompatible
platforms
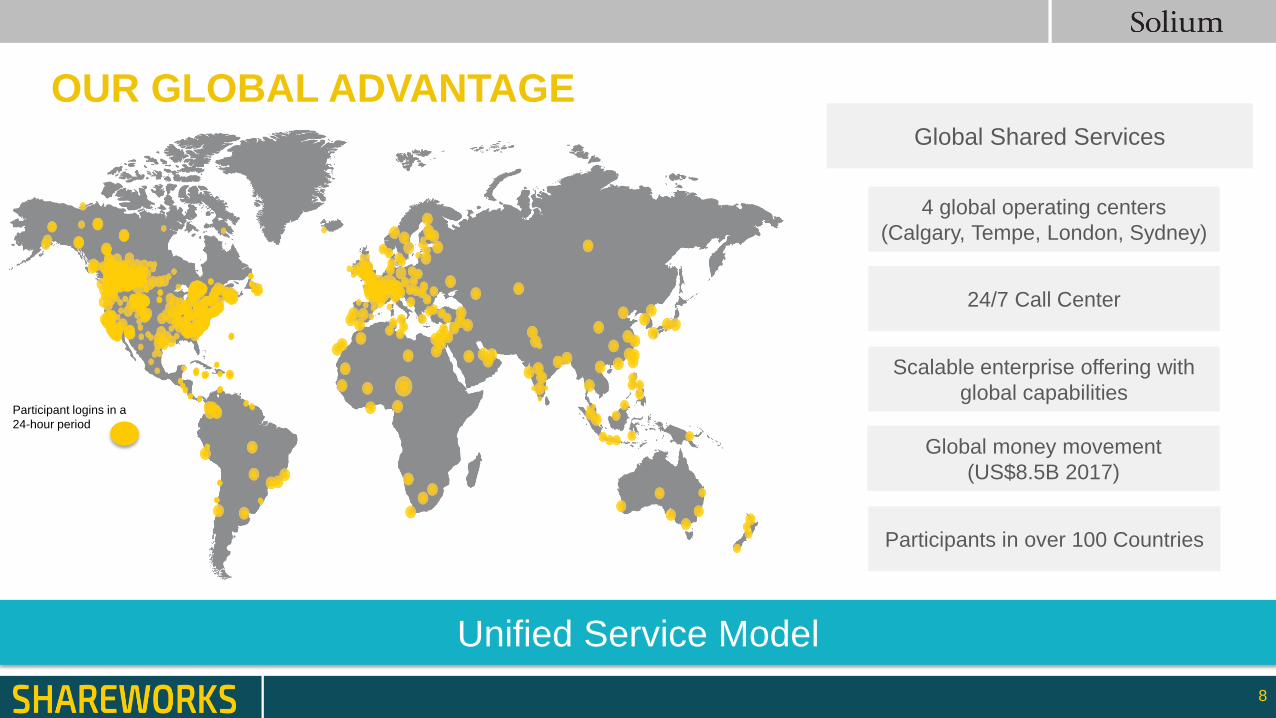
OUR GLOBAL ADVANTAGE
8
Participant logins in a
24-hour period
Participants in over 100 Countries
Unified Service Model
Global money movement
(US$8.5B 2017)
4 global operating centers
(Calgary, Tempe, London, Sydney)
24/7 Call Center
Scalable enterprise offering with
global capabilities
Global Shared Services

DIVERSIFIED CUSTOMER BASE
9
Canada United States EMEA Australia
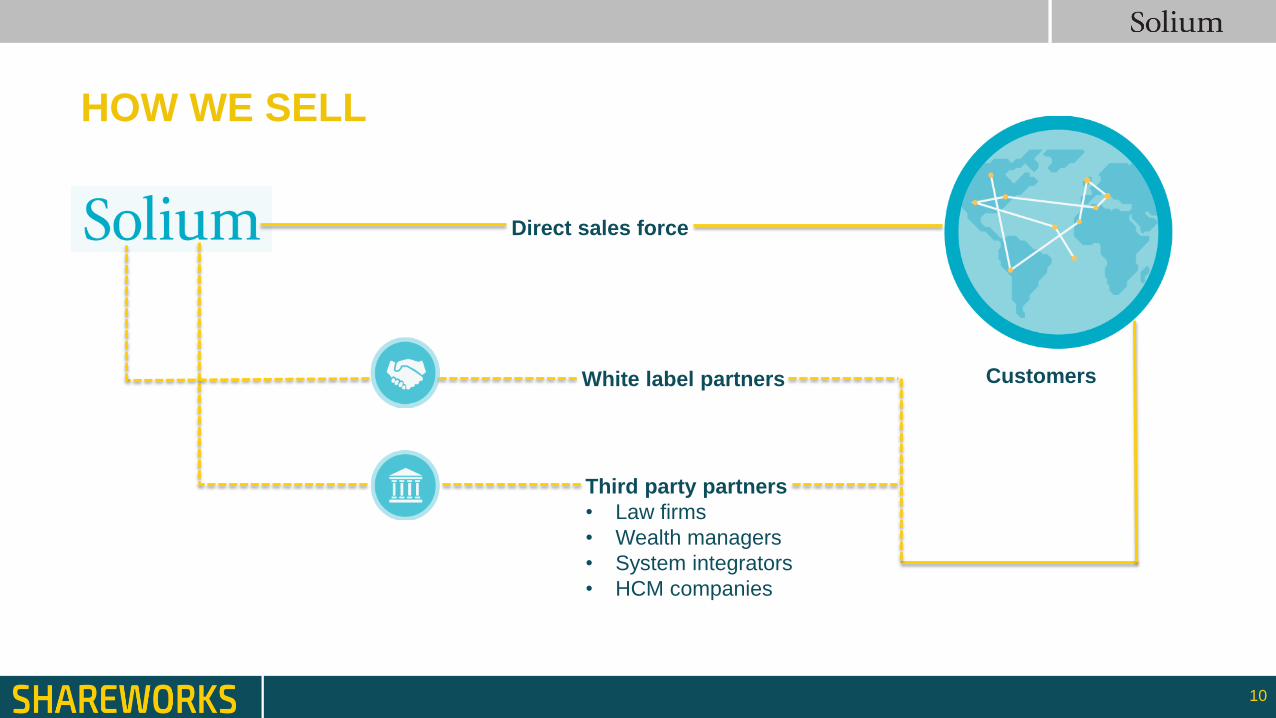
HOW WE SELL
Direct sales force
White label partners
Third party partners
• Law firms
• Wealth managers
• System integrators
• HCM companies
Customers
10

MORGAN STANLEY AND UBS PARTNERSHIPS
11
Q4 2017FIRST CLIENT
MIGRATIONS LIVE -
COMPLETE ALL BY H2
2019
33NEW DEALS CLOSED
JOINTLY WITH
MORGAN STANLEY
> 400MORGAN STANLEY
AND UBS
CORPORATE CLIENTS
$18MANNUAL RECURRING
REVENUE FOR
MORGAN STANLEY
R&DDEVELOPMENT ON TRACK
AND ACHIEVING TARGET
MILESTONES
$10M -15MINCREMENTAL R&D
INVESTMENT FOR
MORGAN STANLEY
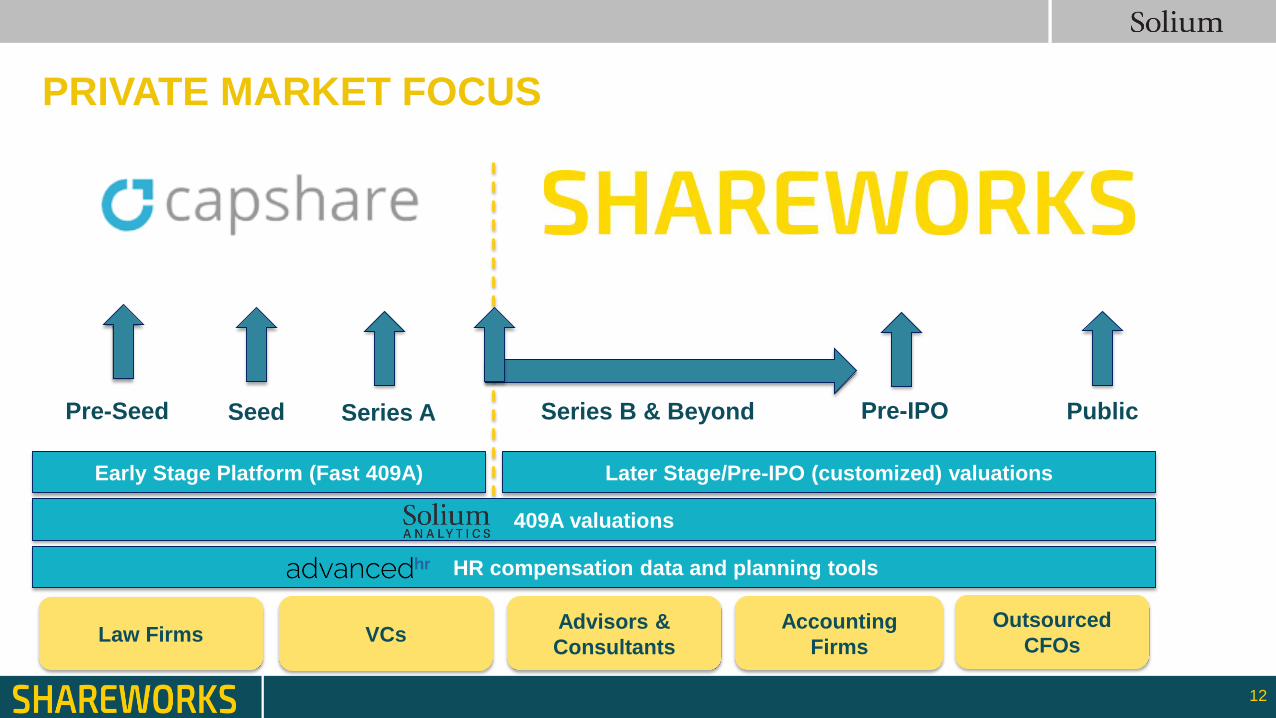
PRIVATE MARKET FOCUS
Pre-Seed Seed Series A Series B & Beyond Pre-IPO Public
409A valuations
Early Stage Platform (Fast 409A) Later Stage/Pre-IPO (customized) valuations
Law Firms VCsAdvisors &
Consultants
Accounting
Firms
Outsourced
CFOs
12
HR compensation data and planning tools
FINANCIAL AND
OPERATING METRICS
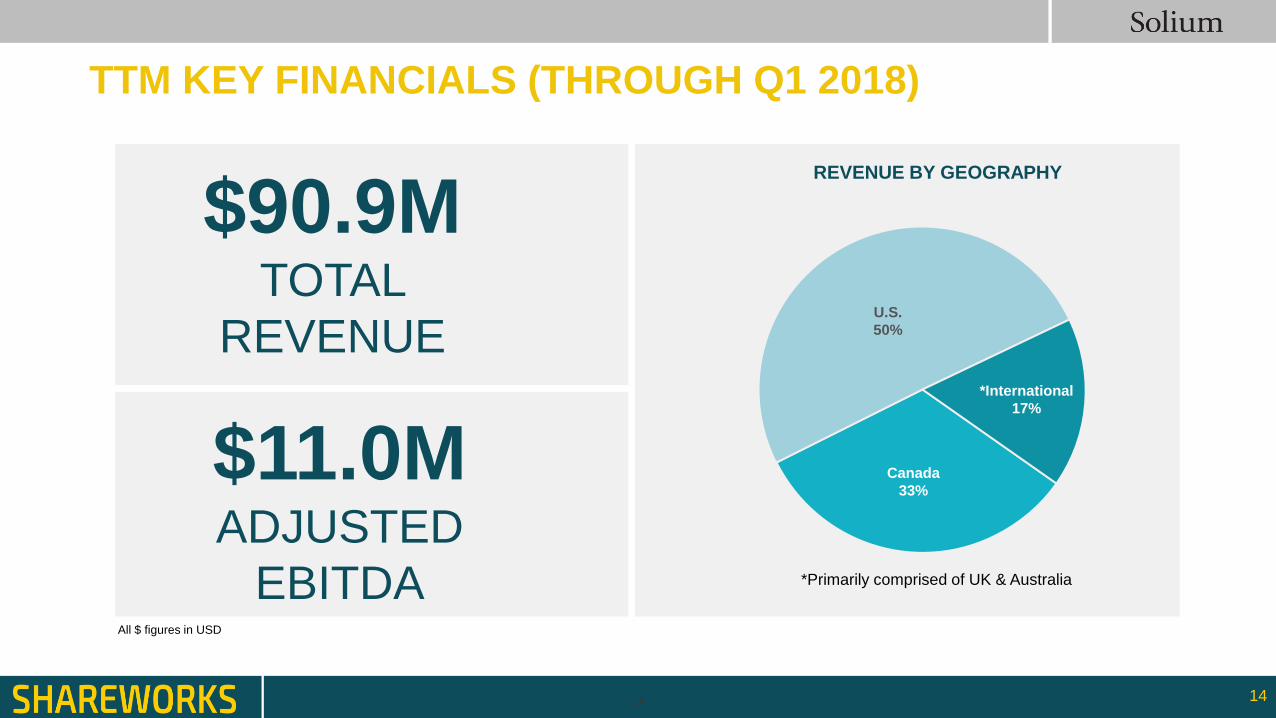
TTM KEY FINANCIALS (THROUGH Q1 2018)
14
$90.9MTOTAL
REVENUE
REVENUE BY GEOGRAPHY
Canada
33%
U.S.
50%
*International
17%
$11.0MADJUSTED
EBITDA *Primarily comprised of UK & Australia
14
All $ figures in USD

REVENUE MODEL
66%FIXED-RECURRING
SUBSCRIPTION REVENUE
30%PARTICIPANT & PLAN BASED -
REOCCURRING ACTIVITY
4%ONE-TIME
• Brokerage, transaction & fund movement fees
• Foreign exchange spread
96%
• Implementation fees
• Special projects & consulting
+ +
Based on 5-year average
15
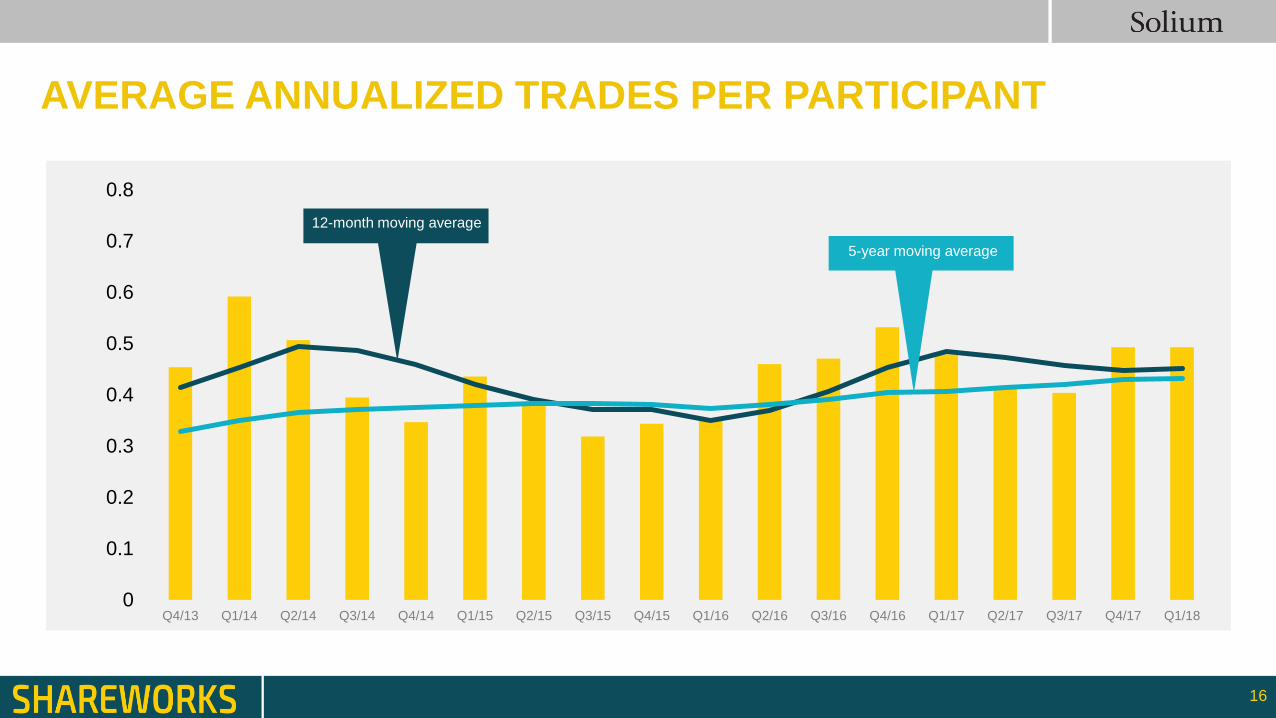
AVERAGE ANNUALIZED TRADES PER PARTICIPANT
16
0
0.1
0.2
0.3
0.4
0.5
0.6
0.7
0.8
Q4/13 Q1/14 Q2/14 Q3/14 Q4/14 Q1/15 Q2/15 Q3/15 Q4/15 Q1/16 Q2/16 Q3/16 Q4/16 Q1/17 Q2/17 Q3/17 Q4/17 Q1/18
12-month moving average
5-year moving average

0
10
20
30
40
50
60
70
80
90
100
2012 2013 2014 2015 2016 2017 TTM
GROWING ANNUAL REVENUE
17
(USD, in millions)
5 YEAR CAGR*
11%
* CAGR calculated 2012-2017

0
5
10
15
20
25
TTM Q1 2017 TTM Q2 2017 TTM Q3 2017 TTM Q4 2017 TTM Q1 2018
TTM ADJUSTED EBITDA
18
(USD, in millions)
21%20%
17%
TTM Adjusted EBITDA Margin
14%12%
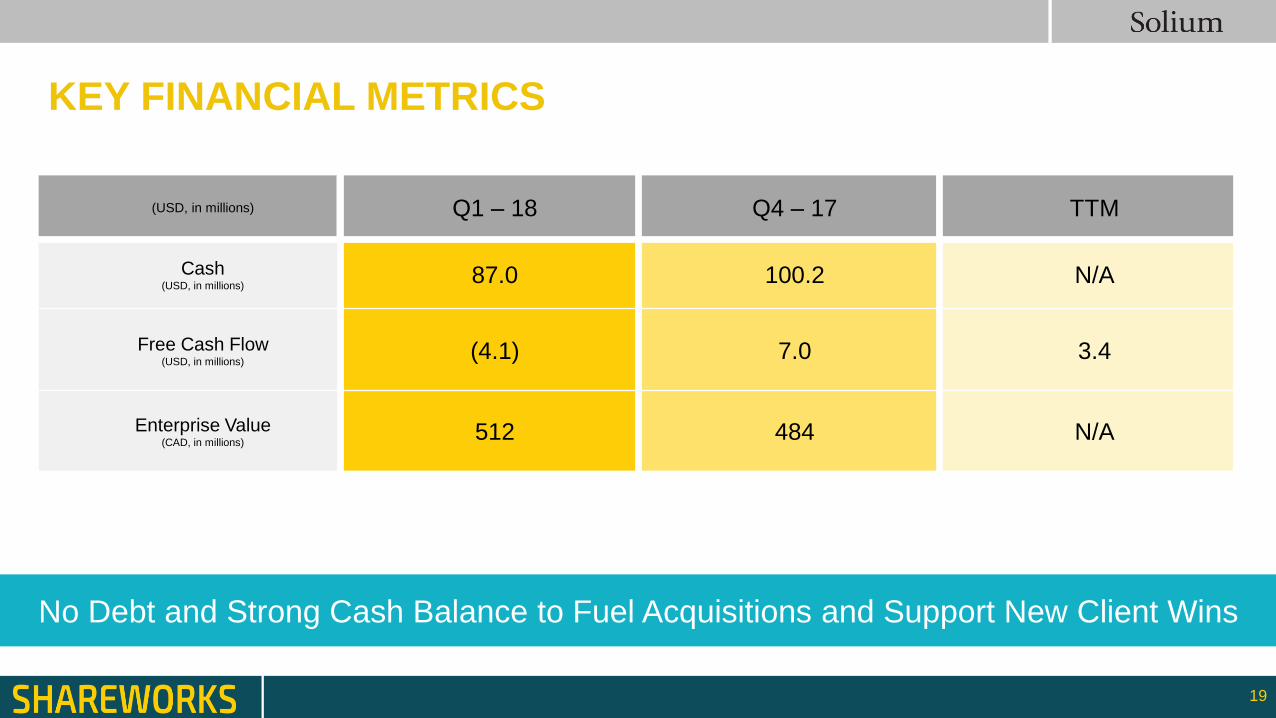
KEY FINANCIAL METRICS
(USD, in millions) Q1 – 18 Q4 – 17 TTM
Cash(USD, in millions)
87.0 100.2 N/A
Free Cash Flow(USD, in millions)
(4.1) 7.0 3.4
Enterprise Value(CAD, in millions)
512 484 N/A
19
No Debt and Strong Cash Balance to Fuel Acquisitions and Support New Client Wins
GROWTH
STRATEGY
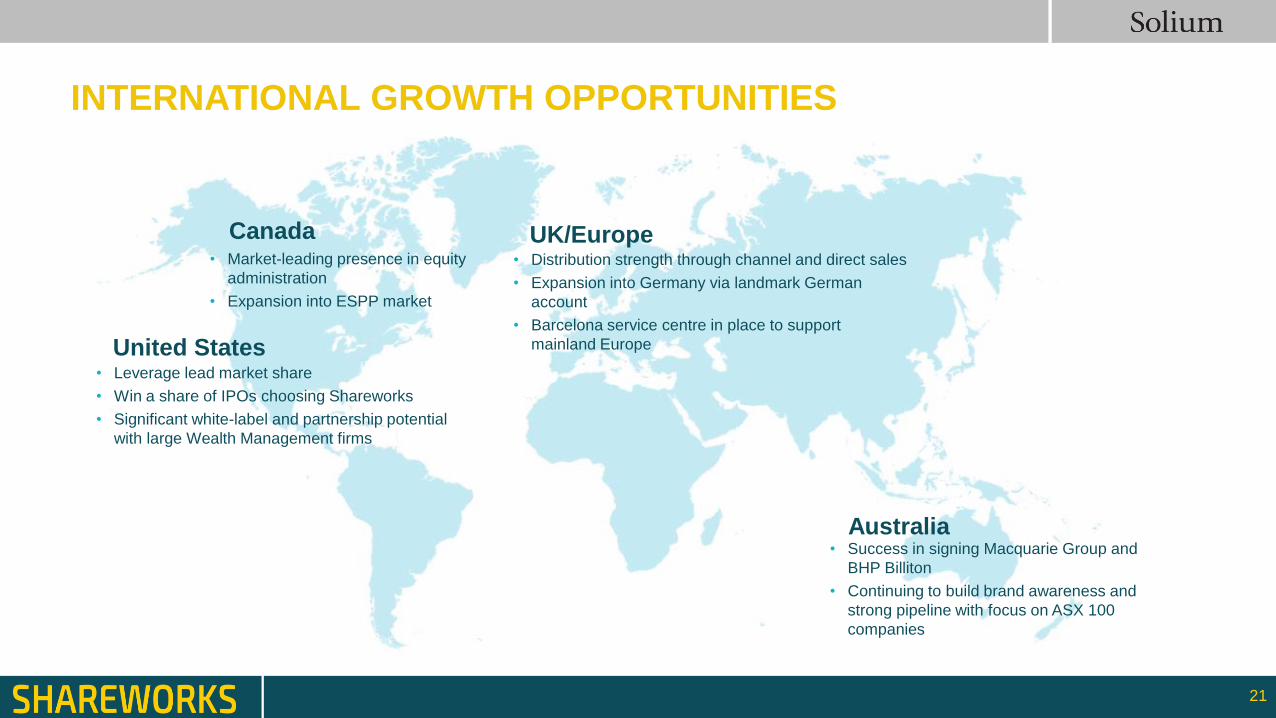
INTERNATIONAL GROWTH OPPORTUNITIES
21
• Leverage lead market share
• Win a share of IPOs choosing Shareworks
• Significant white-label and partnership potential
with large Wealth Management firms
United States
• Market-leading presence in equity
administration
• Expansion into ESPP market
• Success in signing Macquarie Group and
BHP Billiton
• Continuing to build brand awareness and
strong pipeline with focus on ASX 100
companies
Australia
• Distribution strength through channel and direct sales
• Expansion into Germany via landmark German
account
• Barcelona service centre in place to support
mainland Europe
UK/EuropeCanada
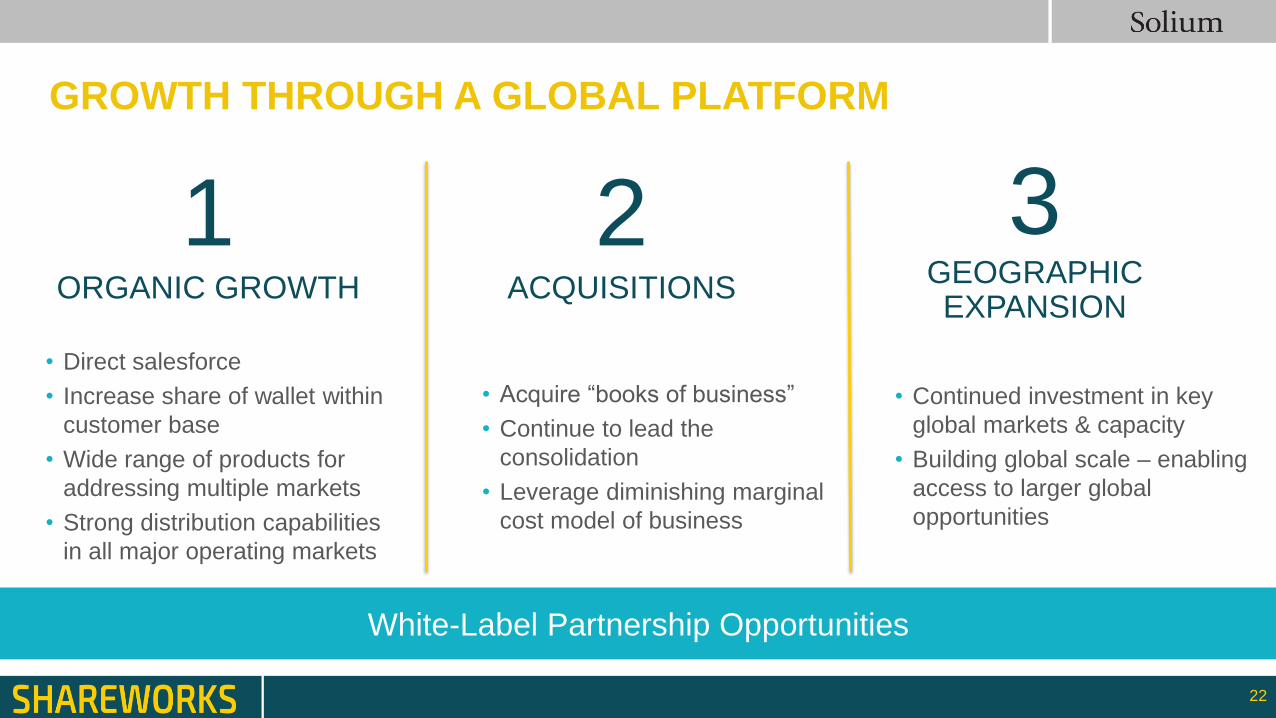
GROWTH THROUGH A GLOBAL PLATFORM
1ORGANIC GROWTH
2ACQUISITIONS
3 GEOGRAPHIC EXPANSION
• Direct salesforce
• Increase share of wallet within
customer base
• Wide range of products for
addressing multiple markets
• Strong distribution capabilities
in all major operating markets
• Acquire “books of business”
• Continue to lead the
consolidation
• Leverage diminishing marginal
cost model of business
• Continued investment in key
global markets & capacity
• Building global scale – enabling
access to larger global
opportunities
22
White-Label Partnership Opportunities
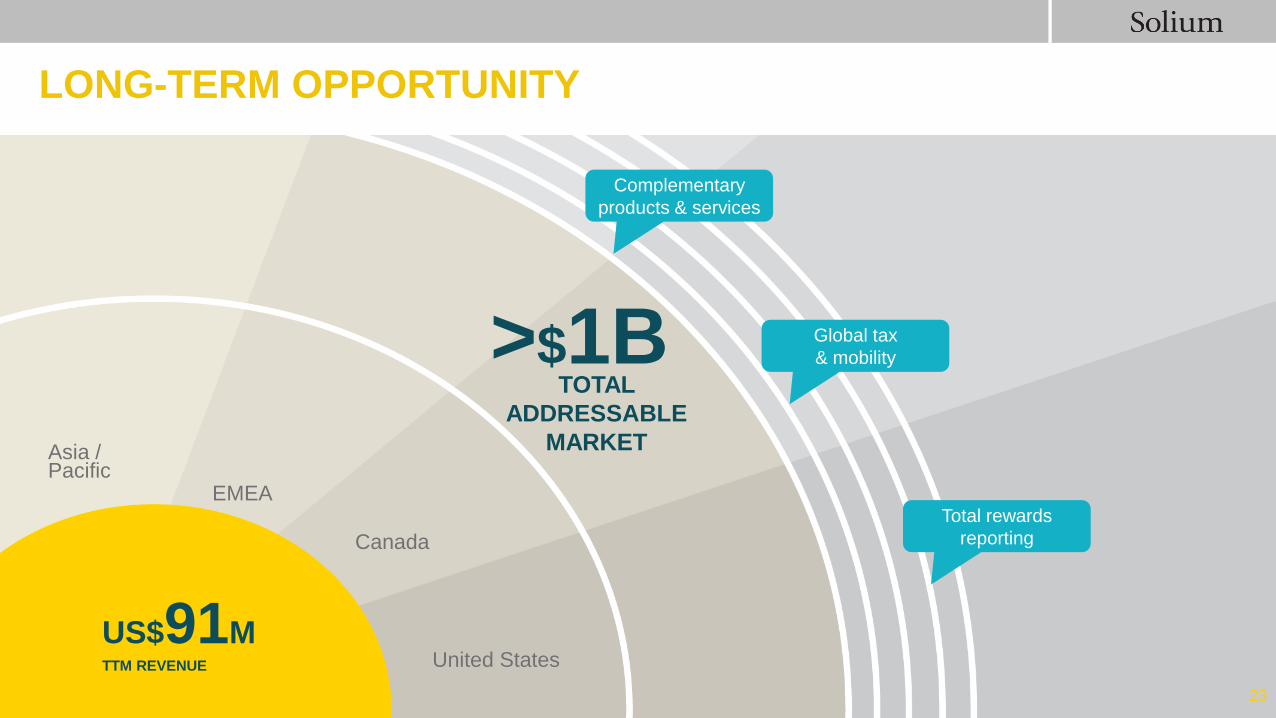
LONG-TERM OPPORTUNITY
23
Asia / Pacific
United States
EMEA
Canada
Global tax
& mobility
US$91MTTM REVENUE
>$1B
23
TOTAL
ADDRESSABLE
MARKET
Complementary
products & services
Total rewards
reporting
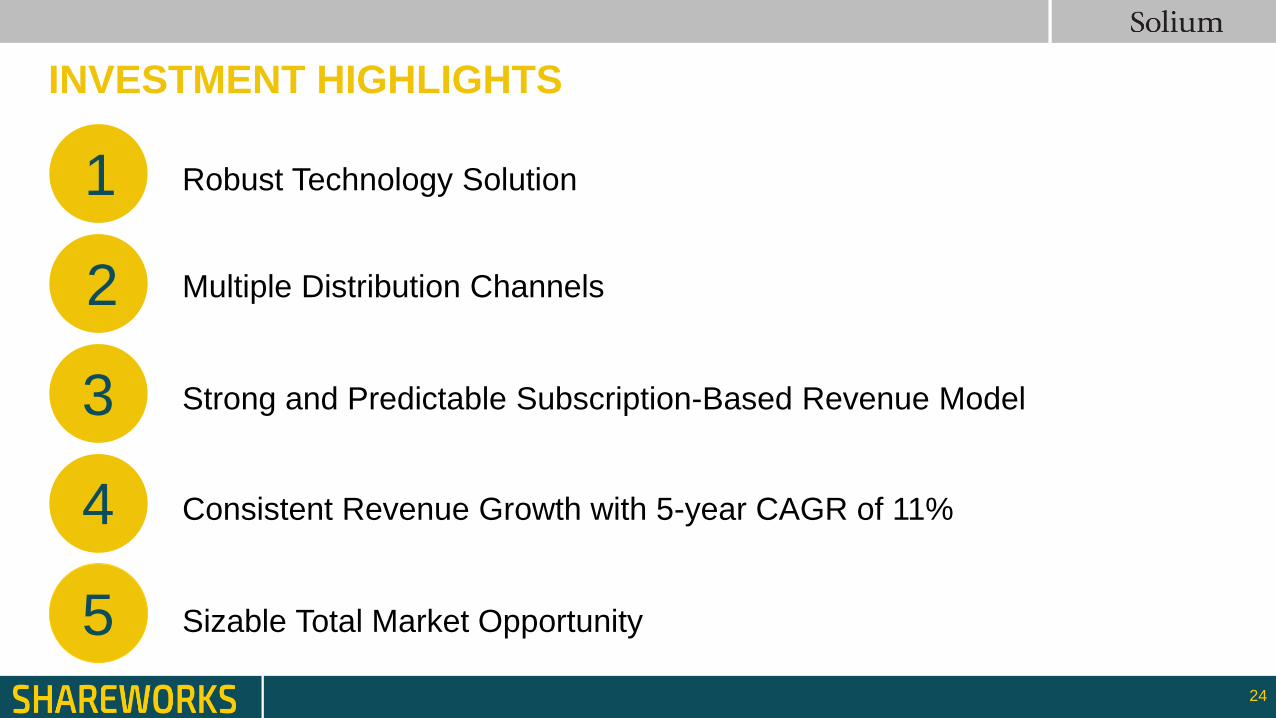
INVESTMENT HIGHLIGHTS
Robust Technology Solution1
2
3
4
5
Multiple Distribution Channels
Strong and Predictable Subscription-Based Revenue Model
Consistent Revenue Growth with 5-year CAGR of 11%
Sizable Total Market Opportunity
24

THE GLOBAL SOLUTION
FOR EQUITY COMPENSATION
ADMINISTRATION
Related Documents