A P R E S E N T A T I O N B Y INVESTOR PRESENTATION FINANCIAL & BUSINESS REVIEW FOR THE FINANCIAL YEAR ENDED 31 st December 2015 26 th February 2016

Welcome message from author
This document is posted to help you gain knowledge. Please leave a comment to let me know what you think about it! Share it to your friends and learn new things together.
Transcript

A P R E S E N T A T I O N B Y
INVESTOR PRESENTATION
FINANCIAL & BUSINESS REVIEW FOR THE FINANCIAL YEAR ENDED 31st December 2015
26th February 2016

SECTION 1
• GROUP OVERVIEWSECTION 2
• FINANCIAL REVIEWSECTION 3
• CORPORATE GOVERNANCE & CORPORATE RESPONSIBILITY
SECTION 4
• DIVIDENDSECTION 5
• OUTLOOK FOR 2016
2
INVESTOR PRESENTATION
FINANCIAL & BUSINESS REVIEW FOR THE FINANCIAL YEAR ENDED 31st December 201526th February 2016

Section 1: Group Overview
3

Media Prima Today~ Fully- integrated Media
TELEVISION BROADCASTING
RADIO NETWORKS
PRINT MEDIA
OUTDOOR
DIGITAL
CONTENT CREATION
Copyright
Laureate
Sdn Bhd
4

Fact sheet as at 31 December 2015
98%
Television Broadcasting
Print Media Outdoor Media
Radio Content Creation
Digital
100%
100%
100%
100%
100%
100%
100%
100%
100%
100%
100%
99.6%
100%100%
100%
Media Prima TodayMedia Prima Today
Issued and paid-up share
capital
Shareholders equity
Total assets Cash Group borrowings
PDS Ratings (RAM)
RM1,109.2m RM1,620.7m RM2,330.1m RM420.7m RM300.1m AA1/P1(CP/MTN)
Copyright Laureate Sdn
Bhd100.0%
5

1. Nielsen’s Adex numbers for both Pay TV & FTA TV have not taken into consideration the discounting factor. Actual
Adex would be lower than Nielsen’s reported numbers due to higher actual bonussing / discounting.
2. Pay TV - a cheaper alternative as its rates are lower than that of FTA TV & Print
3. Inclusion of more paid channels will contribute to higher growth for Pay TV
4. * Nielsen’s tracking of Online Adex has been stopped since June 2015
RM MILLION PAY TV FTA TV PRINT RADIO ONLINE OTHERS TOTAL
FY 2015 5,770 2,859 4,153 478 144* 375 13,779
FY 2014 5,385 3,210 4,651 461 473 323 14,503
% Change 7 (11) (11) 4 na (24) (5)
Source: Nielsen Media Research
PAY TV
42%
FTA TV
21%
30%
Radio
3%
Online
1%Others
3%
PAY TV
37%
FTA TV
22%
32%
Radio
3%
Online
3%
Others
3%
2015 2014
Industry Adex Malaysia – Non discounted gross revenue
6

RM94m (FYE Dec‘14 : RM63m)
1,507
RM’ million
1,723
1,698
1,622
Group EBITDA: RM326m (FYE Dec ‘14 : RM311m)
311
408
405
404
Group PATAMI: RM139m (FYE Dec ‘14 : RM76m)
76
214
209
207
139
Group net revenue: RM1,428m (FYE Dec ‘14: RM1,507m)
(Accumulated losses)/Retained earnings:
63
10
133
RM’ million
RM’ million
RM’ million
FYE Dec ‘15 1,428
326
RM’ million
RM’ million
Group net revenue by category
1,232
1,284 210
179
94
81
Adex: 86%
Adex: 85%
Circulation: 13%
Circulation: 14%
5-Year Performance SummaryFYE Dec ‘15
FYE Dec ‘14
FYE Dec ‘13
FYE Dec ‘12
FYE Dec ‘11
17
Content: 1.2%
Content: 0.9%
13
FYE Dec ‘14
FYE Dec ‘13
FYE Dec ‘12
FYE Dec ‘11
FYE Dec ‘15
FYE Dec ‘14
FYE Dec ‘13
FYE Dec ‘12
FYE Dec ‘11
FYE Dec ‘15
FYE Dec ‘14
FYE Dec ‘13
FYE Dec ‘12
FYE Dec ‘11
FYE Dec ‘15
FYE Dec ‘14
7

Section 2 : Financial Review
8

9
%
FYE Dec 2015 FYE Dec 2014 CHANGE
A B A - B
GROSS REVENUE 1,682,084 1,778,757 (5)
NET REVENUE 1,427,693 1,506,981 (5)
ROYALTIES (1,741) (3,615) 52
NET REVENUE AFTER ROYALTIES 1,425,952 1,503,366 (5)
DIRECT COSTS (432,518) (491,878) 12
CONTRIBUTION 993,434 1,011,488 (2)
OTHER INCOME 31,335 35,438 (12)
OVERHEADS (699,018) (736,140) 5
EBITDA 325,751 310,786 5
FINANCE COSTS (15,300) (22,901) 33
DEPRECIATION & AMORTISATION (103,138) (100,385) (3)
PROFIT BEFORE ASSOCIATE 207,313 187,500 11
SHARE OF ASSOCIATE'S RESULTS (7,245) (6,283) 15
PROFIT BEFORE TAX 200,068 181,217 10
EXCEPTIONAL ITEMS ("EI") - (79,776) NA
PROFIT BEFORE TAX (AFTER EI) 200,068 101,441 97
TAXATION (61,360) (24,819) (>100)
PROFIT AFTER TAX 138,708 76,622 81
MINORITY INTEREST 9 (1,094) >100
PATAMI 138,717 75,528 84
PATAMI EXCL. EI 138,717 141,563 (2)
EBITDA margin % 23% 21%
PATAMI margin % 10% 5%
RM '000
1. Gross revenue decreased by 5%. Challengingbusiness environment and subdued marketsentiment had profound effect on theGroup.
a) Traditional Revenue
FY2015 net advertising revenuecontracted by 4% against FY2014,affected by the soft advertisingspending and subdued marketsentiment.
FY2015 circulation revenue by printmedia was lower by 15% againstFY2014, in tandem with decliningglobal circulation trend.
b) Non Traditional Revenue
Mainly contributed by revenue fromcontent sales. Net revenue fromcontent sales recorded a 23%increase to RM16 million for FY2015against RM13 million for FY2014.
2. Efforts in managing costs and improvedoperational efficiency is visible by the 5%growth in EBITDA.
3. PATAMI improved by 84% due toExceptional Items (MSS) recognised in 2014.
Group Financial Performance FY2015
9

Financial results by media platform
Note:-
*PBT Before Associate for Digital Media is after EI of RM1.479m – reversal of impairment on investment property
TVN PWS Radio Out-Of-Home Print Digital Media Others Consol Total
Media Media Adjustment
Gross Revenue
FY 2015 773,328 110,637 78,613 168,842 642,558 27,890 173,556 (293,340) 1,682,084
FY 2014 812,285 125,741 83,110 165,524 693,556 34,481 141,653 (277,593) 1,778,757
Growt h % (5) (12) (5) 2 (7) (19) 23 (6) (5)
Net Revenue (after royalties)
FY 2015 629,162 110,637 67,432 157,590 551,629 27,091 173,556 (291,145) 1,425,952
FY 2014 645,451 125,741 70,712 152,145 592,467 32,568 141,653 (257,371) 1,503,366
Growt h % (3) (12) (5) 4 (7) (17) 23 13.12 (5)
EBITDA
FY 2015 134,452 19,265 26,971 57,553 103,775 394 149,173 (165,832) 325,751
FY 2014 161,248 18,125 29,920 56,009 76,019 (5,121) 120,130 (145,544) 310,786
Growt h % (17) 6 (10) 3 37 >100 (24) (14) 5
Depreciation &
Interest Expenses
FY 2015 43,108 125 1,923 9,016 49,751 1,786 15,125 (2,396) 118,438
FY 2014 42,216 167 2,134 8,912 49,058 1,564 21,885 (2,650) 123,286
Growt h % (2) 25 10 (1) (1) (14) 31 10 4
PBT / (LBT) Before Associate
FY 2015 91,344 19,140 25,048 48,536 54,024 (1,392) 134,048 (163,436) 207,313
FY 2014 119,032 17,958 27,786 47,097 26,961 (6,685) 98,245 (142,894) 187,500
Growt h % (23) 7 (10) 3 >100 (79) 36 14 11
RM'000
*
10

Section 2.1 : TV Networks
11

Progressive Malay dominance
MASS MARKET
INSPIRASI HIDUPKU -Family orientated programmes, and cultural proximity content
FMCGs, communications, services & transportation brands
TAR
GET
AU
DIE
NC
EP
OSIT
ION
ING
AD
VER
TISER
S
25-45 YRS OLD URBANITES, kids & mass Chinese
MY FEEL GOOD CHANNEL – Television as an escapade
Urban middle to high class image products and lifestyle brands
15-24 YRS OLD URBANITES, Mass Chinese
WE ARE DIFFERENT –Tastemaker, energetic and differentiation in content
MASS MARKET, Young semi-urban & rural Malays
DEKAT DI HATI- A mixture of drama, real-life & current affairs
FMCGs, non-traditional brands and government
Young urban, sports, energy drink, fashion brands. Chinese viewers with interest in health & wealth
Segmentation of our TV channels
12

Lower Adex in the current year especiallyin the FTA TV segment attributed to thedecline in revenue by 3% against 2014.
Despite the fall in revenue, PAT increasedby 4% mainly contributed by savings inprogramme costs.
%
FY 2015 FY 2014 CHANGE
A B A - B
GROSS REVENUE 773,328 812,285 (5)
NET REVENUE 629,162 645,451 (3)
DIRECT COSTS (253,801) (266,436) 5
CONTRIBUTION 375,361 379,015 (1)
OTHER INCOME 6,918 11,971 (42)
OVERHEADS (247,827) (229,738) (8)
EBITDA 134,452 161,248 (17)
DEPRECIATION (38,674) (37,618) (3)
FINANCE CHARGES (4,434) (4,598) 4
PROFIT BEFORE TAX (PBT) 91,344 119,032 (23)-
EXCEPTIONAL ITEM ("EI") - (29,218) NA
PROFIT BEFORE TAX (AFTER EI) 91,344 89,814 2
TAXATION (18,475) (20,486) 10
PROFIT AFTER TAX (PAT) 72,869 69,328 5
EBITDA Margin % 21% 25%
PAT Margin % 12% 11%
RM'000
TV networks results FY 2015
13

Media Prima TVN captured 37.3% of total audience share
LEADING THE COMPETITIONacross all stations/channels by primarily focusing on delivering award-winning contents that are fresh and relevant
Inevitable fragmentation with the inclusion of more Pay Channels & the upcoming Digital Rollout
Source: Nielsen Audience Measurement
(Total 4+, 2015)
4%4.7%7.3%21.2%
1.0%1.6%1.7%1.9%2.3% 2.1%2.6% 2.6%3.1%3.2%5.5% 3.5%
TV2 TV1 AstroCeria
AstroRia
AstroPrima
AstroSunTV
AstroWarna
AstroCitra
Other Astro
AstroDisney
XD
AstroMaya
HD
TV Al-Hijrah
14

Top 10 Channels
Total Individuals Chinese 4+ Malay 15+
NO STN 2014 STN 2015 STN 2014 STN 2015 STN 2014 STN 2015
1 TV3 23.2 TV3 21.2 8TV 24.7 8TV 22.9 TV3 31.9 TV3 29.1
2 TV9 7.7 TV9 7.3 NTV7 16.4 NTV7 14.6 TV9 9.9 TV9 9.4
3TV2 5.4 TV2 5.5
HUA HEE DAI
5.8HUA HEE
DAI4.3 TV1 6.8 TV2 6.0
4 8TV 5.1 8TV 4.7 AEC 4.6 AEC 4.1 TV2 5.9 TV1 5.1
5 TV1 4.8 NTV7 4.0 WLT 4.1 TV2 3.5 PRIMA 4.7 RIA 4.5
6NTV7 4.4 TV1 3.5 TV2 4.0
CELESTIAL CLASSIC
3.4 RIA 4.1 PRIMA 3.7
7PRIMA 3.3 CERIA 3.2
OTHER-ASTRO
3.1 WLT 3.2 WARNA 2.7 CERIA 3.5
8 RIA 3.0 RIA 3.1 XHE 3.0 TV3 1.9 CERIA 2.6 CITRA 3.1
9 SUN-TV 3.0 SUN-TV 2.6 TVBC 2.4 CCTV4 1.9 OASIS 2.6 WARNA 3.0
10CERIA 2.4 PRIMA 2.6 TV3 2.1 TVBC 1.7 CITRA 2.3
MAYA HD
2.3
MPB channels remain the LEADER in key markets
15
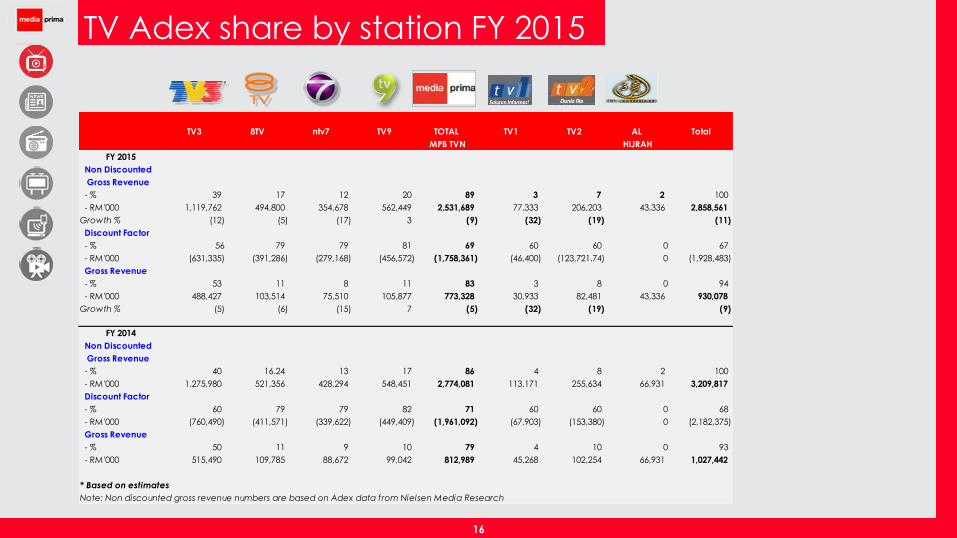
TV3 8TV ntv7 TV9 TOTAL TV1 TV2 AL Total
MPB TVN HIJRAH
FY 2015
Non Discounted
Gross Revenue
- % 39 17 12 20 89 3 7 2 100
- RM'000 1,119,762 494,800 354,678 562,449 2,531,689 77,333 206,203 43,336 2,858,561
Growth % (12) (5) (17) 3 (9) (32) (19) (11)
Discount Factor
- % 56 79 79 81 69 60 60 0 67
- RM'000 (631,335) (391,286) (279,168) (456,572) (1,758,361) (46,400) (123,721.74) 0 (1,928,483)
Gross Revenue
- % 53 11 8 11 83 3 8 0 94
- RM'000 488,427 103,514 75,510 105,877 773,328 30,933 82,481 43,336 930,078
Growth % (5) (6) (15) 7 (5) (32) (19) (9)
FY 2014
Non Discounted
Gross Revenue
- % 40 16.24 13 17 86 4 8 2 100
- RM'000 1,275,980 521,356 428,294 548,451 2,774,081 113,171 255,634 66,931 3,209,817
Discount Factor
- % 60 79 79 82 71 60 60 0 68
- RM'000 (760,490) (411,571) (339,622) (449,409) (1,961,092) (67,903) (153,380) 0 (2,182,375)
Gross Revenue
- % 50 11 9 10 79 4 10 0 93
- RM'000 515,490 109,785 88,672 99,042 812,989 45,268 102,254 66,931 1,027,442
* Based on estimates
Note: Non discounted gross revenue numbers are based on Adex data from Nielsen Media Research
TV Adex share by station FY 2015
16

Broadcasting live local football for 3 consecutive seasons
Liga Super, Piala F.A & Piala Malaysia matches on TV3 & TV9 &
Tonton
17

0
20
40
60
Noon - 2.00
p.m.
7.00 p.m. -
8.00 p.m.
8.00 p.m. -
9.00 p.m.
9.00 p.m. -
10.00 p.m.
10.00 p.m.
- 11.00
p.m.
36
5054
4438
Audience Share - All 4+ (%)
Committed to maintain & defend ratings for prime time
7pm - 8pm
13%
8pm - 9pm
28%
9pm - 10pm
17%
10pm - 11pm
8%
Noon - 2pm
11%
Others
23%
TVN Net Revenue by Prime Time Hour
6 prime time hours contribute to approximately
77% of Media Prima’s TV Networks’ net revenue
Dominant audience share at Prime Time
(Noon – 2pm & 7-11 pm)
54% of total audience captured between 8-9pm
18

Joint venture between Sistem Televisyen Malaysia Berhad and CJ O Shopping Co., Ltd (CJ O)
Diversification of revenue stream - A business-to-consumer (B2C) venture which is complimentary
to TV and is expected to provide the Group an opportunity to gain lucrative consumer revenue
Excellent opportunity to optimize the combined strengths of STMB & CJ O – STMB with vast
experience in commercial TV broadcasting in Malaysia & CJ O with years of international business
expertise in the home shopping business
Reaching out to a bigger/wider audience, leveraging on the Group’s integrated media platform,
talent, reach & brand recognition.
Optimise revenue via non-prime time slots on existing TV channels before establishing a
dedicated channel
New non-traditional revenue stream for the TV platform
Expanding the Media Prima portfolio to include the retailing/
home shopping business
19

Section 2.2 : Print Media
20

Segmentation of our papers
NEW MALAYS, young age 20-39
years old, dynamic and
progressive Malaysian
MALAY DAILY - Young people who
are looking for entertainment,
shopping news and lifestyle
features
FMCG products,
communications, services,
transportation
TAR
GET
AU
DIE
NC
EP
OSIT
ION
ING
AD
VER
TISER
S
FROM ALL WALKS OF LIFE,
working class to
students,
housewives,
business people
and decision
makers
MALAY DAILY - People who have
an open mind and are drawn to
new and interesting products and
services
FMCG products, government,
services
INFLUENTIAL NEWSPAPER addressed to government and
corporate sectors, the
intelligentsia, young
professional
and students
ENGLISH DAILY - Authoritative
newspaper that is responsible for
the well-being and progress of
the nation in all fields. “The
Newspaper of The Nation”
Targeting the Malaysian Urban
middle to high class; image
products and lifestyle
21

NSTP results FY 2015
FY2015 revenue reduced by 7% as advertising
revenue fell by 3% and circulation revenue fell
by 15% in tandem with downward global
circulation trend.
Continued cost management to optimise profit
growth. Savings in direct cost are mainly due to
the following:-
Continuous management of print order to
reduce unsold copies.
Improvement in production yield mainly
due to improved newsprint efficiency by
using 42gsm from 45gsm previously.
PAT grew by >100% as the platform incurred
significant MSS costs in the preceding year.
%
FY 2015 FY 2014 CHANGE
A B A - B
GROSS REVENUE 642,558 693,556 (7)
NET REVENUE 551,629 592,467 (7)
DIRECT COSTS (136,800) (186,134) 27
CONTRIBUTION 414,829 406,333 2
OTHER INCOME 18,147 15,594 16
OVERHEADS (329,201) (345,908) 5
EBITDA 103,775 76,019 37
FINANCE CHARGES (1,130) (2,150) (47)
DEPRECIATION (48,621) (46,908) (4)
PBT BEFORE EI 54,024 26,961 >100
EXCEPTIONAL ITEM (EI) - (39,285) NA
PROFIT BEFORE ASSOCIATES 54,024 (12,324) >100
SHARE OF ASSOCIATES (7,245) (6,283) 15
PROFIT BEFORE TAX (PBT) 46,779 (18,607) >100
TAXATION (18,663) 1,612 (>100)
PROFIT AFTER TAX (PAT) 28,116 (16,995) >100
EBITDA Margin % 19% 13%
PAT Margin % 5% (3%)
RM'000
Sustaining the print business by
diversifying revenue streams
while enhancing brand and
content & also maintaining
operational efficiency.
22

Readership trends
(Source: Nielsen Media Research)
0
1000
2000
3000
4000
5000
6000
7000
8000
2010 2011 2012 2013 2014 2015
English
Malay
Chinese
Tamil
Readership trend by language
Readers ('000) Q2 2010 Q2 2011 Q2 2012 Q2 2013 Q2 2014 Q2 2015
ENGLISH
New Straits Times 241 214 277 288 240 224
New Sunday Times 247 202 270 207 202 179
BAHASA
Berita Harian 1,090 1,093 1,099 1,168 947 1,225
BH Ahad 1,223 1,233 1,103 1,081 1,034 1,236
Harian Metro 2,831 3,654 3,695 3,447 3,812 3,679
Metro Ahad 3,046 3,872 4,061 3,624 4,152 4,008
23

Source: AC Nielsen, Socialbakers.com & comScore
Readership
(Highest last
10 years)
Readership
(June 2015)
Online
WebSocial Media
Total
Reach
339k
(Yr 2006)224k 305k 363k 290k 2.8k 1.185m
1.271m
(Yr 2007)1.225m 1.200m 3.334m 993k 4.6k 6.757m
3.722m
(Yr 2011)3.679m 1.430m 2.931m 510k 65.4k 8.615m
Total Reach: 16.557m
Growing total reach - Strong online and social media presence
24

Maintain strong contribution from the Malay market
Revenue Contribution 2015
NST/NSUT
19%
BH/ BHA
26%
HM/MA
55%
NST/NSUT BH/ BHA HM/MA
NSTP Advertising Revenue Trend
0
100
200
300
400
500
2010 2011 2012 2013 2014 2015
32% 29% 27% 24% 24% 23%
68%
71% 73% 76%
76% 77%
ENGLISH BAHASA
RM mil
25

NSTP newsprint price trend
Newsprint price has stabilized at average of USD520/MT over the past two years. Average newsprint inventory is around 4 months
542
701
466445
525
630 650 625
850
570630
730
605
608
559
490
0
200
400
600
800
1000
2000 2001 2002 2003 2004 2005 2006 2007 2008 2009 2010 2011 2012 2013 2014 2015
USD
/ M
T
26

Section 2.3 : Radio Networks
27

Radio networks results FY 2015
FY2015 revenue and PAT
declined by 5% and 16%
respectively against the
preceding year as the share
of Adex between stations
remains highly competitive.
%
FY 2015 FY 2014 CHANGE
A B A - B
GROSS REVENUE 78,613 83,110 (5)
NET REVENUE 67,432 70,712 (5)
DIRECT COSTS (5,408) (5,322) (2)
CONTRIBUTION 62,024 65,390 (5)
OTHER INCOME 2,030 1,273 59OTHER OVERHEADS (2,383) 100
OVERHEADS (37,083) (36,743) (1)
EBITDA 26,971 29,920 (10)
DEPRECIATION (1,923) (2,134) 10
PBT 25,048 27,786 (10)
EXCEPTIONAL ITEM ("EI") - (1,156) NA
PROFIT BEFORE TAX (PBT) 25,048 26,630 (6)
TAXATION (6,744) (4,854) (39)
PROFIT AFTER TAX (PAT) 18,304 21,776 (16)
EBITDA Margin % 40% 42%
PAT Margin % 27% 31%
RM'000
28

Defending our Radio Adex share - Q4 2015
Source: Nielsen Advertising Information Service (AIS)
15.29
7.98
14.82
2.05
18.71
8.99
17.41
1.36
HOT FM SINAR FM ERA FM SURIA FM
Ad
ex
(R
M m
illio
n)
Q4 2014 Q4 2015
11.68
5.21
4.90
1.49
13.43
5.124.07
1.15
HITZ FM FLY FM MIX FM RED FM
Ad
ex
(R
M m
illio
n)
Q4 2014 Q4 2015
9.96
19.49
9.71
0.55
11.76
21.28
9.31
0.90
ONE FM MYFM 988 AIFM
Ad
ex
(R
M m
illio
n)
Q4 2014 Q4 2015
MALAY ENGLISH CHINESE
29

Radio performance ratings
Source: Nielsen Radio Audience Measurement
2,748
4,835
3,715
1,874
2,371
4,728
3,722
1,728
HOTFM ERA FM SINAR SURIA
NATIONWIDE LISTENERSHIP
(‘000)
1,229
441
281
62
1,240
528
245
73
HITZ FM FLY FM MIX FM RED FM
ENGLISH STATION LISTENERSHIP
(‘000)
900
2,034
1,370
563
915
2,031
1,302
695
ONE FM MYFM 988 AI FM
CHINESE STATION LISTENERSHIP
(‘000)
668
739
492
397
505
659
404
317
HOTFM ERA FM SINAR SURIA
EAST COAST LISTENERSHIP
(‘000)
Survey #1 2015 Survey #2 2015
30

The radio network with the largest online & social media presence in the country
Source: Individual social media platform
As at 31 Dec 2015
3.8millionFANS
1.7millionFOLLOWERS
649.4kFOLLOWERS
(no comparison as we are the only radio stations that have the official accounts)
147,464SUBSCRIBERS
Station Facebook Twitter Instagram YouTube
Hot FM 2,643,088 1,478,835 568k 99,718
Era FM 2,574,205 307,607 672k 102,616
Suria FM 491,414 98,775 24.1k 3,828
Sinar FM 644,699 43,070 94.8k 13,724
Station Facebook Twitter Instagram Weibo YouTube
One FM 687,056 8,621 51.2k 83,380 12,833
My FM 642,550 8,072 23.8k 116,051 32,413
988 337,705 3,313 7.8k 99,368 14,148
Station Facebook Twitter Instagram YouTube
Hitz FM 1,197,730 363,498 71.9k 27,030
Fly FM 447,580 211,747 30.2k 34,913
Red FM 158,809 17,436 3.9k 2,347
Mix FM 293,040 12,758 8.8k 2,097
1.4million
FANS
31

Connecting with a new generation of listeners Encouraging digital listenership numbers
Source: Triton Digital Canada Inc.
Average
Listenership
Per Month
: 2,679,332
Average Unique
Per Month: 704,239
Unique Mobile : 513,863
Unique Web : 190,376
Listening Hours : 2,832,369
Average
Listenership
Per Month
: 464,321
Average Unique
Per Month: 198,320
Unique Mobile : 63,112
Unique Web : 135,208
Listening Hours : 636,291
Average
Listenership Per
Month
: 1,945,321
Average Unique
Per Month: 529,546
Unique Mobile : 190,993
Unique Web : 338,553
Listening Hours : 1,989,293
2,679,332listeners
1,945,321listeners
464,321listeners
Online & Mobile Listenership for the months Oct-Dec 2015
32

Our acquisition of Ultra FM & Pi Mai FM
Entered into SPA to
acquire Copyright
Laureate Sdn Bhd for a
total cash consideration
of RM20.0m
Complement existing media assets of the Group Existing stations will continue to compete for listenership & revenue in their respective demographic
markets whilst adapting to digital music trends.
Potential synergies Potential benefits from collaborative sales & marketing strategies between radio platform & other media
platforms within the group.
Enjoy significant cost savings through consolidation of back office & operational costs.
1 Oct 2015
Completion of acquisition.
CLSB has become a wholly-
owned subsidiary under the
Group
21 Oct 2015
Launch of new
station. Stay Tuned!
1 March2016
Reach Expansion Enable expansion of our radio offerings to a wider segment of listeners, media buyers and advertisers
2015 2016
33

Section 2.4 : Outdoor Media
34

Out-Of-Home Media results FY 2015
4% revenue growth
was driven by new
digital rollouts at key
locations throughout
the year.
PAT increased by 5%
partly due to 4%
revenue growth as
compared to
preceding year.
%
FY 2015 FY 2014 CHANGE
A B A - B
GROSS REVENUE 168,842 165,524 2
NET REVENUE 157,590 152,145 4
DIRECT COSTS (84,974) (83,310) (2)
CONTRIBUTION 72,616 68,835 5
OTHER INCOME 2,595 1,635 59
OVERHEADS (17,658) (14,461) (22)
EBITDA 57,553 56,009 3FINANCE CHARGES - - #DIV/0!
DEPRECIATION & AMORTISATION (9,017) (8,912) (1)
PROFIT BEFORE TAX BEFORE EI 48,536 47,097 3
EXCEPTIONAL ITEM (EI) - (462) NA
PROFIT BEFORE TAX (PBT) 48,536 46,635 4
TAXATION (11,971) (11,942) (0)
PROFIT AFTER TAX (PAT) 36,565 34,693 5
EBITDA% 37% 37%
PAT % 23% 23%
RM'000
35

NATIONWIDE
PRESENCEEXPRESSWAYS
TRANSIT LINES
AIRPORTS
KEY CITY/TOWNS
RETAIL MALLS
Malaysia’s largest OOH Media Company with 44% Market Share
36

Focused on providing best-in-class OOH solutions through creativity, technology & product innovation
Cosmic Digital Tower @ NU Sentral Cubig @ Imbi
Cubig @ Jalan BangsarLumi @ Jalan Bangsar
NU SentralNU Sentral
Lumi @ Jalan Bangsar
Lumi Pillar 2 @ Sultan Ismail
NU Sentral
Station Naming Rights
Station Naming RightsStation Naming Rights
37

Dynamic engagement with the audience via digital screens at
- Bukit Bintang- KLCC- The Curve - LRT Stations- Sultan Ismail- Bangsar- Imbi- Jalan Bangsar- Kuching Int’l Airport- Kota Kinabalu Int’l
Airport- NU Sentral
Continue to invest and convert strategic sites to digital boards to enhance digital inventory networks.
Growing its digital solutions at key and premium sites
TV – PRINT – DIGITAL – RADIO Shout out to promote activities & interaction with
DIGITAL.
38

Section 2.5: Digital Media
39

Media Prima Digital results FY 2015
Streamlining of business
operations during the current
year saw revenue decline by
17%.
Profit increased significantly
due to the reversal of
impairment on assets as well
as the recognition of
deferred tax assets.
Post streamlining exercise,
MPD will be the incubator for
new projects and once set
up it will be passed to the
respective platforms.
The streamlining exercise
involves transferring catch
up and advertising revenue
back to TVN and Print. In
return, MPD charges shared
cost for its services.
%
FY 2015 FY 2014 CHANGE
A B A - B
GROSS REVENUE 27,890 34,481 (19)
NET REVENUE 27,091 32,568 (17)
DIRECT COSTS (2,093) (4,588) 54
CONTRIBUTION 24,998 27,980 (11)
OTHER INCOME 81 51 (59)
OVERHEADS (24,685) (33,152) 26
EBITDA 394 (5,121) >100
DEPRECIATION & AMORTISATION (3,265) (1,564) (>100)
LBT BEFORE EI (2,872) (6,685) 57
EXCEPTIONAL ITEM (EI) 1,479 (562) >100
LBT AFTER EI (1,392) (7,247) 81
TAXATION 10,800 - NA
PROFIT/ (LOSS) AFTER TAX 9,408 (7,247) >100
EBITDA/ LBITDA Margin % 1% (16%)
PAT/ LAT Margin % 35% (22%)
RM'000
Notes:-• EI for PBT/(LBT) FY2015 consists of reversal of impairment on investment property• EI for PAT(LAT) FY2015 consists of reversal of impairment on investment property & deferred tax asset recognition
40

Digital Reach
Source: Comscore
* Lazada contains sites from multiple countries, however a large percentage of unique visitors were from their respective Malaysian sites (over 90%).
Top 10 Malaysian Sites
Media Prima Group is the 2nd largest Digital Media Group in Malaysia
Sites
Dec-14 Dec-15
RankTotal Unique
Visitors (000) Rank
Total Unique
Visitors (000)
Lazada Sites * 2 2,698 1 4,378
Maybank Group 1 3,063 2 3,432
CIMB Group 7 1,701 3 2,041
MUDAH.MY 3 1,974 4 1,758
Astro Group 6 1,722 5 1,624
Tune Group 5 1,735 6 1,558
Media Prima Group 4 1,895 7 1,302
The Star Media Group 8 1,660 8 1,205
11STREET.MY - - 9 1,082
Public Bank Group 13 863 10 1,006
41

Digital Milestone – As at 31 Dec 2015
Tonton Original Series & Interactive TV Show
900THOUSANDMONTHLYUNIQUEVISITORS
3.2MILLION MONTHLY VIDEO VIEWS 16.7
MILLION MONTHLY PAGE VIEWS
5.3 MILLION REGISTERED USERS
Source: Google Analytics, Comscore , Omniture as at December 2015
1.92.6
3.54.3
5.3
REGISTERED USERS
millio
n
201320122011 2014 2015
Tonton’s Growth Chart
42

Titles on Tonton
43

Developing mobile products
Established Media Prima Labs (MPLabs) to champion the development ofMobile Application & Games within the digital industry
Leverage and develop product base on the Group’s unique intellectualproperties - such as Jalan-Jalan Cari Makan, Joran, Harian MetroMountain Bike Grand Prix, Ejen Ali.
Media Prima Digital supports the Group through digital operation, production & data services.
Also provide a platform to innovate and incubate new digital products & services.
Aims to develop 15 apps by end of 2016.
Several currently in development include Jalan Jalan Cari Makan, Ejen Ali, Showdown, Joran and BeritaHarian Mountain Bike.
Focus on establishing and strengthening MPLabs’ foothold domestically in the near to medium term.
44

Commitment to going further into the digital world
Part of Media Prima's initiative to invest in the mobile technology and gaming industry
Extending the Ejen Ali IP to the mobile game industry
Media Prima Labs' 1st attempt at extending one of its intellectual properties(IP) to the mobile game industry.
Media Prima Digital together with Primeworks Studios, Wau Animation &Multimedia Development Corp organised the Ejen Ali Game Jam hackathonfor industry experts to compete with each other to develop a mobile phonegame for the TV series Ejen Ali.
45

TV3’s Jalan-Jalan Cari Makan (JJCM) – A programme with
a strong 15-year history & counting and is an integral
reference point for food enthusiasts.
An extension of the show - Taking JJCM to the digital
sphere with a JJCM mobile app.
Further engagement of loyal viewers via offering of
exclusive promotional deals.
Advertising & promotional plans leverage on the Group’s
clout as the country's leading integrated media group.
Participation in Karnival Jom Heboh, one of the most
highly anticipated TV3 events among the masses
Plans for awareness campaigns on the digital front
including ad buys on Google, YouTube and Facebook, as
well as engaging popular celebrities and lifestyle bloggers
46
Capturing a younger set of audience who are more tech savvy.Expanding & diversifying its followers demographics.
Taking TV3’s “Jalan-Jalan Cari Makan” (JJCM) to the digital sphere
46

Section 2.6: Content Creation
47

Primeworks Studios results FY 2015
Lower external sales of content
affected performance for
FY2015 as total revenue from
external sales of content
dropped by 32% to RM13.4m
from RM19.7m for FY2014.
Lower direct cost and
overheads also cushioned the
impact of lower revenue and
led to a 11% growth in PAT.
%
FY 2015 FY 2014 CHANGE
A B A- B
GROSS REVENUE 110,637 125,741 (12)
NET REVENUE 110,637 125,741 (12)
DIRECT COSTS (49,222) (59,420) 17
CONTRIBUTION 61,415 66,321 (7)
OTHER INCOME 368 830 (56)
OVERHEADS (42,518) (49,026) 13
EBITDA 19,265 18,125 6
DEPRECIATION (125) (167) 25
PBT BEFORE EI 19,140 17,958 7
EXCEPTIONAL ITEM (EI) - (7,058) NA
PBT AFTER EI 19,140 10,900 76
TAXATION (5,136) 1,740 (>100)
PAT 14,004 12,640 11
EBITDA Margin % 17% 14%
PAT Margin % 13% 10%
RM'000
48

Inspiring local flavoured content
ASIAN TASTE
ASIAN CULTURE & BELIEFS FORMAT PROGRAMMING
MODERN URBAN ASIA ISLAMIC ASIA
ASIAN FILMS & DRAMA
49
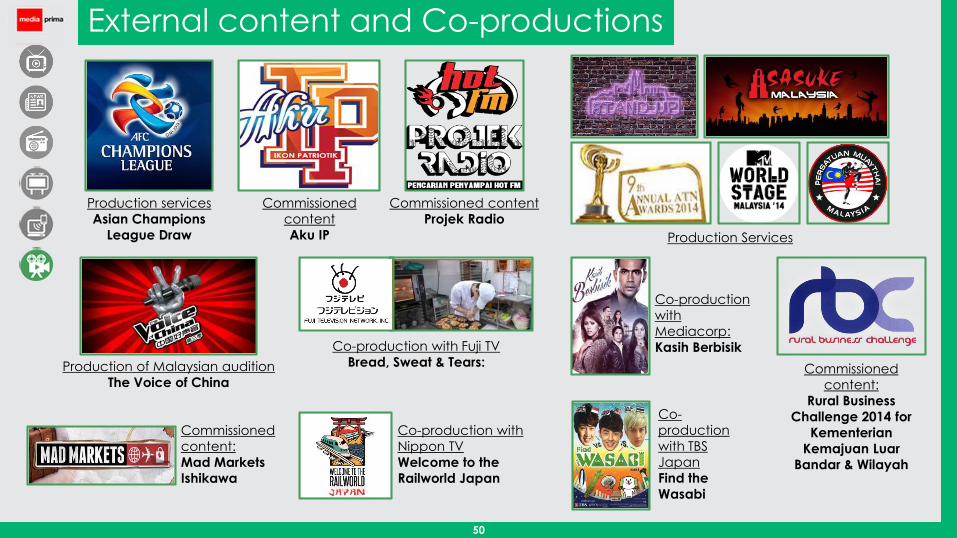
Production services
Asian Champions
League Draw
Commissioned
content
Aku IP
Commissioned content
Projek Radio
Commissioned
content:
Rural Business
Challenge 2014 for
Kementerian
Kemajuan Luar
Bandar & Wilayah
Production of Malaysian audition
The Voice of China
Co-production with Fuji TV
Bread, Sweat & Tears:
Production Services
External content and Co-productions
Co-production with
Nippon TV
Welcome to the
Railworld Japan
Co-
production
with TBS
Japan
Find the
Wasabi
Co-production
with
Mediacorp:
Kasih Berbisik
Commissioned
content:
Mad Markets
Ishikawa
50

Continuous co-production with international partners like FujiTV, NipponTV andHokuriku Asahi Broadcasting as a platform for knowledge sharing.
Best In the World Japan – A second co-production with Nippon TV
Mad Market Ishikawa – A commissioned content with Hokuriku AsahiBroadcasting
Spice Routes, 8th & final season - Commissioned for the 3rd time to produce
Content highlights
Content Sales
/ Distribution
Animation aggregation activity – Sale of animation series Cingkus Blues,Mourinho & Soccer Bugs to Indonesia, Sri Lanka, MENA & Malaysia Airlines.
New markets: Age of Glory sold to China
Distribution and media planning services for the animated feature filmBoboiboy- Sfera Kuasa
Co-
productions
/ External
Content
Animation Ejen Ali - 1st co-owned local animation IP
Presold to Indonesia, Sri Lanka & Middle East.
Target telecast date in Q2 2016.
51

Section 2.7: Corporate and Others
52

Corporate & Others FY 2015
Consol Total
MPB Others Adjustment
Gross Revenue
FY 2015 173,178 378 (293,340) (119,784)
FY 2014 141,640 13 (277,593) (135,940)
Growth % 22 >100 (6) 12
Net Revenue (after royalties)
FY 2015 173,178 378 (291,145) (117,589)
FY 2014 141,640 13 (257,371) (115,718)
Growth % 22 >100 (13) (2)
EBITDA
FY 2015 144,002 5,171 (165,832) (16,659)
FY 2014 120,431 (301) (145,544) (25,414)
Growth % 20 >100 (14) 34
Depreciation &
Interest Expenses
FY 2015 15,125 - (2,396) 12,729
FY 2014 21,813 72 (2,650) 19,235
Growth % 30.66 NA 10 34
PBT / (LBT)
FY 2015 128,877 5,171 (163,435) (29,387)
FY 2014 98,618 (373) (142,894) (44,649)
Growth % 31 >100 (14) 34
RM'000
53

Section 3 : Corporate Governance & Corporate Responsibility
54

Continued commitment towards good corporate governance
55
Awards/ accolades
Media Prima won Best Corporate Governance, Media Company, Asia, 2015, by Ethical Boardroom UK.
Commonwealth Businesswomen Network bestowed its Commonwealth Media of the Year Award 2015 to Media Prima for
its women empowerment initiatives.
Media Prima’s Human Resources’ grand win at the Human Resource Excellence Awards 2015 (Total of 11 awards).

56
Humanitarian Allocation of airtime and space to generate awareness of hardships faced by victims of
disasters
Dedicated funds for special purposes i.e. Media Prima-NSTP Humanitarian Fund, Tabung
Bencana NSTP-Media Prima
Environmental Internal efforts to reduce carbon emission and other spoilages i.e. 5S successfully
conducted in 2015 with positive results
Materials management i.e. 100% recycled paper for all printed materials
Waste management
Environmental conservation efforts i.e. campaigns like “Let’s Cycle” on TV
Social Best practices in the workplace i.e. competitive remuneration & benefits, diversity of
workforce, skills development
Engagement with local communities around places of business i.e. 4 printing plants
Media Prima Radio Networks received Bronze, Silver & Gold Awards at the Summit
Creative Awards 2015, for Public Service Announcements.
Travelling Beruang – A charity travelogue aimed at raising funds for
Malaysian children fighting cancer, A year-long campaign conducted in
collaboration with the National Cancer Council Malaysia (MAKNA)
Everyone Counts – Corporate Responsibility Initiatives
Environmental campaign – One of many socially
responsible activities Media Prima conducts to
engage listeners and upkeep Mother Earth
Media Prima’s aid to flood victims
Materials & waste management initiatives at printing
plants

Section 4 : Dividend
57

Proposed Dividend for FYE2015
Proposed final single tier dividend of 5.0 sen for FYE 31 December 2015 (subject to shareholders’ approval at the forthcoming AGM)
The proforma calculation for dividend payout and yield for the purpose of illustration:
RM ‘000
2015 Dividend payout:
1. First interim 3 sen 33,281
2. Second interim 2 sen 22,184
Share capital as at entitlement date (1,109,199,286)
3. Proposed final dividend 5 sen 55,460
Total 10 sen 110,925
PATAMI 138,717
Dividend yield 7.9%
Dividend payout ratio (as a % of PATAMI) 80.0%
Dividend payout policy (as a % of PATAMI) 60% to 80%
FYE 2015 dividend payout ratioreached the ceiling of our dividendpolicy of 60%-80% of PATAMI.
This reaffirms management’scommitment to rewardshareholders despite the currenteconomic condition.
58

5-year dividend track record
Dividend Policy
Minimum 60% to the maximum
of 80% of PATAMI
Quarterly payment or minimum
twice a year
However, management is
committed to reward
shareholders given the resilient
financial performance & strong
balance sheet position.
FINAL DIVIDEND OF10.0 SEN FOR FYE 31DEC 2015
16.0
13.014.0
2011 2012 2013
Special Dividend (sen)
59.2%
70.4%74.9%
5.0
2014
11.0
161.4%
86.1%
Based onnormalized profit
2015
10.0
80.0%DIVIDEND PAY-OUT RATIO
DIVIDEND YIELD
4.2%5.6% 5.3%
6.3%
7.9%
TOTAL DIVIDEND (SEN)
59

Section 5: Outlook for 2016
60

Outlook for 2016
MPB Group has generally been affected by the challenging market and economic sentiment on thedomestic and global fronts. However, FYE 2015 performance was resilient due to continuous efforts inmanaging costs and improve operational effectiveness and efficiency.
The Group expects 2016 to be a challenging year as the global economic environment continues to remainuncertain. Malaysia is not insulated, with the 2016 national GDP being forecasted lower.
At industry level, consumer fragmentation, technological advancements, shift in advertisement to the digitalmedia and increased competition from new entrants and global media players will continue to posechallenges to the Group.
Changes in the media industry also presents the Group with new opportunities to explore for all of its business
platforms.
The Group will continue to grow its non-traditional revenue while consolidating its market share in coreadvertising revenue. The recently announced home shopping joint venture will be a new non-traditionalrevenue stream for the platform.
The Group will continue its effort in managing the costs and improve operational effectiveness and efficiency.
In view of the above, Management remains cautiously optimistic for the Group financial performance for2016.
61

Prospects & the way forward
TV NETWORKS
PRINT MEDIA
OUT-OF-HOME MEDIA
CONTENT CREATION
Maintain dominant position in viewership share Continue investment in programming and content Recent home shopping joint venture will be a new non-traditional revenue stream for the platform
1st and largest integrated media group in ASEAN Strong presence across its media platforms Offer complete “solution” - COMPREHENSIVE, CUSTOMIZED and INTEGRATED solutions to the clients
No. 1 in terms of readership in a growing Bahasa market Sustain print business by diversifying revenue streams Enhancing brand and content Maintain operational efficiency
Maintain its industry edge by continuing to invest in innovative products and creative assets Continue growing its digital OOH solutions at key and premium sites Expected completion of rapid transit lines in 2016 offers new concession opportunities
Develop hit content for internal and external markets Expand with opportunities in emerging digital channels and foreign markets through partnerships
with other content producers & foreign broadcasters Monetisation of IP and maximisation of revenue via all possible platforms
RADIO NETWORKS Completed acquisition of new radio station enable expansion of offerings Continue developing new talent Adapt to digital musical trends
The digital media engine for the whole Group Consolidation of Group’s database through one data management platform Supports the Group through digital operation, production & data services Provide platform to innovate and incubate new products & services
DIGITAL MEDIA
62

2nd LARGEST reach
in terms of
combined radio
channel listeners’
numbers
2nd LARGEST digital
media group in
Malaysia
LARGEST reach in
terms of TV
viewership
Single Integrated Platform
COMPETITIVE ADVANTAGE:WIDEST MULTIMEDIA DISTRIBUTION OFFERING ON A SINGLE INTEGRATED PLATFORM
LARGEST share of
advertising revenue
& number of
billboards in the
outdoor media
industry
LARGEST reach in
terms of newspaper
circulation and
readership in
Peninsular Malaysia
Generating content
of the highest
standard to meet
viewers
expectation
63

Note: This presentation may contain forward-looking statements which are based on MPB's current expectations, forecasts and assumptions based onmanagement's good faith expectations and belief concerning future developments. In some cases forward-looking statements may be identified byforward-looking words like “would”, “intend”, “hope”, “will”, “may”, “should”, “expect”, “anticipate”, “believe”, “estimate”, “predict”, “continue”, orsimilar words. Forward-looking statements involve risks and uncertainties which could cause actual outcomes and results to differ materially from MPB'sexpectations, forecasts and assumptions. We caution that these forward-looking statements are not statements of historical facts and are subject torisks and uncertainties not in the control of MPB, including, without limitation, economic, competitive, governmental, regulatory, technological andother factors that may affect MPB's operations. Unless otherwise required by law, MPB disclaims any intention or obligation to update or revise anyforward-looking statements, whether as a result of new information, future events, or otherwise. Although we believe the expectations reflected inforward-looking statements are reasonable we cannot guarantee future results, levels of activity, performance or achievements.
THANK YOU
For more information, visit
www.mediaprima.com.my
or
www.mediaprima.com.my/investorcenter/feedbackcommentsfor inquiries, suggestions & comments
64
Related Documents