INVESTOR PRESENTATION NOVEMBER 27, 2015

Welcome message from author
This document is posted to help you gain knowledge. Please leave a comment to let me know what you think about it! Share it to your friends and learn new things together.
Transcript

INVESTOR PRESENTATION
NOVEMBER 27, 2015
2
This presentation contains certain statements that constitute forward-looking information within the meaning of applicable securities laws (“forward-looking statements”),
which reflects management’s expectations regarding Teranga Gold Corporation’s (“Teranga” or the “Company”) future growth, results of operations (including, without
limitation, future production and capital expenditures), performance (both operational and financial) and business prospects (including the timing and development of new
deposits and the success of exploration activities) and opportunities. Wherever possible, words such as “plans”, “expects”, “does not expect”, “budget”, “scheduled”,
“estimates”, “forecasts”, “anticipate” or “does not anticipate”, “believe”, “intend”, “ability to” and similar expressions or statements that certain actions, events or results “may”,
“could”, “would”, “might” or “will” be taken, occur or be achieved, have been used to identify such forward looking information. Although the forward-looking information
contained in this presentation reflect management’s current beliefs based upon information currently available to management and based upon what management believes to
be reasonable assumptions, Teranga cannot be certain that actual results will be consistent with such forward looking information. Such forward-looking statements are
based upon assumptions, opinions and analysis made by management in light of its experience, current conditions and its expectations of future developments that
management believe to be reasonable and relevant. These assumptions include, among other things, the ability to obtain any requisite Senegalese governmental approvals,
the accuracy of mineral reserve and mineral resource estimates, gold price, exchange rates, fuel and energy costs, future economic conditions, anticipated future estimates of
free cash flow, and courses of action. Teranga cautions you not to place undue reliance upon any such forward-looking statements
The risks and uncertainties that may affect forward-looking statements include, among others: the inherent risks involved in exploration and development of mineral
properties, including government approvals and permitting, changes in economic conditions, changes in the worldwide price of gold and other key inputs, changes in mine
plans and other factors, such as project execution delays, many of which are beyond the control of Teranga, as well as other risks and uncertainties which are more fully
described in the Company’s Revised Annual Information Form dated September 1, 2015, and in other company filings with securities and regulatory authorities which are
available at www.sedar.com. Teranga does not undertake any obligation to update forward-looking statements should assumptions related to these plans, estimates,
projections, beliefs and opinions change. Nothing in this report should be construed as either an offer to sell or a solicitation to buy or sell Teranga securities.
This presentation is dated as of the date on the front cover. All references to the Company include its subsidiaries unless the context requires otherwise.
This presentation contains references to Teranga using the words “we”, “us”, “our” and similar words and the reader is referred to using the words “you”, “your” and similar
words.
All dollar amounts stated are denominated in U.S. dollars unless specified otherwise.
FORWARD-LOOKING STATEMENTS
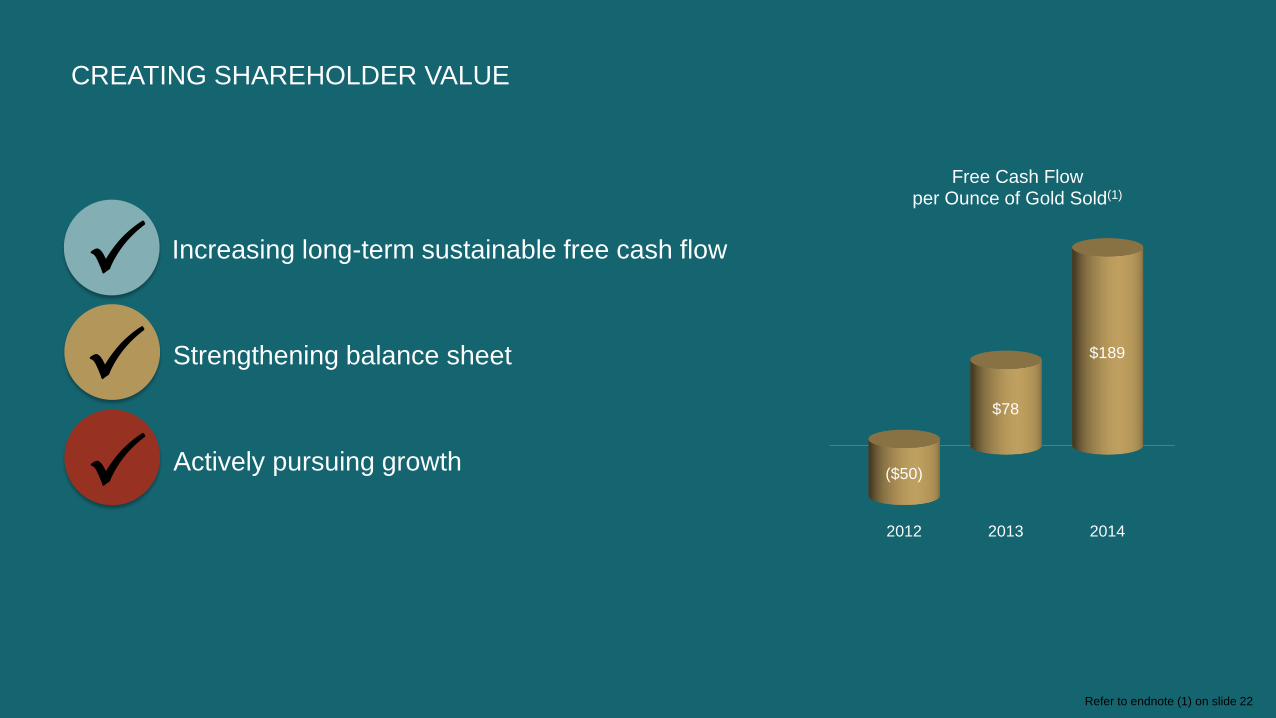
Increasing long-term sustainable free cash flow
Strengthening balance sheet
Actively pursuing growth
CREATING SHAREHOLDER VALUE
2012 2013 2014
($50)
$78
$189
Free Cash Flow per Ounce of Gold Sold(1)
Refer to endnote (1) on slide 22

4
ACTIVELY PURSUING GROWTH &
INCREASING LONG-TERM SUSTAINABLE FREE CASH FLOW
Increase
Production
Grow
Reserve Base

ACCOMPLISHMENTSYTD 2015

6
Cash at September 30, 2015 $29.9M
Private placement $17.4M
VAT recoverable $7.8M
Pro forma cash balance $55.1M
LESS: Revolver drawdown $15.0M
Pro forma net cash balance $40.1M
2012 2013 2014 Q3 2015 Pro formaQ3 2015
($75M)
($32M)
$32M
$15M
$40M
Refer to endnote (2) on slide 22
Maintaining Net Cash (Debt)(2)
Despite Significant Decline inAverage Gold Price per Ounce
YTD 2015 ACCOMPLISHMENTS: BALANCE SHEET CONTINUES TO STRENGTHEN
Eliminated debt in Q1
Secured a $30 million revolving credit facility in Q2
Increased low-grade ore stockpile to 330,000 ounces
Completed $17.4 million strategic private placement
with cornerstone investor in Q4
Pro forma net cash balance of $40 million, includes:
$1,669
$1,411
$1,266
$1,112

7
YTD 2014 YTD 2015
$760 $631
$150$217
$25$116
YTD 2014 YTD 2015
$760$631
Total Cash Costs
Including Royalties(3)
($/oz)
Refer to endnote (3) on slide 22
$129 or 17%
Improving overall costs
Reducing unit costs
Reducing sourcing costs
Reducing contractor costs
Industry-leading health & safety record
YTD 2015 ACCOMPLISHMENTS: ACHIEVED CASH COST SAVINGS OF $129 PER OUNCE
Ongoing Business Improvement Initiatives
$30 or 3%
All-in Sustaining Costs(3)
(per ounce sold) higher due to capex and
impact of rainfall on production
Administration expenses, capitalized
deferred stripping, capitalized reserve
development, and sustaining capital
Development capex
Total cash costs
$934 $964

8
YTD 2015 ACCOMPLISHMENTS: ADVANCING GROWTH
Gora Estimated Reserves: 280,000 oz
H2 2015
Expected production of
50K-75Koz of gold per year
POST Q3 UPDATE
Deferral of three high-grade
benches into 2016
Projected to come in 15%
below budget of $19 million
Mill OptimizationTarget Capacity: 4.0+Mt
Up to 10% increase in
throughput & minimum 5%
cost reduction
POST Q3 UPDATE
Project accelerated with
~$8 million in capex
expected to be spent
in 2015
H2 2016
Heap LeachingTarget Capacity: 2.5-4.0Mt
POST Q3 UPDATE
Pre-feasibility study
anticipated to be completed
by end of 2015
2018E
Underground
Resource Conversion
POST Q3 UPDATE
Work underway to convert
resources previously
identified by Oromin to
underground reserves
2015 -
2016
Potential to add high-grade
mill feed
Potential to increase annual
production by 10%-20%

9
Focused on extending current 11-year mine life based on
2.6 million ounces of proven and probable reserves(7)
Launched Niakafiri resettlement process
Commenced work required to add high-grade ounces from
resources previously classified as underground reserves
Evaluating ramp up of regional exploration(8) program
YTD 2015 ACCOMPLISHMENTS: ADVANCING GROWTH
Refer to endnotes (7) and (8) on slide 22
NIAKAFIRI

10
+12M ounces Au discovered
Yatela
Sadiola
Kofi
Loulo
Tabakoto Segala
Gounkoto
Yalea
Fekola
Massawa
Mako
Boto
Makabingui
BIRIMIAN GREENSTONE BELT
MALI+40M ounces Au discovered
EVALUATING OPPORTUNITIES FOR STRATEGIC COMBINATIONS IN SENEGAL
Sabodala Gold Mill

11
. . . AND REVIEWING OPPORTUNITIES IN GREATER WEST AFRICA
SENEGAL
AFRICAWEST AFRICA
West Africa has the potential to become one of the top five
gold-producing regions in the world

OUTLOOK2015

13
2013 2014 2015
164
215
316
371
332 346
271
190
153
53 61
101
Rainfall Over Period from July - October3-Year History
(millimetres)
July August September October
859mm 798mm 916mm
Heaviest rainy season in at least 3 years, with substantial
precipitation continuing into October
Q3 production impacted by ~17,000 ounces, due to heavy
rainfalls affecting throughput and grade
Gora expected to represent ~25,000 out of ~70,000 ounces
forecasted to be produced in Q4; 2015 production forecast
potentially impacted by historical artisanal mining at Gora
Delay in resettlement process could delay anticipated drilling at Niakafiri
FACTORS AFFECTING 2015 PRODUCTION

14
2015 OUTLOOK UPDATED TO REFLECT IMPROVEMENT IN TOTAL CASH COSTS(3)
Refer to endnotes (3) (4) (5) and (6) on slide 22
2015 Guidance (Updated on October 29, 2015)
Production(4) expected to be at low end of guidance --
however, potential impact of Gora artisanal mining is a risk
to fourth quarter production forecast
Total cash costs expected to be below bottom end of range
Anticipate ending the year with a strong balance sheet
Assumptions(5)
$1,100 average gold price per ounce for the balance of
the year
Gora and mill optimization development cost of ~$135/oz
included in all-in sustaining costs
Franco-Nevada Streaming(6)
All-in sustaining costs exclude stream impact of ~$100/oz
as stream is treated as deferred revenue under IFRS
REVISED ORIGINAL
2015 Guidance
Range
2015 Guidance
Range
Operating results
Total material mined (‘000t) ~ 33,000 28,500 - 30,500
Ore milled (‘000t) 3,350 - 3,450 3,600 - 3,800
Gold produced (4)(6)(7) (oz) ~ 200,000 200,000 - 230,000
Total cash cost (incl. royalties)1 ($/oz sold) < 650 650 - 700
All-in sustaining costs1 ($/oz sold) < 975 900 - 975
Total depreciation and amortization1 ($/oz sold) < 260 260 - 275
Mining ($/t mined) < 2.50 2.75 - 2.90
Mining long haul ($/t hauled) < 6.00 5.00 - 6.00
Milling ($/t milled) < 15.00 15.50 - 17.50
G&A ($/t milled) < 5.25 5.25 - 5.75
Gold sold to Franco-Nevada7 (oz) 24,375 24,375
Exploration and evaluation expense (Regional Land Package) ($ millions) ~ 2.0 1.0 - 2.0
Administration and corporate social responsibility costs
(excluding depreciation)
Administration expense ($ millions) ~ 13.0 11.5 - 12.5
Corporate social responsibility expense ($ millions) ~ 3.0 ~ 3.5
Mine production costs ($ millions) 140.0 - 150.0 155.0 - 165.0
Less capitalized deferred stripping ($ millions) ~ 15.0 8.0 - 10.0
Net mine production costs ($ millions) 125.0 -135.0 147.0 -155.0
Capital expenditures
Mine site sustaining ($ millions ) ~ 8.0 6.0 - 8.0
Capitalized reserve development (Mine License) ($ millions) ~ 6.0 6.0 - 8.0
Project development costs (Gora/Golouma/Kerekounda)
Mill optimization ($ millions) ~ 8.0 5.0 - 6.0
Development ($ millions ~ 10.0 16.5 - 17.5
Mobile equipment and other ($ millions) ~ 7.0 7.5 - 8.5
Total project development costs ($ millions) ~ 25.0 29.0 - 32.0
Capitalized deferred stripping ($ millions) ~ 15.0 8.0 - 10.0
Total capital expenditures ($ millions) ~ 54.0 49.0 - 58.0

15
SELF-FUNDING ORGANIC GROWTH INITIATIVES
Current growth initiatives, including Gora and mill optimization,
represent nearly half of 2015 capex
Updated 2015 Outlook for Total Capital Expenditures: ~ $54M
GoraDevelopment
Mill Optimization
Other Project
Development
Capitalized Reserve
Development
Capitalized Deferred Stripping
Sustaining15%
18%
15%
13%
28%
11%

16
INCREASING
Long-Term Sustainable
Free Cash Flow(1)
LOW
All-in Sustaining
Costs Per Ounce(3)
LARGE LONG-LIFE
Reserve & Resource
Base(7)
SOLID
Balance Sheet
SIGNIFICANT
Growth Potential
STRONG
Social License
Refer to endnotes (1), (3) and (7) on slide 22
EMERGING MID-TIER GOLD PRODUCER

121 KING STREET WEST, SUITE 2600
TORONTO, ON M5H 3T9
TRISH MORAN, HEAD OF INVESTOR RELATIONS
TELEPHONE: +1.416.607.4507
EMAIL: [email protected]
TSX:TGZ / ASX:TGZ
WWW.TERANGAGOLD.COM

18
MINERAL RESOURCES SUMMARY As at December 31, 2014
Measured Indicated Measured and Indicated
Tonnes Grade Au Tonnes Grade Au Tonnes Grade Au
Area (Mt) (g/t) (Moz) (Mt) (g/t) (Moz) (Mt) (g/t) (Moz)
Sabodala 23.73 1.21 0.92 19.55 1.23 0.77 43.28 1.22 1.70
Gora 0.49 5.27 0.08 1.84 4.93 0.29 2.32 5.00 0.37
Niakafiri 0.30 1.74 0.02 10.50 1.10 0.37 10.70 1.12 0.39
ML Other
Subtotal Sabodala 24.52 1.30 1.02 31.89 1.40 1.43 56.41 1.36 2.46
Masato 1.55 0.96 0.05 50.26 1.04 1.67 51.81 1.03 1.72
Golouma 12.04 2.69 1.04 12.04 2.69 1.04
Kerekounda 2.20 3.77 0.27 2.20 3.77 0.27
Somigol Other 18.72 0.93 0.56 18.72 0.93 0.56
Subtotal Somigol 1.55 0.96 0.05 83.22 1.33 3.54 84.77 1.32 3.59
Total 26.07 1.28 1.07 115.11 1.35 4.97 141.18 1.33 6.05
Inferred Resources
Tonnes Au Au
Area (Mt) (g/t) (Moz)
Sabodala 18.42 0.93 0.55
Gora 0.21 3.38 0.02
Niakafiri 7.20 0.88 0.21
ML Other 10.60 0.97 0.33
Subtotal Sabodala 36.43 0.94 1.11
Masato 19.18 1.15 0.71
Golouma 2.46 2.01 0.16
Kerekounda 0.34 4.21 0.05
Somigol Other 12.87 0.84 0.35
Subtotal Somigol 34.86 1.13 1.26
Total 71.29 1.03 2.37
Notes for Mineral Resources Summary:
1. CIM definitions were followed for Mineral Resources.
2. Mineral Resource cut-off grades for Sabodala, Masato, Golouma, Kerekounda and Somigol Other are 0.2 g/t Au for oxide and 0.35 g/t Au for fresh.
3. Mineral Resource cut-off grades for Niakafiri are 0.3 g/t Au for oxide and 0.5 g/t Au for fresh.
4. Mineral Resource cut-off grade for Gora is 0.5 g/t Au for oxide and fresh.
5. Mineral Resource cut-off grade for Niakafiri West and Soukhoto is 0.3 g/t Au for oxide and fresh.
6. Mineral Resource cut-off grade for Diadiako is 0.2 g/t Au for oxide and fresh.
7. Measured Resources include stockpiles which total 11.30 Mt at 0.82 g/t Au for 0.30 Mozs.
8. High grade assays were capped at grades ranging from 10 g/t to 30 g/t Au at Sabodala, 20 g/t to 70 g/t Au at Gora, from 4 g/t to 25 g/t Au at Masato, from 5 g/t to 70 g/t for Golouma, from 11 g/t to 50 g/t at Kerekounda, and from 0.8 g/t to 110 g/t at Somigol Other.
9. The figures above are “Total” Mineral Resources and include Mineral Reserves.
10. Neither underground Mineral Resources nor Mineral Reserves have been generated by the Company, therefore global Mineral Resources have been reported at the determined cut-off grades. A detailed underground analysis will be undertaken to follow-up on the
underground resource potential; however, this is not a priority in the near term.
11. Sum of individual amounts may not equal due to rounding.
For clarity, the mineral Resource estimates disclosed above with respect to Niakafiri, Gora and ML Other (which includes Niakafiri, Niakafiri West, Soukhoto and Diadiako) were prepared and first disclosed under the JORC Code 2004. It
has not been updated since to comply with JORC Code 2012 on the basis that the information has not materially changed since it was last reported. Refer to Teranga Gold Corporation’s ASX Quarterly December 31, 2013 report filed on
January 30, 2014 for further details. All material assumptions and technical parameters previously disclosed continue to be applicable and have not materially changed. See Competent Person Statements on pages 33 and 34 for further
details.

19
MINERAL RESERVES SUMMARY As at December 31, 2014
Proven Probable Proven and Probable
Tonnes Grade Au Tonnes Grade Au Tonnes Grade Au
Area (Mt) (g/t) (Moz) (Mt) (g/t) (Moz) (Mt) (g/t) (Moz)
Sabodala 1.98 1.52 0.10 2.48 1.48 0.12 4.45 1.50 0.21
Gora 0.48 4.66 0.07 1.35 4.79 0.21 1.83 4.76 0.28
Niakafiri 0.23 1.69 0.01 7.58 1.12 0.27 7.81 1.14 0.29
Stockpiles 11.30 0.82 0.30 11.30 0.82 0.30
Subtotal Sabodala 13.99 1.07 0.48 11.41 1.63 0.60 25.40 1.32 1.09
Masato 26.93 1.13 0.98 26.93 1.13 0.98
Golouma 6.47 2.24 0.46 6.47 2.24 0.46
Kerekounda 0.88 3.26 0.09 0.88 3.26 0.09
Subtotal Somigol 34.28 1.39 1.53 34.28 1.39 1.53
Total 13.99 1.07 0.48 45.69 1.45 2.12 59.68 1.36 2.62
Notes for Reserves Summary:
1. CIM definitions were followed for Mineral Reserves.
2. Mineral Reserve cut off grades for Sabodala are 0.40 g/t Au for oxide and 0.5 g/t Au for fresh based on a $1,250/oz gold price and metallurgical recoveries between 90 percent and 93 percent.
3. Mineral Reserve cut off grades for Niakafiri are 0.35 g/t Au for oxide and 0.5 g/t Au for fresh based on a $1,350/oz gold price and metallurgical recoveries between 90 percent and 92 percent.
4. Mineral Reserve cut off grade for Gora is 0.76 g/t Au for oxide and fresh based on $1,200/oz gold price and metallurgical recovery of 95 percent.
5. Mineral Reserve cut off grades for Masato are 0.4 g/t Au for oxide and 0.5 g/t for fresh based on $1,200/oz gold price and metallurgical between 90 percent and 93 percent.
6. Mineral reserve cut off grades for Golouma and Kerekounda are 0.4 g/t Au for oxide and 0.5 g/t for fresh based on $1,250/oz gold price and metallurgical between 90 percent and 93 percent.
7. Sum of individual amounts may not equal due to rounding.
8. The Niakafiri deposit is adjacent to the Sabodala village and relocation of at least some portion of the village will be required which will necessitate a negotiated resettlement program with the affected
community members.
9. The Gora deposit is intended to be merged into the Sabodala mining license which the State of Senegal has agreed to in principal subject to completion and receipt of an approved environmental and
social impact assessment which is ongoing.
10. There are no other known political, legal or environmental risks that could materially affect the potential development of the identified mineral resources or mineral reserves other than as already set
out in the Company’s Annual Information Form dated March 31, 2014 (revised April 24, 2014). Refer to RISK FACTORS beginning on page 60.
For clarity, the mineral Reserve estimates disclosed above with respect to Niakafiri and Gora was prepared and first disclosed under the JORC Code 2004. It has not been
updated since to comply with JORC Code 2012 on the basis that the information has not materially changed since it was last reported. Refer to Teranga Gold Corporation’s ASX
Quarterly December 31, 2013 report filed on January 30, 2014 for further details. All material assumptions and technical parameters previously disclosed continue to be
applicable and have not materially changed. See Competent Person Statements on pages 33 and 34 for further details.

20
The technical information contained in this presentation relating to the mineral reserve estimates for Sabodala, the stockpiles, Masato, Golouma and Kerekounda is based on, and fairly represents,
information compiled by Mr. William Paul Chawrun, P. Eng who is a member of the Professional Engineers of Ontario, which is currently included as a "Recognized Overseas Professional
Organization" in a list promulgated by the ASX from time to time. Mr. Chawrun is a full-time employee of Teranga and is a "qualified person" as defined in NI 43-101 and a "competent person" as
defined in the 2012 Edition of the "Australasian Code for Reporting of Exploration Results, Mineral Resources and Ore Reserves". Mr. Chawrun has sufficient experience relevant to the style of
mineralization and type of deposit under consideration and to the activity he is undertaking to qualify as a Competent Person as defined in the 2012 Edition of the "Australasian Code for Reporting of
Exploration Results, Mineral Resources and Ore Reserves". Mr. Chawrun has consented to the inclusion in this document of the matters based on his compiled information in the form and context in
which it appears in this presentation.
The technical information contained in this presentation relating to the mineral reserve estimates for Gora and Niakafiri is based on, and fairly represents, information and supporting documentation
prepared by Julia Martin, P.Eng. who is a member of the Professional Engineers of Ontario and a Member of AusIMM (CP). Ms. Martin is a full time employee with AMC Mining Consultants (Canada)
Ltd., is independent of Teranga, is a “qualified person” as defined in NI 43-101 and a “competent person” as defined in the 2004 Edition of the “Australasian Code for Reporting of Exploration Results,
Mineral Resources and Ore Reserves”. Ms. Martin has sufficient experience relevant to the style of mineralization and type of deposit under consideration and to the activity she is undertaking to
qualify as a Competent Person as defined in the 2004 Edition of the “Australasian Code for Reporting of Exploration Results, Mineral Resources and Ore Reserves”. Ms. Martin is a “Qualified Person”
under National Instrument 43-101 Standards of Disclosure for Mineral Projects. Ms. Martin has reviewed and accepts responsibility for the Mineral Reserve estimates for Gora and Niakafiri disclosed in
this document and has consented to the inclusion of the matters based on her information in the form and context in which it appears in this presentation.
The technical information contained in this presentation relating to mineral resource estimates for Niakafiri, Gora, Niakafiri West, Soukhoto, and Diadiako is based on, and fairly represents, information
compiled by Ms. Patti Nakai-Lajoie. Ms. Patti Nakai-Lajoie, P. Geo., is a Member of the Association of Professional Geoscientists of Ontario, which is currently included as a "Recognized Overseas
Professional Organization" in a list promulgated by the ASX from time to time. Ms. Nakai-Lajoie is a full time employee of Teranga and is not "independent" within the meaning of National Instrument
43-101. Ms. Nakai-Lajoie has sufficient experience which is relevant to the style of mineralization and type of deposit under consideration and to the activity which she is undertaking to qualify as a
Competent Person as defined in the 2004 Edition of the "Australasian Code for Reporting of Exploration Results, Mineral Resources and Ore Reserves". Ms. Nakai-Lajoie is a "Qualified Person" under
National Instrument 43-101 Standards of Disclosure for Mineral Projects. Ms. Nakai-Lajoie has consented to the inclusion in this document of the matters based on her compiled information in the form
and context in which it appears in this presentation.
COMPETENT AND QUALIFIED PERSONS STATEMENT

21
The technical information contained in this presentation relating to mineral resource estimates for Sabodala, Masato, Golouma, Kerekounda, and Somigol Other are based on, and fairly
represents, information compiled by Ms. Patti Nakai-Lajoie. Ms. Patti Nakai-Lajoie, P. Geo., is a Member of the Association of Professional Geoscientists of Ontario, which is currently included as
a "Recognized Overseas Professional Organization" in a list promulgated by the ASX from time to time. Ms. Nakai-Lajoie is a full time employee of Teranga and is not "independent" within the
meaning of National Instrument 43-101. Ms. Nakai-Lajoie has sufficient experience which is relevant to the style of mineralization and type of deposit under consideration and to the activity which
she is undertaking to qualify as a Competent Person as defined in the 2012 Edition of the "Australasian Code for Reporting of Exploration Results, Mineral Resources and Ore Reserves". Ms.
Nakai-Lajoie is a "Qualified Person" under National Instrument 43-101 Standards of Disclosure for Mineral Projects. Ms. Nakai-Lajoie has consented to the inclusion in this presentation of the
matters based on her compiled information in the form and context in which it appears in this document.
Teranga’s exploration programs are being managed by Mr. Peter Mann, FAusIMM. Mr. Mann is a full time employee of Teranga and is not "independent" within the meaning of National
Instrument 43-101. Mr. Mann has sufficient experience which is relevant to the style of mineralization and type of deposit under consideration and to the activity which he is undertaking to qualify
as a Competent Person as defined in the 2012 Edition of the "Australasian Code for Reporting of Exploration Results, Mineral Resources and Ore Reserves". Mr. Mann is a "Qualified Person"
under National Instrument 43-101 Standards of Disclosure for Mineral Projects. The technical information contained in this presentation relating exploration results are based on, and fairly
represents, information compiled by Mr. Mann. Mr. Mann has verified and approved the data disclosed in this presentation, including any sampling, analytical and test data underlying the
information. The reverse circulation samples are prepared at site and assayed in the SGS laboratory located at the site. Analysis for diamond drilling is sent for fire assay analysis at ALS
Johannesburg, South Africa. Mr. Mann has consented to the inclusion in this presentation of the matters based on his compiled information in the form and context in which it appears herein.
Teranga's disclosure of mineral reserve and mineral resource information is governed by NI 43-101 under the guidelines set out in the Canadian Institute of Mining, Metallurgy and Petroleum (the
"CIM") Standards on Mineral Resources and Mineral Reserves, adopted by the CIM Council, as may be amended from time to time by the CIM ("CIM Standards"). CIM definitions of the terms
"mineral reserve", "proven mineral reserve", "probable mineral reserve", "mineral resource", "measured mineral resource", "indicated mineral resource" and "inferred mineral resource", are
substantially similar to the JORC Code corresponding definitions of the terms "ore reserve", "proved ore reserve", "probable ore reserve", "mineral resource", "measured mineral resource",
"indicated mineral resource" and "inferred mineral resource", respectively. Estimates of mineral resources and mineral reserves prepared in accordance with the JORC Code would not be
materially different if prepared in accordance with the CIM definitions applicable under NI 43-101. There can be no assurance that those portions of mineral resources that are not mineral
reserves will ultimately be converted into mineral reserves.
COMPETENT AND QUALIFIED PERSONS STATEMENT

22
ENDNOTES
1. Free cash flow (“FCF”) is defined as operating cash flow less capital expenditures and includes the impact of the Franco-Nevada stream. For 2013 and 2014, FCF is before the OJVG
transaction costs.
2. Net cash (debt) is defined as total borrowings and financial derivative liabilities less cash and cash equivalents, and restricted cash.
3. Total cash costs per ounce, all-in sustaining costs per ounce, and total depreciation and amortization per ounce are non-IFRS financial measures and do not have a standard meaning under
IFRS. Please refer to the Non-IFRS Financial Measures section in the Company’s 2015 third quarter Management Discussion & Analysis available on the Company’s website at
www.terangagold.com. All-in sustaining costs include: total cash costs, administrative expenses (including share based compensation, and excluding corporate depreciation expense and
social community costs not related to current operations), capitalized deferred stripping, capitalized reserve development, and mine site sustaining & development capital expenditures as
defined by the World Gold Council.
4. The production guidance is based on existing proven and probable reserves only from both the Sabodala mining license and Golouma mining license as disclosed in the Company’s
December 31, 2014 Annual MD&A.
5. Key assumptions: This forecast financial information is based on the following material assumptions for the balance of 2015: gold price: $1,100 per ounce; LFO: $0.98 per litre; HFO: $0.69 per
litre; USD:Euro exchange rate of 1.08:1. Other important assumptions include: any political events are not expected to impact operations, including movement of people, supplies and gold
shipments; grades and recoveries will remain consistent with the life-of-mine plan to achieve the forecast gold production; income tax rate for Teranga’s 25% in Senegal, royalty rate is 5%,
the Company’s tax holiday ending May 2015, and no unplanned delays in or interruption of scheduled production.
6. 22,500 ounces of production are to be sold to Franco Nevada at 20% of the spot gold price. Due to the timing of shipment schedules near year end, the delivery of 1,875 ounces of gold for
the month of December 2014 was not received by Franco-Nevada until early January 2015. The transaction with Franco-Nevada permits for the delivery of payable gold for up to five
business days following a month end.
7. Mineral Reserves and Mineral Resources estimates as at December 31, 2014 as per Company disclosure. For more information regarding Teranga Gold’s Mineral Reserves and Resources,
please refer to the Company’s 2014 Annual MD&A available on the Company’s website at www.terangagold.com.
8. Over the past several years more than twelve million ounces of measured and indicated resources have been identified within the south eastern Senegal region, including the Massawa,
Golouma, Makabingui and Mako projects, along with the Company’s own Sabodala gold mine. With exploration work completed to date and the prior exploration success seen in the area
Management believes there is a reasonable basis to anticipate future resource to reserve conversion.
Related Documents