Investor Presentation May 2016

Welcome message from author
This document is posted to help you gain knowledge. Please leave a comment to let me know what you think about it! Share it to your friends and learn new things together.
Transcript

Investor PresentationMay 2016

2
Forward Looking Statements
This presentation contains forward-looking statements which may be identified by their use of words like
“plans,” “expects,” “will,” “anticipates,” “believes,” “intends,” “projects,” “estimates” or other words of similar
meaning. All statements that address expectations or projections about the future, including, but not limited
to, statements about the strategy for growth, product development, market position, expenditures, and
financial results, are forward-looking statements.
Forward-looking statements are based on certain assumptions and expectations of future events. The
companies referred to in this presentation cannot guarantee that these assumptions and expectations are
accurate or will be realized. The actual results, performance or achievements, could thus differ materially
from those projected in any such forward-looking statements. These companies assume no responsibility to
publicly amend, modify or revise any forward looking statements, on the basis of any subsequent
developments, information or events, or otherwise.

3
Table of Contents
I. Introduction & Financials
II. Refining and Marketing
III. Petrochemicals
IV. Exploration and Production
V. Retail
VI. 4G Telecom – Jio

Introduction & Financials

5
India’s Most Profitable Company Today
Energy Value Chain Consumer-centric Businesses
Vertical Integration through Refining & Petrochemicals
Leadership Across Businesses
Best-in-class Efficiency Driving High Margins
Digital Platform: An ecosystem central to everyday lives
Retail: Unparalleled choice, value and convenience
Refining and Marketing
13 Largest, most complex single site refinery with
1.24mmbpd capacity
Consistently outperforming regional margins
~60% volumes placed in international markets
Ranked Top 10 globally in key products
2nd largest producer of polyester fibre/yarn
globally
FY16 Production: 24.7 MMT
Significant expertise in deep-water operations
Substantial exposure in US Shale
Petrochemicals
Exploration and Production
Retail
India’s largest retailer by revenues
Presence across 532 cities
12.8 MM sq.ft. space
FY16 Number of stores: 3,245
Building a pan-India next generation digital
platform to provide high-speed broadband
network, digital content, applications and
services
Only player with access to pan-India sub 1 GHz
spectrum
Interests in Digital and Mobile Content
Reliance Jio
Most profitable company in India in FY16 - net income of $4.2bn for the year
Revenue of $44.7bn, EBITDA of $7.9bn
A market leader across energy value chain (E&P, R&M, Petchem) and in consumer businesses (Telecom and Retail)

6
13.7
41.7
44.7
FY06 FY11 FY16
Robust And Consistent Financial Performance
Note:1. US$1 = INR 66.2552. Gross turnover3. Adj. for CWIP
2.3
6.1
7.9
FY06 FY11 FY16
Revenue (US$ Bn) (1) EBITDA (US$ Bn) (1) Net Profit (US$ Bn) (1)
1.4
2.9
4.2
FY06 FY11 FY16
7.0% 9.3%10.3%14.7% 17.6%17.0%
Margins
(2)
Source: Company information
20.5
13.2
20.0
FY06 FY11 FY16
Adj. ROCE (%) (3)
7
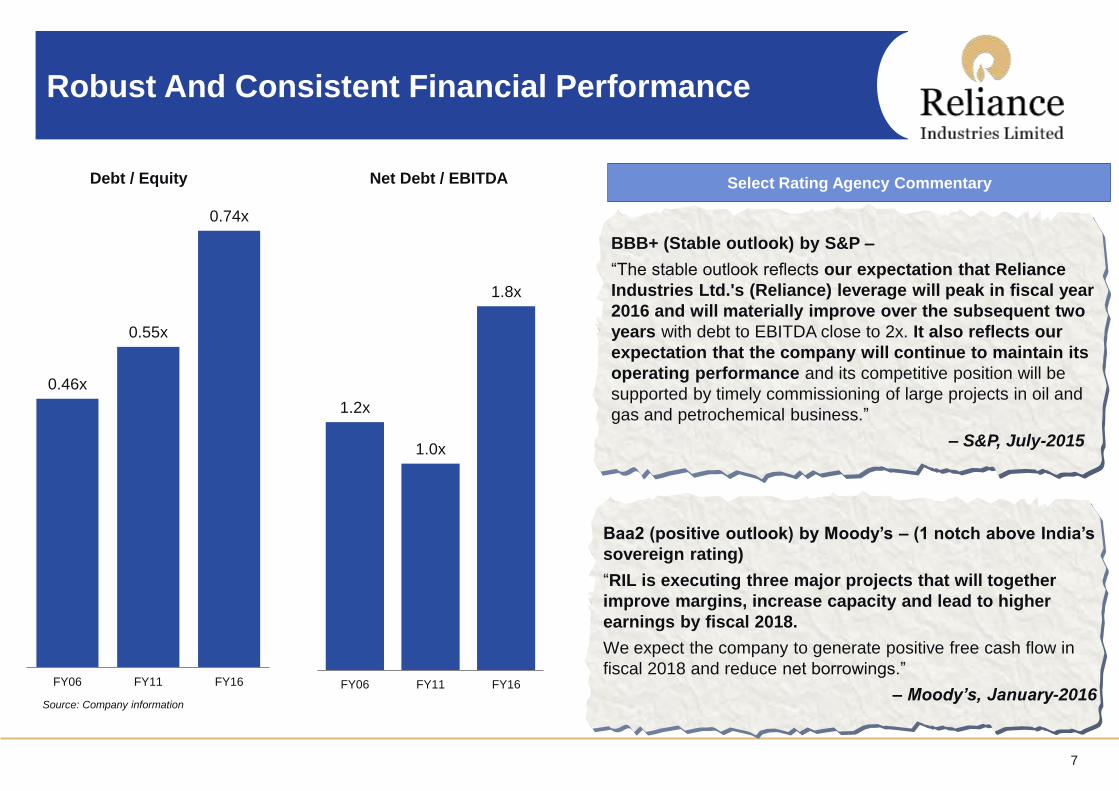
0.46x
0.55x
0.74x
FY06 FY11 FY16
Robust And Consistent Financial Performance
1.2x
1.0x
1.8x
FY06 FY11 FY16
Debt / Equity Net Debt / EBITDA
Source: Company information
Select Rating Agency Commentary
BBB+ (Stable outlook) by S&P –
“The stable outlook reflects our expectation that Reliance
Industries Ltd.'s (Reliance) leverage will peak in fiscal year
2016 and will materially improve over the subsequent two
years with debt to EBITDA close to 2x. It also reflects our
expectation that the company will continue to maintain its
operating performance and its competitive position will be
supported by timely commissioning of large projects in oil and
gas and petrochemical business.”
– S&P, July-2015
Baa2 (positive outlook) by Moody’s – (1 notch above India’s
sovereign rating)
“RIL is executing three major projects that will together
improve margins, increase capacity and lead to higher
earnings by fiscal 2018.
We expect the company to generate positive free cash flow in
fiscal 2018 and reduce net borrowings.”
– Moody’s, January-2016

8
Investments in India to Provide Next Leg of Growth
World-class project execution capabilities
Leveraging integration benefits
Investing through the business cycle
Best-in-class technology selection
Investments based on long-term view
Unparalleled financial flexibility
Best Play on the India’s Demographic Story - Deploying $30 Bn+ in downstream projects and consumer-focused
businesses
Significant value creation through investments in scale, technology and people
Projects nearing completion - set to deliver substantial uplift in operating EBITDA
Note:1. US$1 = INR 66.255

9
Investing in Attractive Opportunities
1.5 MMTPA ROGC (with downstream PE, PP and MEG capacities)
2.3 MMTPA PX capacity at Jamnagar
2.3 MMTPA PTA and 650 KTPA PET capacity at Dahej
0.4 MMTPA PFY at Silvassa
Volume Growth
Cost Advantage and
Feedstock Flexibility
New Growth Platforms
World’s largest Petcoke Gasification project at Jamnagar
Gasification project to provide sustainable cost advantage
Ethane imports to provide feedstock flexibility and security
Building a powerful ecosystem offering pan-India 4G services
End-to-end data solutions on next gen all IP network
India’s largest retailer with significant scale in a high-growth market
Upside from potential foray into e-commerce

Refining & Marketing (R&M)

11
Refining & Marketing:
Focus on Increasing the Advantage
Largest Single Site
Refinery with Robust
Configuration
Ability to Run a Wide
Basket of Crudes
Strategic Location &
Advantaged Logistics
Among Lowest Cost
Producers Globally
Strong Operational
Performance
Flexible Product
Slate, Selling to
Highest Value
Markets
Exposed to
Favourable Regional
Industry Dynamics
Petcoke
Gasification Project
Initiatives for
Enhancing
Competitive
Strength
Ramp-up of
Domestic Retail
Integration
Tangible Upside
to Margins
Improving
Returns on
Capital
Best-in-Class
Portfolio Today
Increasing the
Advantage
Delivering
Differentiated
Performance
RetailPetrochemicalsRefining &
Marketing
Exploration
& ProductionJio
Industry
highlights
Low Oil Prices
Support High Global
Demand
Strong Gasoline
Margins
Low Natural Gas and
Energy Cost

12
RIL Owns the Largest Single Location Refinery in the
World
Top Quality Facilities
Global Scale, Low cost, Modern Assets
12.7 Complexity Index
Robust Configuration—Nelson Complexity Index of 12.7
69.6 MMT
Record crude processed in FY2016
100%+
Ability to sustain high operating rates through the cycles
US$10.8/bbl
Highest GRM in the last 7 years - outperforming regional
benchmark margins
RetailPetrochemicalsRefining &
Marketing
Exploration
& ProductionJio
Source: Company information
Largest Refineries (kbpd)
Company Location Size (kbpd)
RIL Jamnagar 1,240
SK Energy Ulsan 1,120
PdVSA Paraguana 940
G5 Caltex Yeosu 730
S-Oil Onsan 669
ExxonMobil Singapore 605
Motiva Port Arthur 600
ExxonMobil Baytown 573
Saudi Aramco Yas Tanura 550
Marathon Garyvile 522
ExxonMobil Baton Rouge 503

13
Ability to Process a Wide Basket of Crudes Aided by
Strategic Location
…With Captive Infrastructure & Advantaged
Logistics
RetailPetrochemicalsRefining &
Marketing
Exploration
& ProductionJio
Strategically Located on the West Coast…
Captive world class port facilities
Strong crude and product freight economics
Port based, fully integrated manufacturing facility
Dedicated deep-water port & storage
Captive power plant
Gas pipeline infrastructure
Proximity to crude oil sources in the Middle East
Logistics with high degree of automation
Increased efficiency given significant volumes
Ability to process a wide basket of crudes
Active assessment on an ongoing basis, to source the optimal crude basket to minimize cost
Crude slate processed in FY16 – one of the most challenging slates, processable by only a few refineries
in the world
Flexibility further enhanced through ongoing low-cost production measures
Processing of heavier basket (DTA Coker capacity stretch)
Processing of higher contaminant content crudes (Tweak unit operating conditions)
Improved logistics for handling high viscosity / high pour crudes
Ability to
Process a
Wide
Basket of
Crudes

14
49.3
56.3
61.3
51.3
35.5
FY12 FY13 FY14 FY15 FY16
R&M : Robust Financial Performance Continues
Note:1. US$1 = INR 66.255
Revenue (US$ Bn) (1)
3.0%
1.5
1.9 2.0
2.4
3.6
FY12 FY13 FY14 FY15 FY16
EBIT (US$ Bn) (1)
3.4% 3.3% 4.7% 10.0%
EBIT Margin
RetailPetrochemicalsRefining &
Marketing
Exploration
& ProductionJio
Source: Company information
7 year high GRM of US$
10.8/bbl and record crude
throughput of 69.6 MMT
lead to high growth in
EBIT and improved
margins
FY16 average utilisation
of 112% achieved
RIL’s GRM outperformed
Singapore complex
margins by US$ 3.3/bbl
due to strong light
distillate cracks, lower
energy costs and
advantageous crude
sourcing opportunities
R&M revenue declined
due to sharp fall in crude
oil prices
CAGR: 24.4%
15
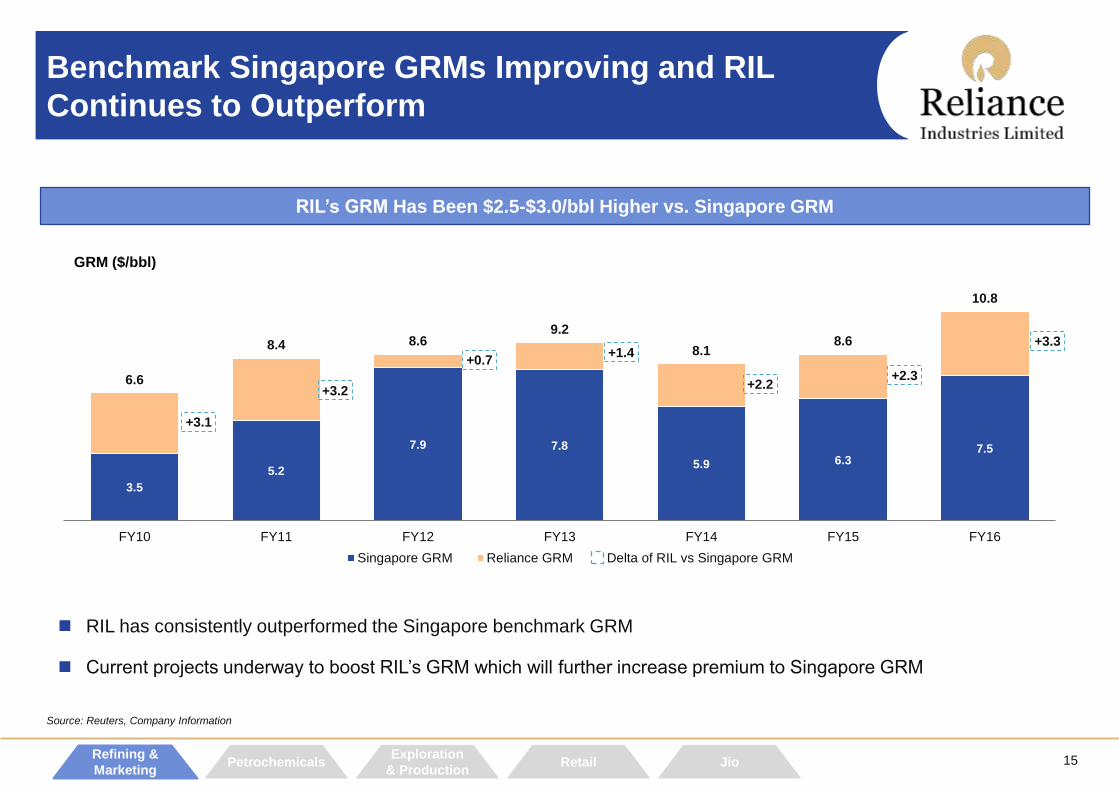
3.5
5.2
7.9 7.8
5.9 6.37.5
+3.1
+3.2
+0.7+1.4
+2.2+2.3
+3.3
6.6
8.4 8.69.2
8.18.6
10.8
FY10 FY11 FY12 FY13 FY14 FY15 FY16
Singapore GRM Reliance GRM Delta of RIL vs Singapore GRM
GRM ($/bbl)
Benchmark Singapore GRMs Improving and RIL
Continues to Outperform
RIL’s GRM Has Been $2.5-$3.0/bbl Higher vs. Singapore GRM
Source: Reuters, Company Information
RetailPetrochemicalsRefining &
Marketing
Exploration
& ProductionJio
RIL has consistently outperformed the Singapore benchmark GRM
Current projects underway to boost RIL’s GRM which will further increase premium to Singapore GRM

16
0.0
0.2
0.4
0.6
0.8
1.0
1.2
1.4
1.6
2012 2013 2014 2015 2016E 2017E 2018E
Incremental refinery throughput Incremental net supply
Encouraging Outlook for Global Oil Demand
Crude Oil Demand Growth (mmbpd) Incremental Oil Demand to Exceed Refinery Capacity¹
(mmbpd)
Source: IEA, PPAC, EIA, BP statistical review, Broker Research1 Refinery throughput excludes condensate volumes, and incremental net supply is adjusted for mothballed capacities.
0.47
0.150.31 0.33
0.35
0.35
0.63
0.30
0.05
0.08
0.25
0.33
0.32
0.32
0.65
0.23
1.19
0.90
1.84
1.19
2013 2014 2015 2016
US China India Others
RetailPetrochemicalsRefining &
Marketing
Exploration
& ProductionJio
China and India continue to drive demand growth
Growth in auto sector will continue to aid demand
growth, especially in China
Structural shift towards gasoline over gasoil in all key
markets
Other industries like heavy metals and mining will
continue to drive gasoil demand
Year Ending March
Global oil demand is likely to be revised upwards to
1.4 mmbpd

17
Utilization Rate Expected to Continue to Increase
Global Demand – Supply and Utilization
Source: Broker research
RetailPetrochemicalsRefining &
Marketing
Exploration
& ProductionJio
Growth in demand vs. capacity
additions is expected to keep
refining margin healthy
— Scheduled refinery shut
downs and maintenance
— Moth-balling of refining
capacity
Incremental demand over
capacity addition is expected to
help maintain and improve
utilization rates
— The positive outlook includes
due consideration for splitter
capacity
78%
79%
80%
81%
82%
83%
84%
40
50
60
70
80
90
100
FY09 FY10 FY11 FY12 FY13 FY14 FY15E FY16E FY17E FY18E
Utiliz
atio
n ra
te %
(mn
b/d
)
Global refining capacity Crude throughput Effective utilization rate (%, RHS)

18
Sources of Value Creation
Creating value through the R&M cycle
Placement in domestic market through retail network
Lower energy cost from gasification project
Continued optimisation and optionality in crude procurement
RetailPetrochemicalsRefining &
Marketing
Exploration
& ProductionJio
Emphasis on operational excellence

Petrochemicals
20
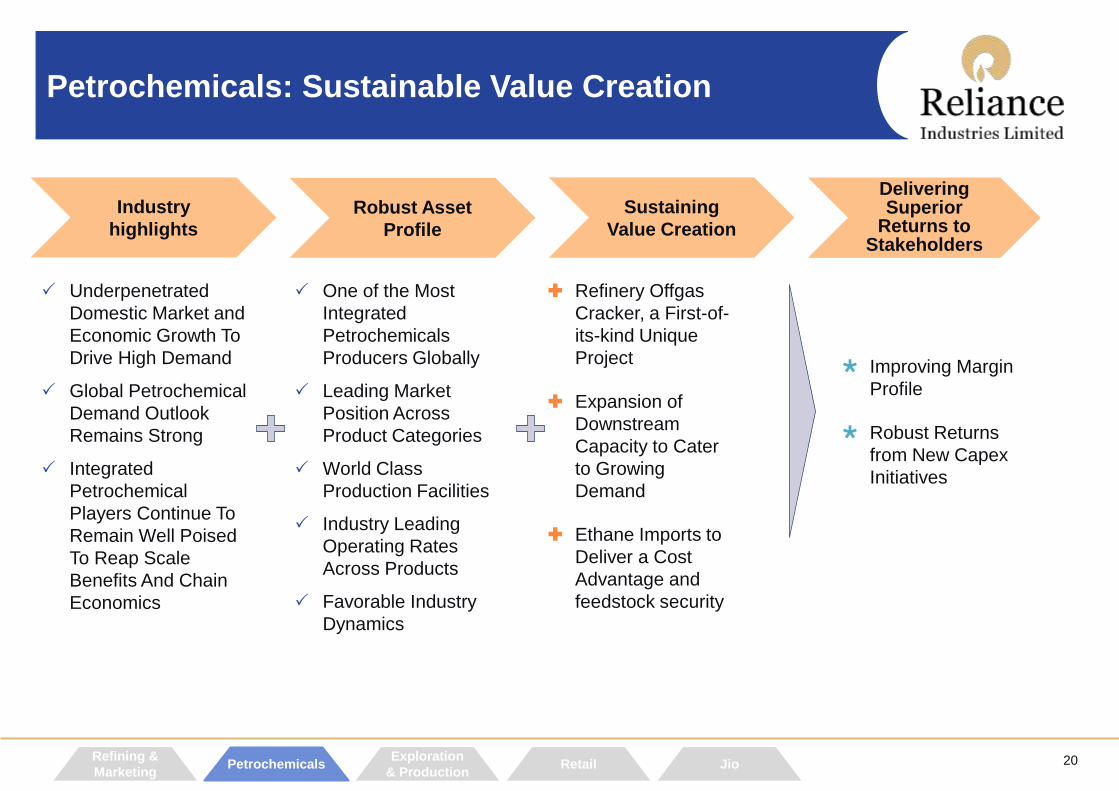
Petrochemicals: Sustainable Value Creation
One of the Most
Integrated
Petrochemicals
Producers Globally
Leading Market
Position Across
Product Categories
World Class
Production Facilities
Industry Leading
Operating Rates
Across Products
Favorable Industry
Dynamics
Refinery Offgas
Cracker, a First-of-
its-kind Unique
Project
Expansion of
Downstream
Capacity to Cater
to Growing
Demand
Ethane Imports to
Deliver a Cost
Advantage and
feedstock security
Improving Margin
Profile
Robust Returns
from New Capex
Initiatives
Robust Asset
Profile
Sustaining
Value Creation
Delivering Superior
Returns to Stakeholders
Industry
highlights
Underpenetrated
Domestic Market and
Economic Growth To
Drive High Demand
Global Petrochemical
Demand Outlook
Remains Strong
Integrated
Petrochemical
Players Continue To
Remain Well Poised
To Reap Scale
Benefits And Chain
Economics
RetailPetrochemicalsRefining &
Marketing
Exploration
& ProductionJio

21
Robust Asset Profile with Efficient Operations
RetailPetrochemicalsRefining &
Marketing
Exploration
& ProductionJio
Largest
Petrochemical producer in India
with 24.7 MMT of production
Among Top 10
Petrochemical producers globally
post implementation of expansion
projects
2nd Largest
Producer of polyester fibre/yarn
globally
5th Largest
Producer of PTA globally
5th Largest
Producer of PP globally
7th Largest
Producer of PX globally
Global Scale and Size (1) Cost Effective Vertically Integrated Operations
Fully integrated
operations providing cost
competitiveness
Captive and cost
effective
feedstock supplies –
provides feedstock
security
High domestic market
share across most
products leading to
benefits of economies
of scale
Consistently higher
operating rates – near
100% utilization
through the cycles
Note:1. All figures/rankings as of FY16
Source: Company information

22
13.0
14.2
15.7
14.6
12.4
FY12 FY13 FY14 FY15 FY16
Petrochemicals: Strong Financial Performance
Note:1. US$1 = INR 66.255
Revenue (US$ Bn) (1)
10.5%
1.4
1.1
1.3 1.3
1.5
FY12 FY13 FY14 FY15 FY16
EBIT (US$ Bn) (1)
7.6% 8.1% 8.6% 12.4%
EBIT Margin
RetailPetrochemicalsRefining &
Marketing
Exploration
& ProductionJio
Source: Company information
New PET and PTA plants
commissioned at Dahej
Started India's largest SBR Plant
at Hazira with capacity of 150
KTPA and also expanded PBR
capacity
Lower product prices resulting
from sharp decline in crude and
feedstock resulted in a decline in
Petchem revenue
EBIT margins are improving due
to strong polymer deltas and
favorable naphtha cracking
economics

23
India – Strong Domestic Demand Trajectory
Polyester facility commissioned at Silvassa
India to witness higher all-fibre growth rate of 4.1% vis-
à-vis global average of 2.6%
Polyester to account for 70% of the incremental fibre
demand globally
2.6% 2.6%2.9%
2.1%
0.5%
4.1%
3.5%
4.7%
5.2%
4.8%
All Fibres Cotton PFY PSF Others
World India
Strong Fibre Demand Outlook (2013-2019E CAGR)
RIL’s planned capacity expansions to capitalize on increasing demand and maintaining market leadership
Source: PCI, IHS
RetailPetrochemicalsRefining &
Marketing
Exploration
& ProductionJio
Polymer Demand Driven by Under Penetration
Among the lowest per capita consumption
India’s polymer demand expected to grow at ~10% over
the next five years
Over 2000-2015, India has sustained CAGR of 9% in
Polymers and 7% in Polyester
CAGR
5.8%
3.7%
3.0%2.9%
11.4%
24
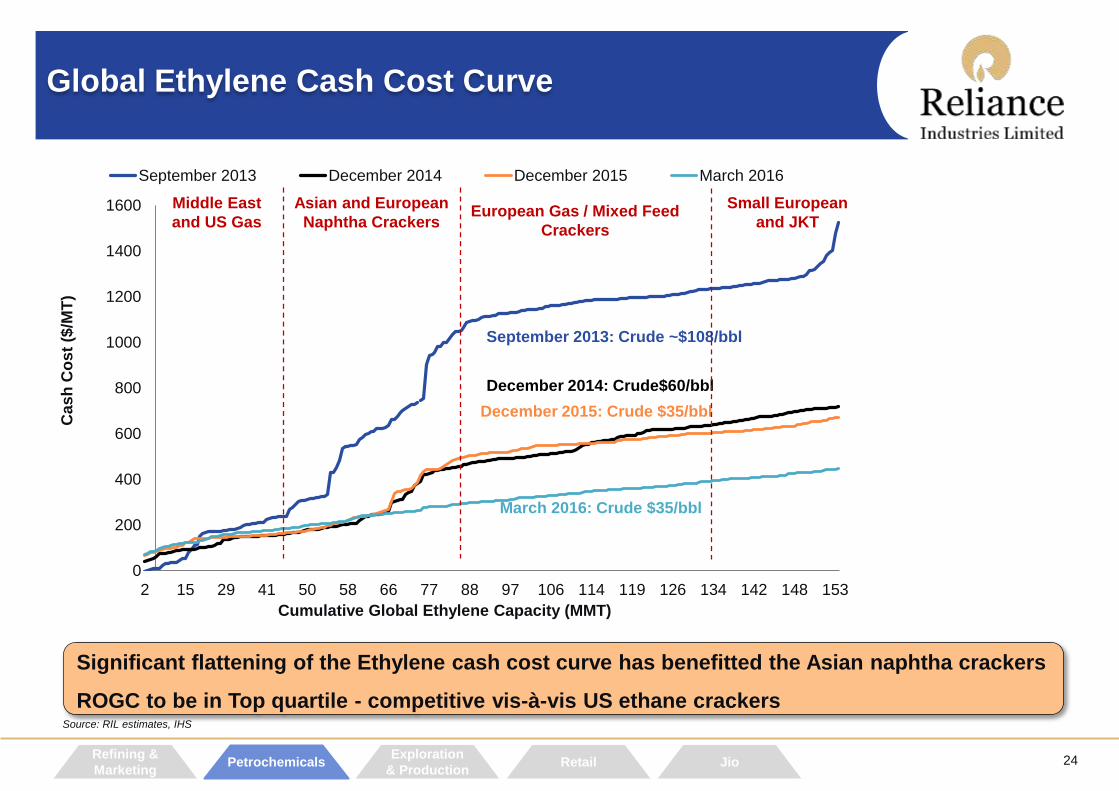
Global Ethylene Cash Cost Curve
Source: RIL estimates, IHS
RetailPetrochemicalsRefining &
Marketing
Exploration
& ProductionJio
Cumulative Global Ethylene Capacity (MMT)
0
200
400
600
800
1000
1200
1400
1600
2 15 29 41 50 58 66 77 88 97 106 114 119 126 134 142 148 153
September 2013 December 2014 December 2015 March 2016
March 2016: Crude $35/bbl
September 2013: Crude ~$108/bbl
December 2014: Crude$60/bbl
December 2015: Crude $35/bbl
Middle East
and US Gas
Asian and European
Naphtha CrackersEuropean Gas / Mixed Feed
Crackers
Small European
and JKT
Cas
h C
os
t ($
/MT
)
Significant flattening of the Ethylene cash cost curve has benefitted the Asian naphtha crackers
ROGC to be in Top quartile - competitive vis-à-vis US ethane crackers

Projects – Petcoke Gasification & Petrochemicals Expansion

26
ROGC and Petcoke Gasification:
A World Class Initiative to Further Operational Excellence
Capacity expansion
of profitable
petrochemical
production
Cost savingEBITDA and Margin
expansion
RIL one of the few players globally with ability to undertake a ROGC / petcoke gasification project
End-to-end integration between refining and petrochemicals
Sufficient scale / volumes to justify cost savings vis-à-vis investments
RetailPetrochemicalsRefining &
Marketing
Exploration
& ProductionJio

27
An Integrated View of the Project
Petrochemical expansion
Need for more feedstock
Utilize refinery off-gases
Deficit fuel / energy for refinery
Utilize syngas produced by
petcoke
gasifier
Utilize petcoke
ROGC
Petcoke Gasification
Satisfies feedstock needs for capacity expansion
Significantly cheaper than Naptha based crackers
Tangible volume increase and cost saving
Replace expensive LNG with syngas from petcoke
gasifier
Sustainable long-term advantage – perpetual source
of energy
A step change in energy cost
Mo
vin
g U
p t
he
Va
lue
Ch
ain
PE:
$900–
1,100 / MT
Petcoke:
$40–50 / MT
RetailPetrochemicalsRefining &
Marketing
Exploration
& ProductionJio

28
Project Progress and Site Pictures
Gasification Skyline Gasification Dome – Inside View
ROGC Furnace Paraxylene Heaters
RetailPetrochemicalsRefining &
Marketing
Exploration
& ProductionJio
Construction work continues on round-the-clock basis with peak level deployment of work force
Many supporting systems are ready and pre-commissioning/commissioning activities are being taken up:
Main receiving station for power
Power generation equipment
Material handling system
Utilities such as cooling tower
ETP (Tertiary Treatment) etc.
Focus on expeditious completion of construction work and commissioning of completed systems

Exploration & Production
30
High Quality Portfolio: Strong Base for Future Growth
Significant India Oil and Gas PositionAdvantageous Offshore Capabilities + Operations in
US Shale
RetailPetrochemicalsRefining &
Marketing
Exploration
& ProductionJio
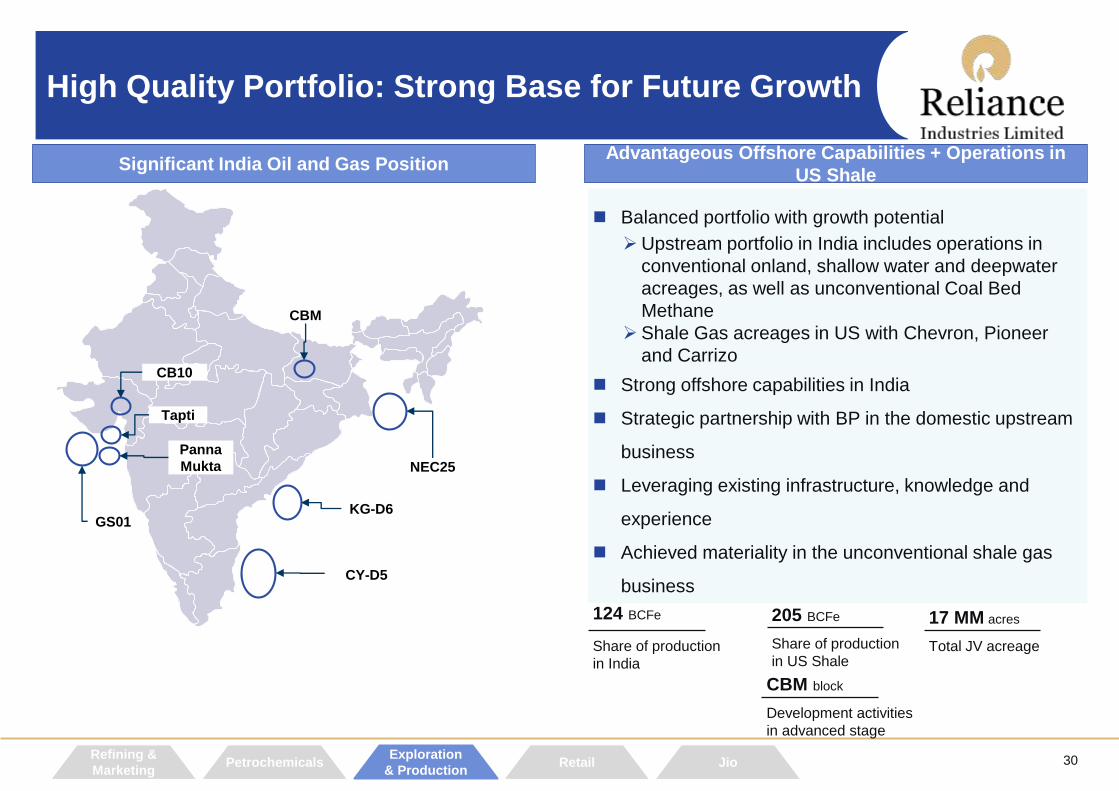
Balanced portfolio with growth potential
Upstream portfolio in India includes operations in
conventional onland, shallow water and deepwater
acreages, as well as unconventional Coal Bed
Methane
Shale Gas acreages in US with Chevron, Pioneer
and Carrizo
Strong offshore capabilities in India
Strategic partnership with BP in the domestic upstream
business
Leveraging existing infrastructure, knowledge and
experience
Achieved materiality in the unconventional shale gas
business
124 BCFe
Share of production
in India
205 BCFe
Share of production
in US Shale
CBM block
Development activities
in advanced stage
17 MM acres
Total JV acreage
GS01
Panna
Mukta
Tapti
CB10
CBM
NEC25
CY-D5
KG-D6

31
Shale Gas : Sustained Volumes & Lower Prices
Average Realization and Volumes In FY16, 129 wells were drilled and 190 wells were put on
production increasing total producing well count to 1,055
Volume growth offset by weak realization due to drop in
commodity prices
Short term earnings stress driven by pricing environment
Business responding with “preservation of cash” while
“maintaining growth and optionality”
Improvement in costs and efficiencies, across JVs
supported by improved efficiencies and renegotiated
service costs
Opex trends remained encouraging and thrust on further
lowering of costs continues across JVs
6.696.19
6.03
7.016.58
5.69
4.60
3.43 3.51
2.812.42
1.97
0.00
2.00
4.00
6.00
8.00
$/M
cfe
19.4 19.4 22.3 22.9 25.0 25.9 27.1 24.6 26.1 27.4 30.7 28.8
7.4 6.78.3 8.7
9.3 9.4 10.310.1 9.7 9.3
8.78.2
5.5 5.36.1 6.4
7.2 7.67.9
6.3 6.0 6.26.4
5.9
0.0
10.0
20.0
30.0
40.0
50.0
RIL
Sh
are
of
Vo
lum
es (
Bcfe
)
Net Sales Volumes (Reliance Share)
Gas Condensate NGLs
45.845.3
42.9 41.0 41.742.9
31.432.3
38.036.7
41.442.9
RetailPetrochemicalsRefining &
Marketing
Exploration
& ProductionJio
Source: Company information

32
CBM: Field and Pipeline Development
Shahdol-Phulpur Pipeline
Installation of GGS-11 completed
Start-up plan
Commencement of Test Production from GGS 11 and
associated wells is expected by Q1 FY17
Infrastructure Roll Out
Gas Gathering Station (GGS-11) along with all
associated wells & facilities has been completed
GGS12 is expected to be ready for start-up by Q1 FY17
More than 90% of production holes are drilled in GGS 12
Work in progress for four WGSs in GGS 12
GGS 12 pipeline laying is under progress
Shahdol-Phulpur Pipeline
Completed and ready for gas-in and testing
RetailPetrochemicalsRefining &
Marketing
Exploration
& ProductionJio
Source: Company information
Retail
34
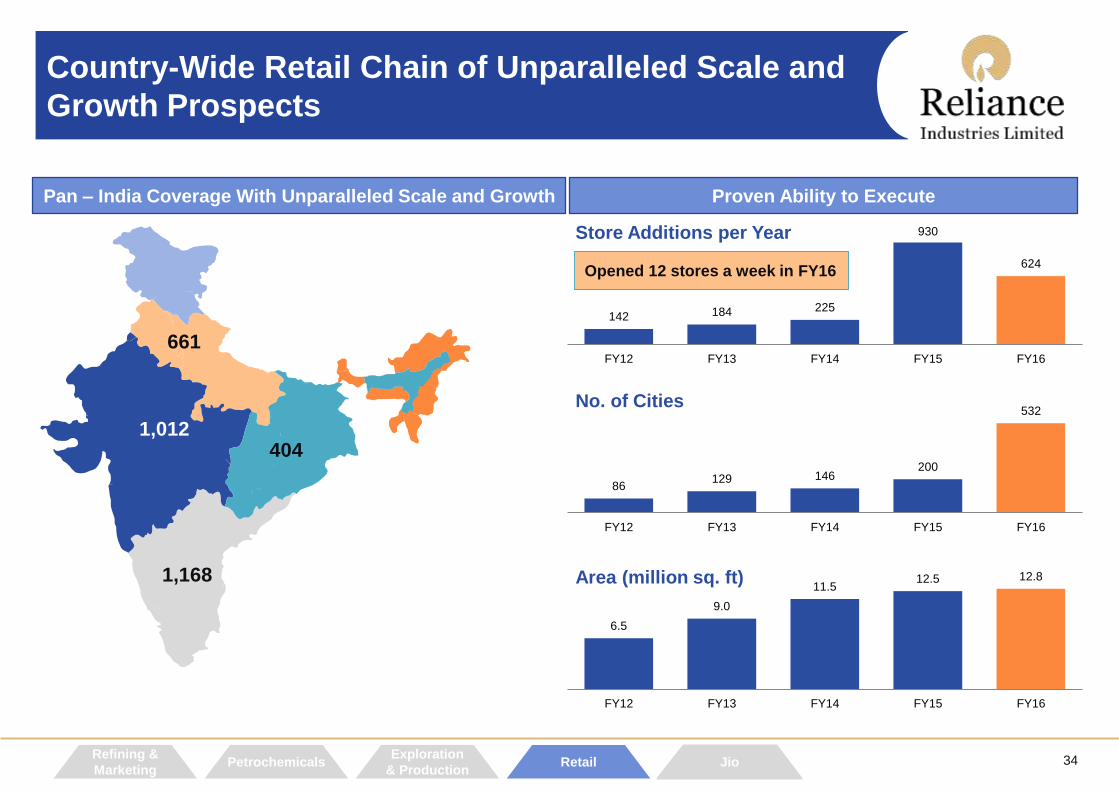
Country-Wide Retail Chain of Unparalleled Scale and
Growth Prospects
Proven Ability to Execute
142 184 225
930
624
FY12 FY13 FY14 FY15 FY16
Pan – India Coverage With Unparalleled Scale and Growth
Store Additions per Year
86129 146
200
532
FY12 FY13 FY14 FY15 FY16
No. of Cities
6.5
9.0
11.5 12.5 12.8
FY12 FY13 FY14 FY15 FY16
Area (million sq. ft)
Opened 12 stores a week in FY16
RetailPetrochemicalsRefining &
Marketing
Exploration
& ProductionJio
661
1,012
1,168
404

35
Diversified Offering Targeting a Wide Audience
Value Formats Digital
Fashion and Lifestyle Brands and Jewellery
Largest Cash and Carry Chain with
2 mm registered Kirana Partners
Own Label Products
E-commerce Channel
“Reliancefreshdirect”
Employing data analytics to drive
Private Label product developments
Largest Apparel Retailer of India
with sales
of over 150,000 garments per day
Presence in over 200 cities
20+ Private Label Brands
Leveraging International Sourcing
Capabilities
Largest Mobile Phone Retail Chain of India
Own Label “ReConnect”
1,500+ stores
Driven by Express Solutions and Differentiated Selling
Strong Customer connect; 3.8+ MM Facebook Fans
Brands
Over 40 brands in portfolio and
operates over 100 stores for
International clients
Jewellery
In-house Designing Capability,
Relaxation of Gold imports
aiding the business, operates
close to 50 stores all over India
RetailPetrochemicalsRefining &
Marketing
Exploration
& ProductionJio

36
Focusing on Profitable Growth
$12
$55
$118
$134
0.7 %
2.4 %
4.3 % 4.1 %
FY13 FY14 FY15 FY16
EBITDA EBITDA Margin
0.9
1.1
1.6
2.2
2.7
3.3
FY11 FY12 FY13 FY14 FY15 FY16
Revenue ($BN) EBITDA ($MM)
RetailPetrochemicalsRefining &
Marketing
Exploration
& ProductionJio
Source: Company Information
Note:1. US$1 = INR 66.255
CAGR: 29%
37
Reliance Retail 2.0: The Way Forward
Augmenting reach to customers through the omni-commerce model and integrating product
assortment across trade channels:
Online-Offline Integration
Integrating own products and other merchants stores
Integration of advanced infrastructure built by Jio and physical retail business to create a
differentiated ecommerce model
The combined physical and ecommerce business is poised for stupendous growth – which would
help sustain Reliance’s leadership in Retail
RetailPetrochemicalsRefining &
Marketing
Exploration
& ProductionJio


39
Why Jio?
Significant Untapped Upside in Indian Telecom
RetailPetrochemicalsRefining &
Marketing
Exploration
& ProductionJio
> 1 billion wireless subscriptions
320 million subscribers accessing internet (doubled in last two years)
200 million WhatsApp and 125 million FB users
Average data usage – 110 MB per subscriber/month
Data usage and voice quality constrained by poor infrastructure
120 million 3G subscribers; average data usage is already at 900 MB, indicating
propensity to consume with better connectivity
Favourable demographics for higher data consumption
47% of India’s population is below 24 years
Broadband connections (Wireline) at only 27 million - significant opportunity for
FTTH services
Smartphone Penetration
Data ARPU ($ per month)
7%11%16%
31% 35%40%
50%
75% 75% 75%
Indo
nesia
Ph
ilipp
ines
Chin
a
Th
aila
nd
Ma
laysia
US
A
UK
0.30.50.71.6 1.8
2.7
4.2
5.7
23.1
14.0
Ph
ilipp
ines
Indo
nesia
Th
aila
nd
Ch
ina
Ma
laysia
US
A
UK
‘13‘14 ‘15
India
‘13‘14 ‘15
India
Source: Broker research, Company filings, TRAI
Note: Smartphone Penetration and Data Prices for Other countries based on 2015
40
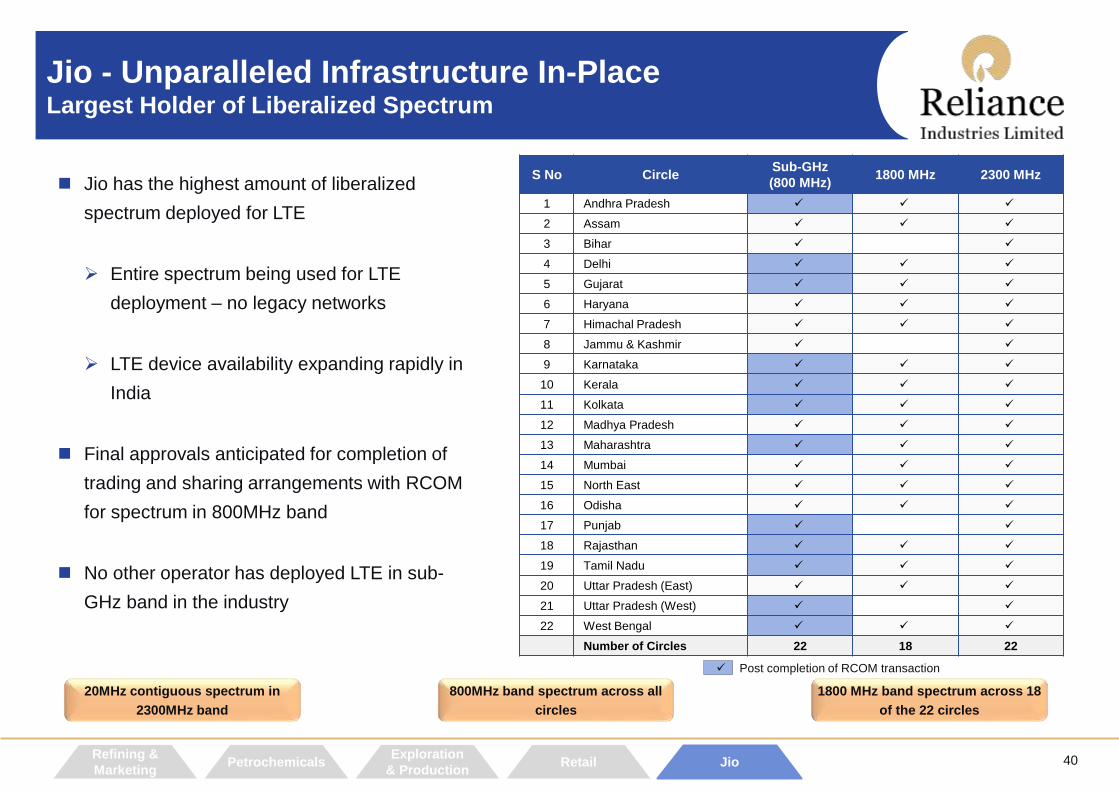
Jio - Unparalleled Infrastructure In-PlaceLargest Holder of Liberalized Spectrum
Jio has the highest amount of liberalized
spectrum deployed for LTE
Entire spectrum being used for LTE
deployment – no legacy networks
LTE device availability expanding rapidly in
India
Final approvals anticipated for completion of
trading and sharing arrangements with RCOM
for spectrum in 800MHz band
No other operator has deployed LTE in sub-
GHz band in the industry
S No CircleSub-GHz
(800 MHz)1800 MHz 2300 MHz
1 Andhra Pradesh
2 Assam
3 Bihar
4 Delhi
5 Gujarat
6 Haryana
7 Himachal Pradesh
8 Jammu & Kashmir
9 Karnataka
10 Kerala
11 Kolkata
12 Madhya Pradesh
13 Maharashtra
14 Mumbai
15 North East
16 Odisha
17 Punjab
18 Rajasthan
19 Tamil Nadu
20 Uttar Pradesh (East)
21 Uttar Pradesh (West)
22 West Bengal
Number of Circles 22 18 22
Post completion of RCOM transaction
20MHz contiguous spectrum in
2300MHz band
800MHz band spectrum across all
circles
1800 MHz band spectrum across 18
of the 22 circles
RetailPetrochemicalsRefining &
Marketing
Exploration
& ProductionJio

41
Jio’s Value Proposition New Age India’s Operator of Choice
Seamless In-building
coverage
Superior indoor coverage
using Macro and Small cells
Ubiquitous Coverage footprint
India’s largest LTE network deployment
with FDD and TDD spectrum
(850/1800/2300 Bands) with fibre backhaul
Superior Data experience
Sufficient throughput for the
highest end applications
Seamless Service experience
Seamless Voice, Video &
Messaging experience
Rich Capacity
Sufficient capacity for every user
on the network, at all times
(combination of fibre and spectrum)
All-IP Network
Instant call connectivity, minimal
call drops, unmatched HD quality
Network differentiators, with best-in-class customer service, will transform the customer experience
RetailPetrochemicalsRefining &
Marketing
Exploration
& ProductionJio
42
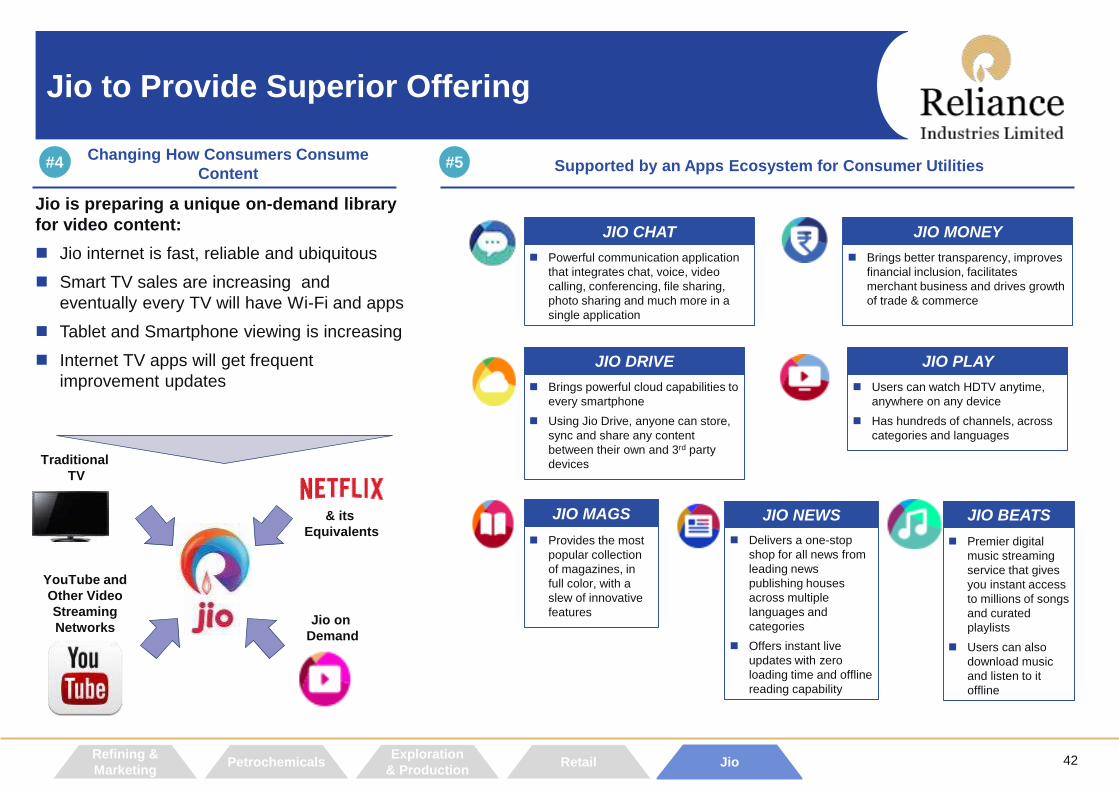
Jio to Provide Superior Offering
Supported by an Apps Ecosystem for Consumer Utilities#5Changing How Consumers Consume
Content#4
Jio is preparing a unique on-demand library
for video content:
Jio internet is fast, reliable and ubiquitous
Smart TV sales are increasing and
eventually every TV will have Wi-Fi and apps
Tablet and Smartphone viewing is increasing
Internet TV apps will get frequent
improvement updates
Jio on
Demand
& its
Equivalents
YouTube and
Other Video
Streaming
Networks
Traditional
TV
Brings better transparency, improves
financial inclusion, facilitates
merchant business and drives growth
of trade & commerce
Brings powerful cloud capabilities to
every smartphone
Using Jio Drive, anyone can store,
sync and share any content
between their own and 3rd party
devices
Users can watch HDTV anytime,
anywhere on any device
Has hundreds of channels, across
categories and languages
JIO MONEY JIO CHAT
JIO DRIVE JIO PLAY
Premier digital
music streaming
service that gives
you instant access
to millions of songs
and curated
playlists
Users can also
download music
and listen to it
offline
JIO BEATS
Delivers a one-stop
shop for all news from
leading news
publishing houses
across multiple
languages and
categories
Offers instant live
updates with zero
loading time and offline
reading capability
JIO NEWS
Provides the most
popular collection
of magazines, in
full color, with a
slew of innovative
features
JIO MAGS
Powerful communication application
that integrates chat, voice, video
calling, conferencing, file sharing,
photo sharing and much more in a
single application
RetailPetrochemicalsRefining &
Marketing
Exploration
& ProductionJio

43
Status Update
RetailPetrochemicalsRefining &
Marketing
Exploration
& ProductionJio
Network rollout substantially completed
In the process of receiving 800MHz spectrum in more circles – to be integrated shortly thereafter
Successfully launched full scale service offerings for RIL group employees, partners, vendors and associates on
28th December 2015
Over half a million users onboarded on trial basis
Initial feedback very encouraging; established smooth operations of all aspects of network and business
All digital applications also being tested extensively
Average monthly consumption per user in excess of 18GB within first month of service and increasing rapidly
Average voice usage is over 250 minutes within first month
Launch now being expanded to others in eco-system
Test program to be progressively upgraded into commercial operations in coming months

44
Thank you
Related Documents