Investor Presentation – Q2FY 2022 October 30, 2021 DCB Bank Limited

Welcome message from author
This document is posted to help you gain knowledge. Please leave a comment to let me know what you think about it! Share it to your friends and learn new things together.
Transcript

Investor Presentation – Q2FY 2022October 30, 2021
DCB Bank Limited

2
This presentation is strictly confidential and may not be copied, published, distributed, redistributed, disseminated or transmitted, directly or indirectly, in any manner. The
information in this presentation is being provided by DCB Bank Limited (the “Bank”).
This presentation has been prepared for information purposes only, without regard to any specific objectives, financial situations or informational needs of any particular person,
and is not an offer or invitation, directly or indirectly, to buy or sell any securities of the Bank by any person in any jurisdiction, including India and the United States, nor shall a
part, or all, of this presentation form the basis of or be relied on in connection with any contract or investment decision or commitment to purchase or subscribe in relation to any
securities. No information contained herein has been independently verified by anyone else. This presentation is not an offer document or a prospectus under the Companies
Act, 2013, as amended, the Securities and Exchange Board of India (Issue of Capital and Disclosure Requirements) Regulations, 2009, as amended and any other applicable
law.
No representation or warranty, express or implied, is made as to, and no reliance should be placed on, the fairness, accuracy, completeness or correctness of the information or
opinions contained in this presentation. Such information and opinions are in all events not current after the date of this presentation. Further, past performance is not
necessarily indicative of future results.
This presentation is not a complete description of the Bank. This presentation may contain forward-looking statements based on the currently held beliefs and assumptions of
the management of the Bank, which are expressed in good faith and, in their opinion, reasonable. Forward-looking statements involve known and unknown risks, uncertainties,
assumptions and other factors, which may cause the actual results, financial condition, performance, or achievements of the Bank or industry results to differ materially from the
results, financial condition, performance or achievements expressed or implied by such forward-looking statements. The risks and uncertainties relating to these statements
include, but are not limited to, risks and uncertainties regarding expansion plans and the benefits there from, fluctuations in our earnings, our ability to manage growth and
implement strategies, intense competition in our business including those factors which may affect our cost advantage, our ability to attract and retain highly skilled
professionals, changes in technology, availability of financing, our ability to successfully complete and integrate our business plans, liabilities, political instability and general
economic conditions affecting our industry. Given these risks, uncertainties, assumptions and other factors, recipients of this document are cautioned not to place undue reliance
on these forward-looking statements. The Bank disclaims any obligation to update these forward-looking statements to reflect future events or developments.
This presentation is not an offer of securities for sale in the United States or in any other jurisdiction. Securities may not be offered or sold in the United States absent registration
or an exemption from registration. No shares or other securities may be offered or sold other than in compliance with the laws of relevant jurisdictions, including the United
States Securities Act of 1933, as amended.
By viewing this presentation you acknowledge that you will be solely responsible for your own assessment of the market and the market position of the Bank and the potential
future performance of the business of the Bank.
Except as otherwise stated, all of the information contained herein is preliminary and indicative and is based on management information, current plans and estimates in the
form as it has been disclosed in this presentation. Industry and market-related information is obtained or derived from industry publications and has not been verified by us. The
information contained in this presentation, except as otherwise stated, is only current as of the date of the presentation, is subject to change without notice and there can be no
assurance that future results or events will be consistent with any such information. The Bank may alter, modify or otherwise change in any manner the content of this
presentation, without any obligation to notify any person of such revision or changes. The accuracy of this presentation is not guaranteed. It may be incomplete or condensed
and it may not contain all material information concerning the Bank. Persons relying on the information in this presentation or any other communication by the Bank should do so
at their own risk and the Bank or any of its officers and directors shall not be responsible for any kind of consequences or liability to any person arising out of, any act or omission
based on or relying and acting upon any such information.
Figures for the previous period / year have been regrouped wherever necessary to conform with the current period’s / year’s presentation. Financial numbers are from Audited
Financials or Limited Reviewed Financials or based on Management estimates.
The amounts / ratios for the period / year have been regrouped / reclassified pursuant to the requirements of ‘Master Direction on Financial Statements – Presentation and
Disclosures’ issued by RBI date August 30, 2021 and wherever considered necessary.
Disclaimer
Financial numbers are rounded off to nearest whole number DCB Bank Limited CIN: L99999MH1995PLC089008
3DCB Bank Limited
Branch Network September 30, 2021

INR mn No. of Branches Balance Sheet Cost to Income
Ratio
Return on Asset Return on Equity
Q2 FY 2022 356 414,747 58.41% 0.63% *7.28%
Q1 FY 2022 354 403,085 52.97% 0.34% *3.79%
FY 2021 352 396,021 48.87% 0.87% *9.99%
FY 2020 336 385,051 54.63% 0.90% *11.19%
FY 2019 333 357,918 57.12% 0.99% *12.08%
FY 2018 318 302,221 60.35% 0.94% *10.31%
FY 2017 262 240,464 60.30% 0.93% 10.30%
FY 2016 198 191,185 59.43% 1.14% 11.59%
FY 2015 154 161,323 59.69% 1.37% 14.16%
4
Key Indicators - I
DCB Bank Limited*Excluding Revaluation Reserves in computation of Equity

5
INR mn Q2 FY 22 Q1 FY 22 Q2 FY 21 Y-o-Y
Deposits 317,695 306,017 287,747 10%
Of which CASA 80,619 66,387 64,542 25%
Of which Certificate of Deposits 0 0 0 -
Of which Term Deposit
- Of which NRI Term
- Of which Inter Bank Term
237,076
23,407
25,929
239,630
24,096
26,136
223,205
24,698
28,569
6%
(5%)
(9%)
Net Advances 268,503 254,956 248,786 8%
Key Indicators - II
INR mn Q2 FY 22 Q1 FY 22 Q2 FY 21 Y-o-Y
Net Interest Income 3,233 3,087 3,339 (3%)
Non Interest Income 977 1,212 809 21%
Total Cost (2,459) (2,277) (2,016) (22%)
Operating Profit 1,751 2,022 2,132 (18%)
Profit Before Tax 888 457 1,117 (21%)
Profit After Tax 649 338 823 (21%)
DCB Bank Limited

6
Balance Sheet
DCB Bank Limited
INR mnMar 31,
2015
Mar 31,
2016
Mar 31,
2017
Mar 31,
2018
Mar 31,
2019
Mar 31,
2020
Mar 31,
2021
Sep 30,
2021
Shareholder’s Equity 15,886 17,922 22,049 28,078 31,156 34,222 37,586 38,578
Deposits 126,091 149,260 192,892 240,069 284,351 303,699 297,039 317,695
Borrowings 11,638 11,479 12,758 19,267 27,232 34,079 44,822 40,422
Other Liabilities &
Provisions7,708 12,524 12,765 14,807 15,179 13,051 16,574 18,052
Total 161,323 191,185 240,464 302,221 357,918 385,051 396,021 414,747
Cash, Inter-bank, etc. 7,192 8,916 11,925 23,720 27,934 35,459 30,393 38,392
Investments 39,622 43,333 58,179 62,190 78,441 77,415 84,137 86,261
Net Advances 104,651 129,214 158,176 203,367 235,680 253,453 259,592 268,503
Fixed Assets 2,367 2,480 4,886 4,940 5,260 5,458 5,685 5,724
Other Assets 7,492 7,242 7,298 8,004 10,603 13,266 16,214 15,867
Total 161,323 191,185 240,464 302,221 357,918 385,051 396,021 414,747
Credit Deposit Ratio 83.00% 86.57% 82.00% 84.71% 82.88% 83.46% 87.39% 84.52%

7
Profit & Loss
INR mn Q2 FY21 Q3 FY21 Q4 FY21 Q1 FY22 Q2 FY22
Net Interest Income 3,339 3,348 3,112 3,087 3,233
Other Income 809 1,566 1,298 1,212 977
- Commission, exchange
and brokerage
- Profit on Sale of
Investment
- Profit on Exchange
Transaction
435
293
66
550
741
51
702
13
74
472
538
88
614
104
61
Operating Income 4,148 4,914 4,410 4,299 4,210
Operating Expenses (2,016) (2,120) (2,399) (2,277) (2,459)
Operating Profit 2,132 2,794 2,011 2,022 1,751
Provisions other than
Tax(1,015) (1,498) (971) (1,565) (863)
Profit Before Tax 1,117 1,296 1,040 457 888
Tax (294) (334) (261) (119) (239)
Profit After Tax 823 962 779 338 649
Cost Income Ratio 48.61% 43.13% 54.40% 52.97% 58.41%
DCB Bank Limited

8
Profit & Loss
DCB Bank Limited
INR mn FY 2015 FY 2016 FY 2017 FY 2018 FY 2019 FY 2020 FY 2021
Net Interest Income 5,082 6,195 7,971 9,954 11,493 12,649 12,866
Other Income 1,561 2,066 2,439 2,982 3,438 3,879 4,458
- Commission,
exchange and
brokerage
- Profit on Sale of
Investment
- Profit on Exchange
Transaction
1,193
277
76
1,405
423
145
1,651
454
104
2,176
454
139
2,399
386
216
2,412
653
192
1,956
1,428
227
Operating Income 6,643 8,261 10,410 12,936 14,931 16,528 17,324
Operating Expenses (3,965) (4,910) (6,277) (7,807) (8,529) (9,029) (8,466)
Operating Profit 2,678 3,351 4,133 5,129 6,402 7,499 8,858
Provisions other than
Tax(598) (740) (1,066) (1,267) (1,337) (2,580) (4,330)
Profit Before Tax 2,080 2,611 3,067 3,862 5,065 4,919 4,528
Tax (168) (666) (1,070) (1,409) (1,811) (1,540) (1,170)
Profit After Tax 1,912 1,945 1,997 2,453 3,254 3,379 3,358
Cost Income Ratio 59.69% 59.43% 60.30% 60.35% 57.12% 54.63% 48.87%

9
Deposits as on September 30, 2021
DCB Bank Limited
Deposits Mix
* CASA includes NRI CASA
*CASA 25%
Interbank Term Deposit 8%
Non-Resident Term Deposit 7%
Residential Term Deposit60%

Mortgages, 41%
SME + MSME, 10% Corporate
Banking, 11%
AIB , 22%
Gold Loan, 6%Commercial Vehicle, 4%
Co-Lending, 3%
Others, 3%
10DCB Bank Limited
Net Advances as on September 30, 2021
Advances Mix
AIB Net Advances as on September 30, 2021
Mortgages, 6%
Kissan Credit Card, 4%
Gold Loan, 2%
MFI + BC, 3%
Tractors, 3%SME + MSME, 1%
Others, 3%

11
NIM, Yield and Cost of Funds
DCB Bank Limited
Year EndedFY
2014-15
FY
2015-16
FY
2016-17
FY
2017-18
FY
2018-19
FY
2019-20
FY
2020-21
Q2 FY
2021-22
Net Interest
Margin (NIM)3.72% 3.94% 4.04% 4.16% 3.83% 3.67% 3.59% 3.37%
Yield on
Advances12.63% 12.52% 12.03% 11.41% 11.29% 11.50% 11.06% 10.66%
Cost of
Deposits7.67% 7.48% 6.91% 6.37% 6.61% 6.96% 6.49% 6.08%
Cost of
Funds7.78% 7.54% 7.00% 6.51% 6.75% 7.10% 6.62% 6.19%

12
Non Performing Assets
DCB Bank Limited
INR mn Mar 31,
2015
Mar 31,
2016
Mar 31,
2017
Mar 31,
2018
Mar 31,
2019
Mar 31,
2020
Sep 30,
2020
Mar 31,
2021
Sep 30,
2021
Mortgages 362 464 717 1,392 1,627 2,283 2,207 4,106 4,479
SME+MSME 273 245 324 307 425 733 531 1,184 1,367
Corporate 919 861 859 840 619 515 418 496 834
AIB 187 288 366 632 984 1,212 1,163 2,348 2,586
Gold Loans 28 22 22 107 84 69 56 552 531
CV/STVL 88 92 200 299 480 1,163 1,082 1,669 2,454
Others 4 2 54 113 176 340 280 479 598
Gross NPA 1,861 1,974 2,542 3,690 4,395 6,315 5,737 10,834 12,849
Net NPA 1,057 975 1,244 1,467 1,538 2,935 2,058 5,942 7,070
Mar 31,
2015
Mar 31,
2016
Mar 31,
2017
Mar 31,
2018
Mar 31,
2019
Mar 31,
2020
Sep 30,
2020
Mar 31,
2021
Sep 30,
2021
Gross NPA 1.76% 1.51% 1.59% 1.79% 1.84% 2.46% 2.27% 4.09% 4.68%
Net NPA 1.01% 0.75% 0.79% 0.72% 0.65% 1.16% 0.83% 2.29% 2.63%
Provision
Coverage74.66% 77.55% 73.80% 75.72% 78.77% 70.81% 79.06% 62.35% 60.46%
INR mn Mar 31,
2015
Mar 31,
2016
Mar 31,
2017
Mar 31,
2018
Mar 31,
2019
Mar 31,
2020
Sep 30,
2020
Mar 31,
2021
Sep 30,
2021
FV of SRs
from ARC160 307 701 629 380 485* 446* 388* 696*
* Netted off INR 89 mn as unrecognised gain from sale of NPAs to ARC
13
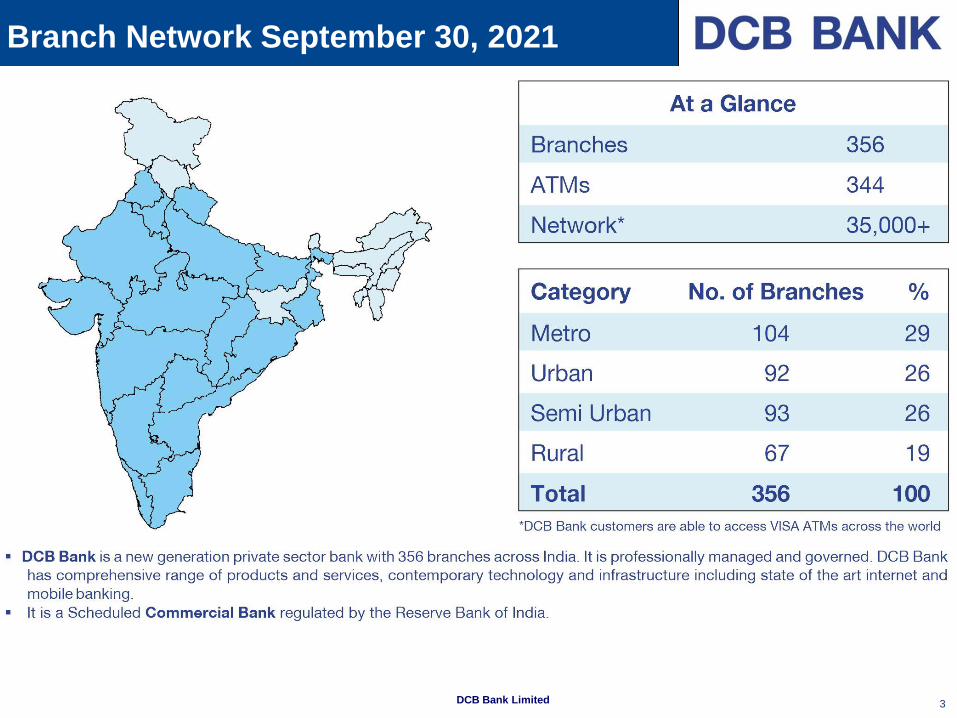
Gross NPA Movement
INR mn Q2 FY 2021-22 Q1 FY 2021-22 FY 2020-21
Opening Balance 12,688 10,834 6,315
(+) Add
Fresh Slippages 4,142 5,151 6,785
Addition to Existing NPAs 24 45 77
(-) Less
Recoveries 941 905 748
Upgrades 3,026 1,621 332
Write Offs / Sacrifice 38 816 1,263
Closing Balance 12,849 12,688 10,834
DCB Bank Limited
1: Includes INR 388 mn on sale of NPAs to an Asset Reconstruction Company
2: Includes INR 311 mn on sale of NPAs to an Asset Reconstruction Company
1
2

14
Treasury
DCB Bank Limited
*Total Investment: Represents Net investments (HTM – Held To Maturity, AFS – Available For Sale, HFT – Held For Trading)
Modified
Duration
Mar 31,
2015
Mar 31,
2016
Mar 31,
2017
Mar 31,
2018
Mar 31,
2019
Mar 31,
2020
Mar 31,
2021
Sep 30,
2021
AFS+HFT 1.32 1.22 0.93 0.82 0.60 1.04 1.09 0.98
INR mnMar 31,
2015
Mar 31,
2016
Mar 31,
2017
Mar 31,
2018
Mar 31,
2019
Mar 31,
2020
Mar 31,
2021
Sep 30,
2021
SLR 34,750 39,855 47,711 49,091 60,007 61,363 67,370 72,442
Non-SLR 4,872 3,478 10,468 13,099 18,434 16,052 16,767 13,819
Total
Investments39,622 43,333 58,179 62,190 78,441 77,415 84,137 86,261
HTM 27,567 30,580 40,286 42,963 57,071 61,363 66,885 69,900
AFS 9,484 10,782 17,840 19,217 21,370 16,052 16,743 16,057
HFT 2,571 1,971 53 10 0 0 509 304
Total
Investments*39,622 43,333 58,179 62,190 78,441 77,415 84,137 86,261
15
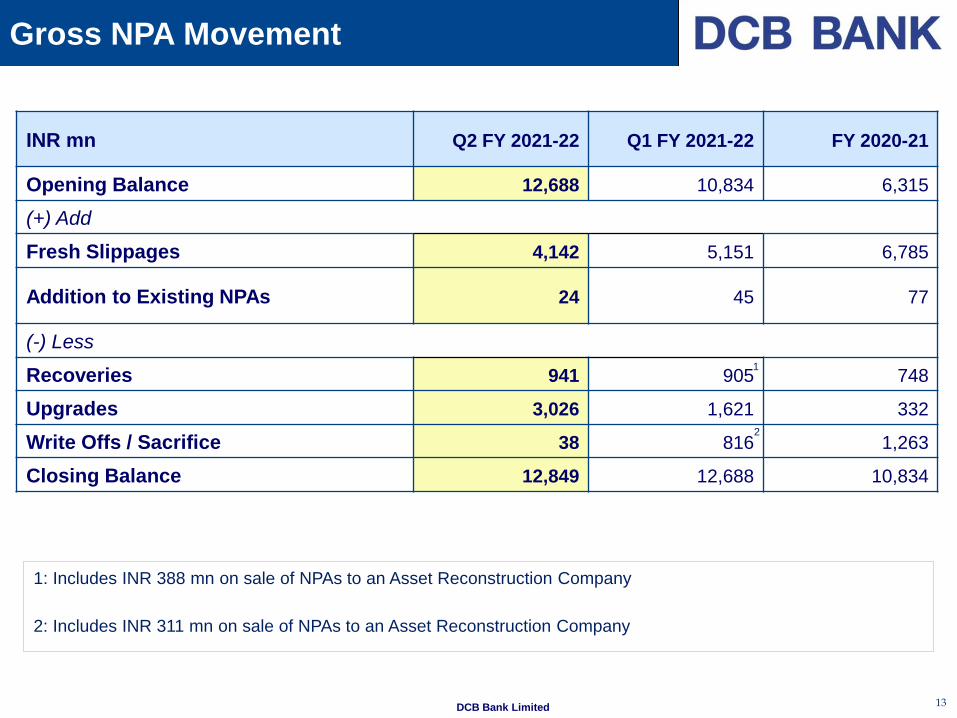
Capital Adequacy Ratios – Basel III
DCB Bank Limited
Mar 31,
2015
Mar 31,
2016
Mar 31,
2017
Mar 31,
2018
Mar 31,
2019
Mar 31,
2020
Mar 31,
2021
Sep 30,
2021
CRAR 14.95% 14.11% 13.76% 16.47% 16.81% 17.75% 19.67% 19.34%
-- Tier I 14.21% 12.79% 11.87% 12.72% 13.10% 13.90% 15.49% 15.28%
-- Tier II 0.74% 1.32% 1.89% 3.75% 3.71% 3.85% 4.18% 4.06%
RWA*
(INR mn)105,973 134,299 172,832 207,554 221,747 233,936 231,839 235,013
*RWA- Risk Weighted Assets

16
Ratings
DCB Bank Limited
Sep 30,
2013
Dec 31,
2014
Mar 31,
2016
Mar 30,
2017
Mar 30,
2018
Mar 31,
2019
Sep 30,
2021
CRISIL
Long Term –
Subordinated
Debt
- - - -A+/
Stable
AA-/
Stable
AA-/
Stable
Certificates of
Deposit A1+ A1+ A1+ A1+ A1+ A1+ A1+
Short – Term
Fixed
Deposits
A1+ A1+ A1+ A1+ A1+ A1+ A1+
ICRA
Long Term –
Subordinated
Debt
- -A+(hyb)
(stable)
A+(hyb)
(stable)
A+(hyb)
(stable)
A+(hyb)
(stable)
A+(hyb)
(stable)
Short – Term
Fixed
Deposits
- A1+ A1+ A1+ A1+ A1+ A1+
17
Overview
DCB Bank Limited
18
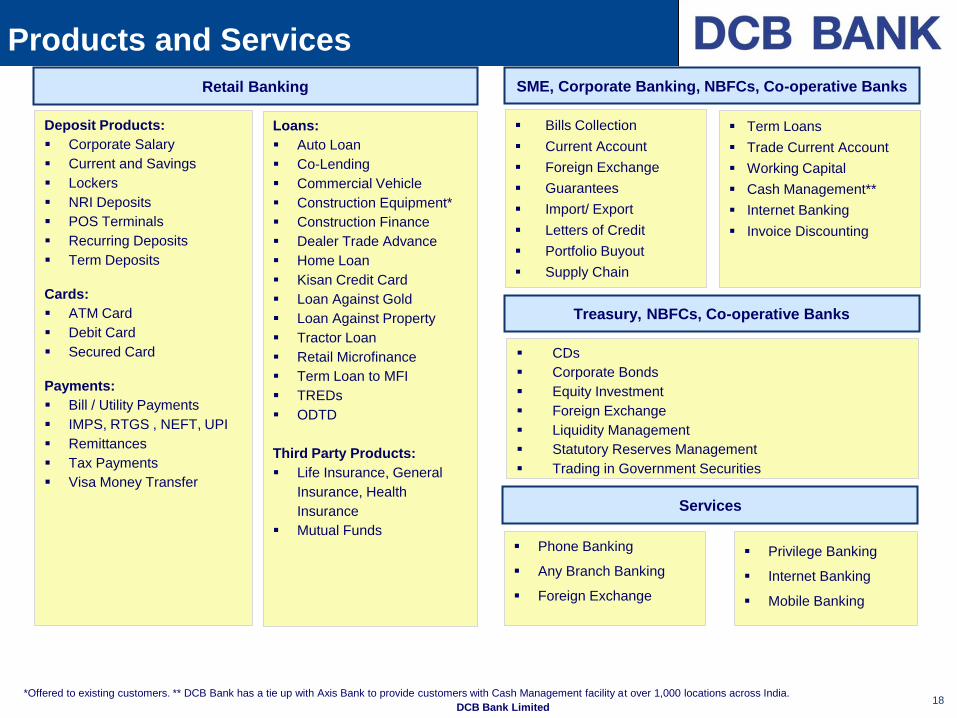
Products and Services
Retail Banking
Deposit Products:
▪ Corporate Salary
▪ Current and Savings
▪ Lockers
▪ NRI Deposits
▪ POS Terminals
▪ Recurring Deposits
▪ Term Deposits
Cards:
▪ ATM Card
▪ Debit Card
▪ Secured Card
Payments:
▪ Bill / Utility Payments
▪ IMPS, RTGS , NEFT, UPI
▪ Remittances
▪ Tax Payments
▪ Visa Money Transfer
Loans:
▪ Auto Loan
▪ Co-Lending
▪ Commercial Vehicle
▪ Construction Equipment*
▪ Construction Finance
▪ Dealer Trade Advance
▪ Home Loan
▪ Kisan Credit Card
▪ Loan Against Gold
▪ Loan Against Property
▪ Tractor Loan
▪ Retail Microfinance
▪ Term Loan to MFI
▪ TREDs
▪ ODTD
Third Party Products:
▪ Life Insurance, General
Insurance, Health
Insurance
▪ Mutual Funds
SME, Corporate Banking, NBFCs, Co-operative Banks
▪ Bills Collection
▪ Current Account
▪ Foreign Exchange
▪ Guarantees
▪ Import/ Export
▪ Letters of Credit
▪ Portfolio Buyout
▪ Supply Chain
▪ CDs
▪ Corporate Bonds
▪ Equity Investment
▪ Foreign Exchange
▪ Liquidity Management
▪ Statutory Reserves Management
▪ Trading in Government Securities
Treasury, NBFCs, Co-operative Banks
▪ Term Loans
▪ Trade Current Account
▪ Working Capital
▪ Cash Management**
▪ Internet Banking
▪ Invoice Discounting
*Offered to existing customers. ** DCB Bank has a tie up with Axis Bank to provide customers with Cash Management facility at over 1,000 locations across India.
DCB Bank Limited
▪ Phone Banking
▪ Any Branch Banking
▪ Foreign Exchange
Services
▪ Privilege Banking
▪ Internet Banking
▪ Mobile Banking

Aga Khan Fund for
Economic Development
Investor Profile as on Sep 30, 2021
*AKFED: Aga Khan Fund for Economic Development & PJI: Platinum Jubilee
Investment Ltd.
**Includes Clearing Members (0.17%), Non Resident Indians (1.41%),Trusts
(0.0006%), Unclaimed shares (0.45%) & Directors & their relatives (0.68%)
***Institutions includes 10.86% held by FII & FPI
DCB Bank Limited
Key Non Promoter Shareholders %
ICICI Prudential Mutual Fund* 4.85%
HDFC Small Cap Fund 4.44%
India Advantage Fund S4 I 4.02%
DSP Small Cap Fund 3.42%
Franklin India Smaller Companies Fund 3.20%
Oman India Joint Investment Fund II 2.96%
ITI Mutual Fund* 2.87%
Aditya Birla Sun Life Mutual Fund* 2.73%
Steinberg India Emerging Opportunities Fund
Ltd.2.58%
Nippon Life India Mutual Fund* 2.06%
TVS Shriram Growth Fund 3 1.87%
19
* Held under various schemes/ funds/ entities.
* AKFED & PJI 14.87%
*** Institutions 49.20%
Bodies Corporate 5.62%
Individuals, 27.37%
** Others (Non Institutional) 2.71%Govt. IEPF A/c MCA
0.23%
Shareholding Pattern
▪ DCB Bank is promoted by the Aga Khan Fund for Economic Development (AKFED) http://www.akdn.org/akfed
▪ AKFED is an international development enterprise. It is dedicated to promoting entrepreneurship and building economically
sound companies
▪ AKFED operates as a network of affiliates with more than 90 separate project companies employing over 47,000 people.
The Fund is active in the developing countries

Rafiq Somani
Shaffiq Dharamshi
Rupa Devi Singh
Somasundaram PR**
Amyn Jassani
Iqbal Khan
Board of Directors
Ashok Barat
A Fellow of the Institute of Chartered Accountants of India and of the Institute of Company Secretaries of India, Associate
of the Institute of Chartered Accountants of England & Wales and CPA, Australia. Mr. Barat held responsible and senior
leadership positions in various Indian and multinational organizations, both in India and overseas. He is on the Board of
several other companies and advises businesses on governance, performance and strategy.
A Fellow of the Institute of Chartered Accountants with more than 25 years of experience, mainly with the big four
accounting firms. He is also a member of the Institute of Company Secretaries of India and has passed the Certified
Information System Auditor’s (CISA) examination.
Shabbir MerchantA Masters in Personal Management with more than 30 years of experience. He is the founder of Valulead Consulting, a
boutique consulting firm.
A Fellow of the Institute of Chartered Accountant, he is the Managing Director & Chief Executive Officer of the Bank since
April, 2009 and has 38 years global experience in financial services in Standard Chartered Bank, Citibank and American
Express.
Partner at Shardul Amarchand Mangaldas & Co. and member of the Private Equity and Mergers and Acquisitions practice
group. He completed his J.D. from Columbia Law School, & LL.B. from London School of Economics and Political
Science.
An M.Sc. Graduate in Economics with specialization in Risk Management. He is currently working with Aga Khan Fund for
Economic Development (AKFED) as Head of Banking.
Murali M Natrajan
Managing Director & CEO
A graduate in Science, Post-Graduate in Law from the University of Delhi & holds CAIIB. She has over 35 years of
experience in areas of Commercial Banking, Project Structuring, Infrastructure, etc. She was the founder Managing
Director & CEO of Power Exchange India Ltd (PXIL).
A Fellow of the Institute of Chartered Accountants of India with over 30 years’ experience across Unilever Group companies
in India and abroad, Standard Chartered Bank and others. Currently he is the Managing Director of World Gold Council in
India.
A Master in Marketing Management with 30 years of experience in the field of Information Technology. He is currently
working as the Area Vice President at ANSYS Inc.
Private & Confidential 20DCB Bank Limited
** Mr. Nasser Munjee was Chairman of DCB Bank till August 18, 2021. Till the appointment of new Chairman, Mr. Somasundaram P R is Chairman for the Board Meetings.

Kamala Kant Pandey – 27 yrs work exp.
Head – Channel Sales & Emerging Markets
Management Team
Bharat Sampat - *35 yrs work exp.
Chief Financial Officer
R. Venkattesh – 31 yrs work exp.
Head – Operations, Technology, Human
Resource and CIO
Abhijit Bose - *31 yrs work exp.
Chief Credit Officer
Manoj Joshi – 27 yrs work exp.
Chief Compliance Officer and Chief
Internal Vigilance
J. K Vishwanath – 28 yrs work exp.
Head – Corporate & SME Banking
Ajay Mathur – 29 yrs work exp.
Head – Collections & Commercial
Vehicles
Sukesh Bhowal – 26 yrs work exp.
Head – Mortgages, Gold Loan &
Personal Loan
*Worked in India & Abroad.
Aditya Prasad – 36 yrs work exp.
Head – Process & Projects
Praveen Kutty - *31 yrs work exp.
Head – Retail Banking
Krishna Ramasankaran – 26 yrs work
exp.
Head Credit – Retail & SME
Pankaj Sood – 25 yrs work exp.
Head – Retail Branch Banking
Gaurav Mehta – 27 yrs work exp.
Head – Marketing, PR , Corporate
Communication, Investor Relations, CSR
T P Anuradha – 22 yrs work exp.
Chief Internal Auditor
Murali Rao – 21 yrs work exp.
Chief Technology Officer
21
N C Kaushal – 30 yrs work exp.
Head – Digital Banking
Murali M. Natrajan - *38 yrs work exp.
Managing Director & CEO
Damodar Agarwal – 26 yrs work exp.
Head – Strategic Initiatives & Alternate
Channels
Bappa Roy – 30 yrs work exp.
Product Head – Banking, Insurance &
Investments
Meghana Rao – 21 yrs work exp.
Head – Branch Operations
DCB Bank Limited
Ravi Kumar – 26 yrs work exp.
Head – Operations and Key Projects
Ajit Kumar Singh - 29 yrs work exp.
Head – Treasury & FIG Business
Rubi Chaturvedi – 15 yrs work exp.
Company Secretary
Narendranath Mishra – 22 yrs work
exp.
Head – Agri & Inclusive Banking
Sumit Manchanda – 21 yrs work exp.
Head – Credit
Sridhar Seshadri – 38 yrs work exp.
Chief Risk Officer

22DCB Bank Limited
Digital Update

Instant Remittance…
Instant support
Get real time assistance
through co-browsing
Digital…DCB ₹EMIT

The new e-filing website of the Income Tax Department was launched on 7th
June 2021 with a host of new features for taxpayers.
Digital… INCOME TAX E-FILING 2.0
New features for DCB Personal Internet Banking and Mobile Banking
customers. ▪ Limit management for ATM , POS & E- commerce
▪ Block & unblock for ATM , POS & E- commerce
▪ International Card Block
▪ Block Card – Temporary & Permanent
▪ ATM PIN Generation
Digital…Self Service

26
Thank you
DCB Bank Limited
To receive investor updates from DCB Bank Ltd., write in at [email protected] . Do let us know
of any change in your contact details on the same email ID.
Corp. & Reg. Office: 6th Floor, Tower A, Peninsula Business Park, Senapati Bapat Marg, Lower Parel, Mumbai – 400013
CIN: L99999MH1995PLC089008 Tel: +91 22 66187000 Fax: +91 22 66589970 Website: www.dcbbank.com
Related Documents


![Investors' Presentation - Q2FY 16 Business Update [Company Update]](https://static.cupdf.com/doc/110x72/577ca70d1a28abea748c2bc2/investors-presentation-q2fy-16-business-update-company-update.jpg)