ASM proprietary information © 2017 ASM INVESTOR PRESENTATION July 25, 2017 Q2 2017 RESULTS

Welcome message from author
This document is posted to help you gain knowledge. Please leave a comment to let me know what you think about it! Share it to your friends and learn new things together.
Transcript
October 26, 2016
ASM proprietary information © 2017 ASM
INVESTOR PRESENTATION
July 25, 2017
Q2 2017 RESULTS
July 25, 2017 | ASM proprietary information | 2
CAUTIONARY NOTE REGARDING FORWARD-LOOKING STATEMENTS
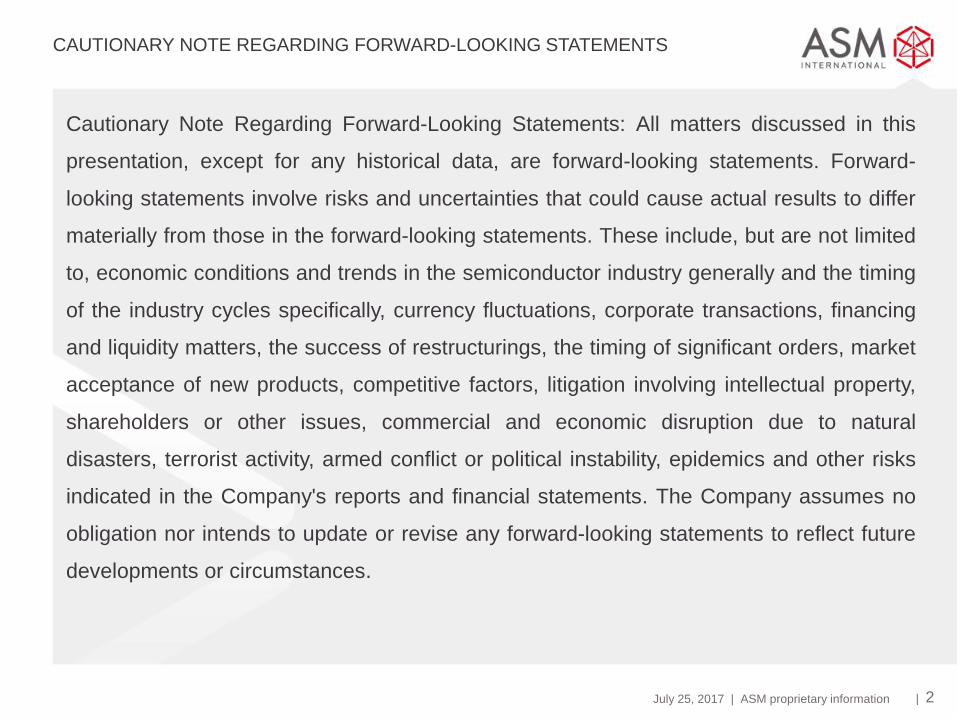
Cautionary Note Regarding Forward-Looking Statements: All matters discussed in this
presentation, except for any historical data, are forward-looking statements. Forward-
looking statements involve risks and uncertainties that could cause actual results to differ
materially from those in the forward-looking statements. These include, but are not limited
to, economic conditions and trends in the semiconductor industry generally and the timing
of the industry cycles specifically, currency fluctuations, corporate transactions, financing
and liquidity matters, the success of restructurings, the timing of significant orders, market
acceptance of new products, competitive factors, litigation involving intellectual property,
shareholders or other issues, commercial and economic disruption due to natural
disasters, terrorist activity, armed conflict or political instability, epidemics and other risks
indicated in the Company's reports and financial statements. The Company assumes no
obligation nor intends to update or revise any forward-looking statements to reflect future
developments or circumstances.

July 25, 2017 | ASM proprietary information | 3
INVESTMENT HIGHLIGHTS
› ALD is a key growth market
ALD market expected to grow by double digits from ’15 to ’20-’21
ASMI has leadership position in ALD
› Outperforming in 2011-2016
ASMI outperformed the WFE market in four of the last six years
Following a drop in the single wafer ALD market in 2016 a clear improvement is
expected again for 2017
› Structurally improved profitability
Gross margin steady at 43.6% in H1 2017, operating margin of 15%
› Solid balance sheet
Strong cash position, no debt
Third consecutive EUR 100m share buyback program, to be executed in 2016/2017
1.5m treasury shares to be cancelled
Stable dividend of EUR 0.70 per share paid in 2017
July 25, 2017 | ASM proprietary information | 4
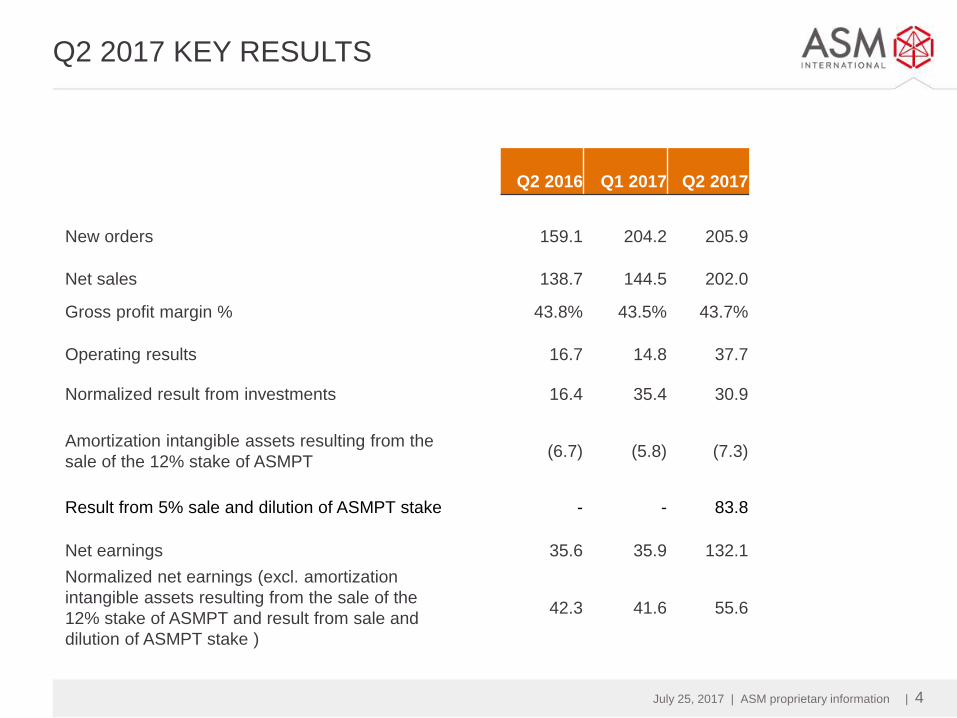
Q2 2017 KEY RESULTS
Q2 2016
Q1 2017
Q2 2017
New orders
159.1
204.2
205.9
Net sales
138.7
144.5
202.0
Gross profit margin % 43.8% 43.5% 43.7%
Operating results
16.7
14.8
37.7
Normalized result from investments 16.4 35.4 30.9
Amortization intangible assets resulting from the
sale of the 12% stake of ASMPT (6.7) (5.8) (7.3)
Result from 5% sale and dilution of ASMPT stake - - 83.8
Net earnings 35.6 35.9 132.1
Normalized net earnings (excl. amortization
intangible assets resulting from the sale of the
12% stake of ASMPT and result from sale and
dilution of ASMPT stake )
42.3 41.6 55.6
July 25, 2017 | ASM proprietary information | 5
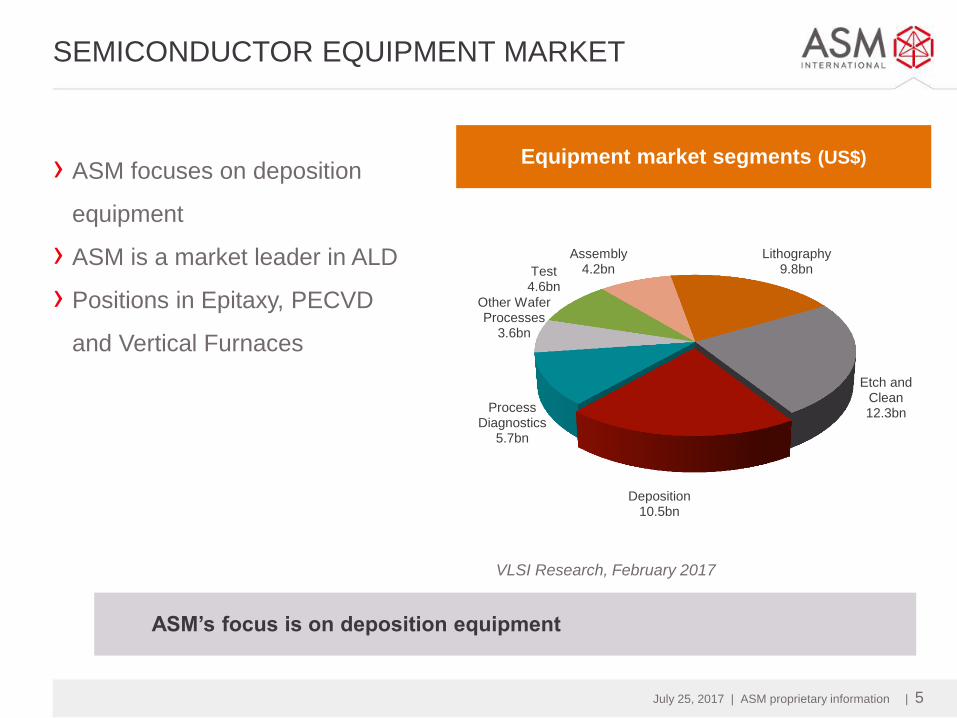
SEMICONDUCTOR EQUIPMENT MARKET
› ASM focuses on deposition
equipment
› ASM is a market leader in ALD
› Positions in Epitaxy, PECVD
and Vertical Furnaces
VLSI Research, February 2017
Equipment market segments (US$)
ASM’s focus is on deposition equipment
Lithography 9.8bn
Etch and Clean 12.3bn
Deposition 10.5bn
Process Diagnostics
5.7bn
Other Wafer Processes
3.6bn
Test 4.6bn
Assembly 4.2bn
July 25, 2017 | ASM proprietary information | 6
0
5
10
15
20
25
30
35
40
45
50
2015 2016 2017 2018 2019 2020 2021
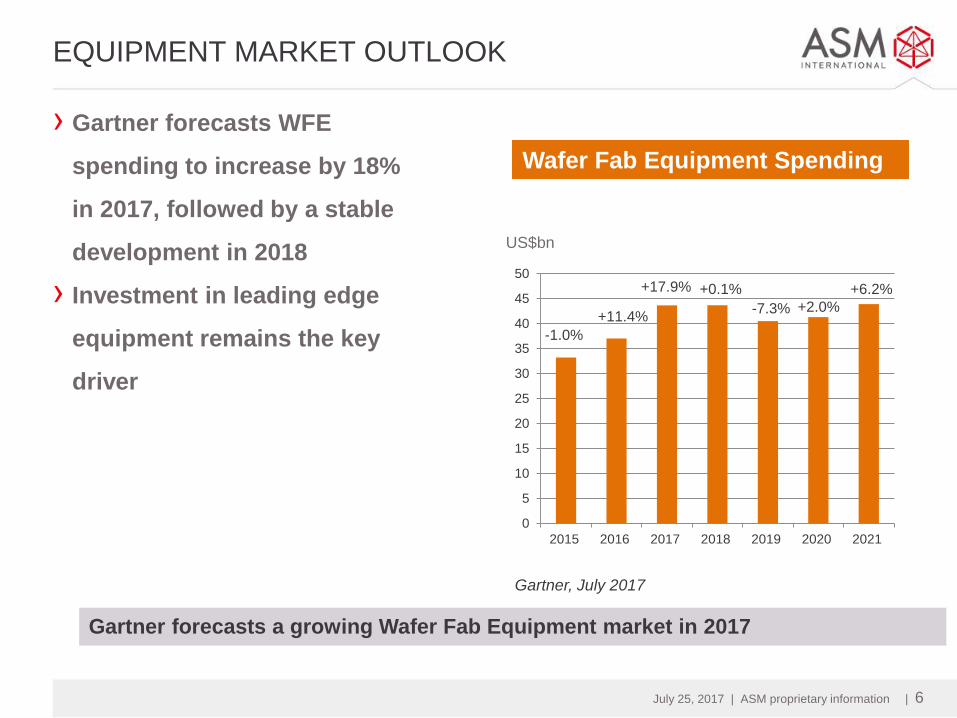
EQUIPMENT MARKET OUTLOOK
› Gartner forecasts WFE
spending to increase by 18%
in 2017, followed by a stable
development in 2018
› Investment in leading edge
equipment remains the key
driver
Gartner forecasts a growing Wafer Fab Equipment market in 2017
+11.4%
+17.9% +0.1%
-7.3% +2.0%
+6.2%
-1.0%
Wafer Fab Equipment Spending
Gartner, July 2017
US$bn
July 25, 2017 | ASM proprietary information | 7
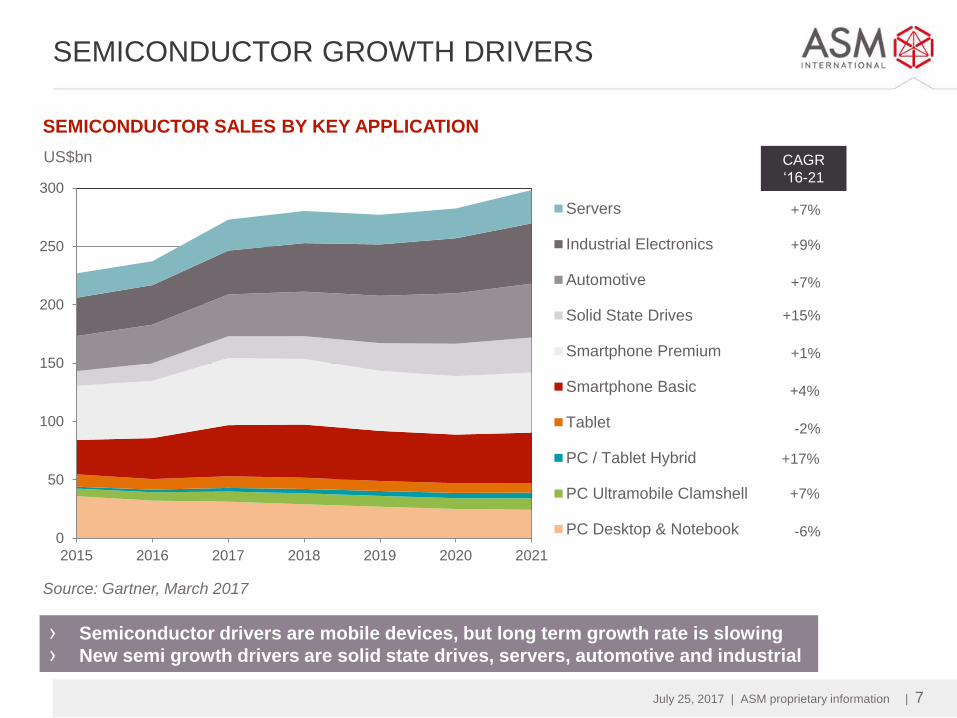
SEMICONDUCTOR SALES BY KEY APPLICATION
0
50
100
150
200
250
300
2015 2016 2017 2018 2019 2020 2021
Servers
Industrial Electronics
Automotive
Solid State Drives
Smartphone Premium
Smartphone Basic
Tablet
PC / Tablet Hybrid
PC Ultramobile Clamshell
PC Desktop & Notebook
US$bn
+9%
+7%
SEMICONDUCTOR GROWTH DRIVERS
› Semiconductor drivers are mobile devices, but long term growth rate is slowing
› New semi growth drivers are solid state drives, servers, automotive and industrial
Source: Gartner, March 2017
CAGR
‘16-21
+1%
+4%
+17%
+7%
-6%
+15%
-2%
+7%
July 25, 2017 | ASM proprietary information | 8
0
5
10
15
20
25
30
35
40
45
50
2015 2016 2017 2018 2019 2020 2021
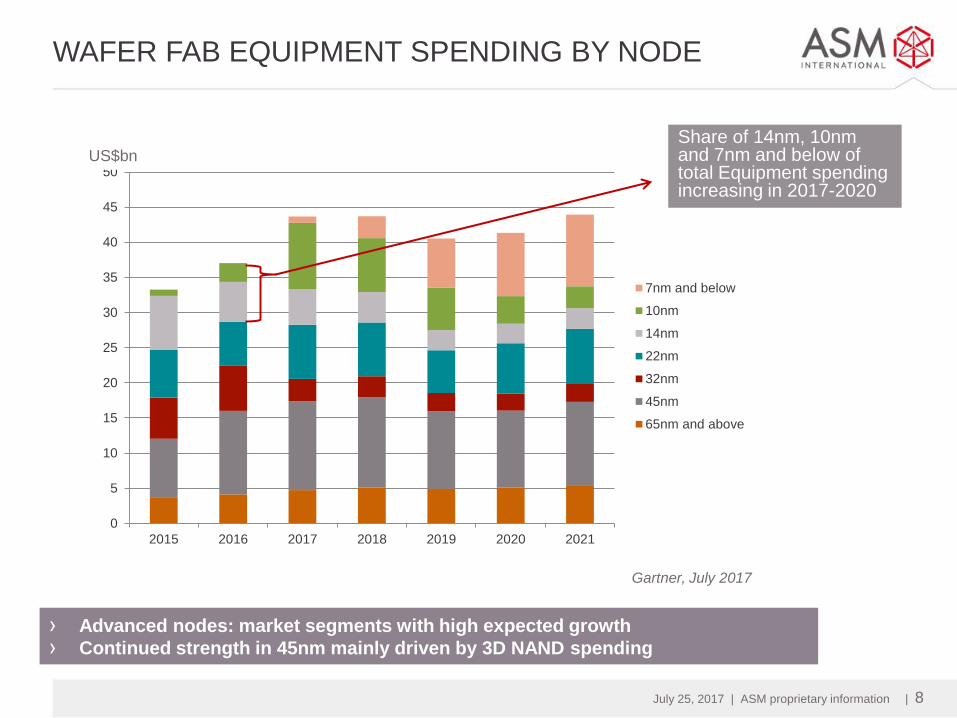
7nm and below
10nm
14nm
22nm
32nm
45nm
65nm and above
WAFER FAB EQUIPMENT SPENDING BY NODE
Gartner, July 2017
Share of 14nm, 10nm and 7nm and below of total Equipment spending increasing in 2017-2020
US$bn
› Advanced nodes: market segments with high expected growth
› Continued strength in 45nm mainly driven by 3D NAND spending
July 25, 2017 | ASM proprietary information | 9
ALD IS AN ENABLING TECHNOLOGY
› ALD technology is a key enabler of Moore’s Law
Strengths of Atomic Layer Deposition: high-precision deposition of smooth and
conformal ultra-thin films, ability to deposit new materials
Device scaling, new materials and 3D architectures drive increased demand for ALD
› ASMI has leading positions in ALD
Leadership in high-k metal gate, spacer defined multiple patterning and several new
applications
ALD continued to account for clearly more than half of ASM’s equipment revenue in
2016
› Strong market outlook ALD
Drivers are further deployment of ALD in volume manufacturing, new applications and
process steps
The CAGR of the single wafer ALD segment is expected to be the highest within the
deposition equipment market in the next years
July 25, 2017 | ASM proprietary information | 10
COMPETITIVE ADVANTAGES
› Focused player, differentiated technologies
› Track record of innovation
› Global network, streamlined operations
› Leadership in ALD
Developing ALD technology since 1999
Leading market share in ALD
› Close cooperation with the leading IC manufacturers
› Strong IP portfolio
July 25, 2017 | ASM proprietary information | 11
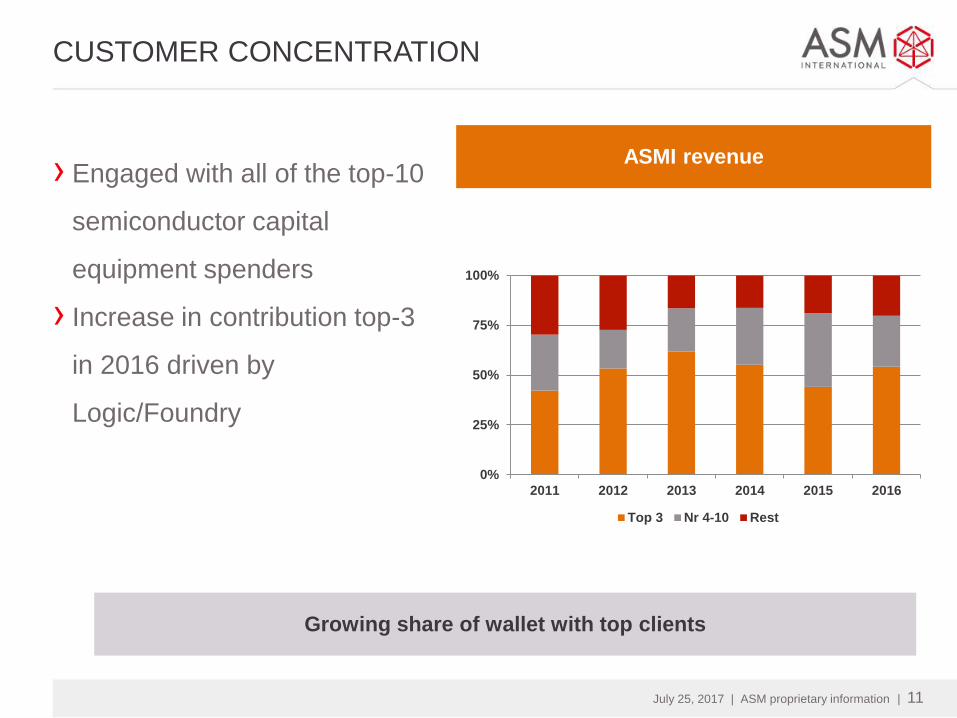
CUSTOMER CONCENTRATION
› Engaged with all of the top-10
semiconductor capital
equipment spenders
› Increase in contribution top-3
in 2016 driven by
Logic/Foundry
ASMI revenue
Growing share of wallet with top clients
0%
25%
50%
75%
100%
2011 2012 2013 2014 2015 2016
Top 3 Nr 4-10 Rest
July 25, 2017 | ASM proprietary information | 12
HIGHLIGHTS
› Solid growth expected for the ALD market
For 2017, we expect a clear improvement in the single wafer ALD market
We expect the single wafer ALD market to reach a size of approx. US$1.5 billion by
2020-2021
› First high volume manufacturing order intake Intrepid
Broadening our Epitaxy presence to the mainstream CMOS market
› Shareholder remuneration
As per July 21, 2017, 85% of the current share buyback program completed
Proceeds of 5% stake sale ASMPT to be used for a new buyback program
Stable dividend of EUR 0.70 per share paid in 2017
› TSMC supplier excellence award
On February 23, 2017, ASMI received a supplier excellence award as one of five
equipment suppliers from TSMC for ALD equipment and technology
July 25, 2017 | ASM proprietary information | 13
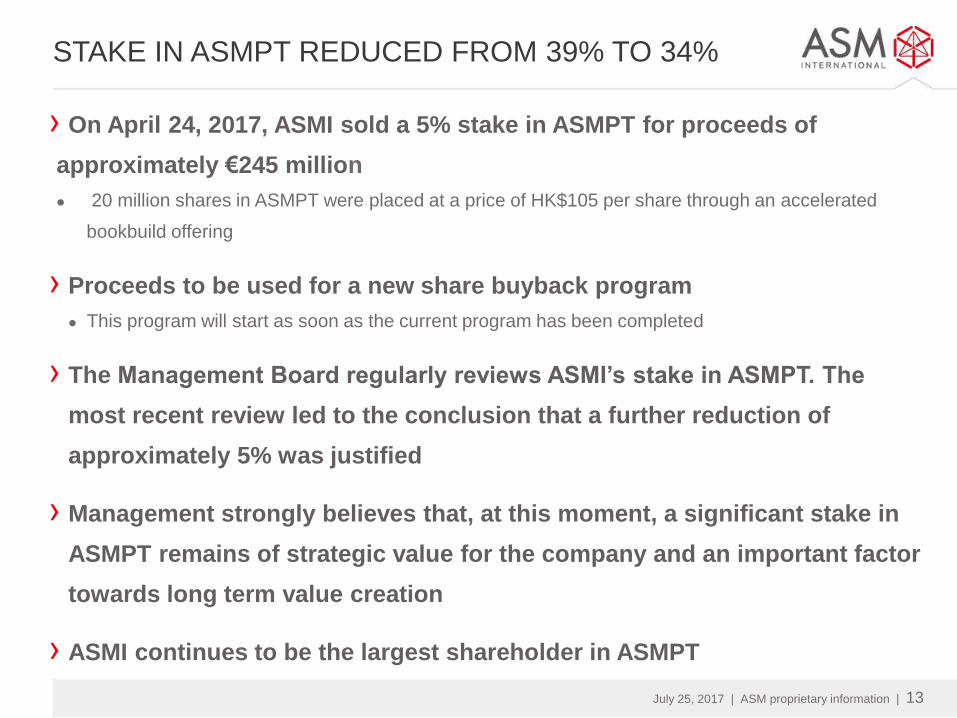
STAKE IN ASMPT REDUCED FROM 39% TO 34%
› On April 24, 2017, ASMI sold a 5% stake in ASMPT for proceeds of
approximately €245 million
20 million shares in ASMPT were placed at a price of HK$105 per share through an accelerated
bookbuild offering
› Proceeds to be used for a new share buyback program
This program will start as soon as the current program has been completed
› The Management Board regularly reviews ASMI’s stake in ASMPT. The
most recent review led to the conclusion that a further reduction of
approximately 5% was justified
› Management strongly believes that, at this moment, a significant stake in
ASMPT remains of strategic value for the company and an important factor
towards long term value creation
› ASMI continues to be the largest shareholder in ASMPT
July 25, 2017 | ASM proprietary information | 14
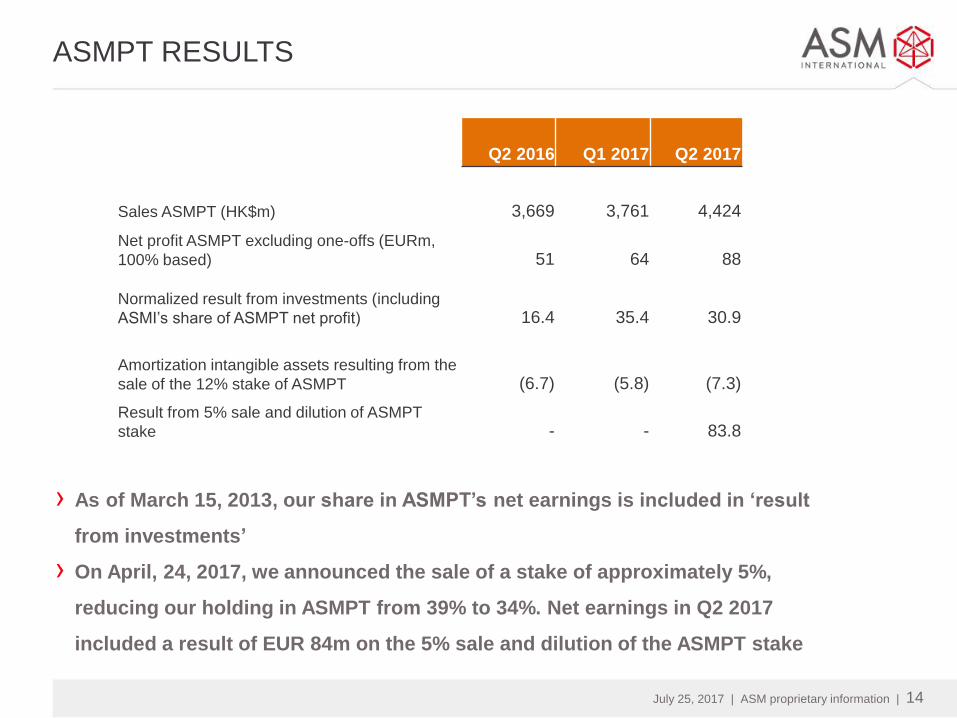
ASMPT RESULTS
› As of March 15, 2013, our share in ASMPT’s net earnings is included in ‘result
from investments’
› On April, 24, 2017, we announced the sale of a stake of approximately 5%,
reducing our holding in ASMPT from 39% to 34%. Net earnings in Q2 2017
included a result of EUR 84m on the 5% sale and dilution of the ASMPT stake
Q2 2016
Q1 2017
Q2 2017
Sales ASMPT (HK$m) 3,669 3,761
4,424
Net profit ASMPT excluding one-offs (EURm,
100% based)
51
64
88
Normalized result from investments (including
ASMI’s share of ASMPT net profit) 16.4 35.4
30.9
Amortization intangible assets resulting from the
sale of the 12% stake of ASMPT (6.7) (5.8) (7.3)
Result from 5% sale and dilution of ASMPT
stake - - 83.8
July 25, 2017 | ASM proprietary information | 15
FINANCIAL OVERVIEW
July 25, 2017 | ASM proprietary information | 16
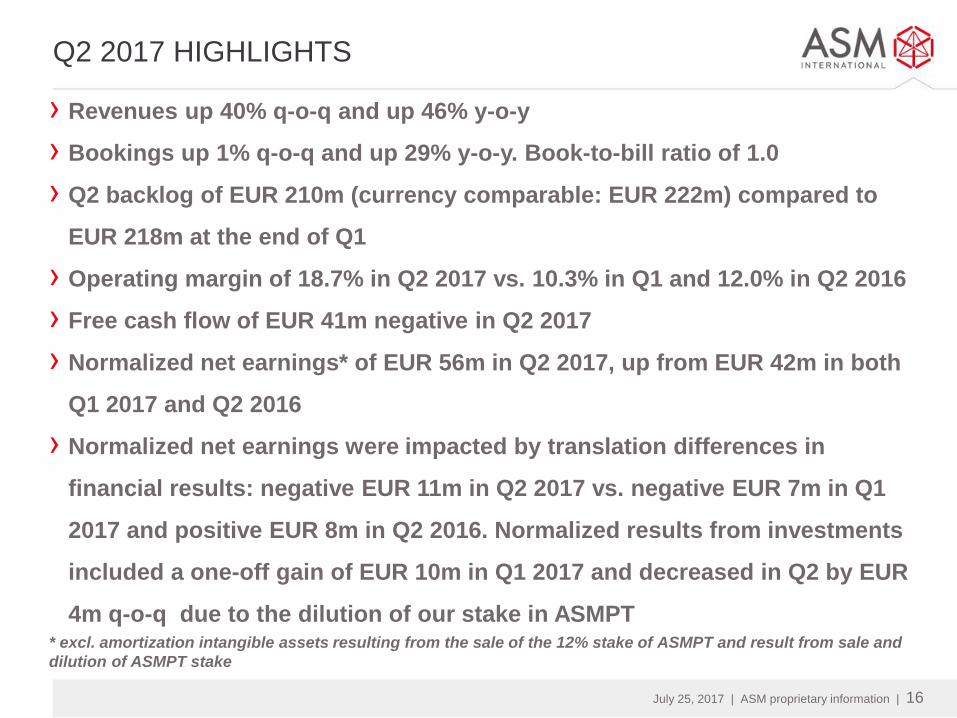
Q2 2017 HIGHLIGHTS
› Revenues up 40% q-o-q and up 46% y-o-y
› Bookings up 1% q-o-q and up 29% y-o-y. Book-to-bill ratio of 1.0
› Q2 backlog of EUR 210m (currency comparable: EUR 222m) compared to
EUR 218m at the end of Q1
› Operating margin of 18.7% in Q2 2017 vs. 10.3% in Q1 and 12.0% in Q2 2016
› Free cash flow of EUR 41m negative in Q2 2017
› Normalized net earnings* of EUR 56m in Q2 2017, up from EUR 42m in both
Q1 2017 and Q2 2016
› Normalized net earnings were impacted by translation differences in
financial results: negative EUR 11m in Q2 2017 vs. negative EUR 7m in Q1
2017 and positive EUR 8m in Q2 2016. Normalized results from investments
included a one-off gain of EUR 10m in Q1 2017 and decreased in Q2 by EUR
4m q-o-q due to the dilution of our stake in ASMPT * excl. amortization intangible assets resulting from the sale of the 12% stake of ASMPT and result from sale and
dilution of ASMPT stake
July 25, 2017 | ASM proprietary information | 17
FINANCIAL OUTLOOK
Based upon the current backlog and our current visibility:
For Q3 we expect a sales level of €170-190 million, on a currency comparable
level, while for the second half of 2017 as a whole we expect a sales level
higher than in the first half of 2017. After the very strong orders in the past two
quarters we expect order intake in Q3 at a still healthy level of €150-170 million,
on a currency comparable level.
July 25, 2017 | ASM proprietary information | 18
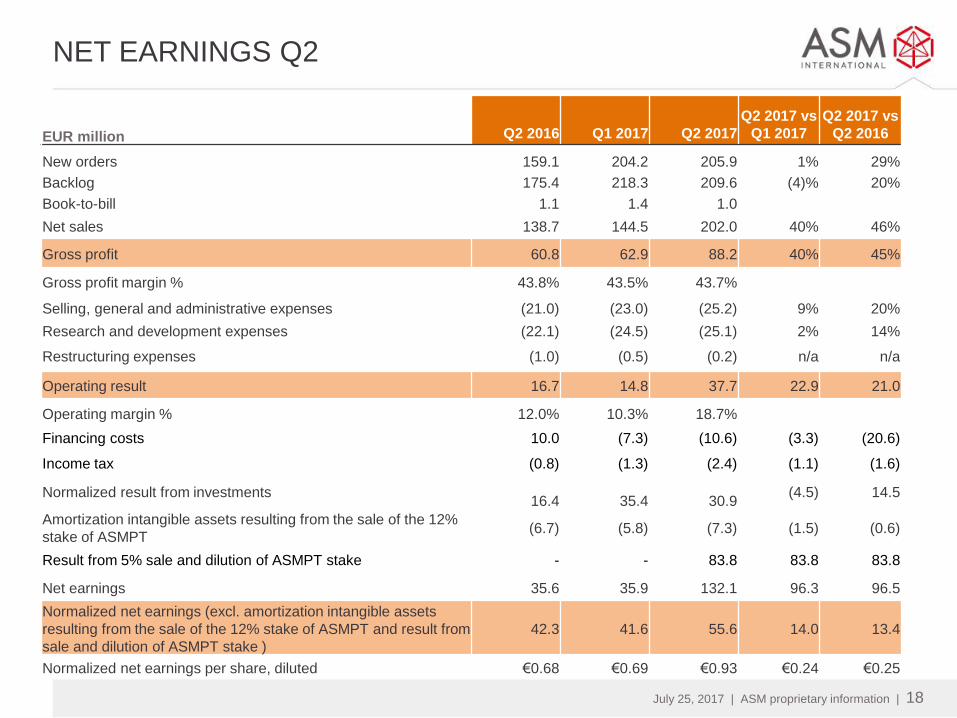
NET EARNINGS Q2
EUR million Q2 2016
Q1 2017
Q2 2017
Q2 2017 vs
Q1 2017
Q2 2017 vs
Q2 2016
New orders 159.1 204.2 205.9 1% 29%
Backlog 175.4 218.3 209.6 (4)% 20%
Book-to-bill 1.1 1.4 1.0
Net sales 138.7 144.5 202.0 40% 46%
Gross profit 60.8 62.9 88.2 40% 45%
Gross profit margin % 43.8% 43.5% 43.7%
Selling, general and administrative expenses (21.0) (23.0) (25.2) 9% 20%
Research and development expenses (22.1) (24.5) (25.1) 2% 14%
Restructuring expenses (1.0) (0.5) (0.2) n/a n/a
Operating result 16.7 14.8 37.7 22.9 21.0
Operating margin % 12.0% 10.3% 18.7%
Financing costs 10.0 (7.3) (10.6) (3.3) (20.6)
Income tax (0.8) (1.3) (2.4) (1.1) (1.6)
Normalized result from investments
16.4
35.4
30.9 (4.5) 14.5
Amortization intangible assets resulting from the sale of the 12%
stake of ASMPT (6.7) (5.8) (7.3) (1.5) (0.6)
Result from 5% sale and dilution of ASMPT stake - - 83.8 83.8 83.8
Net earnings 35.6 35.9 132.1 96.3 96.5
Normalized net earnings (excl. amortization intangible assets
resulting from the sale of the 12% stake of ASMPT and result from
sale and dilution of ASMPT stake )
42.3 41.6 55.6 14.0 13.4
Normalized net earnings per share, diluted €0.68 €0.69 €0.93 €0.24 €0.25
July 25, 2017 | ASM proprietary information | 19
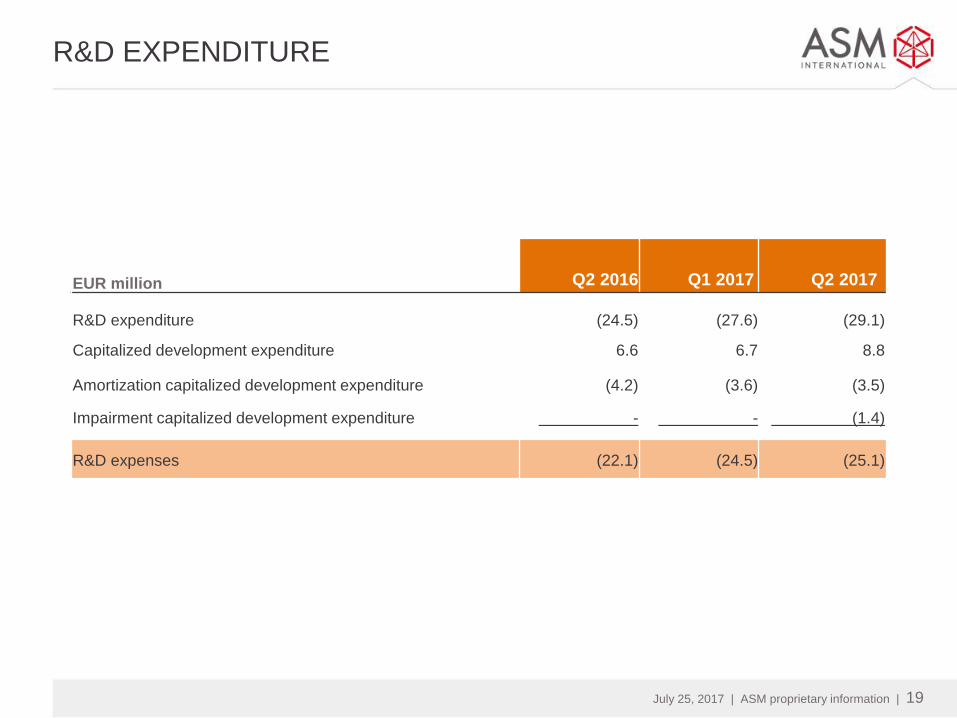
R&D EXPENDITURE
EUR million
Q2 2016
Q1 2017
Q2 2017
R&D expenditure (24.5) (27.6) (29.1)
Capitalized development expenditure 6.6 6.7 8.8
Amortization capitalized development expenditure (4.2) (3.6) (3.5)
Impairment capitalized development expenditure - - (1.4)
R&D expenses (22.1) (24.5) (25.1)
July 25, 2017 | ASM proprietary information | 20
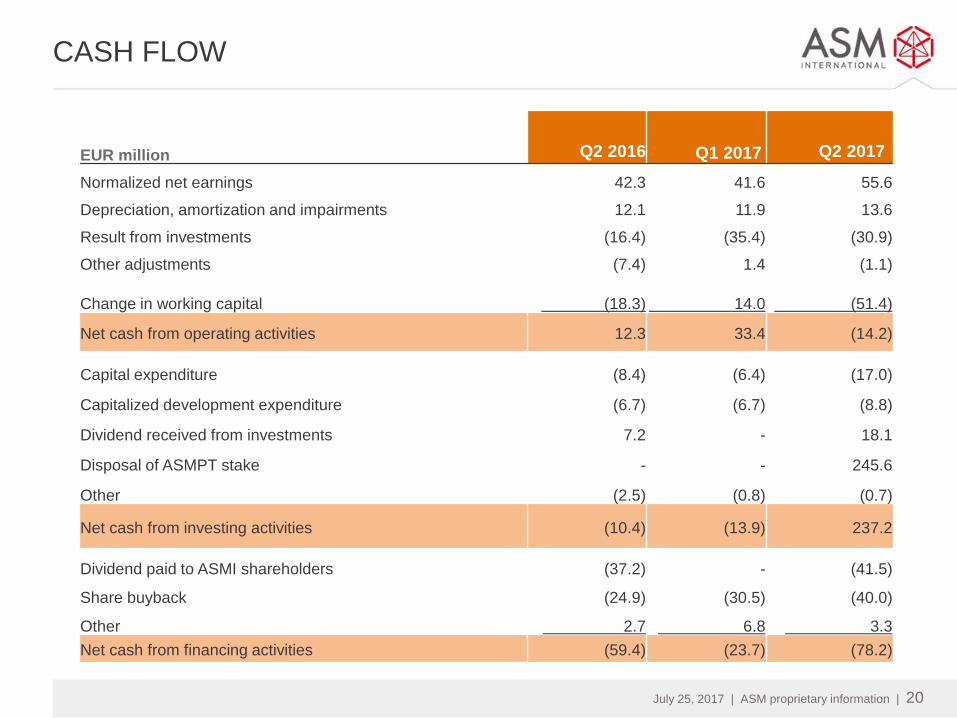
CASH FLOW
EUR million
Q2 2016
Q1 2017
Q2 2017
Normalized net earnings 42.3 41.6 55.6
Depreciation, amortization and impairments 12.1 11.9 13.6
Result from investments (16.4) (35.4) (30.9)
Other adjustments (7.4) 1.4 (1.1)
Change in working capital
1 (18.3) 14.0 (51.4)
Net cash from operating activities 12.3 33.4 (14.2)
Capital expenditure (8.4) (6.4) (17.0)
Capitalized development expenditure (6.7) (6.7) (8.8)
Dividend received from investments 7.2 - 18.1
Disposal of ASMPT stake - - 245.6
Other (2.5) (0.8) (0.7)
Net cash from investing activities (10.4) (13.9) 237.2
Dividend paid to ASMI shareholders (37.2) - (41.5)
Share buyback (24.9) (30.5) (40.0)
Other 2.7 6.8 3.3
Net cash from financing activities (59.4) (23.7) (78.2)
July 25, 2017 | ASM proprietary information | 21
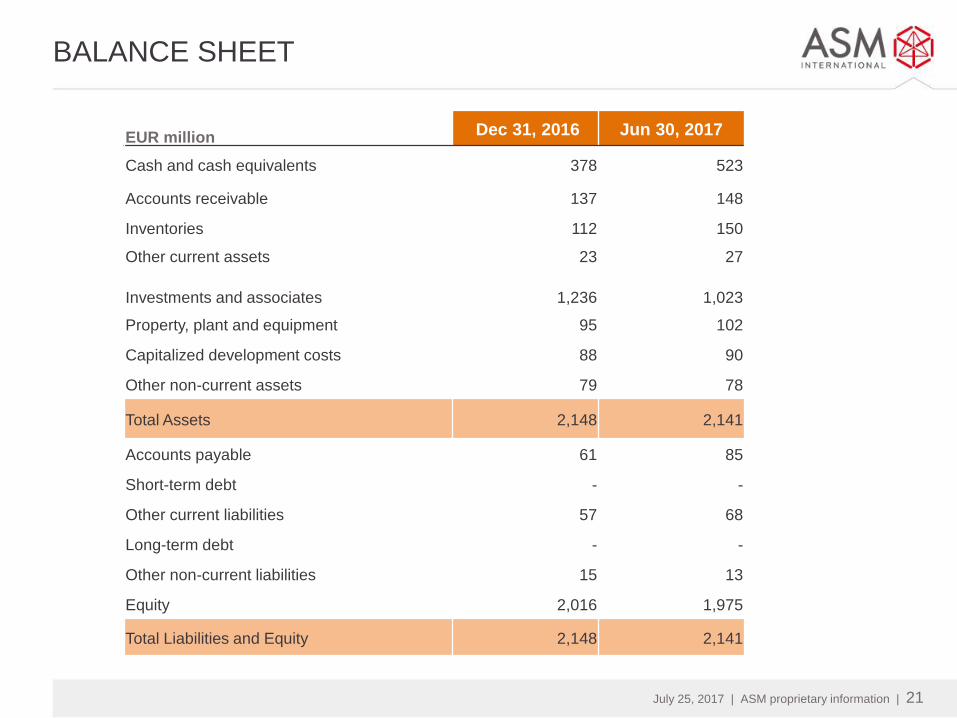
BALANCE SHEET
EUR million Dec 31, 2016 Jun 30, 2017
Cash and cash equivalents 378 523
Accounts receivable 137 148
Inventories 112 150
Other current assets 23 27
Investments and associates 1,236 1,023
Property, plant and equipment 95 102
Capitalized development costs 88 90
Other non-current assets 79 78
Total Assets 2,148 2,141
Accounts payable 61 85
Short-term debt - -
Other current liabilities 57 68
Long-term debt - -
Other non-current liabilities 15 13
Equity 2,016 1,975
Total Liabilities and Equity 2,148 2,141
July 25, 2017 | ASM proprietary information | 22
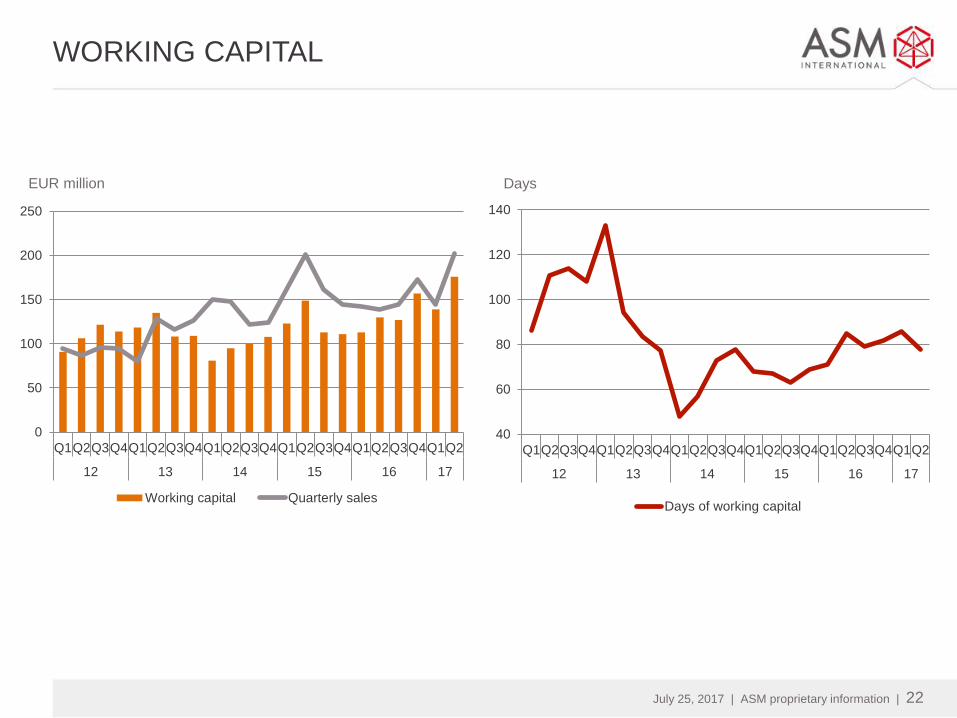
WORKING CAPITAL
EUR million Days
0
50
100
150
200
250
Q1Q2Q3Q4Q1Q2Q3Q4Q1Q2Q3Q4Q1Q2Q3Q4Q1Q2Q3Q4Q1Q2
12 13 14 15 16 17
Working capital Quarterly sales
40
60
80
100
120
140
Q1Q2Q3Q4Q1Q2Q3Q4Q1Q2Q3Q4Q1Q2Q3Q4Q1Q2Q3Q4Q1Q2
12 13 14 15 16 17
Days of working capital
July 25, 2017 | ASM proprietary information | 23
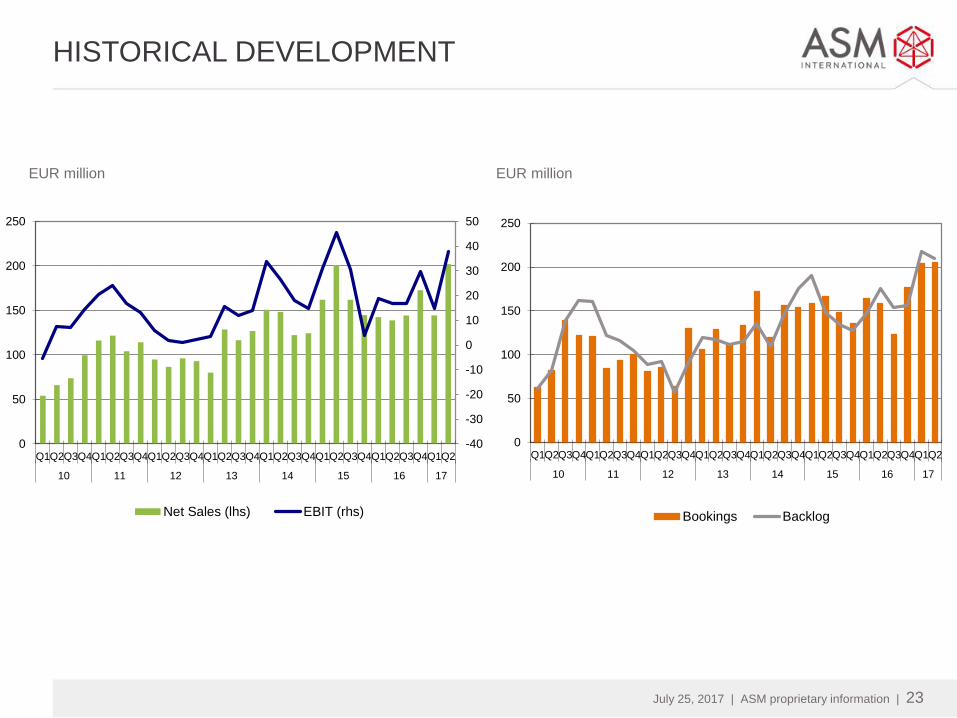
HISTORICAL DEVELOPMENT
EUR million EUR million
-40
-30
-20
-10
0
10
20
30
40
50
0
50
100
150
200
250
Q1Q2Q3Q4Q1Q2Q3Q4Q1Q2Q3Q4Q1Q2Q3Q4Q1Q2Q3Q4Q1Q2Q3Q4Q1Q2Q3Q4Q1Q2
10 11 12 13 14 15 16 17
Net Sales (lhs) EBIT (rhs)
0
50
100
150
200
250
Q1Q2Q3Q4Q1Q2Q3Q4Q1Q2Q3Q4Q1Q2Q3Q4Q1Q2Q3Q4Q1Q2Q3Q4Q1Q2Q3Q4Q1Q2
10 11 12 13 14 15 16 17
Bookings Backlog
July 25, 2017 | ASM proprietary information | 24
Related Documents