Investor Presentation October 2006

Investor Presentation October 2006. 2 Safe Harbor Statement Some of the information in this presentation may contain projections or other forward-looking.
Dec 16, 2015
Welcome message from author
This document is posted to help you gain knowledge. Please leave a comment to let me know what you think about it! Share it to your friends and learn new things together.
Transcript
Investor Presentation
October 2006

2
Safe Harbor Statement
Some of the information in this presentation may contain projections or other forward-looking statements regarding future events or the future financial performance of Sistema Joint Stock Financial Corporation (“Sistema”). You can identify forward looking statements by terms such as “expect,” “believe,” “anticipate,” “estimate,” “intend,” “will,” “could,” “may” or “might,” the negative of such terms or other similar expressions. We wish to caution you that these statements are only predictions and that actual events or results may differ materially. We do not intend to update these statements to reflect events and circumstances occurring after the date hereof or to reflect the occurrence of unanticipated events. Many factors could cause the actual results to differ materially from those contained in our projections or forward-looking statements, including, among others, general economic conditions, our competitive environment, risks associated with operating in Russia, rapid technological and market change in our industries, as well as many other risks specifically related to Sistema and its operations.
3
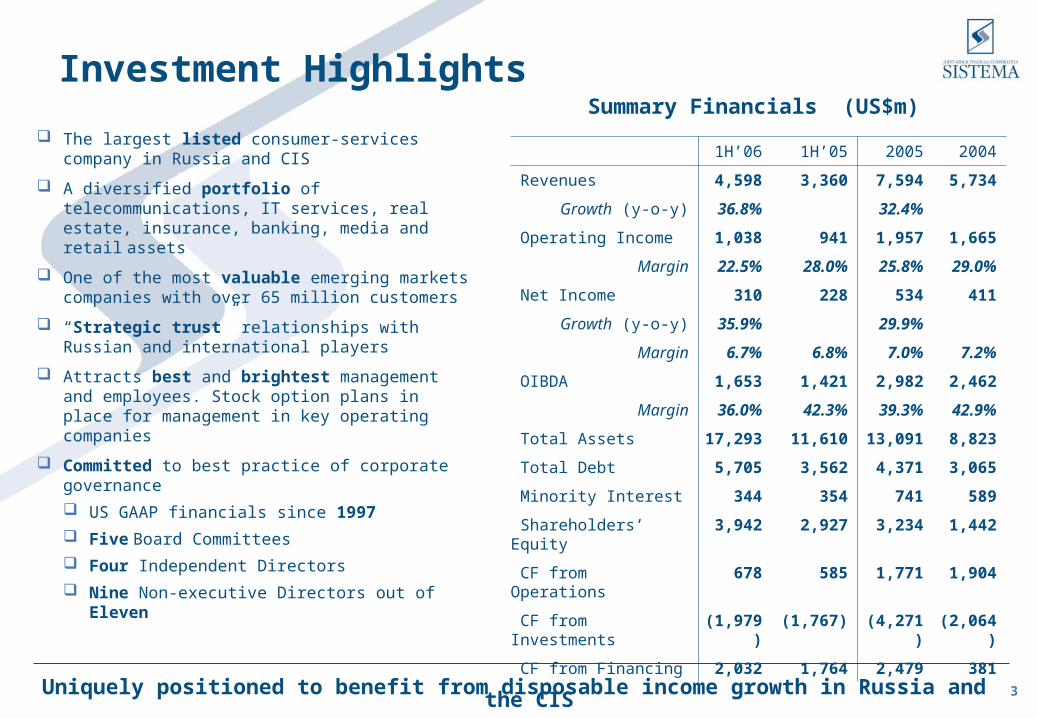
The largest listed consumer-services company in Russia and CIS
A diversified portfolio of telecommunications, IT services, real estate, insurance, banking, media and retail assets
One of the most valuable emerging markets companies with over 65 million customers
“Strategic trust” relationships with Russian and international players
Attracts best and brightest management and employees. Stock option plans in place for management in key operating companies
Committed to best practice of corporate governance
US GAAP financials since 1997
Five Board Committees
Four Independent Directors
Nine Non-executive Directors out of Eleven
Summary Financials (US$m)
1H’06 1H’05 2005 2004
Revenues 4,598 3,360 7,594 5,734
Growth (y-o-y) 36.8% 32.4%
Operating Income 1,038 941 1,957 1,665
Margin 22.5% 28.0% 25.8% 29.0%
Net Income 310 228 534 411
Growth (y-o-y) 35.9% 29.9%
Margin 6.7% 6.8% 7.0% 7.2%
OIBDA 1,653 1,421 2,982 2,462
Margin 36.0% 42.3% 39.3% 42.9%
Total Assets 17,293 11,610 13,091 8,823
Total Debt 5,705 3,562 4,371 3,065
Minority Interest 344 354 741 589
Shareholders’ Equity 3,942 2,927 3,234 1,442
CF from Operations 678 585 1,771 1,904
CF from Investments (1,979) (1,767) (4,271) (2,064)
CF from Financing 2,032 1,764 2,479 381
Investment Highlights
Uniquely positioned to benefit from disposable income growth in Russia and the CIS
4
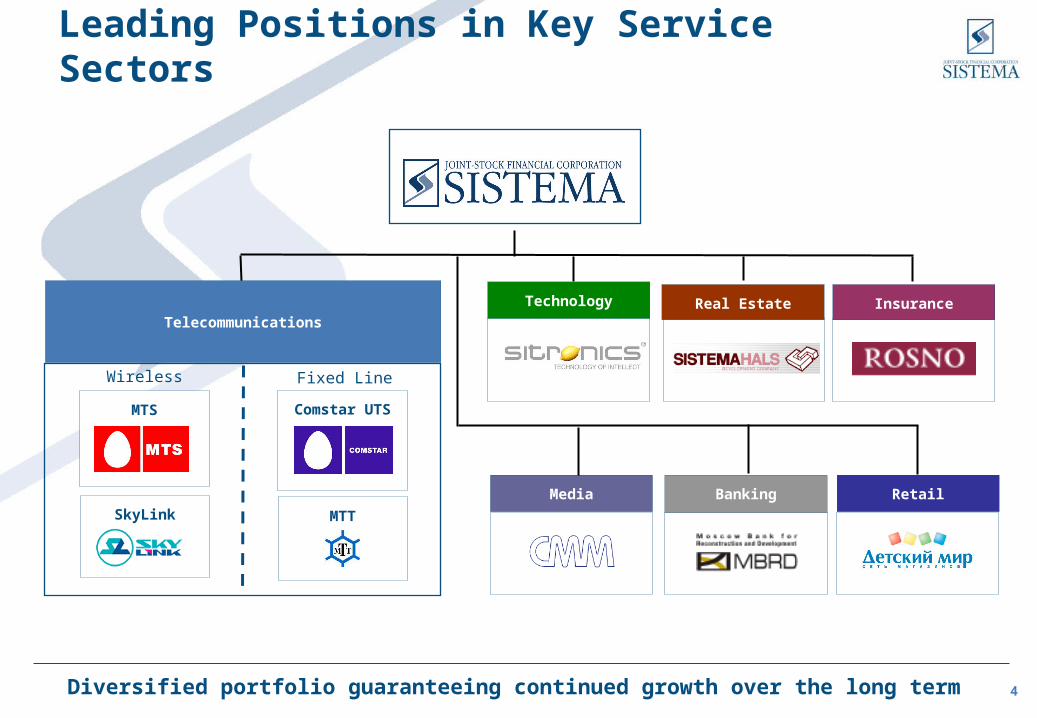
Leading Positions in Key Service Sectors
Media Banking
InsuranceReal Estate
Retail
Telecommunications
SkyLink
MTS
Wireless
Comstar UTS
Fixed Line
MTT
Technology
Diversified portfolio guaranteeing continued growth over the long term
5
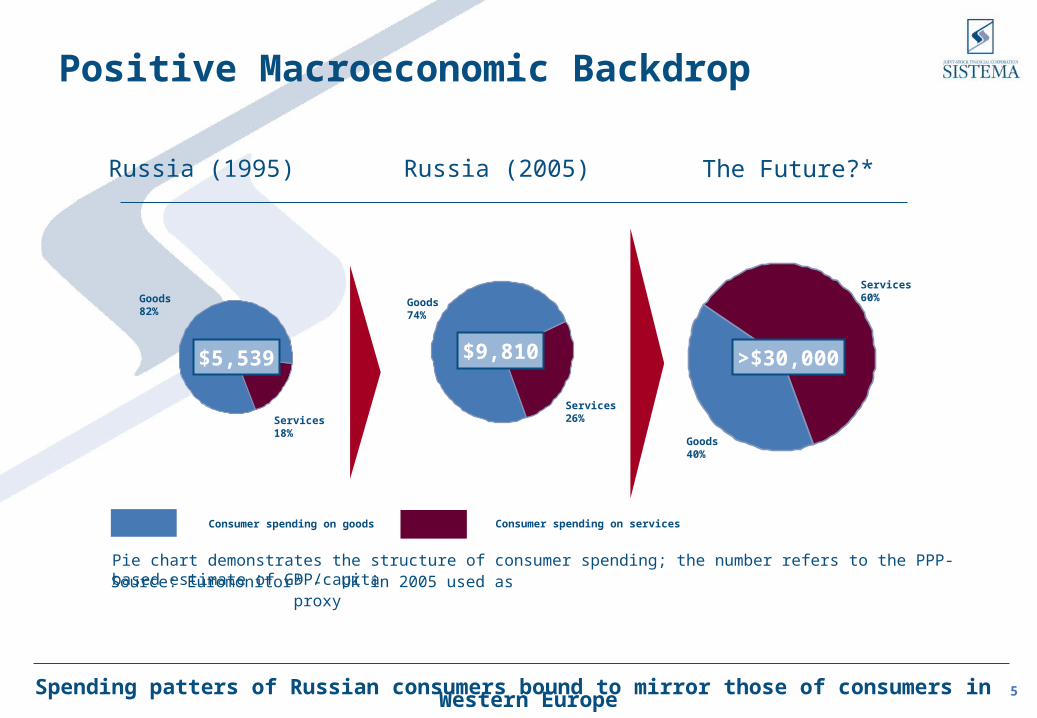
Positive Macroeconomic Backdrop
The Future?*Russia (2005)Russia (1995)
Source: Euromonitor
$5,539 $9,810 >$30,000
Goods82%
Services18%
Goods74%
Services26%
Goods40%
Services60%
* - UK in 2005 used as proxyPie chart demonstrates the structure of consumer spending; the number refers to the PPP-based estimate of GDP/capita
Consumer spending on goods Consumer spending on services
Spending patters of Russian consumers bound to mirror those of consumers in Western Europe
6
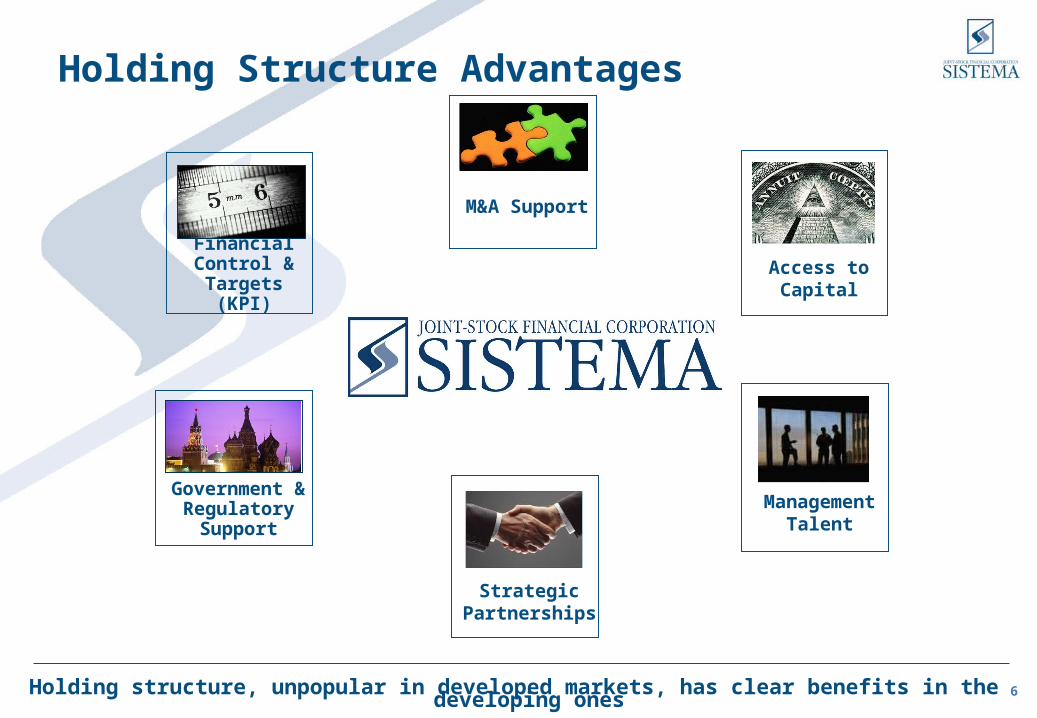
Strategic Partnerships
Government & Regulatory
Support
Financial Control &
Targets (KPI)
M&A Support
Access to Capital
Management Talent
Holding structure, unpopular in developed markets, has clear benefits in the developing ones
Holding Structure Advantages
7
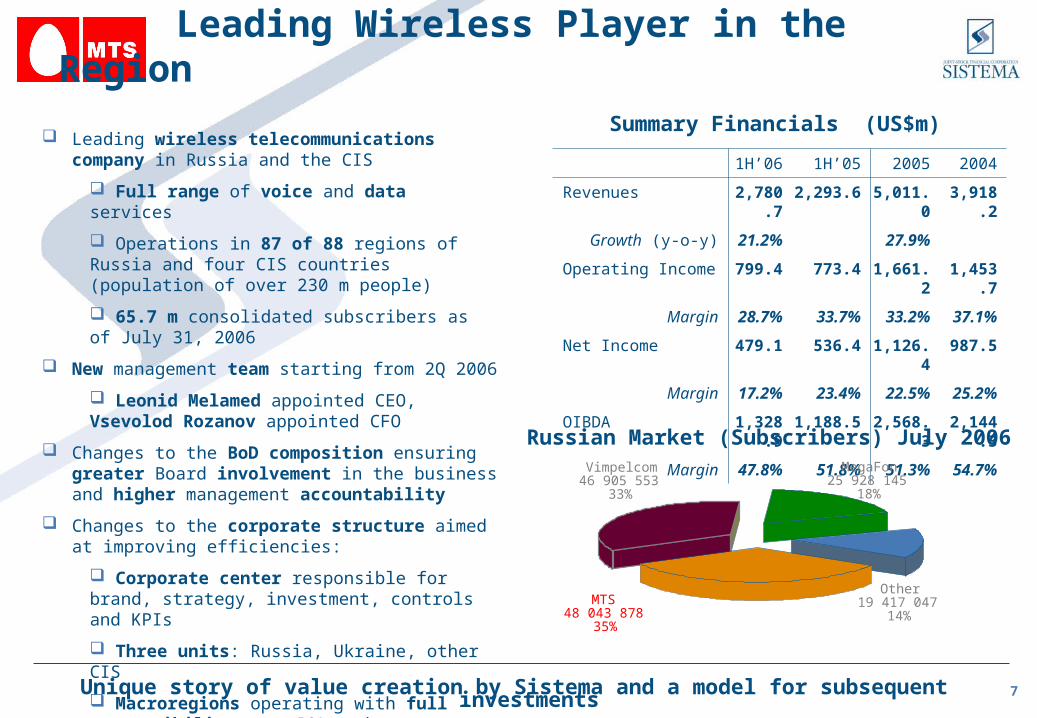
Leading wireless telecommunications company in Russia and the CIS
Full range of voice and data services
Operations in 87 of 88 regions of Russia and four CIS countries (population of over 230 m people)
65.7 m consolidated subscribers as of July 31, 2006
New management team starting from 2Q 2006
Leonid Melamed appointed CEO, Vsevolod Rozanov appointed CFO
Changes to the BoD composition ensuring greater Board involvement in the business and higher management accountability
Changes to the corporate structure aimed at improving efficiencies:
Corporate center responsible for brand, strategy, investment, controls and KPIs
Three units: Russia, Ukraine, other CIS
Macroregions operating with full responsibility over P&L and greater decision-making autonomy
Leading Wireless Player in the RegionSummary Financials (US$m)
1H’06 1H’05 2005 2004
Revenues 2,780.7 2,293.6 5,011.0 3,918.2
Growth (y-o-y) 21.2% 27.9%
Operating Income 799.4 773.4 1,661.2 1,453.7
Margin 28.7% 33.7% 33.2% 37.1%
Net Income 479.1 536.4 1,126.4 987.5
Margin 17.2% 23.4% 22.5% 25.2%
OIBDA 1,328.9 1,188.5 2,568.3 2,144.3
Margin 47.8% 51.8% 51.3% 54.7%
Russian Market (Subscribers) July 2006
Other19 417 047
14%
MegaFon 25 928 145
18%
Vimpelcom 46 905 553
33%
MTS 48 043 878
35%
Unique story of value creation by Sistema and a model for subsequent investments

8
Leading provider of integrated communications services in Moscow and Moscow region with 4.9 million customers
A growth company delivering wide range of consumer services in the traditional and alternative fixed line segments
Actively expanding into Russian regions through M&A, also targeting the broader CIS market
Incumbent operator MGTS holds 68% market share in Moscow and Moscow region and controls access to the last mile
Operating in the environment of increasing regulated tariffs (c.17% in 2005) and rapid technological upgrade
STREAM is a broadband and Pay TV provider with over 300K ADSL subscribers and almost 30K Pay TV subscribers
Extremely successful residential ADSL offering in Moscow since February 2004
Launched an in-house entertainment offering in mid-2005 (c.100 TV channels, PPV, gaming, etc.)
Growth Opportunity in Fixed-Line BusinessSummary Financials (US$m)
1H’06 1H’05 2005 2004
Revenues 536.6 419.0 907.6 695.1
Growth (y-o-y) 28.1% 30.6%
Operating Income 163.5 128.7 268.4 173.7
Margin 30.5% 30.7% 29.6% 25.0%
Net Income 97.3 49.1 105.9 76.1
Margin 18.1% 11.8% 11.7% 10.9%
OIBDA 217.1 174.0 358.8 249.8
Margin 40.4% 41.5% 39.5% 35.9%
1H 2006 Revenue Breakdown
Traditional Segment; 60%
Corporate and Operators; 26%
High Value Residential;
10%
Other inc. Regions; 4%
Creation of an undisputed market leader in the Russian fixed-line industry

9
Diversified Technology Business
Telecom Solutions; 37%
IT Solutions; 43%
Consumer Electronics and
EMS; 12%
Microelectronic Solutions; 8%
Summary Financials (US$m)
1H’06 1H’05 2005 2004
Revenues 696.6 426.5 961.1 498.4
Growth (y-o-y) 163.3% 92.8%
Operating Income 62.4 109.9 143.5 45.9
Margin 8.9% 25.7% 14.9% 9.2%
Net Income 33.7 64.6 78.3 20.6
Margin 4.8% 15.1% 8.1% 4.1%
OIBDA 80.6 115.4 155.6 49.4
Margin 11.6% 27.0% 16.2% 9.9%
1H 2006 Revenue Breakdown
Telecom Solutions
Focus on development of billing systems, OSS/BSS, NGN solutions, etc. Low production costs in Russia, Czech Republic and Romania Continued increase in the share of software sales
IT Solutions
Focus on high value-added businesses: systems integration and consultancy Successful entry into the Russian market from CEE base Launch of mobile games and workflow management software
Microelectronic Solutions
Lead offering to defence contractors and energy companies
Won e-passports tender from Russian government
Well positioned in high-margin smart card business
Focus on selling directly to end users
Consumer Electronics and EMS
Market share growth in domestic consumer electronics: LCD TVs, DVDs, PCs
Well positioned to develop security and telematics systems
Large-scale diversified technology business based on proprietary IP
10
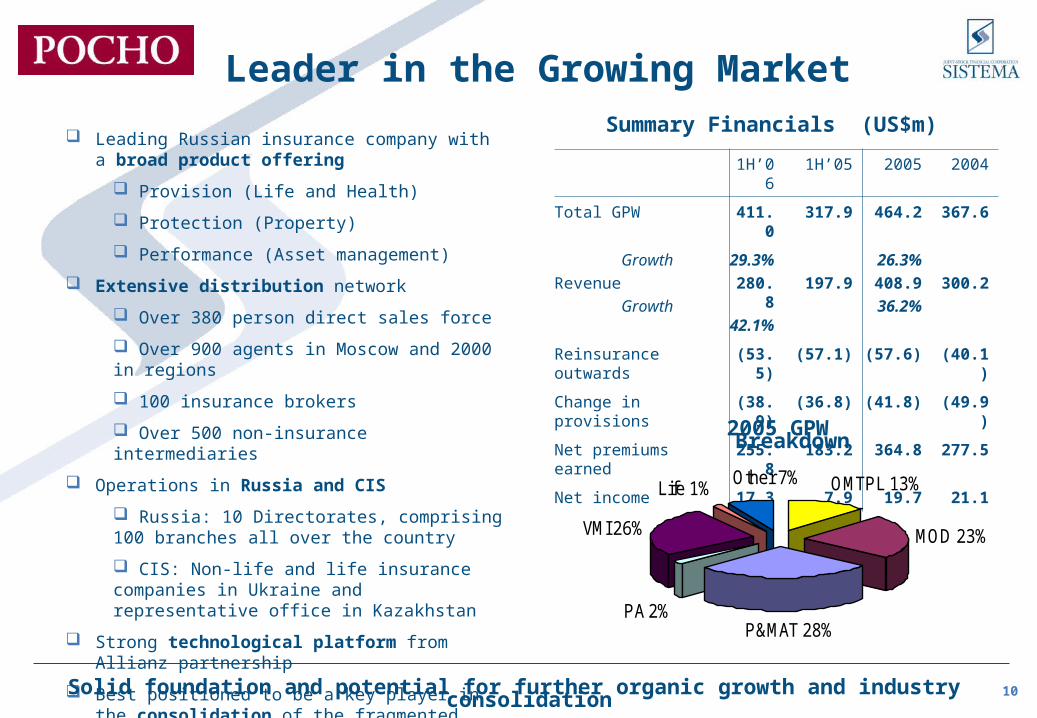
Leading Russian insurance company with a broad product offering
Provision (Life and Health)
Protection (Property)
Performance (Asset management)
Extensive distribution network
Over 380 person direct sales force
Over 900 agents in Moscow and 2000 in regions
100 insurance brokers
Over 500 non-insurance intermediaries
Operations in Russia and CIS
Russia: 10 Directorates, comprising 100 branches all over the country
CIS: Non-life and life insurance companies in Ukraine and representative office in Kazakhstan
Strong technological platform from Allianz partnership
Best positioned to be a key player in the consolidation of the fragmented industry
Leader in the Growing MarketSummary Financials (US$m)
1H’06 1H’05 2005 2004
Total GPW 411.0 317.9 464.2 367.6
Growth
Revenue
Growth
29.3%
280.8
42.1%
197.9
26.3%
408.9
36.2%
300.2
Reinsurance outwards (53.5) (57.1) (57.6) (40.1)
Change in provisions (38.9) (36.8) (41.8) (49.9)
Net premiums earned 255.8 183.2 364.8 277.5
Net income 17.3 7.9 19.7 21.12005 GPW Breakdown
Solid foundation and potential for further organic growth and industry consolidation
PA 2%P&MAT 28%
MOD 23%
OMTPL 13%Life 1%
VMI 26%
Other 7%
11
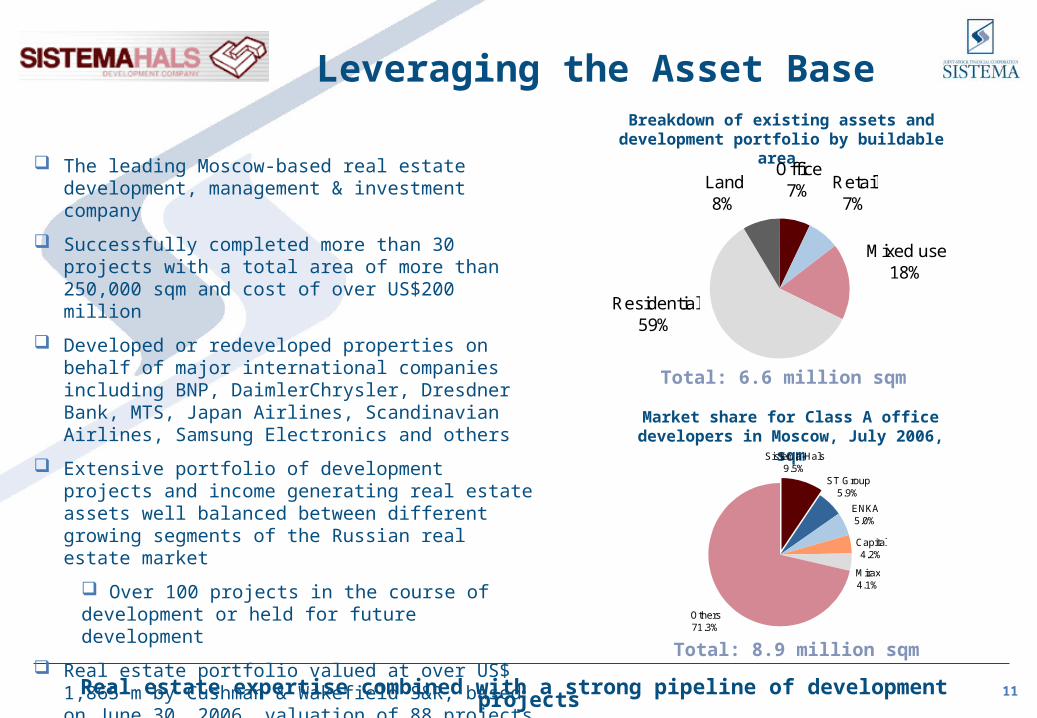
Breakdown of existing assets and development portfolio by buildable area
Leveraging the Asset Base
The leading Moscow-based real estate development, management & investment company
Successfully completed more than 30 projects with a total area of more than 250,000 sqm and cost of over US$200 million
Developed or redeveloped properties on behalf of major international companies including BNP, DaimlerChrysler, Dresdner Bank, MTS, Japan Airlines, Scandinavian Airlines, Samsung Electronics and others
Extensive portfolio of development projects and income generating real estate assets well balanced between different growing segments of the Russian real estate market
Over 100 projects in the course of development or held for future development
Real estate portfolio valued at over US$ 1,865 m by Cushman & Wakefield S&R, based on June 30, 2006, valuation of 88 projects out of the total portfolio.
Market share for Class A office developers in Moscow, July 2006, sqm
Total: 8.9 million sqm
Sistema-Hals9.5%
ST Group5.9%
ENKA5.0%
Capital4.2%
Mirax4.1%
Others71.3%
Real estate expertise combined with a strong pipeline of development projects
Total: 6.6 million sqm
Office7% Retail
7%
Mixed use18%
Residential59%
Land8%

12
Retail – Detsky Mir Russia’s largest retailer of children’s goods: clothing, footwear, toys and accessories Revenues up 261.1% to US$ 117.9 mln in 1H 2006 vs. 1H 2005. Operating income
down due to a significant increase in rented outlets
Rapid expansion through new store openings and acquisitions – from 13 stores at 2004YE to 58 as of September 1, 2006
Moscow Bank for Reconstruction and Development (MBRD) Full-service retail bank with network of 12 branches and 41 mini-offices. Aggressive
retail roll-out in 2006 Revenues up 221.2% to US$ 87.8 mln & operating income up 274.4% to US$ 8.6 mln in
1H 2006 vs. 1H 2005 Successfully exploiting synergies within the Group: car loans with ROSNO, credit cards
with MTS and credit cards with Detsky Mir
Sistema Mass Media (SMM) Multimedia content production (TV programming and movies) and distribution (cable,
MMDS and ADSL platforms) Ongoing restructuring with divestiture of legacy assets and merger of Pay-TV operations
with Comstar UTS. Revenues down 46.8% to US$ 45.6 mln & operating income up to US$ 2.8 mln in 1H 2006 vs. 1H 2005 as a result of this restructuring
Leading cable TV provider in Russia with over 1 million subscribers in 20 regions
Further Potential in the Portfolio
Smaller businesses acting as locomotives of future growth
13
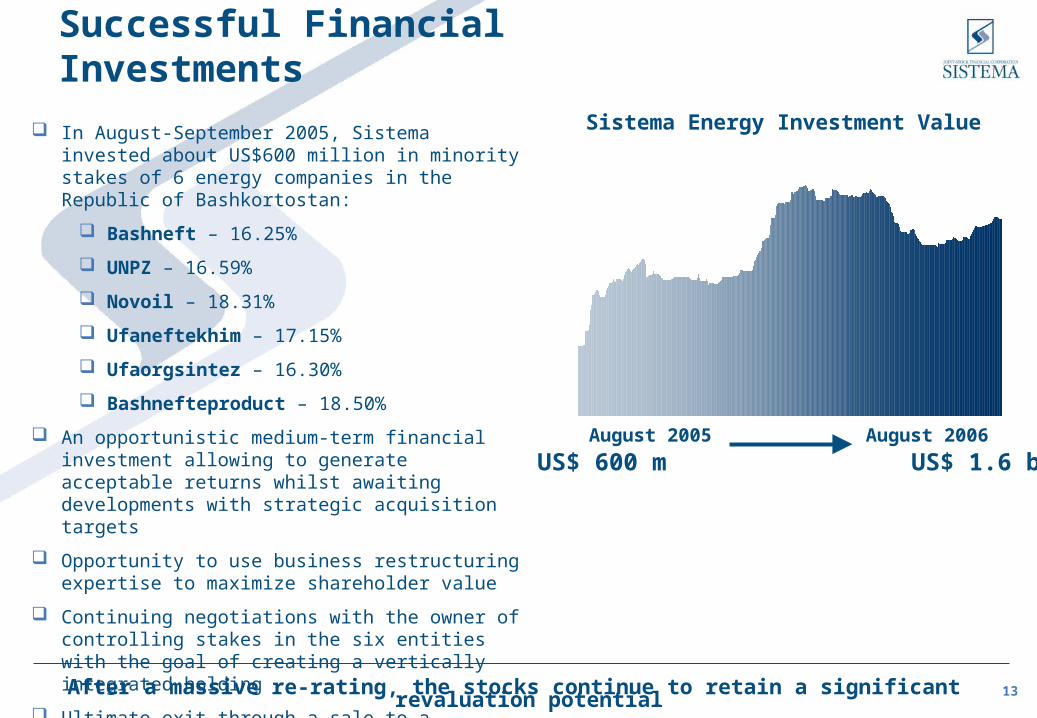
In August-September 2005, Sistema invested about US$600 million in minority stakes of 6 energy companies in the Republic of Bashkortostan:
Bashneft – 16.25%
UNPZ – 16.59%
Novoil – 18.31%
Ufaneftekhim – 17.15%
Ufaorgsintez – 16.30%
Bashnefteproduct – 18.50%
An opportunistic medium-term financial investment allowing to generate acceptable returns whilst awaiting developments with strategic acquisition targets
Opportunity to use business restructuring expertise to maximize shareholder value
Continuing negotiations with the owner of controlling stakes in the six entities with the goal of creating a vertically integrated holding
Ultimate exit through a sale to a strategic owner or a public equity offering
Successful Financial InvestmentsSistema Energy Investment Value
August 2005 August 2006
US$ 600 m US$ 1.6 b
After a massive re-rating, the stocks continue to retain a significant revaluation potential
14
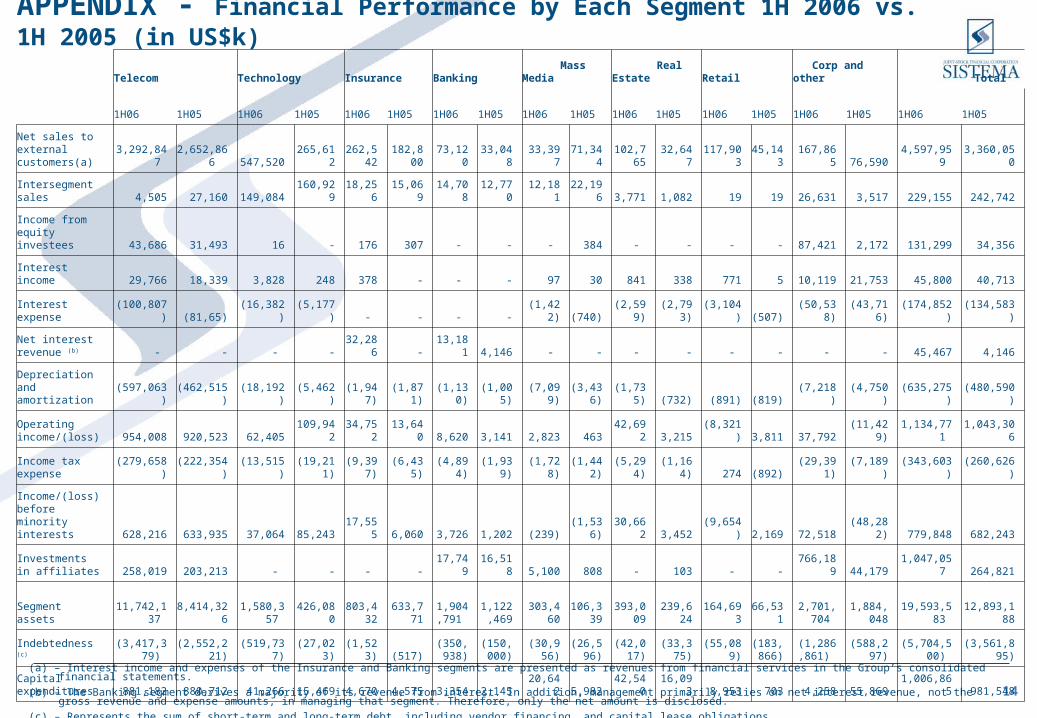
APPENDIX - Financial Performance by Each Segment 1H 2006 vs. 1H 2005 (in US$k)
(a) – Interest income and expenses of the Insurance and Banking segments are presented as revenues from financial services in the Group’s consolidated financial statements.
(b) – The Banking segment derives a majority of its revenue from interest. In addition, management primarily relies on net interest revenue, not the gross revenue and expense amounts, in managing that segment. Therefore, only the net amount is disclosed.
(c) – Represents the sum of short-term and long-term debt, including vendor financing, and capital lease obligations
Telecom Technology Insurance Banking Mass Media Real Estate Retail Corp and other Total
1H06 1H05 1H06 1H05 1H06 1H05 1H06 1H05 1H06 1H05 1H06 1H05 1H06 1H05 1H06 1H05 1H06 1H05
Net sales to external customers(a) 3,292,847 2,652,866 547,520 265,612
262,542 182,800 73,120 33,048 33,397 71,344
102,765 32,647 117,903 45,143 167,865 76,590 4,597,959 3,360,050
Intersegment sales 4,505 27,160 149,084 160,929 18,256 15,069 14,708 12,770 12,181 22,196 3,771 1,082 19 19 26,631 3,517 229,155 242,742
Income from equity investees 43,686 31,493 16 - 176 307 - - - 384 - - - - 87,421 2,172 131,299 34,356
Interest income 29,766 18,339 3,828 248 378 - - - 97 30 841 338 771 5 10,119 21,753 45,800 40,713
Interest expense (100,807) (81,65) (16,382) (5,177) - - - - (1,422) (740) (2,599) (2,793) (3,104) (507) (50,538) (43,716) (174,852) (134,583)
Net interest revenue (b) - - - - 32,286 - 13,181 4,146 - - - - - - - - 45,467 4,146
Depreciation and amortization (597,063) (462,515) (18,192) (5,462) (1,947) (1,871) (1,130) (1,005) (7,099) (3,436) (1,735) (732) (891) (819) (7,218) (4,750) (635,275) (480,590)
Operating income/(loss) 954,008 920,523 62,405 109,942 34,752 13,640 8,620 3,141 2,823 463 42,692 3,215 (8,321) 3,811 37,792 (11,429) 1,134,771 1,043,306
Income tax expense (279,658) (222,354) (13,515) (19,211) (9,397) (6,435) (4,894) (1,939) (1,728) (1,442) (5,294) (1,164) 274 (892) (29,391) (7,189) (343,603) (260,626)
Income/(loss) before minority interests 628,216 633,935 37,064 85,243 17,555 6,060 3,726 1,202 (239) (1,536) 30,662 3,452 (9,654) 2,169 72,518 (48,282) 779,848 682,243
Investments in affiliates 258,019 203,213 - - - - 17,749 16,518 5,100 808 - 103 - - 766,189 44,179 1,047,057 264,821
Segment assets 11,742,137 8,414,326 1,580,357 426,080803,43
2
633,7711,904,7
91 1,122,4
69 303,460106,33
9393,00
9 239,624 164,693 66,5312,701,70
4 1,884,04
8 19,593,583 12,893,188
Indebtedness (c) (3,417,379) (2,552,221) (519,737) (27,023) (1,523) (517)(350,93
8)(150,00
0) (30,956)(26,59
6)(42,017
)(33,375
) (55,089)(183,8
66)(1,286,86
1) (588,297) (5,704,500) (3,561,895)
Capital expenditures 881,182 880,712 41,266 15,469 4,670 4,575 3,354 2,145 20,642 5,982 42,540 16,093 8,953 703 4,258 55,869 1,006,865 981,548
Contact us:Victor Kurilo Head of Investor RelationsTel.: +7 495 629 2741Fax: +7 495 232 3391Email: [email protected]
Related Documents