Investor Presentation August 2011 1

Welcome message from author
This document is posted to help you gain knowledge. Please leave a comment to let me know what you think about it! Share it to your friends and learn new things together.
Transcript

Investor PresentationAugust 2011
1

Safe Harbor
This presentation and the accompanying slides (the “Presentation”), which have been prepared by Balkrishna
Industries Limited (the “Company”), have been prepared solely for information purposes and do not
constitute any offer, recommendation or invitation to purchase or subscribe for any securities, and shall not form
the basis or be relied on in connection with any contract or binding commitment whatsoever. No offering of
securities of the Company will be made except by means of a statutory offering document containing detailed
information about the Company.
This Presentation has been prepared by the Company based on information and data which the Company considers
reliable, but the Company makes no representation or warranty, express or implied, whatsoever, and no reliance
shall be placed on, the truth, accuracy, completeness, fairness and reasonableness of the contents of this
Presentation. This Presentation may not be all inclusive and may not contain all of the information that you may
consider material. Any liability in respect of the contents of, or any omission from, this Presentation is expressly
excluded.
Certain matters discussed in this Presentation may contain statements regarding the Company’s market
opportunity and business prospects that are individually and collectively forward-looking statements. Such forward-
looking statements are not guarantees of future performance and are subject to known and unknown risks,
uncertainties and assumptions that are difficult to predict. These risks and uncertainties include, but are not
limited to, the performance of the Indian economy and of the economies of various international markets, the
performance of the tire industry in India and world-wide, competition, the company’s ability to successfully
implement its strategy, the Company’s future levels of growth and expansion, technological implementation,
changes and advancements, changes in revenue, income or cash flows, the Company’s market preferences and its
exposure to market risks, as well as other risks. The Company’s actual results, levels of activity, performance or
achievements could differ materially and adversely from results expressed in or implied by this Presentation. The
Company assumes no obligation to update any forward-looking information contained in this Presentation. Any
forward-looking statements and projections made by third parties included in this Presentation are not adopted by
the Company and the Company is not responsible for such third party statements and projections.

Content
Page
A. Management 3
B. Global Markets – Local Production 8
C. Key Competitive Advantages 16
D. Growth Strategies 18
E. Financial Highlights 21
3
Off-h
igh
wa
y t
yre
So
lutio
ns

4
Management
Off-h
igh
wa
y t
yre
So
lutio
ns

Siyaram – Poddar Group
Textiles
Paper &
Textile Processing
Garments
Off-Highway
Tires
Bicycle
Tires
Balkrishna Industries Siyaram Silk Govind Rubber
INR 1,012 Crs INR 349 CrsINR 2,211 Crs
INR 3,572 Crs
Group RevenueFlagship Company of
the Group
5
* FY2011 Revenue

Balkrishna Industries…
India‟s leading exporter of “Off-Highway Tires”
Widest and comprehensive product portfolio of over 1900 SKUs
126,000 MTPA current achievable production capacity
Debottlenecking to further enhance capacity to 140,000 MTPA by Q2FY12
Market presence in more than 120 countries
Europe, America, Asia Pacific, Middle-East, ANZ etc
Exponential Revenue & Earning growth
6
7
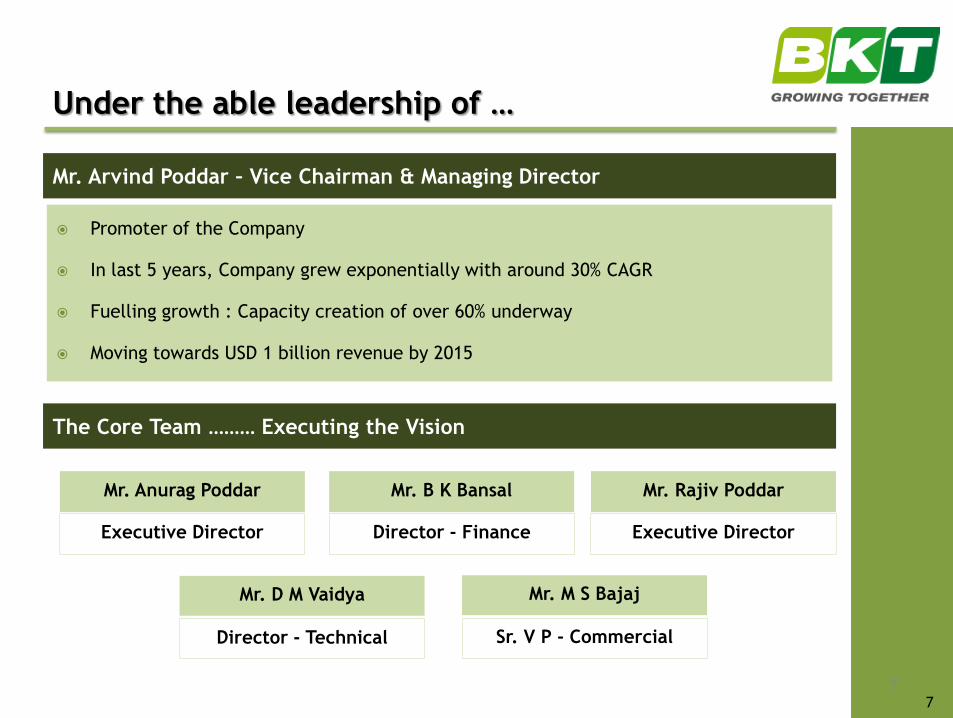
Mr. Arvind Poddar – Vice Chairman & Managing Director
Promoter of the Company
In last 5 years, Company grew exponentially with around 30% CAGR
Fuelling growth : Capacity creation of over 60% underway
Moving towards USD 1 billion revenue by 2015
Under the able leadership of …
The Core Team ……… Executing the Vision
Mr. Anurag Poddar
Executive Director
Mr. B K Bansal
Director - Finance
Mr. D M Vaidya
Director - Technical
Mr. M S Bajaj
Sr. V P - Commercial
Mr. Rajiv Poddar
Executive Director
7
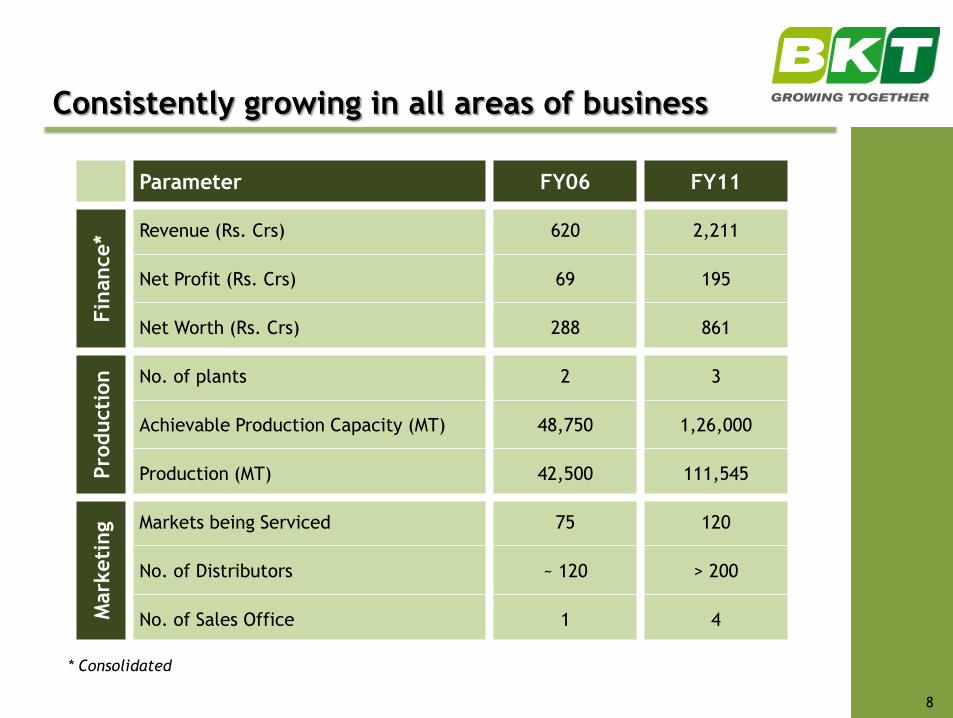
Consistently growing in all areas of business
Parameter FY06 FY11
Fin
ance* Revenue (Rs. Crs) 620 2,211
Net Profit (Rs. Crs) 69 195
Net Worth (Rs. Crs) 288 861
Pro
ducti
on No. of plants 2 3
Achievable Production Capacity (MT) 48,750 1,26,000
Production (MT) 42,500 111,545
Mark
eti
ng Markets being Serviced 75 120
No. of Distributors ~ 120 > 200
No. of Sales Office 1 4
* Consolidated
8

9
Global Markets – Local Production
Off-h
igh
wa
y t
yre
So
lutio
ns
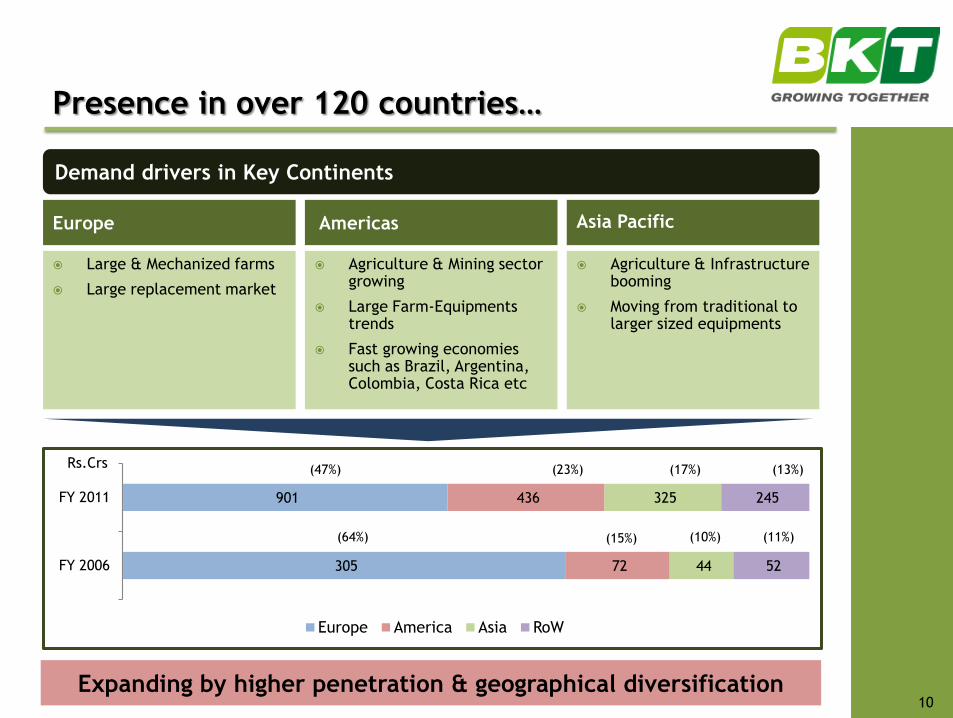
305
901
72
436
44
325
52
245
FY 2006
FY 2011
Europe America Asia RoW
Rs.Crs
Presence in over 120 countries…
Expanding by higher penetration & geographical diversification
Demand drivers in Key Continents
Europe Americas Asia Pacific
Large & Mechanized farms
Large replacement market
Agriculture & Mining sector growing
Large Farm-Equipments trends
Fast growing economies such as Brazil, Argentina, Colombia, Costa Rica etc
Agriculture & Infrastructure booming
Moving from traditional to larger sized equipments
10
(64%) (15%) (10%) (11%)
(23%) (17%) (13%)(47%)

With various “Off-Highway Tires (OHT)”…
Tires for Tractors, Trailers, Farm Equipment,
Forestry
Specifically designed as per farm requirement
Tractor Radial Tires under brand “Agrimax”
Industrial, Construction & Earth Mover tires
Tires for articulate dump trucks, loaders,
underground mines, port application
Steel Radial OTR tire under brand “ Earthmax”
Tires for Sports, Utility vehicles such as Golf-
cart, Lawn & Garden tires
Tires for All Terrain Vehicles (ATV) with
puncture resistance
One Stop -Shop for all off highway tires solution
Agri
cult
ure
(65%
)
OT
R
(29%
)
Oth
ers
(6%
)
11

Through various sales channels
Replacement Market lends stability in turbulent times
Distributors
Caters Replacement Market
Strong Global Network
Over 200 Distributors in 120 countries
Expanding market reach by
Increasing penetration of existing
distributors
Adding new distributors
Off-Take
Supplier to leading Global Tire
manufacturers - labeled under their
brand
Reaffirms Global Quality Standards
OEMs
Supplier to leading OEMs such as,
Volvo
John Deere
CNH
Class
94% Sales under „BKT‟ brand
OEMs14%
Off-take 6%
BOMAG
SAME
Ferrari
JCB
12

Existing manufacturing facilities…
State of the art tire manufacturing plants at
Bhiwadi & Chopanki in Rajasthan
Aurangabad, Maharashtra
In-house Mould Plant, Dombivali, Maharashtra
Achievable Production Capacity at 126,000 MTPA
Wide product range of over 1900 SKUs
Frequent change over in production cycle
Large Variety – low volume restricts optimal capacity utilization
Debottlenecking exercise led to Capacity enhancement
From 120,000 to 126,000 MTPA in FY11
~ Rs. 50 cr spent for capacity debottlenecking and rest for
upgrading business infrastructure
Enhance capacity of premium products like Agri-Radial & OTR Radial
Enhancing mould plant capacity
To be funded from Internal Accruals
Debottlenecking nearing completion by September 2011
To further enhance capacity to 140,000 MTPA
Nearing Optimum Utilization …..need for further capacity creation13

Greenfield expansion underway
Greenfield Expansion of 90,000 MTPA of achievable
production capacity
Location: Bhuj, Gujarat
Total estimated Capital Outlay of USD 275 mn
Funding: Debt & Internal Accruals
ECBs of USD 175 Mn -Tied-Up
Status of Project
Appointed Tata Consulting Engineers as Project Consultants for
Civil, Utilities & Co-generation plant
Construction started, major equipment order placed
Project Completion expected by Q2FY13
Year Capex Estimated
FY 2012 USD 155 mn
FY 2013 USD 95 mn
* Spent in FY11 :USD 25 mn
14Post expansion – Achievable Production Capacity of ~230,000 MTPA

Rubber sourced from
India, Indonesia, Malaysia & Thailand - Major Rubber Producing countries
Closer to Rubber producing countries gives edge over global peers
Lower logistic expenses
Flexibility in sourcing from India or Import
No impact of Import Duty being major exporter
Other materials – Synthetic Rubber, Carbon Black, Fabric & Chemicals
Derivatives of Crude Oil
15
Rubber48%
Carbon Black27%
Fabric6%
Bead Wire3%
Chemicals16%
In Volume
Key Raw materials
Raw material composition

16
Key Competitive Advantages
Off-h
igh
wa
y t
yre
So
lutio
ns

Key Competitive Advantages
• Labor intensive business, however India manufacturing leads to 1/5th labor cost compared to global peers
• Lower selling & distributing expenses due to sales by distributor network
Low Operating Cost ... v/s ... Global Peers
• Strong R&D Team for product development
• In-house mould facility leads to faster conversion
Faster Mind to Market Product Roll-out
• Maximize utilization of entire basket of 1900 SKUs
• Ensures timely execution of customer’s order
Flexible Plant Operation
• Helps production planning to achieve optimum output
• Facilitates container dispatch of varied tires
Inter- Changeability of production amongst various plants
• Largest manufacturer of full range of Radial Tractor Tires located in a low-cost region
• Globally few manufacturers with concentration in USA & Europe
• Addition of capacity makes it a preferred global partner for radial tires
The Radial Advantage
17
18
Growth Strategies
Off-h
igh
wa
y t
yre
So
lutio
ns

Sales strategy to back capacity creation
Increase penetration in current markets
• Increasing coverage through current distributors
•Appointment of new distributors to cater all segments
A
19
Increase exposure with OEMs
•Developing newer products for OEMs
•Expanding the OEMs base
B
Development of new emerging markets viz. Russia & CIS
•Demand drivers are stable economy growth & major infrastructure developments in highway, ports, mining sector
•Establishing distributor network
C
Enhancing Product Portfolio
•All Steel Radial Mining Tires
•Agri-Radial Tires
• Special Puncture-Proof Defense Tires
D

India business opportunity unfolding …
20
Presently, ~ 11% of Revenue from India
Mainly from OTR Segment
Tie-up with OEMs like JCB, Escorts, L&T Case, SDF, John Deere, CNH
Investment in Indian Infrastructure growing rapidly
Earthmoving & Construction equipment (ECE) industry to grow five fold from
USD 2.3 billion to USD 12 – 13 billion by 2015
Agriculture Sector in India witnessing transformation
India moving towards mechanized farming which improves productivity
Well positioned to capture growing India market
Tying-up with new OEMs
Establishing distribution network

21
Financial Highlights
Off-h
igh
wa
y t
yre
So
lutio
ns

Standalone - Tire Business :
Quarterly Financial Highlights
22
* Includes Rs.8 Cr Redemption Premium on FCCB
Rs. Crs Q1 FY12 Q1 FY11 FY 2011 FY 2010
Revenue 585 458 2,012 1,395
Raw Material 373 275 1213 685
Employee Expenses 17 12 55 42
Other Expenses 89 79 375 287
EBITDA 106 92 369 380
EBITDA Margin 18.10% 20.05% 18.36% 27.00%
Exchange (Gain)/Loss -0.4 4 1 18
Interest & Finance Charges 3 3 21* 19
Depreciation 20 18 74 66
PBT 83 66 275 314
Tax 27 22 89 105
PAT 56 44 186 209
PAT Margin 9.60% 9.69% 9.23% 15.00%

Standalone - Tire Business :
Balance-Sheet
23
Rs. Crs 31-Mar-11 31-Mar-10
Net Worth 832 661
Long Term Debt 34 135
Working Capital 573 329
Deferred Tax Liabilities 57 55
Total Liabilities 1,496 1,180
Net Assets 687 615
Investment 32 81
Current Assets
Inventory 410 203
Receivables 325 240
Cash & Bank Balance 11 4
Loans & Advances * 485 * 370
Current Liabilities
Creditors 215 84
Others 387 308
Net Current Assets 630 425
Total Assets 1,496 1,180
* Includes Rs.352 cr Advance Tax and TDS

Rs. Crs. FY 2007 FY 2008 FY 2009 FY 2010 FY 2011
Pro
fita
bilit
y Revenue 749 1,006 1,257 1,413 2,012
YoY Growth 46% 34% 25% 12% 42%
EBITDA 176 232 202 396 369
EBITDA Margin 23.5% 23.1% 16.1% 28.0% 18.3%
Annual Financial Highlights : Tire Business
Continuous Revenue Growth despite
global credit crisis
Margin declined mainly due to
Sudden & Exponential price hike in
input costs
Forex impact
Exceptional year for higher earning
margins mainly due to
Reversal in input costs
24
Guidance for FY 2012 : Sales of Tires ~ 130,000 - 135,000 MT

For further information, please contact:
25
Company : Investor Relations Advisors :
Balakrishna Industries Ltd.
Mr. B K Bansal, Director - Finance
www.bkt-tires.com
Strategic Growth Advisors Pvt. Ltd.
Mr. Gaurang Vasani
www.sgapl.net
Related Documents