First Half 2017 Investor Presentation July 21, 2017

Welcome message from author
This document is posted to help you gain knowledge. Please leave a comment to let me know what you think about it! Share it to your friends and learn new things together.
Transcript

First Half 2017
Investor Presentation
July 21, 2017

2
This document is strictly confidential. Any unauthorised access to, appropriation of,
copying, modification, use or disclosure thereof, in whole or in part, by any means, for
any purpose, infringes GTT’s rights. This document is part of GTT’s proprietary know-
how and may contain trade secrets protected worldwide by TRIPS and EU Directives
against their unlawful acquisition, use and disclosure. It is also protected by Copyright
law. The production, offering or placing on the market of, the importation, export or
storage of goods or services using GTT’s trade secrets or know-how is subject to GTT’s
prior written consent. Any violation of these obligations may give rise to civil or criminal
liability. © GTT, 2010-2017
Disclaimer

3
Disclaimer
This presentation does not contain or constitute an offer of securities for sale or an invitation or inducement to invest in securities in France, the
United States or any other jurisdiction.
It includes only summary information and does not purport to be comprehensive. No representation, warranty or undertaking, express or
implied, is made as to, and no reliance should be placed on, the accuracy, completeness or correctness of the information or opinions contained
in this presentation. None of GTT or any of its affiliates, directors, officers and employees shall bear any liability (in negligence or otherwise) for
any loss arising from any use of this presentation or its contents.
The market data and certain industry forecasts included in this presentation were obtained from internal surveys, estimates, reports and studies,
where appropriate, as well as external market research, including Poten & Partners, Wood Mackenzie and Clarkson Research Services Limited,
publicly available information and industry publications. GTT, its affiliates, shareholders, directors, officers, advisors and employees have not
independently verified the accuracy of any such market data and industry forecasts and make no representations or warranties in relation
thereto. Such data and forecasts are included herein for information purposes only. Where referenced, as regards the information and data
contained in this presentation provided by Clarksons Research and taken from Clarksons Research’s database and other sources, Clarksons
Research has advised that: (i) some information in the databases is derived from estimates or subjective judgments; (ii) the information in the
databases of other maritime data collection agencies may differ from the information in Clarksons Research database; (iii) while Clarksons
Research has taken reasonable care in the compilation of the statistical and graphical information and believes it to be accurate and correct,
data compilation is subject to limited audit and validation procedures.
Any forward-looking statements contained herein are based on current GTT’s expectations, beliefs, objectives, assumptions and projections
regarding present and future business strategies and the distribution environment in which GTT operates, and any other matters that are not
historical fact. Forward-looking statements are not guarantees of future performances and are subject to various risks, uncertainties and other
factors, many of which are difficult to predict and generally beyond the control of GTT and its shareholders. Actual results, performance or
achievements, or industry results or other events, could materially differ from those expressed in, or implied or projected by, these forward-
looking statements. For a detailed description of these risks and uncertainties, please refer to the section “Risk Factors” of the Document de
Référence (“Registration Document”) registered by GTT with the Autorité des Marchés Financiers (“AMF”) under No. R.17-030 on April 27,
2017 and the half-yearly financial report released on July 20, 2017, which are available on the AMF’s website at www.amf-france.org and on
GTT’s website at www.gtt.fr.
The forward-looking statements contained in this presentation are made as at the date of this presentation, unless another time is specified in
relation to them. GTT disclaims any intent or obligation to update any forward-looking statements contained in this presentation.
4
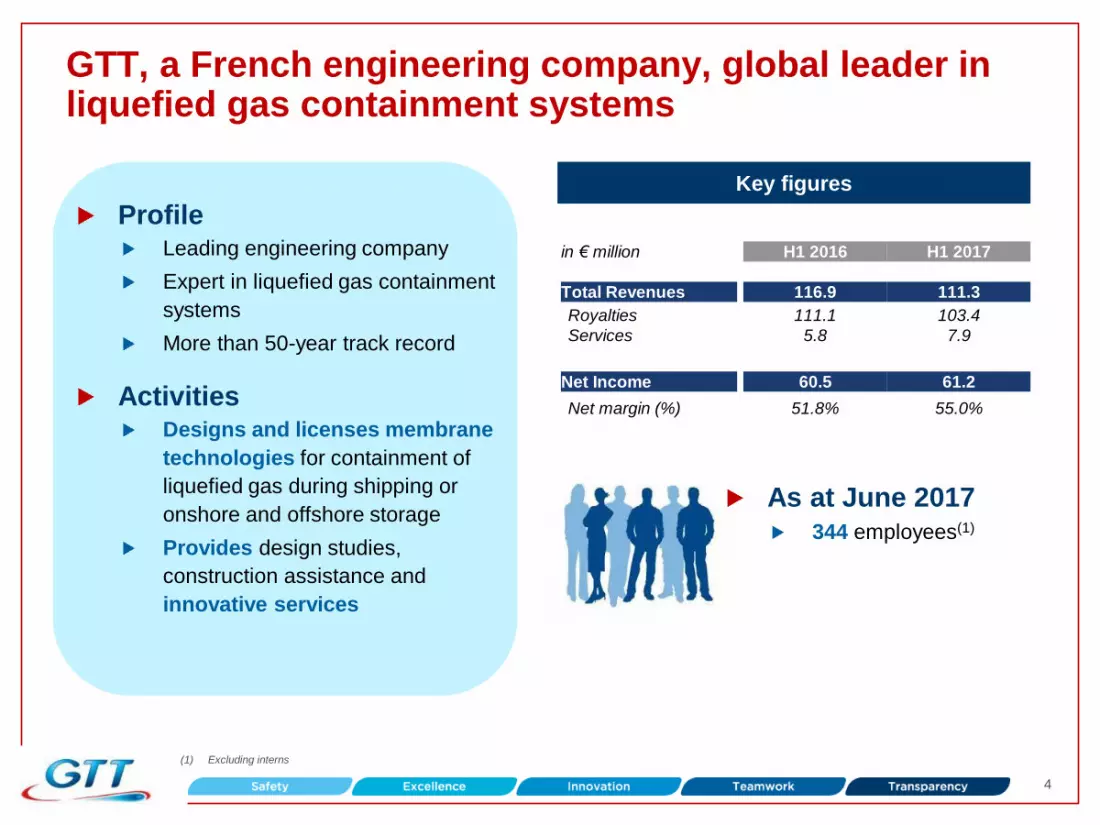
GTT, a French engineering company, global leader in liquefied gas containment systems
Key figures
Profile
Leading engineering company
Expert in liquefied gas containment
systems
More than 50-year track record
Activities
Designs and licenses membrane
technologies for containment of
liquefied gas during shipping or
onshore and offshore storage
Provides design studies,
construction assistance and
innovative services
in € million H1 2016 H1 2017
Total Revenues 116.9 111.3
Royalties
Services
111.1
5.8
103.4
7.9
Net Income 60.5 61.2
Net margin (%) 51.8% 55.0%
As at June 2017
344 employees(1)
(1) Excluding interns
5
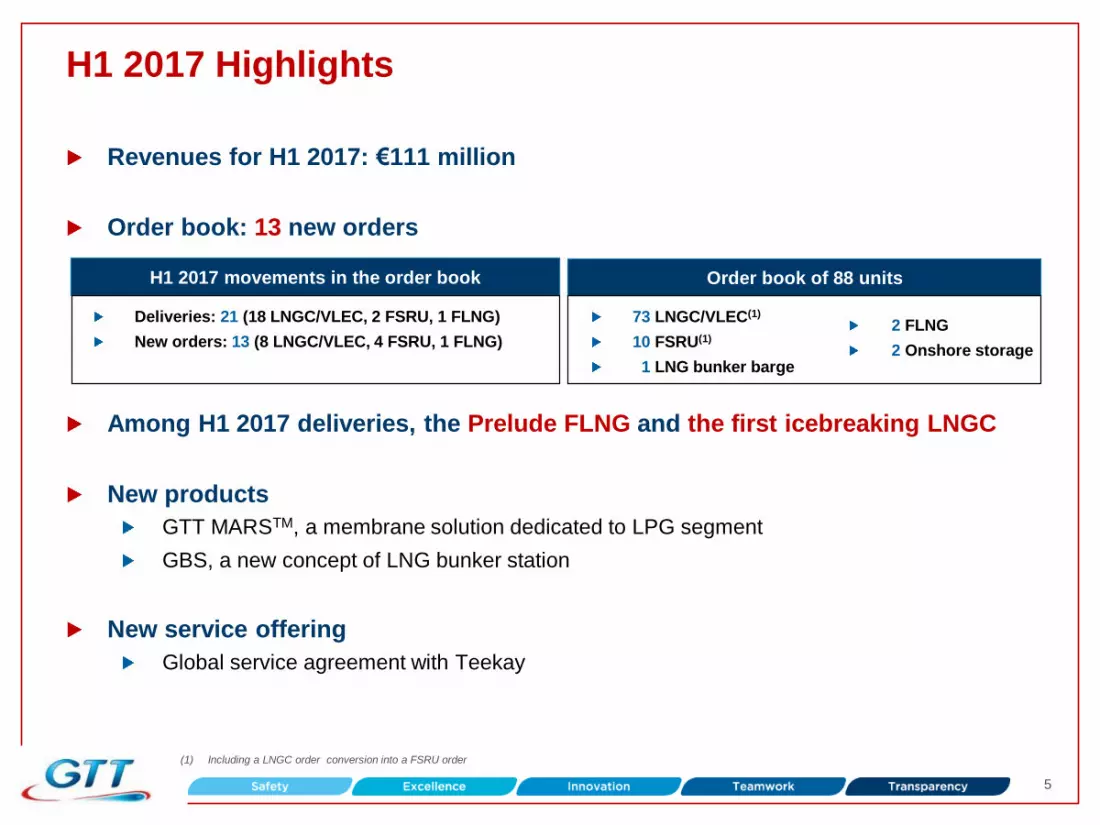
H1 2017 Highlights
Revenues for H1 2017: €111 million
Order book: 13 new orders
Among H1 2017 deliveries, the Prelude FLNG and the first icebreaking LNGC
New products
GTT MARSTM, a membrane solution dedicated to LPG segment
GBS, a new concept of LNG bunker station
New service offering
Global service agreement with Teekay
(1) Including a LNGC order conversion into a FSRU order
Order book of 88 units
73 LNGC/VLEC(1)
10 FSRU(1)
1 LNG bunker barge
2 FLNG
2 Onshore storage
Deliveries: 21 (18 LNGC/VLEC, 2 FSRU, 1 FLNG)
New orders: 13 (8 LNGC/VLEC, 4 FSRU, 1 FLNG)
H1 2017 movements in the order book

6
LNG market

7
H1 2017 LNG market: several positive signals S
UP
PLY
D
EM
AN
D
OPERATIONAL UNDER CONSTRUCTION NEW FIDs
4 new trains online / first
cargo ; +14.5 Mtpa : Gorgon
T3, MLNG T9, PFLNG 1,
Sabine Pass T3
Production / Ramping-up
lower than expected ; feed-
gas shortages and maintenance
affecting production (Australia,
T&T, …)
Coral FLNG sanctioned
(3.4 Mtpa) ; start-up in Q1
2022
Several projects catching-up
(Sabine Pass T4, Cove Point,
…)
Ichthys still behind the
schedule (~3 months
additional delay)
Fortuna (2.2 Mtpa) still
expected in 2017
Golden Pass (15.6 Mtpa)
making progress ; 2017 FID
possible
+12% demand growth vs.
2016 from Top-4 importing
countries*
Coal progressive slowdown
gaining new countries
(China, S. Korea, Spain)
2 FSRUs delivered
(Pakistan, Ghana)
4 FSRUs ordered in 2017 for
2019 delivery (all with GTT
membrane)
6 new terminals (onshore)
still expected to start in 2017
*Jan to May. YoY ; Japan, S. Korea, China, India (60% of imports in 2016)
8
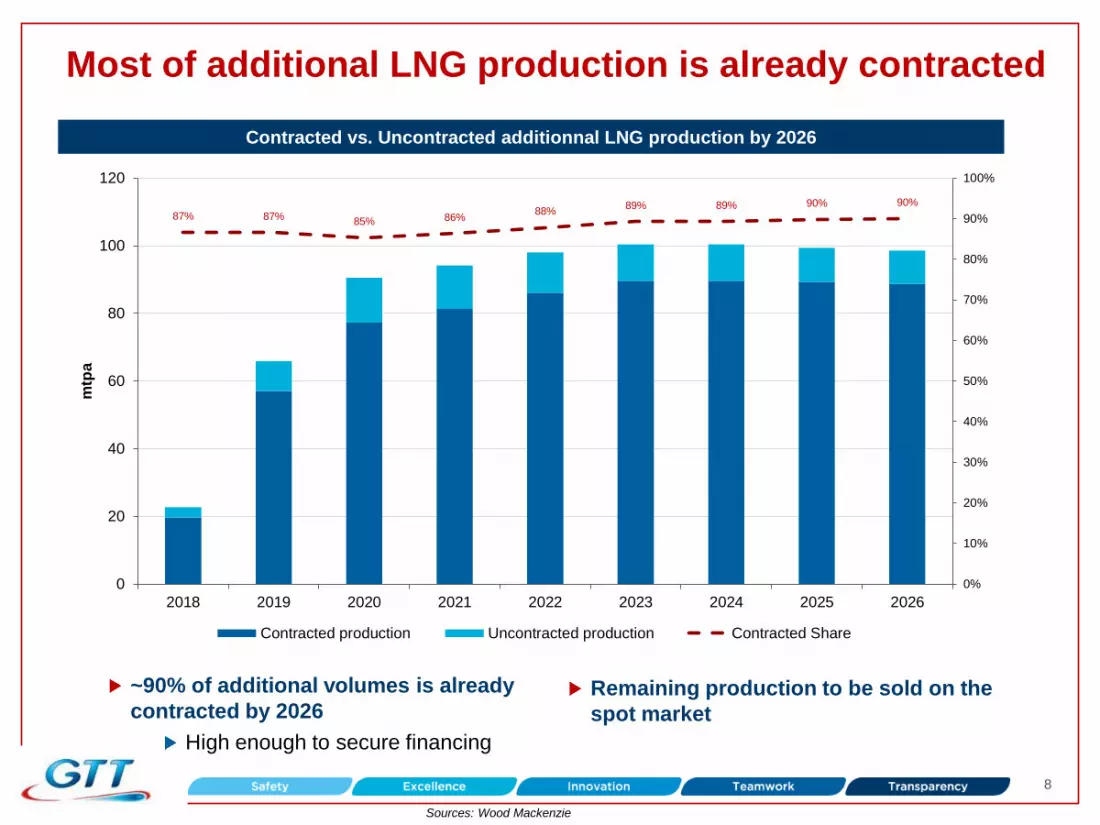
Most of additional LNG production is already contracted
~90% of additional volumes is already
contracted by 2026
High enough to secure financing
Contracted vs. Uncontracted additionnal LNG production by 2026
Sources: Wood Mackenzie
Remaining production to be sold on the
spot market
87% 87% 85% 86%
88% 89% 89% 90% 90%
0%
10%
20%
30%
40%
50%
60%
70%
80%
90%
100%
0
20
40
60
80
100
120
2018 2019 2020 2021 2022 2023 2024 2025 2026
mtp
a
Contracted production Uncontracted production Contracted Share

9
7%
15%
38%
3%
12%
0%
10%
20%
30%
40%
50%
0
10
20
30
40
50
60
70
80
Japan S. Korea China India TOTAL
mtp
a
Jan-16 to May-16 Jan-17 to May-17 Growth YoY (rhs)
Asian LNG imports growing in 2017 vs. 2016 due to structural energy mix evolution
Main sources : National Custody Agencies and Ministries ; Wood Mackenzie
Demand of top-4 LNG importing
countries (60% of imports in 2016)
grew by 12% in 2017 vs. 2016 (Jan
to May YoY), mainly due to:
Coal to Gas switch, especially in
China due to environmental
considerations and LNG
competitiveness vs. coal
Lower nuclear restart, especially in
Japan due to social and legal issues
Coal progressive slowdown in
China and South Korea expected to
strengthen in the mid/long term
Top-4 LNG importers demand comparison 2017 vs. 2016
10
20
30
40
50
60
70
$/
Mw
h*
Coal Average Europe NG China LNG
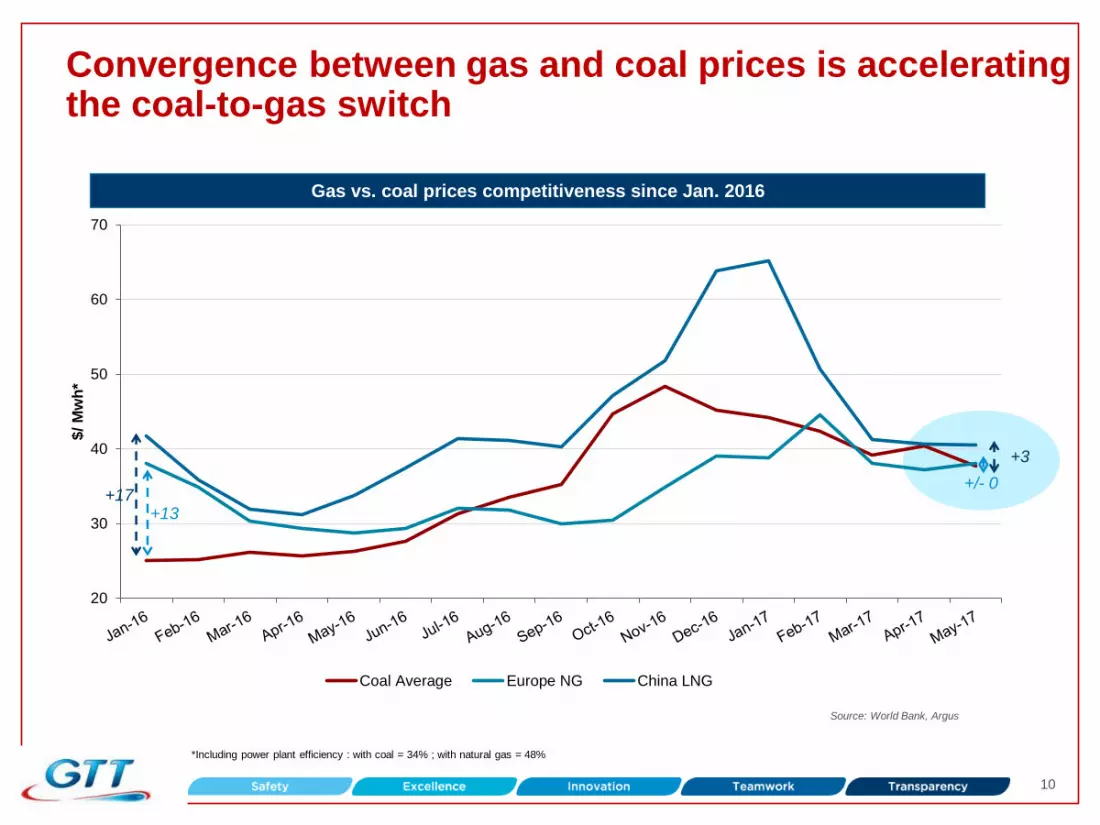
Convergence between gas and coal prices is accelerating the coal-to-gas switch
+13
+3
+/- 0
Gas vs. coal prices competitiveness since Jan. 2016
Source: World Bank, Argus
+17
*Including power plant efficiency : with coal = 34% ; with natural gas = 48%
11
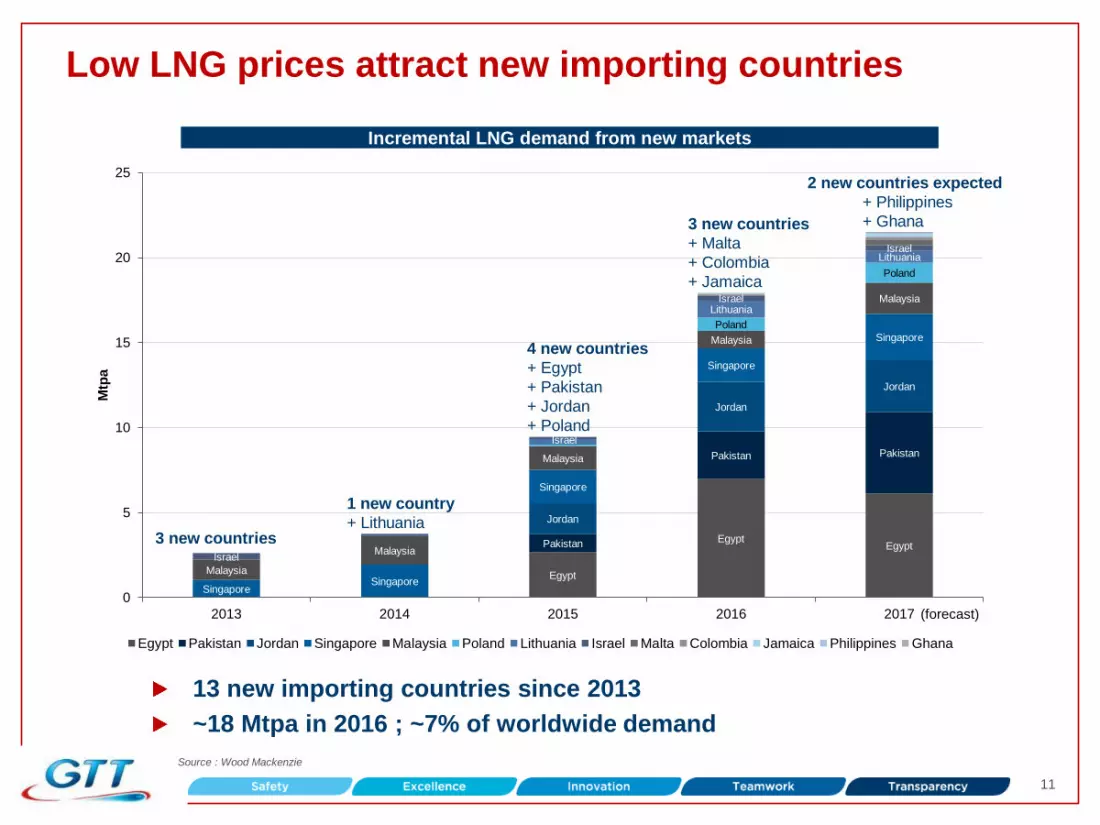
Low LNG prices attract new importing countries
Egypt
Egypt Egypt Pakistan
Pakistan Pakistan
Jordan
Jordan
Jordan
Singapore Singapore
Singapore
Singapore
Singapore
Malaysia
Malaysia
Malaysia
Malaysia
Malaysia
Poland
Poland
Lithuania
Lithuania
Israel
Israel
Israel
Israel
0
5
10
15
20
25
2013 2014 2015 2016 2017
Mtp
a
Egypt Pakistan Jordan Singapore Malaysia Poland Lithuania Israel Malta Colombia Jamaica Philippines Ghana
1 new country
+ Lithuania
4 new countries
+ Egypt
+ Pakistan
+ Jordan
+ Poland
3 new countries
+ Malta
+ Colombia
+ Jamaica
2 new countries expected
+ Philippines
+ Ghana
(forecast)
13 new importing countries since 2013
~18 Mtpa in 2016 ; ~7% of worldwide demand
Incremental LNG demand from new markets
Source : Wood Mackenzie
3 new countries
12
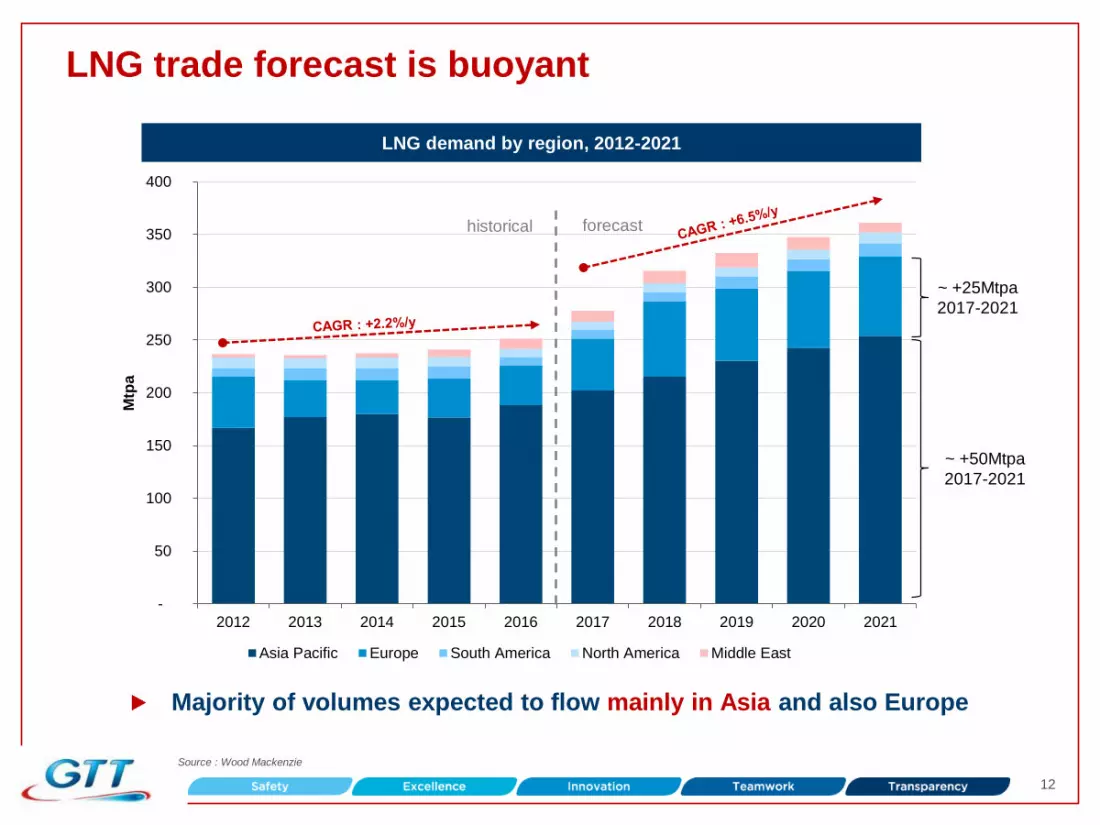
LNG trade forecast is buoyant
Majority of volumes expected to flow mainly in Asia and also Europe
Source : Wood Mackenzie
-
50
100
150
200
250
300
350
400
2012 2013 2014 2015 2016 2017 2018 2019 2020 2021
Mtp
a
Asia Pacific Europe South America North America Middle East
LNG demand by region, 2012-2021
historical forecast
~ +25Mtpa
2017-2021
~ +50Mtpa
2017-2021

13
-
50
100
150
200
250
300
350
400
450
2018 2019 2020 2021 2022 2023 2024 2025 2026 2027
mtp
a
Supply - Operationnal Supply - Under Construction Demand
LNG Supply & Demand could balance from 2021
Sources: Wood Mackenzie ; GTT Analysis
No demand adjustment
S&D balance in early 2023
New FIDs from early 2019
Demand adjustment due to low
prices and FSRUs availability
S&D balance in 2021
New FIDs from 2017
Intermediate
scenario
LNG Supply & Demand balance forecast

14
LNG Shipping
15
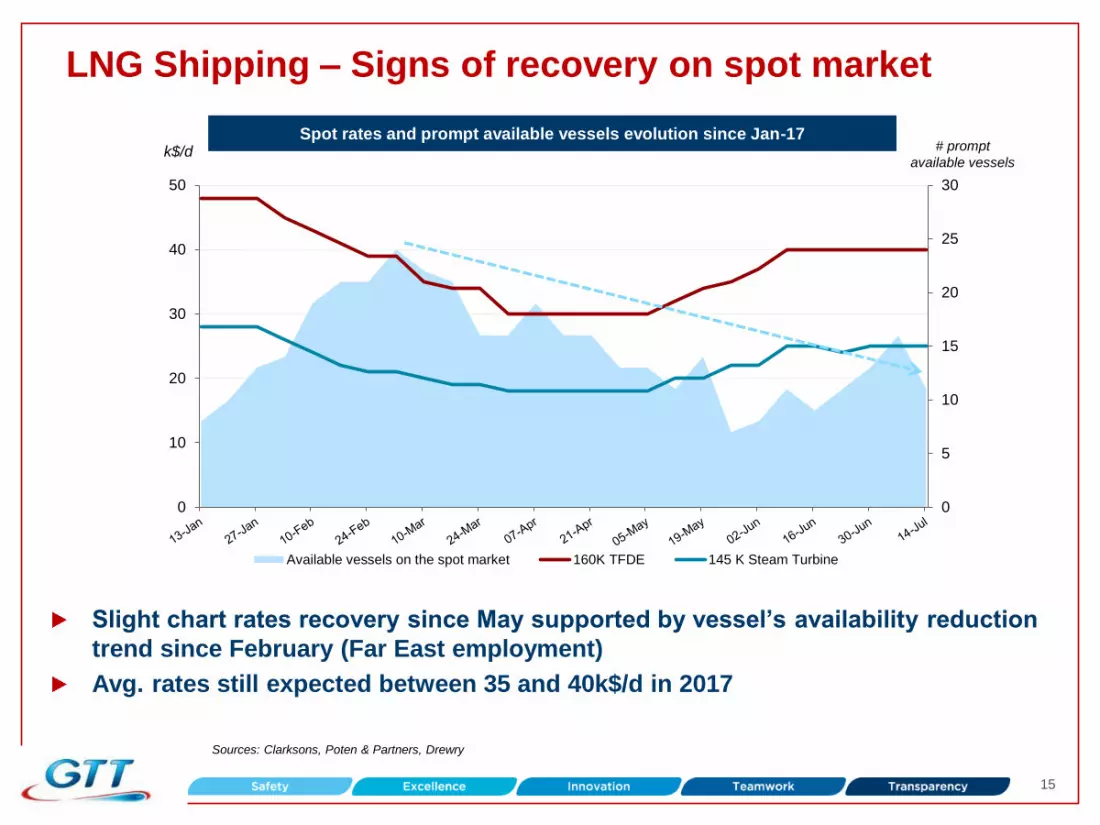
LNG Shipping – Signs of recovery on spot market
Slight chart rates recovery since May supported by vessel’s availability reduction
trend since February (Far East employment)
Avg. rates still expected between 35 and 40k$/d in 2017
k$/d # prompt
available vessels
Spot rates and prompt available vessels evolution since Jan-17
Sources: Clarksons, Poten & Partners, Drewry
0
5
10
15
20
25
30
0
10
20
30
40
50
Available vessels on the spot market 160K TFDE 145 K Steam Turbine

16
Global LNG Shipping – Increase in shipping intensity
Slight growth trend of bcm.miles/ship since January 2016, partly due to first
US exports at Sabine Pass
+15% of avg. bcm/miles/ship in 2017 vs. 2016 (Jan. to May)
Wait & see attitude linked to US FOB contracts may finally give way to a
market recovery
Jan. to May avg.
200
250
300
350
400
450
Jan-16 Feb-16 Mar-16 Apr-16 May-16 Jun-16 Jul-16 Aug-16 Sep-16 Oct-16 Nov-16 Dec-16 Jan-17 Feb-17 Mar-17 Apr-17 May-17
Sources: GTT Analysis, IHS Mint, Clarksons
Bcm.miles/month/ship Bcm.miles monthly evolution since Jan-16

17
c.50 LNGC orders expected from under construction projects
Main sources : GTT analysis, Wood Mackenzie, Clarksons
Project ahead of schedule or catching-up Project behind schedule or slowing-down
Most liquefaction projects under
construction expected to start-up in
time
c.50 LNGCs to order to lift additional
volumes
Vessels to be ordered by 2018-2019
(3 years construction time)
Downside risks:
LNG contracts swapping (shorter routes)
Start-up delays and/or slow ramp-up
Spot vessels utilization as a bridging
solution (e.g. Gail)
Extensive use of under-used less efficient
vessels
Wide majority of 2016 and 2017
LNGC 13 orders were dedicated to
under construction projects
Still some speculative orders
reflecting a short/mid term market
high confidence
Projects associated with 2016 – 2017 LNGCs orders
Note : All LNGCs numbers normalized to 164.4k cbm net capacity (174k gross)
LNGC requirement for under construction liquefaction projects
Project Location Forecasted
Start-Up
Total Capacity
(Mtpa)
LNGC
requirement
Wheatstone LNG T1 Australia Q3-17 4.5 4
Sabine Pass Export Phase 2 - T4 USA Q3-17 4.5 11
Yamal LNG T1 Russia Q4-17 5.5 10
Sengkang LNG Indonesia Q4-17 0.5 0
Cove Point Export USA Q4-17 5.3 6
Prelude FLNG Australia Q2-18 3.6 3
Cameroon GoFLNG Cameroon Q2-18 2.2 5
Wheatstone LNG T2 Australia Q3-18 4.5 4
Ichthys Australia Q3-18 8.9 7
Cameron LNG Export T1 USA Q3-18 5.0 12
Yamal LNG T2 Russia Q4-18 5.5 10
Cameron LNG Export T2 USA Q4-18 5.0 12
Elba Island LNG Export USA Q4-18 2.5 5
Freeport T1 USA Q4-18 5.1 13
Corpus Christi LNG T1 USA Q1/Q2-19 4.5 8
Sabine Pass Export Train 5 USA Q2-19 4.5 11
Freeport T2 USA Q2-19 5.1 14
Corpus Christi LNG T2 USA Q2-19 4.5 8
Cameron LNG Export T3 USA Q3-19 5.0 12
Yamal LNG T3 Russia Q3-19 5.5 10
Freeport T3 USA Q4-19 5.1 6
Tangguh Phase 2 Indonesia Q4-20 3.8 2
PETRONAS FLNG 2 Malaysia Q4-20 1.5 1
Coral LNG Mozambique Q1-22 3.4 6
177.3
115.3
10.3
51.7
TOTAL
- Current Orderbook
- Overcapacity (= Laid Up & Idle vessels < 30 years old)*
Expected orders
* Vessels available on the spot
market no to be considered here

18
H1 2017 Activity

19
Core business and adjacent markets
LNGC/VLEC80%
FSRU12%
FLNG1%
Services7%
GTT order estimates over 2017-2026 GTT H1 2017 Sales
LNGC: between 235 and 255 units
Already 8 orders secured during H1 2017
FSRU: between 30 and 40 units
Already 4 orders secured during H1 2017
FLNG: between 5 and 10 units
Already 1 order secured during H1 2017
Onshore tanks: between 5 and 10 units
Courtesy of Excelerate Energy Courtesy of Shell
20
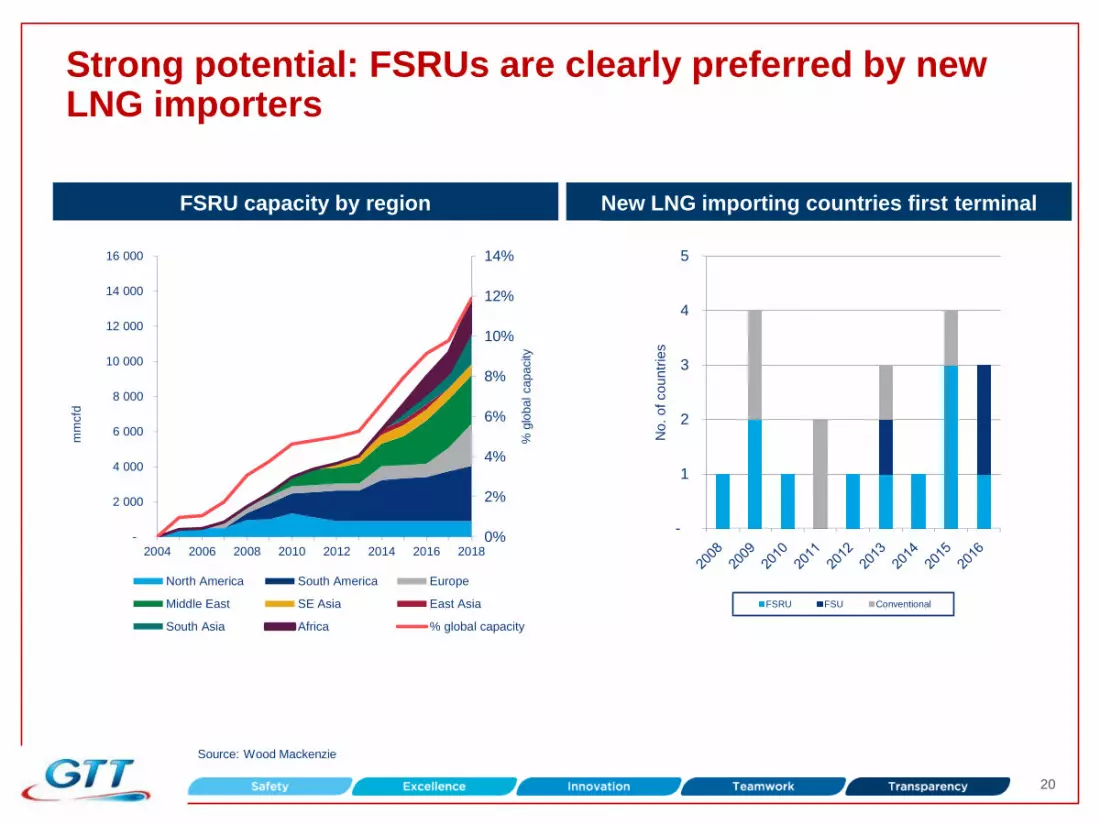
Strong potential: FSRUs are clearly preferred by new LNG importers
Source: Wood Mackenzie
New LNG importing countries first terminal FSRU capacity by region
0%
2%
4%
6%
8%
10%
12%
14%
-
2 000
4 000
6 000
8 000
10 000
12 000
14 000
16 000
2004 2006 2008 2010 2012 2014 2016 2018
% g
lobal capacity
mm
cfd
North America South America Europe
Middle East SE Asia East Asia
South Asia Africa % global capacity
-
1
2
3
4
5
No.
of countr
ies
FSRU FSU Conventional

21
426 426
100
300
500
As at Dec 31, 2016,on 2017-2021
As at June 30, 2017,on 2017-2021
216
160
46
4
223208
80
153
0
100
200
300
2017 2018 2019 2020 2021
As at Dec 31, 2016 As at June 30, 2017
38
32
21
4
37 35
28
8
10
20
40
2017 2018 2019 2020 2021
As at Dec 31, 2016 As at June 30, 2017
Revenues from current order book
Order book in units
In €M
9688
30
60
90
120
As at Dec 31, 2016 As at June 30, 2017
Order book by year of delivery (units per year)
Order book overview
Order book in value
In €M
In units In units
(1) 2017 deliveries include 21 vessels delivered until June 30, 2017 / Delivery dates could move according to the shipyards/EPCs’ building timetables.
(2) Taking into account 2017 H1 revenues from royalties (€103M), the total amount would have been €529M (3) 2017 H1 revenues from royalties. (4) 2017 H1 deliveries
(1)
120
103(3)
(2)
16
21(4)

22
Strategy and activity: expand innovative services
GTT ON SITE
Technical assistance
maintenance & repair
TAMI
Thermal camera
for secondary membrane inspection
TIBIA
Inspection tool
for FLNG inspection
MOON
MOtorized
BalloON
for primary
membrane inspection
SUPPLIERS’ APPROVAL
Materials quality
TRAINING
Training tool
for LNGC
crew members
SLOSHIELD
Sloshing
prediction &
monitoring
system
HEARS
Hotline Emergency
Assistance &
Response
Service
LNG Advisor
Boil-off Gas
monitoring
system
STUDIES
PRE-PROJECT
Vessel modification
feasibility studies
front end engineering
Advisory and optimisation services Intervention services
Test Software Large range of services to support ship-
owners and oil & gas companies
G-SIM
LNG cargo
management
simulator
GLOBAL AND
CUSTOMIZED
SERVICE
OFFERING

23
LNG as fuel & Bunkering: GTT ideally positioned to take full benefit of expected market development
Fuel prices spread narrowing since 2014
favouring small-mid vessels projects
(‘000 cbm LNG tanks)
Larger vessels market (>10,000 cbm LNG
tanks) expecting better price environment
to see major investments
GTT’s solution highly suited and
competitive for this market
Space efficiency
Cost
Weight
Planning
5
10
15
20
25
June 2014 June 2015 June 2016 June 2017
$/m
mb
tu
LNG NE Asia LNG NW Europe LNG US
HFO Avg. MGO/MDO Avg.
Marine fuel prices since June 2014 (delivered onboard)
Up t
o $
13/m
mbu
$4
Main sources : GTT Analysis, Argus LNG, Bunker Index
Bunkering cost hypothesis : $2/mmbtu
Liquefaction fees for US LNG : $2.5/mmbtu
HFO and MDO avg. based on Singapore, Rotterdam and Los Angeles prices
24
Financials

25
H1 2017 financial performance
Key highlights Summary financials
(2)
Decrease in revenues (-4.7%)
Revenues derived from royalties: -6.9%
Impacted by the low level of orders during 2016
Revenues from services: +36.4%
Strong margins
High level of margins (>50%)
Increase of 1.2% in EBITDA, EBIT and net income
Free Cash Flow
H1 Free cashflow impacted by working capital
movement linked to a seasonal effect (payment under
profit sharing scheme)
High cash position of €77 M (+ €13 M classified in
financial assets)
Interim dividend: 1.33€ per share to be paid in
September 2017
(1) Defined as EBIT + the depreciation charge on assets under IFRS
(2) Defined as EBITDA - capex - change in working capital
(3) Defined as December 31 working capital – June 30 working capital
(4) Defined as trade and other receivables + other current assets – trade and other payables – other current liabilities
In € M H1 2016 H1 2017 Change
Total Revenues 116.9 111.3 -4.7%
EBITDA(1) 73.7 74.6 +1.2%
Margin (%) 63.1% 67.0%
Operating Income 72.1 73.0 +1.2%
Margin (%) 61.7% 65.6%
Net income 60.5 61.2 +1.2%
Margin (%) 51.8% 55.0%
Free Cash Flow(2) 42.0 64.5 +53.6%
Change in Working
Capital(3) 30.5 8.8 nm
Capex 1.2 1.3 +10.0%
Dividend paid 50.4 49.3 -2.2%
in € M 31/12/2016 30/06/2017
Cash Position 73.4 77.3 +1.2%
Working Capital
Requirement(4) 18.9 27.8 +46.8%

26
Cost base
GTT operational costs Key highlights
External costs
Down 11% mainly due to a decrease in
subcontracted tests and studies and in legal fees
-1pt in % of sales
Staff costs down 2% due to a decrease in staff
count
A cost base offering a high operating leverage
GTT H1 2017 costs by nature
External costs
46%
in € M H1 2016 H1 2017 Change
(%)
Cost of sales (1.4) (0.9) -12%
% sales (1%) (1%)
Subcontracted Test
and Studies (8.7) (7.1) -18%
Rental and
Insurance (2.7) (2.7) +3%
Travel Expenditures (4.4) (4.0) -9%
Other External
Costs (5.0) (4.7) -7%
Total External
Costs (20.7) (18.5) -11%
% sales (18%) (17%)
Salaries and Social
Charges (17.6) (17.1) -3%
Share-based
payments (0.5) (0.4) -12%
Profit Sharing (3.0) (3.1) +4%
Total Staff Costs (21.0) (20.6) -2%
% sales (18%) (19%)
Other (1.6) 1.8 nm
% sales (1%) 2%
Staff costs
51%
Cost of sales
2%

27
Outlook

28
2017 Outlook confirmed
GTT revenue(1) 2017 revenue estimated in a range of €225 M to €240 M
Dividend
Payment(3)
2017 dividend amount at least equivalent to 2015 and 2016
2018 – 2019: payout of at least 80%
Net margin(2) Net margin above 50%
(1) Subject to any significant delays or cancellations in orders. Variations in order intake between periods could lead to fluctuations in revenues
(2) Excluding potential acquisition effect
(3) Subject to approval of Shareholders' meeting. GTT by-laws provide that dividends may be paid in cash or in shares based on each shareholder’s preference

29
Power barge
Thank you for your attention
Ice breaking
LNG carrier
Multigas carrier
LPG carrier
Bunker barge
Small scale LNG carrier
at import terminal Gravity-based system
FLNG
Onshore tank
LNG carrier
© S
TX
, E
ng
ie, E
xce
lera
te
FSRU

30
Appendices

31
Appendix - Sabine Pass shipping pattern rebalancing
Sabine Pass LNG Exports By Region
Most Sabine Pass production went to LatAm instead of Asia due to narrow prices
spreads between US and Europe / Asia, thus reducing expected shipping demand
Since Nov-16, winter stimulated Asian LNG demand, rebalancing shipping intensity
2.45 1.47 1.43 2.20 Shipping Intensity
(Eq. # 160k cbm / mtpa)
Sources : Chesniere Energy, Dynagas LNG Partners

32
Appendix - Gas is gaining shares versus coal to accompany economic growth in Asian countries
-6%
-4%
-2%
0%
2%
4%
6%
8%
10%
India China S. Korea Japan
2016 v
s.
2015 g
row
th i
n %
GDP (%) Energy consumption Electricity generation Coal consumption Gas consumption Nuclear consumption
Economic growth and Energy consumption of Top4 LNG importers in 2016
Sources : World Bank , BP
Gas consumption increasing in all countries, excepted in Japan due to nuclear restart since
2014 and low economic growth
Coal consumption decreasing in all countries, excepted in India ; high energy needs to
accompany strong economic growth
India still have the highest gas consumption growth
Coal to gas noticeable switch in China and South Korea

33
Appendix - Legacy LNG importers focus
Japan energy consumption evolution S. Korea energy consumption evolution
0
20
40
60
80
100
120
140
2010 2011 2012 2013 2014 2015 2016
Gas Coal Nuclear
0
20
40
60
80
100
120
140
2010 2011 2012 2013 2014 2015 2016
Gas Coal NuclearSource : BP
En
erg
y C
on
su
mp
tio
n i
n m
toe
En
erg
y C
on
su
mp
tio
n i
n m
toe
Nuclear restart threatening gas
growth Gas slowly finding its way
versus coal and nuclear

34
Appendix - New LNG importers focus
0
200
400
600
800
1 000
1 200
1 400
1 600
1 800
2 000
2010 2011 2012 2013 2014 2015 2016
En
erg
y C
on
su
mp
tio
n i
n m
toe
Gas Coal Nuclear
China energy consumption evolution
0
50
100
150
200
250
300
350
400
450
2010 2011 2012 2013 2014 2015 2016
Gas Coal Nuclear
India energy consumption evolution
Source : BP
En
erg
y C
on
su
mp
tio
n i
n m
toe
Coal to gas switch, with an important
future potential
Coal is still largely supporting India’s
solid economic growth

35
Appendix – Japan thermal power plants focus
57
77
4
6
3
2
38
-
20
40
60
80
100
120
Coal Gas Nuclear
# p
lan
ts
Operational Under construction Approved Bid process Planned
Frozen Stopped Mothballed Cancelled
39 663
71 009
3 368
2 621
2 100
2 650
-
36 284
-
10 000
20 000
30 000
40 000
50 000
60 000
70 000
80 000
90 000
100 000
Coal Gas Nuclear
MW
Operational Under construction Approved Bid process Planned
Frozen Stopped Mothballed Cancelled
Source : Enerdata
Thermal power plants status in Japan (# of plants and MW installed)

36
Appendix - LNGCs
Vessel equipped for transporting LNG
Existing GTT fleet: 318 units(1)
In order: 73 units
21 construction shipyards under license
GTT order estimates over 2017-2026:
235-255 units(2)
80.4%
% sales(3)
H1 2017
(1) As of June 30, 2017. Excludes vessel orders below 30,000 m3.
(2) Including orders received in H1 2017.
(3) Including ethane carriers.
Our strengths
Technological leadership, boil-off divided by 2 in the last 5 years
Long term industrial partnerships with major shipyards
A unique position in the LNG ecosystem, nurtured by 50 years of experience,
expertise and customer orientation
Our core business

37
Appendix - FSRUs
Main drivers
New buyers
Competitive advantage vs. land-
based terminals
Better acceptability
Reduced construction time / availability
Flexibility / no upfront capex
Adapted to more volatile LNG prices
Stationary vessel capable of loading,
storing and re-gasifying LNG
Existing GTT fleet: 20 FSRU(1)
In order: 10 units
GTT order estimates over 2017-2026:
30-40 units(2)
The solution for emerging countries
11.5%
% sales
H1 2017
GTT key advantages
Competitive cost
Volume optimisation
High return of
experience
(1) As of June 30, 2017.
(2) Including orders received in H1 2017
Courtesy of Excelerate Energy

38
Appendix - FLNGs
Main drivers
Monetisation of stranded offshore gas
reserves
Better acceptability (no NIMBY syndrom)
Floating unit which ensure treatment
of gas, liquefy and store it
Existing GTT fleet: 2 units(1)
In order: 2 units
GTT order estimates over 2017-2026:
5-10 units(2)
The new frontier of the LNG world
0.9%
% sales
H1 2017
GTT key advantages
Extended amortization perspectives
Deck space available for
liquefaction equipment
More affordable cost
(1) As of June 30, 2017.
(2) Including one order received in H1 2017.
Courtesy of Shell

39
Appendix - LNG as fuel & Bunkering: GTT initiatives
Main drivers
Regulatory framework (2020 IMO
sulphur cap + local initiatives)
Large world fleet of merchant ships
(around 27,000 large and highly
consuming vessels(1))
GTT key advantages
Long expertise
Cooperations with stakeholders
(owners, designers, OEMs…)
SEA/LNG intitiative
License agreements with outfitters
(AG&P and Endel)
Know-how in both LNG as a fuel for
vessel propulsion and LNG supply chain
Gravity Based System (GBS)
Developed by ACCIONA Industrial and GTT
Can be installed in ports or remote areas
without the need for additional infrastructure
Offers significant cost savings
A new
concept of
LNG bunker
station
(1) Source: Clarksons, GTT estimates / including bulkers, tankers ,
containerships and ferries
Fully participate in the energy transition of the shipping industry
Examples of GTT solution
offering
Container ship offer
Both retrofit or
new built
Easy to install
Reduced
planning
impact
(few weeks)

First Half 2017
Investor Presentation
July 21, 2017
Related Documents