Investor Presentation April 4, 2018

Welcome message from author
This document is posted to help you gain knowledge. Please leave a comment to let me know what you think about it! Share it to your friends and learn new things together.
Transcript

Investor Presentation April 4, 2018
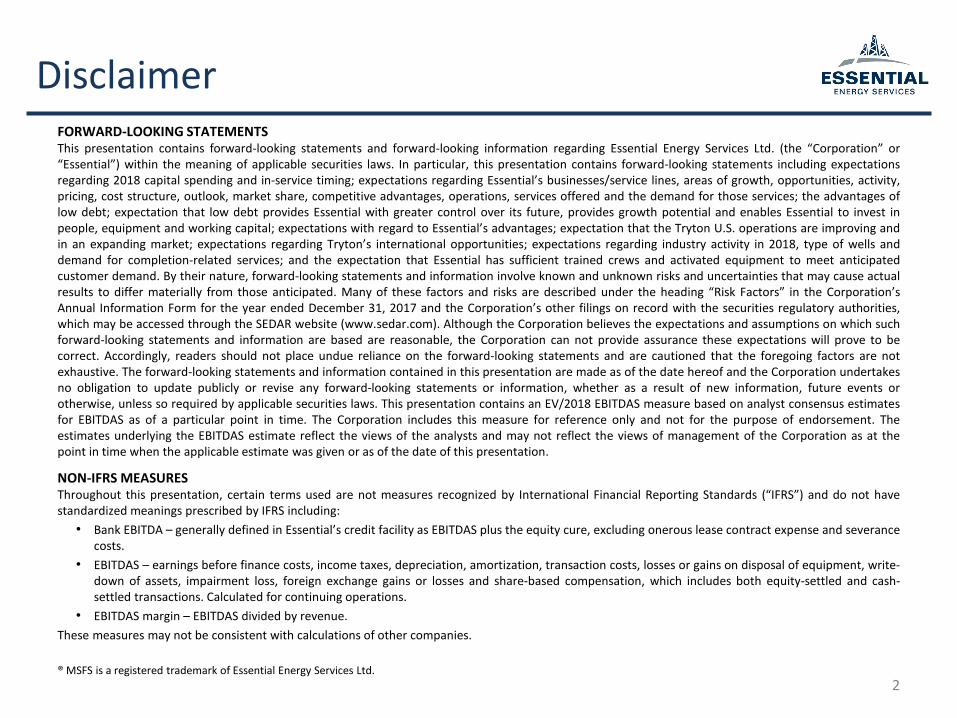
DisclaimerFORWARD-LOOKING STATEMENTS This presentation contains forward-looking statements and forward-looking information regarding Essential Energy Services Ltd. (the “Corporation” or“Essential”) within the meaning of applicable securities laws. In particular, this presentation contains forward-looking statements including expectationsregarding 2018 capital spending and in-service timing; expectations regarding Essential’s businesses/service lines, areas of growth, opportunities, activity,pricing, cost structure, outlook, market share, competitive advantages, operations, services offered and the demand for those services; the advantages oflow debt; expectation that low debt provides Essential with greater control over its future, provides growth potential and enables Essential to invest inpeople, equipment and working capital; expectations with regard to Essential’s advantages; expectation that the Tryton U.S. operations are improving andin an expanding market; expectations regarding Tryton’s international opportunities; expectations regarding industry activity in 2018, type of wells anddemand for completion-related services; and the expectation that Essential has sufficient trained crews and activated equipment to meet anticipatedcustomer demand. By their nature, forward-looking statements and information involve known and unknown risks and uncertainties that may cause actualresults to differ materially from those anticipated. Many of these factors and risks are described under the heading “Risk Factors” in the Corporation’sAnnual Information Form for the year ended December 31, 2017 and the Corporation’s other filings on record with the securities regulatory authorities,which may be accessed through the SEDAR website (www.sedar.com). Although the Corporation believes the expectations and assumptions on which suchforward-looking statements and information are based are reasonable, the Corporation can not provide assurance these expectations will prove to becorrect. Accordingly, readers should not place undue reliance on the forward-looking statements and are cautioned that the foregoing factors are notexhaustive. The forward-looking statements and information contained in this presentation are made as of the date hereof and the Corporation undertakesno obligation to update publicly or revise any forward-looking statements or information, whether as a result of new information, future events orotherwise, unless so required by applicable securities laws. This presentation contains an EV/2018 EBITDAS measure based on analyst consensus estimatesfor EBITDAS as of a particular point in time. The Corporation includes this measure for reference only and not for the purpose of endorsement. Theestimates underlying the EBITDAS estimate reflect the views of the analysts and may not reflect the views of management of the Corporation as at thepoint in time when the applicable estimate was given or as of the date of this presentation.
NON-IFRS MEASURESThroughout this presentation, certain terms used are not measures recognized by International Financial Reporting Standards (“IFRS”) and do not havestandardized meanings prescribed by IFRS including:
• Bank EBITDA – generally defined in Essential’s credit facility as EBITDAS plus the equity cure, excluding onerous lease contract expense and severancecosts.
• EBITDAS – earnings before finance costs, income taxes, depreciation, amortization, transaction costs, losses or gains on disposal of equipment, write-down of assets, impairment loss, foreign exchange gains or losses and share-based compensation, which includes both equity-settled and cash-settled transactions. Calculated for continuing operations.
• EBITDAS margin – EBITDAS divided by revenue.
These measures may not be consistent with calculations of other companies.
® MSFS is a registered trademark of Essential Energy Services Ltd.
2
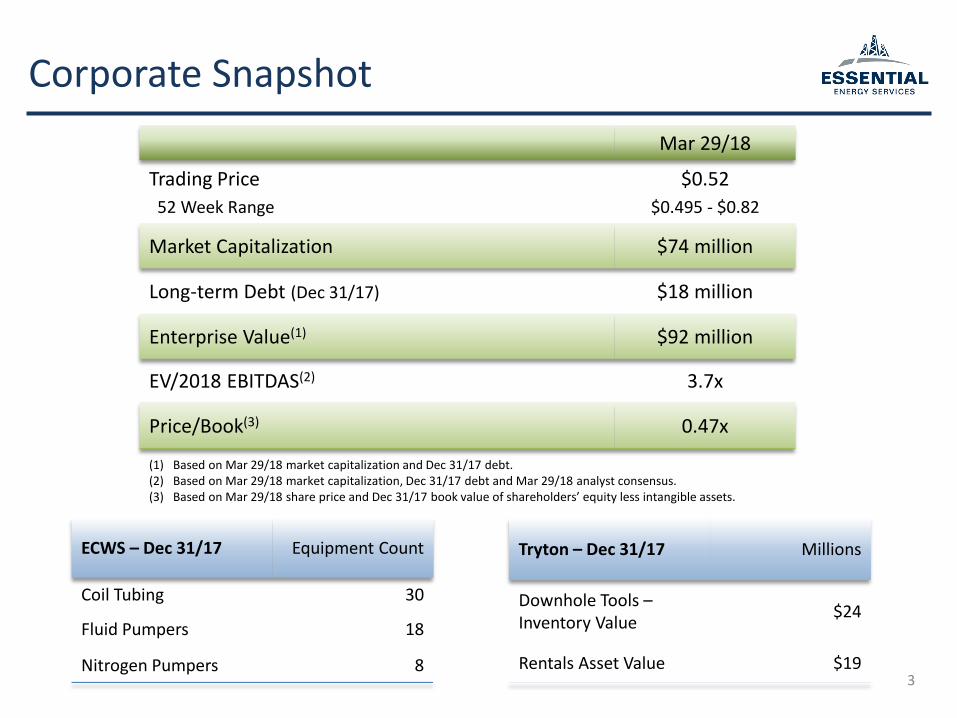
Corporate Snapshot
3
(1) Based on Mar 29/18 market capitalization and Dec 31/17 debt.(2) Based on Mar 29/18 market capitalization, Dec 31/17 debt and Mar 29/18 analyst consensus.(3) Based on Mar 29/18 share price and Dec 31/17 book value of shareholders’ equity less intangible assets.
ECWS – Dec 31/17 Equipment Count
Coil Tubing 30
Fluid Pumpers 18
Nitrogen Pumpers 8
Tryton – Dec 31/17 Millions
Downhole Tools –Inventory Value
$24
Rentals Asset Value $19
Mar 29/18
Trading Price
52 Week Range
$0.52
$0.495 - $0.82
Market Capitalization $74 million
Long-term Debt (Dec 31/17) $18 million
Enterprise Value(1) $92 million
EV/2018 EBITDAS(2) 3.7x
Price/Book(3) 0.47x

• Investment in people, equipment, working capital
• Greater control over our future; growth potential
The Essential Advantage
4
• Skilled workforce; success in recruiting
• An optimal choice to service the Duvernay, Montney, Viking and Bakken plays
• Largest deep coil tubing fleet in Canada (“ECWS”)
• An innovative tool business (“Tryton”)
Essential People
Industry Leading Equipment/Services
Low Debt
• Long-term customer relationships; diversity
• Equipment and crews for deeper, longer horizontal wells
Customers and Targeted Work
• Lean organization – manageable fixed costs
• Field compensation primarily variable payCost Control

5
Financial and Operating Results
Annual
($ millions) 2017 2016
Essential
Revenue $176 $98
EBITDAS $19 $(9)(1)
EBITDAS margin 11% (9%)
Long-term debt $18 $11
Tryton Revenue Split
MSFS® 49% 43%
Conventional Tools & Rentals
51% 57%
2017 2016
ECWS Operating Hours
Coil Tubing Rigs 48,425 32,306
Pumpers 60,857 37,022
0%
10%
20%
30%
40%
50%
60%
70%
80%
90%
TotalRevenue
ECWS Hours ECWSRevenue
TrytonRevenue
Growth – 2017 vs 2016
(1) 2016 EBITDAS includes $7 MM expense for onerous lease contract expense and severance costs.
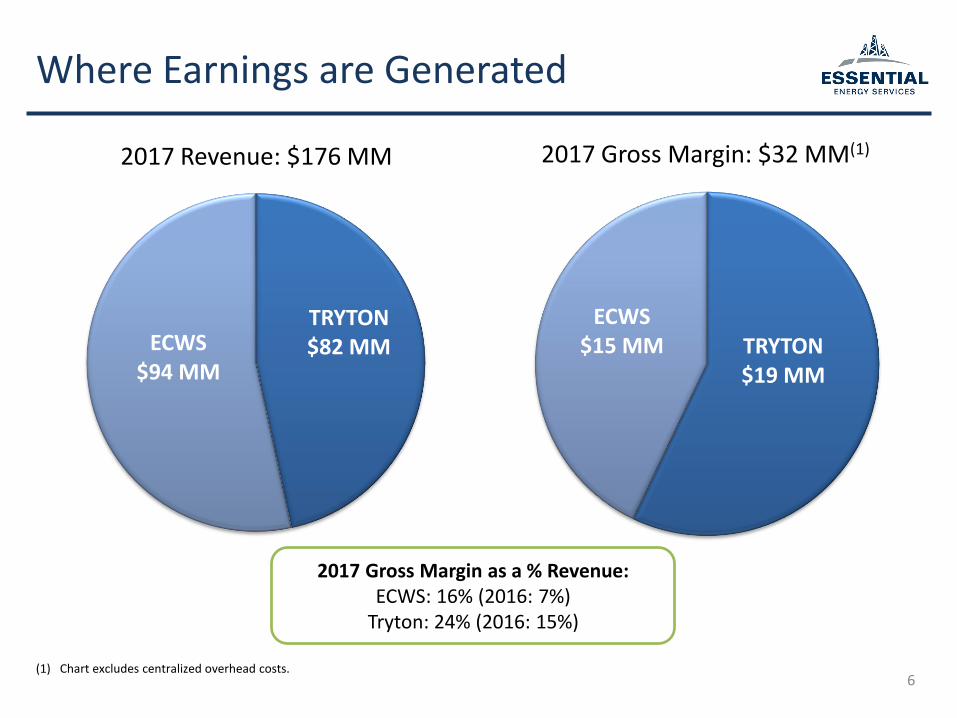
TRYTON$19 MM
ECWS$15 MM
6
Where Earnings are Generated
TRYTON$82 MMECWS
$94 MM
2017 Revenue: $176 MM 2017 Gross Margin: $32 MM(1)
(1) Chart excludes centralized overhead costs.
2017 Gross Margin as a % Revenue:ECWS: 16% (2016: 7%)
Tryton: 24% (2016: 15%)

7
Essential Revenue Diversification
0%
10%
20%
A B C D E F G H I J
% o
f R
eve
nu
e b
y C
ust
om
er
2017 2016
• In 2017 Essential completed work for 485 customers; 445 in 2016
• Top 10 customers 2017 and 2016 represent 60% of revenue
• In 2017 no single customer accounted for more than 15% of revenue

• Headcount increased 47% (103 employees) in 2017
• 58% growth in operating hours for the year (2017 vs 2016)
• Significant growth potential by activating existing equipment
• Excellent safety record
• Variable cost structure
• Pricing has remained stable since Q1/17 price increases were implemented
• Further increases are being resisted by customers
ECWS – Q4/17
8
• Activity slowed as the quarter progressed and customers completed 2017 capital budgets
• Continued demand for Gen III rigs and high rate fluid pumpers
Activity
Pricing
Competitive Advantages
Recent Accomplishments

Other 45%
Fracturing with Coil(1)
16%
Milling 39%
ECWS Job Types
9
2016
Fracturing with Coil(1)
33%
Milling 44%
Other 23%
2017
(1) Third party fracturing equipment working in conjunction with an Essential coil tubing rig. This includes fracturing through coil or annular coil fracturing with a sliding sleeve system.

• Headcount increased 33% (25 employees) in 2017
• New tools and products
• Excellent safety record
• Diverse locations, product inventory, experienced toolhands, new tool designs
• Variable cost structure
• Good Q4/17 margins despite minimal price increases
• Pricing remains stable; highly competitive
Tryton – Q4/17
10
• Q4/17 – higher activity and broader customer base vs Q4/16; good demand for MSFS® and conventional tools
• US operations – expanding markets
Activity
Pricing
Competitive Advantages
Recent Accomplishments

11
Capital Spending Overview
Annual 2018 2017 2016
($ millions) Budget Actual Actual
Growth $5 $11 $8
Maintenance 8 9 3
Total $13 $20 $11
2018 Capital Spending:• Retrofit one Gen IV coil tubing rig• Add one N2 pumper• Complete two quintuplex fluid
pumpers

12
Advantages of Low Debt
$0
$10
$20
$30
$40
$50
$60
$ m
illio
ns
Debt
Q4/14 Q4/16Q4/15 Q4/17 (1)
• Greater control over our financial future
• Stable, longer-term planning of capital spending and crewing
• Opportunistic competitive choices: service price decisions / labour enticements
• Ability to grow by re-investing operating cash flow
(1) Debt increase in 2017 is largely due to capital spending and increased working capital (increased receivables due to higher activity).
Dec 31/17: Debt to Bank
EBITDA = 0.96x

2018 Outlook
13
Industry:
• Analysts and industry associations suggest 2018 E&P spending and oilfield service activity will be similar to 2017
• Continued demand for completion-related services – longer laterals and increased frac stages per well
• WTI oil price at a good level but large WCS discount
• Natural gas glut but liquids-rich plays still attractive
Essential:
• Striving to increase market share with new/better offerings
• Service price increases not anticipated in the near term – stronger industry activity required
• Have sufficient trained crews and activated equipment to meet anticipated customer demand
Continuous Improvement

14
Growth Opportunities
Well bores and length of horizontal legs continue to be deeper and longer
• Approximately two-thirds of the coil tubing rigs are active and ready for work
o Existing deep coil tubing fleet: revenue growth potential
o Fluid pumper capacity is under-matched to coil as 90% of work is “paired”: ability to add more high-rate fluid pumpers
• Successfully transitioned to meet industry changes with latest technology
o Deep, high pressure capabilities
o Masted and conventional rigs –unique demand for each
• New composite bridge plugo Q1/18: completed two-90 stage
MSFS® jobs combining the composite bridge plug and ball & seat tools
• Evolution of our Viking sleeve system for multi-stage completionso Q1/18: completed a 53-stage job in
a single tool run
• An improving U.S. operation
• International opportunities
• Rental pipe – new opportunities for high spec, high torque drill pipe
ECWS Tryton

• EV/EBITDAS multiple low compared to sector
• Price/Book low compared to completions companies
• Enables investment in people, equipment, working capital
• Highly variable cost structure
• Multi-stage completions tools and stable conventional tool base
• Low capital intensity; historically high margins
• Completions focus
• Specialized coil well service assets for complex, long-reach horizontal wells
Why Invest in Essential?
15
Innovative Tool Business
Cost Control
Low Debt
Valuation
Industry Leading Coil/Pump Division

Supplemental InformationEssential on site near Grande Prairie
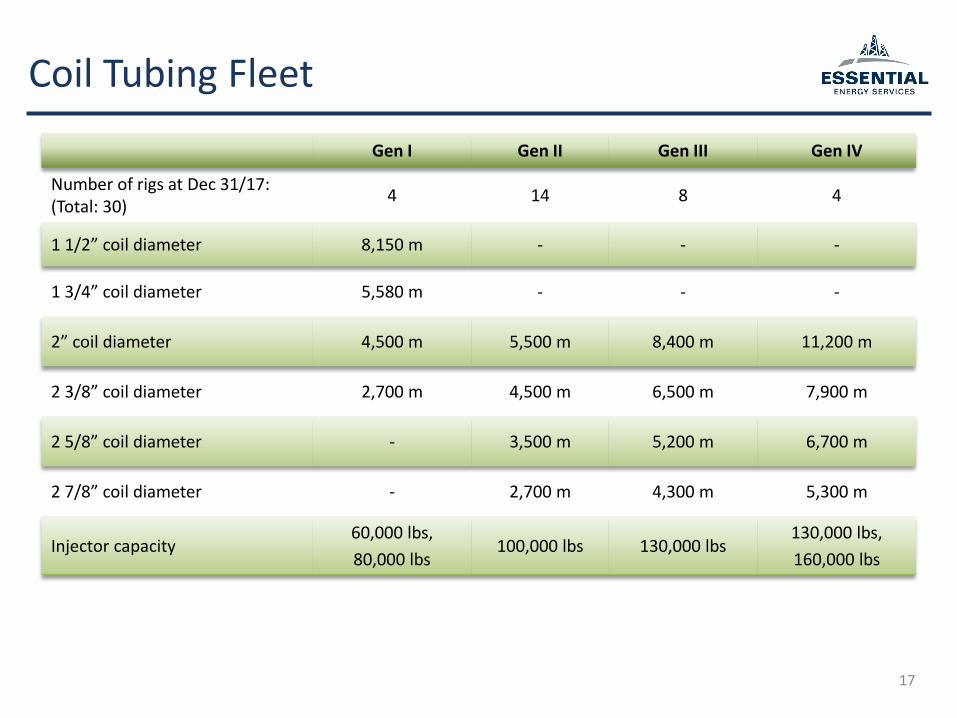
Coil Tubing Fleet
17
Gen I Gen II Gen III Gen IV
Number of rigs at Dec 31/17: (Total: 30)
4 14 8 4
1 1/2” coil diameter 8,150 m - - -
1 3/4” coil diameter 5,580 m - - -
2” coil diameter 4,500 m 5,500 m 8,400 m 11,200 m
2 3/8” coil diameter 2,700 m 4,500 m 6,500 m 7,900 m
2 5/8” coil diameter - 3,500 m 5,200 m 6,700 m
2 7/8” coil diameter - 2,700 m 4,300 m 5,300 m
Injector capacity60,000 lbs,
80,000 lbs100,000 lbs 130,000 lbs
130,000 lbs,
160,000 lbs

Deep Coil: Completions & Work-Overs
18
• The number of long-reach horizontal wells increases the demand for Essential’s coil tubing rigs
• In the well completion phase, coil tubing rigs are used for:
Pre-Fracturing
Confirmation runs
Placement of tools to isolate a portion of the well
during facturing
Fracturing
Frac-thru coil
Annular fracturing
Convey and actuate sliding sleeve tools
“Plug-and-perf” operations
Post-Fracturing
Confirmation runs
Cleanouts
Mill-out/drill-out ball and seat systems
• In the post completion phase, coil tubing rigs are used for work-overs and abandonments

Fluid Pumping Fleet
19
SingleTriplex
SingleTriplex
TwinTriplex
TwinQuintuplex(1)
Number of rigs at Dec 31/17
(Total: 18)2 1 8 7
Horsepower (hp) 1 x 600 1 x 600 2 x 6602 x 800
2 x 1,050
Pumping pressure (psi) 10,000 15,000 10,000 15,000
Fluid Pumper Uses
Maintaining downhole circulation
Providing ancillary acid or solvent treatments
Injecting friction reducers or chemicals
(1) Adding two quintuplex pumpers; expected to be delivered H1/18.
Garnet AmundsonPresident, Chief Executive Officer & Director
Karen PerasaloInvestor Relations
1100, 250 – 2nd Street SWCalgary, Alberta T2P 0C1(403) 513-7272 [email protected]
www.essentialenergy.ca
TSX:ESN
Related Documents