2018 Delmarva Investor Days Thursday, September 20, 2018 Energy Lane - Dover, DE energized … 1

Welcome message from author
This document is posted to help you gain knowledge. Please leave a comment to let me know what you think about it! Share it to your friends and learn new things together.
Transcript

2018 Delmarva Investor Days Thursday, September 20, 2018
Energy Lane - Dover, DE
energized …
1
Introduction and Welcome
22

Presentation Title Here
Forward Looking Statements
and Other DisclosuresSafe Harbor Statement: Some of the Statements in this document concerning future Company performance will
be forward-looking within the meanings of the securities laws. Actual results may materially differ from those
discussed in these forward-looking statements, and you should refer to the additional information contained in
Chesapeake Utilities Corporation’s 2017 Annual Report on Form 10-K filed with the SEC and our other SEC filings
concerning factors that could cause those results to be different than contemplated in today’s discussion.
REG G Disclosure: Today’s discussion includes certain non-GAAP financial measures as defined under SEC
Regulation G. Although non-GAAP measures are not intended to replace the GAAP measures for evaluation of
Chesapeake’s performance, Chesapeake believes that the portions of the presentation, which include certain non-
GAAP financial measures, provide a helpful comparison for an investor’s evaluation purposes.
Gross Margin (non-GAAP measure): Gross Margin is determined by deducting the cost of sales from operating
revenue. Cost of sales includes the purchased fuel cost for natural gas, electric and propane distribution operations
and the cost of labor spent on different revenue-producing activities. Other companies may calculate gross margin
in a different manner.
Adjusted EPS (non-GAAP measure): Diluted Earnings per share excluding the impact of certain significant non-
cash items, including: the timing related to mark-to-market accounting and the impact of non-recurring separation
expenses associated with a former executive.
3

Presentation Title Here
Investor Day Presentation - Discussion Areas• Welcome
• Strategy and Culture – The Keys to Our Success
– Supporting Our Culture and Growth
• Our Path Forward
• Mid-Atlantic and Midwest Energy Operations
• Florida Operations
• Regulatory Update
• Energy Marketing
• Financial Review and Outlook
• Closing Remarks
Beth Cooper, Senior Vice President and CFO
Mike McMasters, President and CEO
Beth Cooper, Senior Vice President and Chief Financial Officer
Jim Moriarty, Senior Vice President, General Counsel & Secretary (lead)
– Lou Anatrella, VP and Chief Human Resources Officer
– Vikrant Gadgil, Vice President and Chief Information Officer
– Nicole Carter, Assistant Vice President of Customer Care
– Beth Cooper, Senior Vice President and Chief Financial Officer
Mark Eisenhower, Vice President of Strategic Planning & Development
Jack Lewnard, Vice President of Business Development
Steve Thompson, Senior Vice President (lead)
– Jeff Tietbohl, Vice President Eastern Shore Natural Gas
– Aleida Socarras, Vice President
– Robert Zola, President, Sharp Energy
– Doug Ward, Vice President, Aspire Energy
Jeff Householder, President, Florida Public Utilities (lead)
– Kevin Webber, Vice President, Florida Public Utilities
– Cheryl Martin, Assistant Vice President, Florida Public Utilities
Sheri Richard, Vice President, Rates & Regulatory Affairs
Cheryl Martin, Assistant Vice President, Florida Public Utilities
Mark Eisenhower, Vice President of Strategic Planning & Development
Beth Cooper, Senior VP and CFO
Tom Mahn, Vice President and Treasurer
Mike McMasters, President and CEO
4

Strategy and Culture:
the Keys to Our Success
55

Welcome and Thank You!
- Mike McMasters, President and CEO Announcement on Monday (9/10) regarding my planned retirement in early 2019.
I am looking forward to spending time with my family and enjoying my retirement.
It has been an honor to lead Chesapeake Utilities for the past eight years and a
privilege to work with so many dedicated and hardworking colleagues during my thirty-
six years with the Company.
It will be business as usual for the coming months, so you will still hear from me
frequently as we move forward into 2019 and thereafter, as I will continue to be a
member of our Board of Directors.
Chesapeake is well positioned for the future given its established culture, successful
strategy/strategic planning process, embedded financial discipline and strong team.
Chesapeake’s consistent generation of superior earnings growth and return to
shareholders is a testimony to this foundation - culture, strategy/strategic planning
process, financial discipline and team.
6

Presentation Title Here
Building an Infrastructure for Sustainable Growth
Since 2010, the leadership team has beensignificantly expanded from 13 to 23members to manage the demands ofgrowth, position Chesapeake for futuregrowth, and ensure continuity in thedirection and culture of the Company. Theresult is a very talented team that hasconsistently executed our strategy, nurturedour culture, and produced superior returnsto shareholders.
7

Strategic Platform for Sustainable Growth
Engaged Employees
Unified Brand Strategy
Engaging Customers
Engaging with Communities
Strategic Thinking
Engagement Strategies
Provide the Strategic Infrastructure for
Sustainable Growth
Developing
New Business
Opportunities and
Executing Existing
Business Unit Growth
Results
Engagement Strategies
Maximize organic growth in existing
geographic footprint
Expand into new geographic areas
Develop additional growth across business
units
Maximize Growth in Existing Footprint
and Expand Into New Territories
Safety Awards
Top Workplace and Top Leadership Awards
Community Service Awards and Other Recognitions
Achieving top quartile growth in earnings
Achieving top quartile Total Shareholder Return
Results
Our culture of engaged, caring employees has driven our past
performance and is the foundation for our future success
8

Measuring Employee Engagement
Employee engagement is measured
by: Loyalty, Motivation and Referral.
• Loyalty – Enjoyment around job
and long-term commitment to
Chesapeake Utilities
Corporation.
• Motivation – Motivation to give
the very best at work.
• Referral – Recommendation to
others re: working at
Chesapeake Utilities
Corporation
Employees’ Description of Our Culture:
9

Energized EngagementInvesting in our culture, employees, customers, communities and governments
Investing in our culture, employees,
customers, communities, and governments.
Engagement Strategies
Reinforcing our foundation for growth by strengthening our internal and external culture
through employee and community engagement. Creating a corporate
voice – ensuring all interactions with our employees and family of
companies reflects our shared brand DNA and brand values.
Engage and connect with our communities and governments,
demonstrating communityleadership and corporate social
responsibility.
Empower and engage our employees as one Company, working in unison toward common goals and linking our people with the brand and overall strategies of our Company.
Connecting with our customers by understanding the changing expectations, competitive pressures, regulatory levers and technological innovation affecting customer needs and transforming our customer relationship from Rate Payer to Energy Partner–delivering excellent customer care.
10

Energized Engagement - Awards & Recognition
7 years - 2012, 2013, 2014,2015, 2016, 2017, 2018
Outstanding Serviceby a Major Company
American Heart Association Legacy
Sponsor
10 Safety Achievement Awards & 8 Accident
Prevention Certificates2012-2018
Eight Flags CHP PlantCHP Project of the Year
Governance Professional& Governance
Team of the Year
Engineering Innovation Award & Marketing Excellence Award
Southern Gas Association
Corporate Donorof the Year
Locator Awards
Miss Utility of Delaware
11 Consecutive YearsOf Record Earnings
Annual Report Competition Awards
2015, 2016, 2017 & 2018
Best Corporate Governance in the North American
Utilities Sector
11

Total Return is for the periods ended August 31, 2018; all other figures are for the year ended 2017
Why is Engagement Important?Because It Underlies Our Financial Performance from 2011 to 2018
Our engaged
employees have
consistently
produced
distinctively
higher levels of
earnings and
dividend growth
and total return to
shareholders.
Our culture is
different - it has
driven our past
performance and
is the foundation
for our future
success.
Source: McManus Financial – Total Returns do not include Reinvested Dividends
12

Presentation Title Here
Chesapeake Utilities Corporation’s Strategy
• Our goal is to continue generating top quartile earnings per share growth by investing
significant capital in opportunities that generate returns that equal or exceed our cost of capital.
• To accomplish this we will:
• maximize organic growth;
• expand in to new service areas;
• serve new customers; and
• provide new service offerings.
• We will also consider:
• accretive acquisitions to expand our footprint in potential growth markets;
• new energy businesses that complement our existing operations and growth strategy;
• While always operating as a customer-centric full-service energy supplier/partner/provider.
Our strategy is to consistently produce industry leading total shareholder return by profitably investing
capital into opportunities that leverage our skills and expertise in energy distribution and transmission
to achieve high levels of service and growth.
We turn aspirations into reality every day. We personally and genuinely care about each other, our
customers, the communities we serve, our investors, and our business partners.
13

Presentation Title Here
Strategic Plan ExecutionIdentifying and Cultivating Profitable Investment Opportunities
To support recent growth and position the Company for continued growth, we have:
• invested in additional business development resources to further enhance our ability to identify and cultivate growth
• expanded the depth and breadth of our officer group
• Invested in our people, systems and technology to maintain our safety, quality, and service
The $1.1 billion
in capital
expenditures
from 2011 to
2018 has been
invested in a
variety of
opportunities.$108 MM $98 MM
$195 MM
$-
$50,000
$100,000
$150,000
$200,000
$250,000
2011 2012 2013 2014 2015 2016 2017 2018
Capital Investment per Year including Acquisitions(Dollars in Thousands)
Capital Expenditures Acquisitions
14

Strategic Plan ExecutionCapital Discipline and EfficiencyPeer ROE vs. Capital Expenditures (July 2015 – June 2018)
-2%
0%
2%
4%
6%
8%
10%
12%
14%
16%
18%
20%
0% 5% 10% 15% 20% 25%
Weig
hte
d A
vera
ge
RO
E
Capital Expenditures/Total Capitalization
High Returns/High Investment
Low Returns/High InvestmentLow Returns/Low Investment
High Returns/Low Investment
CPK
ChesapeakeCPK Performance Peer GroupElectric & Combination Groups
Cap Ex ROE
CPK 23.14% 11.62%
Median 12.78% 9.40%
75th Percentile 14.75% 10.98%
Med
ian
9.4
0%
Our engaged employees have generated superior returns on proportionately higher capital investment
15

Our Culture and Strategy Drive Record ResultsEPS and Return on Equity
* Adjusted EPSand ROE
$1.82 $1.91 $1.99
$2.26$2.47
$2.72 $2.86 $2.89*
11.6% 11.6% 11.6%12.2% 12.2% 12.1%
11.3%10.5%*
0%
2%
4%
6%
8%
10%
12%
14%
16%
18%
$0.00
$0.50
$1.00
$1.50
$2.00
$2.50
$3.00
$3.50
2010 2011 2012 2013 2014 2015 2016 2017*
RO
E
Dilu
ted
EP
S
EPS ROE
• 2017 GAAP Earnings per share of $3.55 and Return on Equity of 12.6%
• 2017 Adjusted Earnings per share of $2.89 and Return on Equity of 10.5%
(after adjustment for revaluation of net deferred tax assets and liabilities for the unregulated energy businesses
and mark-to-market (“MTM”) charge for unrealized loss on hedges in the natural gas marketing business)
• Forecasted EPS growth of 17% plus in 2018 including tax reform and key projects (based upon 2017 Adjusted EPS)
16

Energized to Deliver Superior Shareholder Return Comparisons to S&P 500 and Peer Group
42.7%
75.9%81.4%
84.2%
76.5%
0%
10%
20%
30%
40%
50%
60%
70%
80%
90%
1 Yr 3 Yr 5 Yr 10 Yr 20 Yr
CPK Ranking of Annualized Shareholder Return compared to S&P 500 companies
for periods ending 8/31/18
4%
19%
17%
13%
11%
7%
22%21%
15% 13%
10%
23% 22%
19%
15%
0%
5%
10%
15%
20%
25%
30%
35%
40%
1 Yr 3 Yr 5 Yr 10 Yr 20 Yr
Annualized Shareholder Returns for Performance Peer Group
for Periods Ending 8/31/18
Median 75th Percentile CPK
Source: Bloomberg – Total Shareholder Return includes Price Appreciation and Dividends
•Chesapeake has delivered compound annual return in excess of 15% over the long-term
•Total return relative to the S&P 500 has ranked in the top quartile over the long-term
•Chesapeake ranks in the top quartile in its peer group of 12 companies for total return for all periods
17

Supporting Our Culture and Growth
1818

Corporate Depth
• Office of the General Counsel (including Legal,
Regulatory and Security) – Jim Moriarty
• Customer Care – Nicole Carter
• Information Technology – Vikrant Gadgil
• Safety, Communications and Human Resources
– Lou Anatrella
• Accounting, Finance and Investor Relations –
Beth Cooper
19

The Path Forward
2020

Presentation Title Here
Process to Oversee Growth OpportunitiesFrom Concept to Investment
21
We continue to identify and develop growth opportunities inside and outside our existing footprint. As part of that process, our Growth Council oversees the evaluation and development of strategic growth projects within the Company.
The Growth Council is the organizational entity that:
Investment
Proposals
Organic
Growth
Growing our Footprint through
M&A Transactions
Routine Capital
Expenditures
Regulated Growth
and System
Expansion Projects
Non-regulated
growth
Incremental
Growth and Expansion
in Existing Footprint
Other investment
opportunities
Serves as the “clearinghouse” for all capital investments being proposed as growth opportunities
Ensures that proposals within Growth Council Scope are evaluated and scored on a sound and consistent basis
Composition of Growth Council includes representation from strategic development, finance, legal and business units
Manage projects in incubation
Form the initial team Bring in external resources as needed Conduct periodic reviews of progress Make timely decisions on continuing or
discontinuing projects
Growth and Expansion
Beyond Existing
Footprint
Incremental
Growth and Expansion
in Existing Footprint
Growth and Expansion
Beyond Existing
Footprint
21

Presentation Title Here
Growth Council: Composition and Functions
22
Composition of Council
• Chair: Jim Moriarty, Senior Vice President
and General Counsel
• Members:
Corporate Senior Leadership
Business Units’ Senior Leadership
Regulatory Senior Leadership
Strategic Development
Analytic and Decision-making support
• Strategic Development Support
• Internal analyses
• External advisors
Project Sponsorship/ Champions
• Strategic Development Support
• Internal team from BU
• Establish and oversee a disciplined
business development process
• Put in place a process for:
Timely decisions on progressing
proposals from concept to active
projects
Ensure all proposals are assessed
in a consistent manner
Making decisions on investments in
a rigorous and consistent manner
Ongoing review and monitoring of
investments
Where necessary, “incubating
projects” until they are ready for
transition to the line BUs
Key Functions of the Growth CouncilThe Growth Council
22

Chesapeake Utilities Corporation Strategy
By Continuing to:• Maximize Organic Growth• Expand in to New Areas• Serve New Customers• Provide New Service Offerings
We will create sufficient profitable opportunities to invest capital above our fundamental growth levels and, with disciplined execution, we will meet or exceed our financial targets.
$0
$100
$200
$300
$400
$500
$600
$700
$800
$900
$1,000
2017 2018E 2018-2022E
$187 M $216 MIn M
illio
ns
$600M - $1B over 5 years;$120 M to $200 M Annually
Annual Capital Expenditures
Strategy: Our strategy is to consistently produce industry leading total shareholder return by profitably investing capital into opportunities that leverage our skills and expertise in energy distribution and transmission to achieve high levels of service and growth.
23

Presentation Title Here
Initiatives to Continue our EPS Growth
24
• To maintain or exceed our historical EPS growth rate, CPK will remain entrepreneurial.
• We will invest opportunistically, adapting to changing market fundamentals, while
remaining financially disciplined
• Some new investment opportunities may have lower near term ROE but we will achieve
continued EPS growth and long-term returns on capital investments
• Our business development teams will seek opportunities to invest capital into growth
opportunities
• Select growth opportunities being considered include: natural gas transportation
infrastructure, clean energy generation (natural gas and renewables) and propane in
new service areas
Select Growth Areas being considered
Natural Gas Transportation Infrastructure
Gas-Fired Generation
Renewables
Propane Expansions and
Start-Ups
24
Presentation Title Here
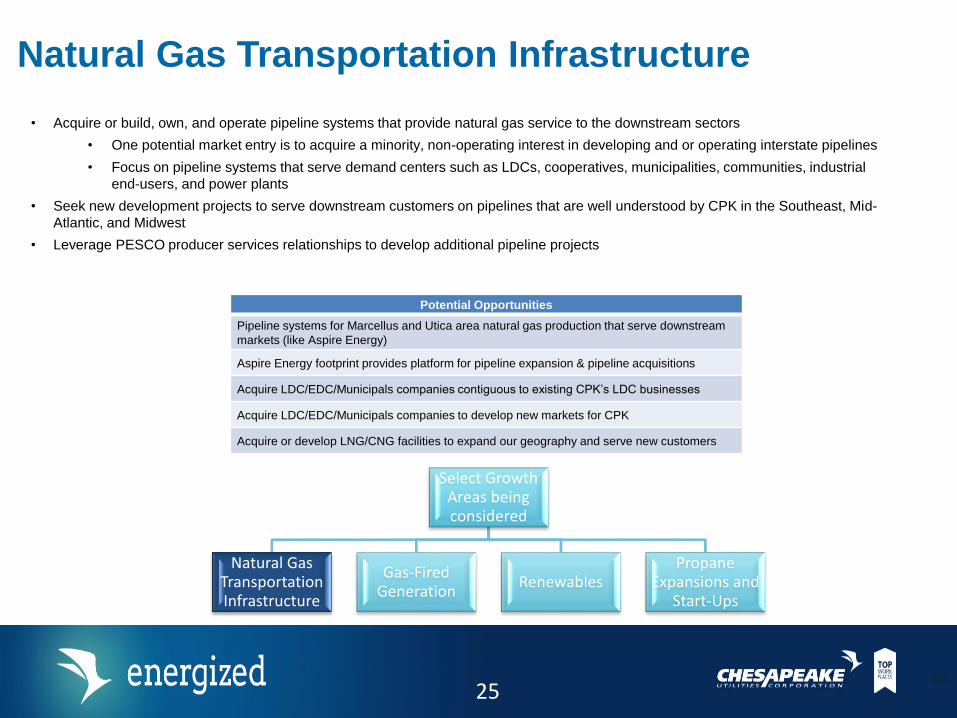
Potential Opportunities
Pipeline systems for Marcellus and Utica area natural gas production that serve downstream
markets (like Aspire Energy)
Aspire Energy footprint provides platform for pipeline expansion & pipeline acquisitions
Acquire LDC/EDC/Municipals companies contiguous to existing CPK’s LDC businesses
Acquire LDC/EDC/Municipals companies to develop new markets for CPK
Acquire or develop LNG/CNG facilities to expand our geography and serve new customers
Natural Gas Transportation Infrastructure
25
• Acquire or build, own, and operate pipeline systems that provide natural gas service to the downstream sectors
• One potential market entry is to acquire a minority, non-operating interest in developing and or operating interstate pipelines
• Focus on pipeline systems that serve demand centers such as LDCs, cooperatives, municipalities, communities, industrial
end-users, and power plants
• Seek new development projects to serve downstream customers on pipelines that are well understood by CPK in the Southeast, Mid-
Atlantic, and Midwest
• Leverage PESCO producer services relationships to develop additional pipeline projects
Select Growth Areas being considered
Natural Gas Transportation Infrastructure
Gas-Fired Generation
RenewablesPropane
Expansions and Start-Ups
25

Presentation Title Here
Clean Energy Generation – New Services & Customers
26
• Acquire or build power generation assets proximate to existing CPK infrastructure
• Preferred power generation asset would have long-term power and/or steam or other thermal requirements with customers
• Peak margin in the power market is the summer, therefore investment in this sector would offset CPK peak winter earnings seasonality
• Earnings volatility different than legacy CPK businesses
• Long-term offtake agreement could provide predictability of earnings
• Hedging eliminates the risk of margin erosion but may create short-term financial reporting volatility
• Central station generation barriers to entry are high, CPK will be more competitive on projects within existing service territory
• Pursue renewable projects that serve long-term customers
• Develop solar projects being requested by our commercial and industrial customers, before others come into our markets and provide the service
• Acquire an interest in a solar development company with a pipeline of projects and a need for capital to build and own solar projects
Potential Opportunities
Acquire or develop Combined Heat and Power projects
Acquire interest in power generation projects
Select Growth Areas being considered
Natural Gas Transportation Infrastructure
Gas-Fired Generation
RenewablesPropane
Expansions and Start-Ups
26

Presentation Title Here
Propane Expansions and Start-Ups
27
• Acquisition of propane companies to provide access to new markets with significant growth potential or additional margin if converted to natural
gas at prevailing values
• Build, own and operate distribution systems that provide propane service to new housing developments or small communities currently served by
individual tanks
• Focus on new housing developments beyond the reach and economic feasibility of natural gas service
• Identify step out areas for expanding Sharp’s Community Gas Systems
• Seek out CGS opportunities where natural gas is not available
• Provide option to convert propane customers when/if natural gas service becomes available and CPK total returns on capital for natural gas
exceeds propane
• Leverage our Autogas business to enter new markets
Potential Opportunities
Acquisition of propane company in new markets
Existing CPK service territories in DE, MD, OH, VA and FL
Identify markets outside of current footprint in areas where there is high growth and
limited or no natural gas infrastructure
Select Growth Areas being Considered
Natural Gas Transportation Infrastructure
Gas-Fired Generation
RenewablesPropane
Expansions and Start-Ups
27
Mid-Atlantic and Midwest
Energy Operations
28

Mid-Atlantic and Midwest Energy Operations
Components/
Entities Business
Regulated or
Unregulated
Eastern Shore Natural
Gas
Natural gas
transmission
Regulated
Delmarva Natural Gas • Delaware Division
• Maryland Division
• Sandpiper Energy
Natural gas distribution;
propane gas systems
being converted by
Sandpiper Energy
Regulated
Sharp Energy • Sharp CGS
• Sharp Autogas
Propane distribution Unregulated
Aspire Energy of Ohio Natural gas
transmission/supply
Unregulated
29

Eastern Shore
Natural Gas
30
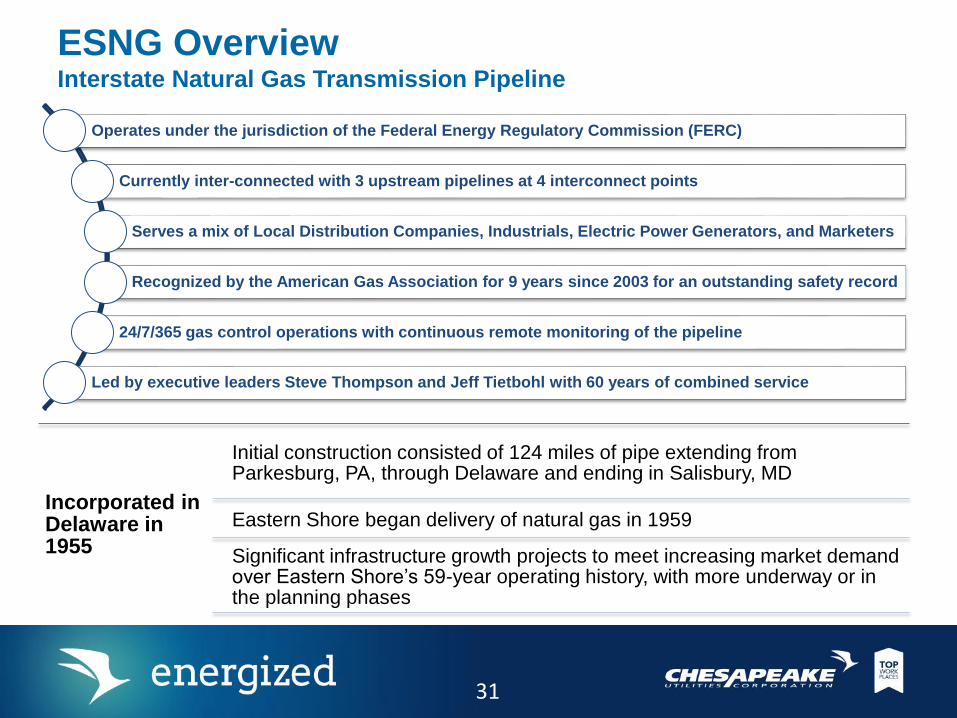
ESNG OverviewInterstate Natural Gas Transmission Pipeline
Operates under the jurisdiction of the Federal Energy Regulatory Commission (FERC)
Currently inter-connected with 3 upstream pipelines at 4 interconnect points
Serves a mix of Local Distribution Companies, Industrials, Electric Power Generators, and Marketers
Recognized by the American Gas Association for 9 years since 2003 for an outstanding safety record
24/7/365 gas control operations with continuous remote monitoring of the pipeline
Led by executive leaders Steve Thompson and Jeff Tietbohl with 60 years of combined service
Incorporated in Delaware in 1955
Initial construction consisted of 124 miles of pipe extending from Parkesburg, PA, through Delaware and ending in Salisbury, MD
Eastern Shore began delivery of natural gas in 1959
Significant infrastructure growth projects to meet increasing market demand over Eastern Shore’s 59-year operating history, with more underway or in the planning phases
31

ESNG OverviewTransmission Pipeline Infrastructure
KEY FACTS
Miles of Pipeline 457
Delivery Points96 Delivery Points within 16 Delivery Point
Areas
Compression 17,745 hp at 3 sites
Daleville, PA 4 units, totaling 6,880 hp
Delaware City, DE 6 units totaling 7,890 hp
Bridgeville, DE 3 units totaling 2,975 hp
Interconnects 4 Interconnects with 3 Upstream Pipelines
Honey Brook, PA Texas Eastern Transmission
Parkesburg, PA &
Hockessin, DETranscontinental Gas Pipeline Co.
Daleville, PA Columbia Gas Transmission, LLC
Total FT System Capacity Currently : 236,400 dts/day
Pending the completion of the 2017 Expansion Project,
approximately 40 miles of pipeline and 3,750 hp of
compression will be added to the system with total FT
System Capacity nearly 300,000 dts/day
Incorporated in Delaware in 1955
32
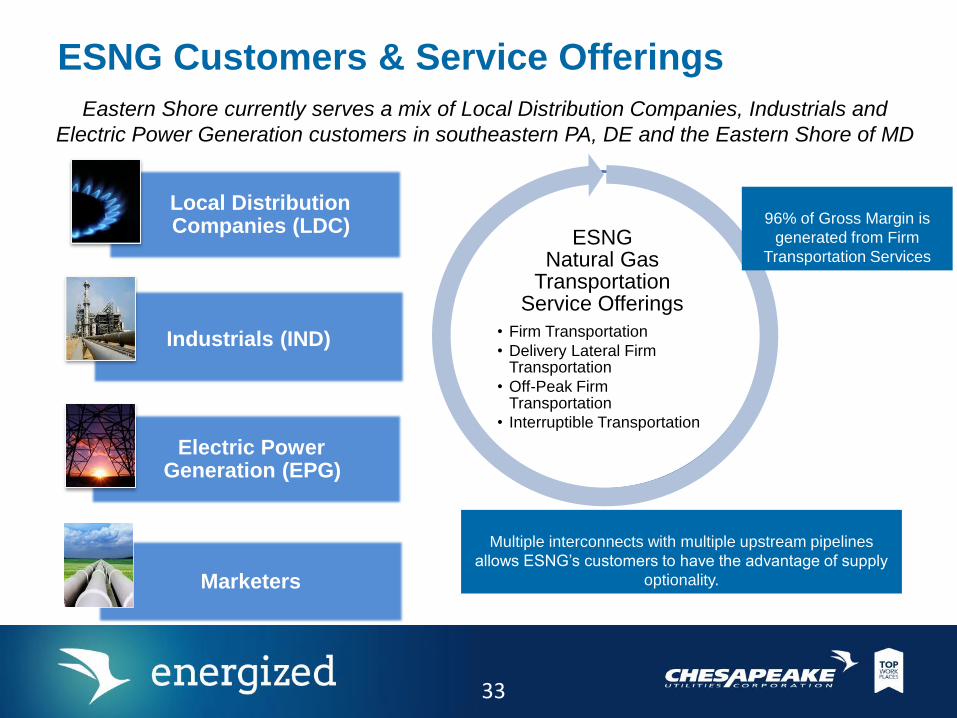
ESNG Customers & Service Offerings
Local Distribution Companies (LDC)
Industrials (IND)
Electric Power Generation (EPG)
Marketers
ESNG Natural Gas
Transportation Service Offerings
• Firm Transportation
• Delivery Lateral Firm Transportation
• Off-Peak Firm Transportation
• Interruptible Transportation
Eastern Shore currently serves a mix of Local Distribution Companies, Industrials and
Electric Power Generation customers in southeastern PA, DE and the Eastern Shore of MD
96% of Gross Margin is
generated from Firm
Transportation Services
Multiple interconnects with multiple upstream pipelines
allows ESNG’s customers to have the advantage of supply
optionality.
33

ESNG CapacityConsistent Growth
Natural Gas Availability on the ESNG System
Since the pipeline went Open Access in 1997, ESNG has more than quadrupled pipeline capacity,
adding over 180 miles of new pipeline facilities and extending natural gas service to existing and new territories.
62.3
114.0
172.9
236.2
297.6
0.0
50.0
100.0
150.0
200.0
250.0
300.0
350.0
1998 2003 2008 2014 2018
De
ka
the
rms
(in
th
ou
san
d)
Year-End Pipeline Capacity
* Projected growth
after 2017
Expansion
Project placed in-
service
(estimated 2018)
*
34

ESNG Capital Expenditures
$0
$10,000
$20,000
$30,000
$40,000
$50,000
$60,000
$70,000
2008 2009 2010 2011 2012 2013 2014 2015 2016 2017
An
nu
al
Cap
Ex (
$ in t
housands)
• Over the last 10 years, ESNG has invested $265 million in its pipeline system and related infrastructure.
• The most significant expansion and reliability projects over the last decade include connecting ESNG to the TETCO
pipeline system, White Oak Mainline, System Reliability, and currently the 2017 Expansion Project.
35
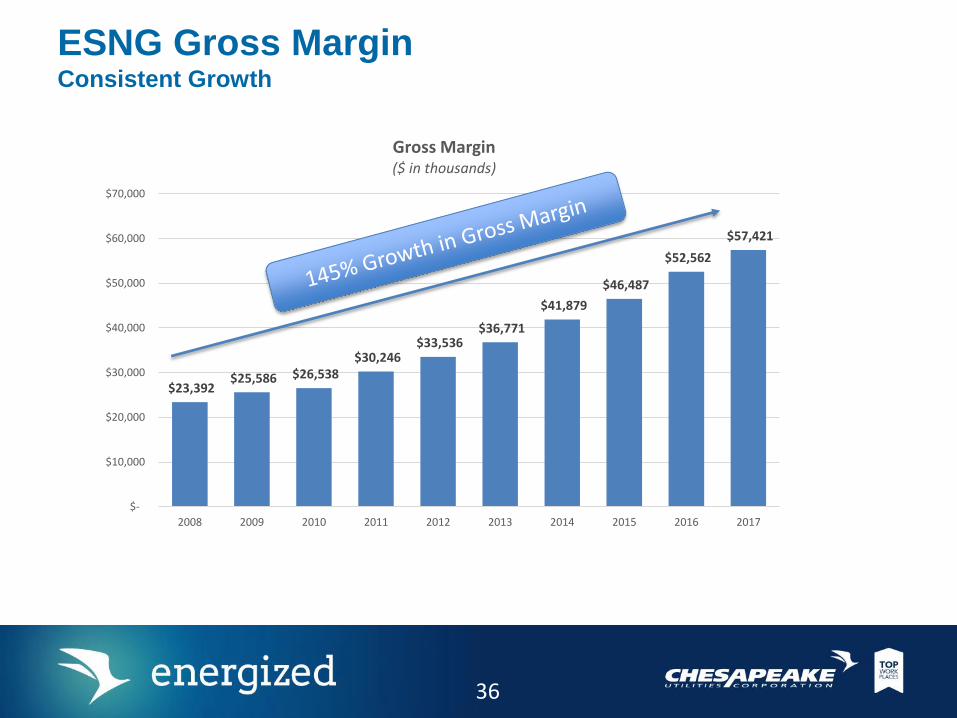
ESNG Gross MarginConsistent Growth
$23,392 $25,586 $26,538
$30,246 $33,536
$36,771
$41,879
$46,487
$52,562
$57,421
$-
$10,000
$20,000
$30,000
$40,000
$50,000
$60,000
$70,000
2008 2009 2010 2011 2012 2013 2014 2015 2016 2017
Gross Margin($ in thousands)
36

ESNG Recent Projects Continuing to Increase NG Infrastructure
• In-service March 2017
• Pipeline looping and compressor upgrades to provide transportation services for Calpine's electric generating plant in Dover, DE
White Oak Mainline
• In-service April 2017
• Additional facilities that ensure the quality of service and optimal system design and operation, benefiting all customers on ESNG's system
System Reliability
• Target In-service 2018 – Q12019
• Capacity expansion of ESNG’s existing pipeline to provide additional natural gas transportation services to several customers, ranging from local distribution companies to industrials to electric power generators
2017 Expansion Project
• Open Season Conducted: 5/16/17 – 6/6/17
• Capacity expansion
• Precedent Agreements executed with participating customers
• FERC CP application filed 9/14/18
Del-Mar Energy Pathway Project
Co
mp
lete
dIn
Pro
gres
sA
pp
rova
l Pe
nd
ing
$41MM
Capital
$38MM
$117MM
$37MM
37
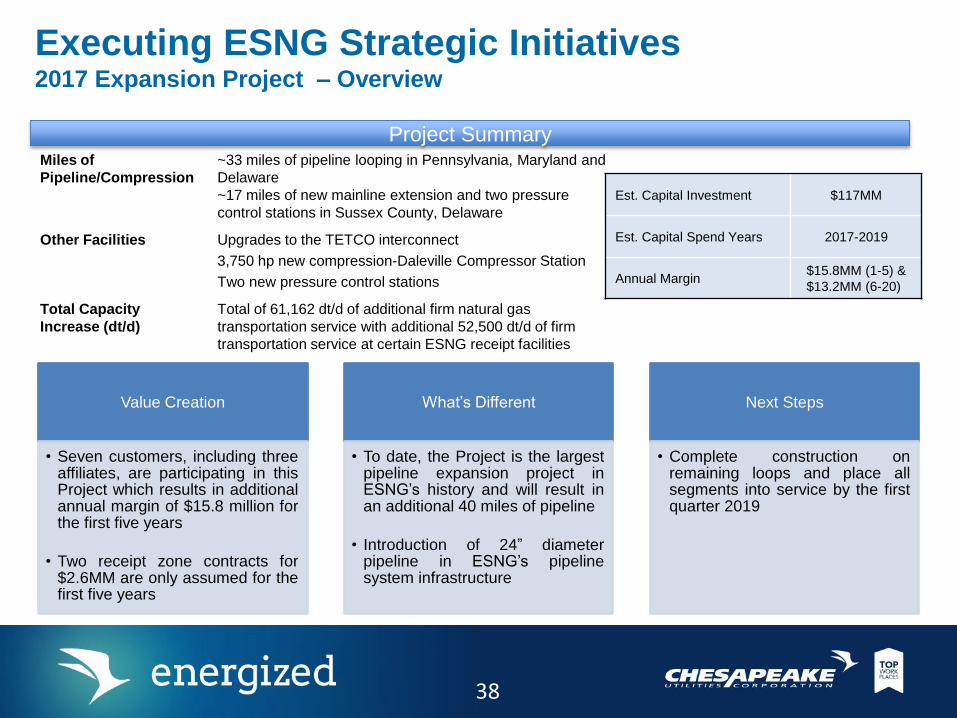
Executing ESNG Strategic Initiatives 2017 Expansion Project – Overview
Value Creation
• Seven customers, including threeaffiliates, are participating in thisProject which results in additionalannual margin of $15.8 million forthe first five years
• Two receipt zone contracts for$2.6MM are only assumed for thefirst five years
What’s Different
• To date, the Project is the largestpipeline expansion project inESNG’s history and will result inan additional 40 miles of pipeline
• Introduction of 24” diameterpipeline in ESNG’s pipelinesystem infrastructure
Next Steps
• Complete construction onremaining loops and place allsegments into service by the firstquarter 2019
Miles of
Pipeline/Compression
~33 miles of pipeline looping in Pennsylvania, Maryland and
Delaware
~17 miles of new mainline extension and two pressure
control stations in Sussex County, Delaware
Other Facilities Upgrades to the TETCO interconnect
3,750 hp new compression-Daleville Compressor Station
Two new pressure control stations
Total Capacity
Increase (dt/d)
Total of 61,162 dt/d of additional firm natural gas
transportation service with additional 52,500 dt/d of firm
transportation service at certain ESNG receipt facilities
Project Summary
Est. Capital Investment $117MM
Est. Capital Spend Years 2017-2019
Annual Margin$15.8MM (1-5) &
$13.2MM (6-20)
38
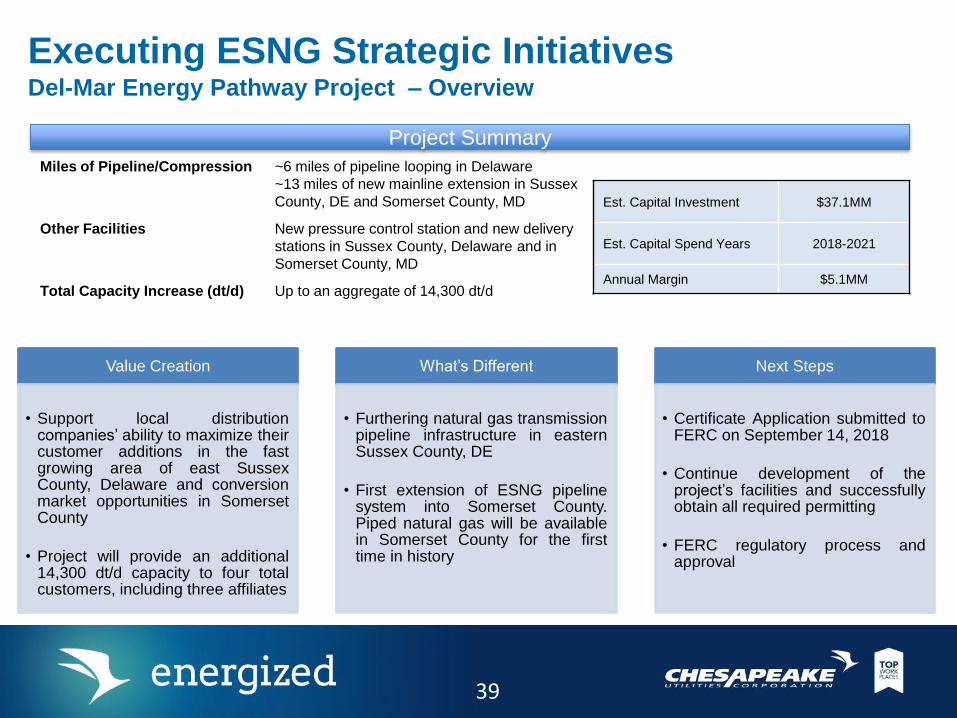
Executing ESNG Strategic InitiativesDel-Mar Energy Pathway Project – Overview
Miles of Pipeline/Compression ~6 miles of pipeline looping in Delaware
~13 miles of new mainline extension in Sussex
County, DE and Somerset County, MD
Other Facilities New pressure control station and new delivery
stations in Sussex County, Delaware and in
Somerset County, MD
Total Capacity Increase (dt/d) Up to an aggregate of 14,300 dt/d
Value Creation
• Support local distributioncompanies’ ability to maximize theircustomer additions in the fastgrowing area of east SussexCounty, Delaware and conversionmarket opportunities in SomersetCounty
• Project will provide an additional14,300 dt/d capacity to four totalcustomers, including three affiliates
What’s Different
• Furthering natural gas transmissionpipeline infrastructure in easternSussex County, DE
• First extension of ESNG pipelinesystem into Somerset County.Piped natural gas will be availablein Somerset County for the firsttime in history
Next Steps
• Certificate Application submitted toFERC on September 14, 2018
• Continue development of theproject’s facilities and successfullyobtain all required permitting
• FERC regulatory process andapproval
Est. Capital Investment $37.1MM
Est. Capital Spend Years 2018-2021
Annual Margin $5.1MM
Project Summary
39

Executing ESNG Strategic Initiatives Potential Future Expansion Project – Overview
Pipeline Expansion
• Multi-year phased in pipeline expansion providing firm transportation service
capacity additions to southeastern PA and areas of the Delmarva Peninsula,
including areas currently not served with piped natural gas. Proposed to be
phased in over 3-year period (Nov. 1, 2020, Nov. 1, 2021, and/or Nov. 2022).
Market Hub Services
• Possible bi-directional upgrades to the northern portion of ESNG’s
transmission system where it is interconnected with the three interstate
systems (Texas Eastern, Transco and Columbia Gas).
• Shippers would have the ability to deliver gas to ESNG from one interstate
pipeline and have ESNG re-deliver the gas into another interstate system for
the shipper.
• This supply optionality will allow shippers to take advantage of market pricing
differentials between pipelines.
Open Season held from February 7 – April 17, 2018
Development of project(s) to meet Open Season responses underway
Opportunity Summary
40

Delmarva Natural
Gas Distribution
41

Chesapeake Utilities & Sandpiper Energy –
Overview Delaware Division
Southern New Castle County, Kent County and
Sussex County
Over 52,000 retail customers
Over 1,027 miles of natural gas main
Delivers nearly 8 million Mcf of natural gas per
year
Maryland Division Cecil County, Caroline County, Dorchester
County and Wicomico County
Over 12,800 retail customers
Over 311 miles of natural gas main
Delivers nearly 3 million Mcf of natural gas per
year
Sandpiper Energy Worcester County
Over 10,600 retail customers
Over 310 miles of natural gas and propane main
Delivers nearly 400 thousand Mcf of natural gas
and 4.1 million gallons of propane per year (363
thousand Mcf equivalent)
42
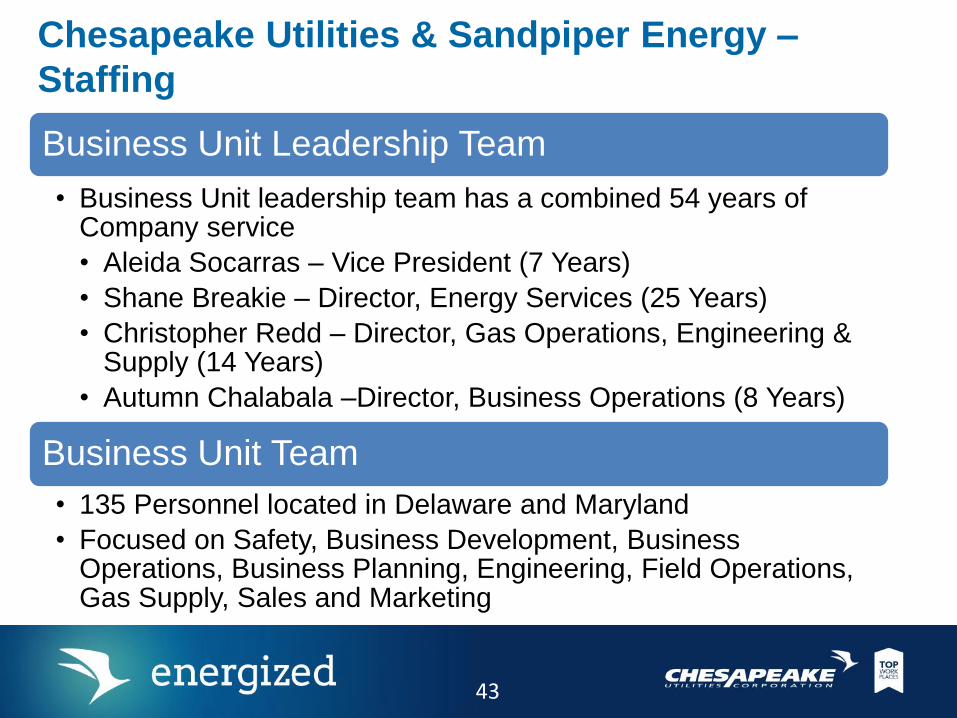
Chesapeake Utilities & Sandpiper Energy –
Staffing
Business Unit Leadership Team
• Business Unit leadership team has a combined 54 years of Company service
• Aleida Socarras – Vice President (7 Years)
• Shane Breakie – Director, Energy Services (25 Years)
• Christopher Redd – Director, Gas Operations, Engineering & Supply (14 Years)
• Autumn Chalabala –Director, Business Operations (8 Years)
Business Unit Team
• 135 Personnel located in Delaware and Maryland
• Focused on Safety, Business Development, Business Operations, Business Planning, Engineering, Field Operations, Gas Supply, Sales and Marketing
43

Chesapeake Utilities & Sandpiper Energy –
Past Performance
44

Chesapeake Utilities & Sandpiper Energy –
Distribution System ExpansionPast
Organic growth focused on
Kent/New Castle Counties, DE
Present Growth into eastern Sussex
County, DE and Cecil County,
MD
Conversion of existing propane
customers in Worcester County,
MD
Future Continued expansion in growth
areas of our service territory
Looking for expansion
opportunities in other areas of
the Peninsula
45

Sandpiper Energy – Customer Conversions
from Propane to Natural Gas
• Approximately 6,800 customers have
been converted (Berlin, West Ocean
City, Ocean Pines, and Ocean City).
• A bay crossing from West Ocean City
to Ocean City completed in 2017
• Conversions in Ocean City continue
during the months of September -
May
• Conversions in Ocean Pines happen
year round
--- line = natural gas main --- line = propane main
Ocean
City
46
Sharp Energy
Propane
Operations
47

Sharp Energy – Overview
Provides propane distribution service to approximately 39,000 customers
Service territories include Delaware, Maryland, Virginia and Pennsylvania
Customer categories include residential, commercial, industrial, agricultural and Autogas
29 bulk storage facilities (4 rail) with total propane storage capacity in excess of 3.5 million gallons; more than any other propane provider in our operating territory
Leadership team has a combined 158 years of service
170 employees and 10 operating locations
Servicing customers’ propane needs for over 35 years
1981: Acquired Clarence E. Sharp Company in Georgetown, DE. Sharpgas, Inc. DBA Sharp Energy was formed to consolidate CPK’s propane distribution operations
1988: Acquired Kellam Energy, Inc. in Belle Haven, VA
1997: Acquired Tri-County Gas Company in Salisbury, MD and Sheldon Gas Company in Dover, DE
2005: Initiated start-up operation in Allentown, PA
2010: Initiated start-up operation in Cecil County, MD
2011: Initiated start-up operation in the Poconos, PA
2013: Signed first Autogas customer
2016: Initiated start-up operation in Anne Arundel, MD
2018: Expanded Autogas offerings to Jupiter and Jacksonville, FL
48

Sharp Energy Growth Story
Sharp continues to grow organically within existing
territories as well as expand geographically, with a
focus on markets on the western shore of MD (Anne
Arundel County and Baltimore County) and
Wilmington, DE (Autogas and commercial focus)
Expanding into Carroll County to support
autogas/builder opportunities in the surrounding
counties
His
tori
c S
erv
ice T
err
ito
rie
s
(200
1 –
2011)
Cu
rre
nt
Se
rvic
e T
err
ito
rie
s
(201
8)
49

Market Profile – Gallon Sales & Customer Count Sharp Energy
$21,000 $20,734 $18,573
$28,211 $29,398
$35,306
$30,527 $32,633
$-
$5,000
$10,000
$15,000
$20,000
$25,000
$30,000
$35,000
$40,000
2010 2011 2012 2013 2014 2015 2016 2017
Gross Margin($ in thousands)
50

Sharp Energy – Growth Initiatives
Community Gas Systems
Business Unit Leadership Team
Timely execution and communication has set Sharp Energy apart from the competition
Maintain and develop builder relationships via dedicated staff to ensure seamless implementation of the
gas system within the developments
Additional opportunities for temp heat and bulk residential gallon sales
Autogas
Start-ups
Poultry
Established relationships early-on with strategic partners to support sales efforts
Autogas technical services team is capable of converting, repairing and maintaining Autogas vehicles
Created a multi-fleet fueling station network to support refueling efficiency for our Autogas customers
Recognized as the premier provider of Autogas in the propane industry
Facilitates geographic expansion beyond existing service territories
Accelerated gallon sales through builder relationships and autogas opportunities
Poultry producers are increasing capacity on the Delmarva Peninsula to more efficiently supply the
Northeast market and accommodate growth
Poultry producers see the value of quality of service and guarantee of supply
Sharp can leverage its superior infrastructure and grower relations to gain market share in the growing
poultry market
51
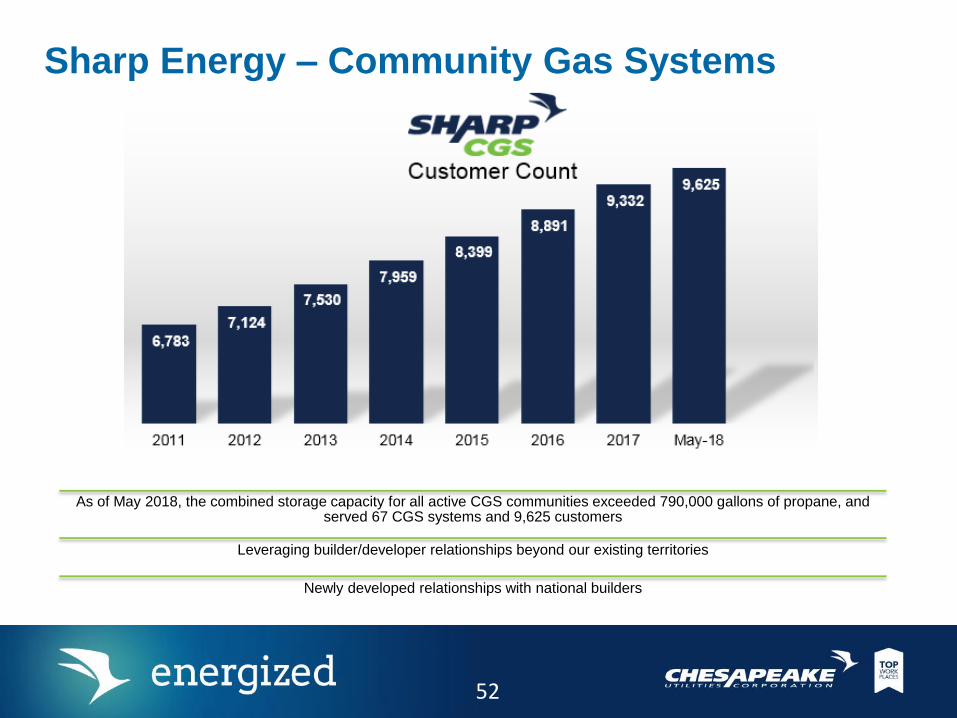
Sharp Energy – Community Gas Systems
As of May 2018, the combined storage capacity for all active CGS communities exceeded 790,000 gallons of propane, and served 67 CGS systems and 9,625 customers
Leveraging builder/developer relationships beyond our existing territories
Newly developed relationships with national builders
52

Sharp Energy – Autogas To date, Sharp has displaced over 4.8M gallons of
gasoline/diesel fuel (internal use and external sales
combined)
Benefits of Autogas:
Economical
On average, 30-40% less expensive than
gasoline and about 50% less than diesel
Cleaner burning = reduced maintenance
costs
Clean
Up to 25% less greenhouse gases
20% less nitrogen oxide
Up to 60% less carbon monoxide
Domestic
More than 90% of the U.S. propane Autogas
supply is produced domestically, with an
additional 7% from Canada
Sales accomplishments:
Awarded Delaware Rapid Transit fuel supply for 5
years
Sharp is a key provider of Autogas for propane-
powered school buses in the states of Delaware,
Maryland and Pennsylvania
Sharp’s ability to capitalize on various incentives and
grants increases the economics of conversions for
both Sharp and its customers
Sharp will facilitate Autogas conversions for FPU
and support sales efforts to expand Autogas
offerings in Florida
53

Sharp Energy – Autogas
# of Multi-Fleet Fueling Stations = 15 # of Private Fueling Stations = 31
54
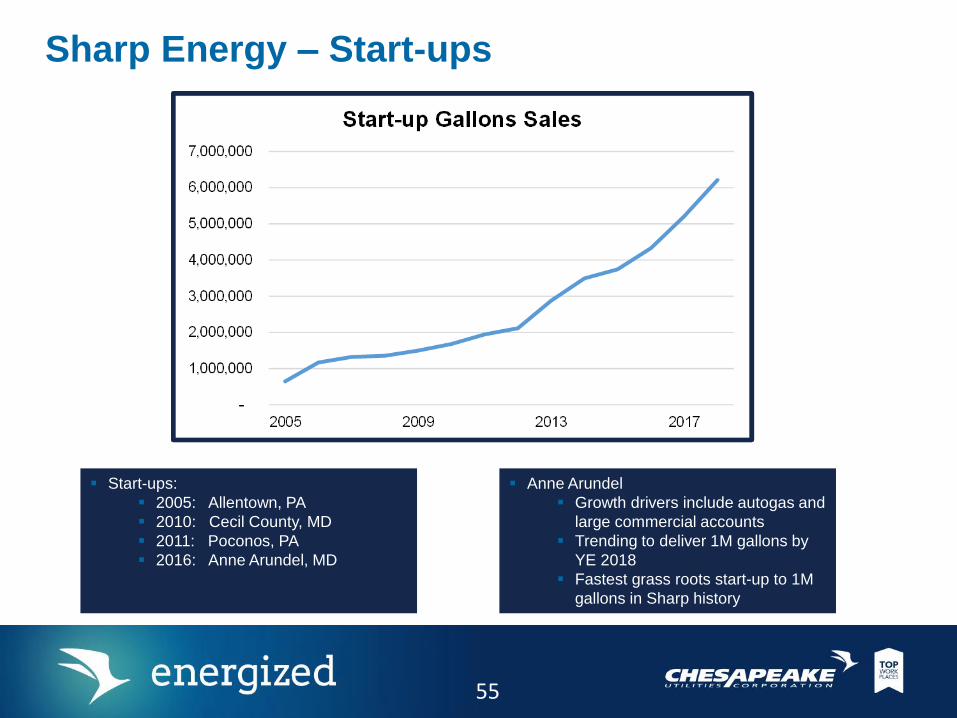
Sharp Energy – Start-ups
Start-ups:
2005: Allentown, PA
2010: Cecil County, MD
2011: Poconos, PA
2016: Anne Arundel, MD
Anne Arundel
Growth drivers include autogas and
large commercial accounts
Trending to deliver 1M gallons by
YE 2018
Fastest grass roots start-up to 1M
gallons in Sharp history
55

Sharp Energy – Poultry
Added 495,000 gallons
of tank capacity since
March 2017
Total poultry growers
tank capacity is
currently 2.28M
gallons
56

Aspire Energy
of Ohio
57
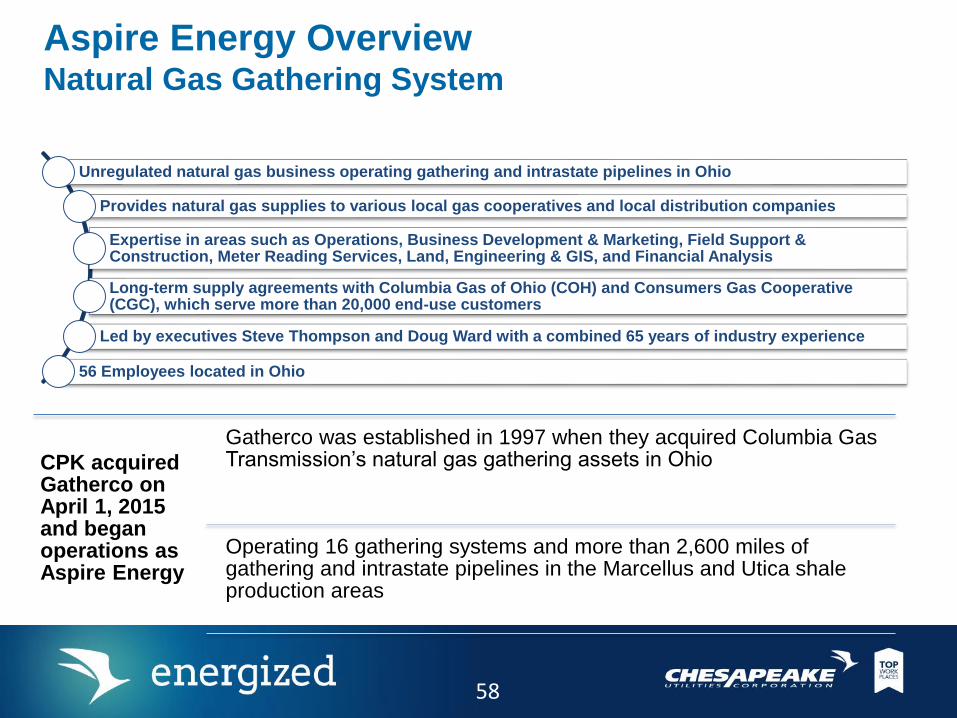
CPK acquired Gatherco on April 1, 2015 and began operations as Aspire Energy
Gatherco was established in 1997 when they acquired Columbia Gas Transmission’s natural gas gathering assets in Ohio
Operating 16 gathering systems and more than 2,600 miles of gathering and intrastate pipelines in the Marcellus and Utica shale production areas
Aspire Energy OverviewNatural Gas Gathering System
Unregulated natural gas business operating gathering and intrastate pipelines in Ohio
Provides natural gas supplies to various local gas cooperatives and local distribution companies
Expertise in areas such as Operations, Business Development & Marketing, Field Support & Construction, Meter Reading Services, Land, Engineering & GIS, and Financial Analysis
Long-term supply agreements with Columbia Gas of Ohio (COH) and Consumers Gas Cooperative (CGC), which serve more than 20,000 end-use customers
Led by executives Steve Thompson and Doug Ward with a combined 65 years of industry experience
56 Employees located in Ohio
58

Aspire Energy Overview
Aspire Energy operates in 40 of
the 88 counties in Ohio,
providing natural gas supplies to
various local gas cooperatives
and local distribution
companies, including
Consumers Gas Cooperative
and Ohio’s largest local
distribution company, Columbia
Gas of Ohio
Aspire Energy is an unregulated
natural gas business operating
16 gathering systems and more
than 2,600 miles of gathering
and intrastate pipelines in the
Marcellus and Utica shale
production areas.
59

Aspire Energy Value ChainSystem Overview
Own and Operate ~2,600 miles of
pipeline, 16 Gathering systems
Off-System Sales
DELIVERIES: Approx. 2 MM DthGather wellhead natural gas
production
RECEIPTS: Approx. 5.0 MM Dth
Own and Operate
two (2) gas
processing plants
Serving more than 20,000 end-use customers,
and delivering approximately 4 MM Dth per year
RECEIPTS: Approx. 1 MM Dth
Propane Services
(Potential Growth Opportunity)
Wholesale Retail
Propane Extracted
From Processing Plants:
Approx. 700k gallons
NGL Sales
DELIVERIES: Approx. 1.5 MM gal.
from 305 Producers
60
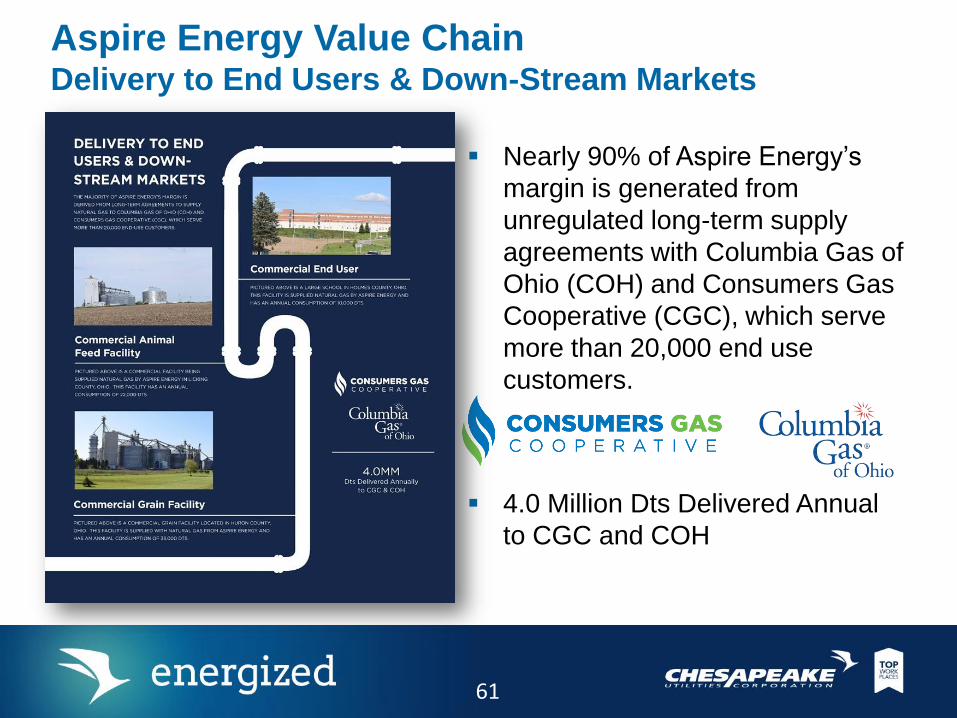
4.0 Million Dts Delivered Annual
to CGC and COH
Nearly 90% of Aspire Energy’s
margin is generated from
unregulated long-term supply
agreements with Columbia Gas of
Ohio (COH) and Consumers Gas
Cooperative (CGC), which serve
more than 20,000 end use
customers.
Aspire Energy Value ChainDelivery to End Users & Down-Stream Markets
61

0
1000
2000
3000
4000
5000
6000
7000
8000
2011 2012 2013 2014 2015 2016 2017
Historical Member Growth
Customer Profile – Consumers Gas Cooperative Customer Growth
Growth rates have
averaged 8.77% the last
three years.
The residential sector
continues to be the
driving force for customer
growth, accounting for
82% of new members
over the past five years.
62

Customer Profile – Consumers Gas Cooperative
Aspire Energy has a long term contract to provide natural gas to all
Consumers Gas Cooperative members.
821,216 807,044
1,127,340
1,336,676
1,167,886 1,192,955
1,342,193
-
1,000
2,000
3,000
4,000
5,000
6,000
7,000
-
200,000
400,000
600,000
800,000
1,000,000
1,200,000
1,400,000
1,600,000
1,800,000
2011 2012 2013 2014 2015 2016 2017
Heating D
egre
e D
ays (
HD
D)
Annual S
ale
s
Annual Sales Volumes (Dekatherms)
Dekatherms HDD
63

Customer Profile – Columbia Gas of Ohio
Aspire Energy has a seven year contract to provide natural gas to 80
Columbia Gas of Ohio meters.
2,202,003 2,120,552
2,389,655
2,777,474
2,472,673
2,197,140 2,263,587
-
1,000
2,000
3,000
4,000
5,000
6,000
7,000
-
500,000
1,000,000
1,500,000
2,000,000
2,500,000
3,000,000
3,500,000
2011 2012 2013 2014 2015 2016 2017
Heating D
egre
e D
ays (
HD
D)
Annual S
ale
sAnnual Sales Volumes (Dekatherms)
Dekatherms HDD
64

Aspire Energy Performance ResultsGross Margin
$6.324
$12.271
$14.528
2015 2016 2017
Mill
ion
s
Excludes Q14/1/15 – Date of Acquisition
65

Aspire Energy – Potential Growth Sectors Consumers Gas Cooperative
Focus on agricultural sector primarily in Western Ohio which is
home to the largest corn production in the state. Areas also have
large poultry facilities with year-round usage.
Pursue commercial loads and other large volume industrial users.
Target expansion in growth regions in the state.
Transmission Opportunities
Pursue intra/interstate pipeline opportunities preferably with
associated downstream markets such as power plants, industrial
consumers, and LDCs.
Propane Services
Upgrading existing processing plants’ Mechanical Refrigeration
Units (MRU) to include depropanizers that will extract marketable
propane onsite.
Leveraging propane extracted by MRUs will position the company
to initiate and grow wholesale/retail propane services.
Positions the company to grow outside of existing footprint
through Community Gas System (CGS) projects where natural
gas infrastructure is readily available.
Acquisitions
Opportunistic acquisitions to expand our footprint and to enhance
our system capabilities.
66

Regulatory
Overview and
Update
67

Regulatory Strategy is a Key Component of our Corporate
Strategy
• Regulatory Strategy is a Key Component of Corporate Strategy with a goal of
Maximizing Shareholder Value
• This is accomplished through a variety of Regulatory actions
– Attaining a positive and influential position with Stakeholders
– Partnering with BU’s on Strategy and Budgets to develop a Regulatory Plan
– Making strategic filings to receive a return on and/or recovery of investments and
acquisitions
• Base Rates
• Riders and surcharges
• Revenue Normalization Mechanism
• Regulatory Assets
– 100% compliance with Commission Orders, Rules and Statutes
68

Regulatory Contributions to Corporate
Success• In the last 2 years, the Regulatory group has successfully settled 3 rate
cases 2 of which resulted in the largest base rate increase in the respective BU’s history and the group successfully filed and received approval to construct and implement several large projects such as ESNG’s 2017 Expansion Project which contributed to record earnings for the Company.
• In addition, the Regulatory team was successful in negotiating regulatory assets for Tax, Pension termination, and IT related costs as well as riders for propane to gas conversion costs and line relocates & PHMSA related costs.
• Finally, the Regulatory group has developed positive and collaborative relationships which have been key in receiving positive outcomes for not only base rate cases but also in settling cases such as the recent USA Expansion Area Rates at our LDC’s.
69

Unique Regulatory Provisions -
Chesapeake Utilities & Sandpiper EnergyRevenue Normalization (MD, SE) – Delivery service revenue is either increased or decreased to equate to a set amount per customer as approved in the last base rate proceeding
Expansion Area Rates (DE) – Higher customer charges in a designated area to enable expansion of infrastructure
– Eastern Sussex Expansion Rates (defined geographical area)
– Underserved Area (USA) Expansion Rates
Negotiated Rates (DE, MD, SE) – Individual rates to certain large customers, often higher than tariff rates, allowing for economic expansion to serve those customers
Environmental Rider (DE) – Separate surcharge on customer bills to recover costs associated with remediation of environmental sites
Franchise Surcharge (DE) – Separate surcharge applicable to customers within specific city/town limits to recover the franchise fee paid to the city/town
Gas Cost Recovery (DE) – Provision allowing out-of-cycle adjustment to the gas cost rate if over/under collection of gas costs is outside of a designated band
System Improvement Rate (SE)– Separate surcharge on customer bills to recover the cost of bare steel replacement and the cost of distribution system conversion and customer conversions from propane to natural gas
Delivery
Service
Rates
Incremental
Rates
70

Presentation Title Here
Status of Tax Rate Reserves for Refunds to Customers
FERC(ESNG)
Delaware(DE - DNG)
Maryland(DNG- Sandpiper)
Florida (FPU)
YTDthru 6/30/2018
Refunds and Reserves
$1.7 MM
$641K
$910K
$2.2MM
Status 6/30/2018
Refunded $902K YTD
FiledPSC Reviewing Rates
$783KRefunded in July 2018
Natural Gas and Electric have both filed
(in thousands except per share)
TCJA ImpactPre-tax
IncomeNet Income
Earnings
Per Share
Income taxes - decreased effective tax rate -$ 5,262$ 0.32$
Refunds and reserves for future refunds to ratepayers (5,421) (3,925) (0.24)
Net TCJA Impact (5,421)$ 1,337$ 0.08$
Six Months Ended
June 30, 2018
71

Florida Business UnitInvestor Day 2018
72

Performance Results
Projects and Initiatives
Florida Market
Business Unit Profile
373
Florida Market
74

Florida Key Growth Metrics
November 2017 Fishkind & Associates, Inc.©
Housing StartsCommercial Sq. Ft.
• City sized developments underway again.
• Forecast downturn tied to interest rates.
• Significant construction activity in medical,
industrial, and service markets.• Florida 3rd largest state - 21.3 million.
• 1,000 person per day growth rate.
Population and Employment
75

Florida Energy Industry
Natural Gas Sabal Trail; Next Era Florida Southeast Connection pipelines in-service.
Next Era Indiantown to Riviera Beach Power Plant 24” pipeline moved to
FSC.
Companies are looking to develop a new transmission pipeline to South Florida.
EMERA TECO/Peoples Gas and NextEra Florida City Gas acquisitions.
Emerging LNG/CNG market.
Electric FPL acquisition of Gulf Power.
Implications for current and future Purchase Power Agreements.
Capacity market remains long, generation development continues.
Significant utility scale solar PV under development.
Electrics are investing heavily in smart grid and storm hardening.
Muni’s a little unsettled (Vero Beach, JEA, etc.).
Propane Wholesale expansion.
Small acquisitions.
76
Florida Business
Unit Profile
77

Florida Business Unit Profile
Florida Public Utilities Company
Natural gas distribution
Electric distribution
Central Florida Gas
Natural gas distribution
Peninsula Pipeline Company
Intrastate gas transmission
Flo-gas Corporation
Wholesale and retail propane
Eight Flags Energy, LLC
Unregulated Energy Services
Home warranty, surge protection, appliance sales and services
78

Florida Strategy
79
Consistent with the overall Chesapeake strategy.
Aggressive, but disciplined, market search for investment opportunities.
Territory Expansion; GRIP; CHP; Electric Reliability
Create an organization capable of executing and supporting project
development.
Engineering; Finance; Regulatory; Project Management; Operations
Execute a regulatory strategy that supports growth.
Inter-company project approval (PPC and CHP)
Cost recovery mechanisms (GRIP, Swing Charge)
Obtain project margins that produce accretive, EPS growth.
Regulatory strategy and incremental customers.
Balance the pace of growth to maintain reasonable returns and rate
impacts.
79

$10
$16
$34
$41
$52
$93
$69
$78
$74
$ 0
$ 10
$ 20
$ 30
$ 40
$ 50
$ 60
$ 70
$ 80
$ 90
$ 100
2010 2011 2012 2013 2014 2015 2016 2017 2018F
$’s
in M
illio
ns
Florida Capital Expenditures
8080

2010-2018F Florida Growth
Average Capitalization
$112
$0$12
$34
$0
$159
$269
$61
$15
$66
$33
$444
$0
$50
$100
$150
$200
$250
$300
$350
$400
$450
$500
Natural Gas Peninsula Pipeline Propane Electric Eight Flags Total
$’s
in M
illio
ns
2010 2018F
81

Florida Margin Growth
82
$0
$5,000
$10,000
$15,000
$20,000
$25,000
$30,000
$35,000
$40,000
$60,000
$70,000
$80,000
$90,000
$100,000
$110,000
$120,000
$130,000
2010 2011 2012 2013 2014 2015 2016 2017 2018F
Ye
ar
ove
r Y
ea
r $
’s in T
ho
usa
nd
s
Ma
rgin
$’s
in T
ho
usa
nd
s
Margin
2018F Margins does not include an adjustment for a $3.8M reserve for tax rate refund
Year over Year
82

Projects and
Initiatives
83
Presentation Title Here
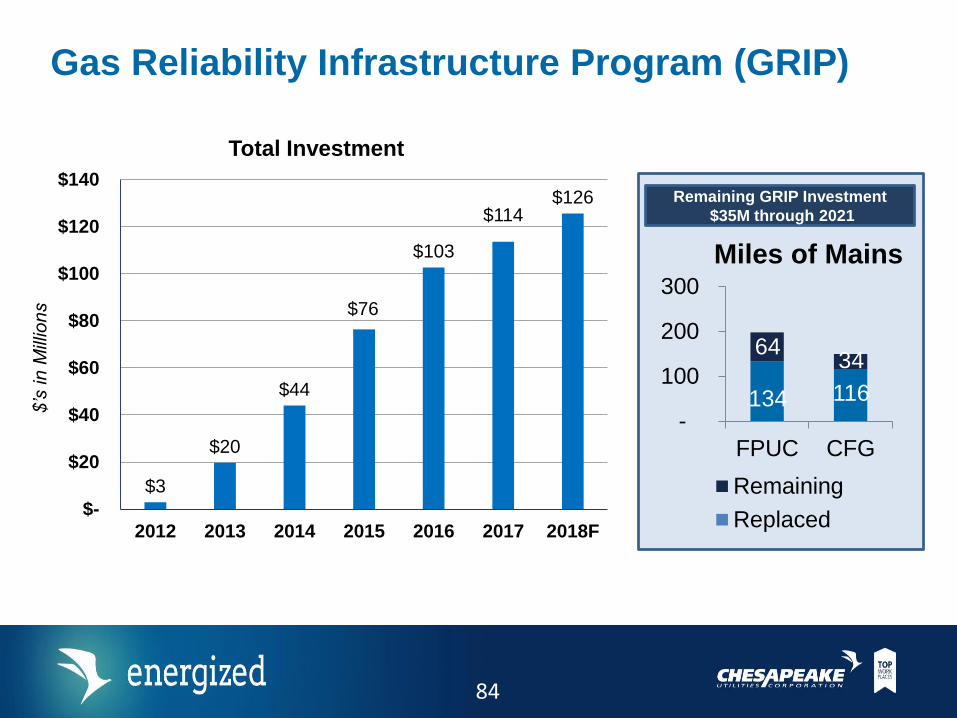
Gas Reliability Infrastructure Program (GRIP)
$3
$20
$44
$76
$103
$114$126
$-
$20
$40
$60
$80
$100
$120
$140
2012 2013 2014 2015 2016 2017 2018F
$’s
in
Mill
ion
s
Total Investment
134 116
64 34
-
100
200
300
FPUC CFG
Miles of Mains
Remaining
Replaced
Remaining GRIP Investment
$35M through 2021
84

Presentation Title Here
Florida Natural Gas Developments
Westlake – Palm Beach County
4,500 homesAvenir – Palm Beach County
3,250 homes
Wildlight – Nassau County
3,000 homes
6,000+ total homes under contract
$9M capital investment
2018 Florida Res Dev Signings – 2,428 homes
$3.6M capital investment
85

Presentation Title Here
Florida Natural Gas Development
Deseret Ranch
Property Ownership Land acquired in 1950 by the Mormon Church.
295,000 acres, 250 square miles.
Location: Osceola, Orange and Brevard Counties
Current use: cattle, citrus, timber.
Project Scope City the size of Miami.
2080 expected population: 493,000.
Sunbridge 37,000 homes and apartments, nearly 20 million
square feet of commercial space and more than
3,000 hotel rooms.
Development timeline: 2018-2047.
North Ranch Sector Plan 133,000 acres in Osceola County.
53% mixed-use development, 29% conservation
lands, 13% agriculture, 5% reservoirs.
Development timeline: 2040-2080.
86

Presentation Title Here
PPC and CFG Northwest Expansion
• PPC 12” transmission
project to serve CFG
Escambia County,
Florida expansion.
• Anchor loads: City of
Pensacola and Ascend
Performance Materials.
• 115,500 dt/day
capacity.; 105,500
dt/day under contract.
• $44.3M total capital.
• $6.6M annual margin.
• 16% IRR.
• In-service.
87

Presentation Title Here
PPC New Smyrna Beach Pipeline
• PPC project serves
FPU.
• Increased pressure and
volume for FPU growing
distribution system.
• Resolves a pipeline
integrity issue with
former FGT lateral
acquired by FPU in
2011.
• $9M investment.
• $1.4M annual margin.
• In-service.
88

Presentation Title Here
PPC Western Palm Beach County Expansion
• Four PPC projects to
serve FPU distribution
expansions in PBC.
• Resolves a pipeline
integrity issue with
former FGT lateral
acquired by FPU in
2011.
• $20M total investment.
• $3.4M annual margin.
• Mid-2019 in-service.
89
Presentation Title Here
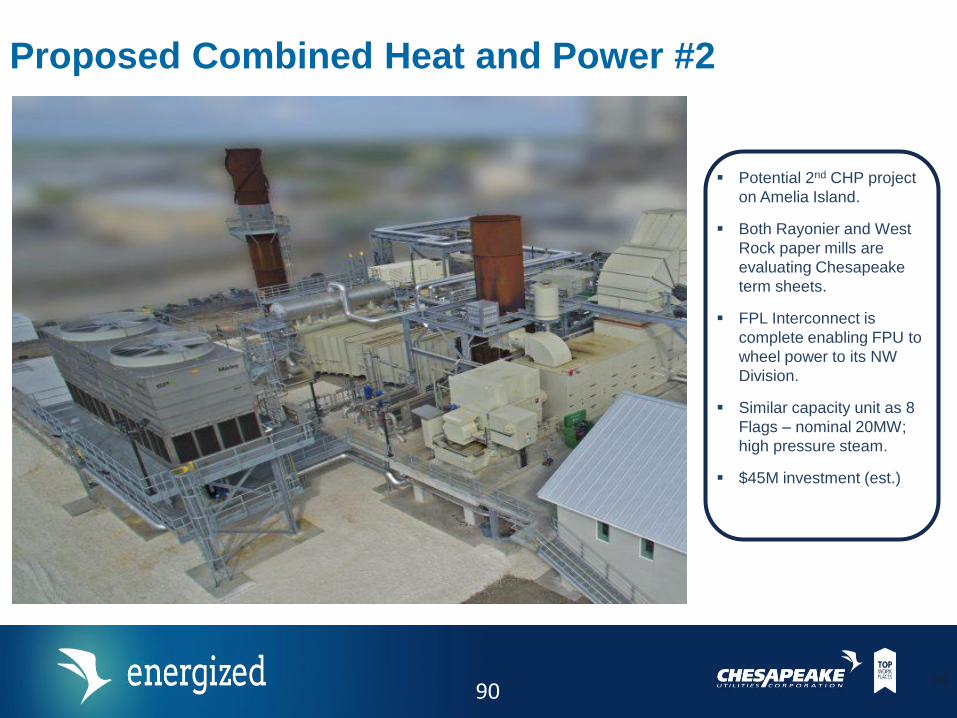
Proposed Combined Heat and Power #2
90
Potential 2nd CHP project
on Amelia Island.
Both Rayonier and West
Rock paper mills are
evaluating Chesapeake
term sheets.
FPL Interconnect is
complete enabling FPU to
wheel power to its NW
Division.
Similar capacity unit as 8
Flags – nominal 20MW;
high pressure steam.
$45M investment (est.)
90

Presentation Title Here
• PPC interconnect with
SONAT and the existing
PPC pipeline jointly-
owned with EMERA
Peoples Gas.
• Supports FPU load
growth for additional
CHP, Lignotech,
Rayonier recovery boiler
and other res and C&I
growth.
• $25M total investment
(est.)
Proposed PPC Nassau County Pipeline
9191
Natural Gas Marketing - PESCO
9292

Presentation Title Here
Strategic Business Unit Objectives Create Incremental Value
Aggregate Supply Optimize Asset
PortfolioOriginate Demand
93

Presentation Title Here
Strategic Fit - Generating Margins With Other CPK Business Units
•
Upstream Midstream Downstream
Gathering /
ProcessingIntrastate / Interstate
Pipelines
Demand Projects
Combined Heat
& Power (CHP)
CNG & Propane
Fueling
Propane
Distribution
Local Distribution
Companies (LDCs)
and Cooperatives
Energy Marketing &
Trading
Wholesale Logistics
Asset Management
Agreement (AMA) for:Operational Balancing
Agreement (OBA) for: Shipper behind
Hedging for:
Gas Supply for:
EIGHT FLAGS ENERGY
Asset Management
Agreement (AMA) for:
BU associated target margin – Aspire $300 - $500k, DNG $1.0 - $1.5 million, 8 Flags $150 -
$300k, ESNG $500k - $1.0 million
94

Presentation Title Here
Strategic Insights
Our growth strategy continues to be impacted by significant fundamental changes
in shale supply, demand, and new build infrastructure
These changing market dynamics are supportive to our strategy:
• Aggregate Supply, Originate Demand, and Optimize Asset Portfolio
In order to achieve our targeted growth for PESCO, we need to grow organically
across these disciplines
Our regional growth plan uniquely positions us to take advantage of dislocations in
markets caused by these fundamental factors
Target markets: Southeast, Mid-Atlantic, Appalachian Basin, & Midwest
Our origination team has the capability to sell CPK’s entire unregulated service
offering in our target markets (propane, CHP, renewables and other PESCO
offerings)
95

Presentation Title Here
Margin History
$3,505 $3,311 $3,587
$4,630
$7,977
$-
$1,000
$2,000
$3,000
$4,000
$5,000
$6,000
$7,000
$8,000
$9,000
2013 2014 2015 2016 2017 Excl. MTM
Gross Margin($ in thousands)
9696

Presentation Title Here
Beachhead Project Locations of Interest - Nexus Points
5
4
2
3
1
6
7
8
Anchor Markets 1. DE, MD, Eastern PA2. Florida3. Midwest
Adjacent Markets4. Marcellus
• Adjacent to TCO FT• Cheapest gas• Most production
5. D.C. Metro / Transco Z5• Adjacent to DE• Non-Coincidental, Peak Demand
(NCPD)• Attractive retail• changing
6. SONAT area• Link to FL• Non-Coincidental, Peak Demand
(NCPD)
Follow the Gas7. Southern Appalachia8. Gulf access areas9. Mississippi Valley
Beach Heads are defined as high priority transactions that anchor PESCO to market areas
9
97

Financial Review
and Outlook
98
Presentation Title Here
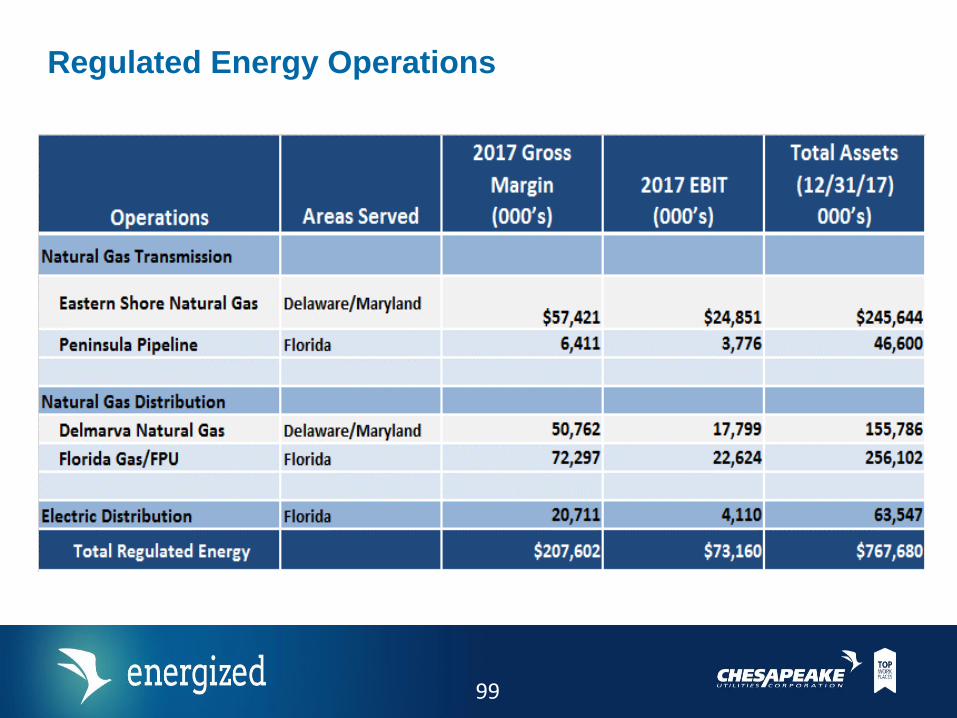
Regulated Energy Operations
99

Presentation Title Here
Unregulated Energy Operations*
*Xeron’s results have been excluded.
2017 Gross Margin 2017 EBITTotal Assets (12/31/17)
Operations Areas Served (000’s) (000’s) 000’s)
Propane DistributionDelaware, Maryland, Pennsylvania, Virginia and Florida
$47,726 $9,182 $55,079
Natural Gas Transmission Ohio 14,528 4,524 69,182
Electric & Steam Generation Florida 7,993 2,641 37,951
Natural Gas Marketing & Services
Appalachian Basin, Mid-Atlantic, Southeast
2,212 (3,147) 13,850
Total Unregulated Energy $72,459 $13,199 $176,062
100
Presentation Title Here
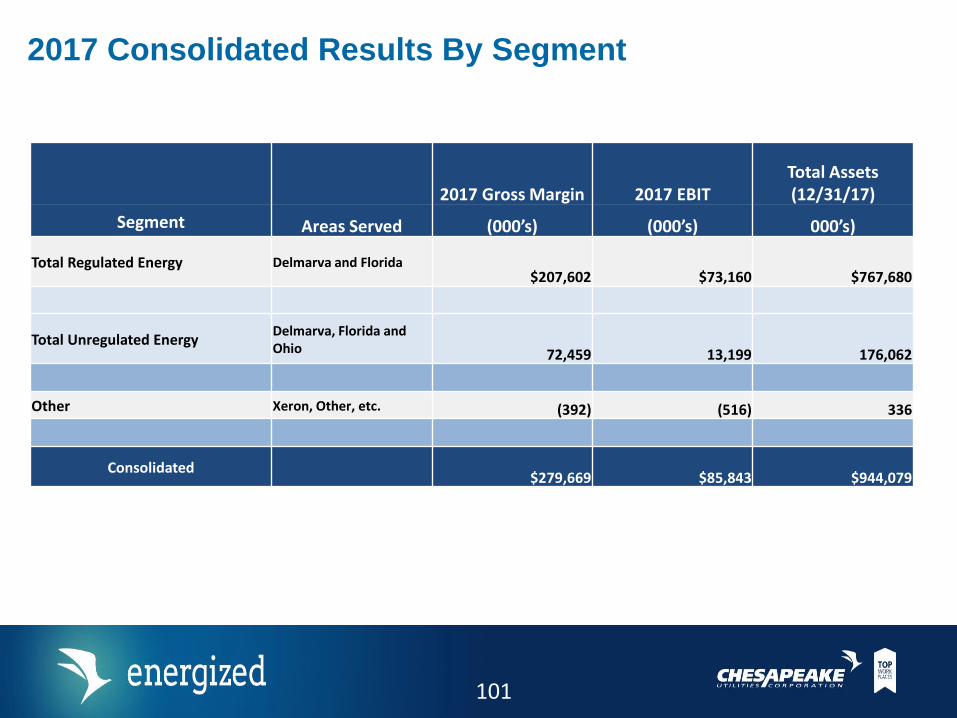
2017 Consolidated Results By Segment
2017 Gross Margin 2017 EBITTotal Assets (12/31/17)
Segment Areas Served (000’s) (000’s) 000’s)
Total Regulated Energy Delmarva and Florida$207,602 $73,160 $767,680
Total Unregulated EnergyDelmarva, Florida and Ohio 72,459 13,199 176,062
Other Xeron, Other, etc. (392) (516) 336
Consolidated$279,669 $85,843 $944,079
101

Presentation Title Here
Strong Results over the Last Ten YearsFinancial Metrics for 2007 and 2017*
* Except as Otherwise Noted.
$82
$280
2007 2017
Annual Gross Margin($ in millions)
$1.29
$2.89 *
2007 2017
Diluted Earnings Per Share(*based on adjusted 2017 EPS)
$11.76
$31.02
2007 6/30/2018
Book Value Per Share
$217
$1,466
2007 9/17/2018
Market CapitalizationAt 9/17/2018
($ in millions)
$142
$766
2007 2017
Capital Expenditures for the Five Years Ended
($ in millions)
$10,000
$55,271
12/31/2007 8/31/2018
Total Shareholder Return
102

Presentation Title Here
Earnings per Share Eleven Years of Consistent Growth
• Affirm previous year end guidance for forecasted earnings per share growth of 17% plus in 2018 including tax reform and key projects (based upon 2017 Adjusted EPS of $2.89)
Reported Earnings
5-year Growth Rate 8.4%
10-year Growth Rate 9.9%
Long-term EPS Growth RatesThrough 2018 Estimate
EPS of $3.38
$1.32 $1.43
$1.82 $1.91
$1.99
$2.26
$2.47
$2.72 $2.86 $2.89
$3.38
$0.50
$1.00
$1.50
$2.00
$2.50
$3.00
$3.50
$4.00
2008 2009 2010 2011 2012 2013 2014 2015 2016 2017* 2018
Diluted Earnings Per Share
*Represents Adjusted EPS.
103
Presentation Title Here
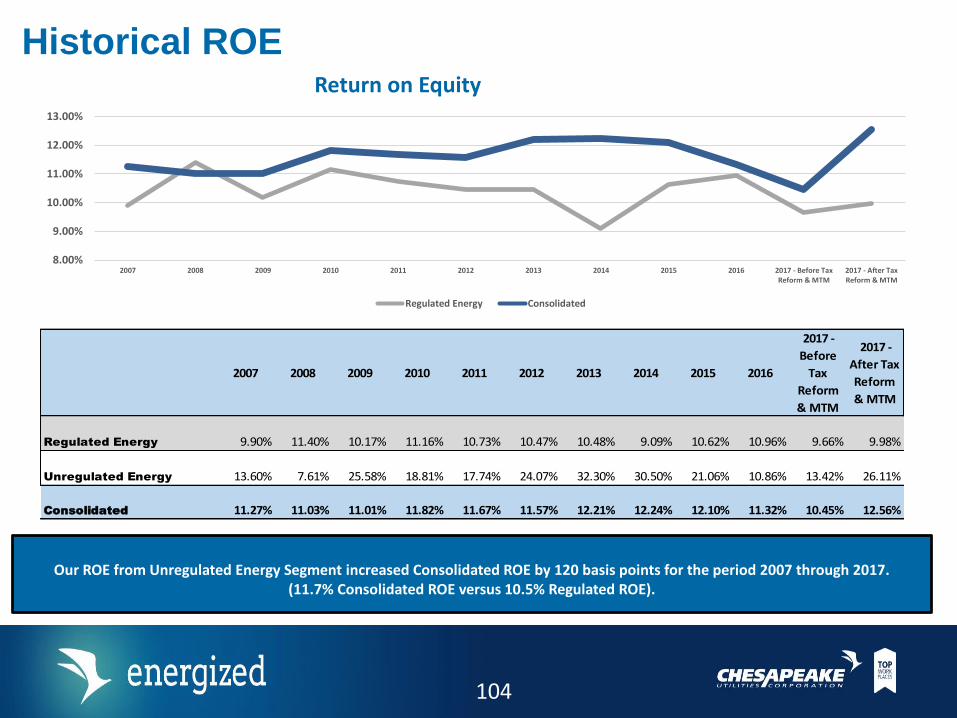
Historical ROE
2007 2008 2009 2010 2011 2012 2013 2014 2015 2016
2017 -
Before
Tax
Reform
& MTM
2017 -
After Tax
Reform
& MTM
Regulated Energy 9.90% 11.40% 10.17% 11.16% 10.73% 10.47% 10.48% 9.09% 10.62% 10.96% 9.66% 9.98%
Unregulated Energy 13.60% 7.61% 25.58% 18.81% 17.74% 24.07% 32.30% 30.50% 21.06% 10.86% 13.42% 26.11%
Consolidated 11.27% 11.03% 11.01% 11.82% 11.67% 11.57% 12.21% 12.24% 12.10% 11.32% 10.45% 12.56%
8.00%
9.00%
10.00%
11.00%
12.00%
13.00%
2007 2008 2009 2010 2011 2012 2013 2014 2015 2016 2017 - Before TaxReform & MTM
2017 - After TaxReform & MTM
Return on Equity
Regulated Energy Consolidated
Our ROE from Unregulated Energy Segment increased Consolidated ROE by 120 basis points for the period 2007 through 2017. (11.7% Consolidated ROE versus 10.5% Regulated ROE).
104
Presentation Title Here
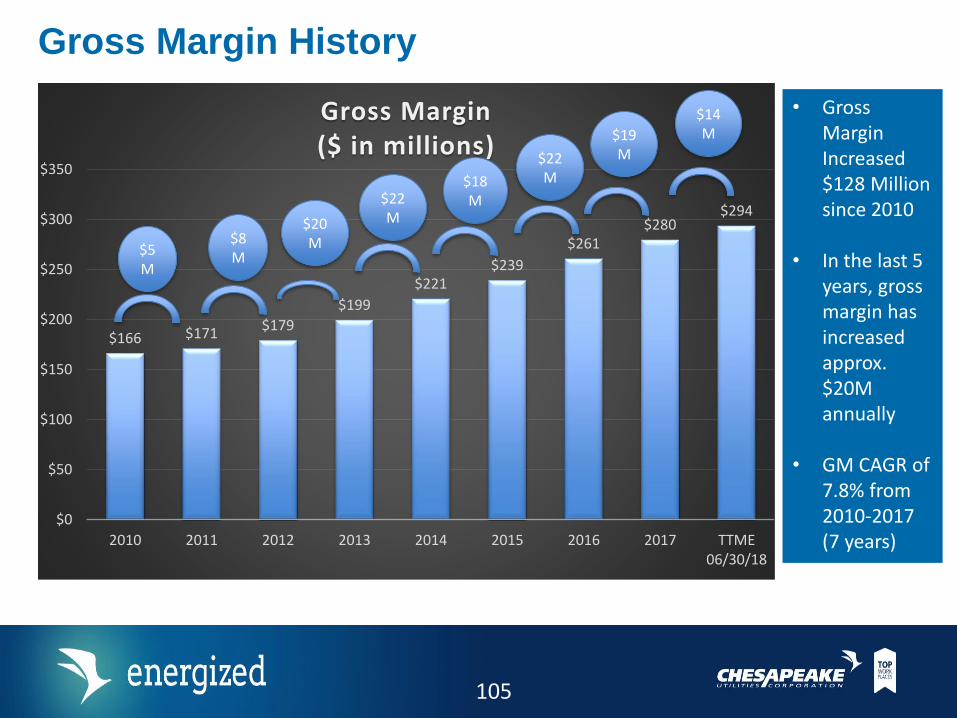
Gross Margin History
• Gross Margin Increased $128 Million since 2010
• In the last 5 years, gross margin has increased approx. $20M annually
• GM CAGR of 7.8% from 2010-2017 (7 years)
$166 $171$179
$199
$221$239
$261$280
$294
$0
$50
$100
$150
$200
$250
$300
$350
2010 2011 2012 2013 2014 2015 2016 2017 TTME06/30/18
Gross Margin($ in millions)
$22M$20
M$5M
$8M
$18M
$22M
$19M
$14M
105
Presentation Title Here
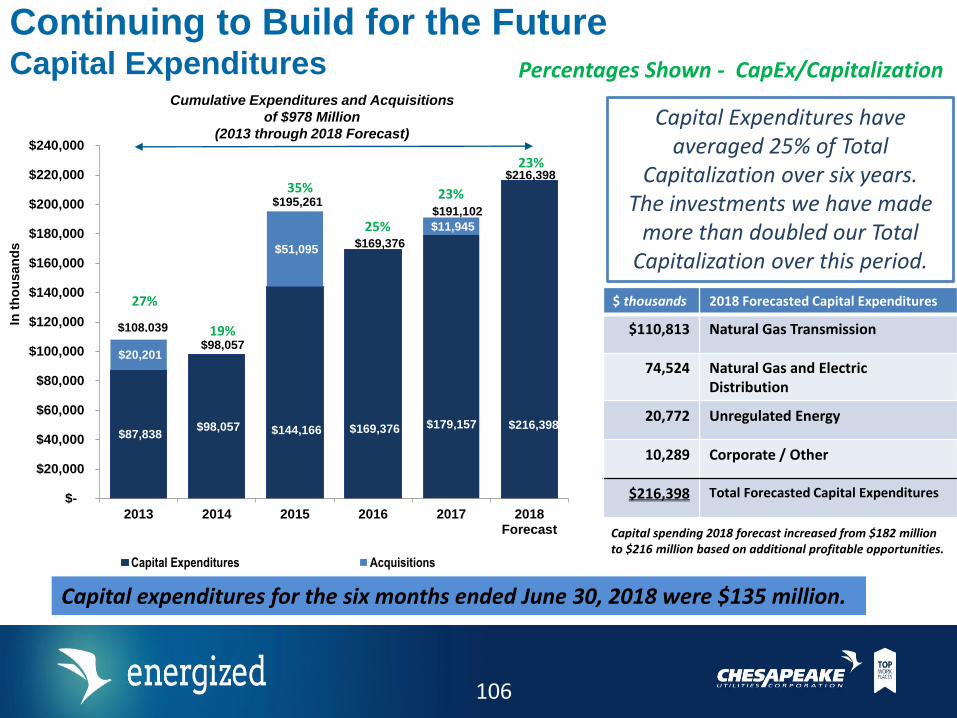
Continuing to Build for the FutureCapital Expenditures
$87,838 $98,057 $144,166 $169,376 $179,157 $216,398
$20,201
$51,095
$11,945
$-
$20,000
$40,000
$60,000
$80,000
$100,000
$120,000
$140,000
$160,000
$180,000
$200,000
$220,000
$240,000
2013 2014 2015 2016 2017 2018Forecast
In t
ho
usan
ds
Capital Expenditures Acquisitions
Cumulative Expenditures and Acquisitions
of $978 Million
(2013 through 2018 Forecast)
$108,039
$169,376
$191,102
$98,057
$195,261
$216,398
23%
19%
35%
25%
27%
23%
Capital Expenditures have averaged 25% of Total
Capitalization over six years.The investments we have made
more than doubled our Total Capitalization over this period.
$ thousands 2018 Forecasted Capital Expenditures
$110,813 Natural Gas Transmission
74,524 Natural Gas and Electric Distribution
20,772 Unregulated Energy
10,289 Corporate / Other
$216,398 Total Forecasted Capital Expenditures
Capital expenditures for the six months ended June 30, 2018 were $135 million.
Capital spending 2018 forecast increased from $182 million to $216 million based on additional profitable opportunities.
Percentages Shown - CapEx/Capitalization
106

Investing in GrowthCapital Expenditures as Percentage of Total Capitalization
7.9%
11.7%
18.1%
22.6%
12.8% 12.4%
41.2%**
12.1% 11.3%
18.3%
25.0%
17.6%
35.7%
21.0% 21.5%22.9%
0.0%
5.0%
10.0%
15.0%
20.0%
25.0%
30.0%
35.0%
40.0%
45.0%
2003 2004 2005 2006 2007 2008 2009 2010 2011 2012 2013 2014 2015 2016 2017 2018
3 year average peer group median* of 12.78% for
2016-2018
We are aggressively seeking opportunities to invest capital to generate value for our customers and shareholders.
*Named Peer Group includes the following companies: Atmos Energy Corporation; Spire Energy, Inc.; New Jersey Resources Corp.; Northwest Natural Gas Company; RGC Resources, Inc.; South Jersey Industries, Inc.; and WGL Holdings, Inc.; Black Hills Corp.; NiSource Inc.; Northwestern Corp.; ONE Gas Inc.; Unitil Corp.; Vectren Corp.
Results of Peer Group through June 30, 2018.
**Includes FPU acquisition.
107

Chesapeake Utilities – Capital Spending
$923$1,000
$0
$200
$400
$600
$800
$1,000
$1,200
Historical Capital (2012-2017) Projected Capital (2018-2022)
In M
illio
ns
Actual/Projected Capital Expenditures
Fundamental Growth Formula -$600M
We expect to invest $600M-$1B over the 5 yrs.
108

Presentation Title Here
Major Projects and Initiatives Expected to Produce $33.6 Million in Incremental Margin (2017 vs. 2019)
10,033 $20,730$5,104 $12,820
Gross margin amounts included in this table have not been adjusted to reflect the impact of TCJA.
Any refunds and/or rate reductions implemented in the Company's regulated businesses will be offset by lower Federal income tax due to TCJA.
(1)
(in thousands)
Quarter
Ended
June 30,
2018
Quarter
Ended
June 30,
2017
Six Months
Ended
June 30,
2018
Six Months
Ended
June 30,
2017 Fiscal 2017
Fiscal 2018
Estimate
Fiscal 2019
EstimateFlorida GRIP 3,647$ 3,341$ 7,211$ 6,609$ 13,454$ 14,287$ 14,370$
Eastern Shore Rate Case/ Settled Rates 2,365 - 5,095 - 3,693 9,800 9,800
Florida Electric Reliability/Modernization Program 352 - 767 - 94 1,558 1,558
New Smyrna Beach, Florida Project 352 - 704 - 235 1,409 1,409
2017 Eastern Shore System Expansion Project 859 - 1,995 - 433 8,101 15,799
Northwest Florida Expansion Project 870 - 870 - - 3,484 6,500
Western Palm Beach County, Florida - Expansion - - - - - - 2,023
Total 8,445$ 3,341$ 16,642$ 6,609$ 17,909$ 38,639$ 51,459$
Gross Margin for the Period
(1)
(1)(1)
(1)
(1)(1)
109

Presentation Title Here
Strong Balance Sheet to Support Future GrowthTotal Capitalization has Nearly Doubled in Five Years
$278,773 $300,322 $358,138
$446,086 $486,294 $507,986
$117,592 $158,486
$149,006
$136,954
$197,395$241,596
$117,019 $97,340
$182,548
$221,970
$260,390
$245,265
$0
$500,000
$1,000,000
12/31/13 12/31/14 12/31/15 12/31/16 12/31/2017 6/30/2018
Stockholders' Equity Long-Term Debt Short-Term Debt *(in thousands)
Equity/Permanent
Capitalization70.3% 65.5% 70.6% 76.5% 71.1% 67.8%
Equity/Total
Capitalization54.3% 54.0% 51.9% 55.4% 51.5% 51.1%
* Short-Term Debt includes Current Portion of Long-Term Debt
$994,847$944,079
$805,010
$689,692
$556,148$513,384
Target Equity to
Total Capitalization
Ratio of 50% - 60%
110

Presentation Title Here
Long-term Debt Maturity ScheduleAnnual Principal Payments and Cost of Remaining Debt
$-
$5,000,000
$10,000,000
$15,000,000
$20,000,000
$25,000,000
$30,000,000
20
18
20
19
20
20
20
21
20
22
20
23
20
24
20
25
20
26
20
27
20
28
20
29
20
30
20
31
20
32
20
33
20
34
20
35
20
36
20
37
20
38
Annual Principal Payments
2022 amortization includes $8.0 million FPU 9.08% legacy note.
Total long-term debt with new issues $407 MM Committed $340 MM new long-term debt since 2013 at an average rate of 3.72% and average life of 12.9 years.
20
18
20
19
20
20
20
21
20
22
20
23
20
24
20
25
20
26
20
27
20
28
20
29
20
30
20
31
20
32
20
33
20
34
20
35
20
36
20
37
20
38
3.50%
3.60%
3.70%
3.80%
3.90%
4.00%
4.10%
4.20%Cost of Remaining Debt
111
Presentation Title Here
Anticipated Financing Plans Through 2022
• A significant portion of our capital spending will be funded internally given our high earnings retention rate
• Current plan does call for additional long-term permanent financing through 2022
• We will issue permanent financing to support achieving our target equity to total capitalization (including short-term debt) remains 50-60 percent
• We will continue to utilize our committed short-term lines of credit to provide flexible, cost-effective financing until projects are placed in service
• Private Placement Shelf Agreements• $50 Million long-term debt placement committed to fund in November 2018• $100 Million long-term debt placement committed to fund in August 2019• $250 Million in Available Shelf Agreement Capacity
• Equity offering may be necessary in 2019 as current projects under construction are fully-in service
112

Presentation Title Here
Dividend Growth Continues Dividend and Dividend Payout Ratio – With Room to Grow
5 Year Average Dividend Payout = 43%10 Year Average Dividend Payout = 46%
6.2% 6.5%4.9% 6.1% 6.6% 13.8%
$1.03 $1.08$1.15
$1.22$1.30
$1.48
0%
5%
10%
15%
20%
25%
30%
35%
40%
45%
50%
$0.00
$0.20
$0.40
$0.60
$0.80
$1.00
$1.20
$1.40
$1.60
2013 2014 2015 2016 2017 2018
Annualized Dividend and Payout Ratio
Annualized Dividends Payout Ratio
$0.81
2008
5 year CAGR in DPS = 7.6%
10 year CAGR in DPS = 6.2%
113

Chesapeake Utilities Corporation - Execution
• Consistently exceeds targets for total return, EPS and DPS growth and payout• Superior return compared to industry; average rank of 3.5 out of 44 for total return• Earnings growth 40 to 290 percent higher than the industry average• Dividend growth 14 to 250 percent higher than the industry average
Source – McManus Financial
Notes:
• Total Return is calculated without dividend reinvestment
• First Call consensus estimate used for 2018 earnings; all other earnings numbers reflect “adjusted earnings (for all companies)
• Dividend payout is calculated using dividends paid divided by adjusted earnings
• 2017-21 (Earnings Growth) = CAGR in consensus estimated EPS for 2021 over actual, adjusted EPS for 2017
114
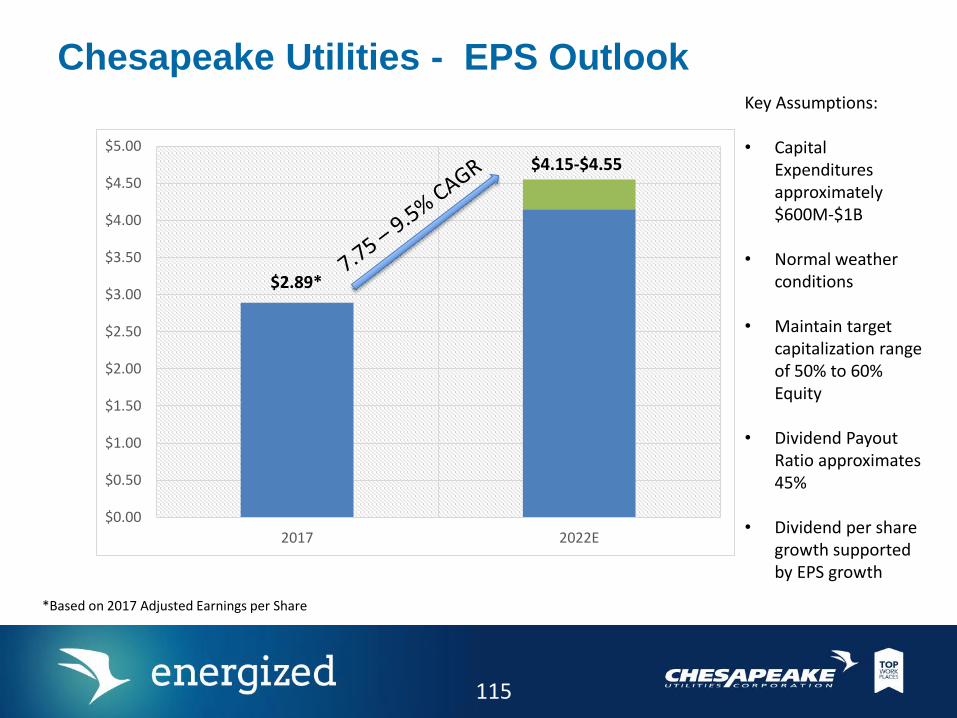
Chesapeake Utilities - EPS Outlook
$0.00
$0.50
$1.00
$1.50
$2.00
$2.50
$3.00
$3.50
$4.00
$4.50
$5.00
2017 2022E
$2.89*
$4.15-$4.55
*Based on 2017 Adjusted Earnings per Share
Key Assumptions:
• Capital Expenditures approximately $600M-$1B
• Normal weather conditions
• Maintain target capitalization range of 50% to 60% Equity
• Dividend Payout Ratio approximates 45%
• Dividend per share growth supported by EPS growth
115
Presentation Title Here
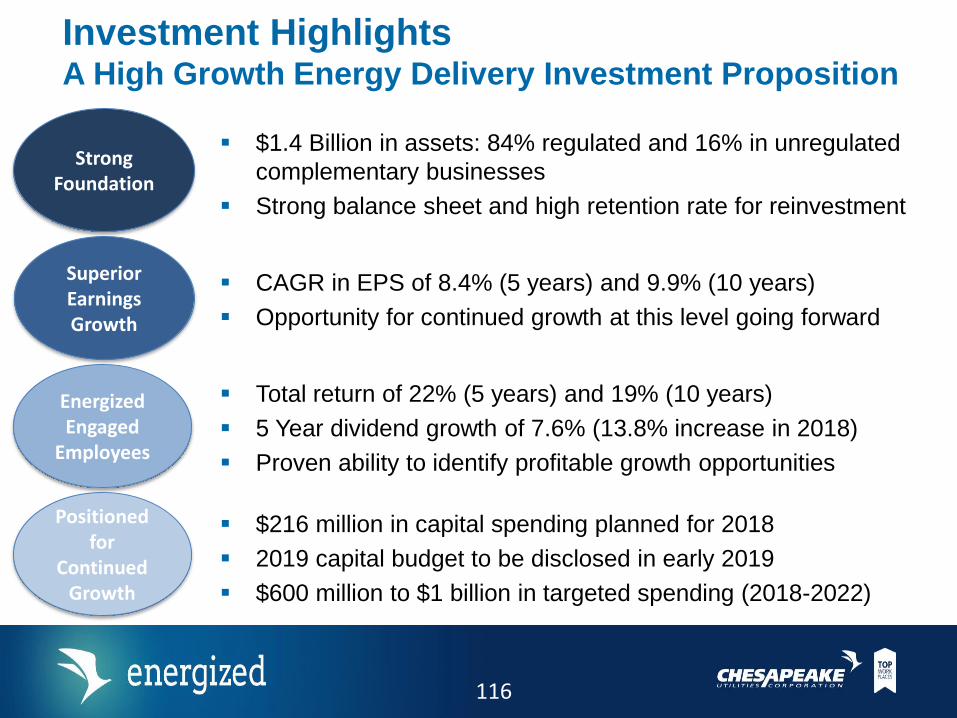
$1.4 Billion in assets: 84% regulated and 16% in unregulated
complementary businesses
Strong balance sheet and high retention rate for reinvestment
CAGR in EPS of 8.4% (5 years) and 9.9% (10 years)
Opportunity for continued growth at this level going forward
Total return of 22% (5 years) and 19% (10 years)
5 Year dividend growth of 7.6% (13.8% increase in 2018)
Proven ability to identify profitable growth opportunities
$216 million in capital spending planned for 2018
2019 capital budget to be disclosed in early 2019
$600 million to $1 billion in targeted spending (2018-2022)
Superior Earnings Growth
Strong Foundation
Energized Engaged
Employees
Positioned for
Continued Growth
Investment HighlightsA High Growth Energy Delivery Investment Proposition
116

Closing Remarks
117117

Presentation Title Here
Well positioned for 2019 and beyond!
Strong Company culture driven by energized
employees
Successful implementation of growth strategy
led by a deep management bench
Strategic platform for growth supports our
strategy and execution
Opportunities exist for continued growth
Disciplined execution of growth investments
118

Thank You!
119

Appendix
120

Corporate Depth
• Office of the General Counsel (including Legal,
Regulatory and Security) – Jim Moriarty
• Customer Care – Nicole Carter
• Information Technology – Vikrant Gadgil
• Safety, Communications and Human Resources
– Lou Anatrella
• Accounting, Finance and Investor Relations –
Beth Cooper
121

Presentation Title Here
Office of the General Counsel - Overview
• The office was established in March of 2015 and is responsible for all legal,
government relations, corporate governance, regulatory, and security
matters
• Our General Counsel chairs the Company’s Growth Council, Risk
Management Committee and Security Council, while other team members
actively participate in cross-functional groups
• We work closely with Company leadership to respond to significant
challenges in the energy industry, and to develop and implement our growth
strategies, including adjustments to the Company’s operations
• Our goal is to provide value added services to our stakeholders through
expertise and efficiency
• We have a broad reach across the enterprise serving a range of
stakeholders
• We are positioning for sustainable practices and sound risk management
122

Presentation Title Here
Office of the General Counsel - What We Do
• We develop strong and positive relationships with the members of the senior management team, as
well as with business unit leaders and other employees across the enterprise
• We continue to foster and develop strong and positive relationships with legislators, regulators, key
industry players and others in the community
• We are a trusted advisor and confidant and maintain an open door policy to all team members on
any subject matter
• We are comprised of hard working, bright people who do the right thing
• We value being a member of the team and are comfortable advocating or taking strong positions
when appropriate
• We advise on activities that enable the Company to leverage existing and new relationships
• We bring structure and uniformity to contracts, transactions and commercial relationships across the
Company
• We generate awareness of legal review and continue to lower the transactional risk across the
organization
• We have facilitated free flow of legal and regulatory information and advice between departments by
centralizing and standardizing processes and discussions
• Outreach efforts across the organization continue to strengthen cross-functional dialogue
123
Presentation Title Here
Living our CultureCorporate Governance Accolades
2018 Best North American Utility for Corporate Governance
• Ethical Boardroom magazine named us the Best North American Utility for
Corporate Governance
• Our commitment to a culture that promotes integrity and accountability, along with
hard work and dedication of our team, is the foundation for our continued success
2017 Governance Team of the Year
• We took top honors at the Corporate Secretary magazine’s 10th annual Corporate
Governance Awards ceremony in NYC on November 9, 2017 for Governance
Team of the Year (small to mid-cap sized companies)
• We are committed to the highest ethical standards, compliance and best practices
in corporate governance, which are embedded in the Company’s culture and
values
Other award winners included Apple, Eli Lilly and Company, Honeywell, Intel Corporation, Microsoft, PepsiCo, Visa and
USAA.
124

Presentation Title Here
Safety, Communications, and Human Resources
• Chief Human Resources Officer established in 2017.
• Combined Human Resources, Safety, and Communications teams in May
of 2018.
• Together, we are responsible for all corporate health and safety programs;
Company brand management; internal and external communications;
engagement, culture, and talent management; compensation and benefits;
and employee and labor relations.
• Our CHRO chairs the Employee Benefits Committee, sponsors the
Company’s Leadership Development Academy, and is involved in the
Company’s Growth Council.
• We Enable Success through Leadership (We are a Powerful Catalyst for
Change) by understanding the business strategy in order to drive the people
strategy
125

Presentation Title Here
Promoting Our Brand Values
LeadershipDevelopment
Compensation and
BenefitsSuccession
Management
Performance Management
Our Strategic Priorities
126

Presentation Title Here
Information TechnologyCreating Scale & Supporting Growth
Highlights :
• Build People, Process and Systems infrastructure to support growth
• Utilize technology to create scale and achieve efficiencies.
• Realize efficiencies and speed through a balance of capabilities between corporate functions and Business Units
Business & Information Services:
• Basic IT services including Telephony, Networks, Workplace Technology, Productivity Tools, eMail
• Provide support to end users on technology needs including office productivity applications and mobile devices
• Support a growing business and geographic footprint.
• Delivering business enabling technology projects such as Mobile Work Orders, Budgeting and Planning, Billing Systems, Customer Portal
• Support applications and enhancements in all functional areas and business units
• Provide secure and reliable IT infrastructure through sound Cyber Security practices
127

Presentation Title Here
Information TechnologyCreating Scale & Supporting Growth
Enterprise Project Management Office :
• Enterprise Project Management Office was created to support large capital and enterprise projects.
• The team is staffed with Project Management professionals and are tasked with establishing strong project management capability and processes and to lead assigned projects.
• The team continues to support enterprise, facilities and capital projects directly and indirectly.
• With about a billion dollar capital spend projected over 5 years, project management excellence is a key capability for effective delivery of the projects underpinning this investment.
Procurement :
• Created a Corporate procurement department in 2017
• Hired procurement leader and identified opportunity across over $ 200 million of addressable annual spend.
• Executive advisory council in place to guide multiple sourcing initiatives across categories ranging from Travel, Pipes and MRO.
• Potential of $ 10 million in savings in both capital and expense.
• Developing capabilities in sourcing, streamlining purchase and contracting processes and enhancing vendor interactions.
• Expecting gain in processes efficiency and purchasing leverage to enhance value.
128

Presentation Title Here
Customer Care
• Chesapeake's customer strategy is guided by our Service Excellence Model:• Safety, WOW, Presentation, and Delivering Results
• The Voice of the Customer (VOC) program allows us to gain insight on customer sentiment, identify areas of strength, areas customers would like to see improved, and new service offering opportunities.
• VOC analytics and metrics include Customer Satisfaction, Transactional Net Promoter Score, Customer Effort, First Contact Resolution, Internal customer experience, and Quality scores.
• Chesapeake strives to balance customer innovation with fiscal responsibility.
• Business transformation in technology will allow Chesapeake to marry the best of the human interactions and digital capabilities.
129

Finance Team
Key Services
• Treasury Services– Cash management
– Credit management (evaluation and monitoring)
– Financing (debt and equity)
– Risk management and insurance
– Investor relations
• Internal Audit – Enterprise Risk Management
– Operational audit
– Internal control environment (evaluate effectiveness and monitoring)
– SOX compliance
• Financial Planning & Analysis– Budget and forecast compilation and analytics
– Assisting with strategic initiatives, including review of financial models
– Enhance analytics
• Accounting System and Process Improvement – Accounting system administration
– Project coordination and support for process improvements
– Project management, prioritization and execution
130

Finance Team Supporting the Business
• Accounting– Business Unit Accounting (Delmarva regulated, Florida regulated, unregulated)
• General ledger and plant accounting
• Analytics and reconciliation
• Revenue, sales, franchise and property taxes
• Regulatory annual reports (FERC forms)
– Shared Services
– Accounts Payable
– Corporate Accounting & Allocations
• Financial Policy
– Technical accounting• Evaluate regulatory and accounting treatment of Company initiatives
– Analysis and financial support
– Evaluate Company’s compliance with emerging GAAP and potential impact
– Liaison with business units, rates and regulatory group, and accounting as it relates to regulatory matters
• Financial Reporting and Tax Compliance
– Internal reporting to management and Board of Directors
– External SEC reporting (10-Q, 10-K, earnings release)
– Stand-alone financial statements
– Income tax compliance
– Payroll tax compliance
131

Regulatory Information
132

ESNG Regulatory Snapshot
Commission Structure: 5 commissioners
• Full-Time
• Presidential Appointment
Regulatory Jurisdiction: FERC
Base Rate Proceeding:
Delay in collection of rates subsequent to filing
application
Up to 180 days
Application date associated with the most recent
permanent rates
1/27/2017
Effective date of permanent rates 8/1/2017
Rate increase (decrease) approved $9.8M, exclusive of TCJA impact
Stay-out Provision 3 years, expires April 1, 2021
133

Regulatory Snapshot - Chesapeake Utilities
Chesapeake -
Delaware Division
Chesapeake -
Maryland Division
Commission Structure: 5 commissioners 5 commissioners
Part-Time Full-Time
Gubernatorial
Appointment
Gubernatorial
Appointment
Regulatory
Jurisdiction: Delaware PSC Maryland PSC
Base Rate Proceeding:
Delay in collection of
rates subsequent to filing
application 60 days 180 days
Application date
associated with the most
recent permanent rates 12/21/2015 5/1/2006
Effective date of
permanent rates 01/01/20171 12/1/20072
Rate increase (decrease)
approved $2.25 million $648,000
Return on Equity
approved 9.75% 10.75%
1The Delaware Division, as directed by the DE PSC, filed proposed rates
reflecting the benefits of the corporate income tax decrease from 35% to
21%, showing an annual rate reduction of approximately $1.12M. However,
the DE PSC has not yet responded to the Company’s proposal.
2Maryland Division’s delivery service rates were subsequently changed,
effective 05/01/2018, due to the impact of the TCJA.
• New rate schedules were established for residential and small-to-medium commercial customers in designated Underserved Areas (USA)
• USA rates include an incremental $25.50 per month added to the customer charge, which allows the Company to extend service economically to more areas where natural gas is not available
• Eligible customers will remain on USA rates for 13 years
Area Expansion –USA
Rates
(2017)
•Maryland Division was directed by the MD PSC to file revised rates reflecting the benefits of the corporate income tax decrease from 35% to 21%
•The total impact on Maryland Division’s revenue requirement from this income tax change was an annual revenue reduction of approximately $472K
•As a result of rate reductions, an average residential heating customers’ bill will decrease by approximately $32 per year
Tax Cuts and
Jobs Act
(2018)
134

Regulatory Snapshot - Sandpiper Energy
Sandpiper Energy
Commission Structure: 5 commissioners
Full-Time
Gubernatorial Appointment
Regulatory Jurisdiction: Maryland PSC
Base Rate Proceeding:
Delay in collection of rates
subsequent to filing
application 180 days
Application date
associated with the most
recent permanent rates 12/01/2015
Effective date of
permanent rates 12/01/20161
Rate increase (decrease)
approved Revenue Neutral2
Return on Equity approved Not Specified
1Sandpiper’s delivery service rates were subsequently changed, effective 05/01/2018, due
to the impact of the TJCA.
2Represents results for Year 1. The settlement agreement in Sandpiper’s most recent
rate case provided for an annual revenue reduction that is proportionally related to the
projected number of customers converted from propane to natural gas service each year.
•Sandpiper was directed by the MD PSC to file revised rates reflecting the benefits of the corporate income tax decrease from 35% to 21%
•The total impact on Sandpiper’s revenue requirement from this income tax change was an annual revenue reduction of approximately $500K
•As a result of rate reductions, an average residential heating customer’s bill will decrease by approximately $50 per year
Tax Cuts and Jobs Act
(2018)
135

Regulatory Snapshot – Florida Public UtilitiesFlorida Public Utilities – Natural Gas
UnitsCommission Structure: 5 commissioners
Full-Time
Gubernatorial Appointment
Regulatory Jurisdiction: Florida PSC
Base Rate Proceeding:
Delay in collection of rates
subsequent to filing
application
FPUC 13 months
CFG 6 months
Application date associated
with the most recent
permanent rates
FPUC 12/17/2008
CFG 7/14/2009
Effective date of permanent
rates
FPUC 1/14/2010
CFG 1/14/2010
Rate increase (decrease)
approved
FPUC $7.96M
CFG $2.53M
Return on Equity approved FPUC 10.85%
CFG 10.8%
•The Florida Public Service Commission (FPSC) has not issued an order, but they are evaluating options for adjusting rates in response to the impacts created by the TCJAT.
•The Commission decided to attach jurisdiction effective February 6, 2018.
•On February 23, 2018, the FPSC opened individual dockets on every distribution company (gas and electric) to consider the tax impacts associated with TCJA. The FPSC has set a target date 4th quarter 2018 for final resolution of the disposition of the tax impacts for the natural gas companies.
•FPUC’s natural gas units are not operating under any settlement agreements in regards to the TCJA. The potential impacts have been calculated, but no final decision has been made internally and no discussion has occurred with the FPSC regarding the plan for disposition of the tax impacts
Tax Cuts and Jobs
Act
(2018)
136

Regulatory Snapshot – Florida Public Utilities
Florida Public Utilities – Electric UnitCommission Structure: 5 commissioners
Full-Time
Gubernatorial Appointment
Regulatory Jurisdiction: Florida PSC
Base Rate Proceeding:
Delay in collection of rates
subsequent to filing
application
6 months
Application date associated
with the most recent
permanent rates
07/03/20171
Effective date of permanent
rates
1//22/2018
Rate increase (decrease)
approved
$1.56M
Return on Equity approved 10.25%
1Limited Proceeding The settlement agreement in provides for an annual revenue recovery for
Storm Hardening of the grid and the FPL Interconnect.
•The Florida Public Service Commission (FPSC) has not issued an order, but they are evaluating options for adjusting rates in response to the impacts created by the TCJAT.
•The Commission decided to attach jurisdiction effective February 6, 2018.
•On February 23, 2018, the FPSC opened individual dockets on every distribution company (gas and electric) to consider the tax impacts associated with TCJA. The FPSC has set a target date of the 1st quarter of 2019 for final resolution for the electric companies.
•FPCU’s electric division is under an Order (PSC-2017-0488-PAA-EI), resulting from the settlement of the electric limited proceeding (Docket No. 20170150-EI), which prescribes the applicability, timing, and treatment of the implications of TCJA.
Tax Cuts and Jobs
Act
(2018)
137

Presentation Title Here
Regulatory Snapshot
138
Related Documents