INVESTOR DAY PROPRIETARY AND PROTECTED INFORMATION. MAY NOT BE COPIED, SHARED OR DISTRIBUTED WITHOUT CITIGROUP WRITTEN CONSENT. ©2022 CITIGROUP INC.

Welcome message from author
This document is posted to help you gain knowledge. Please leave a comment to let me know what you think about it! Share it to your friends and learn new things together.
Transcript
I N V E S T O R D AY
PROPRIETARY AND PROTECTED INFORMATION. MAY NOT BE COPIED, SHARED OR DISTRIBUTED WITHOUT CITIGROUP WRITTEN CONSENT. ©2022 CITIGROUP INC.
M A R K M A S O NC H I E F F I N A N C I A L O F F I C E R, C I T I
1
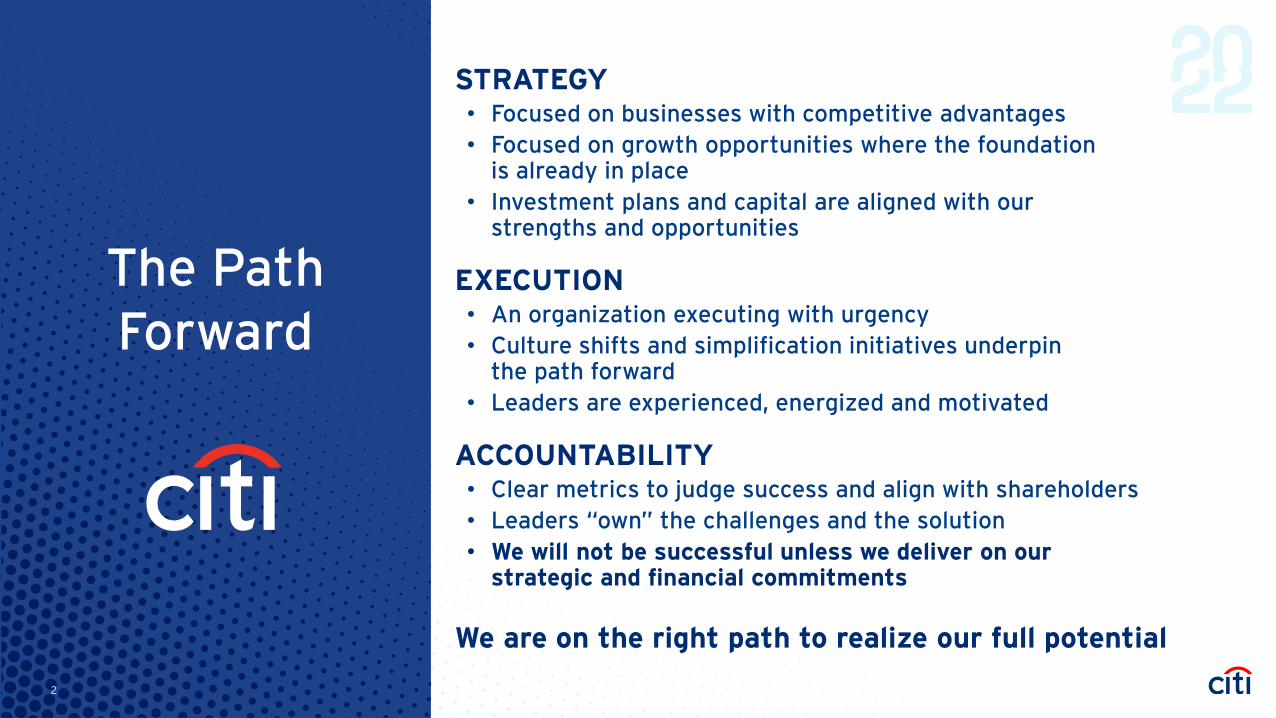
STRATEGY• Focused on businesses with competitive advantages • Focused on growth opportunities where the foundation
is already in place • Investment plans and capital are aligned with our
strengths and opportunities
EXECUTION• An organization executing with urgency• Culture shifts and simplification initiatives underpin
the path forward • Leaders are experienced, energized and motivated
ACCOUNTABILITY• Clear metrics to judge success and align with shareholders • Leaders “own” the challenges and the solution• We will not be successful unless we deliver on our
strategic and financial commitments
We are on the right path to realize our full potential
The Path Forward
2
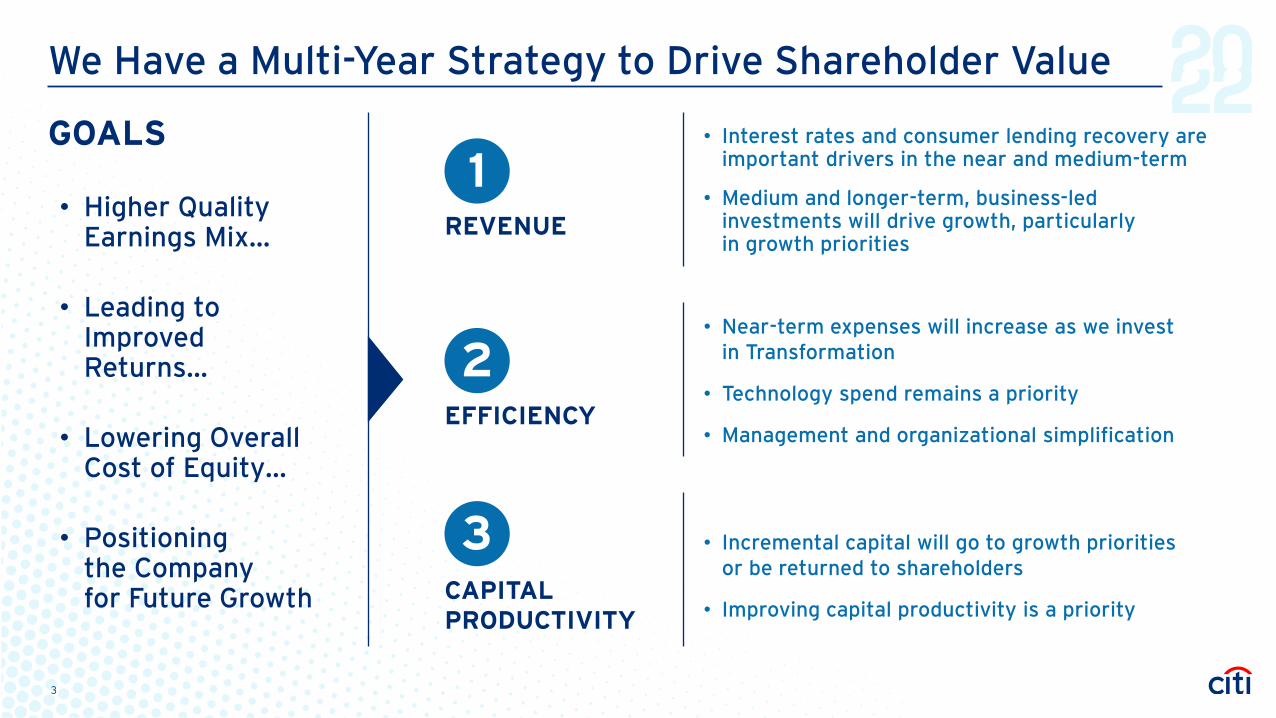
We Have a Multi-Year Strategy to Drive Shareholder Value
GOALS
• Higher Quality Earnings Mix...
• Leading to Improved Returns…
• Lowering Overall Cost of Equity…
• Positioning the Company for Future Growth
• Interest rates and consumer lending recovery are important drivers in the near and medium-term
• Medium and longer-term, business-led investments will drive growth, particularly in growth priorities
• Near-term expenses will increase as we invest in Transformation
• Technology spend remains a priority
• Management and organizational simplification
• Incremental capital will go to growth priorities or be returned to shareholders
• Improving capital productivity is a priority
REVENUE
1
EFFICIENCY
2
CAPITALPRODUCTIVITY
3
3
Brief Recap of Our Historical Performance Assessment of our challenges and drivers of underperformance
4
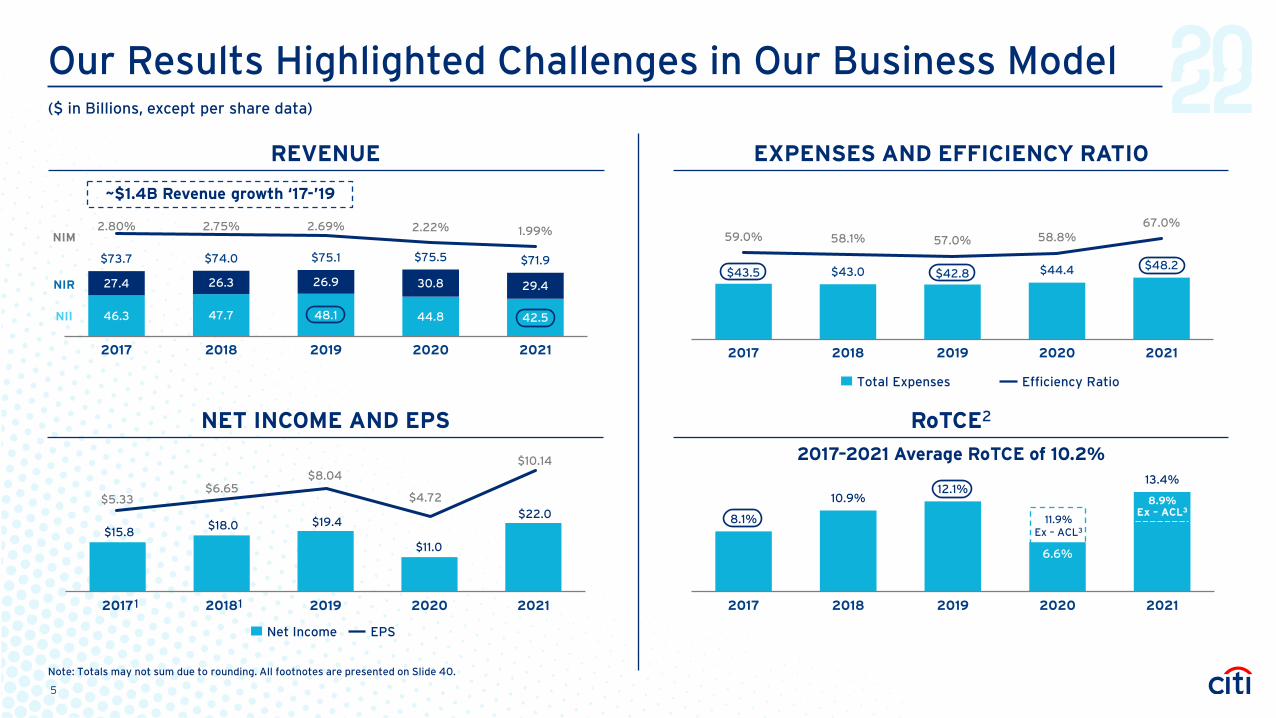
Our Results Highlighted Challenges in Our Business Model
REVENUE EXPENSES AND EFFICIENCY RATIO
NET INCOME AND EPS RoTCE2
$43.5 $43.0 $42.8 $44.4 $48.2
59.0% 58.1% 57.0% 58.8%67.0%
10.0%
20.0%
30.0%
40.0%
50.0%
60.0%
70.0%
2017 2018 2019 2020 2021
8.1%
10.9%12.1%
6.6%
13.4%
2017 2018 2019 2020 2021
11.9% Ex – ACL3$15.8
$18.0 $19.4
$11.0
$22.0
2017 2018 2019 2020 2021
$5.33$6.65
$8.04
$4.72
$10.14
46.3 47.7 48.1 44.8 42.5
27.4 26.3 26.9 30.8 29.4
$73.7 $74.0 $75.1 $75.5 $71.9
2.80% 2.75% 2.69% 2.22% 1.99%
2017 2018 2019 2020 2021
NII
NIR
NIM
EPSNet Income
2017–2021 Average RoTCE of 10.2%
8.9% Ex – ACL3
1 1
~$1.4B Revenue growth ‘17-’19
($ in Billions, except per share data)
Note: Totals may not sum due to rounding. All footnotes are presented on Slide 40.
Efficiency RatioTotal Expenses
5
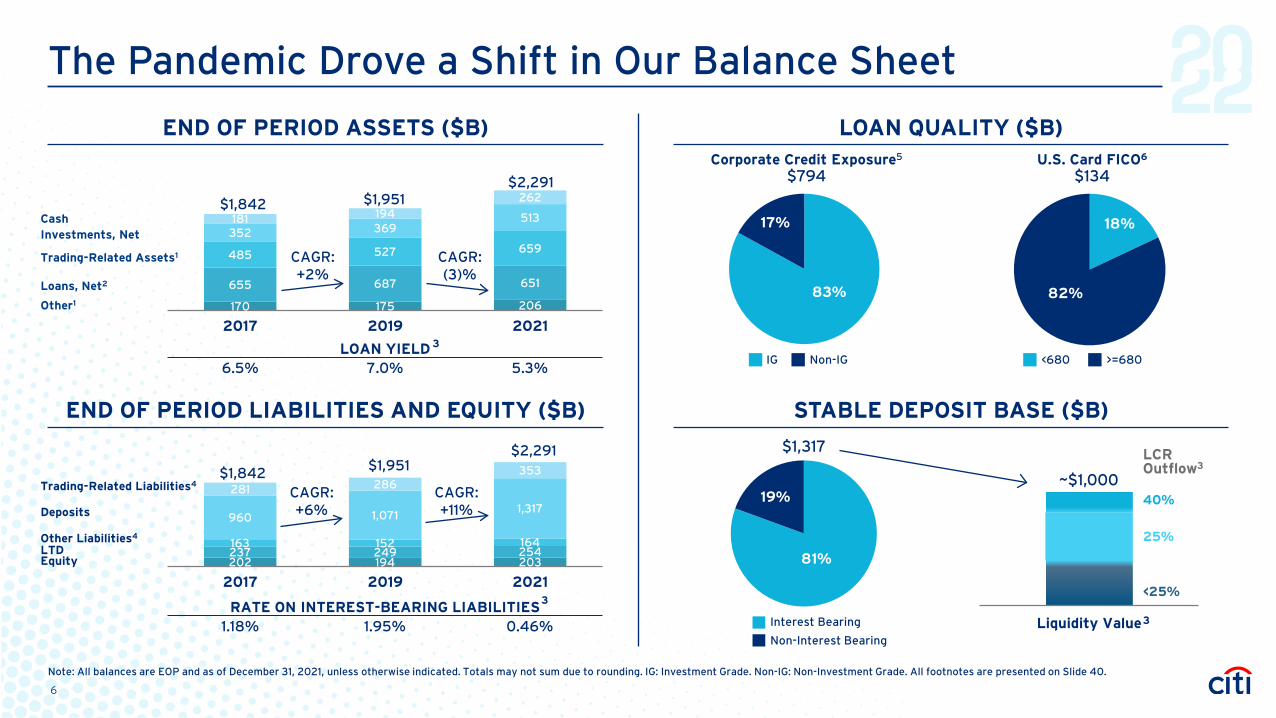
The Pandemic Drove a Shift in Our Balance Sheet
LOAN YIELD6.5% 7.0% 5.3%
END OF PERIOD ASSETS ($B) LOAN QUALITY ($B)
CashInvestments, Net
Trading-Related Assets1
Loans, Net2
Other1
Corporate Credit Exposure5
$794
83%
17%
Non-IGIG
RATE ON INTEREST-BEARING LIABILITIES1.18% 1.95% 0.46%
Trading-Related Liabilities4
Deposits
Other Liabilities4
LTDEquity 81%
19%
Non-Interest Bearing
Interest Bearing
$1,317
202 194 203237 249 254163 152 164
960 1,0711,317
281 286353$1,842 $1,951
$2,291
2017 2019 2021
170 175 206
655 687 651
485 527 659 352 369
513 181 194 262 $1,842 $1,951
$2,291
2017 2019 2021
CAGR:+6%
CAGR:+2%
CAGR:(3)%
CAGR:+11%
3
3
Liquidity Value
~$1,000
18%
82%
U.S. Card FICO6
$134
LCR Outflow3
<25%
25%
40%
3
Note: All balances are EOP and as of December 31, 2021, unless otherwise indicated. Totals may not sum due to rounding. IG: Investment Grade. Non-IG: Non-Investment Grade. All footnotes are presented on Slide 40.
END OF PERIOD LIABILITIES AND EQUITY ($B) STABLE DEPOSIT BASE ($B)
<680 >=680
6
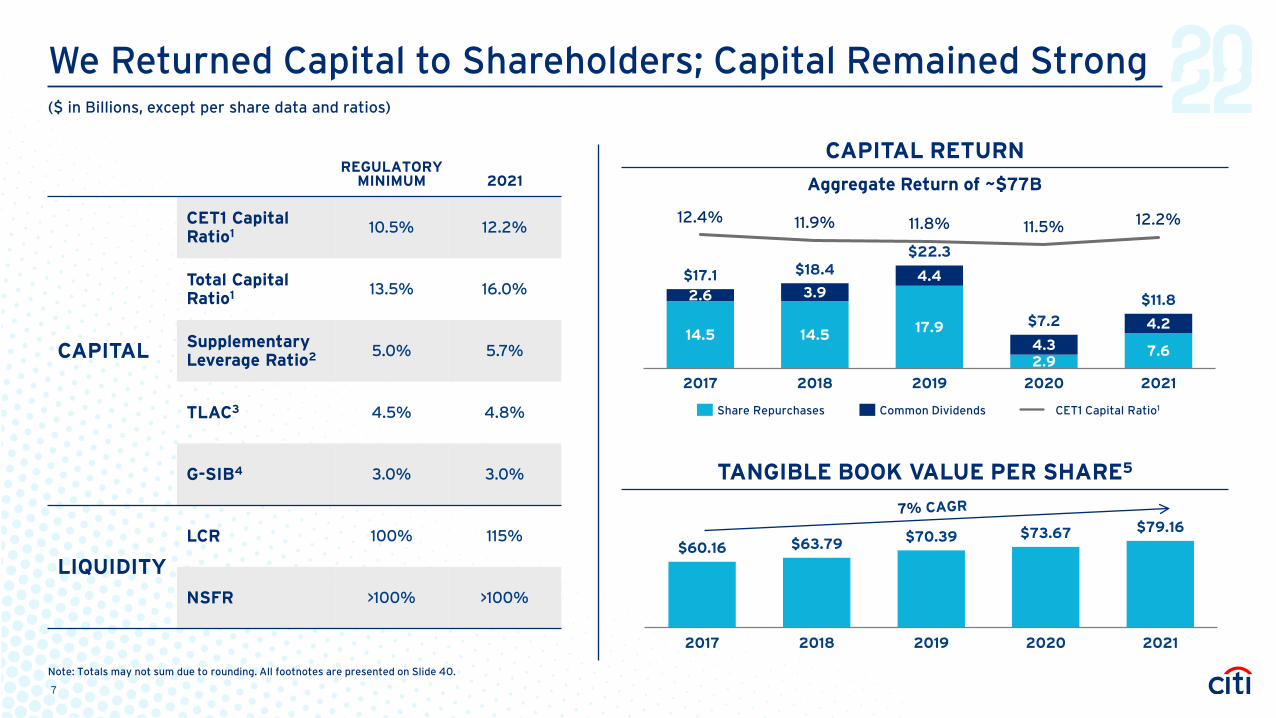
We Returned Capital to Shareholders; Capital Remained Strong
REGULATORY MINIMUM 2021
CAPITAL
CET1 Capital Ratio1 10.5% 12.2%
Total Capital Ratio1 13.5% 16.0%
Supplementary Leverage Ratio2 5.0% 5.7%
TLAC3 4.5% 4.8%
G-SIB4 3.0% 3.0%
LIQUIDITY
LCR 100% 115%
NSFR >100% >100%
14.5 14.5 17.9
2.97.6
2.6 3.94.4
4.3
4.2
$17.1 $18.4$22.3
$7.2
$11.8
12.4% 11.9% 11.8% 11.5% 12.2%
2017 2018 2019 2020 2021
$60.16 $63.79 $70.39 $73.67 $79.16
2017 2018 2019 2020 2021
TANGIBLE BOOK VALUE PER SHARE5
Common DividendsShare Repurchases CET1 Capital Ratio1
Aggregate Return of ~$77B
CAPITAL RETURN
Note: Totals may not sum due to rounding. All footnotes are presented on Slide 40.
($ in Billions, except per share data and ratios)
7
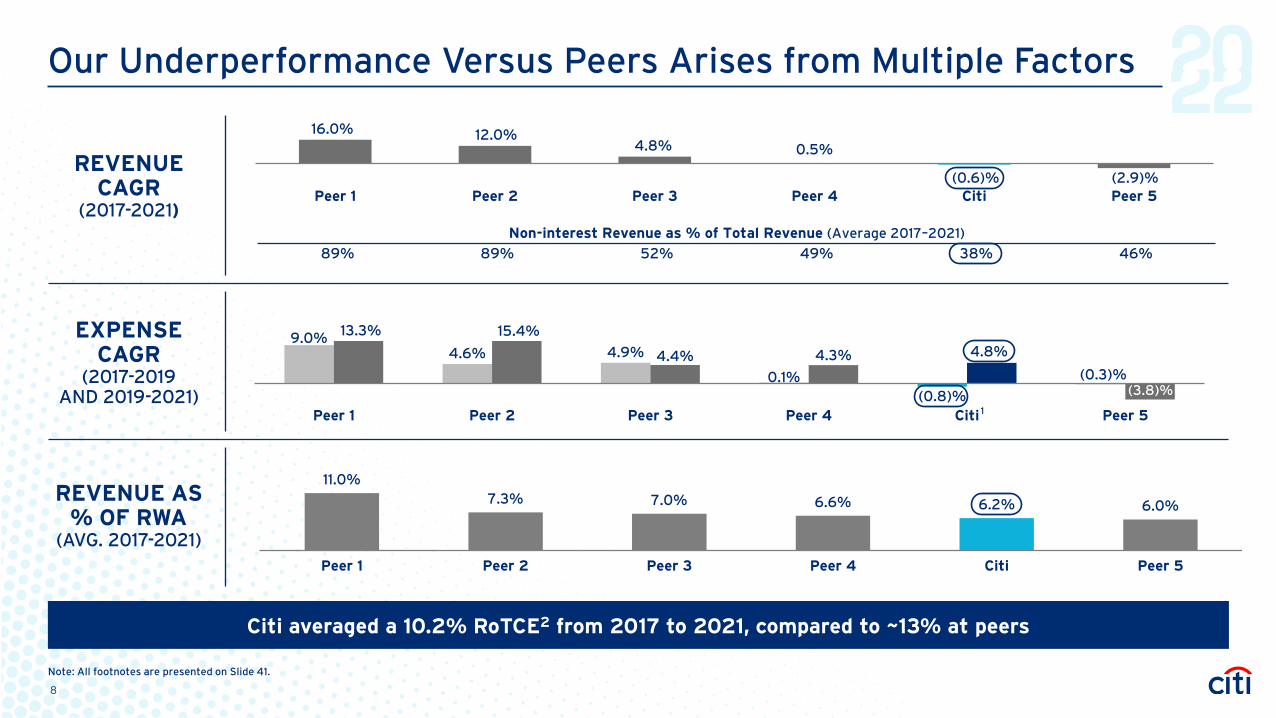
Our Underperformance Versus Peers Arises from Multiple Factors
Citi averaged a 10.2% RoTCE2 from 2017 to 2021, compared to ~13% at peers
REVENUE CAGR
(2017-2021)
EXPENSE CAGR
(2017-2019 AND 2019-2021)
REVENUE AS % OF RWA
(AVG. 2017-2021)
16.0% 12.0% 4.8% 0.5%
Peer 1 Peer 2 Peer 3 Peer 4 Citi Peer 5
9.0%4.6% 4.9%
0.1%(0.8)%
(0.3)%4.4% 4.3% 4.8%
(3.8)%
Peer 1 Peer 2 Peer 3 Peer 4 Citi Peer 5
15.4%13.3%
1
11.0%7.3% 7.0% 6.6% 6.2% 6.0%
Peer 1 Peer 2 Peer 3 Peer 4 Citi Peer 5
Non-interest Revenue as % of Total Revenue (Average 2017–2021)
89% 89% 52% 49% 38% 46%
Note: All footnotes are presented on Slide 41.
8
(2.9)%(0.6)%
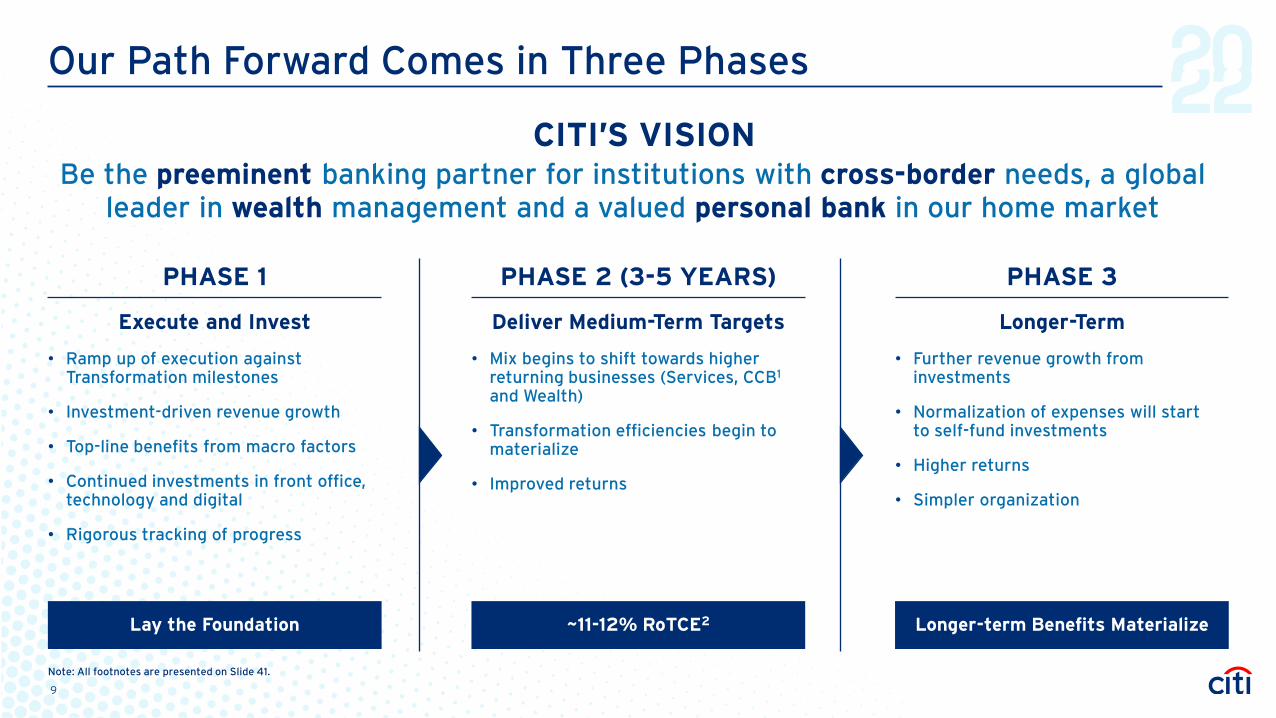
Our Path Forward Comes in Three Phases
PHASE 1
• Ramp up of execution against Transformation milestones
• Investment-driven revenue growth
• Top-line benefits from macro factors
• Continued investments in front office, technology and digital
• Rigorous tracking of progress
Lay the Foundation
Execute and Invest
PHASE 2 (3-5 YEARS)
• Mix begins to shift towards higher returning businesses (Services, CCB1
and Wealth)
• Transformation efficiencies begin to materialize
• Improved returns
~11-12% RoTCE2
Deliver Medium-Term Targets
PHASE 3
• Further revenue growth from investments
• Normalization of expenses will start to self-fund investments
• Higher returns
• Simpler organization
Longer-term Benefits Materialize
Longer-Term
Be the preeminent banking partner for institutions with cross-border needs, a global leader in wealth management and a valued personal bank in our home market
OUR CITI’S VISION
Note: All footnotes are presented on Slide 41.
9
Phase 1 – Execute and InvestDeliver on strategic refresh, transformation and investment agenda
10
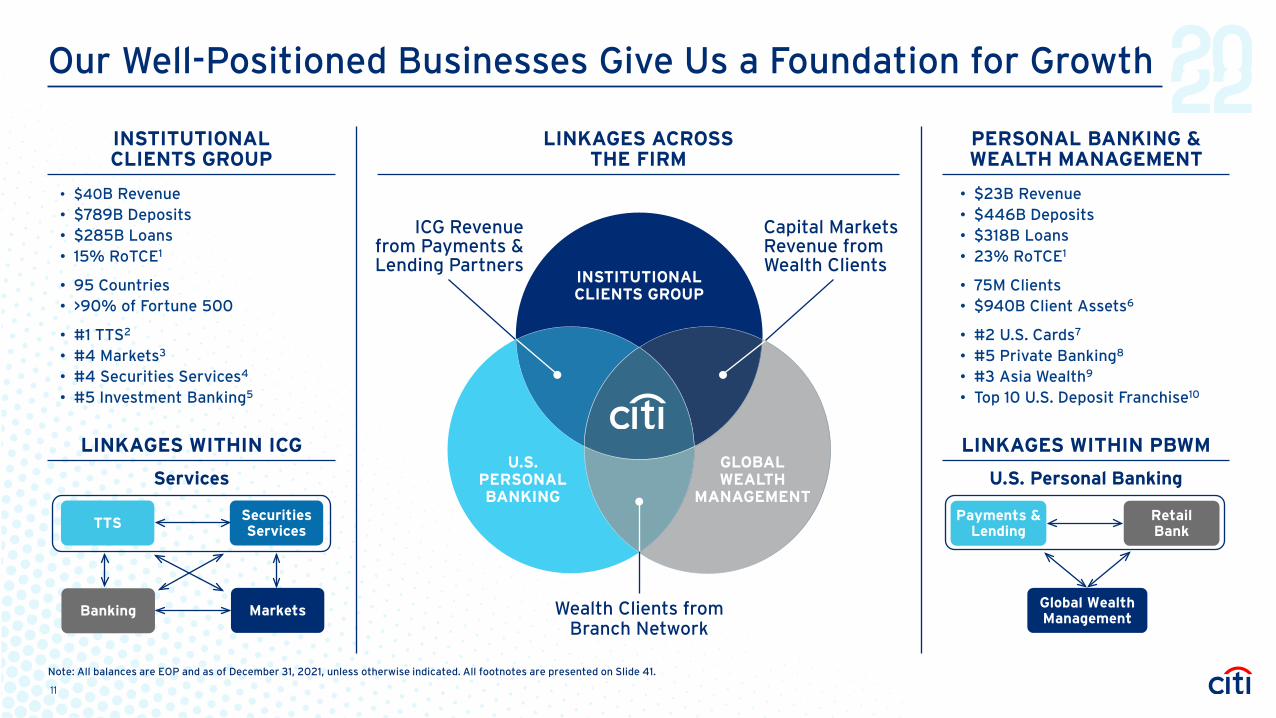
Our Well-Positioned Businesses Give Us a Foundation for Growth
Securities Services
Markets
TTS
Banking
Services
INSTITUTIONAL CLIENTS GROUP
LINKAGES ACROSS THE FIRM
PERSONAL BANKING & WEALTH MANAGEMENT
• $40B Revenue• $789B Deposits• $285B Loans• 15% RoTCE1
• 95 Countries• >90% of Fortune 500
• #1 TTS2
• #4 Markets3
• #4 Securities Services4
• #5 Investment Banking5
LINKAGES WITHIN ICG
INSTITUTIONAL CLIENTS GROUP
GLOBAL WEALTH
MANAGEMENT
U.S. PERSONAL BANKING
Wealth Clients from Branch Network
Capital Markets Revenue from Wealth Clients
ICG Revenue from Payments & Lending Partners
• $23B Revenue• $446B Deposits• $318B Loans• 23% RoTCE1
• 75M Clients• $940B Client Assets6
• #2 U.S. Cards7
• #5 Private Banking8
• #3 Asia Wealth9
• Top 10 U.S. Deposit Franchise10
LINKAGES WITHIN PBWM
U.S. Personal Banking
Global Wealth Management
Payments & Lending
Retail Bank
Note: All balances are EOP and as of December 31, 2021, unless otherwise indicated. All footnotes are presented on Slide 41.
11
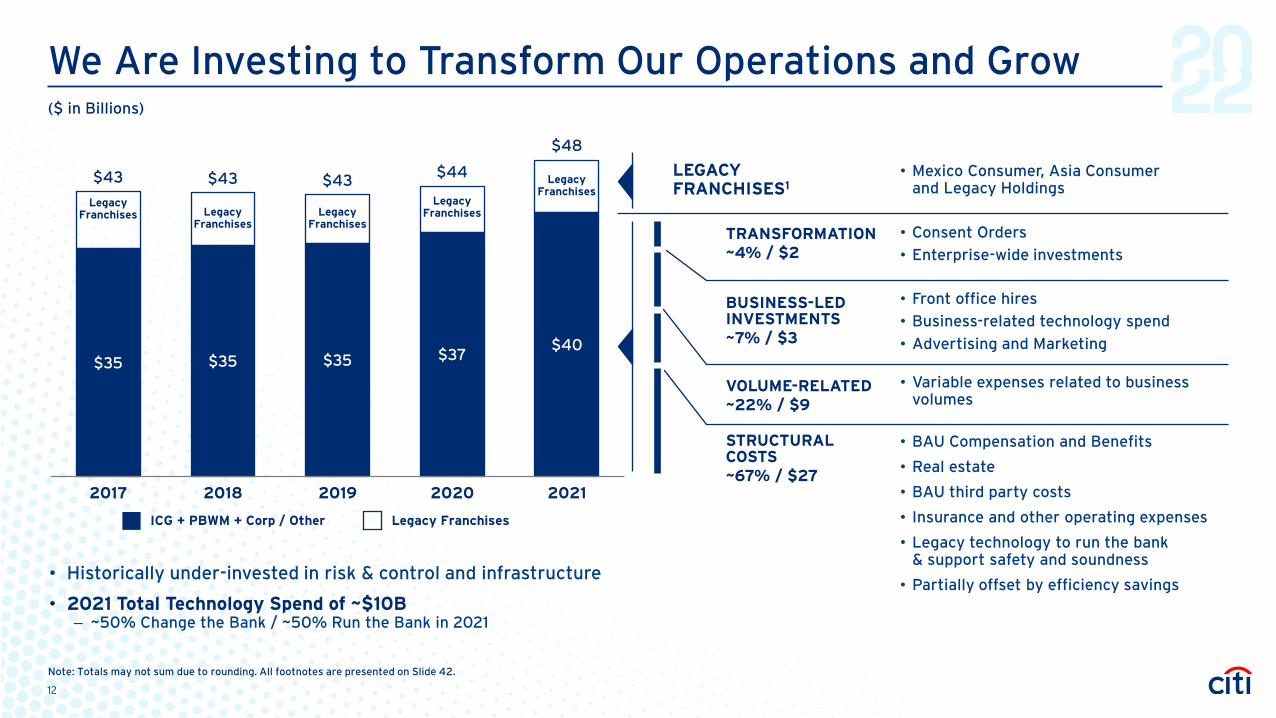
We Are Investing to Transform Our Operations and Grow
$35 $35 $35 $37$40
$43 $43 $43 $44
$48
2017 2018 2019 2020 2021
Legacy Franchises
• Mexico Consumer, Asia Consumer and Legacy Holdings
LEGACYFRANCHISES1
• Consent Orders
• Enterprise-wide investments
• Variable expenses related to business volumes
• BAU Compensation and Benefits
• Real estate
• BAU third party costs
• Insurance and other operating expenses
• Legacy technology to run the bank & support safety and soundness
• Partially offset by efficiency savings
TRANSFORMATION~4% / $2
VOLUME-RELATED~22% / $9
STRUCTURAL COSTS~67% / $27
• Front office hires
• Business-related technology spend
• Advertising and Marketing
BUSINESS-LED INVESTMENTS~7% / $3
ICG + PBWM + Corp / Other Legacy Franchises
Note: Totals may not sum due to rounding. All footnotes are presented on Slide 42.
($ in Billions)
Legacy Franchises
Legacy Franchises Legacy
FranchisesLegacy
Franchises
• Historically under-invested in risk & control and infrastructure
• 2021 Total Technology Spend of ~$10B‒ ~50% Change the Bank / ~50% Run the Bank in 2021
12
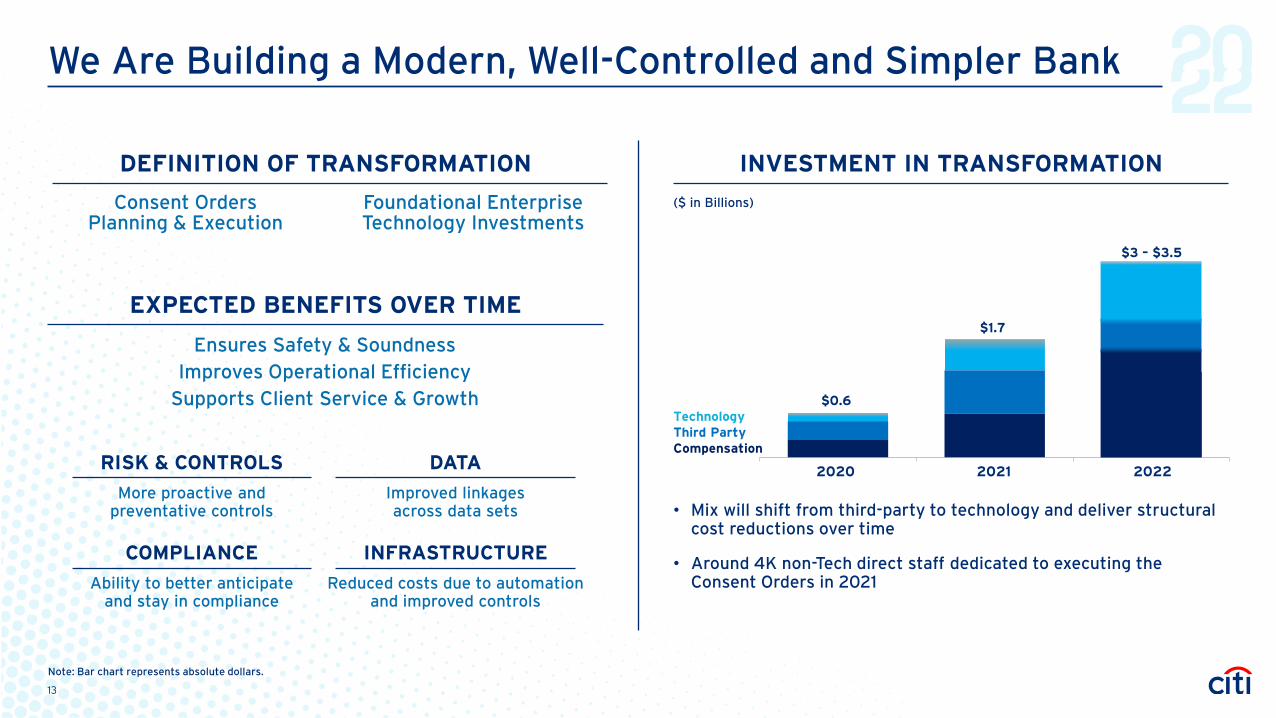
$0.6
$1.7
2020 2021 2022
We Are Building a Modern, Well-Controlled and Simpler Bank
($ in Billions)
• Mix will shift from third-party to technology and deliver structural cost reductions over time
• Around 4K non-Tech direct staff dedicated to executing the Consent Orders in 2021
TechnologyThird PartyCompensation
DEFINITION OF TRANSFORMATION INVESTMENT IN TRANSFORMATION
EXPECTED BENEFITS OVER TIME
Ensures Safety & SoundnessImproves Operational Efficiency
Supports Client Service & Growth
Consent OrdersPlanning & Execution
Foundational Enterprise Technology Investments
$3 – $3.5
$0.6
$1.7
Note: Bar chart represents absolute dollars.
DATA
Improved linkages across data sets
INFRASTRUCTURE
Reduced costs due to automation and improved controls
RISK & CONTROLS
More proactive and preventative controls
COMPLIANCE
Ability to better anticipate and stay in compliance
2021 20222020
13
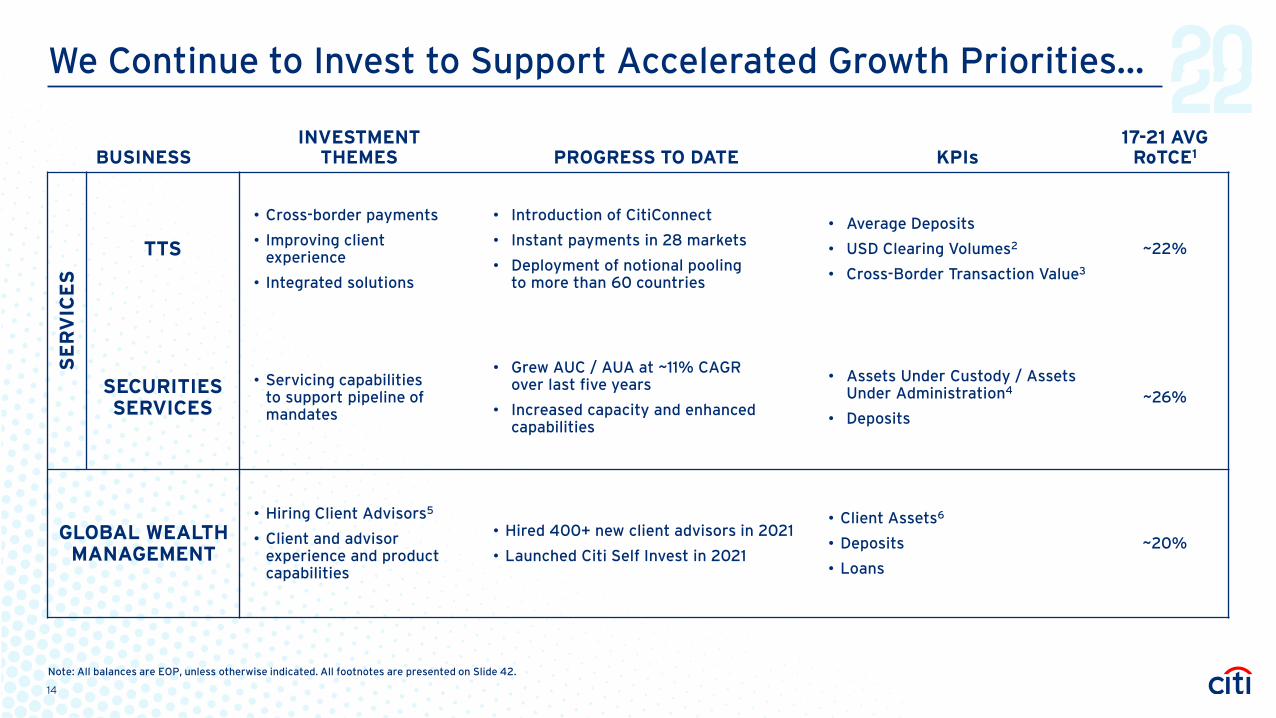
We Continue to Invest to Support Accelerated Growth Priorities...
BUSINESSINVESTMENT
THEMES PROGRESS TO DATE KPIs17-21 AVG
RoTCE1
SE
RV
ICE
S
TTS
• Cross-border payments
• Improving client experience
• Integrated solutions
• Introduction of CitiConnect
• Instant payments in 28 markets
• Deployment of notional pooling to more than 60 countries
• Average Deposits
• USD Clearing Volumes2
• Cross-Border Transaction Value3
~22%
SECURITIES SERVICES
• Servicing capabilities to support pipeline of mandates
• Grew AUC / AUA at ~11% CAGR over last five years
• Increased capacity and enhanced capabilities
• Assets Under Custody / Assets Under Administration4
• Deposits~26%
GLOBAL WEALTHMANAGEMENT
• Hiring Client Advisors5
• Client and advisor experience and product capabilities
• Hired 400+ new client advisors in 2021
• Launched Citi Self Invest in 2021
• Client Assets6
• Deposits
• Loans
~20%
Note: All balances are EOP, unless otherwise indicated. All footnotes are presented on Slide 42.
14
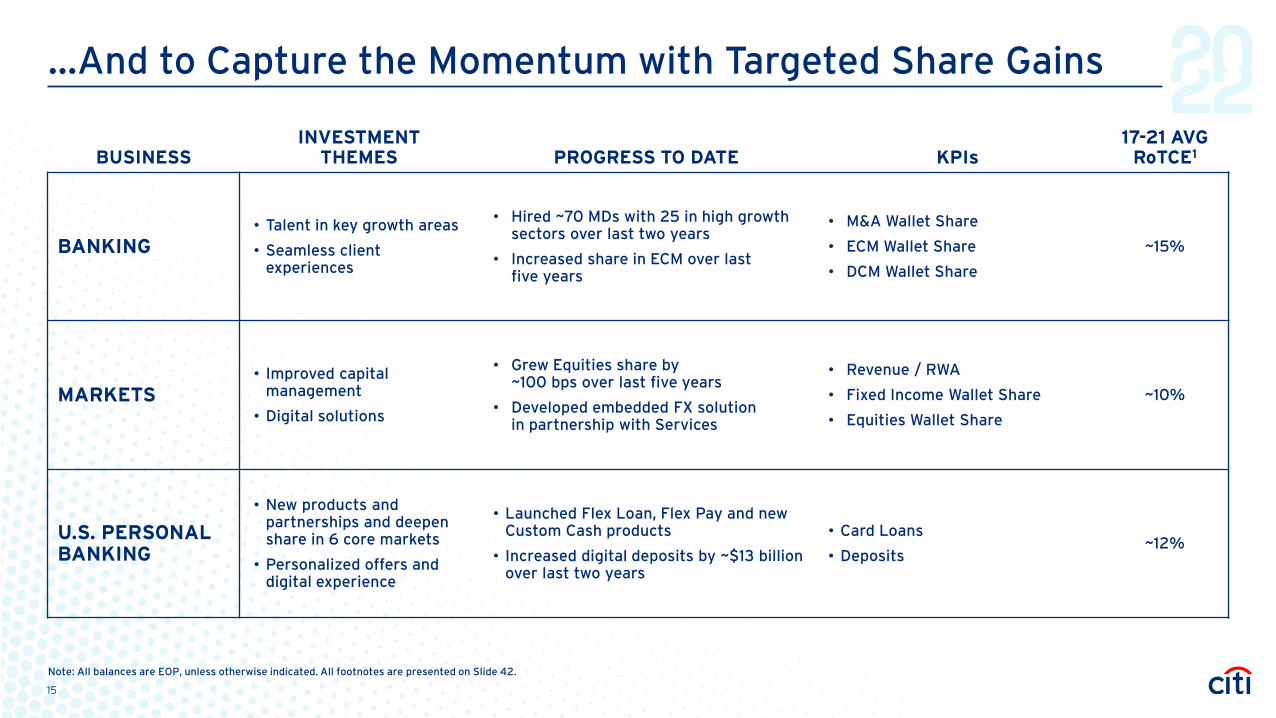
...And to Capture the Momentum with Targeted Share Gains
BUSINESSINVESTMENT
THEMES PROGRESS TO DATE KPIs17-21 AVG
RoTCE1
BANKING• Talent in key growth areas
• Seamless client experiences
• Hired ~70 MDs with 25 in high growth sectors over last two years
• Increased share in ECM over last five years
• M&A Wallet Share
• ECM Wallet Share
• DCM Wallet Share
~15%
MARKETS• Improved capital
management
• Digital solutions
• Grew Equities share by ~100 bps over last five years
• Developed embedded FX solution in partnership with Services
• Revenue / RWA
• Fixed Income Wallet Share
• Equities Wallet Share
~10%
U.S. PERSONAL BANKING
• New products and partnerships and deepen share in 6 core markets
• Personalized offers and digital experience
• Launched Flex Loan, Flex Pay and new Custom Cash products
• Increased digital deposits by ~$13 billion over last two years
• Card Loans
• Deposits~12%
Note: All balances are EOP, unless otherwise indicated. All footnotes are presented on Slide 42.
15
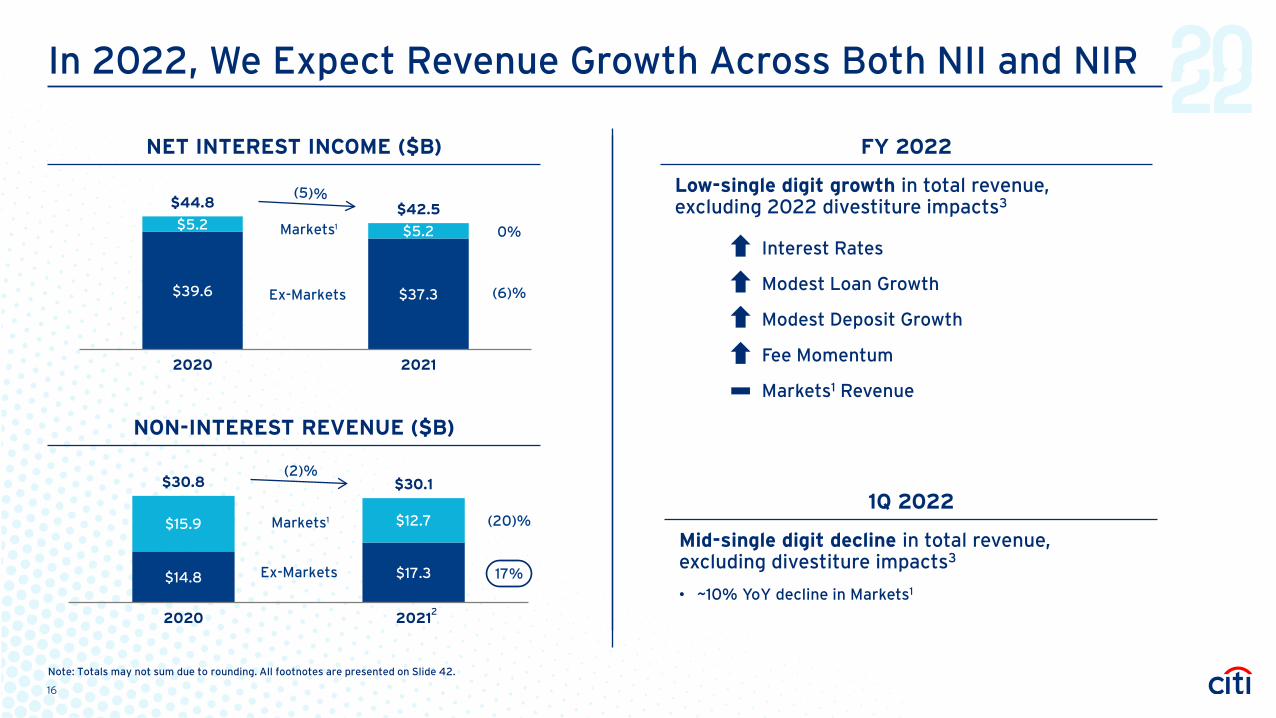
In 2022, We Expect Revenue Growth Across Both NII and NIR
NET INTEREST INCOME ($B)
NON-INTEREST REVENUE ($B)
$39.6 $37.3
$5.2 $5.2
$44.8 $42.5
2020 2021
$14.8 $17.3
$15.9 $12.7
$30.8 $30.1
2020 2021
Ex-Markets
Markets
Ex-Markets
Markets
(2)%
1
1
2
FY 2022
Low-single digit growth in total revenue, excluding 2022 divestiture impacts3
• Interest Rates
• Modest Loan Growth
• Modest Deposit Growth
• Fee Momentum
• Markets1 Revenue
1Q 2022
Mid-single digit decline in total revenue, excluding divestiture impacts3
• ~10% YoY decline in Markets1
0%
(6)%
(20)%
17%
Note: Totals may not sum due to rounding. All footnotes are presented on Slide 42.
16
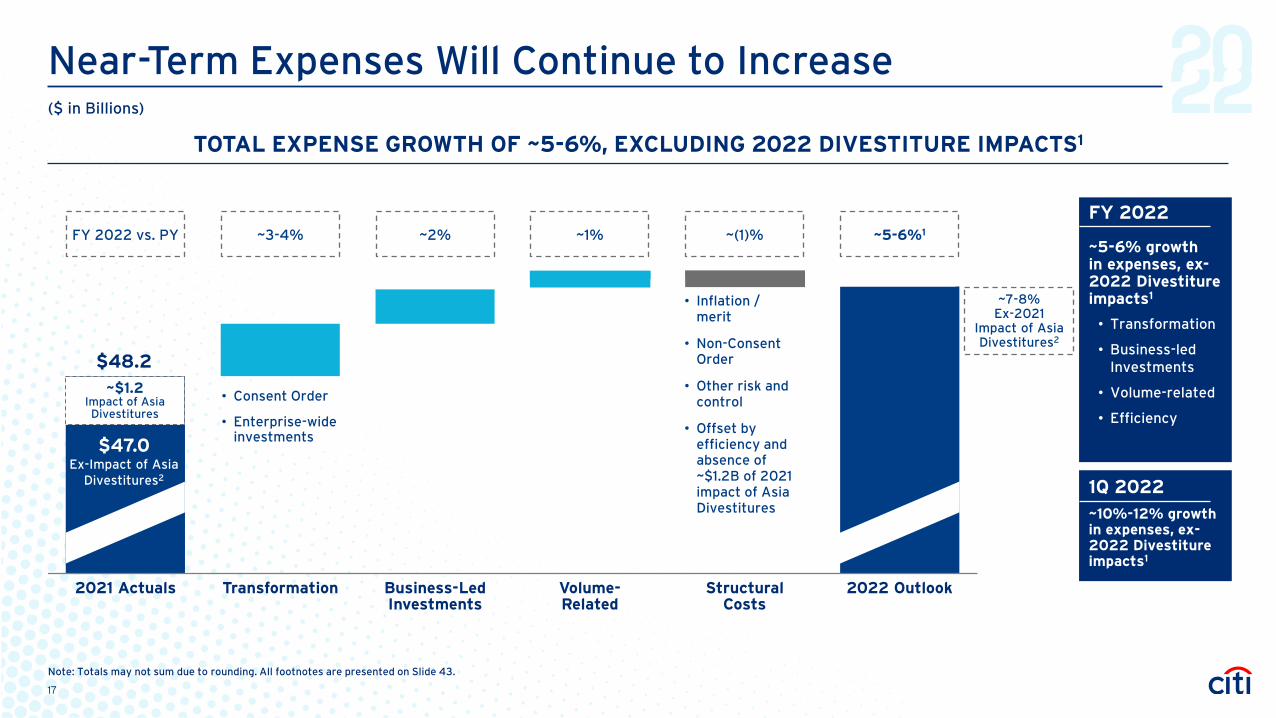
Near-Term Expenses Will Continue to Increase
~2% ~1% ~(1)%~3-4%
• Consent Order
• Enterprise-wideinvestments
• Inflation / merit
• Non-Consent Order
• Other risk and control
• Offset by efficiency and absence of ~$1.2B of 2021 impact of Asia Divestitures
~5-6%1FY 2022 vs. PY
~$1.2Impact of Asia Divestitures
2021 Actuals Transformation Business-Led Investments
Volume-Related
Structural Costs
2022 Outlook
TOTAL EXPENSE GROWTH OF ~5-6%, EXCLUDING 2022 DIVESTITURE IMPACTS1
FY 2022
~5-6% growth in expenses, ex-2022 Divestiture impacts1
• Transformation
• Business-led Investments
• Volume-related
• Efficiency
$48.2
$47.0Ex-Impact of Asia
Divestitures2
~7-8%Ex-2021
Impact of Asia Divestitures2
1Q 2022~10%-12% growth in expenses, ex-2022 Divestiture impacts1
Note: Totals may not sum due to rounding. All footnotes are presented on Slide 43.
($ in Billions)
17
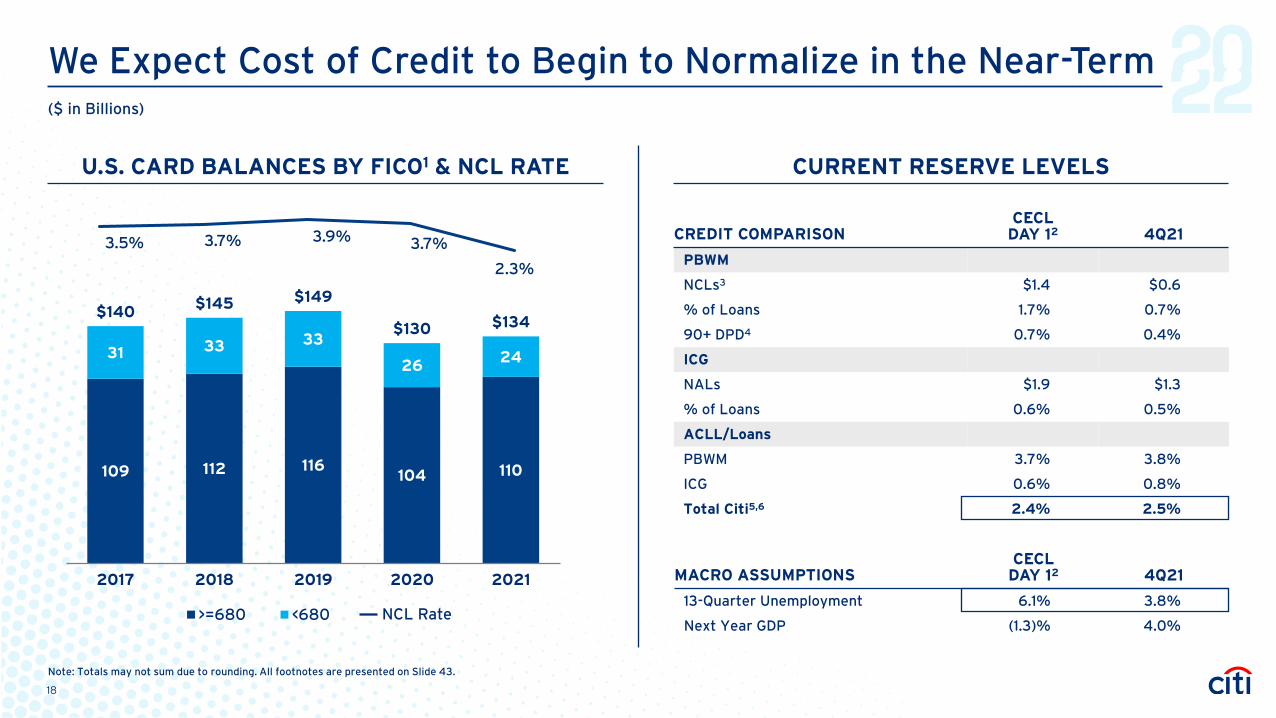
We Expect Cost of Credit to Begin to Normalize in the Near-Term
CREDIT COMPARISONCECL
DAY 12 4Q21
PBWM
NCLs3 $1.4 $0.6
% of Loans 1.7% 0.7%
90+ DPD4 0.7% 0.4%
ICG
NALs $1.9 $1.3
% of Loans 0.6% 0.5%
ACLL/Loans
PBWM 3.7% 3.8%
ICG 0.6% 0.8%
Total Citi5,6 2.4% 2.5%
MACRO ASSUMPTIONSCECL
DAY 12 4Q21
13-Quarter Unemployment 6.1% 3.8%
Next Year GDP (1.3)% 4.0%
109 112 116104 110
31 33 33
26 24
$140 $145 $149
$130 $134
2017 2018 2019 2020 2021
>=680 <680
3.5% 3.7% 3.9% 3.7%
2.3%
Note: Totals may not sum due to rounding. All footnotes are presented on Slide 43.
($ in Billions)
U.S. CARD BALANCES BY FICO1 & NCL RATE CURRENT RESERVE LEVELS
NCL Rate
18
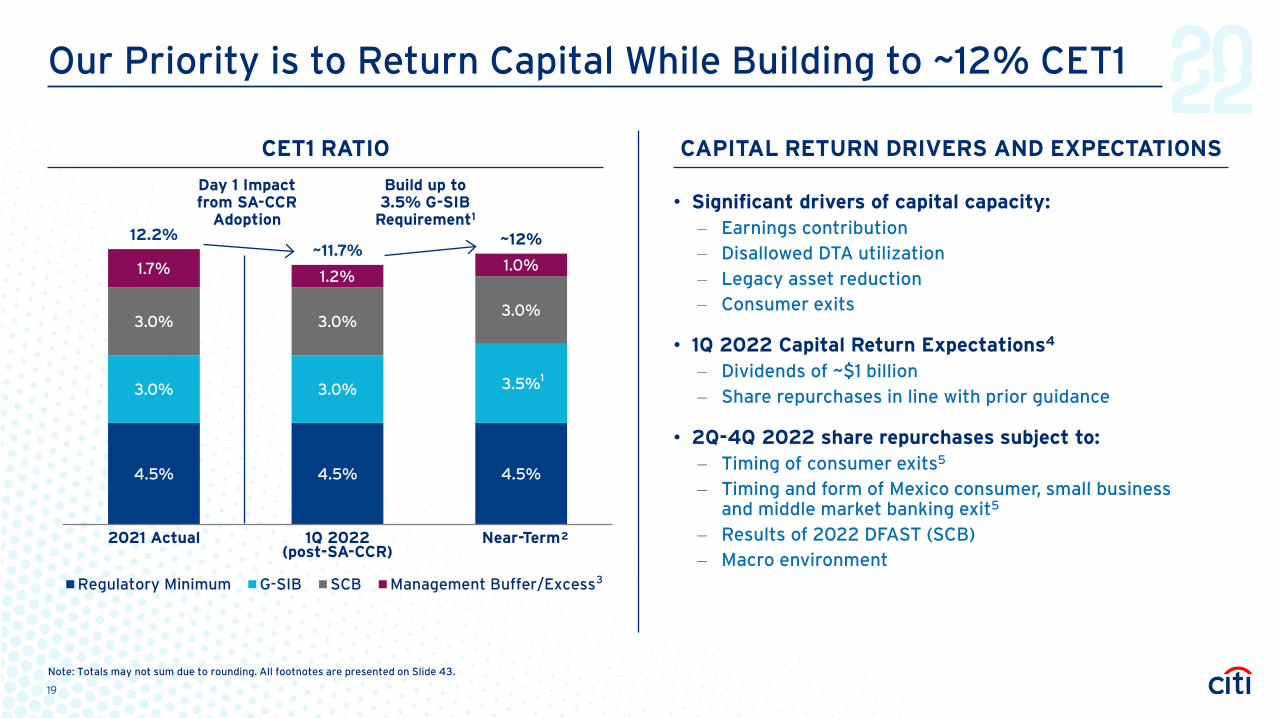
4.5% 4.5% 4.5%
3.0% 3.0% 3.5%
3.0% 3.0%3.0%
1.7% 1.2%1.0%
12.2%~11.7%
~12%
2021 Actual 1Q 2022 (post-SA-CCR)
Near-Term
Regulatory Minimum G-SIB SCB Management Buffer/Excess
Our Priority is to Return Capital While Building to ~12% CET1
CAPITAL RETURN DRIVERS AND EXPECTATIONSCET1 RATIO
• Significant drivers of capital capacity: – Earnings contribution– Disallowed DTA utilization– Legacy asset reduction– Consumer exits
• 1Q 2022 Capital Return Expectations4
– Dividends of ~$1 billion – Share repurchases in line with prior guidance
• 2Q-4Q 2022 share repurchases subject to: – Timing of consumer exits5
– Timing and form of Mexico consumer, small business and middle market banking exit5
– Results of 2022 DFAST (SCB) – Macro environment
Day 1 Impact from SA-CCR
Adoption
Build up to 3.5% G-SIB
Requirement1
1
Note: Totals may not sum due to rounding. All footnotes are presented on Slide 43.
2
3
19
Phase 2 – Path to Medium-Term Targets Transparent path to achieving our plan and delivering shareholder value
20
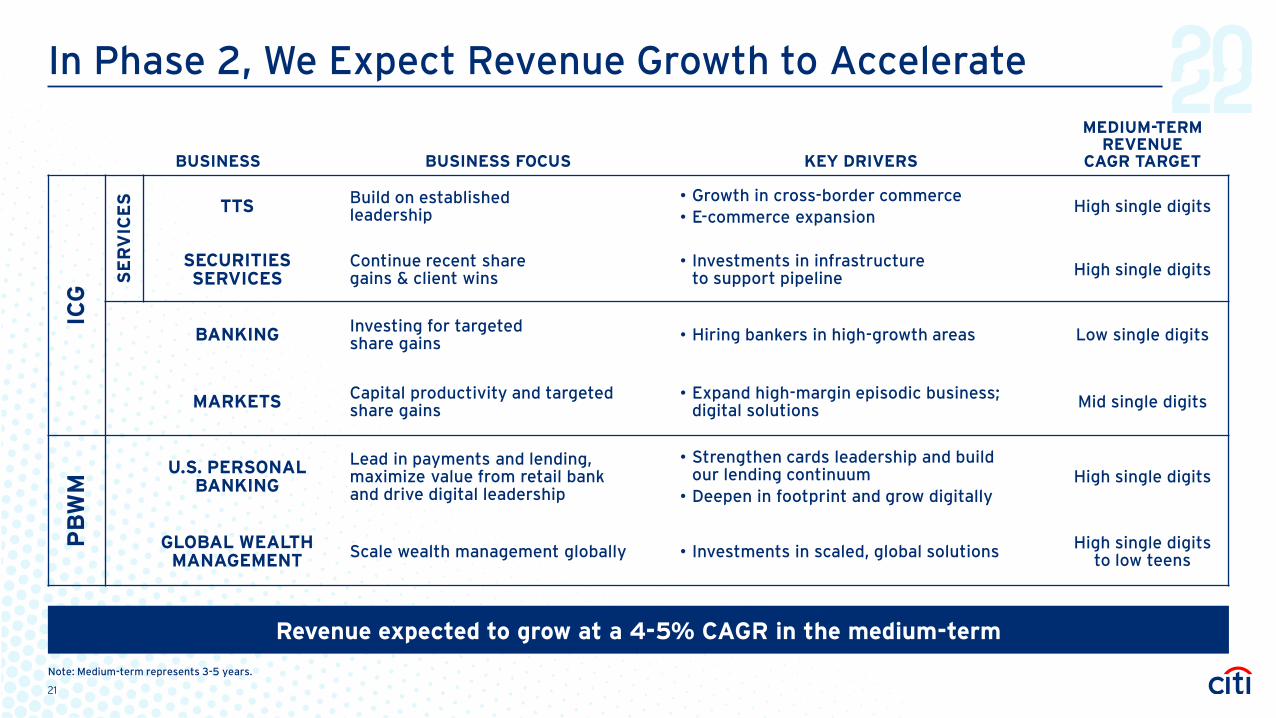
In Phase 2, We Expect Revenue Growth to Accelerate
BUSINESS BUSINESS FOCUS KEY DRIVERS
MEDIUM-TERMREVENUE
CAGR TARGET
ICG
SE
RV
ICE
S TTS Build on established leadership
• Growth in cross-border commerce• E-commerce expansion
High single digits
SECURITIES SERVICES
Continue recent share gains & client wins
• Investments in infrastructure to support pipeline High single digits
BANKING Investing for targeted share gains • Hiring bankers in high-growth areas Low single digits
MARKETS Capital productivity and targeted share gains
• Expand high-margin episodic business; digital solutions Mid single digits
PB
WM
U.S. PERSONALBANKING
Lead in payments and lending, maximize value from retail bank and drive digital leadership
• Strengthen cards leadership and build our lending continuum
• Deepen in footprint and grow digitallyHigh single digits
GLOBAL WEALTHMANAGEMENT Scale wealth management globally • Investments in scaled, global solutions High single digits
to low teens
Revenue expected to grow at a 4-5% CAGR in the medium-term
Note: Medium-term represents 3-5 years.
21
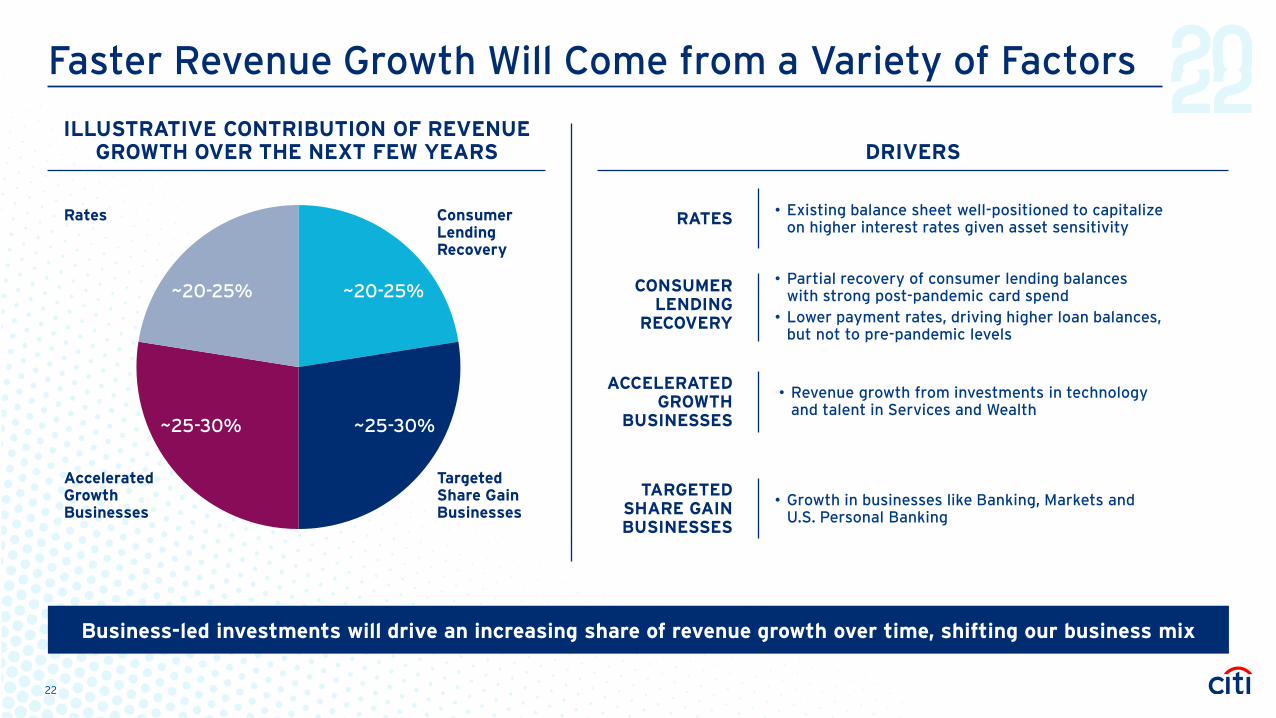
~20-25%
~25-30%~25-30%
~20-25%
Faster Revenue Growth Will Come from a Variety of Factors
DRIVERSILLUSTRATIVE CONTRIBUTION OF REVENUE
GROWTH OVER THE NEXT FEW YEARS
• Revenue growth from investments in technology and talent in Services and Wealth
• Growth in businesses like Banking, Markets and U.S. Personal Banking
CONSUMER LENDING
RECOVERY
TARGETED SHARE GAIN BUSINESSES
• Existing balance sheet well-positioned to capitalize on higher interest rates given asset sensitivityRATES
• Partial recovery of consumer lending balances with strong post-pandemic card spend
• Lower payment rates, driving higher loan balances, but not to pre-pandemic levels
ACCELERATED GROWTH
BUSINESSES
Targeted Share Gain Businesses
Accelerated Growth Businesses
Consumer Lending Recovery
Rates
Business-led investments will drive an increasing share of revenue growth over time, shifting our business mix
22
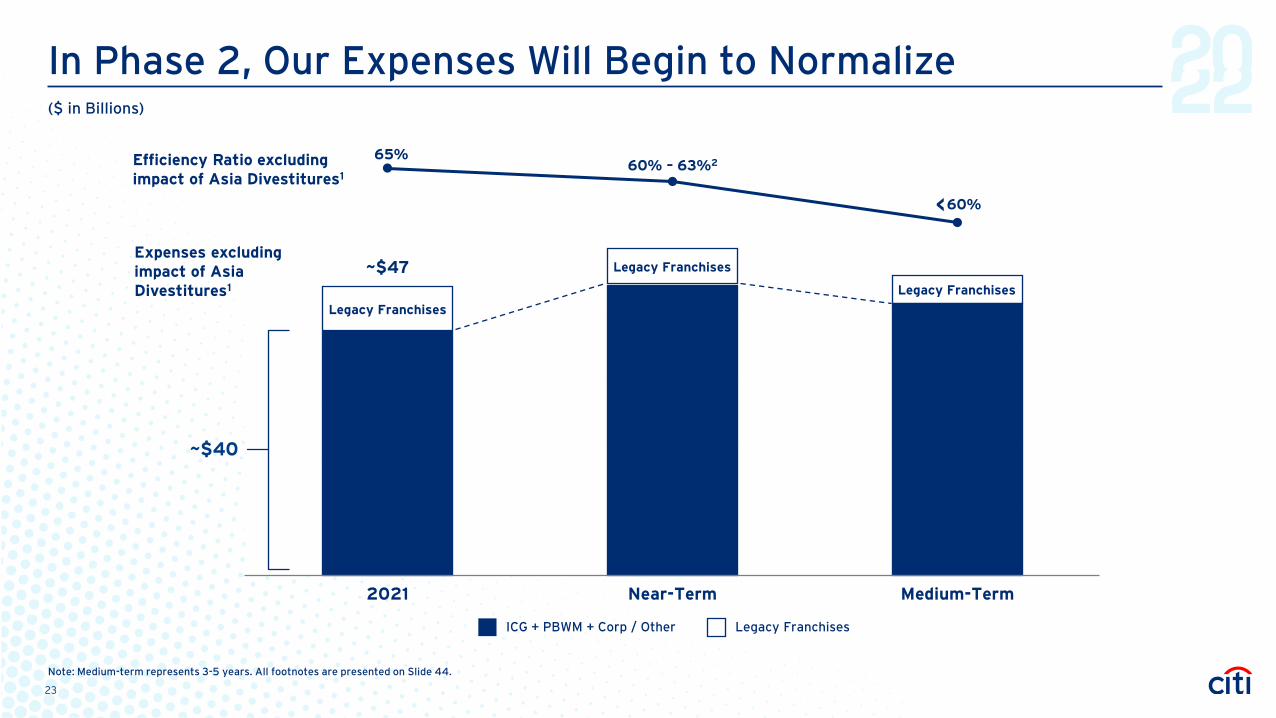
In Phase 2, Our Expenses Will Begin to Normalize
2021 Near-Term Medium-Term
~$40
65%60% – 63%2
<
ICG + PBWM + Corp / Other Legacy Franchises
Expenses excluding impact of Asia Divestitures1
Efficiency Ratio excluding impact of Asia Divestitures1
Note: Medium-term represents 3-5 years. All footnotes are presented on Slide 44.
($ in Billions)
~$47
Legacy Franchises
Legacy Franchises
Legacy Franchises
23
60%
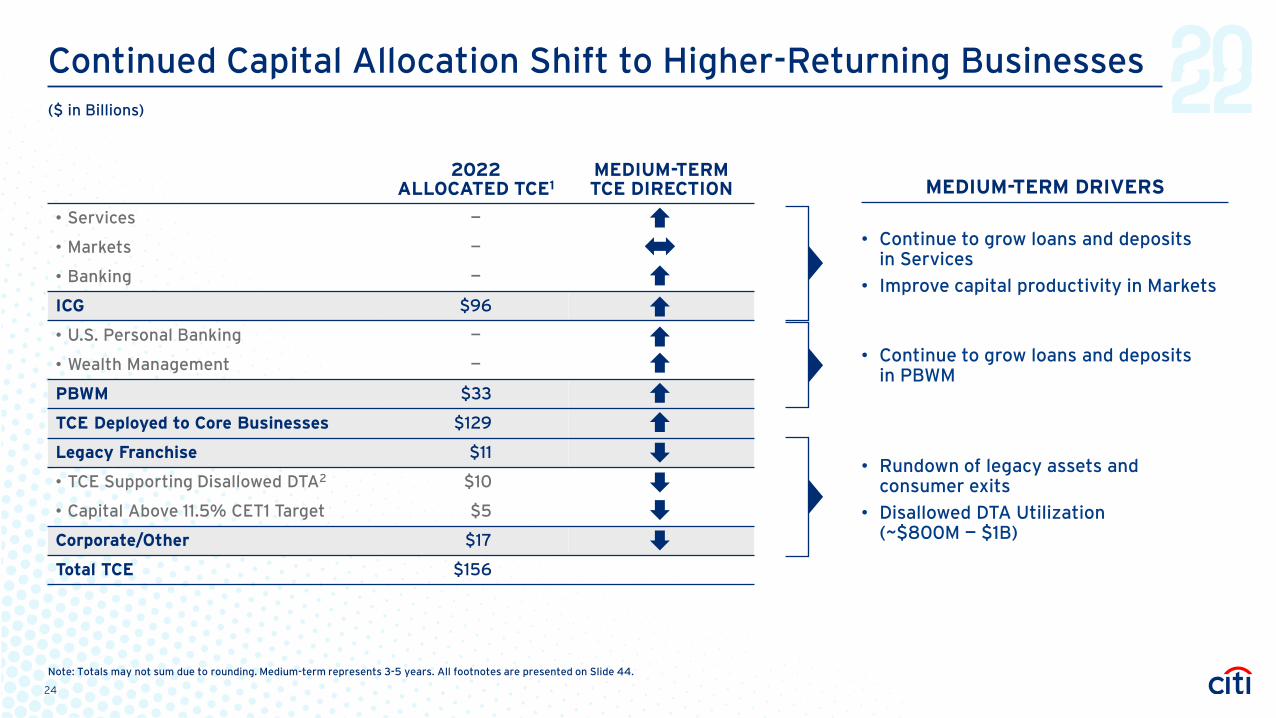
Continued Capital Allocation Shift to Higher-Returning Businesses
2022ALLOCATED TCE1
MEDIUM-TERMTCE DIRECTION
• Services —
• Markets —
• Banking —
ICG $96
• U.S. Personal Banking —
• Wealth Management —
PBWM $33
TCE Deployed to Core Businesses $129
Legacy Franchise $11
• TCE Supporting Disallowed DTA2 $10
• Capital Above 11.5% CET1 Target $5
Corporate/Other $17
Total TCE $156
• Continue to grow loans and deposits in PBWM
• Continue to grow loans and deposits in Services
• Improve capital productivity in Markets
• Rundown of legacy assets andconsumer exits
• Disallowed DTA Utilization (~$800M — $1B)
MEDIUM-TERM DRIVERS
Note: Totals may not sum due to rounding. Medium-term represents 3-5 years. All footnotes are presented on Slide 44.
($ in Billions)
24
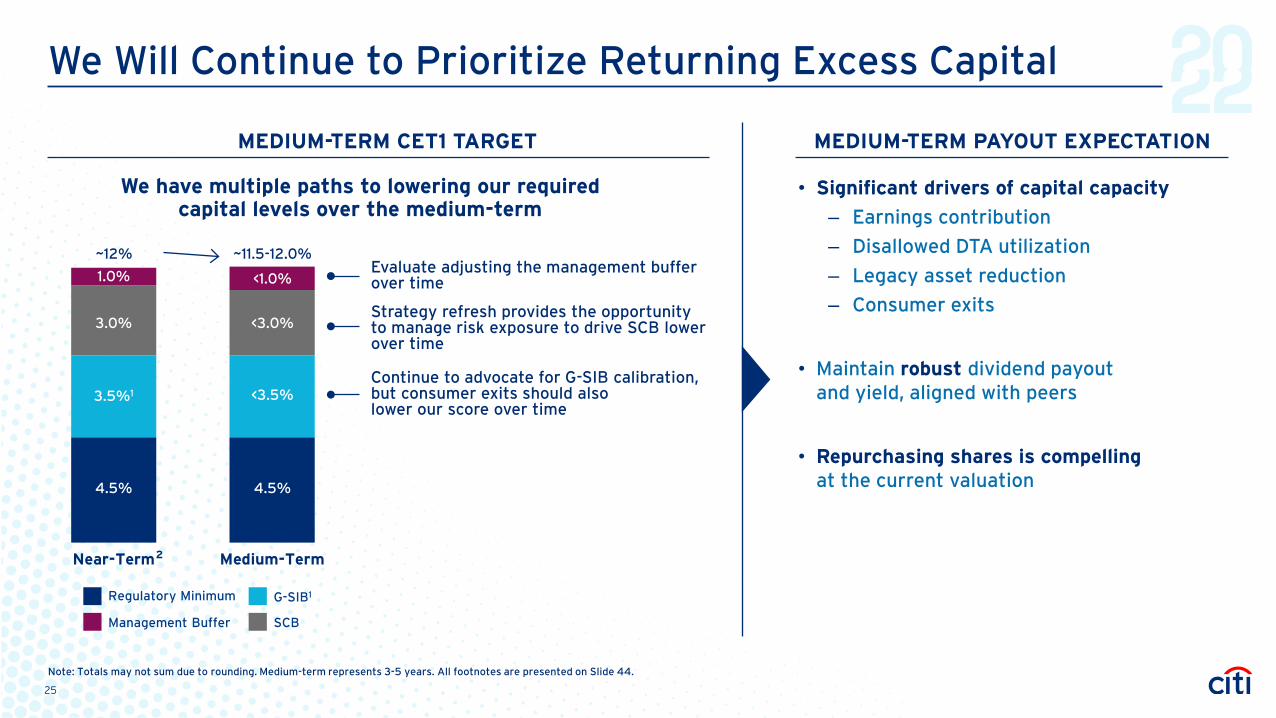
We Will Continue to Prioritize Returning Excess Capital
MEDIUM-TERM PAYOUT EXPECTATIONMEDIUM-TERM CET1 TARGET
• Significant drivers of capital capacity
‒ Earnings contribution
‒ Disallowed DTA utilization
‒ Legacy asset reduction
‒ Consumer exits
• Maintain robust dividend payout and yield, aligned with peers
• Repurchasing shares is compellingat the current valuation
We have multiple paths to lowering our required capital levels over the medium-term
Medium-TermNear-Term
Evaluate adjusting the management buffer over time
Continue to advocate for G-SIB calibration, but consumer exits should also lower our score over time
Strategy refresh provides the opportunity to manage risk exposure to drive SCB lower over time
~11.5-12.0%~12%
<1.0%1.0%
<3.5%
3.0% <3.0%
3.5%1
4.5%4.5%
G-SIB1Regulatory Minimum
SCBManagement Buffer
Note: Totals may not sum due to rounding. Medium-term represents 3-5 years. All footnotes are presented on Slide 44.
2
25
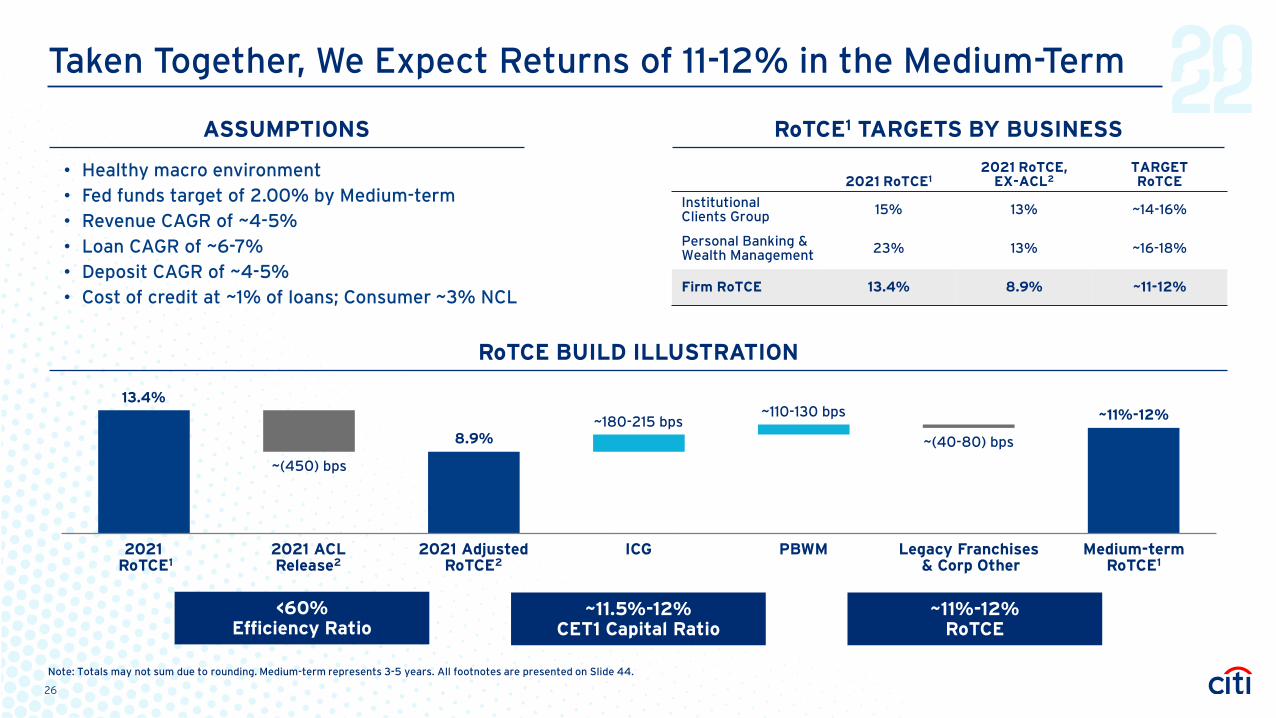
Taken Together, We Expect Returns of 11-12% in the Medium-Term
ASSUMPTIONS RoTCE1 TARGETS BY BUSINESS
• Healthy macro environment• Fed funds target of 2.00% by Medium-term • Revenue CAGR of ~4-5%• Loan CAGR of ~6-7%• Deposit CAGR of ~4-5%• Cost of credit at ~1% of loans; Consumer ~3% NCL
2021 RoTCE12021 RoTCE,
EX-ACL2TARGET RoTCE
InstitutionalClients Group 15% 13% ~14-16%
Personal Banking & Wealth Management 23% 13% ~16-18%
Firm RoTCE 13.4% 8.9% ~11-12%
RoTCE BUILD ILLUSTRATION
8.9%
2021 Adjusted RoTCE2
Medium-term RoTCE1
~11%-12%13.4%
2021 ACLRelease2
2021RoTCE1
~(450) bps
ICG PBWM Legacy Franchises& Corp Other
~180-215 bps~(40-80) bps
~110-130 bps
~11%-12%RoTCE
~11.5%-12%CET1 Capital Ratio
<60%Efficiency Ratio
Note: Totals may not sum due to rounding. Medium-term represents 3-5 years. All footnotes are presented on Slide 44.
26
Phase 3 – Longer-Term
27
Our Strategy Will Shift Our Business Mix and Grow Returns
ILLUSTRATIVE BUSINESS MIX EVOLUTION BUSINESS CHARACTERIZATION
Note: All footnotes are presented on Slide 44.
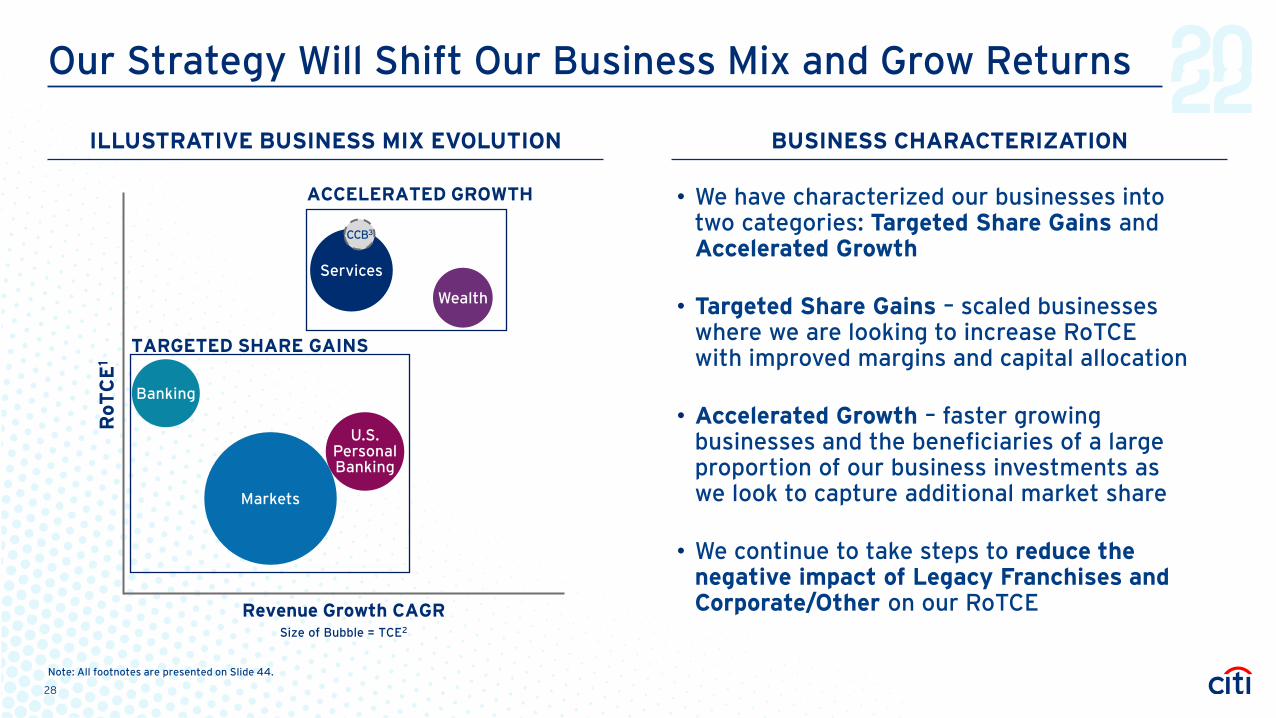
• We have characterized our businesses into two categories: Targeted Share Gains and Accelerated Growth
• Targeted Share Gains – scaled businesses where we are looking to increase RoTCE with improved margins and capital allocation
• Accelerated Growth – faster growing businesses and the beneficiaries of a large proportion of our business investments as we look to capture additional market share
• We continue to take steps to reduce the negative impact of Legacy Franchises and Corporate/Other on our RoTCE
Markets
Banking
U.S. Personal Banking
Services
CCB3
Wealth
ACCELERATED GROWTH
RoT
CE
1
Revenue Growth CAGR
TARGETED SHARE GAINS
Size of Bubble = TCE2
28
Summary — Our Plan and Execution Priorities Are Clear
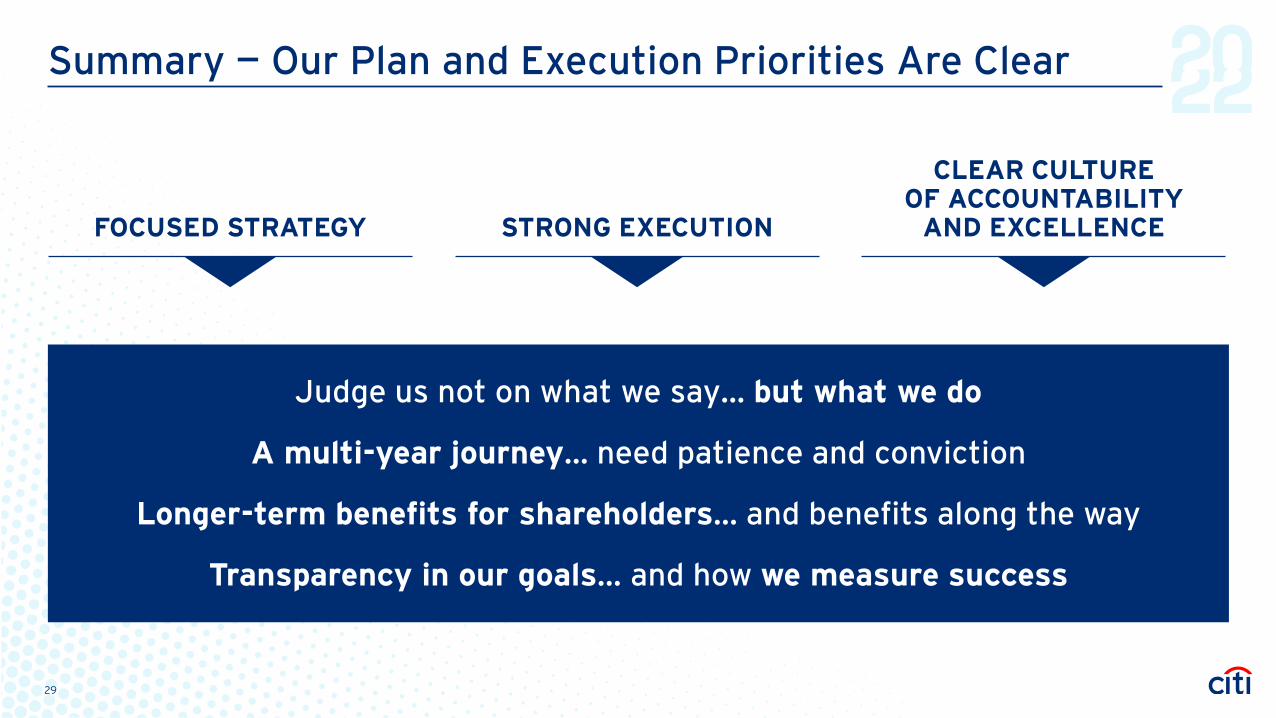
FOCUSED STRATEGY STRONG EXECUTION
CLEAR CULTURE OF ACCOUNTABILITY
AND EXCELLENCE
Judge us not on what we say… but what we do
A multi-year journey… need patience and conviction
Longer-term benefits for shareholders… and benefits along the way
Transparency in our goals… and how we measure success
29
Forward-looking Statements
Certain statements in this presentation are “forward-looking statements” within the Private Securities Litigation Reform Act of 1995, including statements made orally by Citi’s management. Such statements may be identified by words such as believe, expect, anticipate, intend, estimate, may increase, may fluctuate, target, illustrative and similar expressions or future or conditional verbs such as will, should, would and could. These statements are based on management’s current expectations and are subject to uncertainty and changes in circumstances. These statements are not guarantees of future results or occurrences. Actual results and capital and other financial condition may differ materially from those included in these statements due to a variety of factors, including, among others: the efficacy of Citi’s business strategies and execution of those strategies, such as those relating to its growth, investment, efficiency and capital optimization initiatives; governmental or regulatory requirements, actions or approvals; macroeconomic and other challenges and uncertainties, such as those related to the COVID-19 pandemic, inflationary pressures and the level of interest rates; the precautionary statements included in this presentation; and those contained in Citigroup’s filings with the U.S. Securities and Exchange Commission, including without limitation the “Risk Factors” section of Citigroup’s 2021 Form 10-K. Any forward-looking statements made by or on behalf of Citigroup speak only as to the date they are made, and Citi does not undertake to update forward-looking statements to reflect the impact of circumstances or events that arise after the date the forward-looking statements were made.
30

I N V E S T O R D AY
PROPRIETARY AND PROTECTED INFORMATION. MAY NOT BE COPIED, SHARED OR DISTRIBUTED WITHOUT CITIGROUP WRITTEN CONSENT. ©2022 CITIGROUP INC.
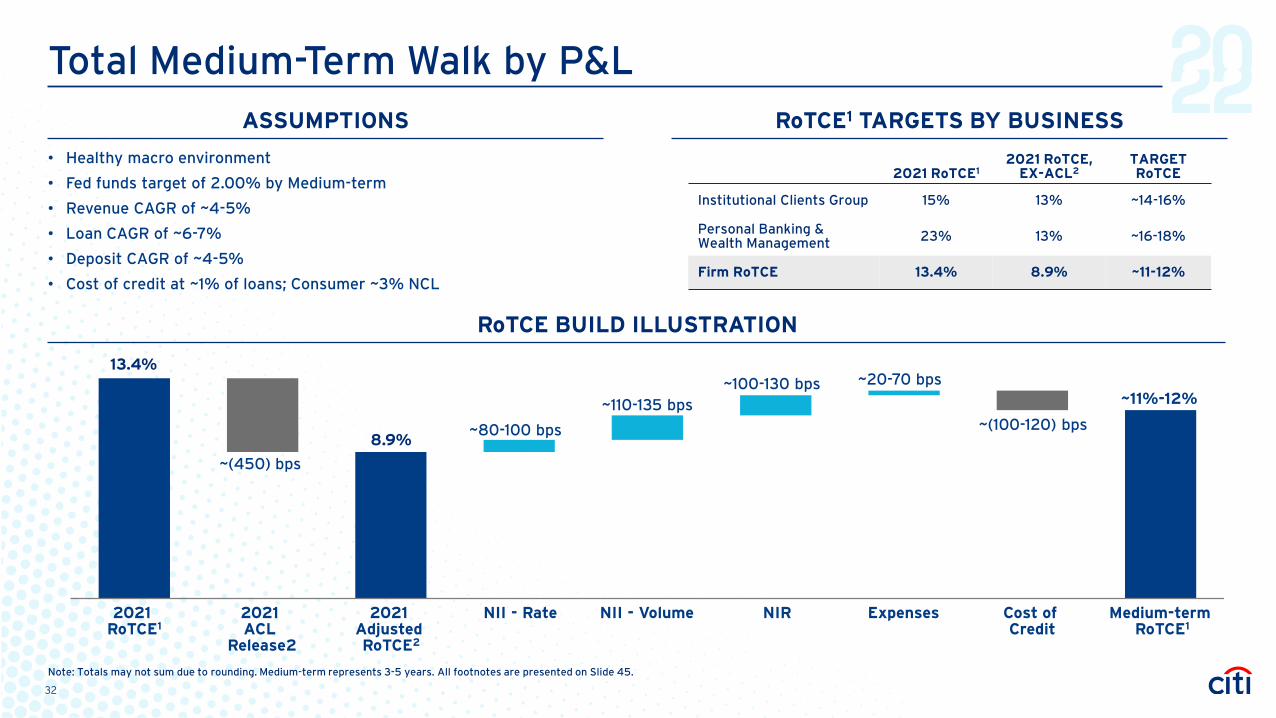
Total Medium-Term Walk by P&L
8.9%
Medium-term RoTCE1
~11%-12%
13.4%
2021 ACL
Release2
2021 RoTCE1
~(450) bps
NII - Rate Cost of Credit
~110-135 bps~(100-120) bps
~20-70 bps
ExpensesNII - Volume NIR
~80-100 bps
~100-130 bps
ASSUMPTIONS RoTCE1 TARGETS BY BUSINESS
• Healthy macro environment
• Fed funds target of 2.00% by Medium-term
• Revenue CAGR of ~4-5%
• Loan CAGR of ~6-7%
• Deposit CAGR of ~4-5%
• Cost of credit at ~1% of loans; Consumer ~3% NCL
2021 RoTCE12021 RoTCE,
EX-ACL2TARGET RoTCE
Institutional Clients Group 15% 13% ~14-16%
Personal Banking & Wealth Management 23% 13% ~16-18%
Firm RoTCE 13.4% 8.9% ~11-12%
RoTCE BUILD ILLUSTRATION
Note: Totals may not sum due to rounding. Medium-term represents 3-5 years. All footnotes are presented on Slide 45.
2021 Adjusted RoTCE2
32
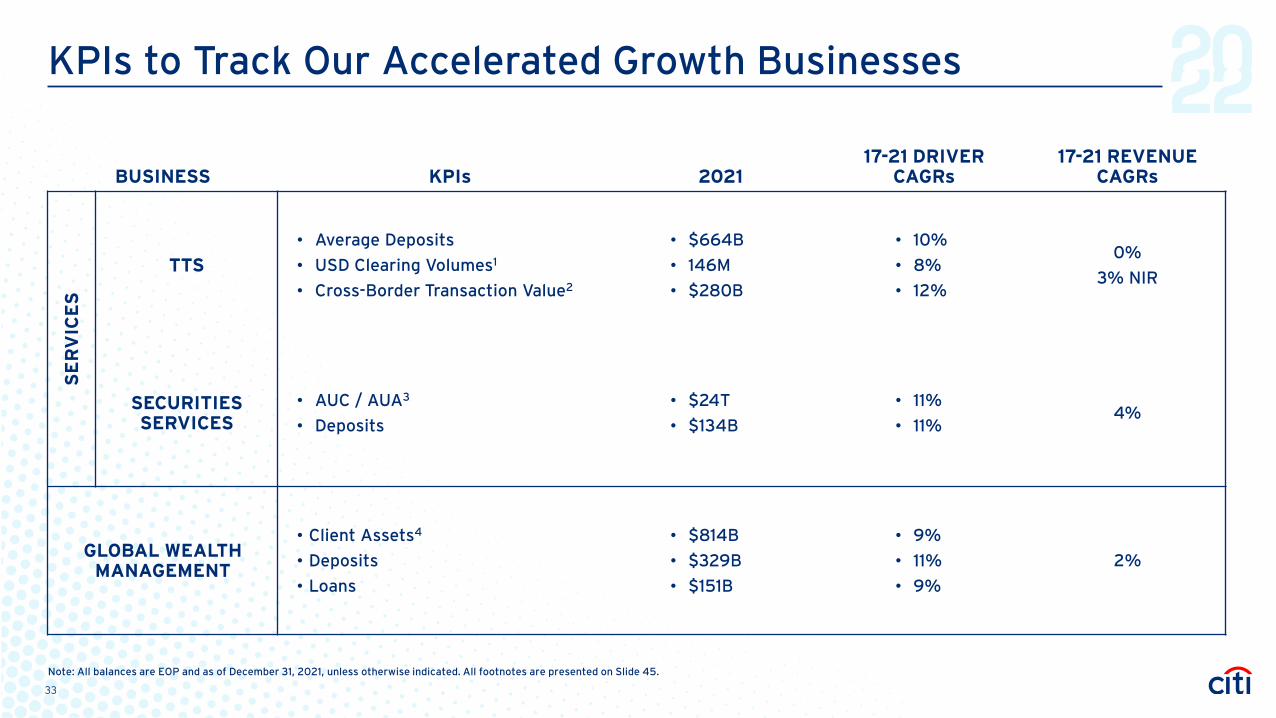
KPIs to Track Our Accelerated Growth Businesses
BUSINESS KPIs 202117-21 DRIVER
CAGRs17-21 REVENUE
CAGRs
SE
RV
ICE
S
TTS
• Average Deposits
• USD Clearing Volumes1
• Cross-Border Transaction Value2
• $664B
• 146M
• $280B
• 10%
• 8%
• 12%
0%
3% NIR
SECURITIES SERVICES
• AUC / AUA3
• Deposits
• $24T
• $134B
• 11%
• 11%4%
GLOBAL WEALTHMANAGEMENT
• Client Assets4
• Deposits
• Loans
• $814B
• $329B
• $151B
• 9%
• 11%
• 9%
2%
Note: All balances are EOP and as of December 31, 2021, unless otherwise indicated. All footnotes are presented on Slide 45.
33
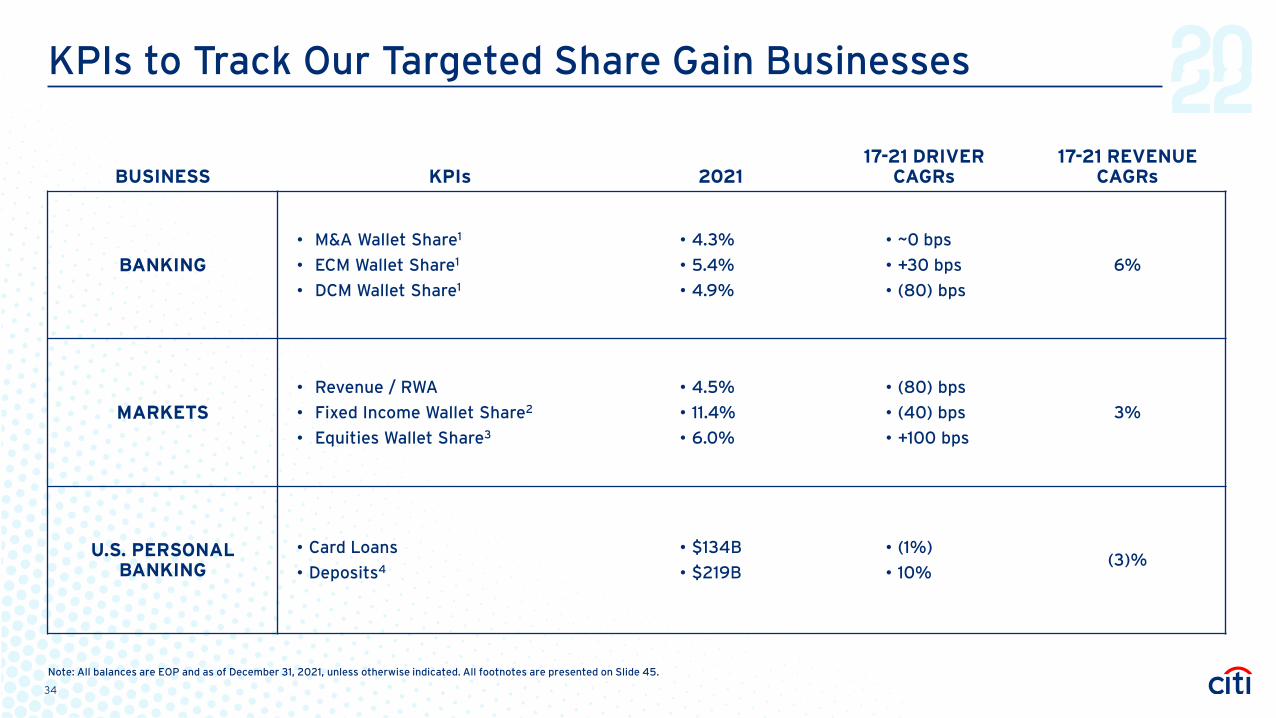
KPIs to Track Our Targeted Share Gain Businesses
BUSINESS KPIs 202117-21 DRIVER
CAGRs17-21 REVENUE
CAGRs
BANKING
• M&A Wallet Share1
• ECM Wallet Share1
• DCM Wallet Share1
• 4.3%
• 5.4%
• 4.9%
• ~0 bps
• +30 bps
• (80) bps
6%
MARKETS
• Revenue / RWA
• Fixed Income Wallet Share2
• Equities Wallet Share3
• 4.5%
• 11.4%
• 6.0%
• (80) bps
• (40) bps
• +100 bps
3%
U.S. PERSONAL BANKING
• Card Loans
• Deposits4
• $134B
• $219B
• (1%)
• 10%(3)%
Note: All balances are EOP and as of December 31, 2021, unless otherwise indicated. All footnotes are presented on Slide 45.
34
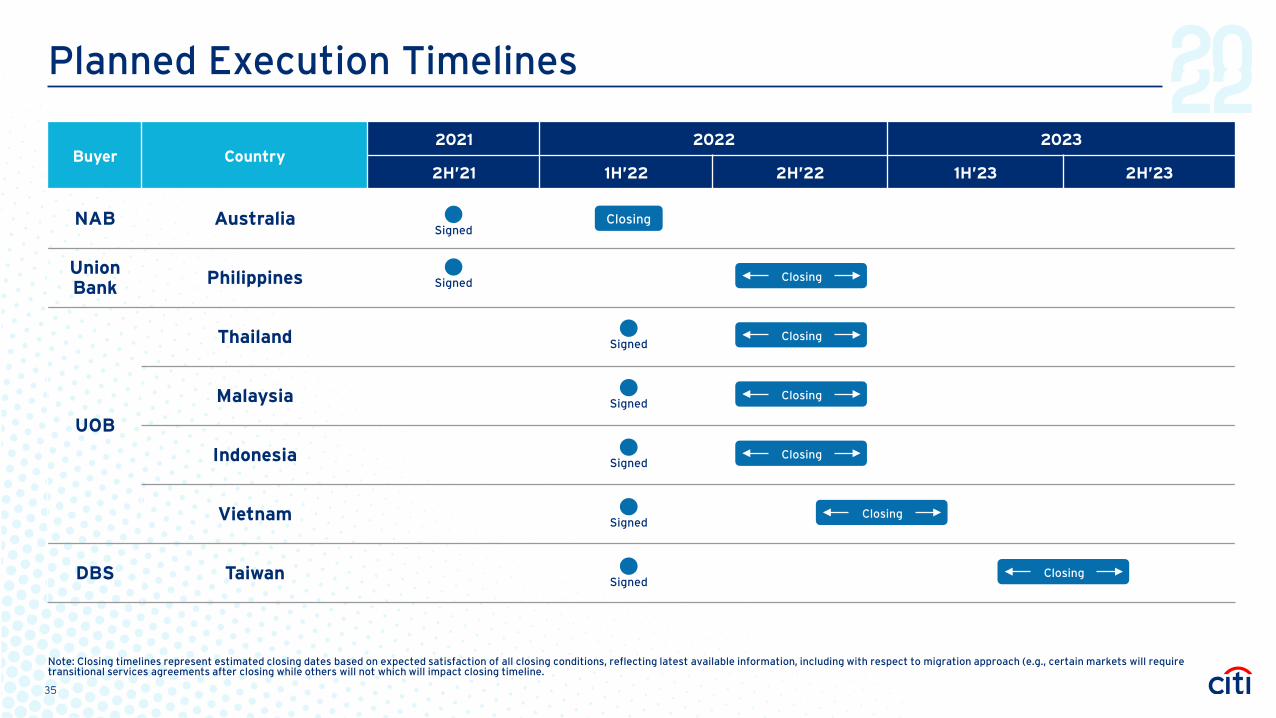
Planned Execution Timelines
Buyer Country2021 2022 2023
2H’21 1H’22 2H’22 1H’23 2H’23
NAB Australia
UnionBank Philippines
UOB
Thailand
Malaysia
Indonesia
Vietnam
DBS Taiwan
SignedClosing
Closing
Closing
Closing
Closing
Closing
Closing
Note: Closing timelines represent estimated closing dates based on expected satisfaction of all closing conditions, reflecting latest available information, including with respect to migration approach (e.g., certain markets will require transitional services agreements after closing while others will not which will impact closing timeline.
Signed
Signed
Signed
Signed
Signed
Signed
35
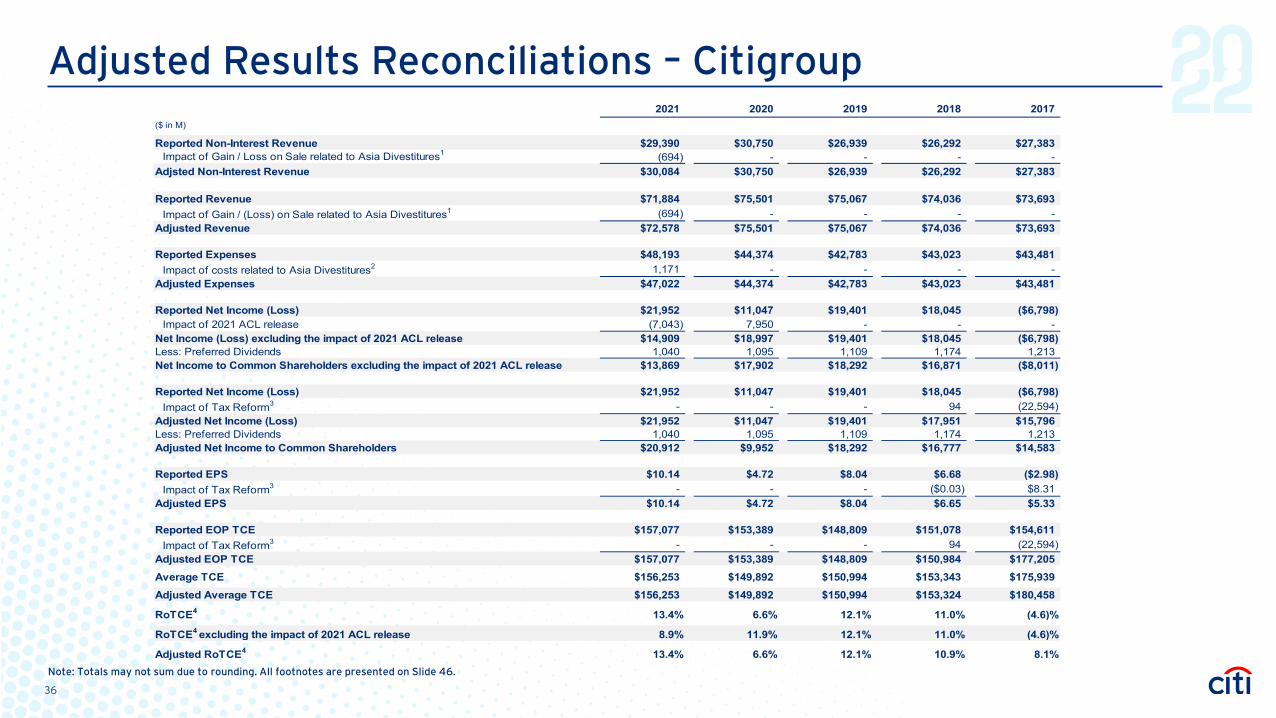
Adjusted Results Reconciliations – Citigroup
Note: Totals may not sum due to rounding. All footnotes are presented on Slide 46.
2021 2020 2019 2018 2017($ in M)
Reported Non-Interest Revenue $29,390 $30,750 $26,939 $26,292 $27,383Impact of Gain / Loss on Sale related to Asia Divestitures1 (694) - - - -
Adjsted Non-Interest Revenue $30,084 $30,750 $26,939 $26,292 $27,383
Reported Revenue $71,884 $75,501 $75,067 $74,036 $73,693Impact of Gain / (Loss) on Sale related to Asia Divestitures1 (694) - - - -
Adjusted Revenue $72,578 $75,501 $75,067 $74,036 $73,693
Reported Expenses $48,193 $44,374 $42,783 $43,023 $43,481Impact of costs related to Asia Divestitures2 1,171 - - - -
Adjusted Expenses $47,022 $44,374 $42,783 $43,023 $43,481
Reported Net Income (Loss) $21,952 $11,047 $19,401 $18,045 ($6,798)Impact of 2021 ACL release (7,043) 7,950 - - -
Net Income (Loss) excluding the impact of 2021 ACL release $14,909 $18,997 $19,401 $18,045 ($6,798)Less: Preferred Dividends 1,040 1,095 1,109 1,174 1,213Net Income to Common Shareholders excluding the impact of 2021 ACL release $13,869 $17,902 $18,292 $16,871 ($8,011)
Reported Net Income (Loss) $21,952 $11,047 $19,401 $18,045 ($6,798)Impact of Tax Reform3 - - - 94 (22,594)
Adjusted Net Income (Loss) $21,952 $11,047 $19,401 $17,951 $15,796Less: Preferred Dividends 1,040 1,095 1,109 1,174 1,213Adjusted Net Income to Common Shareholders $20,912 $9,952 $18,292 $16,777 $14,583
Reported EPS $10.14 $4.72 $8.04 $6.68 ($2.98)Impact of Tax Reform3 - - - ($0.03) $8.31
Adjusted EPS $10.14 $4.72 $8.04 $6.65 $5.33
Reported EOP TCE $157,077 $153,389 $148,809 $151,078 $154,611Impact of Tax Reform3 - - - 94 (22,594)
Adjusted EOP TCE $157,077 $153,389 $148,809 $150,984 $177,205Average TCE $156,253 $149,892 $150,994 $153,343 $175,939Adjusted Average TCE $156,253 $149,892 $150,994 $153,324 $180,458
RoTCE4 13.4% 6.6% 12.1% 11.0% (4.6)%
RoTCE4 excluding the impact of 2021 ACL release 8.9% 11.9% 12.1% 11.0% (4.6)%
Adjusted RoTCE4 13.4% 6.6% 12.1% 10.9% 8.1%
36
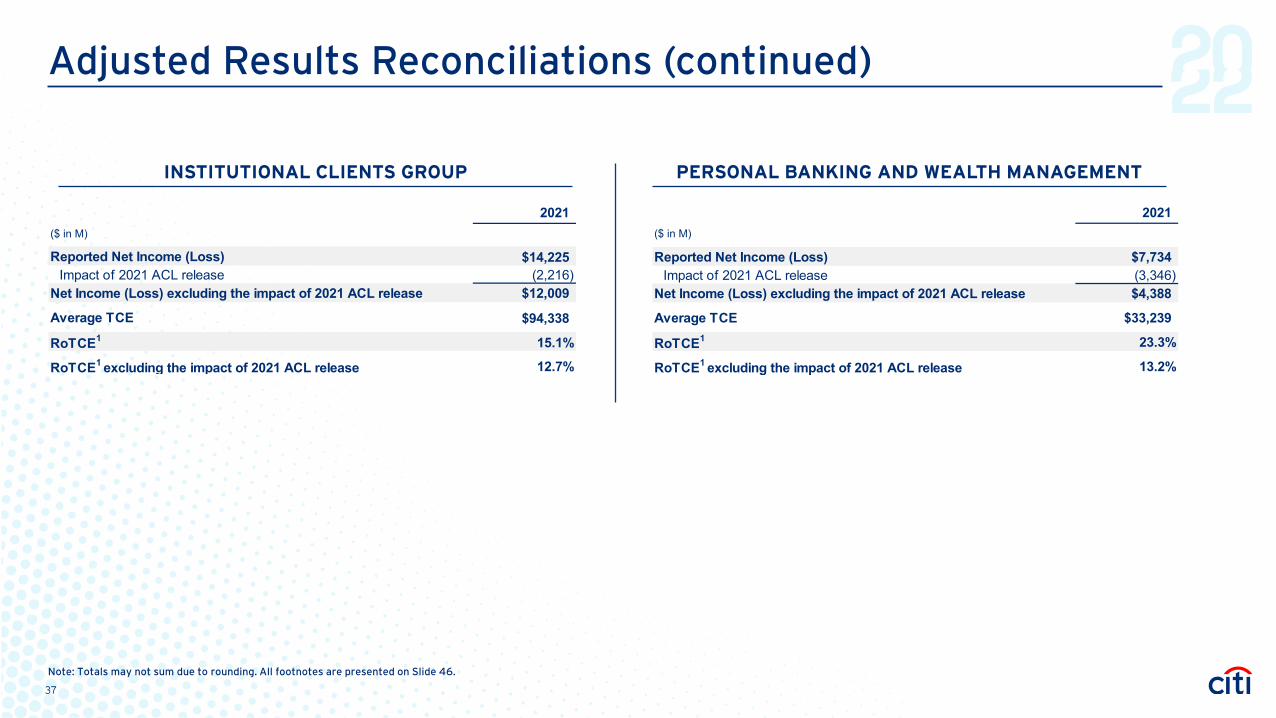
Adjusted Results Reconciliations (continued)
INSTITUTIONAL CLIENTS GROUP PERSONAL BANKING AND WEALTH MANAGEMENT
Note: Totals may not sum due to rounding. All footnotes are presented on Slide 46.
2021($ in M)
Reported Net Income (Loss) $14,225Impact of 2021 ACL release (2,216)
Net Income (Loss) excluding the impact of 2021 ACL release $12,009
Average TCE $94,338
RoTCE1 15.1%
RoTCE1 excluding the impact of 2021 ACL release 12.7%
2021($ in M)
Reported Net Income (Loss) $7,734Impact of 2021 ACL release (3,346)
Net Income (Loss) excluding the impact of 2021 ACL release $4,388
Average TCE $33,239
RoTCE1 23.3%
RoTCE1 excluding the impact of 2021 ACL release 13.2%
37
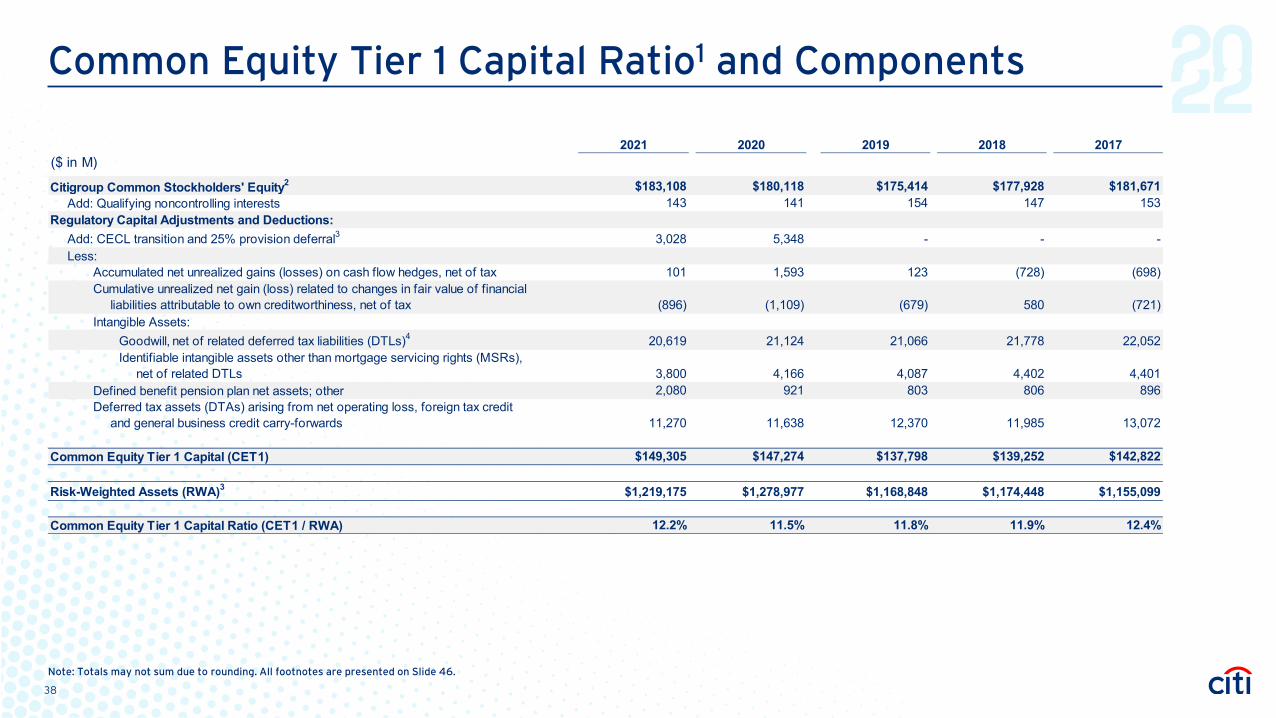
Common Equity Tier 1 Capital Ratio1 and Components
Note: Totals may not sum due to rounding. All footnotes are presented on Slide 46.
2021 2020 2019 2018 2017($ in M)
Citigroup Common Stockholders' Equity2 $183,108 $180,118 $175,414 $177,928 $181,671 Add: Qualifying noncontrolling interests 143 141 154 147 153
Regulatory Capital Adjustments and Deductions:Add: CECL transition and 25% provision deferral3 3,028 5,348 - - - Less:
Accumulated net unrealized gains (losses) on cash flow hedges, net of tax 101 1,593 123 (728) (698)Cumulative unrealized net gain (loss) related to changes in fair value of financial liabilities attributable to own creditworthiness, net of tax (896) (1,109) (679) 580 (721)Intangible Assets:
Goodwill, net of related deferred tax liabilities (DTLs)4 20,619 21,124 21,066 21,778 22,052 Identifiable intangible assets other than mortgage servicing rights (MSRs), net of related DTLs 3,800 4,166 4,087 4,402 4,401
Defined benefit pension plan net assets; other 2,080 921 803 806 896 Deferred tax assets (DTAs) arising from net operating loss, foreign tax credit and general business credit carry-forwards 11,270 11,638 12,370 11,985 13,072
Common Equity Tier 1 Capital (CET1) $149,305 $147,274 $137,798 $139,252 $142,822
Risk-Weighted Assets (RWA)3 $1,219,175 $1,278,977 $1,168,848 $1,174,448 $1,155,099
Common Equity Tier 1 Capital Ratio (CET1 / RWA) 12.2% 11.5% 11.8% 11.9% 12.4%
38
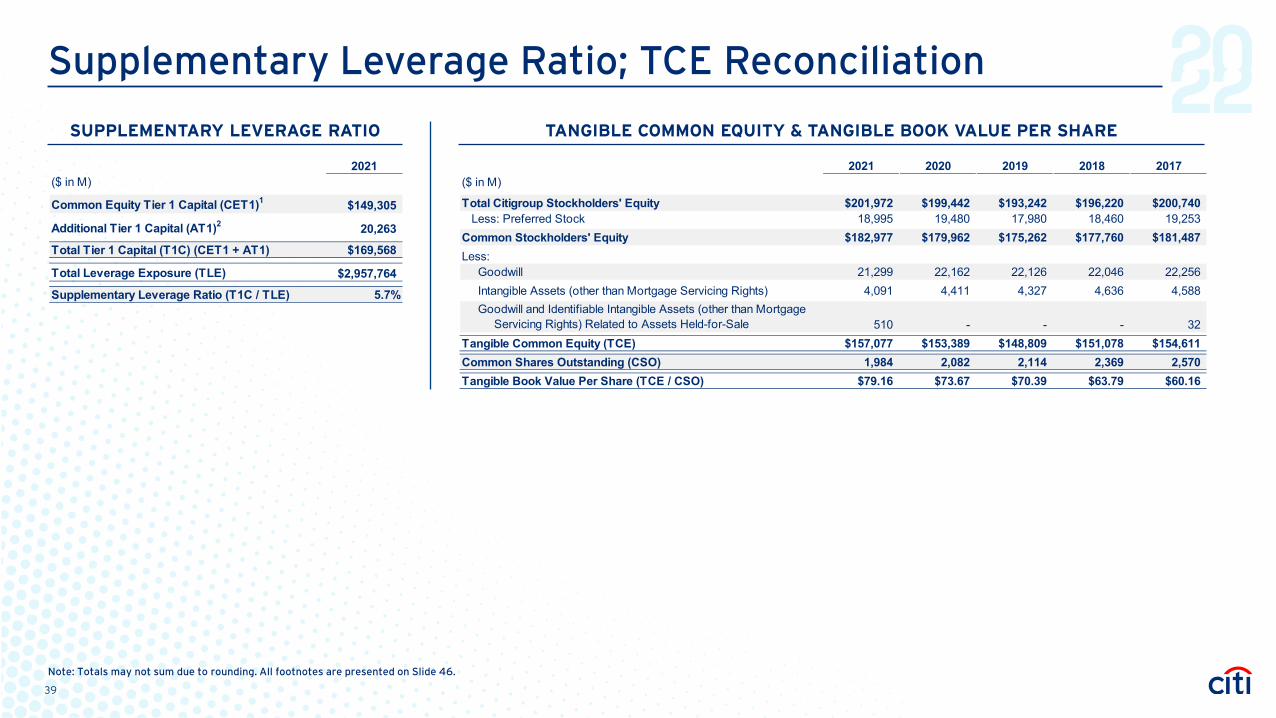
Supplementary Leverage Ratio; TCE Reconciliation
SUPPLEMENTARY LEVERAGE RATIO TANGIBLE COMMON EQUITY & TANGIBLE BOOK VALUE PER SHARE
Note: Totals may not sum due to rounding. All footnotes are presented on Slide 46.
2021 2020 2019 2018 2017($ in M)
Total Citigroup Stockholders' Equity $201,972 $199,442 $193,242 $196,220 $200,740 Less: Preferred Stock 18,995 19,480 17,980 18,460 19,253Common Stockholders' Equity $182,977 $179,962 $175,262 $177,760 $181,487Less:
Goodwill 21,299 22,162 22,126 22,046 22,256Intangible Assets (other than Mortgage Servicing Rights) 4,091 4,411 4,327 4,636 4,588Goodwill and Identifiable Intangible Assets (other than Mortgage Servicing Rights) Related to Assets Held-for-Sale 510 - - - 32
Tangible Common Equity (TCE) $157,077 $153,389 $148,809 $151,078 $154,611Common Shares Outstanding (CSO) 1,984 2,082 2,114 2,369 2,570Tangible Book Value Per Share (TCE / CSO) $79.16 $73.67 $70.39 $63.79 $60.16
2021($ in M)
Common Equity Tier 1 Capital (CET1)1 $149,305
Additional Tier 1 Capital (AT1)2 20,263Total Tier 1 Capital (T1C) (CET1 + AT1) $169,568
Total Leverage Exposure (TLE)1 $2,957,764Supplementary Leverage Ratio (T1C / TLE) 5.7%
39
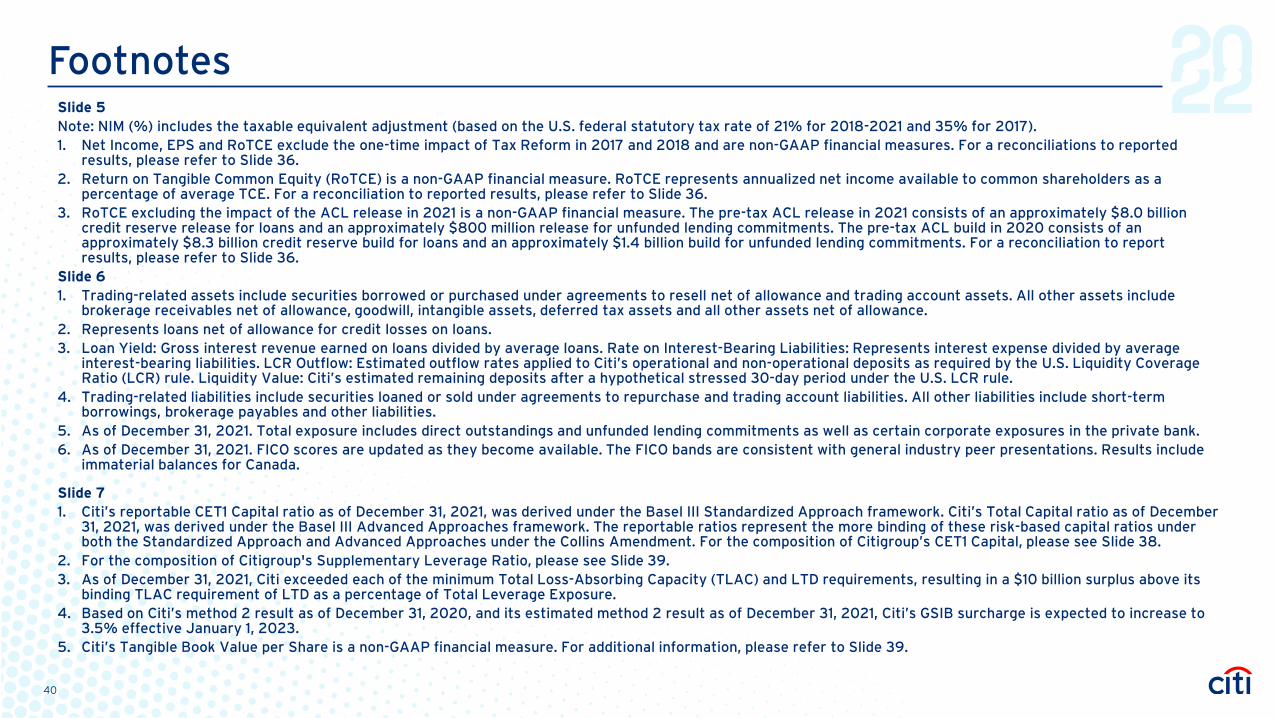
FootnotesSlide 5Note: NIM (%) includes the taxable equivalent adjustment (based on the U.S. federal statutory tax rate of 21% for 2018-2021 and 35% for 2017).1. Net Income, EPS and RoTCE exclude the one-time impact of Tax Reform in 2017 and 2018 and are non-GAAP financial measures. For a reconciliations to reported
results, please refer to Slide 36.2. Return on Tangible Common Equity (RoTCE) is a non-GAAP financial measure. RoTCE represents annualized net income available to common shareholders as a
percentage of average TCE. For a reconciliation to reported results, please refer to Slide 36.3. RoTCE excluding the impact of the ACL release in 2021 is a non-GAAP financial measure. The pre-tax ACL release in 2021 consists of an approximately $8.0 billion
credit reserve release for loans and an approximately $800 million release for unfunded lending commitments. The pre-tax ACL build in 2020 consists of an approximately $8.3 billion credit reserve build for loans and an approximately $1.4 billion build for unfunded lending commitments. For a reconciliation to report results, please refer to Slide 36.
Slide 61. Trading-related assets include securities borrowed or purchased under agreements to resell net of allowance and trading account assets. All other assets include
brokerage receivables net of allowance, goodwill, intangible assets, deferred tax assets and all other assets net of allowance.2. Represents loans net of allowance for credit losses on loans.3. Loan Yield: Gross interest revenue earned on loans divided by average loans. Rate on Interest-Bearing Liabilities: Represents interest expense divided by average
interest-bearing liabilities. LCR Outflow: Estimated outflow rates applied to Citi’s operational and non-operational deposits as required by the U.S. Liquidity Coverage Ratio (LCR) rule. Liquidity Value: Citi’s estimated remaining deposits after a hypothetical stressed 30-day period under the U.S. LCR rule.
4. Trading-related liabilities include securities loaned or sold under agreements to repurchase and trading account liabilities. All other liabilities include short-term borrowings, brokerage payables and other liabilities.
5. As of December 31, 2021. Total exposure includes direct outstandings and unfunded lending commitments as well as certain corporate exposures in the private bank.6. As of December 31, 2021. FICO scores are updated as they become available. The FICO bands are consistent with general industry peer presentations. Results include
immaterial balances for Canada.
Slide 71. Citi’s reportable CET1 Capital ratio as of December 31, 2021, was derived under the Basel III Standardized Approach framework. Citi’s Total Capital ratio as of December
31, 2021, was derived under the Basel III Advanced Approaches framework. The reportable ratios represent the more binding of these risk-based capital ratios under both the Standardized Approach and Advanced Approaches under the Collins Amendment. For the composition of Citigroup’s CET1 Capital, please see Slide 38.
2. For the composition of Citigroup's Supplementary Leverage Ratio, please see Slide 39.3. As of December 31, 2021, Citi exceeded each of the minimum Total Loss-Absorbing Capacity (TLAC) and LTD requirements, resulting in a $10 billion surplus above its
binding TLAC requirement of LTD as a percentage of Total Leverage Exposure.4. Based on Citi’s method 2 result as of December 31, 2020, and its estimated method 2 result as of December 31, 2021, Citi’s GSIB surcharge is expected to increase to
3.5% effective January 1, 2023.5. Citi’s Tangible Book Value per Share is a non-GAAP financial measure. For additional information, please refer to Slide 39.
40
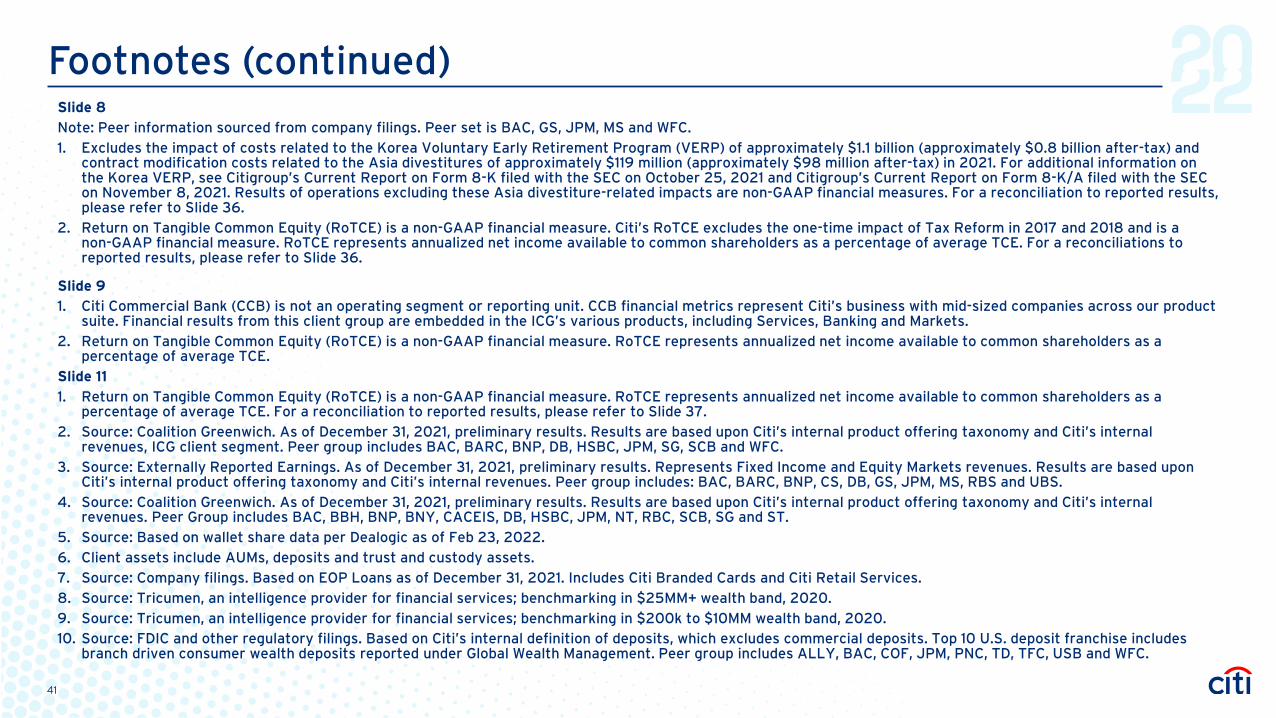
Footnotes (continued)Slide 8
Note: Peer information sourced from company filings. Peer set is BAC, GS, JPM, MS and WFC. 1. Excludes the impact of costs related to the Korea Voluntary Early Retirement Program (VERP) of approximately $1.1 billion (approximately $0.8 billion after-tax) and
contract modification costs related to the Asia divestitures of approximately $119 million (approximately $98 million after-tax) in 2021. For additional information on the Korea VERP, see Citigroup’s Current Report on Form 8-K filed with the SEC on October 25, 2021 and Citigroup’s Current Report on Form 8-K/A filed with the SEC on November 8, 2021. Results of operations excluding these Asia divestiture-related impacts are non-GAAP financial measures. For a reconciliation to reported results, please refer to Slide 36.
2. Return on Tangible Common Equity (RoTCE) is a non-GAAP financial measure. Citi’s RoTCE excludes the one-time impact of Tax Reform in 2017 and 2018 and is a non-GAAP financial measure. RoTCE represents annualized net income available to common shareholders as a percentage of average TCE. For a reconciliations to reported results, please refer to Slide 36.
Slide 91. Citi Commercial Bank (CCB) is not an operating segment or reporting unit. CCB financial metrics represent Citi’s business with mid-sized companies across our product
suite. Financial results from this client group are embedded in the ICG’s various products, including Services, Banking and Markets.2. Return on Tangible Common Equity (RoTCE) is a non-GAAP financial measure. RoTCE represents annualized net income available to common shareholders as a
percentage of average TCE.Slide 11
1. Return on Tangible Common Equity (RoTCE) is a non-GAAP financial measure. RoTCE represents annualized net income available to common shareholders as a percentage of average TCE. For a reconciliation to reported results, please refer to Slide 37.
2. Source: Coalition Greenwich. As of December 31, 2021, preliminary results. Results are based upon Citi’s internal product offering taxonomy and Citi’s internal revenues, ICG client segment. Peer group includes BAC, BARC, BNP, DB, HSBC, JPM, SG, SCB and WFC.
3. Source: Externally Reported Earnings. As of December 31, 2021, preliminary results. Represents Fixed Income and Equity Markets revenues. Results are based upon Citi’s internal product offering taxonomy and Citi’s internal revenues. Peer group includes: BAC, BARC, BNP, CS, DB, GS, JPM, MS, RBS and UBS.
4. Source: Coalition Greenwich. As of December 31, 2021, preliminary results. Results are based upon Citi’s internal product offering taxonomy and Citi’s internal revenues. Peer Group includes BAC, BBH, BNP, BNY, CACEIS, DB, HSBC, JPM, NT, RBC, SCB, SG and ST.
5. Source: Based on wallet share data per Dealogic as of Feb 23, 2022.6. Client assets include AUMs, deposits and trust and custody assets.7. Source: Company filings. Based on EOP Loans as of December 31, 2021. Includes Citi Branded Cards and Citi Retail Services.8. Source: Tricumen, an intelligence provider for financial services; benchmarking in $25MM+ wealth band, 2020.9. Source: Tricumen, an intelligence provider for financial services; benchmarking in $200k to $10MM wealth band, 2020.10. Source: FDIC and other regulatory filings. Based on Citi’s internal definition of deposits, which excludes commercial deposits. Top 10 U.S. deposit franchise includes
branch driven consumer wealth deposits reported under Global Wealth Management. Peer group includes ALLY, BAC, COF, JPM, PNC, TD, TFC, USB and WFC.
41
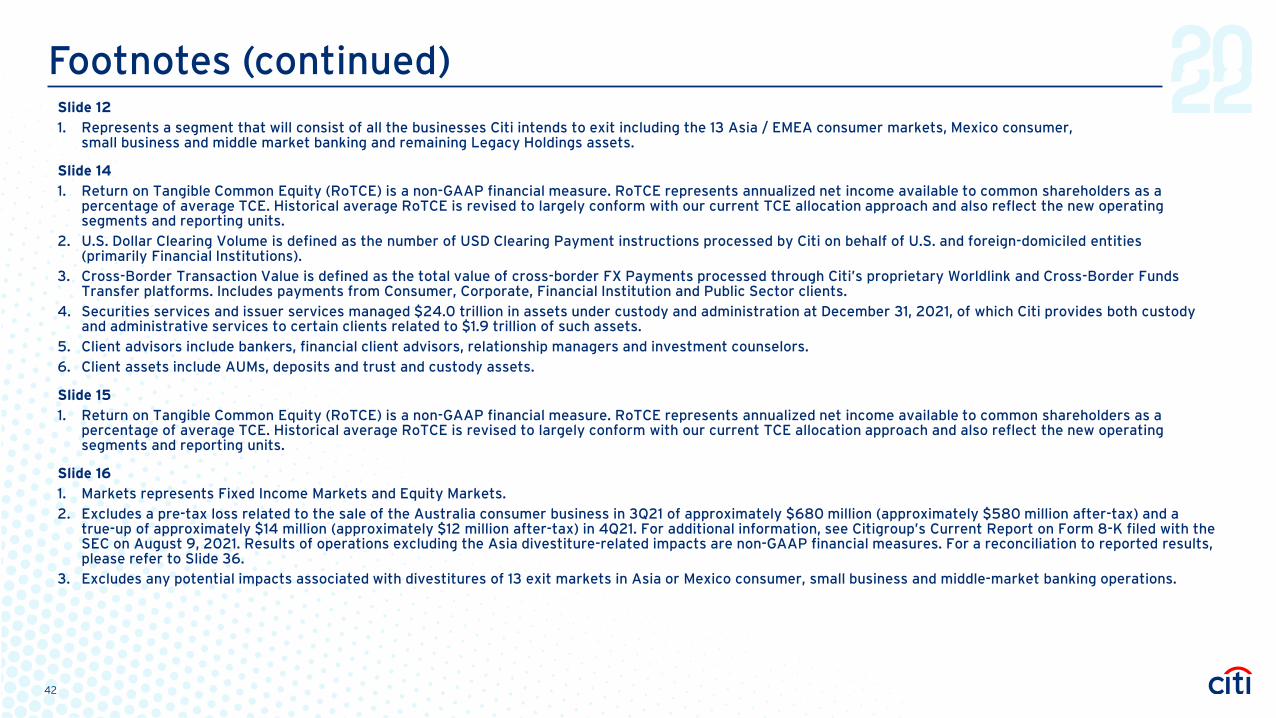
Footnotes (continued)Slide 12
1. Represents a segment that will consist of all the businesses Citi intends to exit including the 13 Asia / EMEA consumer markets, Mexico consumer, small business and middle market banking and remaining Legacy Holdings assets.
Slide 14
1. Return on Tangible Common Equity (RoTCE) is a non-GAAP financial measure. RoTCE represents annualized net income available to common shareholders as a percentage of average TCE. Historical average RoTCE is revised to largely conform with our current TCE allocation approach and also reflect the new operating segments and reporting units.
2. U.S. Dollar Clearing Volume is defined as the number of USD Clearing Payment instructions processed by Citi on behalf of U.S. and foreign-domiciled entities (primarily Financial Institutions).
3. Cross-Border Transaction Value is defined as the total value of cross-border FX Payments processed through Citi’s proprietary Worldlink and Cross-Border Funds Transfer platforms. Includes payments from Consumer, Corporate, Financial Institution and Public Sector clients.
4. Securities services and issuer services managed $24.0 trillion in assets under custody and administration at December 31, 2021, of which Citi provides both custody and administrative services to certain clients related to $1.9 trillion of such assets.
5. Client advisors include bankers, financial client advisors, relationship managers and investment counselors.6. Client assets include AUMs, deposits and trust and custody assets.
Slide 15
1. Return on Tangible Common Equity (RoTCE) is a non-GAAP financial measure. RoTCE represents annualized net income available to common shareholders as a percentage of average TCE. Historical average RoTCE is revised to largely conform with our current TCE allocation approach and also reflect the new operating segments and reporting units.
Slide 16
1. Markets represents Fixed Income Markets and Equity Markets.2. Excludes a pre-tax loss related to the sale of the Australia consumer business in 3Q21 of approximately $680 million (approximately $580 million after-tax) and a
true-up of approximately $14 million (approximately $12 million after-tax) in 4Q21. For additional information, see Citigroup’s Current Report on Form 8-K filed with the SEC on August 9, 2021. Results of operations excluding the Asia divestiture-related impacts are non-GAAP financial measures. For a reconciliation to reported results, please refer to Slide 36.
3. Excludes any potential impacts associated with divestitures of 13 exit markets in Asia or Mexico consumer, small business and middle-market banking operations.
42
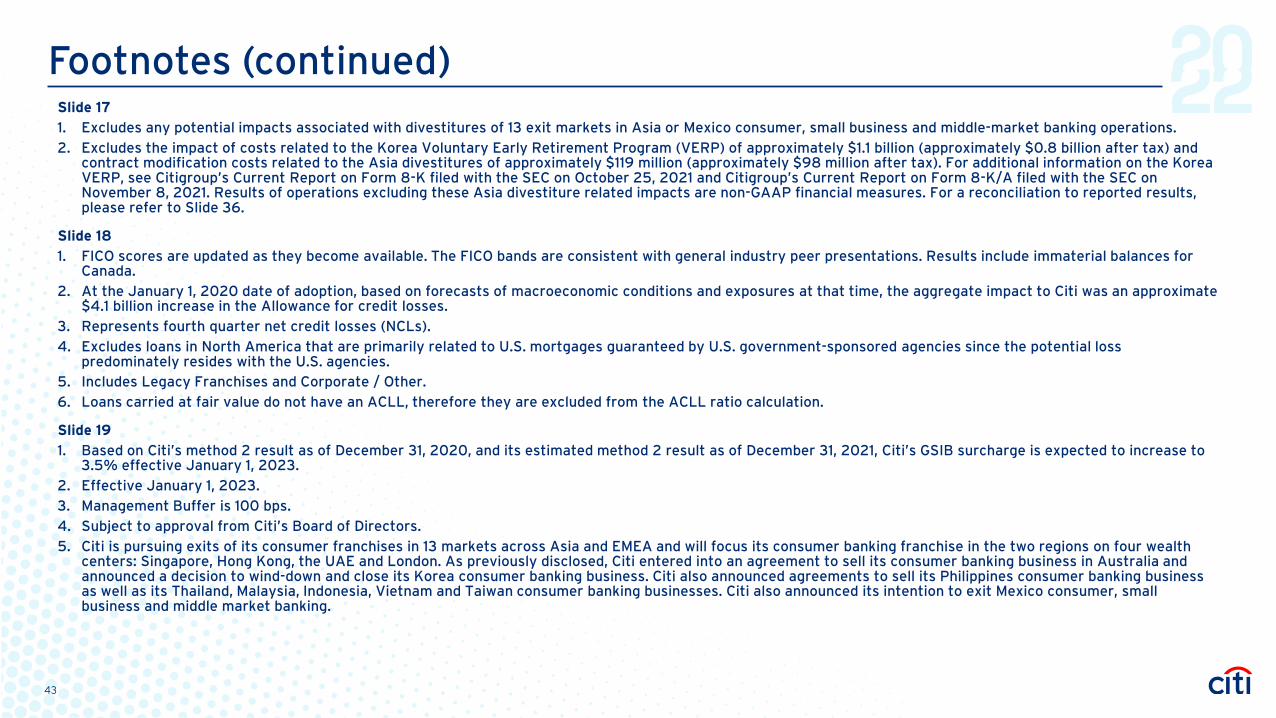
Footnotes (continued)Slide 17
1. Excludes any potential impacts associated with divestitures of 13 exit markets in Asia or Mexico consumer, small business and middle-market banking operations.2. Excludes the impact of costs related to the Korea Voluntary Early Retirement Program (VERP) of approximately $1.1 billion (approximately $0.8 billion after tax) and
contract modification costs related to the Asia divestitures of approximately $119 million (approximately $98 million after tax). For additional information on the Korea VERP, see Citigroup’s Current Report on Form 8-K filed with the SEC on October 25, 2021 and Citigroup’s Current Report on Form 8-K/A filed with the SEC on November 8, 2021. Results of operations excluding these Asia divestiture related impacts are non-GAAP financial measures. For a reconciliation to reported results, please refer to Slide 36.
Slide 18
1. FICO scores are updated as they become available. The FICO bands are consistent with general industry peer presentations. Results include immaterial balances for Canada.
2. At the January 1, 2020 date of adoption, based on forecasts of macroeconomic conditions and exposures at that time, the aggregate impact to Citi was an approximate $4.1 billion increase in the Allowance for credit losses.
3. Represents fourth quarter net credit losses (NCLs).4. Excludes loans in North America that are primarily related to U.S. mortgages guaranteed by U.S. government-sponsored agencies since the potential loss
predominately resides with the U.S. agencies.5. Includes Legacy Franchises and Corporate / Other.6. Loans carried at fair value do not have an ACLL, therefore they are excluded from the ACLL ratio calculation.
Slide 19
1. Based on Citi’s method 2 result as of December 31, 2020, and its estimated method 2 result as of December 31, 2021, Citi’s GSIB surcharge is expected to increase to 3.5% effective January 1, 2023.
2. Effective January 1, 2023.3. Management Buffer is 100 bps.4. Subject to approval from Citi’s Board of Directors.5. Citi is pursuing exits of its consumer franchises in 13 markets across Asia and EMEA and will focus its consumer banking franchise in the two regions on four wealth
centers: Singapore, Hong Kong, the UAE and London. As previously disclosed, Citi entered into an agreement to sell its consumer banking business in Australia and announced a decision to wind-down and close its Korea consumer banking business. Citi also announced agreements to sell its Philippines consumer banking business as well as its Thailand, Malaysia, Indonesia, Vietnam and Taiwan consumer banking businesses. Citi also announced its intention to exit Mexico consumer, small business and middle market banking.
43
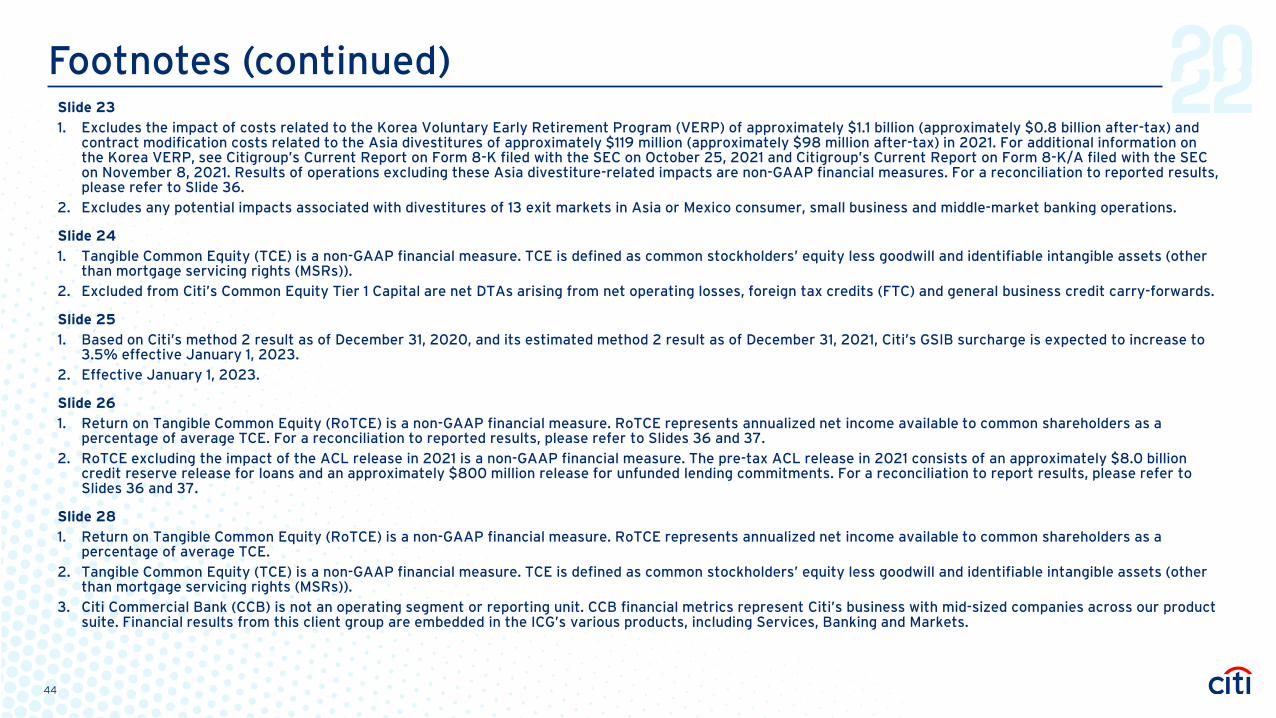
Footnotes (continued)Slide 23
1. Excludes the impact of costs related to the Korea Voluntary Early Retirement Program (VERP) of approximately $1.1 billion (approximately $0.8 billion after-tax) and contract modification costs related to the Asia divestitures of approximately $119 million (approximately $98 million after-tax) in 2021. For additional information on the Korea VERP, see Citigroup’s Current Report on Form 8-K filed with the SEC on October 25, 2021 and Citigroup’s Current Report on Form 8-K/A filed with the SEC on November 8, 2021. Results of operations excluding these Asia divestiture-related impacts are non-GAAP financial measures. For a reconciliation to reported results, please refer to Slide 36.
2. Excludes any potential impacts associated with divestitures of 13 exit markets in Asia or Mexico consumer, small business and middle-market banking operations.
Slide 24
1. Tangible Common Equity (TCE) is a non-GAAP financial measure. TCE is defined as common stockholders’ equity less goodwill and identifiable intangible assets (other than mortgage servicing rights (MSRs)).
2. Excluded from Citi’s Common Equity Tier 1 Capital are net DTAs arising from net operating losses, foreign tax credits (FTC) and general business credit carry-forwards.
Slide 25
1. Based on Citi’s method 2 result as of December 31, 2020, and its estimated method 2 result as of December 31, 2021, Citi’s GSIB surcharge is expected to increase to 3.5% effective January 1, 2023.
2. Effective January 1, 2023.
Slide 26
1. Return on Tangible Common Equity (RoTCE) is a non-GAAP financial measure. RoTCE represents annualized net income available to common shareholders as a percentage of average TCE. For a reconciliation to reported results, please refer to Slides 36 and 37.
2. RoTCE excluding the impact of the ACL release in 2021 is a non-GAAP financial measure. The pre-tax ACL release in 2021 consists of an approximately $8.0 billion credit reserve release for loans and an approximately $800 million release for unfunded lending commitments. For a reconciliation to report results, please refer to Slides 36 and 37.
Slide 28
1. Return on Tangible Common Equity (RoTCE) is a non-GAAP financial measure. RoTCE represents annualized net income available to common shareholders as a percentage of average TCE.
2. Tangible Common Equity (TCE) is a non-GAAP financial measure. TCE is defined as common stockholders’ equity less goodwill and identifiable intangible assets (other than mortgage servicing rights (MSRs)).
3. Citi Commercial Bank (CCB) is not an operating segment or reporting unit. CCB financial metrics represent Citi’s business with mid-sized companies across our product suite. Financial results from this client group are embedded in the ICG’s various products, including Services, Banking and Markets.
44
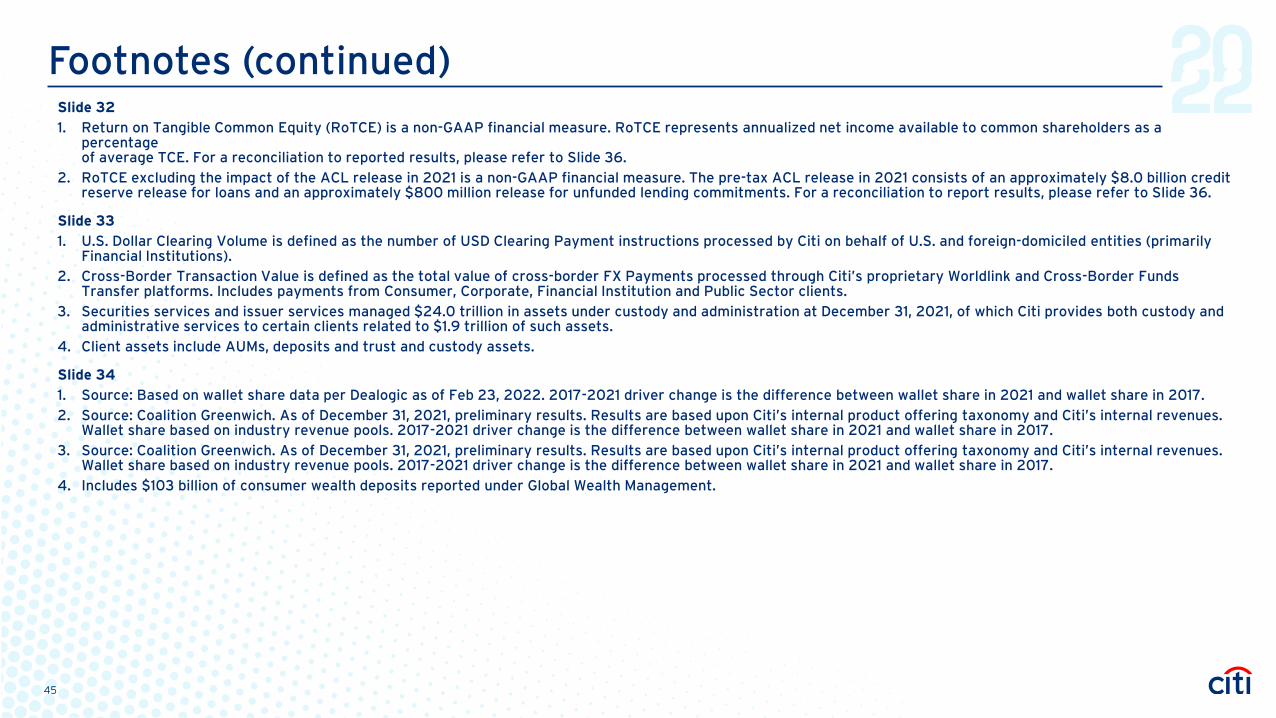
Footnotes (continued)Slide 32
1. Return on Tangible Common Equity (RoTCE) is a non-GAAP financial measure. RoTCE represents annualized net income available to common shareholders as a percentage of average TCE. For a reconciliation to reported results, please refer to Slide 36.
2. RoTCE excluding the impact of the ACL release in 2021 is a non-GAAP financial measure. The pre-tax ACL release in 2021 consists of an approximately $8.0 billion credit reserve release for loans and an approximately $800 million release for unfunded lending commitments. For a reconciliation to report results, please refer to Slide 36.
Slide 33
1. U.S. Dollar Clearing Volume is defined as the number of USD Clearing Payment instructions processed by Citi on behalf of U.S. and foreign-domiciled entities (primarily Financial Institutions).
2. Cross-Border Transaction Value is defined as the total value of cross-border FX Payments processed through Citi’s proprietary Worldlink and Cross-Border Funds Transfer platforms. Includes payments from Consumer, Corporate, Financial Institution and Public Sector clients.
3. Securities services and issuer services managed $24.0 trillion in assets under custody and administration at December 31, 2021, of which Citi provides both custody and administrative services to certain clients related to $1.9 trillion of such assets.
4. Client assets include AUMs, deposits and trust and custody assets.
Slide 34
1. Source: Based on wallet share data per Dealogic as of Feb 23, 2022. 2017-2021 driver change is the difference between wallet share in 2021 and wallet share in 2017.2. Source: Coalition Greenwich. As of December 31, 2021, preliminary results. Results are based upon Citi’s internal product offering taxonomy and Citi’s internal revenues.
Wallet share based on industry revenue pools. 2017-2021 driver change is the difference between wallet share in 2021 and wallet share in 2017.3. Source: Coalition Greenwich. As of December 31, 2021, preliminary results. Results are based upon Citi’s internal product offering taxonomy and Citi’s internal revenues.
Wallet share based on industry revenue pools. 2017-2021 driver change is the difference between wallet share in 2021 and wallet share in 2017. 4. Includes $103 billion of consumer wealth deposits reported under Global Wealth Management.
45
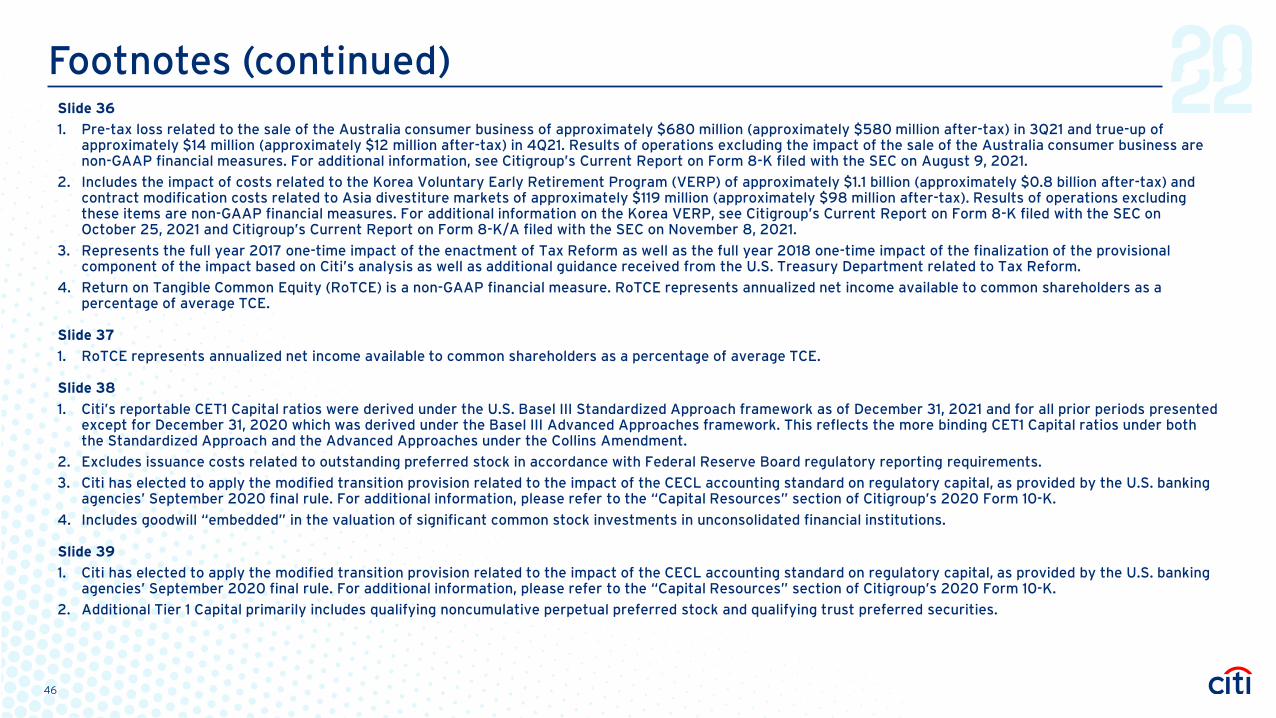
Footnotes (continued)Slide 36
1. Pre-tax loss related to the sale of the Australia consumer business of approximately $680 million (approximately $580 million after-tax) in 3Q21 and true-up of approximately $14 million (approximately $12 million after-tax) in 4Q21. Results of operations excluding the impact of the sale of the Australia consumer business are non-GAAP financial measures. For additional information, see Citigroup’s Current Report on Form 8-K filed with the SEC on August 9, 2021.
2. Includes the impact of costs related to the Korea Voluntary Early Retirement Program (VERP) of approximately $1.1 billion (approximately $0.8 billion after-tax) and contract modification costs related to Asia divestiture markets of approximately $119 million (approximately $98 million after-tax). Results of operations excluding these items are non-GAAP financial measures. For additional information on the Korea VERP, see Citigroup’s Current Report on Form 8-K filed with the SEC on October 25, 2021 and Citigroup’s Current Report on Form 8-K/A filed with the SEC on November 8, 2021.
3. Represents the full year 2017 one-time impact of the enactment of Tax Reform as well as the full year 2018 one-time impact of the finalization of the provisional component of the impact based on Citi’s analysis as well as additional guidance received from the U.S. Treasury Department related to Tax Reform.
4. Return on Tangible Common Equity (RoTCE) is a non-GAAP financial measure. RoTCE represents annualized net income available to common shareholders as a percentage of average TCE.
Slide 37
1. RoTCE represents annualized net income available to common shareholders as a percentage of average TCE.
Slide 38
1. Citi’s reportable CET1 Capital ratios were derived under the U.S. Basel III Standardized Approach framework as of December 31, 2021 and for all prior periods presented except for December 31, 2020 which was derived under the Basel III Advanced Approaches framework. This reflects the more binding CET1 Capital ratios under both the Standardized Approach and the Advanced Approaches under the Collins Amendment.
2. Excludes issuance costs related to outstanding preferred stock in accordance with Federal Reserve Board regulatory reporting requirements.
3. Citi has elected to apply the modified transition provision related to the impact of the CECL accounting standard on regulatory capital, as provided by the U.S. banking agencies’ September 2020 final rule. For additional information, please refer to the “Capital Resources” section of Citigroup’s 2020 Form 10-K.
4. Includes goodwill “embedded” in the valuation of significant common stock investments in unconsolidated financial institutions.
Slide 39
1. Citi has elected to apply the modified transition provision related to the impact of the CECL accounting standard on regulatory capital, as provided by the U.S. banking agencies’ September 2020 final rule. For additional information, please refer to the “Capital Resources” section of Citigroup’s 2020 Form 10-K.
2. Additional Tier 1 Capital primarily includes qualifying noncumulative perpetual preferred stock and qualifying trust preferred securities.
46
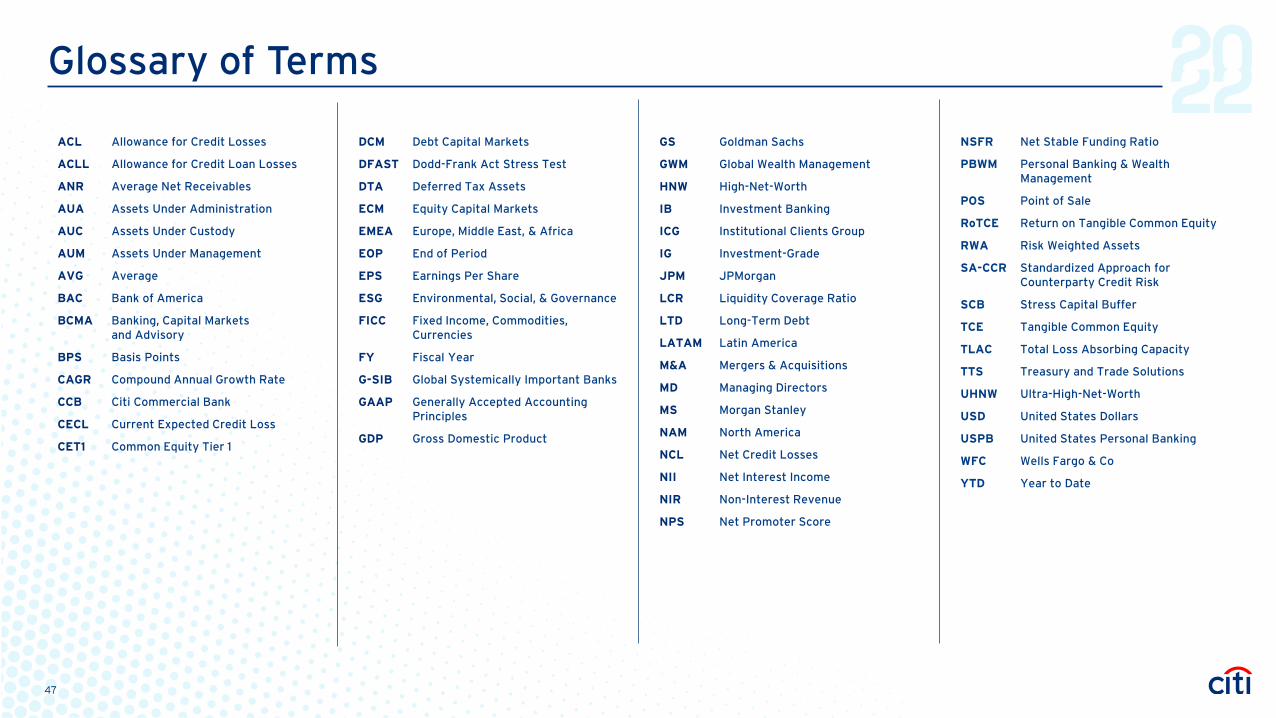
Glossary of Terms
ACL Allowance for Credit Losses
ACLL Allowance for Credit Loan Losses
ANR Average Net Receivables
AUA Assets Under Administration
AUC Assets Under Custody
AUM Assets Under Management
AVG Average
BAC Bank of America
BCMA Banking, Capital Markets and Advisory
BPS Basis Points
CAGR Compound Annual Growth Rate
CCB Citi Commercial Bank
CECL Current Expected Credit Loss
CET1 Common Equity Tier 1
DCM Debt Capital Markets
DFAST Dodd-Frank Act Stress Test
DTA Deferred Tax Assets
ECM Equity Capital Markets
EMEA Europe, Middle East, & Africa
EOP End of Period
EPS Earnings Per Share
ESG Environmental, Social, & Governance
FICC Fixed Income, Commodities, Currencies
FY Fiscal Year
G-SIB Global Systemically Important Banks
GAAP Generally Accepted Accounting Principles
GDP Gross Domestic Product
GS Goldman Sachs
GWM Global Wealth Management
HNW High-Net-Worth
IB Investment Banking
ICG Institutional Clients Group
IG Investment-Grade
JPM JPMorgan
LCR Liquidity Coverage Ratio
LTD Long-Term Debt
LATAM Latin America
M&A Mergers & Acquisitions
MD Managing Directors
MS Morgan Stanley
NAM North America
NCL Net Credit Losses
NII Net Interest Income
NIR Non-Interest Revenue
NPS Net Promoter Score
NSFR Net Stable Funding Ratio
PBWM Personal Banking & Wealth Management
POS Point of Sale
RoTCE Return on Tangible Common Equity
RWA Risk Weighted Assets
SA-CCR Standardized Approach for Counterparty Credit Risk
SCB Stress Capital Buffer
TCE Tangible Common Equity
TLAC Total Loss Absorbing Capacity
TTS Treasury and Trade Solutions
UHNW Ultra-High-Net-Worth
USD United States Dollars
USPB United States Personal Banking
WFC Wells Fargo & Co
YTD Year to Date
47
Related Documents

![PM 2014 investor day 2014-06-26-CEO Investor Day Slides [FINAL]](https://static.cupdf.com/doc/110x72/577cbc651a28aba7118da313/pm-2014-investor-day-2014-06-26-ceo-investor-day-slides-final.jpg)


![PM 2014 investor day 2014-06-26-Operations Investor Day Slides [FINAL]](https://static.cupdf.com/doc/110x72/577cbc651a28aba7118da314/pm-2014-investor-day-2014-06-26-operations-investor-day-slides-final.jpg)