Investor Call June 21, 2016 United Continental Holdings, Inc. Oscar Munoz President and Chief Executive Officer Jim Compton Vice Chairman and Chief Revenue Officer

Welcome message from author
This document is posted to help you gain knowledge. Please leave a comment to let me know what you think about it! Share it to your friends and learn new things together.
Transcript

Investor Call
June 21, 2016
United Continental Holdings, Inc. Oscar Munoz President and Chief Executive Officer Jim Compton Vice Chairman and Chief Revenue Officer
Certain statements included in this presentation are forward-looking and thus reflect our current expectations and beliefs with respect to certain future events and anticipated financial and operating performance. Such forward-looking statements are and will be subject to many risks and uncertainties relating to our operations and business environment that may cause actual results to differ materially from any future results expressed or implied in such forward-looking statements. Words such as “expects,” “will,” “plans,” “anticipates,” “indicates,” “believes,” “forecast,” “guidance,” “outlook,” “goals” and similar expressions are intended to identify forward-looking statements. Additionally, forward-looking statements include statements that do not relate solely to historical facts, such as statements which identify uncertainties or trends, discuss the possible future effects of current known trends or uncertainties, or which indicate that the future effects of known trends or uncertainties cannot be predicted, guaranteed or assured. All forward-looking statements in this presentation are based upon information available to us on the date of this presentation. We undertake no obligation to publicly update or revise any forward-looking statement, whether as a result of new information, future events, changed circumstances or otherwise, except as required by applicable law. Our actual results could differ materially from these forward-looking statements due to numerous factors including, without limitation, the following: our ability to comply with the terms of our various financing arrangements; the costs and availability of financing; our ability to maintain adequate liquidity; our ability to execute our operational plans and revenue-generating initiatives, including optimizing our revenue; our ability to control our costs, including realizing benefits from our resource optimization efforts, cost reduction initiatives and fleet replacement programs; our ability to utilize our net operating losses; our ability to attract and retain customers; demand for transportation in the markets in which we operate; an outbreak of a disease that affects travel demand or travel behavior; demand for travel and the impact that global economic conditions have on customer travel patterns; excessive taxation and the inability to offset future taxable income; general economic conditions (including interest rates, foreign currency exchange rates, investment or credit market conditions, crude oil prices, costs of aircraft fuel and energy refining capacity in relevant markets); economic and political instability and other risks of doing business globally; our ability to cost-effectively hedge against increases in the price of aircraft fuel; any potential realized or unrealized gains or losses related to fuel or currency hedging programs; the effects of any hostilities, act of war or terrorist attack; the ability of other air carriers with whom we have alliances or partnerships to provide the services contemplated by the respective arrangements with such carriers; disruptions to our regional network; the costs and availability of aviation and other insurance; industry consolidation or changes in airline alliances; competitive pressures on pricing and on demand; our capacity decisions and the capacity decisions of our competitors; U.S. or foreign governmental legislation, regulation and other actions (including open skies agreements and environmental regulations); the impact of regulatory, investigative and legal proceedings and legal compliance risks; the impact of any management changes; labor costs; our ability to maintain satisfactory labor relations and the results of the collective bargaining agreement process with our union groups; any disruptions to operations due to any potential actions by our labor groups; weather conditions; and other risks and uncertainties set forth under Part I, Item 1A., “Risk Factors,” of UAL’s Annual Report on Form 10-K, as well as other risks and uncertainties set forth from time to time in the reports we file with the U.S. Securities and Exchange Commission.
Safe Harbor Statement
2

Purpose of today’s call
Continue with open, direct and frequent dialogue
Share update on efforts already underway to improve financial performance
Plan to host an investor day in the fourth quarter of 2016
3
Engaged workforce
Global network
Flexible fleet
Healthy balance sheet
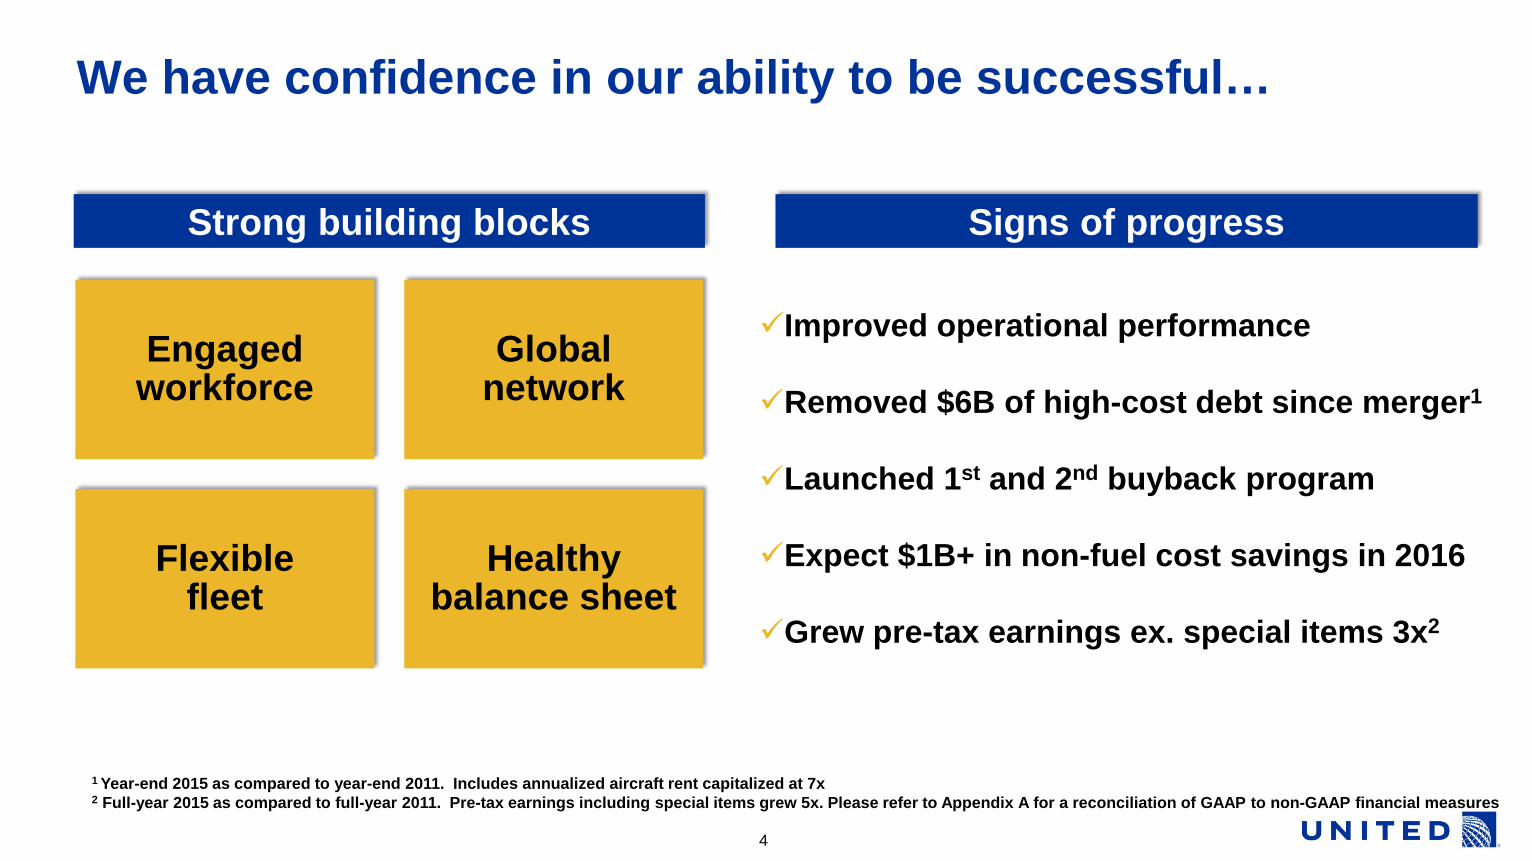
We have confidence in our ability to be successful…
4
Improved operational performance Removed $6B of high-cost debt since merger1
Launched 1st and 2nd buyback program
Expect $1B+ in non-fuel cost savings in 2016 Grew pre-tax earnings ex. special items 3x2
Signs of progress Strong building blocks
1 Year-end 2015 as compared to year-end 2011. Includes annualized aircraft rent capitalized at 7x 2 Full-year 2015 as compared to full-year 2011. Pre-tax earnings including special items grew 5x. Please refer to Appendix A for a reconciliation of GAAP to non-GAAP financial measures

(2%)0%2%4%6%8%
10%12%14%16%18%
2015 2014 2013 2012 20113 1Q16
Peers Integration was more complex and took
longer than expected
Had operational and service challenges
Seat share declined in domestic markets as domestic profitability improved
Lost share of premium customers
…but financial performance has lagged peers
5
Pre-tax margin1
UAL vs. peers2
1 Twelve months ended 2 AAL (pro-forma prior to 1Q14), DAL and LUV (pro-forma prior to 2Q12); Pre-tax margin, excluding special items, is a non-GAAP measure and may be calculated differently by the peer airlines presented in this chart 3 UAL numbers in 1Q11 and 2Q11 are pro-forma
What contributed to relative performance?
Excl. special items Incl. special items

Current priorities
Earnings accretive initiatives underway
Network and commercial objectives
Looking ahead
We are focused on improving relative financial performance
1
2
3
4
6
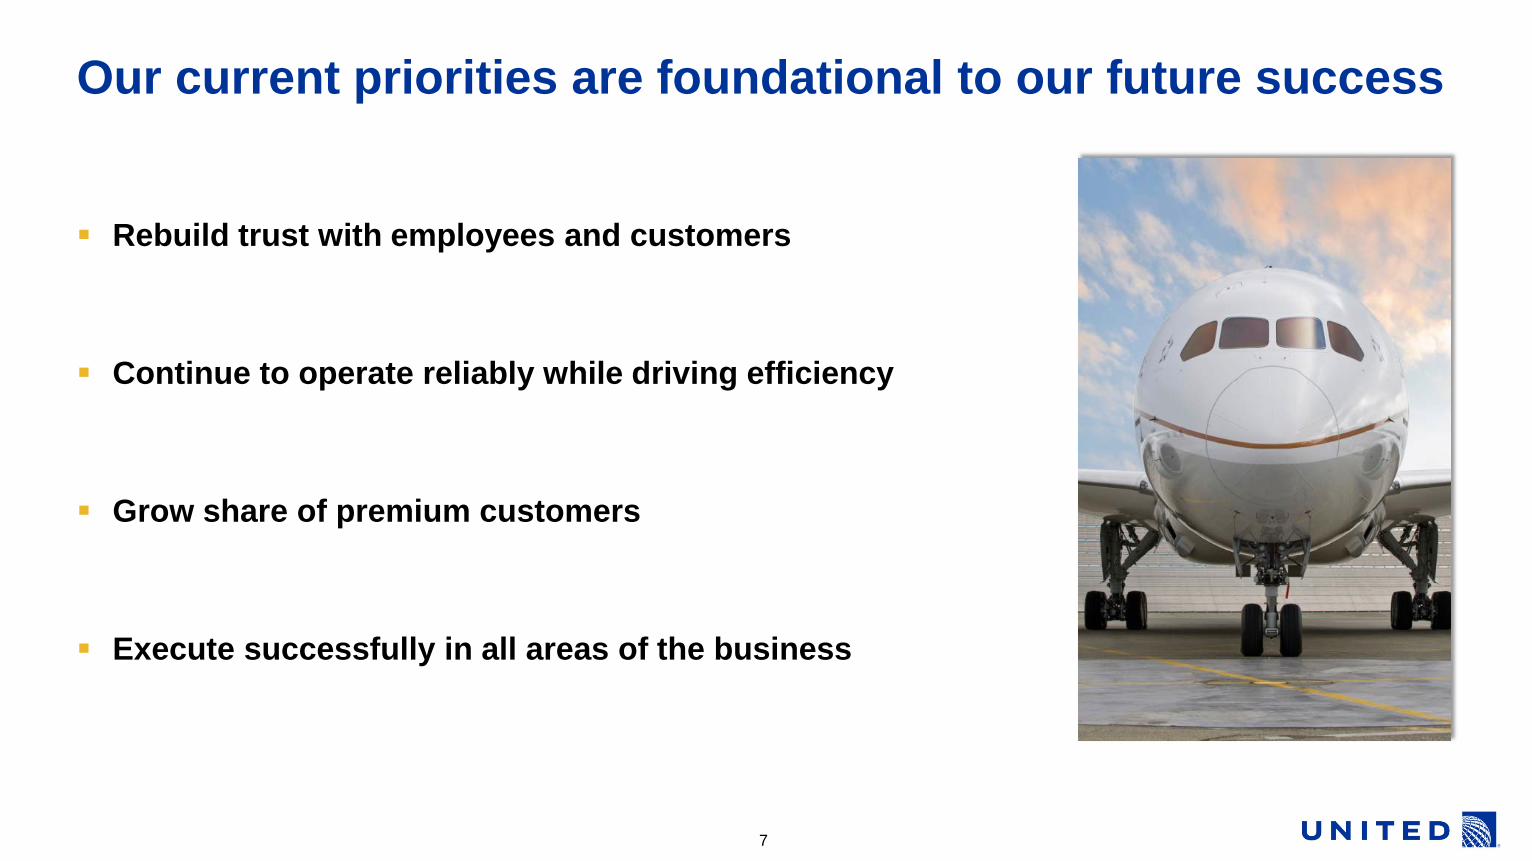
Our current priorities are foundational to our future success
Rebuild trust with employees and customers
Continue to operate reliably while driving efficiency
Grow share of premium customers
Execute successfully in all areas of the business
7
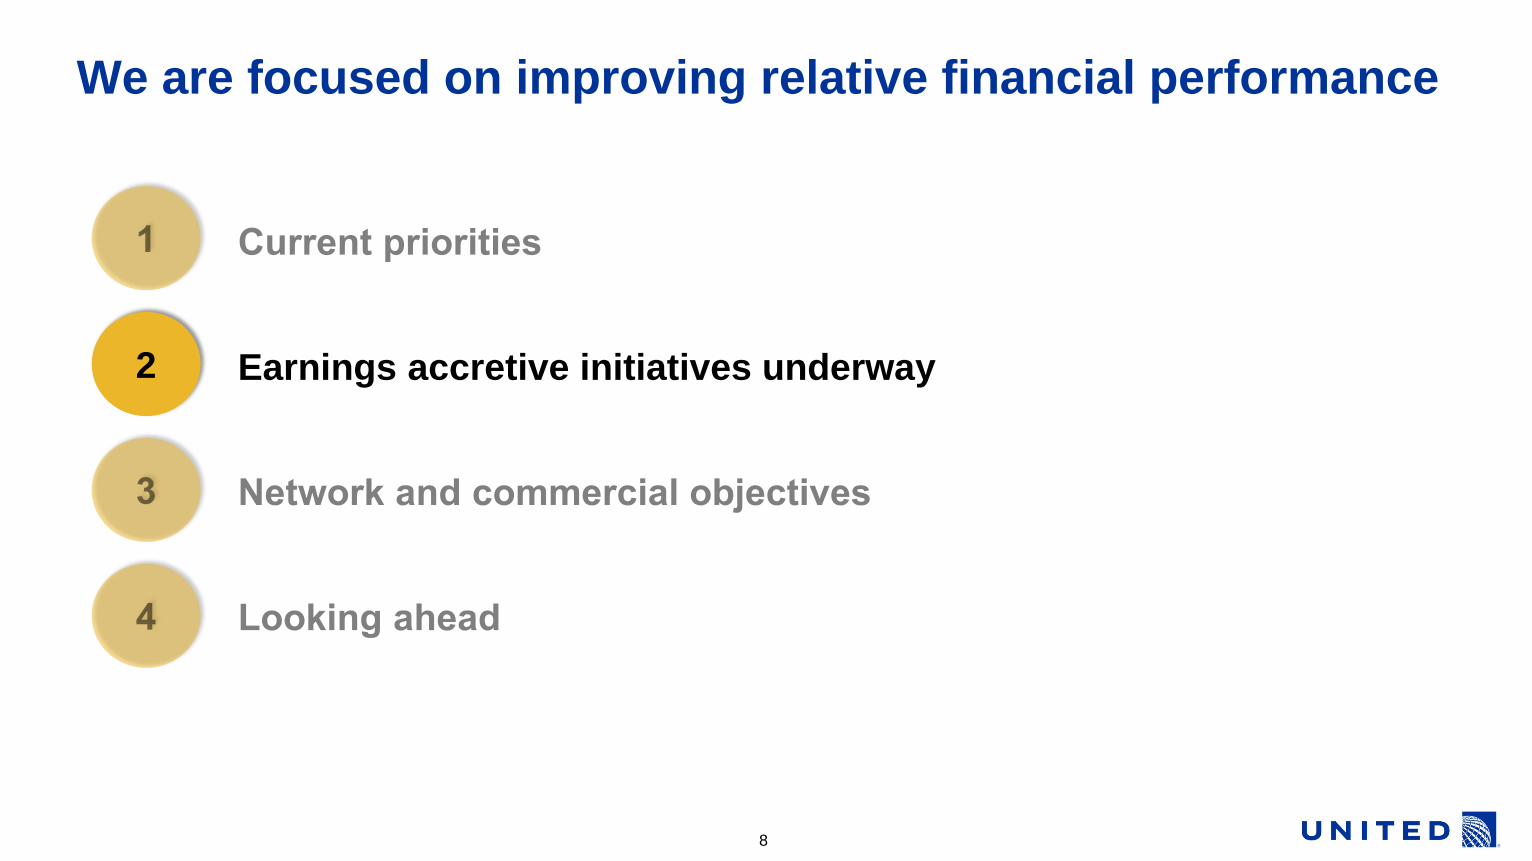
Earnings accretive initiatives underway
We are focused on improving relative financial performance
2
8
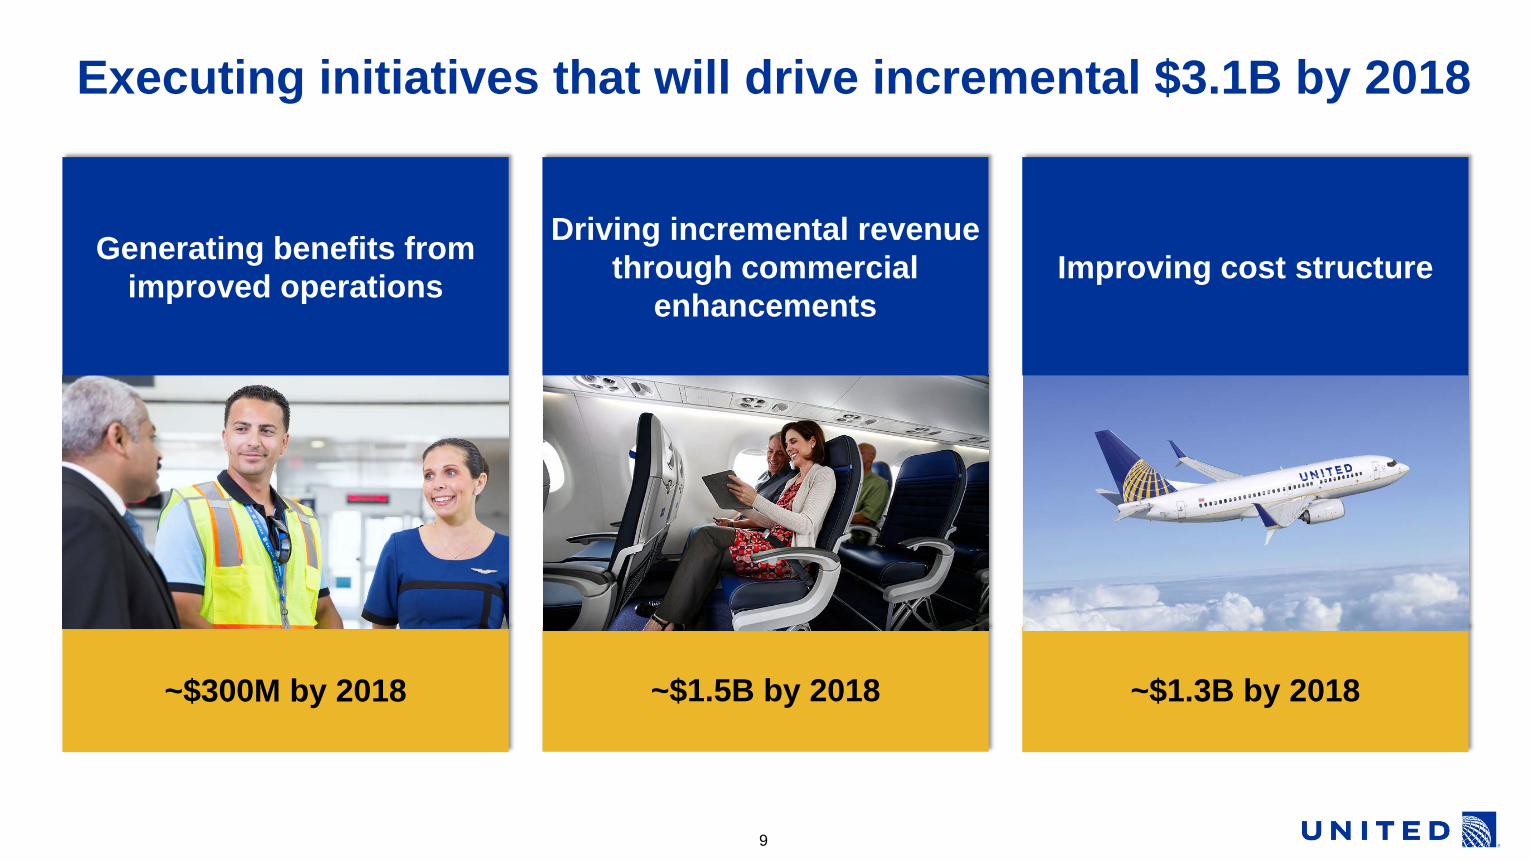
~$300M by 2018 ~$1.3B by 2018 ~$1.5B by 2018
Executing initiatives that will drive incremental $3.1B by 2018
Improving cost structure Driving incremental revenue
through commercial enhancements
Generating benefits from improved operations
9
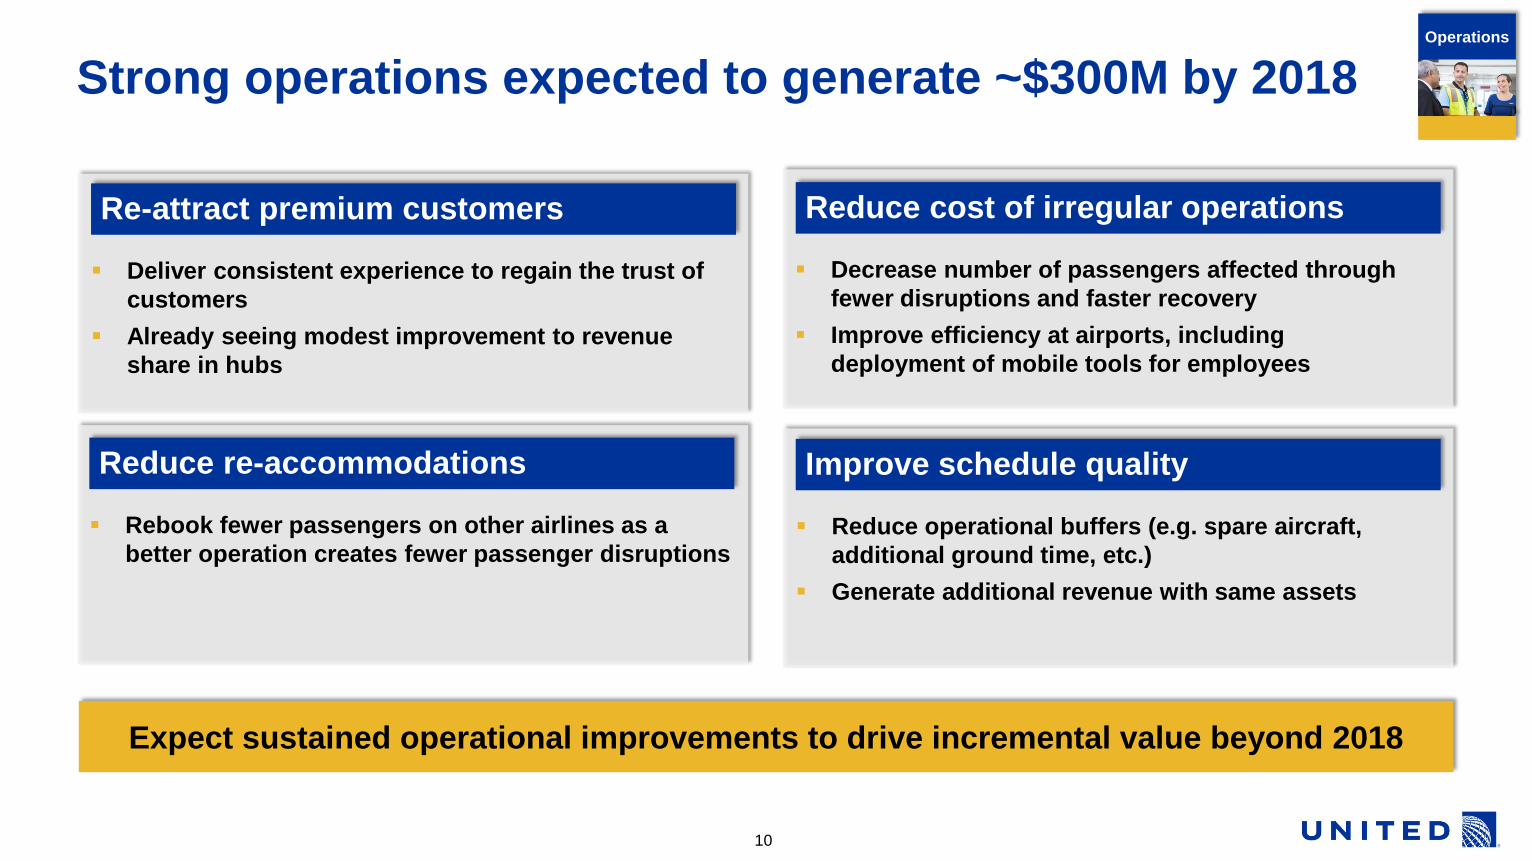
Reduce operational buffers (e.g. spare aircraft, additional ground time, etc.)
Generate additional revenue with same assets
Improve schedule quality
Strong operations expected to generate ~$300M by 2018
Re-attract premium customers
Deliver consistent experience to regain the trust of customers
Already seeing modest improvement to revenue share in hubs
Reduce cost of irregular operations
Decrease number of passengers affected through fewer disruptions and faster recovery
Improve efficiency at airports, including deployment of mobile tools for employees
10
Expect sustained operational improvements to drive incremental value beyond 2018
Operations
Rebook fewer passengers on other airlines as a better operation creates fewer passenger disruptions
Reduce re-accommodations

Grow industry-leading existing portfolio
(~$750M by 2018) ~20% increase in Economy Plus and ~30% increase
in front-cabin seating by 2018
Expand sales through third party channels
Introduce new products (~$250M by 2018) Entry level fares (~$150M by 2018) for price
sensitive customers
Bundled products (~$100M by 2018) to improve customer choice and customization
Further segmentation will drive $1B of revenue by 2018
11
$6.53
$10.94
~50%
2018E 2015
70%
2012
Customer choice revenue1
$ per passenger
$16 - $17
1 Includes revenue from ancillary products including premium cabin, Economy Plus, and entry level fare upsells Does not include bag, change and booking fees
$0.9B $1.5B $2.5B Annual impact
Revenue
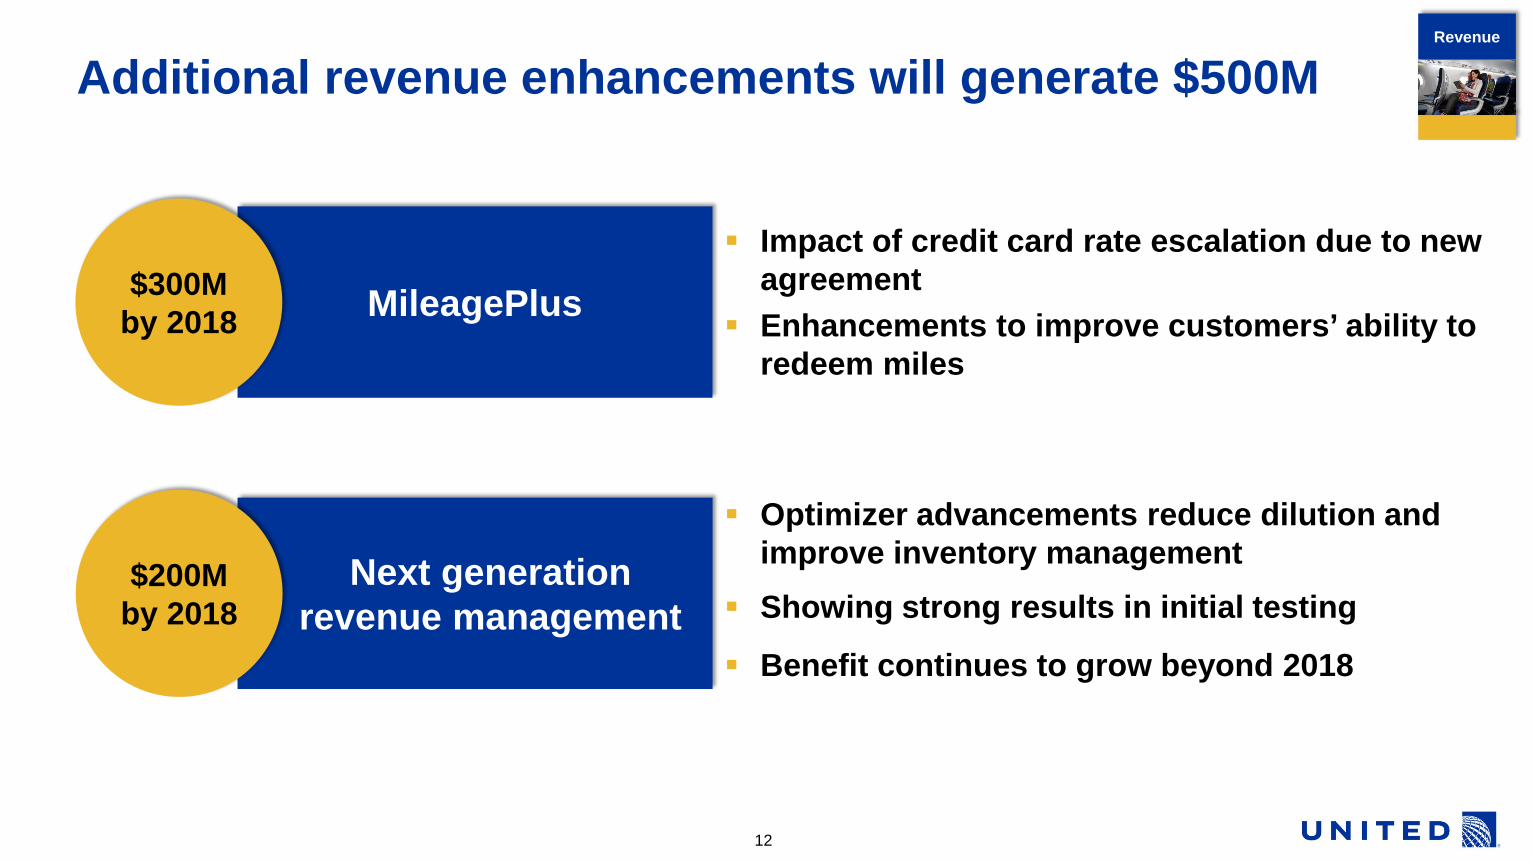
Next generation revenue management
MileagePlus
Additional revenue enhancements will generate $500M
12
$300M by 2018
$200M by 2018
Impact of credit card rate escalation due to new agreement
Enhancements to improve customers’ ability to redeem miles
Optimizer advancements reduce dilution and improve inventory management
Showing strong results in initial testing
Benefit continues to grow beyond 2018
Revenue
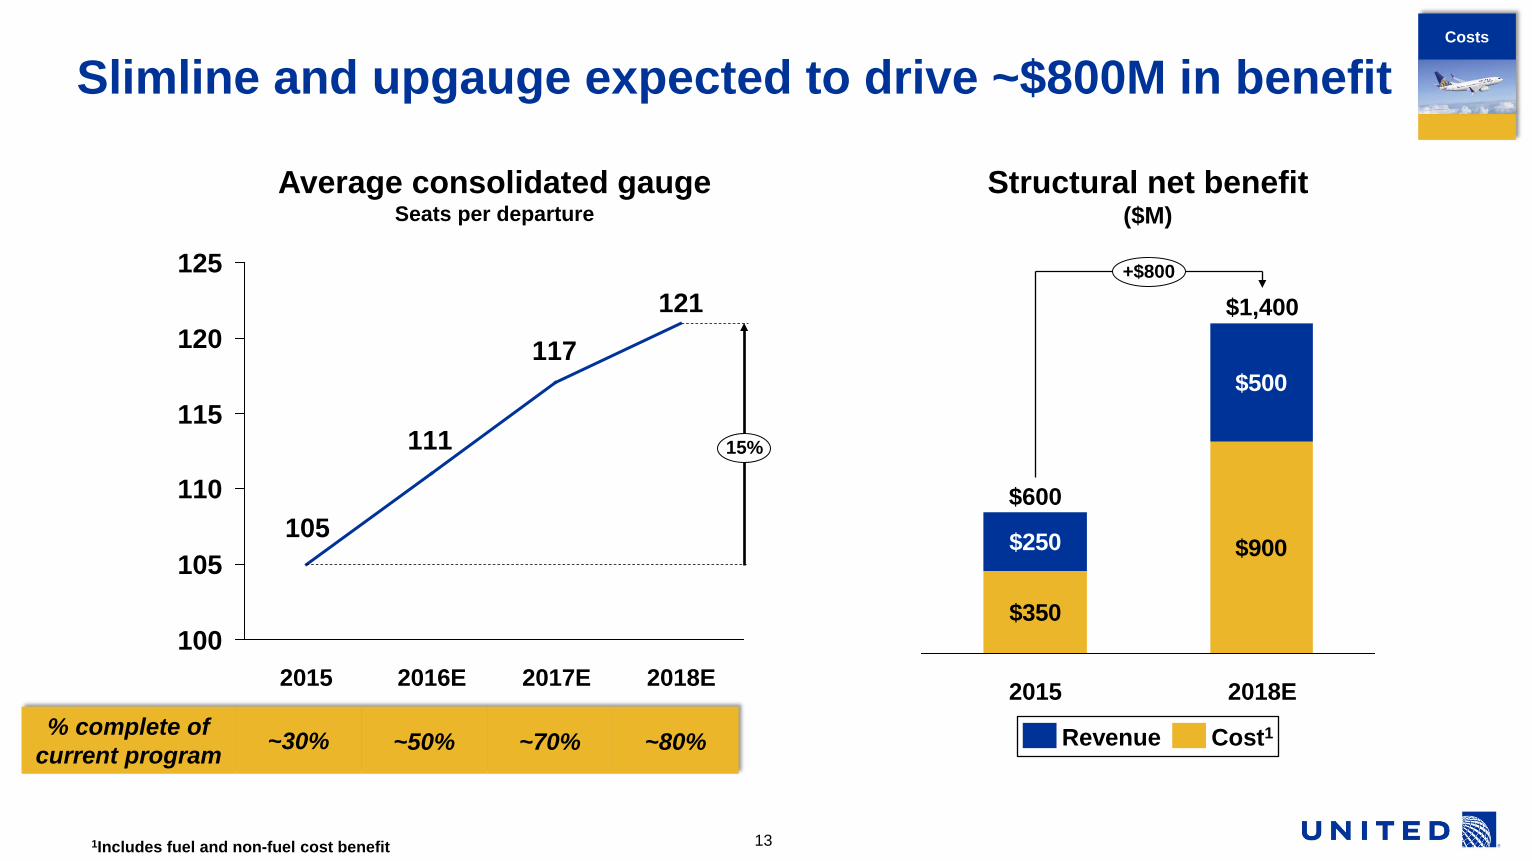
Slimline and upgauge expected to drive ~$800M in benefit
13
121
117
111
105
100
105
110
115
120
125
15%
2018E 2016E 2015 2017E
Average consolidated gauge Seats per departure
% complete of current program ~30% ~50% ~70% ~80%
$350
$900$250
$500
+$800
2018E
$1,400
2015
$600
Structural net benefit ($M)
Cost1 Revenue
Costs
1Includes fuel and non-fuel cost benefit
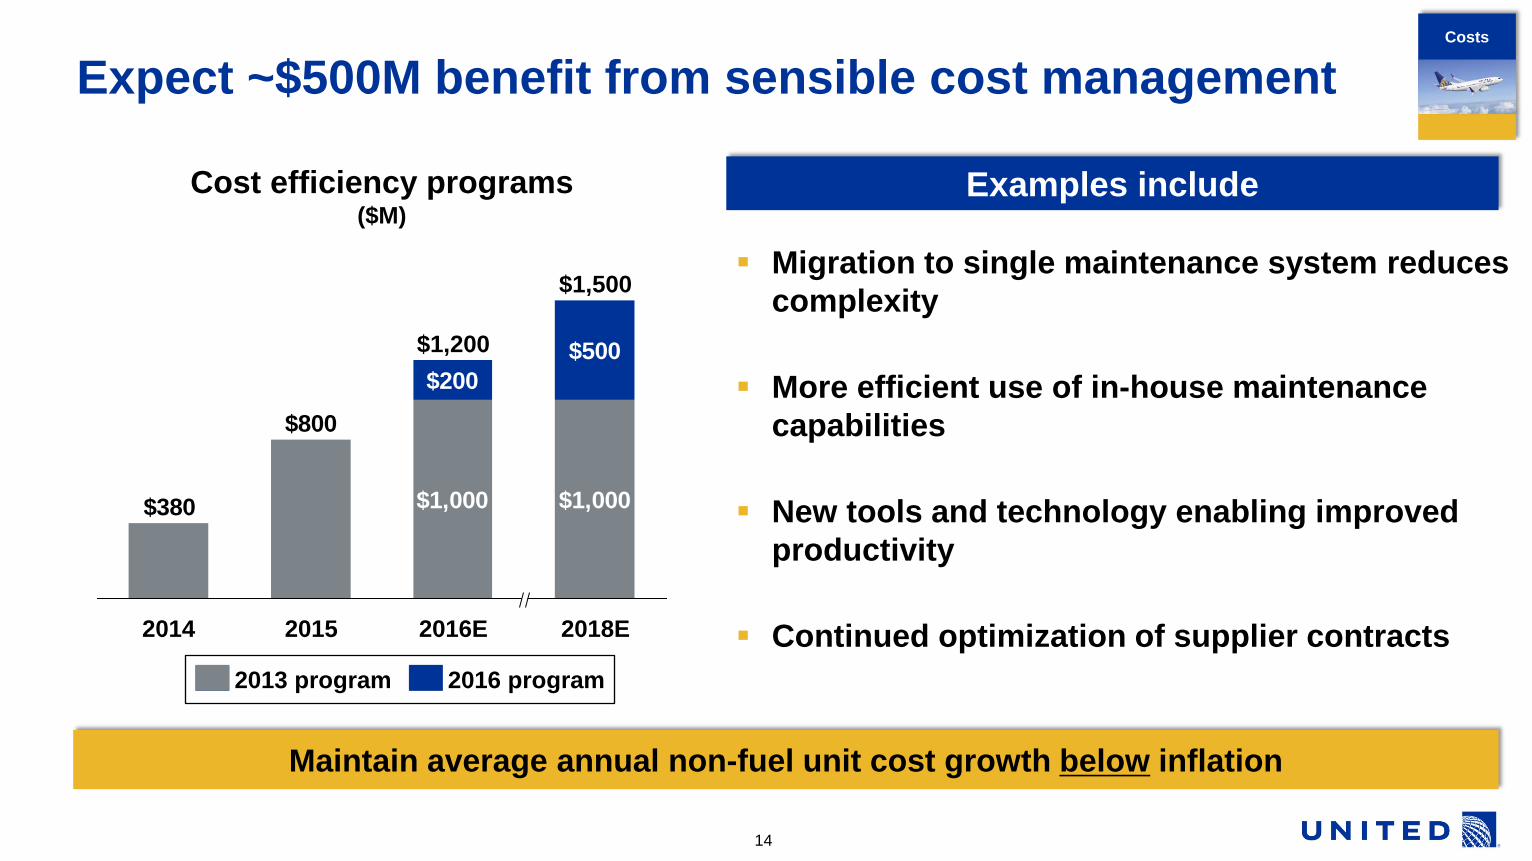
Expect ~$500M benefit from sensible cost management
Migration to single maintenance system reduces complexity
More efficient use of in-house maintenance capabilities
New tools and technology enabling improved productivity
Continued optimization of supplier contracts
14
Costs
$200$500
$800
$380 $1,000$1,000
2018E
$1,500
2016E
$1,200
2015 2014
Cost efficiency programs ($M)
2016 program 2013 program
Maintain average annual non-fuel unit cost growth below inflation
Examples include
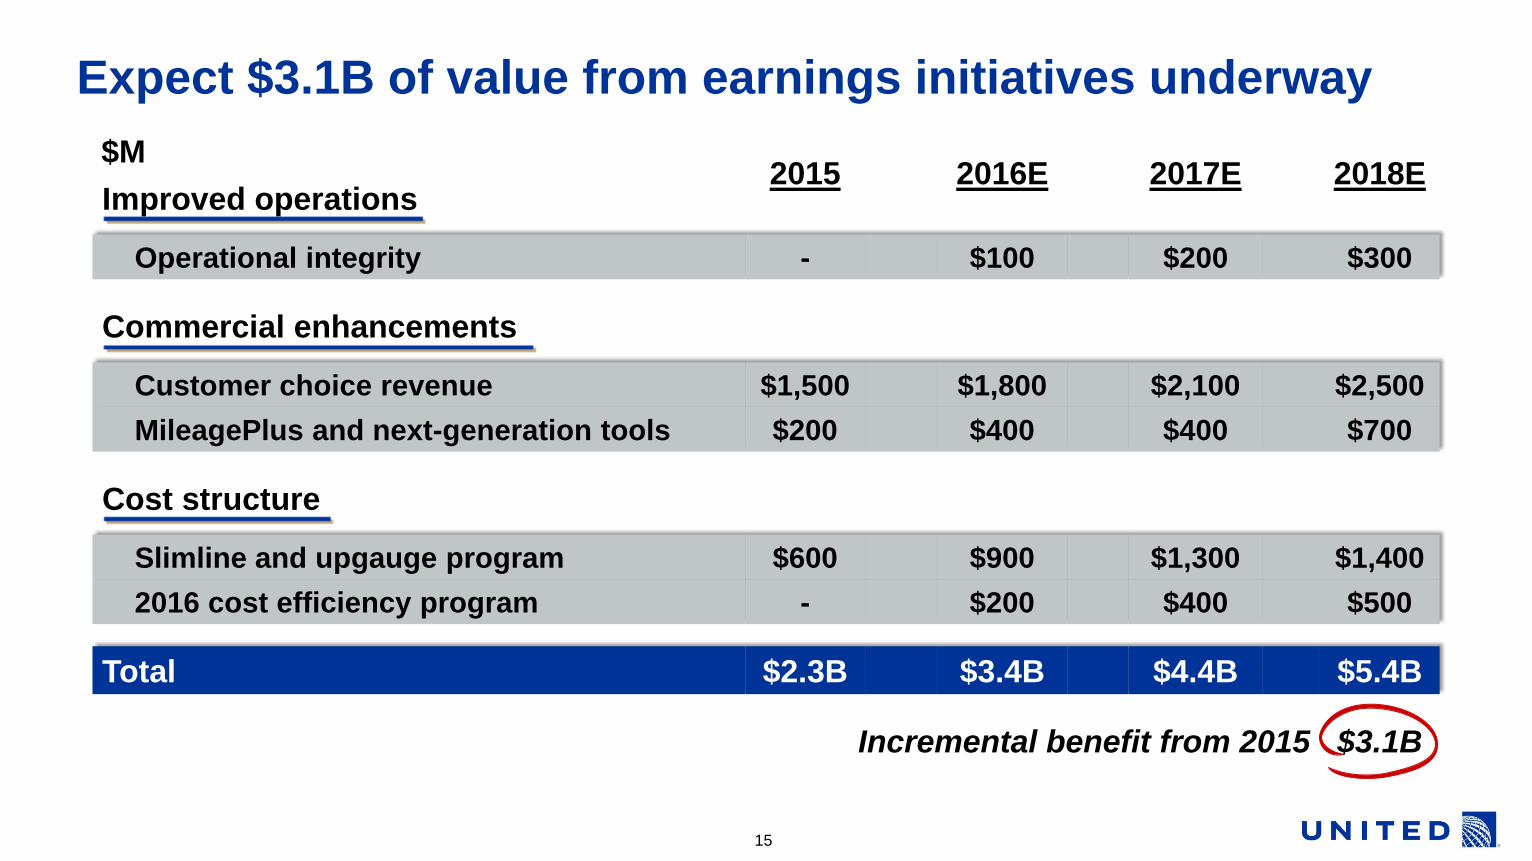
Expect $3.1B of value from earnings initiatives underway
Improved operations
2015
2016E
2017E
2018E
Operational integrity - $100 $200 $300
Commercial enhancements
Customer choice revenue $1,500 $1,800 $2,100 $2,500 MileagePlus and next-generation tools $200 $400 $400 $700
Cost structure
Slimline and upgauge program $600 $900 $1,300 $1,400 2016 cost efficiency program - $200 $400 $500
Total $2.3B $3.4B $4.4B $5.4B
Incremental benefit from 2015 $3.1B
15
$M
Network and commercial objectives
We are focused on improving relative financial performance
3
16

Our network has many strengths…
Hubs located in big, business-centric cities with most originating passengers Coastal hubs well-positioned for international connections San Francisco is the premier Pacific gateway
Newark is the only true international, connecting hub in New York
Houston serves the most destinations to Mexico, Central America and South America
#1 seat share in United hub metro areas except Los Angeles (#2) and
Washington, D.C. (#2)
17
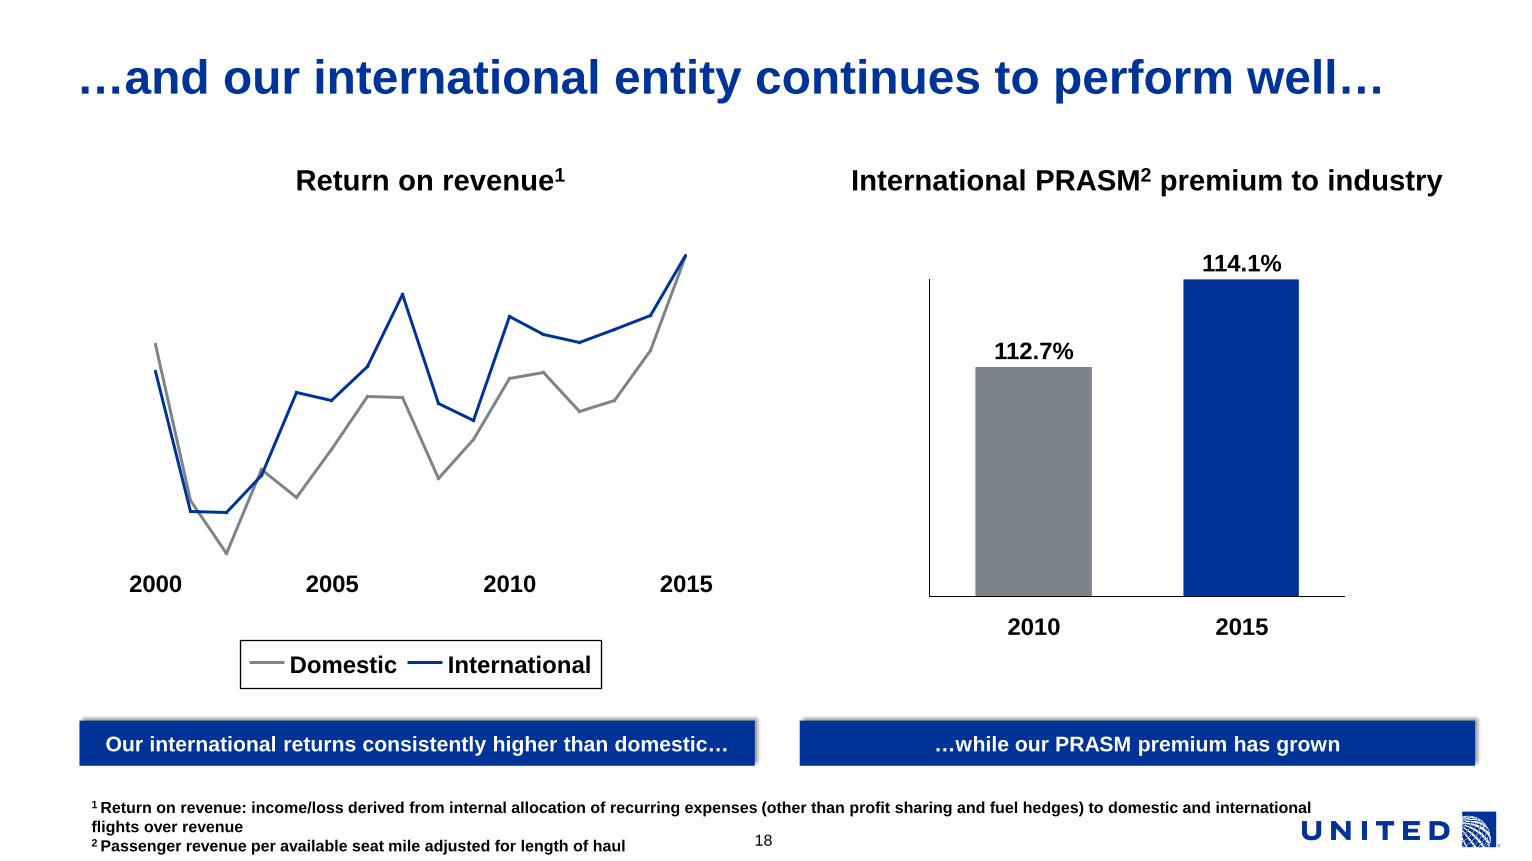
…and our international entity continues to perform well…
18
Return on revenue1
Our international returns consistently higher than domestic…
2000 2005 2010 2015
Domestic International
…while our PRASM premium has grown
2015
114.1%
2010
112.7%
International PRASM2 premium to industry
1 Return on revenue: income/loss derived from internal allocation of recurring expenses (other than profit sharing and fuel hedges) to domestic and international flights over revenue 2 Passenger revenue per available seat mile adjusted for length of haul
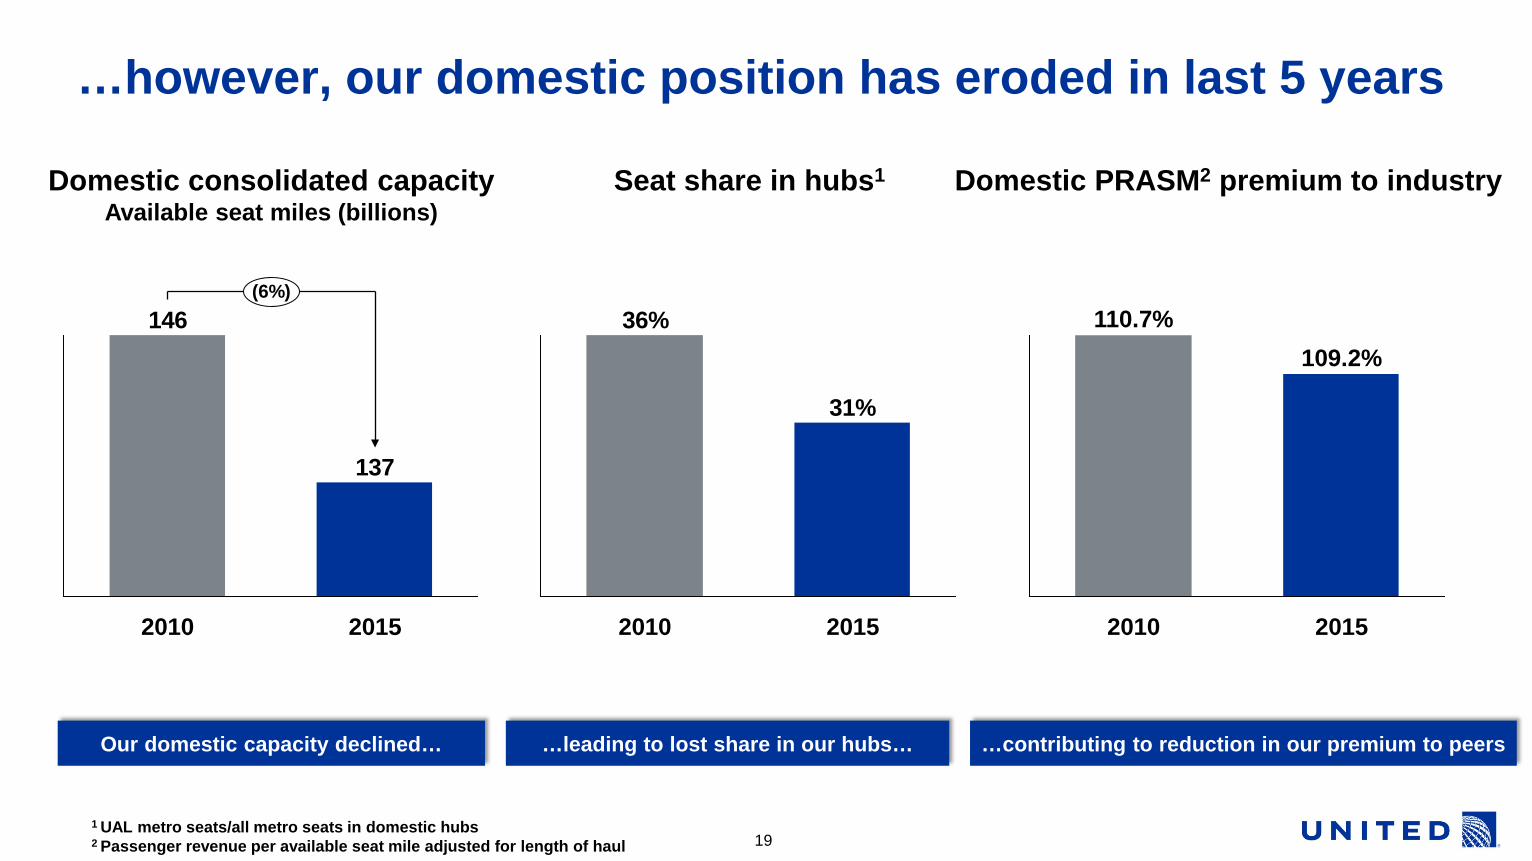
31%
36%
2015 2010
…however, our domestic position has eroded in last 5 years
19
Seat share in hubs1
109.2%
2015 2010
110.7%
Domestic PRASM2 premium to industry
137
146(6%)
2015 2010
Domestic consolidated capacity Available seat miles (billions)
1 UAL metro seats/all metro seats in domestic hubs 2 Passenger revenue per available seat mile adjusted for length of haul
Our domestic capacity declined… …leading to lost share in our hubs… …contributing to reduction in our premium to peers

Continuing to invest in travel experience for customers
Improving reliability and schedule utility
Adding premium seats in key business markets
Reimagining travel with United Polaris Business Class
Transforming the United Club experience
Providing customer-friendly tools like innovative mobile app
Elevating food and beverage offerings
20
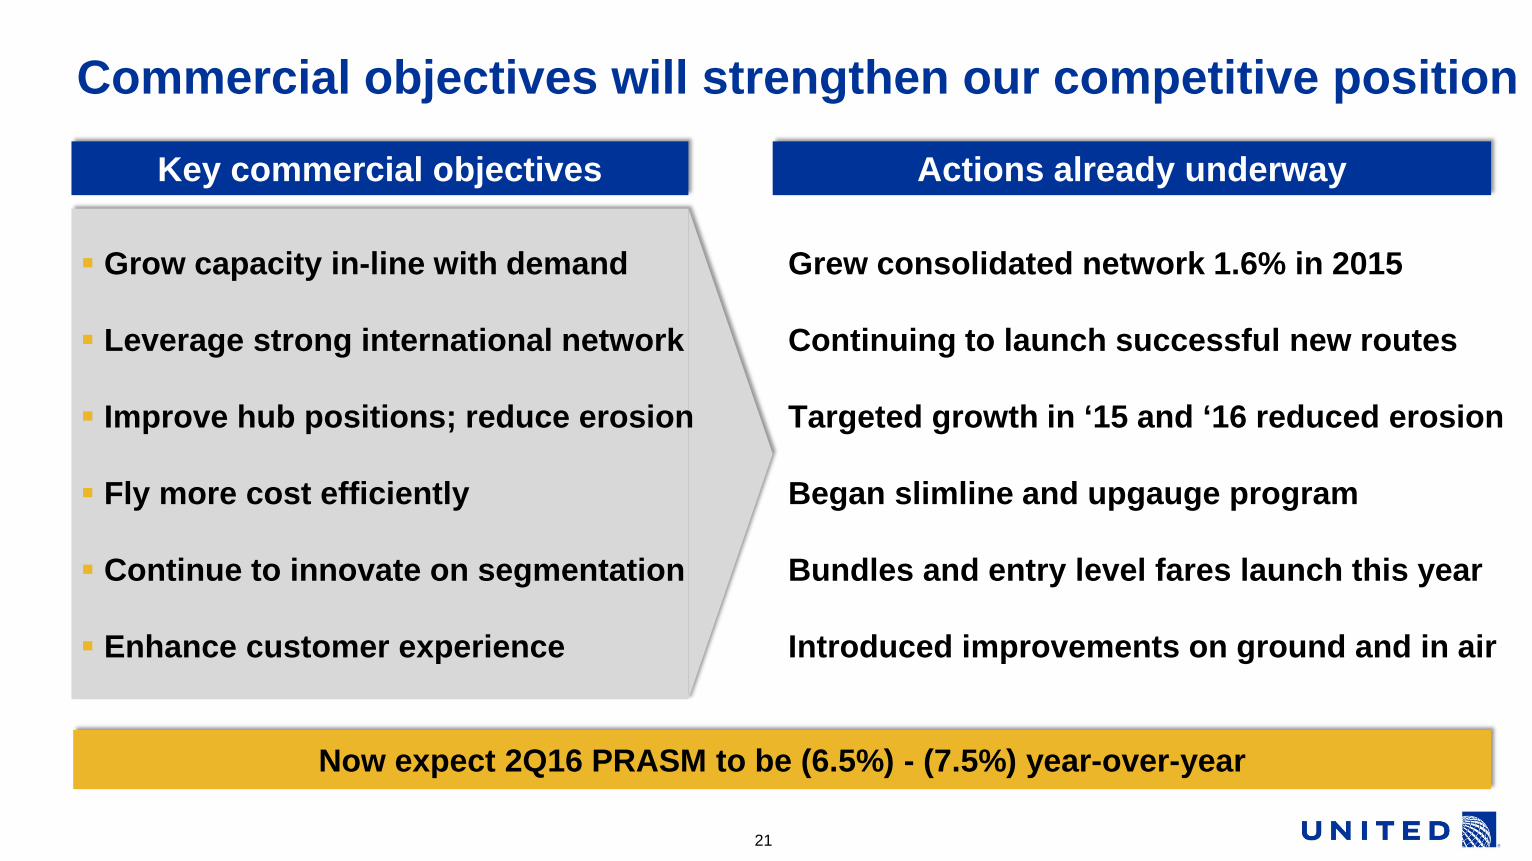
Grew consolidated network 1.6% in 2015
Continuing to launch successful new routes Targeted growth in ‘15 and ‘16 reduced erosion
Began slimline and upgauge program
Bundles and entry level fares launch this year
Introduced improvements on ground and in air
Commercial objectives will strengthen our competitive position
21
Key commercial objectives Actions already underway
Grow capacity in-line with demand Leverage strong international network Improve hub positions; reduce erosion Fly more cost efficiently Continue to innovate on segmentation Enhance customer experience
Now expect 2Q16 PRASM to be (6.5%) - (7.5%) year-over-year
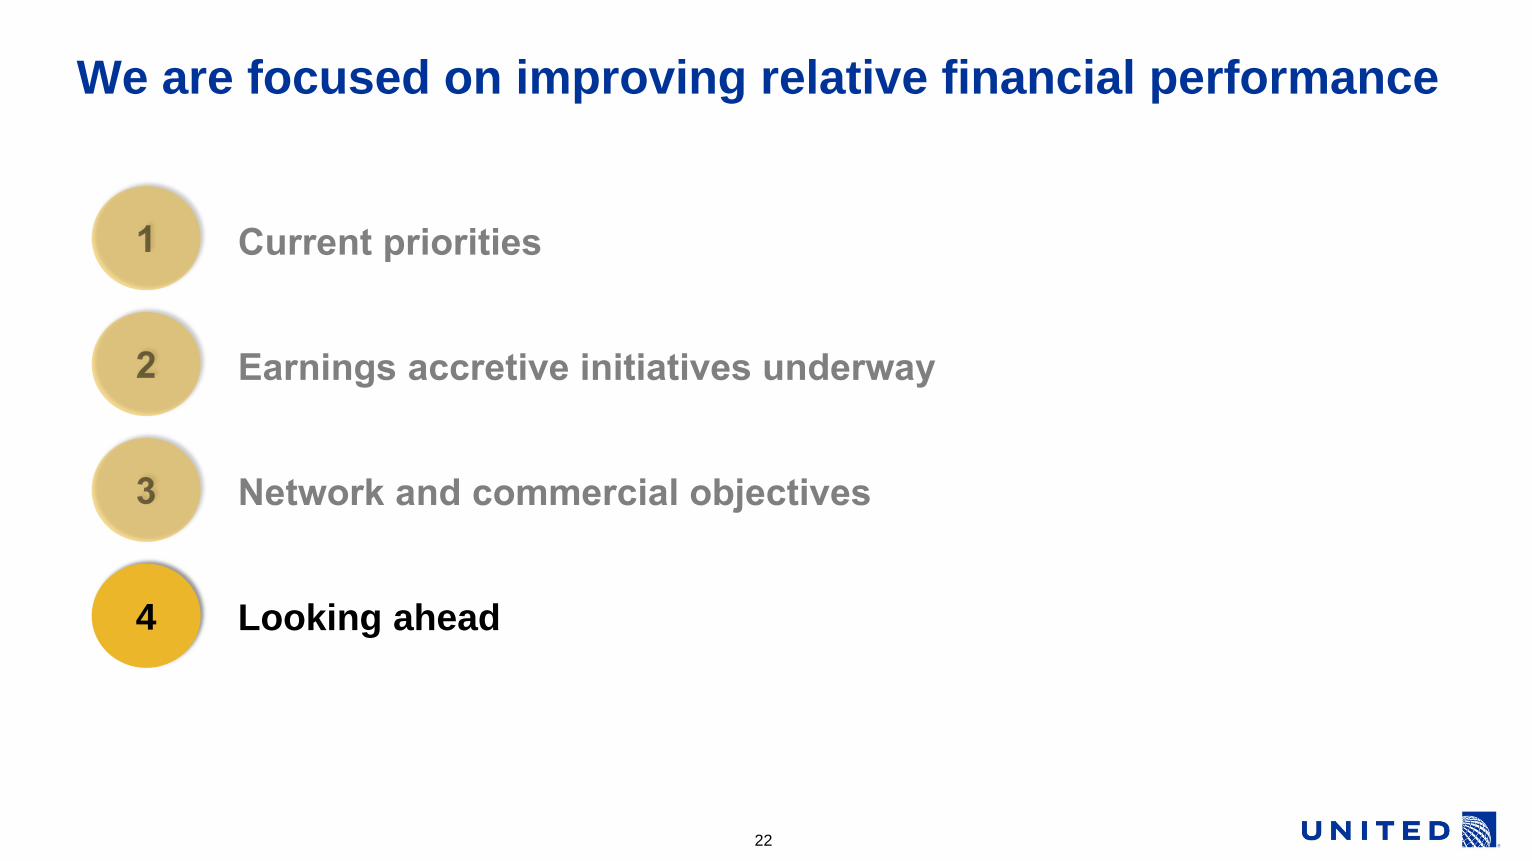
Looking ahead
We are focused on improving relative financial performance
4
22

As we look ahead at United
Maintain strong reliability while improving efficiency
Refine the mission for each geographic region, hub and spoke
Implement the profit maximizing product and segmentation strategy
Further identify and address controllable cost gap to peers
23
Question & Answer Session
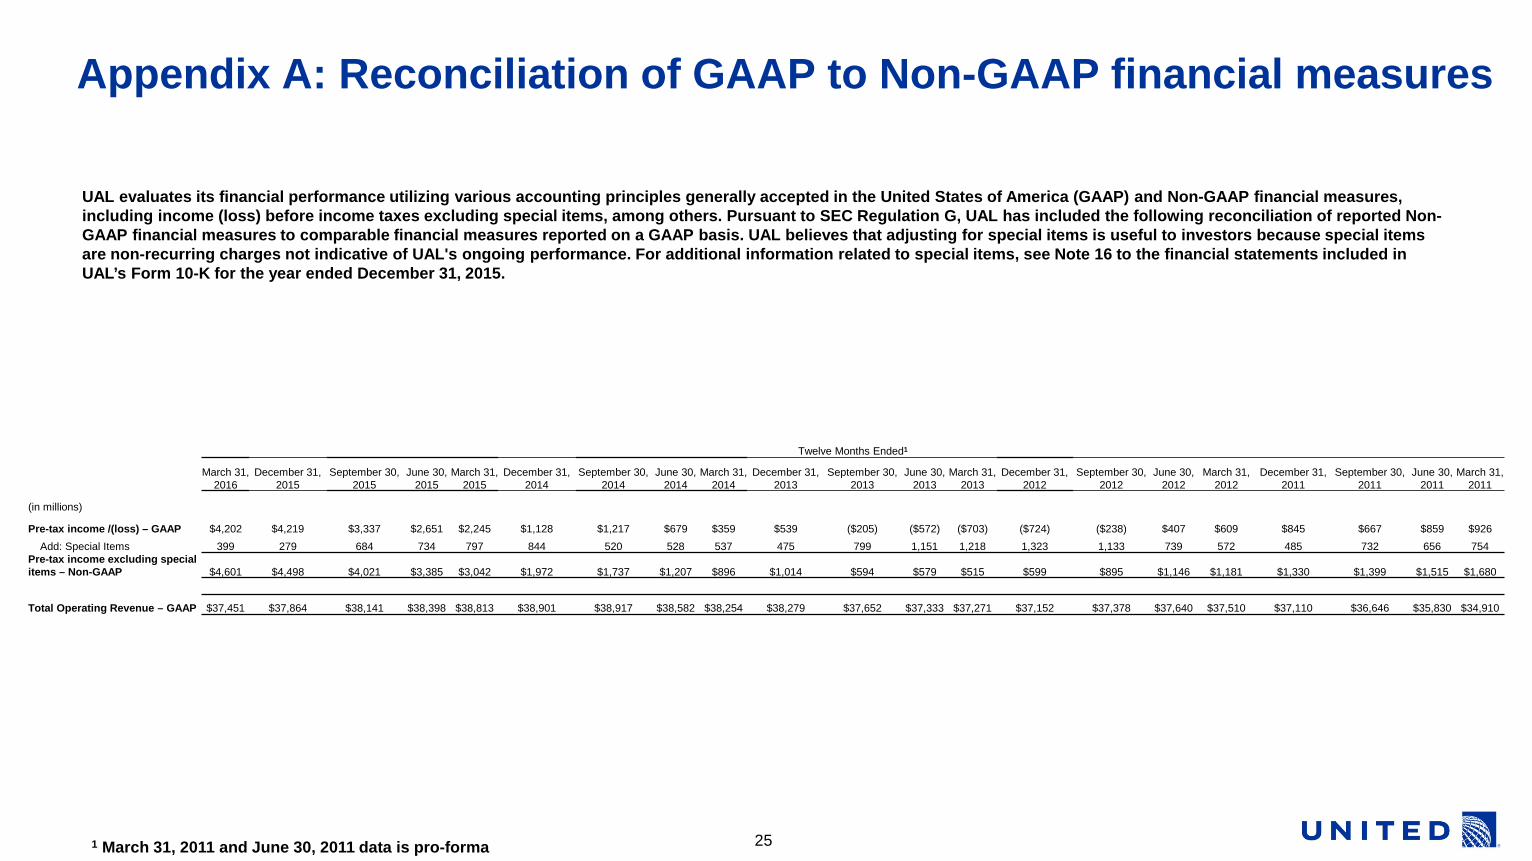
Appendix A: Reconciliation of GAAP to Non-GAAP financial measures
25
Twelve Months Ended1
March 31, 2016
December 31, 2015
September 30, 2015
June 30, 2015
March 31, 2015
December 31, 2014
September 30, 2014
June 30, 2014
March 31, 2014
December 31, 2013
September 30, 2013
June 30, 2013
March 31, 2013
December 31, 2012
September 30, 2012
June 30, 2012
March 31, 2012
December 31, 2011
September 30, 2011
June 30, 2011
March 31, 2011
(in millions)
Pre-tax income /(loss) – GAAP $4,202 $4,219 $3,337 $2,651 $2,245 $1,128 $1,217 $679 $359 $539 ($205) ($572) ($703) ($724) ($238) $407 $609 $845 $667 $859 $926 Add: Special Items 399 279 684 734 797 844 520 528 537 475 799 1,151 1,218 1,323 1,133 739 572 485 732 656 754 Pre-tax income excluding special items – Non-GAAP $4,601 $4,498 $4,021 $3,385 $3,042 $1,972 $1,737 $1,207 $896 $1,014 $594 $579 $515 $599 $895 $1,146 $1,181 $1,330 $1,399 $1,515 $1,680
Total Operating Revenue – GAAP $37,451 $37,864 $38,141 $38,398 $38,813 $38,901 $38,917 $38,582 $38,254 $38,279 $37,652 $37,333 $37,271 $37,152 $37,378 $37,640 $37,510 $37,110 $36,646 $35,830 $34,910
UAL evaluates its financial performance utilizing various accounting principles generally accepted in the United States of America (GAAP) and Non-GAAP financial measures, including income (loss) before income taxes excluding special items, among others. Pursuant to SEC Regulation G, UAL has included the following reconciliation of reported Non-GAAP financial measures to comparable financial measures reported on a GAAP basis. UAL believes that adjusting for special items is useful to investors because special items are non-recurring charges not indicative of UAL's ongoing performance. For additional information related to special items, see Note 16 to the financial statements included in UAL’s Form 10-K for the year ended December 31, 2015.
1 March 31, 2011 and June 30, 2011 data is pro-forma
Related Documents