January 24, 2001 Fourth Quarter 2000 (Unaudited) This supplement to the press release announcing BCE’s Quarterly results is intended to provide, on a timely basis, information of interest to the investment community. Results are reported in Canadian dollars and prepared according to Canadian GAAP. For further information, please contact Sophie Argiriou at (514) 786-3845 or George Walker at (514) 870-2488. The Investor Briefing is also available on BCE’s web site at www.bce.ca under the Investor Relations section. Investor Briefing Certain sections of this document contain forward -looking statements with respect to BCE and its subsidiaries. These forward-looking statements, by their nature, necessarily involve risks and uncertainties that could cause actual results to differ materially from those contemplated by the forward-looking statements. Factors which could cause actual results or events to differ materially from current expectations are discussed on page 24 under “CAUTIONARY STATEMENT CONCERNING FORWARD-LOOKING STATEMENTS”. This material is presented for information only, and should not be construed as a solicitation to invest in any securities of BCE Inc.

Welcome message from author
This document is posted to help you gain knowledge. Please leave a comment to let me know what you think about it! Share it to your friends and learn new things together.
Transcript
January 24, 2001 Fourth Quarter 2000 (Unaudited)
This supplement to the press release announcing BCE’s Quarterly results is intended to provide, on a timely basis, information of interest to the investment community.
Results are reported in Canadian dollars and prepared according to Canadian GAAP.
For further information, please contact Sophie Argiriou at (514) 786-3845 or George Walker at (514) 870-2488.
The Investor Briefing is also available on BCE’s web site at www.bce.ca under the Investor Relations section.
Investor Briefing
Certain sections of this document contain forward-looking statements with respect to BCE and its subsidiaries. These forward-looking statements, by their nature, necessarily involve risks and uncertainties that could cause actual results to differ materially from those contemplated by the forward-looking statements. Factors which could cause actual results or events to differ materially from current expectations are discussed on page 24 under “CAUTIONARY STATEMENT CONCERNING FORWARD-LOOKING STATEMENTS”.
This material is presented for information only, and should not be construed as a solicitation to invest in any securities of BCE Inc.
BCE Inc. Investor Briefing – Fourth Quarter 2000
January 24, 2001
n BCE Announces 8% Revenue Growth In The Fourth Quarter and 9% for the year
Cash baseline earnings up 10% - Data revenues up 29% Sympatico High Speed Edition customers up 49% over the third quarter
• BCE today reported its fourth
quarter results which continue to show strong growth driven by Bell Canada and BCE Emergis.
• Consolidated revenues for the
fourth quarter of 2000 were $5.2B. This reflects a 7.7% increase over the same period last year,
excluding CTV, Teleglobe and Excel for comparison purposes.
• Consolidated EBITDA was $1.7B. This reflects 9.0% growth, excluding CTV, Teleglobe and Excel.
• Consolidated cash baseline
earnings were $299M.
Excluding CTV, Teleglobe and Excel this represents 9.7% growth.
• Consolidated cash baseline
earnings per share were $0.40 for the quarter and $1.81 for the year 2000.
Summary of Fourth Quarter Results
(Millions of dollars, except where otherwise indicated) 2000 1999 % change
Consolidated results
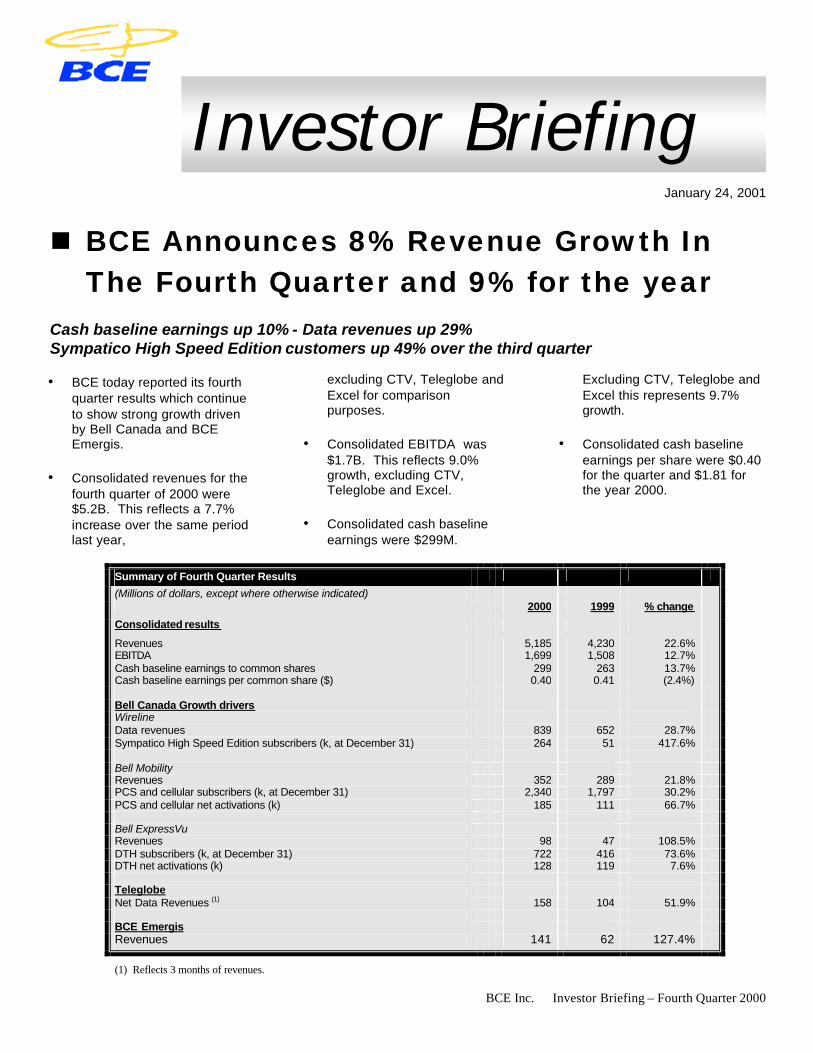
Revenues 5,185 4,230 22.6% EBITDA 1,699 1,508 12.7% Cash baseline earnings to common shares 299 263 13.7% Cash baseline earnings per common share ($) 0.40 0.41 (2.4%) Bell Canada Growth drivers Wireline Data revenues 839 652 28.7% Sympatico High Speed Edition subscribers (k, at December 31) 264 51 417.6% Bell Mobility Revenues 352 289 21.8% PCS and cellular subscribers (k, at December 31) 2,340 1,797 30.2% PCS and cellular net activations (k) 185 111 66.7% Bell ExpressVu Revenues 98 47 108.5% DTH subscribers (k, at December 31) 722 416 73.6% DTH net activations (k) 128 119 7.6% Teleglobe Net Data Revenues (1) 158 104 51.9% BCE Emergis Revenues 141 62 127.4%
Investor Briefing
(1) Reflects 3 months of revenues.
BCE Inc. Investor Briefing – Fourth Quarter 2000 Page 2
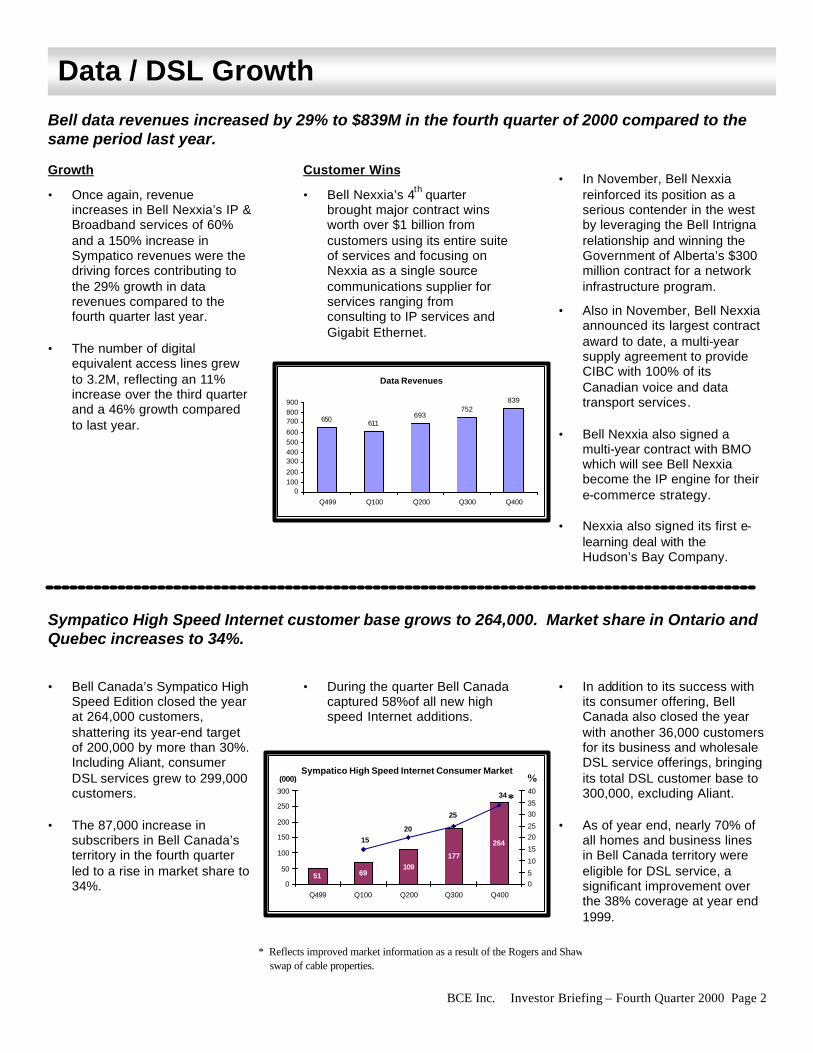
Bell data revenues increased by 29% to $839M in the fourth quarter of 2000 compared to the same period last year. Growth
• Once again, revenue increases in Bell Nexxia’s IP & Broadband services of 60% and a 150% increase in Sympatico revenues were the driving forces contributing to the 29% growth in data revenues compared to the fourth quarter last year.
• The number of digital
equivalent access lines grew to 3.2M, reflecting an 11% increase over the third quarter and a 46% growth compared to last year.
Customer Wins
• Bell Nexxia’s 4th quarter brought major contract wins worth over $1 billion from customers using its entire suite of services and focusing on Nexxia as a single source communications supplier for services ranging from consulting to IP services and Gigabit Ethernet.
• In November, Bell Nexxia reinforced its position as a serious contender in the west by leveraging the Bell Intrigna relationship and winning the Government of Alberta’s $300 million contract for a network infrastructure program.
• Also in November, Bell Nexxia announced its largest contract award to date, a multi-year supply agreement to provide CIBC with 100% of its Canadian voice and data transport services.
• Bell Nexxia also signed a
multi-year contract with BMO which will see Bell Nexxia become the IP engine for their e-commerce strategy.
• Nexxia also signed its first e-
learning deal with the Hudson’s Bay Company.
Sympatico High Speed Internet customer base grows to 264,000. Market share in Ontario and Quebec increases to 34%. • Bell Canada’s Sympatico High
Speed Edition closed the year at 264,000 customers, shattering its year-end target of 200,000 by more than 30%. Including Aliant, consumer DSL services grew to 299,000 customers.
• The 87,000 increase in
subscribers in Bell Canada’s territory in the fourth quarter led to a rise in market share to 34%.
• During the quarter Bell Canada
captured 58%of all new high speed Internet additions.
• In addition to its success with
its consumer offering, Bell Canada also closed the year with another 36,000 customers for its business and wholesale DSL service offerings, bringing its total DSL customer base to 300,000, excluding Aliant.
• As of year end, nearly 70% of
all homes and business lines in Bell Canada territory were eligible for DSL service, a significant improvement over the 38% coverage at year end 1999.
Data / DSL Growth
* Reflects improved market information as a result of the Rogers and Shaw swap of cable properties.
*
(000)
Data Revenues
650 611693
752839
0100200
300400500600
700800900
Q499 Q100 Q200 Q300 Q400
Sympatico High Speed Internet Consumer Market
177
264
51 69109
1520
25
34
0
50
100
150
200
250
300
Q499 Q100 Q200 Q300 Q40005
10
15
2025
3035
40
%
BCE Inc. Investor Briefing – Fourth Quarter 2000 Page 3
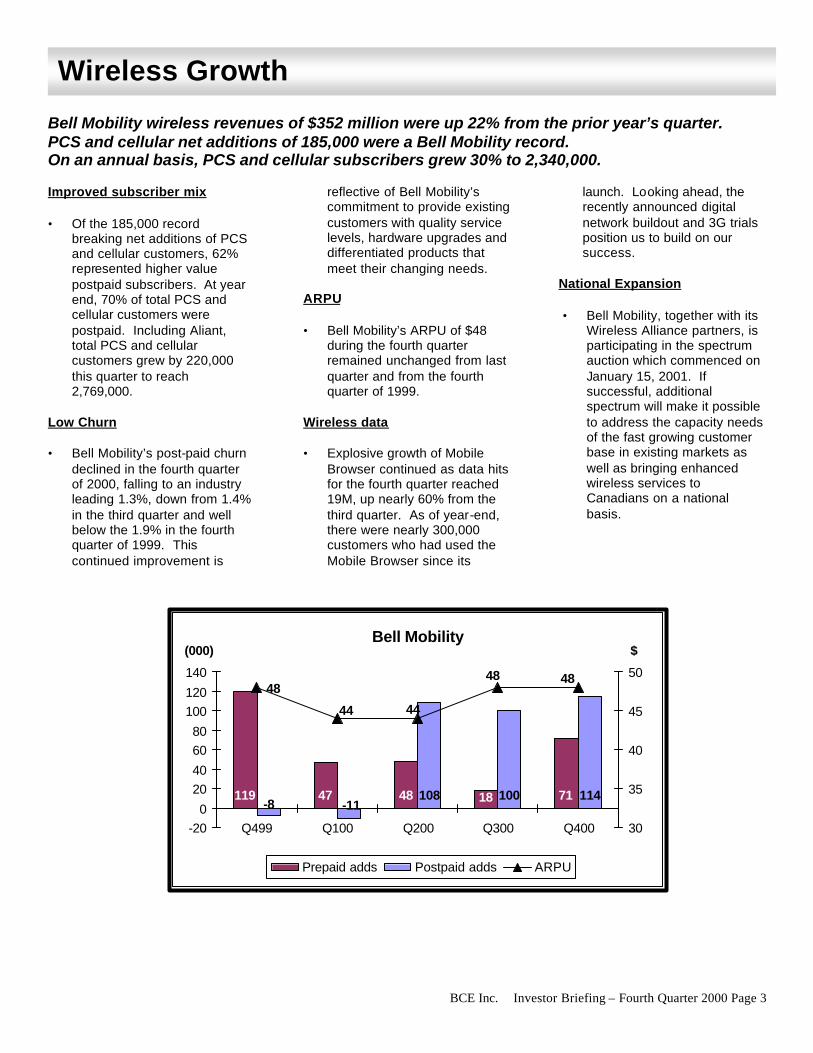
Bell Mobility wireless revenues of $352 million were up 22% from the prior year’s quarter. PCS and cellular net additions of 185,000 were a Bell Mobility record. On an annual basis, PCS and cellular subscribers grew 30% to 2,340,000. Improved subscriber mix • Of the 185,000 record
breaking net additions of PCS and cellular customers, 62% represented higher value postpaid subscribers. At year end, 70% of total PCS and cellular customers were postpaid. Including Aliant, total PCS and cellular customers grew by 220,000 this quarter to reach 2,769,000.
Low Churn • Bell Mobility’s post-paid churn
declined in the fourth quarter of 2000, falling to an industry leading 1.3%, down from 1.4% in the third quarter and well below the 1.9% in the fourth quarter of 1999. This continued improvement is
reflective of Bell Mobility’s commitment to provide existing customers with quality service levels, hardware upgrades and differentiated products that meet their changing needs.
ARPU • Bell Mobility’s ARPU of $48
during the fourth quarter remained unchanged from last quarter and from the fourth quarter of 1999.
Wireless data • Explosive growth of Mobile
Browser continued as data hits for the fourth quarter reached 19M, up nearly 60% from the third quarter. As of year-end, there were nearly 300,000 customers who had used the Mobile Browser since its
launch. Looking ahead, the recently announced digital network buildout and 3G trials position us to build on our success.
National Expansion • Bell Mobility, together with its
Wireless Alliance partners, is participating in the spectrum auction which commenced on January 15, 2001. If successful, additional spectrum will make it possible to address the capacity needs of the fast growing customer base in existing markets as well as bringing enhanced wireless services to Canadians on a national basis.
Wireless Growth
Bell Mobility
119 47 48 71108 100 11418-11-8
48
44
4848
44
-200
2040
6080
100120
140
Q499 Q100 Q200 Q300 Q400 30
35
40
45
50
Prepaid adds Postpaid adds ARPU
$(000)
BCE Inc. Investor Briefing – Fourth Quarter 2000 Page 4
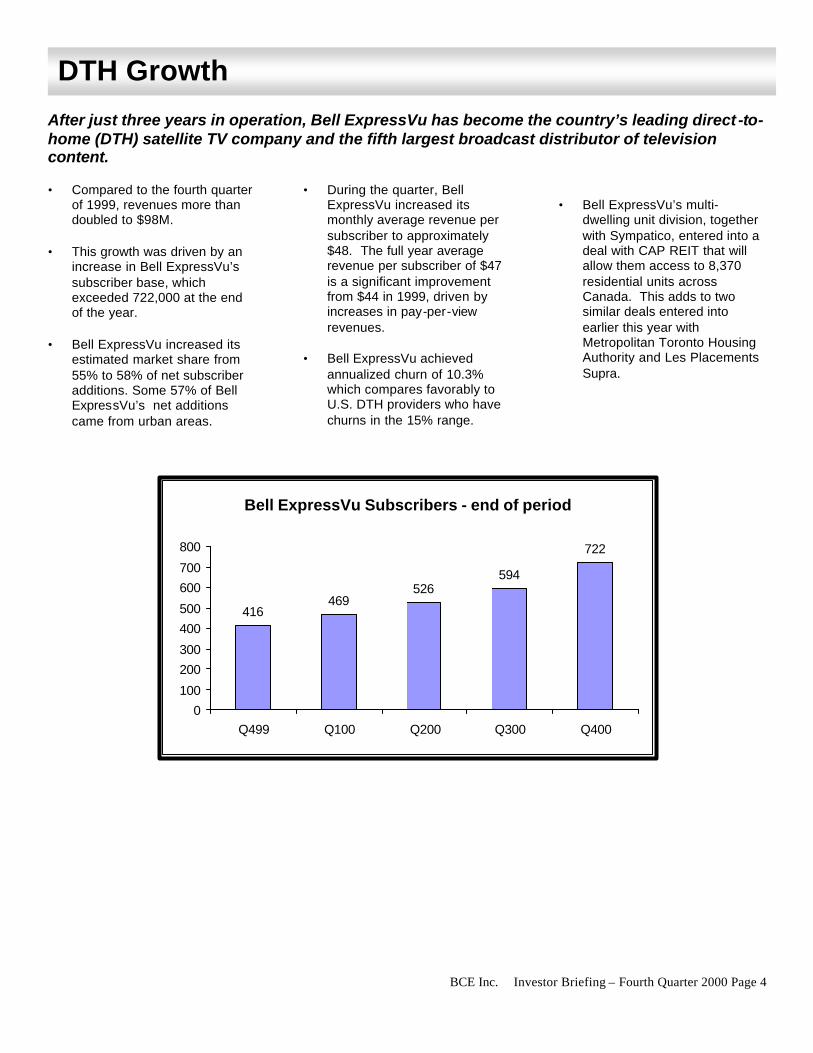
After just three years in operation, Bell ExpressVu has become the country’s leading direct -to-home (DTH) satellite TV company and the fifth largest broadcast distributor of television content. • Compared to the fourth quarter
of 1999, revenues more than doubled to $98M.
• This growth was driven by an
increase in Bell ExpressVu’s subscriber base, which exceeded 722,000 at the end of the year.
• Bell ExpressVu increased its
estimated market share from 55% to 58% of net subscriber additions. Some 57% of Bell ExpressVu’s net additions came from urban areas.
• During the quarter, Bell ExpressVu increased its monthly average revenue per subscriber to approximately $48. The full year average revenue per subscriber of $47 is a significant improvement from $44 in 1999, driven by increases in pay-per-view revenues.
• Bell ExpressVu achieved
annualized churn of 10.3% which compares favorably to U.S. DTH providers who have churns in the 15% range.
• Bell ExpressVu’s multi-
dwelling unit division, together with Sympatico, entered into a deal with CAP REIT that will allow them access to 8,370 residential units across Canada. This adds to two similar deals entered into earlier this year with Metropolitan Toronto Housing Authority and Les Placements Supra.
DTH Growth
Bell ExpressVu Subscribers - end of period
416469
526594
722
0
100
200
300
400
500
600
700
800
Q499 Q100 Q200 Q300 Q400
BCE Inc. Investor Briefing – Fourth Quarter 2000 Page 5
CRTC approves BCE acquisition of CTV. Bell Globemedia, Canada’s premier company in the fields of broadcasting, print, and new media created. • In December, BCE received
CRTC approval of its purchase of CTV, thus paving the way for BCE to proceed with the launch of Bell Globemedia, Canada’s premier company in the fields of broadcasting, print and new media.
• The launch took place on
January 9, 2001 following the closing of the deal by its owners BCE Inc, (70.1%), the Thomson Corporation (20%) and the Woodbridge Company Limited (9.9%).
CTV • CTV revenues for the three
months ended December 31, 2000 were $256 million, an
increase of 67% compared to the same period last year. This increase reflects the purchase of NetStar Communications Inc. effective April 2000 and the fact that CTV’s conventional broadcasting business benefited from a strong programming line-up and improved ratings in news and entertainment.
• The acquisition of NetStar has
provided CTV with a more stable and diversified revenue stream with advertising now representing around 70% of consolidated revenues compared to 90% last year.
• EBITDA margins have also improved from 19% in 1999 to 21% this year due to higher margins on the specialty channel operations.
Sympatico-Lycos • In December, the Sympatico
websites had 6.8M unique visitors.
• Pageviews for the quarter for
all Sympatico-Lycos sites were 421M.
Teleglobe acquisition completed November 1, 2000. Contributes $326M of revenue and $20M of EBITDA to BCE’s results, for November and December. • In the fourth quarter, Teleglobe
continued to show progress in its turnaround. For the full quarter, data revenues of $158M and EBITDA of $40M both reflect steady improvement over previous quarterly results.
• Progress was also made in
reducing the data backlog after the acquisition of additional capacity late in the third quarter. The data backlog currently stands at $90M on an annualized basis.
• During the quarter,
Globesystem’s European ring
encompassing London, Paris, Amsterdam and Frankfurt went into service.
• In November, Teleglobe
announced its plans to build Internet Data Centers (IDCs) in 8 strategic locations. Leases for the Washington and Miami IDC’s were finalized in the fourth quarter and the Washington build is underway.
• In November, Teleglobe
announced the signing of a US$400 million contract with Nortel networks for the supply of high-performance optical
Internet systems throughout Teleglobe’s global IP network.
• In November, Teleglobe
announced a technology alliance with Inktomi for the high-performance delivery of rich media and web content worldwide. Since then, Teleglobe has announced contracts for its caching and streaming media services.
Teleglobe
Bell Globemedia
BCE Inc. Investor Briefing – Fourth Quarter 2000 Page 6
Once again, BCE Emergis achieved significant quarter over quarter and sequential revenue growth. Revenues for the fourth quarter were up 131% over the same period last year. • Revenues for the fourth
quarter of 2000 were $141 million, $80 million higher compared to the prior year’s quarter mainly driven by growth in the eHealth and Canadian business units. The acquisition of UP&UP earlier this year accounted for most of the eHealth segment’s growth.
• BCE Emergis now focuses its
activities in three business units (Canadian, US, and eHealth), offering a full suite of products to companies in transaction-intensive, eHealth and financial services sectors.
Recent highlights include: Strategic agreement with JP Morgan Chase • In January 2001, Emergis and
J.P. Morgan Chase entered into a strategic agreement to
implement an electronic invoice presentment and payment solution. J.P. Morgan Chase will offer Emergis e-Invoicing as a solution for corporate, middle market, financial institution and net marketplace wholesale banking clients to use with their trading partners. This transaction represents a milestone for BCE Emergis in expanding its business base in the U.S.
e-route launches service • During the fourth quarter, e-
route inc., the consortium of Canada’s main financial institutions launched its e-bill presentment service. BCE Emergis which has a 10-year exclusive contract with e-route, operates the electronic billing and document presentment platform which will link
financial institutions, billing organizations and consumers.
Descartes Strategic Alliance • In December, BCE Emergis
signed a multi-faceted strategic alliance with Descartes Systems Group, a leading provider of global Internet logistics solutions. Through this alliance, BCE Emergis will sell its transportation logistics messaging business to DesCartes and utilize their logistic services to expand its own e-commerce service offerings. This alliance will not only add depth and reach to Emergis’ e-commerce services offering but will allow Emergis to focus on its core market activities in eHealth and financial services.
BCE Emergis
BCE Inc. | Investor Briefing – Fourth quarter Page 7
BCE REPORTING
Effective December 1, 2000, BCE implemented a new operating structure following strategic acquisitions made during theyear. As a result, BCE centres its activities around four operating businesses: Bell Canada (Canadian connectivity);Teleglobe (global connectivity); Bell Globemedia (content) and BCE Emergis (commerce). All other investments arecombined in BCE Ventures whose main investments include Bell Canada International Inc. (BCI), CGI Group Inc. (CGI),Telesat Canada, BCE Capital Inc. (BCE Capital), Bimcor Inc. (Bimcor), Excel Communications Inc. (Excel) and LookCommunications Inc. (Look). Results for the BCE segments are reflected as follows:
Bell Canada
• This segment reflects the consolidation of Bell Canada Holdings Inc. (BCH) with Bell Canada and its consolidatedsubsidiaries (including Bell Mobility, BCE Nexxia Inc. and Bell ActiMedia Inc.). BCH owns 100% of Bell Canada. BCEowns 80% of BCH, the remaining 20% is owned by SBC Communications Inc.
• Effective January 2000, BCE increased its ownership interest in Aliant Inc. (Aliant) from 41% to 53% (approximately39% held by Bell Canada and approximately 14% held by BCE Inc.); therefore, in 2000 Aliant is consolidated andincluded in the Bell Canada segment. For improved comparability, Aliant results for 1999 are reflected on aconsolidated basis.
• Prior to November 1, 2000, Bell Canada’s 23% interest in Teleglobe was accounted for using the equity method andincluded in this segment. Bell Canada now accounts for Teleglobe on a cost basis and prior periods have beenrestated to reflect this treatment. Therefore, BCE’s indirect interest in Teleglobe for current and prior periods is nowreflected in the Teleglobe segment.
• Bell ExpressVu Limited Partnership (Bell ExpressVu) (100%), previously part of the BCE Media segment, is nowincluded in the Bell Canada segment. Prior periods have been restated to reflect the current presentation.
• Sympatico-Lycos Inc. (Sympatico-Lycos) previously included in the Bell Canada segment is now reflected in the BellGlobemedia segment. Prior periods have been restated to reflect the current presentation.
• Manitoba Telecom Services Inc. is accounted for using the equity method.
Teleglobe
• Represents Teleglobe Communications Corporation (Teleglobe). BCE effectively holds 95.4% of Teleglobe, theremaining 4.6% is held by SBC Communications Inc.
• Effective November 1, 2000, BCE Inc. acquired the remaining shares of Teleglobe Inc. that it did not already ownbringing BCE’s effective ownership to 95.4% (approximately 23% held by Bell Canada of which BCE indirectly owns80% and approximately 77% held by BCE Inc.) and began consolidating Teleglobe’s results. Teleglobe’s results arereported as follows:
January 1, 1999 to December 31, 1999 – Teleglobe is accounted for using the equity method.January 1, 2000 to October 31, 2000 – Teleglobe is accounted for using the equity method.November 1, 2000 to December 31, 2000 – Teleglobe is accounted on a consolidated basis.
• The acquisition of Teleglobe Inc. included mainly Teleglobe Communications Corporation, Excel and Look. TheTeleglobe segment reflects Teleglobe Communications Corporation. Excel and Look are reported in BCE Ventures.
• Cash baseline earnings for Teleglobe Inc., which includes Teleglobe, Excel and Corporate, are presented in theTeleglobe segment.
BCE Inc. | Investor Briefing – Fourth quarter Page 8
BCE Emergis
• Represents BCE Emergis Inc. (BCE Emergis). Previously, BCE Emergis was reported in the BCE Emergis and CGIsegment. CGI is now reported in BCE Ventures. Prior periods have been restated to reflect the current presentation.
Bell Globemedia
• Represents CTV Inc. (CTV), new media and other media interests. (Prior to December 31, 2000, new media includedSympatico-Lycos. Starting in January 2001 new media will also include Globe Interactive). Starting 2001, thissegment will also include The Globe and Mail and Globe Interactive.
• Effective January 2001, the above companies will operate under a new media company, Bell Globemedia, of whichBCE will hold an ownership interest of 70.1%.
• In April 2000, BCE Inc. acquired 100% of CTV and accounted for CTV’s results using the equity method untilNovember 30, 2000. Effective December 1, 2000, following CRTC approval of the CTV acquisition, results of CTVare reflected on a consolidated basis. Hence, revenues and EBITDA are included in BCE’s results only for the monthof December. Earnings are reflected since April 2000 and therefore include nine months of 100% of CTV’s earnings.
• Sympatico-Lycos, previously included in the Bell Canada segment, is now reflected in the Bell Globemedia segment.Prior periods have been restated to reflect the current presentation.
BCE Ventures
• This segment includes BCE’s interests in Bell Canada International Inc. (73.6%), Telesat Canada (100%), TMICommunications and Company Limited Partnership (100%), CGI Group Inc. (43.4%), Excel Communications Inc.(95.4%), Look Communications Inc. (25.3%), Bimcor Inc. (100%), BCE Capital Inc. (100%) and TeleReal Inc. (100%).
• BCI was previously reported as a single segment. Bimcor, BCE Capital and TeleReal Inc. were previously reported inCorporate and other. Excel and Look were acquired through the Teleglobe acquisition. Prior periods have beenrestated to reflect the current presentation.

9
Results by Operating Group (1)
Three months ended December 31 Year ended December 31(Millions of dollars, except otherwise indicated) 2000 1999 % change 2000 1999 % change
Revenues
Bell CanadaBell Canada Holdings (2) 4,071 3,799 7.2% 15,486 14,371 7.8%
Bell ExpressVu 98 47 108.5% 305 133 129.3%
Total Bell Canada 4,169 3,846 8.4% 15,791 14,504 8.9%Bell Globemedia (4) 85 2 N.M. 98 3 N.M.Teleglobe (3) 326 - N.M. 326 - N.M.
BCE Emergis 141 62 127.4% 468 188 148.9%BCE Ventures (6) 673 508 32.5% 2,064 1,810 14.0%
Corporate and other (including intercompany eliminations) (209) (188) (11.2%) (653) (503) (29.8%)
Revenues 5,185 4,230 22.6% 18,094 16,002 13.1%
EBITDA
Bell CanadaBell Canada Holdings (2) 1,702 1,585 7.4% 6,658 6,117 8.8%
Bell ExpressVu (61) (51) (19.6%) (138) (126) (9.5%)
Total Bell Canada 1,641 1,534 7.0% 6,520 5,991 8.8%Bell Globemedia (4) 5 (1) N.M. (8) (1) N.M.Teleglobe (3) 20 - N.M. 20 - N.M.
BCE Emergis 24 3 N.M. 75 4 N.M.BCE Ventures (6) 29 19 52.6% 140 265 (47.2%)
Corporate and other (20) (47) 57.4% (69) (126) 45.2%
EBITDA 1,699 1,508 12.7% 6,678 6,133 8.9%
Cash baseline earnings
Bell Canada
Bell Canada Holdings 299 295 1.4% 1,245 1,215 2.5%
Bell ExpressVu (54) (39) (38.5%) (146) (98) (49.0%)
Total Bell Canada 245 256 (4.3%) 1,099 1,117 (1.6%)
Bell Globemedia 17 - N.M. 22 - N.M.
Teleglobe * (23) (6) N.M. (60) - N.M.
BCE Emergis 10 (2) N.M. 16 (2) N.M.BCE Ventures 19 20 (5.0%) 52 71 (26.8%)
Corporate and other (including intercompany eliminations) 49 18 N.M. 159 - N.M.
Cash baseline earnings 317 286 10.8% 1,288 1,186 8.6%
Dividends on preferred shares (18) (23) 21.7% (79) (93) 15.1%
Cash baseline earnings applicable to common shares 299 263 13.7% 1,209 1,093 10.6%
Cash baseline earnings per common share - $/sh 0.40$ 0.41$ (2.4%) 1.81$ 1.70$ 6.5%
Average number of common shares outstanding (millions) 746.1 643.6 670.0 642.8
N.M. : not meaningful
* Represents cash baseline earnings for Teleglobe Inc. (includes Teleglobe, Excel and Corporate)
See accompanying notes on pages 22-23. BCE Inc. | Investor Briefing - Fourth quarter 2000 Page 9
9 3.1 11 40.28 8 8 8
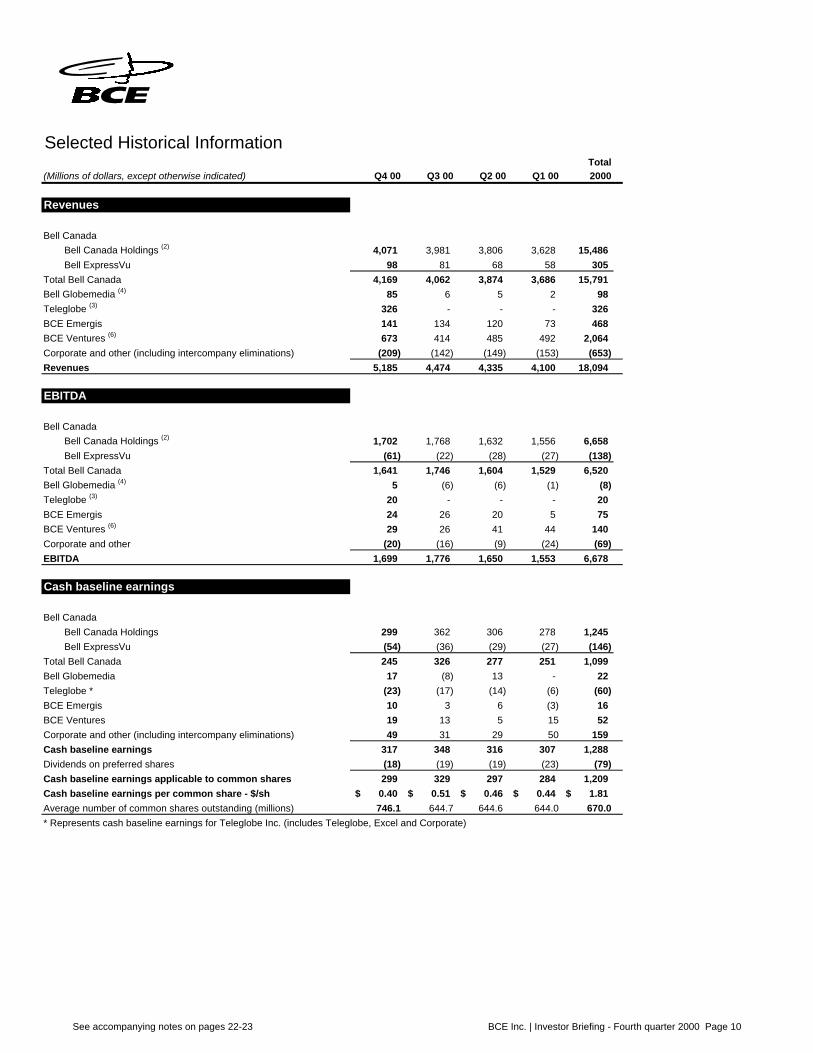
Selected Historical InformationTotal
(Millions of dollars, except otherwise indicated) Q4 00 Q3 00 Q2 00 Q1 00 2000
Revenues
Bell CanadaBell Canada Holdings (2) 4,071 3,981 3,806 3,628 15,486 Bell ExpressVu 98 81 68 58 305
Total Bell Canada 4,169 4,062 3,874 3,686 15,791 Bell Globemedia (4) 85 6 5 2 98 Teleglobe (3) 326 - - - 326 BCE Emergis 141 134 120 73 468 BCE Ventures (6) 673 414 485 492 2,064 Corporate and other (including intercompany eliminations) (209) (142) (149) (153) (653) Revenues 5,185 4,474 4,335 4,100 18,094
EBITDA
Bell CanadaBell Canada Holdings (2) 1,702 1,768 1,632 1,556 6,658 Bell ExpressVu (61) (22) (28) (27) (138)
Total Bell Canada 1,641 1,746 1,604 1,529 6,520 Bell Globemedia (4) 5 (6) (6) (1) (8) Teleglobe (3) 20 - - - 20 BCE Emergis 24 26 20 5 75 BCE Ventures (6) 29 26 41 44 140 Corporate and other (20) (16) (9) (24) (69) EBITDA 1,699 1,776 1,650 1,553 6,678
Cash baseline earnings
Bell CanadaBell Canada Holdings 299 362 306 278 1,245 Bell ExpressVu (54) (36) (29) (27) (146)
Total Bell Canada 245 326 277 251 1,099 Bell Globemedia 17 (8) 13 - 22 Teleglobe * (23) (17) (14) (6) (60) BCE Emergis 10 3 6 (3) 16 BCE Ventures 19 13 5 15 52 Corporate and other (including intercompany eliminations) 49 31 29 50 159 Cash baseline earnings 317 348 316 307 1,288 Dividends on preferred shares (18) (19) (19) (23) (79) Cash baseline earnings applicable to common shares 299 329 297 284 1,209 Cash baseline earnings per common share - $/sh 0.40$ 0.51$ 0.46$ 0.44$ 1.81$ Average number of common shares outstanding (millions) 746.1 644.7 644.6 644.0 670.0* Represents cash baseline earnings for Teleglobe Inc. (includes Teleglobe, Excel and Corporate)
See accompanying notes on pages 22-23 BCE Inc. | Investor Briefing - Fourth quarter 2000 Page 10

Selected Financial Information
(Millions of dollars, except otherwise indicated)
Proportionate EBITDA (5)
Number of common * BCE*
shares owned by BCE Ownership % Q1 00 Q2 00 Q3 00 Q4 00 YTD 00(M) ($M) ($M) ($M) ($M) ($M)
Bell Canada
Bell Canada Holdings 80% 1,090 1,122 1,234 1,191 4,637 Aliant (7) 71.3 45% 87 104 102 95 388
Bell ExpressVu 100% (27) (28) (22) (61) (138)
Total Bell Canada 1,150 1,198 1,314 1,225 4,887
Bell Globemedia
CTV 100% 12 62 16 76 166
Sympatico-Lycos 57% - (3) (3) (5) (11)
Other 100% (1) (1) (1) (1) (4)
Total Bell Globemedia 11 58 12 70 151
Teleglobe 95% 21 3 30 38 92
BCE Emergis 62.0 66% 3 13 17 16 49
BCE Ventures
BCI 58.1 74% (7) - (18) (32) (57) CGI (6) 120.0 43% 24 13 13 15 65
Excel 95% 49 (19) 32 22 84
Telesat 100% 36 37 38 42 153
Other 100% (2) (2) 4 6 6
Total BCE Ventures 100 29 69 53 251
Corporate and other 100% (24) (9) (16) (20) (69)
Total 1,261 1,292 1,426 1,383 5,361
Proportionate Net Debt and Preferreds (5)
Number of common * BCE*
shares owned by BCE Ownership % Dec. 31(M) 2000
Bell Canada
Bell Canada Holdings 80% 11,702 Aliant (7) 71.3 45% 809
Total Bell Canada 12,511
Bell Globemedia 100% 705 Teleglobe (11) 95% 3,014
BCE Emergis 62.0 66% (28)
BCE Ventures
BCI 58.1 74% 1,907 CGI (6) 120.0 43% 2
Telesat 100% 449
Other 100% 16
Total BCE Ventures 2,374
Corporate 100% (5,456)
Total 13,120
Corporate liquidity and debt investments net of debt and preferred shares outstanding
Dec. 31 Dec. 312000 1999
Cash and cash equivalents 4 2,203 Nortel common shares for monetization (8) - Hedged 4,331 -
- Unhedged 589 - Bell Canada Holdings debt due to BCE (9) 4,579 5,379
Short and long term debt outstanding (2,347) (580) Preferred shares outstanding (10) (1,700) (1,700)
Total 5,456 5,302
Other Information
Year ended December 31 2000 1999
Shares outstanding (M) 809.9 643.1
Shares issued (M) 166.1 3.0
Shares purchased for cancellation (M) 9.1 -
Book value ($/sh) 21.68 24.75
* At December 31, 2000
See accompanying notes on pages 22-23 BCE Inc. | Investor Briefing - Fourth quarter 2000 Page 11
Bell Canada9 3 11 42.14 10 10 10 10 10 10
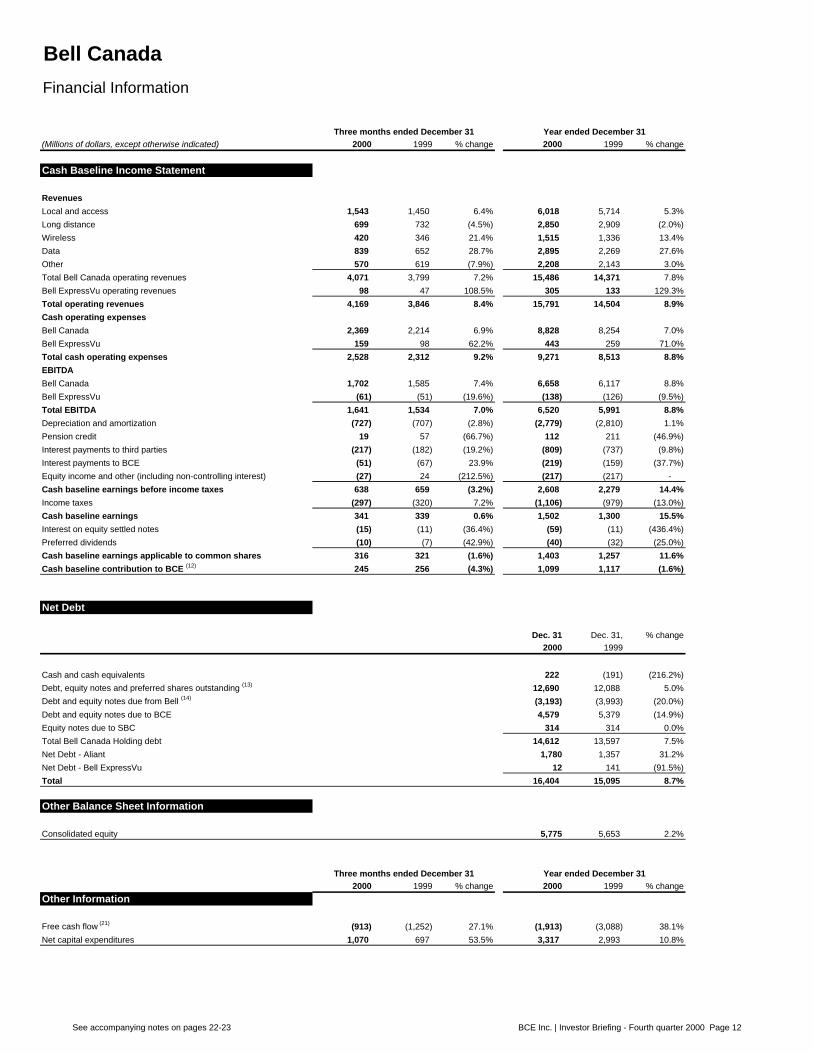
Financial Information
Three months ended December 31 Year ended December 31(Millions of dollars, except otherwise indicated) 2000 1999 % change 2000 1999 % change
Cash Baseline Income Statement
Revenues
Local and access 1,543 1,450 6.4% 6,018 5,714 5.3%
Long distance 699 732 (4.5%) 2,850 2,909 (2.0%)
Wireless 420 346 21.4% 1,515 1,336 13.4%
Data 839 652 28.7% 2,895 2,269 27.6%
Other 570 619 (7.9%) 2,208 2,143 3.0%
Total Bell Canada operating revenues 4,071 3,799 7.2% 15,486 14,371 7.8%
Bell ExpressVu operating revenues 98 47 108.5% 305 133 129.3%
Total operating revenues 4,169 3,846 8.4% 15,791 14,504 8.9%
Cash operating expenses
Bell Canada 2,369 2,214 6.9% 8,828 8,254 7.0%
Bell ExpressVu 159 98 62.2% 443 259 71.0%
Total cash operating expenses 2,528 2,312 9.2% 9,271 8,513 8.8%
EBITDA
Bell Canada 1,702 1,585 7.4% 6,658 6,117 8.8%
Bell ExpressVu (61) (51) (19.6%) (138) (126) (9.5%)
Total EBITDA 1,641 1,534 7.0% 6,520 5,991 8.8%
Depreciation and amortization (727) (707) (2.8%) (2,779) (2,810) 1.1%
Pension credit 19 57 (66.7%) 112 211 (46.9%)
Interest payments to third parties (217) (182) (19.2%) (809) (737) (9.8%)
Interest payments to BCE (51) (67) 23.9% (219) (159) (37.7%)
Equity income and other (including non-controlling interest) (27) 24 (212.5%) (217) (217) -
Cash baseline earnings before income taxes 638 659 (3.2%) 2,608 2,279 14.4%
Income taxes (297) (320) 7.2% (1,106) (979) (13.0%)
Cash baseline earnings 341 339 0.6% 1,502 1,300 15.5%
Interest on equity settled notes (15) (11) (36.4%) (59) (11) (436.4%)
Preferred dividends (10) (7) (42.9%) (40) (32) (25.0%)
Cash baseline earnings applicable to common shares 316 321 (1.6%) 1,403 1,257 11.6%
Cash baseline contribution to BCE (12) 245 256 (4.3%) 1,099 1,117 (1.6%)
Net Debt
Dec. 31 Dec. 31, % change2000 1999
Cash and cash equivalents 222 (191) (216.2%)
Debt, equity notes and preferred shares outstanding (13) 12,690 12,088 5.0%
Debt and equity notes due from Bell (14) (3,193) (3,993) (20.0%)
Debt and equity notes due to BCE 4,579 5,379 (14.9%)
Equity notes due to SBC 314 314 0.0%
Total Bell Canada Holding debt 14,612 13,597 7.5%
Net Debt - Aliant 1,780 1,357 31.2%
Net Debt - Bell ExpressVu 12 141 (91.5%)
Total 16,404 15,095 8.7%
Other Balance Sheet Information
Consolidated equity 5,775 5,653 2.2%
Three months ended December 31 Year ended December 312000 1999 % change 2000 1999 % change
Other Information
Free cash flow (21) (913) (1,252) 27.1% (1,913) (3,088) 38.1%
Net capital expenditures 1,070 697 53.5% 3,317 2,993 10.8%
See accompanying notes on pages 22-23 BCE Inc. | Investor Briefing - Fourth quarter 2000 Page 12
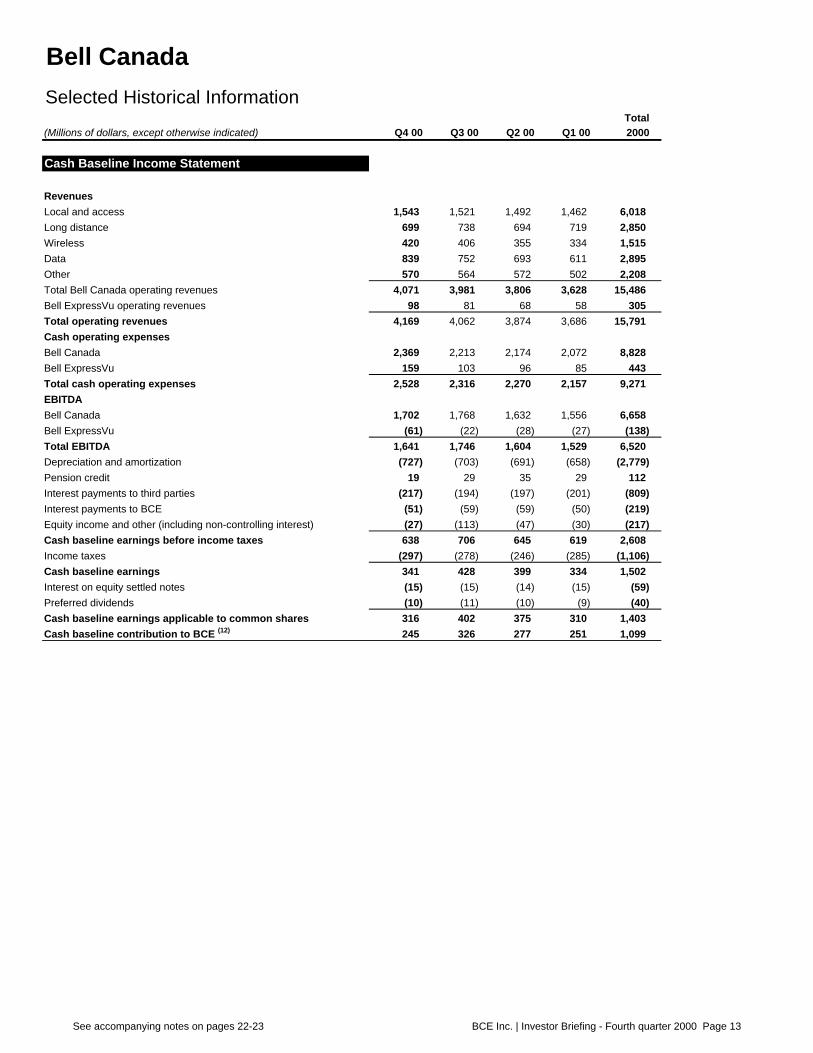
Bell Canada
Selected Historical InformationTotal
(Millions of dollars, except otherwise indicated) Q4 00 Q3 00 Q2 00 Q1 00 2000
Cash Baseline Income Statement
RevenuesLocal and access 1,543 1,521 1,492 1,462 6,018 Long distance 699 738 694 719 2,850 Wireless 420 406 355 334 1,515 Data 839 752 693 611 2,895 Other 570 564 572 502 2,208 Total Bell Canada operating revenues 4,071 3,981 3,806 3,628 15,486 Bell ExpressVu operating revenues 98 81 68 58 305 Total operating revenues 4,169 4,062 3,874 3,686 15,791 Cash operating expensesBell Canada 2,369 2,213 2,174 2,072 8,828 Bell ExpressVu 159 103 96 85 443 Total cash operating expenses 2,528 2,316 2,270 2,157 9,271 EBITDABell Canada 1,702 1,768 1,632 1,556 6,658 Bell ExpressVu (61) (22) (28) (27) (138) Total EBITDA 1,641 1,746 1,604 1,529 6,520 Depreciation and amortization (727) (703) (691) (658) (2,779) Pension credit 19 29 35 29 112 Interest payments to third parties (217) (194) (197) (201) (809) Interest payments to BCE (51) (59) (59) (50) (219) Equity income and other (including non-controlling interest) (27) (113) (47) (30) (217) Cash baseline earnings before income taxes 638 706 645 619 2,608 Income taxes (297) (278) (246) (285) (1,106) Cash baseline earnings 341 428 399 334 1,502 Interest on equity settled notes (15) (15) (14) (15) (59) Preferred dividends (10) (11) (10) (9) (40) Cash baseline earnings applicable to common shares 316 402 375 310 1,403 Cash baseline contribution to BCE (12) 245 326 277 251 1,099
See accompanying notes on pages 22-23 BCE Inc. | Investor Briefing - Fourth quarter 2000 Page 13
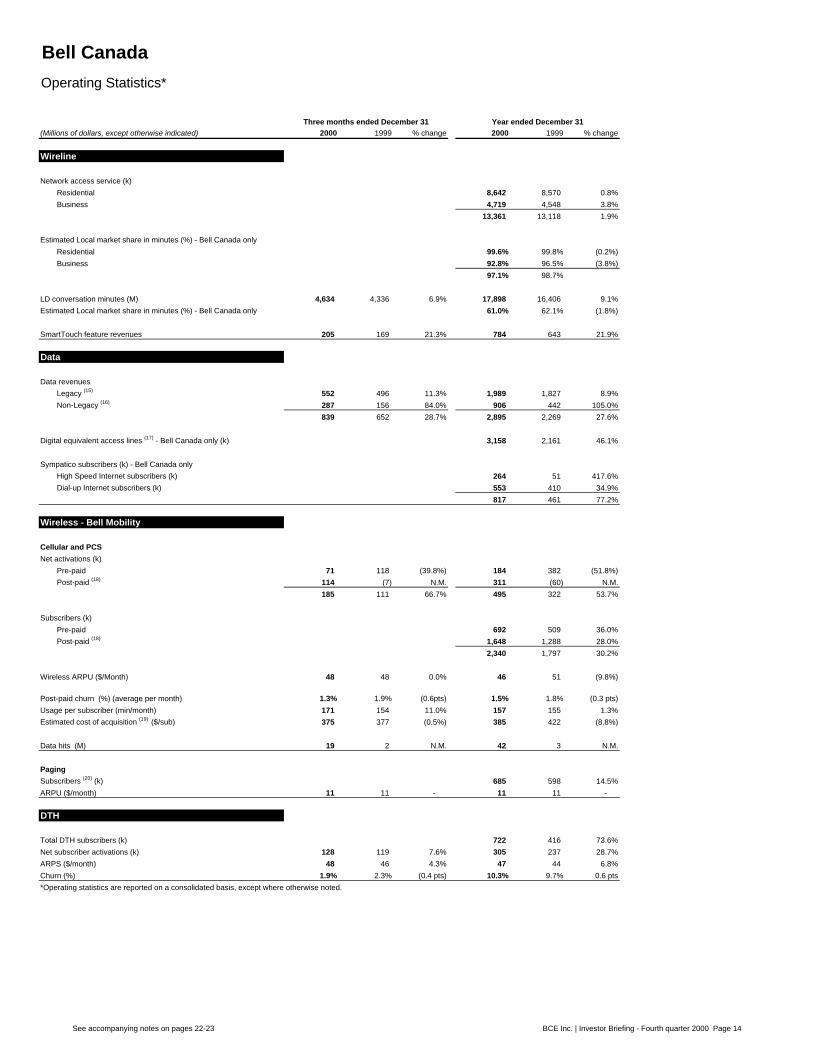
Bell Canada9 3 11 42.14 10 10 10 2 10 10 10
Operating Statistics*
Three months ended December 31 Year ended December 31(Millions of dollars, except otherwise indicated) 2000 1999 % change 2000 1999 % change
Wireline
Network access service (k)
Residential 8,642 8,570 0.8%
Business 4,719 4,548 3.8%
13,361 13,118 1.9%
Estimated Local market share in minutes (%) - Bell Canada only
Residential 99.6% 99.8% (0.2%)
Business 92.8% 96.5% (3.8%)
97.1% 98.7%
LD conversation minutes (M) 4,634 4,336 6.9% 17,898 16,406 9.1%
Estimated Local market share in minutes (%) - Bell Canada only 61.0% 62.1% (1.8%)
SmartTouch feature revenues 205 169 21.3% 784 643 21.9%
Data
Data revenues
Legacy (15) 552 496 11.3% 1,989 1,827 8.9%
Non-Legacy (16) 287 156 84.0% 906 442 105.0%
839 652 28.7% 2,895 2,269 27.6%
Digital equivalent access lines (17) - Bell Canada only (k) 3,158 2,161 46.1%
Sympatico subscribers (k) - Bell Canada only
High Speed Internet subscribers (k) 264 51 417.6%
Dial-up Internet subscribers (k) 553 410 34.9%
817 461 77.2%
Wireless - Bell Mobility
Cellular and PCS
Net activations (k)
Pre-paid 71 118 (39.8%) 184 382 (51.8%)
Post-paid (18) 114 (7) N.M. 311 (60) N.M.
185 111 66.7% 495 322 53.7%
Subscribers (k)
Pre-paid 692 509 36.0%
Post-paid (18) 1,648 1,288 28.0%
2,340 1,797 30.2%
Wireless ARPU ($/Month) 48 48 0.0% 46 51 (9.8%)
Post-paid churn (%) (average per month) 1.3% 1.9% (0.6pts) 1.5% 1.8% (0.3 pts)
Usage per subscriber (min/month) 171 154 11.0% 157 155 1.3%
Estimated cost of acquisition (19) ($/sub) 375 377 (0.5%) 385 422 (8.8%)
Data hits (M) 19 2 N.M. 42 3 N.M.
Paging
Subscribers (20) (k) 685 598 14.5%
ARPU ($/month) 11 11 - 11 11 -
DTH
Total DTH subscribers (k) 722 416 73.6%
Net subscriber activations (k) 128 119 7.6% 305 237 28.7%
ARPS ($/month) 48 46 4.3% 47 44 6.8%
Churn (%) 1.9% 2.3% (0.4 pts) 10.3% 9.7% 0.6 pts
*Operating statistics are reported on a consolidated basis, except where otherwise noted.
See accompanying notes on pages 22-23 BCE Inc. | Investor Briefing - Fourth quarter 2000 Page 14

Bell Canada
Selected Historical Information
Operating Statistics*Total
(Millions of dollars, except otherwise indicated) Q4 00 Q3 00 Q2 00 Q1 00 2000
Wireline
Network access service (k)Residential 8,642 8,602 8,530 8,581Business 4,719 4,726 4,656 4,609
13,361 13,328 13,186 13,190
Estimated Local market share in minutes (%) - Bell Canada onlyResidential 99.6% 99.6% 99.6% 99.6%Business 92.8% 93.6% 94.4% 95.5%
97.1% 97.4% 97.7% 98.2%
LD conversation minutes (M) 4,634 4,372 4,464 4,428 17,898 Estimated Local market share in minutes (%) - Bell Canada only 61.0% 62.0% 61.9% 61.6%
SmartTouch feature revenues 205 199 192 188 784
Data
Data revenuesLegacy (15) 552 505 476 456 1,989 Non-Legacy (16) 287 247 217 155 906
839 752 693 611 2,895
Digital equivalent access lines (17) - Bell Canada only (k) 3,158 2,840 2,571 2,408
Sympatico subscribers (k) - Bell Canada onlyHigh Speed Internet subscribers (k) 264 177 109 69 Dial-up Internet subscribers (k) 553 528 500 476
817 705 609 545
Wireless - Bell Mobility
Cellular & PCS Net activations (k) Pre-paid 71 18 48 47 184 Post-paid (18) 114 100 108 (11) 311
185 118 156 36 495
Cellular & PCS subscribers (k) Pre-paid 692 621 603 556 Post-paid (18) 1,648 1,533 1,433 1,324
2,340 2,154 2,036 1,880
Wireless ARPU ($/Month) 48 48 44 44 46
Post-paid churn (%) 1.3% 1.4% 1.5% 2.1% 1.5%Usage per subscriber (min/month) 171 162 152 140 157Estimated cost of acquisition (19) ($/sub) 375 363 386 451 385
Data hits (M) 19 12 8 3 42
PagingSubscribers (20) (k) 685 659 651 638ARPU ($/month) 11 11 11 11 11
DTH
Total DTH subscribers (k) 722 594 526 469 Net subscriber activations (k) 128 67 57 53 305 ARPS ($/month) 48 46 47 46 47 Churn (%) 1.9% 2.7% 2.5% 3.5% 10.3%* Operating statistics are reported on a consolidated basis, except where otherwise noted.
See accompanying notes on pages 22-23 BCE Inc. | Investor Briefing - Fourth quarter 2000 Page 15
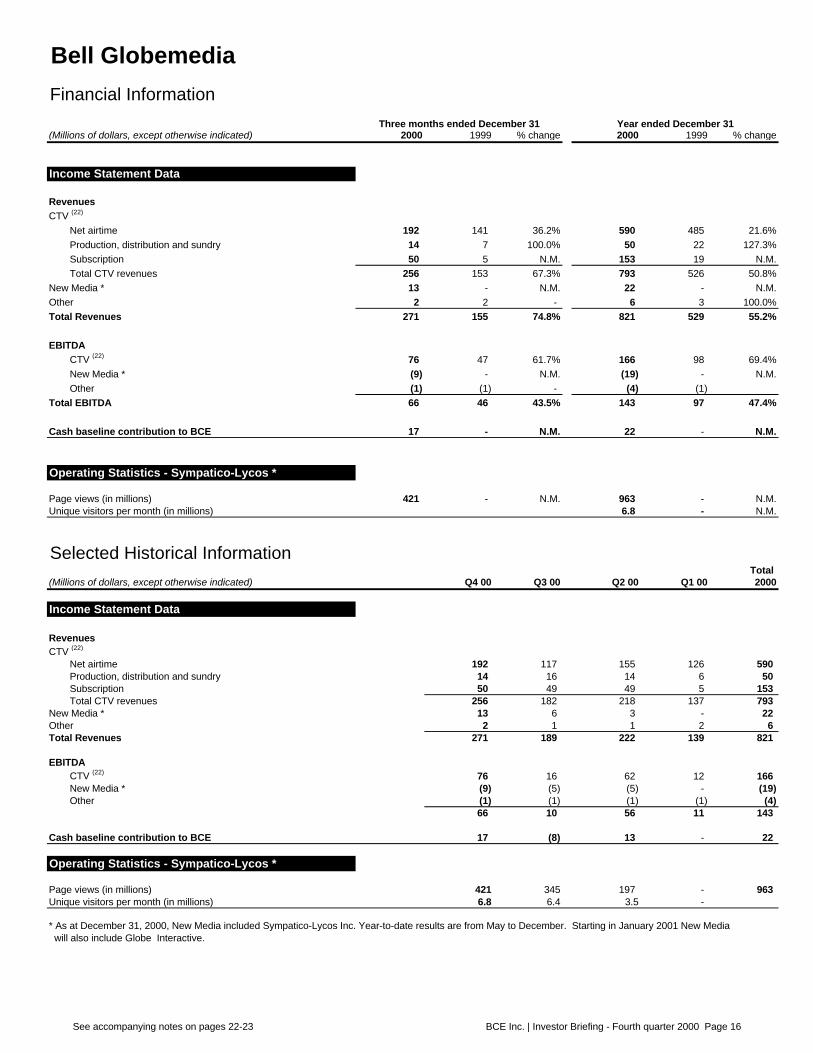
Bell Globemedia
Financial Information
Three months ended December 31 Year ended December 31(Millions of dollars, except otherwise indicated) 2000 1999 % change 2000 1999 % change
Income Statement Data
RevenuesCTV (22)
Net airtime 192 141 36.2% 590 485 21.6%Production, distribution and sundry 14 7 100.0% 50 22 127.3%Subscription 50 5 N.M. 153 19 N.M.Total CTV revenues 256 153 67.3% 793 526 50.8%
New Media * 13 - N.M. 22 - N.M.Other 2 2 - 6 3 100.0%Total Revenues 271 155 74.8% 821 529 55.2%
EBITDACTV (22) 76 47 61.7% 166 98 69.4%New Media * (9) - N.M. (19) - N.M.Other (1) (1) - (4) (1)
Total EBITDA 66 46 43.5% 143 97 47.4%
Cash baseline contribution to BCE 17 - N.M. 22 - N.M.
Operating Statistics - Sympatico-Lycos *
Page views (in millions) 421 - N.M. 963 - N.M.Unique visitors per month (in millions) 6.8 - N.M.
Selected Historical InformationTotal
(Millions of dollars, except otherwise indicated) Q4 00 Q3 00 Q2 00 Q1 00 2000
Income Statement Data
RevenuesCTV (22)
Net airtime 192 117 155 126 590 Production, distribution and sundry 14 16 14 6 50 Subscription 50 49 49 5 153 Total CTV revenues 256 182 218 137 793
New Media * 13 6 3 - 22 Other 2 1 1 2 6 Total Revenues 271 189 222 139 821
EBITDACTV (22) 76 16 62 12 166 New Media * (9) (5) (5) - (19) Other (1) (1) (1) (1) (4)
66 10 56 11 143
Cash baseline contribution to BCE 17 (8) 13 - 22
Operating Statistics - Sympatico-Lycos *
Page views (in millions) 421 345 197 - 963 Unique visitors per month (in millions) 6.8 6.4 3.5 -
* As at December 31, 2000, New Media included Sympatico-Lycos Inc. Year-to-date results are from May to December. Starting in January 2001 New Media will also include Globe Interactive.
See accompanying notes on pages 22-23 BCE Inc. | Investor Briefing - Fourth quarter 2000 Page 16
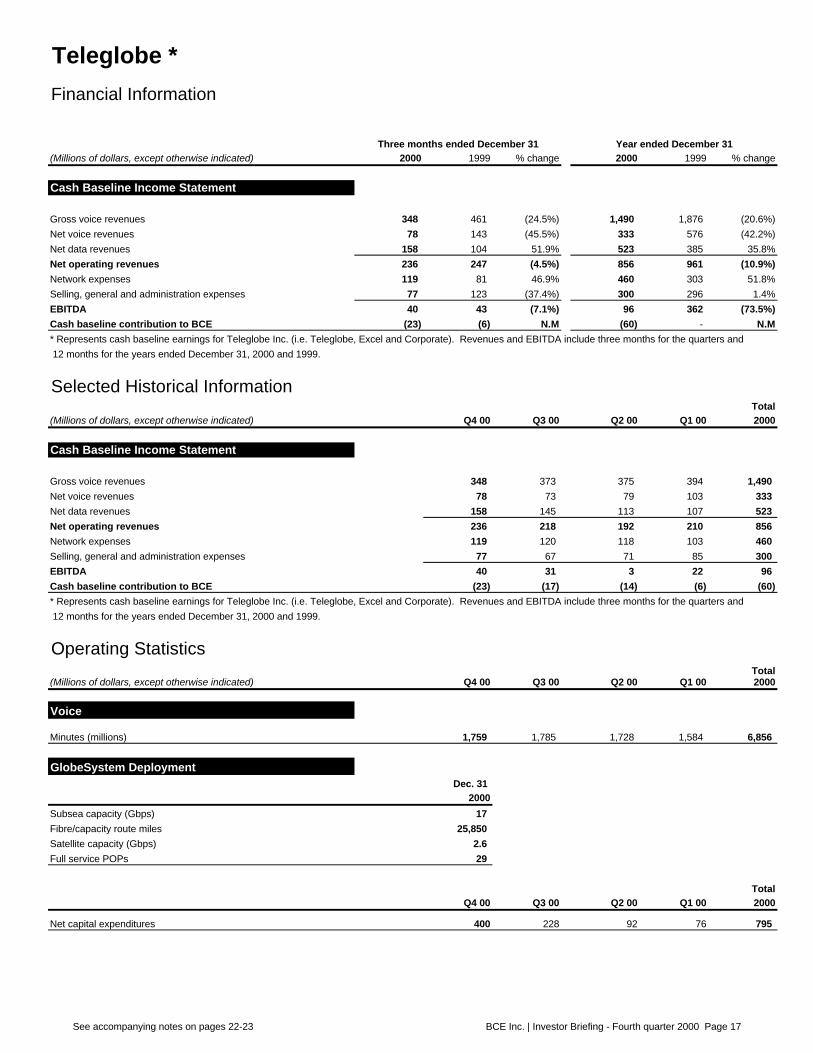
Teleglobe *9 3 11 42.14 10 10 10 10 10 10
Financial Information
Three months ended December 31 Year ended December 31(Millions of dollars, except otherwise indicated) 2000 1999 % change 2000 1999 % change
Cash Baseline Income Statement
Gross voice revenues 348 461 (24.5%) 1,490 1,876 (20.6%)
Net voice revenues 78 143 (45.5%) 333 576 (42.2%)
Net data revenues 158 104 51.9% 523 385 35.8%
Net operating revenues 236 247 (4.5%) 856 961 (10.9%)
Network expenses 119 81 46.9% 460 303 51.8%
Selling, general and administration expenses 77 123 (37.4%) 300 296 1.4%
EBITDA 40 43 (7.1%) 96 362 (73.5%)
Cash baseline contribution to BCE (23) (6) N.M (60) - N.M
* Represents cash baseline earnings for Teleglobe Inc. (i.e. Teleglobe, Excel and Corporate). Revenues and EBITDA include three months for the quarters and
12 months for the years ended December 31, 2000 and 1999.
Selected Historical InformationTotal
(Millions of dollars, except otherwise indicated) Q4 00 Q3 00 Q2 00 Q1 00 2000
Cash Baseline Income Statement
Gross voice revenues 348 373 375 394 1,490
Net voice revenues 78 73 79 103 333
Net data revenues 158 145 113 107 523
Net operating revenues 236 218 192 210 856
Network expenses 119 120 118 103 460
Selling, general and administration expenses 77 67 71 85 300
EBITDA 40 31 3 22 96
Cash baseline contribution to BCE (23) (17) (14) (6) (60)
* Represents cash baseline earnings for Teleglobe Inc. (i.e. Teleglobe, Excel and Corporate). Revenues and EBITDA include three months for the quarters and
12 months for the years ended December 31, 2000 and 1999.
Operating StatisticsTotal
(Millions of dollars, except otherwise indicated) Q4 00 Q3 00 Q2 00 Q1 00 2000
Voice
Minutes (millions) 1,759 1,785 1,728 1,584 6,856
GlobeSystem DeploymentDec. 31
2000
Subsea capacity (Gbps) 17
Fibre/capacity route miles 25,850
Satellite capacity (Gbps) 2.6
Full service POPs 29
TotalQ4 00 Q3 00 Q2 00 Q1 00 2000
Net capital expenditures 400 228 92 76 795
See accompanying notes on pages 22-23 BCE Inc. | Investor Briefing - Fourth quarter 2000 Page 17
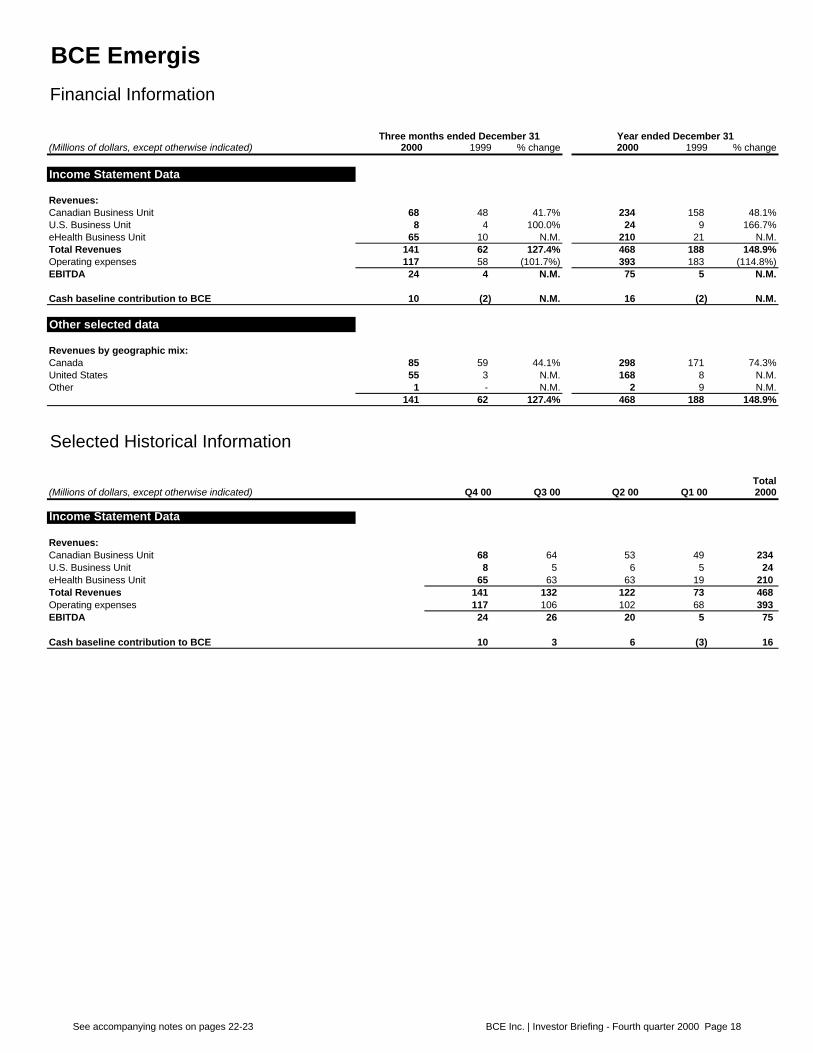
BCE Emergis
Financial Information
Three months ended December 31 Year ended December 31(Millions of dollars, except otherwise indicated) 2000 1999 % change 2000 1999 % change
Income Statement Data
Revenues:Canadian Business Unit 68 48 41.7% 234 158 48.1%U.S. Business Unit 8 4 100.0% 24 9 166.7%eHealth Business Unit 65 10 N.M. 210 21 N.M.Total Revenues 141 62 127.4% 468 188 148.9%Operating expenses 117 58 (101.7%) 393 183 (114.8%)EBITDA 24 4 N.M. 75 5 N.M.
Cash baseline contribution to BCE 10 (2) N.M. 16 (2) N.M.
Other selected data
Revenues by geographic mix:Canada 85 59 44.1% 298 171 74.3%United States 55 3 N.M. 168 8 N.M.Other 1 - N.M. 2 9 N.M.
141 62 127.4% 468 188 148.9%
Selected Historical Information
Total(Millions of dollars, except otherwise indicated) Q4 00 Q3 00 Q2 00 Q1 00 2000
Income Statement Data
Revenues:Canadian Business Unit 68 64 53 49 234 U.S. Business Unit 8 5 6 5 24 eHealth Business Unit 65 63 63 19 210 Total Revenues 141 132 122 73 468 Operating expenses 117 106 102 68 393 EBITDA 24 26 20 5 75
Cash baseline contribution to BCE 10 3 6 (3) 16
See accompanying notes on pages 22-23 BCE Inc. | Investor Briefing - Fourth quarter 2000 Page 18
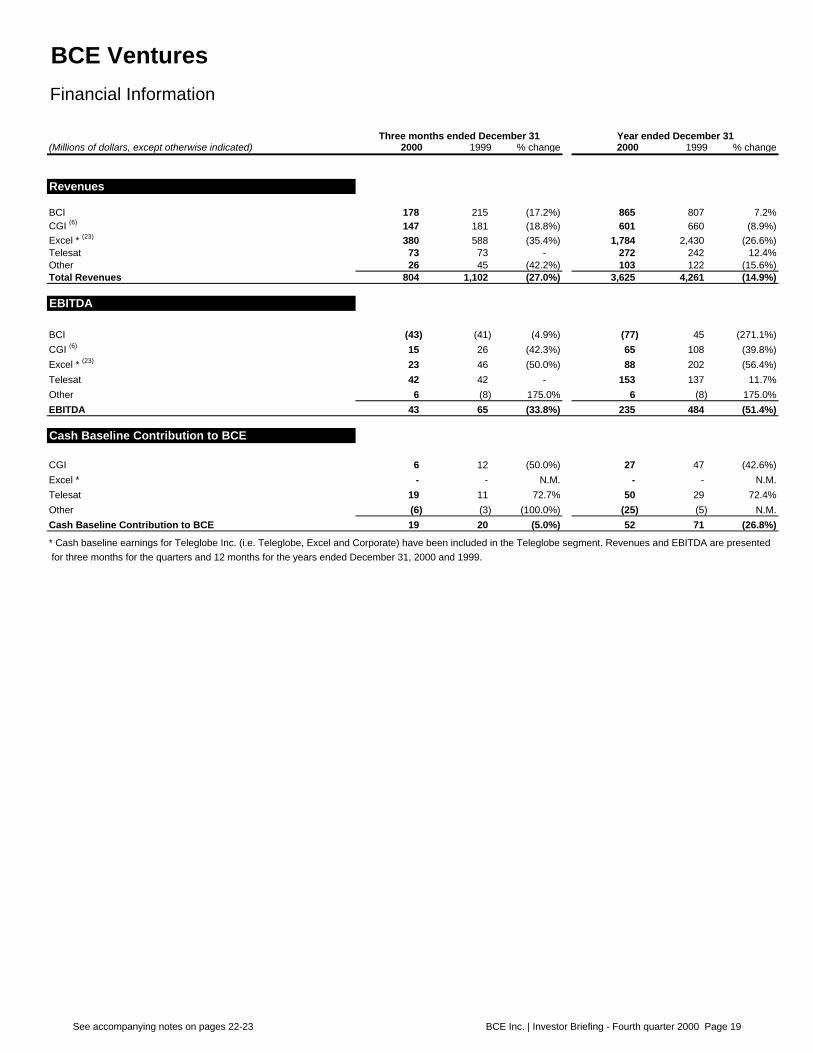
BCE Ventures
Financial Information
Three months ended December 31 Year ended December 31(Millions of dollars, except otherwise indicated) 2000 1999 % change 2000 1999 % change
Revenues
BCI 178 215 (17.2%) 865 807 7.2%CGI (6) 147 181 (18.8%) 601 660 (8.9%)Excel * (23) 380 588 (35.4%) 1,784 2,430 (26.6%)Telesat 73 73 - 272 242 12.4%Other 26 45 (42.2%) 103 122 (15.6%)Total Revenues 804 1,102 (27.0%) 3,625 4,261 (14.9%)
EBITDA
BCI (43) (41) (4.9%) (77) 45 (271.1%)CGI (6) 15 26 (42.3%) 65 108 (39.8%)Excel * (23) 23 46 (50.0%) 88 202 (56.4%)
Telesat 42 42 - 153 137 11.7%
Other 6 (8) 175.0% 6 (8) 175.0%
EBITDA 43 65 (33.8%) 235 484 (51.4%)
Cash Baseline Contribution to BCE
CGI 6 12 (50.0%) 27 47 (42.6%)
Excel * - - N.M. - - N.M.
Telesat 19 11 72.7% 50 29 72.4%
Other (6) (3) (100.0%) (25) (5) N.M.
Cash Baseline Contribution to BCE 19 20 (5.0%) 52 71 (26.8%)
* Cash baseline earnings for Teleglobe Inc. (i.e. Teleglobe, Excel and Corporate) have been included in the Teleglobe segment. Revenues and EBITDA are presented for three months for the quarters and 12 months for the years ended December 31, 2000 and 1999.
See accompanying notes on pages 22-23 BCE Inc. | Investor Briefing - Fourth quarter 2000 Page 19

BCE Ventures
Selected Historical InformationTotal
(Millions of dollars, except otherwise indicated) Q4 00 Q3 00 Q2 00 Q1 00 2000
Revenues
BCI 178 192 254 241 865 CGI (6) 147 140 145 169 601 Excel * (23) 380 454 449 501 1,784
Telesat 73 68 67 64 272
Other 26 25 26 26 103
Total Revenues 804 879 941 1,001 3,625
EBITDA
BCI (43) (25) - (9) (77) CGI (6) 15 13 13 24 65 Excel * (23) 23 34 (20) 51 88
Telesat 42 38 37 36 153
Other 6 4 (2) (2) 6
EBITDA 43 64 28 100 235
Cash Baseline Contribution to BCE
CGI 6 4 6 11 27
Excel * - - - - -
Telesat 19 15 8 8 50
Other (6) (6) (4) (9) (25)
Cash Baseline Contribution to BCE 19 13 10 10 52
* Cash baseline earnings for Teleglobe Inc. (i.e. Teleglobe, Excel and Corporate) have been included in the Teleglobe segment. Revenues and EBITDA are presented for three months for the quarters and twelve months for the years ended December 31, 2000 and 1999.
See accompanying notes on pages 22-23 BCE Inc. | Investor Briefing - Fourth quarter 2000 Page 20

Reconciliation of reported earnings
Three months ended December 31 Year ended December 31(Millions of dollars, except otherwise indicated) 2000 1999 % change 2000 1999 % change
Cash baseline earnings to common shares 299 263 13.7% 1,209 1,093 10.6%Bell Canada:
Goodwill expense (19) (13) (86) (36) Restructuring charges (98) Bell Mobility write-down of Iridium (29) Gain on sale of 25% of Expertech 11 Bell Mobility gain on Phone.com-net 40 40 Gain on sale of Canoe 14 Bell ActiMedia Services gain on sale of Pacific Access 8 Impact of income tax rate adjustments (24) (26) (26) Other 4 13 (3) Bell Expressvu (6)
Teleglobe:Discontinued operations - ORBCOMM (80) Restructuring charges (6) (37) Goodwill expense (60) (60)
BCE Emergis:Goodwill expense (79) (8) (214) (41) Write-off of assets and IPR&D 5 (3) (11) (26) Gain on sale of TotalNet
Bell Globemedia:Goodwill expense (33) (100)
BCE Ventures:Goodwill expense (5) (7) (25) (23) Bell Canada International (97) (124) 185 (354) Telesat - Impact of income tax rate adjustments (24) 18 18 Telesat - ABCN writedown (21)
Corporate:Gain on reduction of ownership in Bell 4,242 Nortel Networks 561 4,055 390 Skyview write-down (62) Gain on sale of Jones 234 Impact of income tax rate adjustments (24) (32) (32) Write-down of Iridium (12) Gain on sale of Sun Media shares 18
Net cash baseline adjustments (330) 446 3,573 4,273 Reported earnings applicable to common shares (31) 709 (104.4%) 4,782 5,366 (10.9%)Reported earnings per common share - $/sh (0.04)$ 1.10$ (103.6%) 7.14$ 8.35$ (14.5%)Average number of common shares outstanding (millions) 746.1 643.6 670.0 642.8
Historical InformationTotal
Q4 00 Q3 00 Q2 00 Q1 00 2000
Cash baseline earnings to common shares 299 329 297 284 1,209 Bell Canada:
Goodwill expense (19) (22) (24) (21) (86) Impact of income tax rate ajustments (24) (26) (26) Other 4 3 6 13 Bell Expressvu (6) (6)
Teleglobe:Discontinued operations - ORBCOMM (67) (7) (6) (80) Restructuring charges (6) (25) (6) (37) Goodwill expense (60) (60)
BCE Emergis:Goodwill expense (79) (61) (54) (20) (214) Write-off of assets and IPR&D 5 (5) (6) (5) (11)
Bell Globemedia.:Goodwill expense (33) (34) (33) (100)
BCE Ventures:Goodwill expense (5) (7) (6) (7) (25) Bell Canada International (97) 556 (143) (131) 185 Telesat - Impact of income tax rate adjustments (24) 18 18 Telesat - ABCN writedown (21) (21)
Corporate:Nortel Networks 4,055 4,055 Impact of income tax rate ajustments (24) (32) (32)
Net cash baseline adjustments (330) 311 (273) 3,865 3,573 Reported earnings applicable to common shares (31) 640 24 4,149 4,782 Reported earnings per common share - $/sh (0.04)$ 0.99$ 0.04$ 6.44$ 7.14$ Average number of common shares outstanding (millions) 746.1 644.7 644.6 644.0 670.0
See accompanying notes on pages 22-23 BCE Inc. | Investor Briefing - Fourth quarter 2000 Page 21

BCE Inc.9 3 11 42.14 10 10 10 10 10 10
Accompanying Notes
(1) Effective December 1, 2000, BCE centres its activities around four operating businesses:
CORE OPERATIONS:Bell Canada
This segment provides an integrated platform of substantially domestic telecommunications services including voice, data, wireline, wireless and directory communications and satellite entertainment to Canadian customers.
Represents the consolidation of Bell Canada Holdings Inc. (BCH) with Bell Canada and its consolidated subsidiaries (including Bell Mobility, BCE Nexxia Inc. and Bell ActiMedia Inc.). BCH owns 100%of Bell Canada. BCE owns 80%of BCH, the remaining 20% is owned by SBC Communications Inc. In addition, the segment includes the consolidationof Aliant Inc. (approximately 39% held by Bell Canada and approximately 14% held by BCE Inc.) as well as Bell ExpressVu Limited Partnership (ExpressVu). Bell Canada's 23% interest in Teleglobe is accounted for at cost.
Teleglobe
Represents Teleglobe Communications Corporation (Teleglobe) which provides, on a worldwide basis, a broad portfolio of data and Internet services including connectivity services, hosting services and content distribution to Internet service providers,Internet content providers, application service providers, carriers and global enterprises. BCE owns 95.4% of Teleglobe (approximately 23% held by Bell Canada of which BCE indirectly owns 80% and approximately 77% held by BCE Inc.). The remaining 4.6% is held by SBC Communications Inc.
BCE Emergis
Represents BCE Emergis Inc. which currently focuses its activities in three business units (Canadian, US and eHealth), offering a full suite of products to companies in transaction-intensive, eHealth and financial services sectors. BCE owns 66.2% of BCE Emergis Inc.
Bell Globemedia
Represents CTV Inc., acquired by BCE Inc. in April 2000 and accounted for using the equity method until November 30, 2000(effective December 1, 2000, results of CTV are reflected on a consolidated basis), Sympatico-Lycos Inc. and other media interests.Starting in 2001, this segment will also include The Globe and Mail and Globe Interactive. The above companieswill operate under a new media company, Bell Globemedia of which BCE will hold an ownership interest of 70.1%.This segment provides integrated information, communications and entertainment services to Canadian customers and access to distinctive Canadian content that will allow the creation of unique destinations for Internet users through the various portal properties.
NON-CORE OPERATIONS:BCE Ventures
Represents investments in a diverse group of companies which provide services to customers worldwide. This segment includes BCE's interests in Bell Canada International Inc. (73.6%), Telesat Canada (100%) TMI Communications and CompanyLimited Partnership (100%), CGI Group Inc. (43.4%), Excel Communications Inc. (95.4%), Look Communications Inc. (25.3%), Bimcor Inc. (100%), BCE Capital Inc. (100%) and TeleReal Inc. (100%).
(2) Effective January 2000, BCE increased its ownership interest in Aliant from 41% to 53%. Therefore, in 2000, Aliant is consolidated and included in the Bell Canada segment. For improved comparability Aliant results for 1999 are reflected on a consolidated basis.
(3) Effective November 1, 2000, BCE Inc. acquired the remaining shares of Teleglobe Inc. that it did not already own, bringing BCE'seffective ownership interest to 95.4% and began consolidating Teleglobe's results.
(4) In April 2000, BCE Inc. acquired CTV Inc. and accounted for CTV's results using the equity method until November 30, 2000. Effective December 1, 2000, following CRTC approval of the CTV acquisition, results of CTV are reflected on a consolidatedbasis. Hence, revenues and EBITDA are included only for the month of December.
(5) Calculated by applying BCE's ownership interest at December 31, 2000 and reflects corporate liquidity and debt investments net of debt and preferred shares outstanding.
(6) CGI is currently proportionately consolidated into BCE's results.
(7) Represents 80% of Bell Canada's 39.3% (52.5M shares) interest and 100% of BCE's 14.0% interest (18.8M shares).
BCE Inc. | Investor Briefing - Fourth quarter 2000 Page 22

BCE Inc.3Accompanying Notes (continued)
(8) Hedged represents approximately 46.4M shares valued at average forward price of $90 and unhedged represents 13.6M shares valued at market.
(9) Includes $1.3B of equity settled notes.
(10) At December 31, 1999, includes Series P Retractable preferred shares.
(11) Represents net debt and preferreds of Teleglobe Inc, which includes Teleglobe, Excel and Corporate.
(12) Represents 80% of Bell Canada Holdings (BCH) (as of June 1, 1999, BCE owns 80% of BCH, the remaining 20% is owned by SBC Communications Inc.), 100% of Bell ExpressVu and 45.4% of Aliant (80% of Bell Canada's 39.3%interest in Aliant and BCE's 14.0% interest in Aliant).
(13) Represents the debt, equity settled notes and preferred shares at the Bell Canada operating level.
(14) Represents the debt, equity settled notes and preferred shares at the Bell Canada operating level due to BCH
(15) Legacy data revenues include digital transmission services such as MEGALINK TM, network access forIntegrated Services Digital Network (ISDN) and Data, as well as Asymmetric Digital Subscriber Line (ADSL), competitive network services and the sale of inter-networking equipment.
(16) Non-legacy data revenues include national and regional IP data and Internet services.
(17) Digital equivalent access lines are derived by converting high capacity data lines to the estimated capacity of one NAS line. The conversion multiples used are as follows: Basic ISDN=2, Primary ISDN=23, DEA=24, DS0=1, DS1=24, DS3=672Prior period numbers have been restated to include MicroLink lines and switched DS1 lines.
(18) Q1 2000 includes a one-time transfer of 48K SimplyOne subscribers from Bell Canada.
(19) Includes an estimate of the selling costs that have been transferred to Bell Canada and excludes migration costs.
(20) Includes 69K paging subscribers purchased from PageMart during Q1/00.
(21) Represents cash from operating activities plus cash from investing activities less dividends paid.
(22) CTV's results are accounted under the equity method as of April 1, 2000. In addition, Netstar's resultshave been consolidated into CTV Inc.'s results beginning April 1, 2000. For improved comparability andanalysis, revenues and EBITDA for CTV reflect all months for each quarter and twelve months endedDecember 31 for the years 2000 and 1999.
(23) Amounts shown for Excel do not reflect the impact on revenue and EBITDA relating to the overstatement of accounts receivableof approximately US $100 million that was noted during the course of BCE's year-end.
(24) In December 2000, the Emerging Issues Committee of the CICA mandated that the income tax rate reductions announced in the Federal budgets (February and October), are to be considered substantively enacted. Therefore, as required by the accounting rules for income taxes, the future income tax asset and liability balances are to be measured at the new tax rates and related adjustments are to be reflected in the current year earnings.
BCE Inc. | Investor Briefing - Fourth Quarter 2000 Page 23

BCE Inc.9 3 11 42.14
CAUTIONARY STATEMENT CONCERNING FORWARD-LOOKING STATEMENTS
Certain statements made in this document which describe BCE's intentions, expectations or predictions, are forward-looking statements within the meaning of the “safe harbor” provisions of the Private Securities Litigation Reform Act of 1995 (the “Act”) and are subject to important risks and uncertainties. For these statements, we claim the protection of the “safe harbor” for forward-looking statements contained in the Act. The results or events predicted in these statements may differ materially from actual results or events.
Factors which could cause results or events to differ from current expectations include, among other things:
- uncertainty as to whether BCE’s strategies will yield the expected growth prospects;
- the uncertainties of the Internet including the Internet economy growing at a slower pace than anticipated;
- the intensity of competitive activity and its resulting impact on pricing strategies and new product offerings;
- the potential significant impact on BCE’s growth prospects resulting from competitors’ reaction to BCE’s strategies and marketing plans;
- higher than anticipated start-up costs or significant up-front investments associated with business initiatives;
- unanticipated higher capital spending from, or delays in, the deployment of new technologies (including DSL technology);
- the final outcome of pending and future litigation and regulatory initiatives and proceedings;
- risks of new or changes to existing laws or regulations in jurisdictions where the BCE group companies operate and, in particular, changes in laws or regulations governing Internet commerce;
- the inability to further identify, develop and achieve commercial success for new products, services and technologies;
- the impact of consolidations in the telecommunications and media industries;
- the availability and cost of capital;
- the quality of service offered by competitors and the significant level of expenditures required to maintain quality of service;
- the availability of, and ability to retain, key personnel;
- the extent of demand for traditional and emerging services;
- the impact of rapid technological and market change; and
- general industry and market conditions and growth rates.
For additional information with respect to certain of these and other factors, please refer to BCE’s Annual Information Form for the year ended December 31, 1999 and BCE’s Management’s Discussion and Analysis of the first and second quarter results of 2000 filed with the Canadian provincial securities regulatory authorities, as well as the reports on Forms 6-K and 40-F filed by BCE with the U.S. Securities and Exchange Commission. BCE disclaims any intention or obligation to update or revise any forward-looking statements, whether as a result of new information, future events or otherwise.
BCE Inc. | Investor Briefing - Fourth quarter 2000 Page 24
Related Documents